Final Report Identifying potential new food vehicles for … · · 2018-03-29Nigeria 4.3 SUPPLY...
22
REPORT IDENTIFYING POTENTIAL NEW FOOD VEHICLES FOR FORTIFICATION IN WEST AFRICA MARCH 2018 DISCLAIMER This report is made possible by the generous support of the American people through the United States Agency for International Development (USAID). The contents are the responsibility of GAIN, under the terms of Grant No. GHA-G-00-06-00002, and do not necessarily reflect the views of USAID or the United States Government.
-
Upload
hoangkhanh -
Category
Documents
-
view
214 -
download
1
Transcript of Final Report Identifying potential new food vehicles for … · · 2018-03-29Nigeria 4.3 SUPPLY...

REPORT IDENTIFYING POTENTIAL NEW FOOD VEHICLES FOR FORTIFICATION IN WEST AFRICA
MARCH 2018
DISCLAIMER
This report is made possible by the generous support of the American people through the United States Agency for International Development (USAID). The contents are the responsibility of GAIN, under the terms of Grant No. GHA-G-00-06-00002, and do not necessarily reflect the views of USAID or the United States Government.

2
RECOMMENDED CITATION:
Global Alliance for Improved Nutrition. 2018. Identifying potential new food vehicles for fortification in West Africa. Global Alliance for Improved Nutrition: Geneva, Switzerland.

3
Table of Contents Summary ....................................................................................................................................................... 5
1. Introduction .......................................................................................................................................... 7
2. Objectives ............................................................................................................................................. 8
3. Methods ............................................................................................................................................... 8
3.1 Burkina Faso survey ............................................................................................................................. 8
3.1.1 Study design and selection of market sites ................................................................................. 8
3.1.2 Data collection ............................................................................................................................. 9
3.1.3 Ethical considerations and survey administration .................................................................... 10
3.2 Nigeria survey .................................................................................................................................... 10
3.2.1 Survey design and target population ........................................................................................ 10
3.2.2 Data collection ........................................................................................................................... 10
3.2.3 Ethical considerations and survey administration .................................................................... 11
3.3 Supply chain analysis of rice in Africa ................................................................................................ 11
3.3.1 Study design .............................................................................................................................. 11
3.3.2 Data collection ........................................................................................................................... 11
4. Results ................................................................................................................................................ 12
4.1 Burkina Faso survey ........................................................................................................................... 12
4.2 Nigeria survey .................................................................................................................................... 17
4.3 Supply chain analysis of rice in Africa ................................................................................................ 18
5. Key Findings and Recommendations .................................................................................................. 19
5.1 Key findings ....................................................................................................................................... 19
5.2 Recommendations ............................................................................................................................. 21
6. References .......................................................................................................................................... 22

4
Figures Figure 1. Map of selected market hubs and roads in Burkina Faso .................................................................... 9
Figure 2. Number of bouillon cube brands found in each market hub in Burkina Faso ................................... 13
Figure 3. Number of tomato paste brands found in each market hub in Burkina Faso .................................... 14
Figure 4. Number of rice brands found in each market hub in Burkina Faso ................................................... 15
Figure 5. Number of maize flour brands found in each market hub in Burkina Faso ....................................... 16
Figure 6. Household coverage of foods and fortifiable foods in Ebonyi and Sokoto, Nigeria........................... 17
Figure 7. Daily apparent consumption of fortifiable foods among women of reproductive age in Ebonyi and Sokoto, Nigeria .................................................................................................................................................. 18

5
Summary
Large-scale food fortification is among the most sustainable medium-to-long-term strategies to combat
vitamin and mineral deficiencies and one of the most cost-effective public health strategies when
implemented through centralized and reasonably developed food industries, and with adequate
enforcement. Oil and cereal grain fortification is common throughout West Africa; however, the impact on
public health may be insufficient if the current diet (local and fortified foods) does not meaningfully
contribute towards meeting the dietary needs for some essential nutrients and/or the coverage of existing
fortification programs excludes certain population groups, information which has not been accurately
quantified across many West African countries.
In an effort to explore the potential of new food vehicles for large-scale food fortification in West Africa, the
Global Alliance for Improved Nutrition (GAIN) took advantage of two Fortification Assessment Coverage
Toolkit (FACT) surveys conducted in West Africa (Burkina Faso and Nigeria) that measured quality, coverage
and/or consumption of mandatorily fortified foods, for exploring the potential of other industry-
manufactured foods for fortification. The new candidate food vehicles for fortification were analyzed based
on their market penetration, industry/trade production patterns, and consumption patterns. In Burkina Faso,
the presence of brands and producers of rice, tomato paste, bouillon cubes and maize flour were assessed in
select urban market hubs across the country. In Ebonyi and Sokoto states in Nigeria, household level
coverage and consumption patterns of bouillon cube, tomato paste, and rice were assessed. Additionally,
GAIN and the Food Fortification Initiative (FFI) undertook an analysis of the feasibility and potential coverage
of fortified rice in the Africa rice supply chain to identify rice fortification opportunities (both domestic and
import market) in 19 countries in Africa, including Nigeria.
In Burkina Faso, the results revealed that rice, tomato paste, and bouillon cubes are widely available across
all regions of the country, although over 90% of the available brands are imported. In Nigeria, all three foods
had high coverage in a fortifiable form; in Ebonyi (100%, 95% and 83%, respectively) and to a lesser extent in
Sokoto (99%, 45% and 40%, respectively). Furthermore, in terms of consumption patterns, women of
reproductive age in Ebonyi apparently consumed 2 g/day of fortifiable bouillon cube, 27 g/day of fortifiable
tomato paste, and 80 g/day of fortifiable rice. In Sokoto, these figures were 3 g/day of fortifiable bouillon
cube, 8 g/day of fortifiable tomato paste, and 97 g/day of fortifiable rice. Finally, the supply chain analysis of
rice revealed that nearly one third of the 37 million metric tons (MT) of rice that is globally traded each year
is exported to Africa. Urban areas in West Africa consume more imported rice than domestic and, in many
countries, it remains the predominate source of rice while the current feasibility of domestic fortified rice
production in these countries is limited.

6
In summary, rice, tomato paste, and bouillon cubes may be good potential candidates as vehicles for
fortification in both Burkina Faso and Nigeria given their high availability, household coverage and
consumption in potentially fortifiable forms. That said, given the reliance on imported products, expanding
the fortification mandates to include them would only be worthwhile if there is strong monitoring and
enforcement at customs/border levels to ensure that only appropriately fortified foods are imported. If
mandates are not expanded and a voluntary fortification approach is pursued for these vehicles, evidence
indicates that both the sustainability and the public health impact may be limited.
Before adding new food vehicle to the fortification program further research is needed to assess the nutrient
contribution from fortified foods as well as the total intake of the nutrient from all dietary sources to
ascertain the extent to which the nutrient gap in the diet could be filled through current fortification efforts.
If these analyses reveal that the current program could meaningfully contribute towards filling the nutrient
gaps then it may be worthwhile to consolidate efforts to improve the compliance of producers of those food
vehicles rather than add new food vehicles. Alternatively, if the current food vehicles do not have the
potential to fill the actual nutrient gap or the feasibility to significantly improve compliance among
producers is limited then consideration of these new food vehicles may be warranted. In this case, additional
research would also be needed to confirm their coverage and utilization in other areas of the country as well
as their market share, value chains, and, for bouillon cubes, possibilities of excessive salt consumption.

7
1. Introduction
Fortification of industry-manufactured, and widely distributed and consumed foods with micronutrients (i.e.
large-scale food fortification) has the potential to improve the nutritional status of a large proportion of the
population (WHO & FAO 2006) and neither requires changes in dietary patterns nor individual decisions for
consumption (WHO et al. 2009). Large-scale food fortification is among the most sustainable medium-to-
long-term strategies to combat vitamin and mineral deficiencies and one of the most cost-effective public
health strategies when implemented through centralized and reasonably developed food industries. and
accompanied with a reliable enforcement mechanism.
Africa is currently contributing to the global momentum for oil and cereal grain fortification. In 2004, only
two countries (South Africa and Nigeria) had legislation that required fortification of industrially milled
wheat flour. Now, 25 countries have such legislation, and seven of those countries also require fortification
of industrially milled maize flour. In the 12 West African countries that have mandatory or voluntary wheat
flour fortification1 (FFI 2014), the impact on public health in some of these countries may be insufficient
because the population may not consume wheat flour in sufficient quantities to deliver meaningful amounts
of micronutrients. In West Africa, alternative foods may be needed to complement the delivery of nutrients
through wheat flour. For example, in Ghana, 51 grams of wheat flour are available per person per day,
compared to 94 grams of rice (FAO 2011); therefore, rice fortification may have the potential to improve
nutrition by complementing the contribution of fortified wheat flour. New vehicles for food fortification may
also be advantageous in certain circumstances: 1) when the current diet (local and fortified foods) does not
cover the dietary needs for some essential nutrients; and 2) if coverage of existing fortification programs
excludes certain population groups. In all cases, the population level impact depends on the proportion of
the population that has access to these food vehicles and how much they consume, information which has
not been accurately quantified across many West African countries for rice and other food vehicles that may
have high potential for impact nutrient intakes if fortified.
1 The countries are: Benin, Burkina Faso, Cape Verde, Côte d’Ivoire, Gambia, Ghana, Guinea, Guinea Bissau, Liberia, Mali, Mauritania, Niger, Nigeria, Senegal and Sierra Leone.

8
2. Objectives
The main objective of this report was to explore the potential of new food vehicles for large-scale food
fortification in West Africa.
Specific objectives of the report were:
1. To assess the presence of brands and producers of potentially fortifiable food vehicles (i.e. bouillon
cubes, tomato paste, rice, and maize flour) across select market hubs in Burkina Faso;
2. To assess the coverage of potentially fortifiable food vehicles (i.e. bouillon cubes, tomato paste, and
rice) among households, and utilization of these foods among children (less than five years of age)
and women of reproductive age (15 to 49 years), respectively, in two Nigerian states (Ebonyi and
Sokoto); and
3. To assess the feasibility and potential coverage of fortified rice in the Africa rice supply chain to
identify rice fortification opportunities (both domestic and import market) in Africa.
For objectives 1 and 2, primary data were collected as part of two Fortification Assessment Coverage Toolkit
(FACT) surveys conducted in West Africa that measured quality, coverage and/or consumption of fortified
foods implemented by the Global Alliance for Improved Nutrition (GAIN). For objective 3, secondary data
from a previously conducted assessment that identified rice fortification opportunities in 19 countries in
Africa implemented by GAIN and the Food Fortification Initiative (FFI) were used.
3. Methods
3.1 BURKINA FASO SURVEY
3.1.1 Study design and selection of market sites
A cross-sectional market survey was conducted by GAIN with support from Helen Keller International (HKI)
and in collaboration with the Ministry of Health (MOH) Nutrition Directorate and the Agence Burkinabè de
Normalisation, de la Métrologie et de la Qualité (ABNORM) in Burkina Faso. The survey used the FACT
market survey methodology. Detailed survey methods and results are presented elsewhere (GAIN 2018) and
summarized as follows.
Eight market hubs (Banfora, Bobo-Dioulasso, Dédougou, Ouagadougou, Kaya, Ouragye, Tenkodogo, and Fad
N’Gourma) were strategically selected based on the following criteria: population size and density,
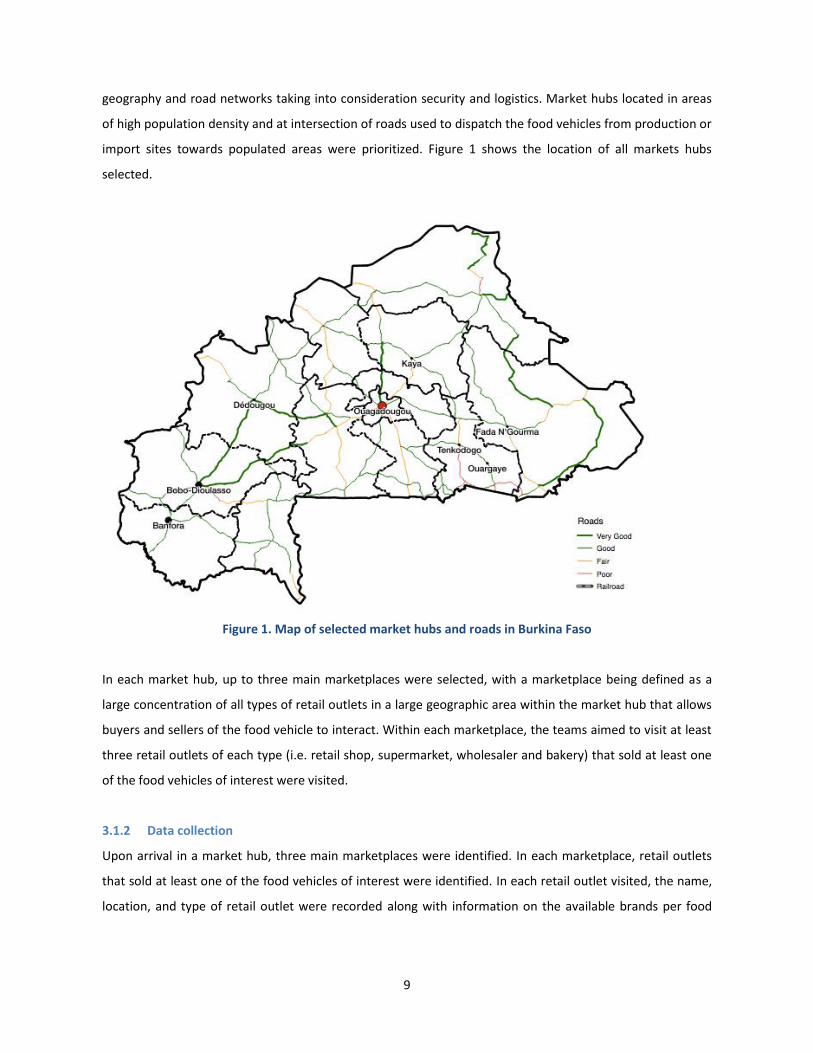
9
geography and road networks taking into consideration security and logistics. Market hubs located in areas
of high population density and at intersection of roads used to dispatch the food vehicles from production or
import sites towards populated areas were prioritized. Figure 1 shows the location of all markets hubs
selected.
Figure 1. Map of selected market hubs and roads in Burkina Faso
In each market hub, up to three main marketplaces were selected, with a marketplace being defined as a
large concentration of all types of retail outlets in a large geographic area within the market hub that allows
buyers and sellers of the food vehicle to interact. Within each marketplace, the teams aimed to visit at least
three retail outlets of each type (i.e. retail shop, supermarket, wholesaler and bakery) that sold at least one
of the food vehicles of interest were visited.
3.1.2 Data collection
Upon arrival in a market hub, three main marketplaces were identified. In each marketplace, retail outlets
that sold at least one of the food vehicles of interest were identified. In each retail outlet visited, the name,
location, and type of retail outlet were recorded along with information on the available brands per food

10
vehicle, including the producer name and address, the distributer/importer name and address, and the
packaging types and sizes for sale.
3.1.3 Ethical considerations and survey administration
Approvals were obtained from the Direction Générale de la Santé, Direction de la Nutrition. Data were
collected by two trained data collectors under the supervision of GAIN and ABNORM staff. All survey
instruments were contextualized and adapted to the local context then translated into French. Survey
instruments were pilot-tested prior to implementation to finalize language, wording, and flow of questions
and response options. Data were collected on paper forms, which were reviewed daily by supervisors for
completeness and correctness. All data collected as part of this survey are stored securely within the GAIN
office, are only available to authorized individuals for analytical purposes and are handled in accordance
with data protection best practices.
3.2 NIGERIA SURVEY
3.2.1 Survey design and target population
A survey in which households were selected using cross-sectional, multi-stage, cluster sampling and data
were collected using the FACT methodology was conducted by GAIN and Oxford Policy Management (OPM)
in collaboration with the Federal Ministry of Health in two states of Nigeria, Ebonyi and Sokoto. Detailed
survey methods and results are presented elsewhere (GAIN & OPM, 2018) and summarized as follows.
The target population was children (under five years of age) and women of reproductive age (WRA) (15–49
years old) as these two groups are among those most at risk of micronutrient deficiencies. In each state, 15
households were selected in 41 enumeration areas. Within each household, one child less than five years of
age was randomly selected and his/her caregiver was invited to participate in the survey.
3.2.2 Data collection
One household questionnaire was administered per household. First, the household roster was administered
to the household member most knowledgeable about the household. Then the primary caregiver of the
selected child under five was then asked to complete the remainder of the household questionnaire.
Information on household demographic and socio-economic characteristics was collected along with
information on household level coverage and consumption patterns (using the adult male equivalent
method) of fortifiable foods, including rice, tomato paste and bouillon cubes.

11
3.2.3 Ethical considerations and survey administration
Approvals were obtained from the National Health Research Ethics Committee of Nigeria. Data were
collected by trained data collectors under the supervision of OPM and GAIN staff. All survey instruments
were contextualized and adapted to the local context then translated into local languages. Survey
instruments were pilot-tested prior to implementation to finalize language, wording, and flow of questions
and response options. Data were collected on tablets, electronically through CAPI software, which enabled
automated live data checks during the implementation of the household interview. Extensive validations and
cross-checks were programmed into the CAPI software to reduce errors and inaccuracies during the
household interview. All data collected as part of this survey are stored securely within the OPM and GAIN
offices, are only available to authorized individuals for analytical purposes and are handled in accordance
with data protection best practices.
3.3 SUPPLY CHAIN ANALYSIS OF RICE IN AFRICA
3.3.1 Study design GAIN and the Food Fortification Initiative (FFI) undertook an analysis of the feasibility and potential coverage
of fortified rice in the Africa rice supply chain to identify rice fortification opportunities (both domestic and
import market) in 19 countries in Africa. Detailed methods and results are published elsewhere (FFI & GAIN
2016a) and summarized as follows.
3.3.2 Data collection Primary and secondary data were collected on rice milling industries (both domestic and import markets) in
19 countries in Africa. Primary data were collected in 13 priority countries: Benin, Gambia, Ghana, Guinea,
Guinea Bissau, Côte d’Ivoire, Liberia, Mali, Madagascar, Nigeria, Senegal, Sierra Leone, and Comoros by a
consultant. Secondary data sources, including, UN COMTRADE, FAO, USDA and rice exported association
websites for basic country data, including bilateral trade flow data, were used to collect additional
information on the 13 initial countries as well as six additional countries, i.e. Cabo Verde, Mauritania,
Djibouti, Egypt, Gabon, Mauritius.

12
4. Results
4.1 BURKINA FASO SURVEY
In total, 255 retail outlets were visited in the eight market hubs selected for the market assessment. The
results revealed that rice, tomato paste, and bouillon cubes are widely available across all regions of the
country, although over 90% of the available brands are imported. In summary, 60 brands of bouillon cube
were identified that were produced by 27 companies across 10 countries, with only one (3.6%) being locally
produced. For tomato paste, 76 brands were identified from 11 countries, with only three brands (3.9%)
being locally produced. For rice, 136 brands were identified from 10 countries, with only 13 (10%) being
locally produced. For maize flour, 35 brands were identified from three countries with 33 brands (94.3%)
being locally produced. The imported brands of bouillon cubes are mainly from Europe and Senegal, tomato
paste from China, and rice from Asia (Thailand, Vietnam and India). In contrast, maize flour was
predominantly locally produced but, according to the labelling, marketed as a specialty product targeting
people with diabetes and young children.
The following profiles present general information for each food vehicle, such as the number of brands
present in the markets, the breakdown of types, packaging characteristics, and the distribution across the
market hubs, as well as specific information of interest per food vehicle related to disaggregation by origin of
production and/or importation versus local production.

ProductionOrigin
N
%
BurkinaFaso 1 3.6Ghana 2 7.1Mali 1 3.6Niger 1 3.6Nigeria 1 3.6Senegal 5 17.9Tunisia 1 3.6France 6 21.4Spain 3 10.7China 3 10.7Unknown 4 14.3
General
PresenceTotalcompanies:27
AProfileofBurkinaFaso’sBouillonCubeMarket
7
9
6
12
15 59
4 Figure2.Numberofbouilloncubebrandsfoundineachmarkethub
While60uniquebrandswereidentifiedinthemarkethubs,thesewereproducedby27companies.Twolargecompaniesproduced8uniquebrandseach,1companyproduced5brands,1companyproduced4brands,4companiesproduced2brandseach,4companiesproduced3brandseach,andtheremaining15companiesinthemarketproducedjust1brandeach.OnlyoneofthesecompanieswasBurkinabé.
Productionorigin*Ofthe27companies,justoneisproducedin2differentcountries,thusthecountbyproductionoriginis28,not27.Allbut1areimported.Whilethecountryofproductioncouldnotbeidentifiedfor4companies,12companies(48%)werebasedinAfricannations(BurkinaFaso,Ghana,Mali,Niger,Nigeria,SenegalandTunisia),9wereEuropean(fromFranceorSpain),and3wereChinese.
OutletsMostbouilloncubecompanieswereobservedforsaleinsmallretailshops(78%ofthecompanies)andinsupermarkets(52%).Only15%ofthecompaniesweresoldinwholesaleshops.ForthosecompaniesthatproduceinAfricannations,all(100%ofcompanies)soldtheirbrandsinsmallretailshops,while½(50%)soldinsupermarkets.CompaniesfromEuropegenerallysoldmoreinsupermarkets(78%ofEuropeanbouilloncubecompanies)comparedtosmallretailshops(44%).
Fourofthecompanieshadspreadtheirproductswidelyacrossthecountryandwerefoundin7-8ofthemarkethubsallmarkethubs.Themajorityofthecompanies(21,78%)werefoundinjust1-2hubs.
PackagingtrendsAllcompaniessoldtheirproductsascubespackagedinboxesofdifferentquantities(4cubesupto64cubes).Boxesof60cubeswereapopularsizeforcompanies–52%ofcompaniessoldinthatsize.Afewalsosoldtheirproductsinplasticsachets.
13

ProductionOrigin N %BurkinaFaso 3 3.9China 37 48.7Italy 8 10.5Ghana 2 2.6Malaysia 1 1.3France 1 1.3Turkey 1 1.3Niger 1 1.3Senegal 1 1.3Tunisia 1 1.3UAE 1 1.3Unknown 19 25.0
Gen
eral
AProfileofBurkinaFaso’sTomatoPasteMarket
PresenceTotalbrands:76
15
24
823
387
14
Productionorigin
Figure3.Numberoftomato33 pastebrandsfoundineach
markethub
ThemajorityoftomatopastebrandsareimportedfromChina(37brands,49%),withtheItalianbrandsbeingsecond(8brands,11%).Only3brandswerelocallyproduced(4%).The3locallyproducedbrandswerefoundinthewesternmarkethubs.
Outlets&marketdispersionAhighproportionofbrandsarefoundinsmallretailshops(80%)andinsupermarkets(57%ofbrands).Wholesalersstockanarrowerrangeofbrands(33%ofbrandsrepresented).Ascanbeseeninthemap,alargerproportionofbrandswerefoundoutinwesternmarkethubsandOuagadougoucomparedtotheeasternmarkethubs:intotal50%ofobservedbrandswereseeninBobo-Dioulasso,44%seeninBanfora,32%wereseeninDédougou,and30%inOuagadougou.Bycomparison,20%wereseeninKaya,18%inOurgaye,11%inFada-Ngourma,and9%inTenkodogo.
PackagingtrendsMostofthebrandsareavailableintincansof1to2packagingsizes:29brands(38%)areavailableinjustonepackagingsize,while32brands(42%)areavailablein2differentpackagingsizesand13brands(17%)areavailable3ormorepackagingsizes.Thetincansvaryinsize/weightfrom56gto2.2kg,withthemostcommonlysoldsizesbeing2.2kgcans(54%ofbrandsaresoldinthissize),400gcans(34%ofbrands),210g(26%ofbrands),and70gcans(49%ofbrandssoldinthissize). BrandsproducedinAfrica(BurkinaFaso,Ghana,Niger,Senegal,andTunisia),tendtocomein2.2kg,210g,and/or70g;brandsfromChinatendtocomeinthesameaswellasin400gcans,whilebrandsfromEurope(mostlyItalybutalsoFranceandTurkey)tendtocomeinawiderassortmentofsizesinclusiveofthosesamesizesmentionedabove,aswellas1kg,880g,800g,600g,440g,340g,220g,and170g.
14

ByOriginofproduction
General
PresenceTotalbrands:136
25
41
AProfileofBurkinaFaso’sRiceMarket
Productionoriginofbrands N %BurkinaFaso 13 9.6Thailand 40 29.4
38 Vietnam 18 13.2Myanmar 4 2.9
36India 34 25.0Pakistan 2 1.5
83Italy 2 1.5
2216 USA 1 0.7
Nigeria 1 0.725 Figure4.Numberofricebrands
foundineachmarkethubAlgeria 1 0.7Unknown 20 14.7
ImportedN=123brands(90%)
TypeThemajorityofimportedricebrandsaresoldaswholegrain(62%).Approximately16%aresoldasbrokenrice,almostallofwhichcomesfromSoutheastAsiancountries.Parboiledvarieties,ontheotherhand,comemostlyfromAsian(India,Pakistan)andAfrican(Nigeria,Algeria)countries.
Outlets&marketdispersionThemajorityoftheimportedricebrandswerefoundinsupermarkets(73%),whilecloserto½theimportedricebrandswereseeninwholesaleshops(47%)and59%werefoundinsmallretailshops.Mostbrands(85%)arefoundin3orfewermarkethubs(14%in3hubseach,31%in2hubseach,and41%in1hubeach).Oftheremaining15%ofbrands,8brands(7%)areseenin4hubseach,4brands(3%)in6hubseach,and4brandsin5hubsandin7hubsrespectively.
PackagingtrendsMostoftheimportedbrands(61%)wereavailablein50kgPETsacs.Thenextmostcommonsizesseenwere25kgPETsacs(33%)and5kgsacs(38%).Approximately23%weresoldineither1kgor900gplasticbags.
LocalN=13brands(10%)TypeMostofthelocallyproducedricebrandsaresoldaswholegrain(7ofthe13brands),while4areparboiledand2hadnoindicationoftypeonthepackaging.Outlets&marketdispersionSimilarlytoimportedbrands,localbrandsweremostlyfoundinsupermarkets(10ofthe13brands,77%).Only3ofthe13brandswereseeninwholesaleshopsand1insmallretailshops.Localbrandsdidnothaveaswidedispersionacrossmarketsasimportedbrands:1brandwasseenin4hubs,3brandswereseen2hubseach,and9brandswerefoundinjust1hubeach.NolocalbrandswereseeninBanfora,while8ofthe13brandswereseeninOuagadougou.PackagingtrendsOnly1ofthelocalbrandswasseenforsaleonlyina1kgplasticbag.Themajority(8)weresoldin25kgPETsacs,and6ofthe13weresoldin5kgbagsPETsacs.
15

ProductionOrigin N %BurkinaFaso 33 94.3Thailand 1 2.9Lebanon 1 2.9
LocalBrandsOuagadougou
27
87.1Dédougou 2 6.5Banfora 1 3.2Kaya 1 3.2
Gen
eral
AProfileofBurkinaFaso’sMaizeFlourMarket
PresenceTotalbrands:35
4
3
1
8 1
Maizeflourisbrandedasaspecialty 1
producttargetingpeoplewithdiabetesandyoungchildren.
Figure5.Numberofmaizeflourbrandsfoundineachmarkethub
ProductionoriginThemajorityofmaize flourbrandsarelocallyproducedinOuagadougou:Ofthetotal35brands,33wereBurkinabéand27wereproducedinOuagadougou.TheremainingtwowereproducedinDédougou,oneinBanfora,andoneinKaya(for2localbrands,theproductionsitecouldnotbediscerned).Ofthetwoimportedbrands,oneisproducedinThailandandoneinLebanon.
Outlets&marketdispersionAllbrandswerefoundonlyinsupermarkets.Themajorityofbrands(33brands)werealsofoundonlyinonemarkethub,withonebrandfoundin2hubsandonebrandfoundin3hubs.ThemarketformaizeflourishighlyconcentratedinOuagadougou(28brandsfoundinthecapital)withtherestofthemarkethubssellingbetween1to4brands.NomaizeflourbrandswerefoundinBobo-DioulassoorOurgaye.
PackagingtrendsMostofthebrandsareavailablein1kgplasticsacs(49%ofbrands),with¼ofbrands(26%)availablein15kgPETsacs.Otherobservedsizesarebagsof500g,2kg,3kg,4kg,5kg,6kg,9kg,20kg,and25kg.THemajorityofbrands(51%)wereavailableinjustonesize,but6brandswerefoundin2differentsizesand7brandswerefoundin3differentsizedpackages.
16

17
4.2 NIGERIA SURVEY
In total, 610 households in Ebonyi and 614 households in Sokoto (of the required 615 in each state) were
interviewed. In Ebonyi, there was nearly universal household coverage of bouillon cube, tomato paste, and
rice in general (100%, 95%, and 100%, respectively) with similarly high coverage of the fortifiable forms of
the food vehicles, i.e. industrially produced, (100%, 95%, and 83%, respectively) (Figure 6). In Sokoto, there
was high coverage of bouillon cube and rice (99% and 93%, respectively) with slightly lower coverage of
tomato paste (65%) in general. An equal proportion of households consumed bouillon cube in a fortifiable
form (99%) while household coverage of fortifiable tomato paste and rice was lower (45% and 40%,
respectively) (Figure 6).
Figure 6. Household coverage of foods and fortifiable foods in Ebonyi and Sokoto, Nigeria
When household coverage results were disaggregated by various risk factors related to low micronutrient
intakes, some differences were revealed. In Sokoto, fewer poor households (i.e. multi-dimensional poverty
index ≥0.33) consumed fortifiable rice compared to non-poor households (36% vs. 54%). Similarly, fewer low
socio-economic households (i.e. those in the lowest two demographic health survey (DHS) wealth quintiles)
compared to high socio-economic households (i.e. those in the highest three DHS wealth quintiles)
consumed fortifiable tomato paste (37% vs. 54%) and rice (36% vs. 45%). In Ebonyi, there were no
differences between poor vs. non-poor or low vs. high socio-economic households in terms of coverage of
these fortifiable foods. These differences are not surprising as the risk of poverty is high in Sokoto (76% of
households are poor vs. only 33% in Ebonyi, and 51% of households have low socio-economic status vs. only
28% in Ebonyi). Furthermore, Sokoto is a rice producing state, which in part explains the lower coverage of
fortifiable rice among households.

18
Figure 7 presents the amount of fortifiable foods
consumed daily among WRA. In terms of
consumption patterns, WRA in Ebonyi apparently
consumed 2 g/day of fortifiable bouillon cube, 27
g/day of fortifiable tomato paste, and 80 g/day of
fortifiable rice. In Sokoto, these figures were 3
g/day of fortifiable bouillon cube, 8 g/day of
fortifiable tomato paste, and 97 g/day of
fortifiable rice. There were no significant
differences in daily consumption of these
fortifiable foods between women from poor vs.
non-poor or low vs. high socio-economic
households in either state.
Figure 7. Daily apparent consumption of fortifiable foods among women of reproductive age in Ebonyi and Sokoto, Nigeria
4.3 SUPPLY CHAIN ANALYSIS OF RICE IN AFRICA
The supply chain analysis of rice revealed that nearly one third of the 37 million MT of rice that is globally
traded each year is exported to Africa. Urban areas in West Africa consume more imported rice than
domestic and, in many countries, it remains the predominate source of rice. On average, 19 African
countries, including several in West Africa, have 75 grams per capita per day of rice available for
consumption. The current feasibility of domestic fortified rice production in these countries is limited;
therefore, successful rice fortification would require the fortification of imported brands that are coming
predominately from countries in Asia. Detailed results are available in the report (FFI & GAIN 2016a) and
country profiles can be found on the FFI website.
Of most interest to this report is the Nigeria country profile (FFI & GAIN, 2016b), which revealed that Nigeria
is the biggest rice consuming country in Africa (5.1 million MT) and had the greatest number of rice imports
(2.1 MMT) and domestics rice production (2.7 million MT) in 2016. However, 80% of the rice consumed is
imported and controlled by a limited number of companies (four to five) while only about 12% of local rice is
industrially produced and could potentially be fortified with the remainder being produced domestically for
home consumption and thus would not be feasible to fortify.

19
5. Key Findings and Recommendations
5.1 KEY FINDINGS
The findings of this report provide information on the potential for fortification of new food vehicles in West
Africa, particularly in Burkina Faso and Nigeria. In summary, rice, tomato paste, and bouillon cubes may be
good potential candidates as vehicles for food in both Burkina Faso and Nigeria given their high availability
and household coverage and consumption in potentially fortifiable forms. However, as the majority of those
foods are coming from other countries, a food fortification program based on them should be
conceptualized as regional and place a major emphasis on a very strong and reliable enforcement
mechanism at the importation sites. On the other hand, maize flour in Burkina Faso is not recommended as
a vehicle for fortification given its generally low household coverage in a fortifiable form.
Bouillon cubes appear to be the most suitable for establishing large programs with less heterogeneity and
therefore potentially easier to manage given the relatively small number of companies producing them in
Burkina Faso with about half (48%) coming from West and North Africa and high household coverage in a
fortifiable form in Nigeria. A fortified bouillon cube containing iodine and iron has already been released by
one large manufacturer in multiple West African countries (Benin, Togo, Cameroon, Côte d’Ivoire, Nigeria,
Senegal, Ghana, Niger and Guinea) (Nestlé, 2015). However, information on its coverage and consumption is
limited. Further research is needed into the market share and supply chains, both nationally and across
other regions/states, and into any potential health implications related to excessive salt consumption, given
the success of the salt iodization programs and estimated nutrient intake contributions, in the event the
promotion of a fortified bouillon cube increases demand and consumption before specific recommendations
can be made. Tomato paste and rice have high potential, although this is compromised by the home-
production of these foods in some areas. That said, they also appear more challenging as vehicles for
fortification given they are widely produced outside of Africa (over 90% of the available brands are
imported). As a result, expanding the fortification programs to include them would only be worthwhile if: 1)
foreign producers are willing to fortify the products they are exporting to these countries, and 2) there is
strong monitoring and enforcement at customs/border levels to ensure only appropriately fortified foods
are imported. Efforts to initiate and/or improve fortification in the countries where these imported products
are coming from would likely be necessary given the low level of fortification among imported brands found
in the Burkina Faso survey. This may also require an alignment of standards across the main countries
supplied with the same products.

20
That said, the heavy reliance on imported rice that is centrally produced in other regions may actually make
rice fortification opportune in many West African countries. For countries with limited internal rice
fortification capacity, such as those in West Africa, requiring the fortification of imported rice could be
relatively easy if the rice industry in other countries accepts to implement the intervention. However,
national production of rice is still important, as demonstrated in the Nigeria survey, therefore further studies
are needed to better understand its potential as a fortifiable food source. Mandatory legislation for both
imported rice as well as domestically produced rice across the region would be necessary to increase the
coverage of fortified rice in West Africa and create the necessary policies requiring rice exporters in the
major exporting countries (e.g. Thailand, Vietnam, and India) to fortify their exported rice to the region.
An important limitation to note in these studies is that dietary intake data were not collected. Therefore,
while the studies do identify potential food fortification vehicles, they do not provide the evidence that
would be needed to design such programs, i.e., which nutrients and at what level specific nutrients should
be fortified.
Before adding new food vehicle to a fortification program further research is needed in each country to
assess the following three things. First, it is important to assess both the nutrient contribution from fortified
foods as well as the total intake of the nutrient from all dietary sources to ascertain the extent to which the
nutrient gap in the diet could be filled through current fortification efforts. Second, if these analyses reveal
that the current program could meaningfully contribute towards filling the nutrient gaps then it may be
worthwhile to consolidate efforts to improve the compliance of producers of those food vehicles rather than
adding new food vehicles. Third, if the current food vehicles do not have the potential to fill the actual
nutrient gap or the feasibility to significantly improve compliance among producers is limited then
consideration of these new food vehicles may be warranted. In this case, additional research would be
needed to confirm their coverage and utilization in other areas of the country as well as their market share,
value chains, and, for bouillon cubes, possibilities of excessive salt consumption. It is important to
underscore these formative steps to avoid inheriting current constraints with any new food vehicles for
fortification.

21
5.2 RECOMMENDATIONS
Based on the findings of this report, several priority recommendations can be made:
1. Future research into dietary intake patterns of these food vehicles and the nutrient gap the current
fortification programs could fill is needed before new food vehicles are added;
2. Further research into the market share and supply chains for bouillon cube and tomato paste is
needed; and
3. Further research into the feasibility of nationally produced rice in countries of interest is needed.
These results will be shared with nutrition stakeholders in Burkina Faso, Nigeria and the region to further
guide programming efforts and nutrition policy recommendations.

22
6. References
FAO (2011). Food Balance Sheets. http://faostat3.fao.org/. Accessed 20 November 2016.
FAOSTAT (2011). Trade, Crops and Livestock Products by Country. Food and Agriculture Organization. http://faostat3.fao.org/browse/T/TP/E. Accessed 14 March 2015.
Food Fortification Initiative. Global Progress. http://ffinetwork.org/global_progress/index.php. Accessed 8 June 2014.
Food Fortification Initiative (FFI) & Global Alliance for Improved Nutrition (GAIN) (2016a). Feasibility and Potential Coverage of Fortified Rice in the Africa Rice Supply Chain. http://www.gainhealth.org/wp-content/uploads/2016/12/Feasibility-and-Potential-Coverage-of-Fortified-Rice-in-the-Africa-Rice-Supply-Chain-Executive-summary.compressed.pdf. Accessed 15 November 2017.
Food Fortification Initiative (FFI) & Global Alliance for Improved Nutrition (GAIN) (2016b). Federal Republic of Nigeria Country Snapshot on Rice. http://ffinetwork.org/about/stay_informed/releases/images/Rice_Nigeria.pdf#Nigeria. Accessed 2 February 2017.
Global Alliance for Improved Nutrition (2017). Fortification Assessment Coverage Toolkit (FACT) Market Survey in Burkina Faso, 2018. Global Alliance for Improved Nutrition. Geneva, Switzerland. (under review).
Global Alliance for Improved Nutrition & Oxford Policy Management (2017). Fortification Assessment Coverage Toolkit (FACT) Market Survey in Two Nigerian States: Ebonyi and Sokoto, 2018. Global Alliance for Improved Nutrition. Geneva, Switzerland. (under review).
Nestlé (2015). Nestlé introduces iron-fortified MAGGI bouillons to consumers in Togo and Benin. Accessed 15 February 2018. http://www.nestle-cwa.com/en/nestl-introduces-iron-fortified-maggi-bouillons-to-consumers-in-togo-and-benin.
World Health Organization & Food and Agriculture Organization (2006). Guidelines on food fortification with micronutrients. World Health Organization: Geneva. http://www.who.int/nutrition/publications/guide_food_fortification_micronutrients.pdf Accessed 14 March 2015.
WHO, FAO, UNICEF, GAIN, MI, & FFI (2009). Recommendations on wheat and maize flour fortification. Meeting Report: Interim Consensus Statement. World Health Organization: Geneva. http://www.who.int/nutrition/publications/micro-nutrients/wheat_maize_fort.pdf Accessed 14 March 2015.