FINAL REPORT FS102109 - EU Harmonised Surveillance of ...
85
Page 1 of 85 FINAL REPORT FS102109 - EU Harmonised Surveillance of Antimicrobial Resistance (AMR) in E. coli from Retail Meats in UK (2020 - Year 6, chicken) 21st September 2021 Animal and Plant Health Agency (APHA) Woodham Lane New Haw Surrey KT15 3NB https://doi.org/10.46756/sci.fsa.phi798
Transcript of FINAL REPORT FS102109 - EU Harmonised Surveillance of ...

Page 1 of 85
FINAL REPORT
FS102109 - EU Harmonised Surveillance of
Antimicrobial Resistance (AMR) in E. coli from
Retail Meats in UK (2020 - Year 6, chicken)
21st September 2021
Animal and Plant Health Agency (APHA)
Woodham Lane
New Haw
Surrey
KT15 3NB
https://doi.org/10.46756/sci.fsa.phi798

Page 2 of 85
Table of contents
Liability Statement ..................................................................................................... 4
1. Lay person’s summary ....................................................................................... 5
2. Executive Summary.......................................................................................... 10
3. Glossary ........................................................................................................... 16
4. Materials and Methods ..................................................................................... 18
5. Results ............................................................................................................. 25
Table 1 – Number of samples per NUTS-1 area† ................................................... 25
Table 2 – Collected samples* completed per retail chain, per UK region† .............. 26
Table 3 - Number of samples collected by regions and isolates tested by MICs. .... 32
Table 4 - Number of samples per supermarket tested that gave rise to E. coli on MCA-CTX with resistance phenotypes. ................................................................... 38
Table 5 - Samples positive on for E. coli on MCA-CTX with MIC phenotype. .......... 39
Table 6 - MIC results of 19 antimicrobials against all E. coli from MacConkey agar + 1 mg/L cefotaxime with AmpC (A) ESBL (E) or AmpC + ESBL (A+E) phenotype. .. 42
Table 7 - Summary of resistance phenotypes for E. coli from MacConkey agar + 1 mg/L cefotaxime - Comparison between 2018 and 2020 isolates. .......................... 45
Table 8 - Samples positive for E. coli on CHROMagar™ ESBL. ............................ 46
Table 9 - Samples positive for E. coli on both MacConkey agar + 1 mg/L cefotaxime and CHROMagar™ ESBL. ...................................................................................... 50
Figure 1 - Percentages of chicken meat samples (skin on or off) positive for E. coli on MacConkey agar + 1 mg/L cefotaxime and CHROMagar™ ESBL for 2016, 2018 and 2020.................................................................................................................. 52
Figure 2 - Breakdown of resistance to antibiotics for AmpC- and ESBL-phenotype E. coli from isolated on MacConkey agar + 1 mg/L cefotaxime from retail chicken meat in 2018 and 2020. .................................................................................................... 53
Table 10 – Details of mcr positive meat samples and overall mcr results by PCR and WGS. ....................................................................................................................... 54
Table 11 – WGS results for isolates from meat sample 2798047. ........................... 56
Table 12 – WGS results for isolates from meat sample 563345. ............................. 57
Table 13 – WGS results for isolates from meat sample 2798073. ........................... 58
Table 14 – WGS results for isolates from meat sample 2672451. ........................... 59
Table 15 – MICs of colistin and quinolone antibiotics against E. coli carrying mcr-1. ................................................................................................................................ 60
Table 16 – MICs of beta-lactam antibiotics including meropenem against E. coli carrying mcr-1. ......................................................................................................... 61
Table 17 – MICs of sulfamethoxazole, tetracycline and trimethoprim against E. coli carrying mcr-1. ......................................................................................................... 62
Table 18 – MICs of azithromycin, chloramphenicol, gentamicin and tigecycline

Page 3 of 85
against E. coli carrying mcr-1. ................................................................................. 63
6. Discussion ........................................................................................................ 64
7. Conclusions ...................................................................................................... 70
8. Appendix 1 - Viable counts of E. coli from chicken meat samples homogenised in Buffered Peptone water (BPW) or saline. ............................................................ 72
9. Appendix 2 – Further molecular characterisation of mcr-1 plasmids ................ 78
10. References ................................................................................................... 81

Page 4 of 85
Liability Statement
© Crown Copyright 2021
This report has been produced by The Animal and Plant Health Agency (APHA)
under a contract placed by the Food Standards Agency (FSA). The views expressed
herein are not necessarily those of the FSA. APHA warrants that all reasonable skill
and care has been used in performing tests and preparing this report.
Notwithstanding this warranty, APHA shall not be under any liability for loss of profit,
business, revenues or any special indirect or consequential damage of any nature
whatsoever or loss of anticipated saving or for any increased costs sustained by the
client or his or her servants or agents arising in any way whether directly or
indirectly as a result of reliance on this report or of any error or defect in this report.

Page 5 of 85
1. Lay person’s summary
This report presents results of the EU harmonised surveillance of antimicrobial
resistance (AMR) in E. coli from retail chicken meats in the UK in 2020.
In accordance with European Directive 2003/99/EC on the monitoring of bacteria
that can pass from animals to humans and causes disease (zoonoses and zoonotic
agents), Member States (MS) are obliged to ensure that procedures are in place to
monitor and report on the occurrence of antimicrobial resistance (AMR) in such
bacteria. The UK continued to be subject to EU rules during the transition period up
to the end of December 2020. Further testing of retail beef, chicken and pork is
being considered based on surveillance priorities.
The requirements (with additional detailed guidance from the EU Reference
Laboratory for Antimicrobial Resistance) state that 300 retail chicken meats should
be tested by culture for the bacterium Escherichia coli. E. coli bacteria are a normal
part of the gut flora of mammals and as such can be useful “indicators” of AMR in
gut bacteria. Whilst some strains of E. coli can cause disease, most strains of E. coli
do not cause observable disease in healthy animals and humans.
The EU requirements state that samples should be tested on an agar (growth
medium) supplemented with a third generation cephalosporin. Third generation
cephalosporins are a group of antimicrobials which are important for treating
infections in humans. E. coli growth on this agar suggests antimicrobial resistance
known as Extended Spectrum β-lactamase (ESBL) resistance and/or AmpC
resistance.
ESBL resistance is also referred to as ESBL-phenotype, AmpC resistance is also
referred to as AmpC-phenotype. The degrees of susceptibility/resistance of E. coli
recovered from this agar must then be determined to a pre-defined panel of
antimicrobials by Minimum Inhibitory Concentrations (MICs) tests.
EU requirements also state that samples should be tested on two other
supplemented agars which select bacteria which are resistant to carbapenems.
Carbapeems are another a group of antimicrobials which are very important in
human medicine. Carbapenems are termed “last resort” antimicrobials because they
are used to treat severe infections when all or almost all other treatment options
have failed, because the infecting bacteria are resistant to most / all other relevant
antimicrobials. Additionally, each meat sample is tested for counts of the number of

Page 6 of 85
background and AMR (AmpC and ESBL type resistance only) E. coli in each meat
sample according to an EU protocol.
At the request of the FSA, other agar culture media used to test samples included
an agar to specifically isolate E. coli with ESBL-only type resistance only (rather
than for E. coli with both an AmpC and an ESBL type resistance as per one of the
EU specified agars), and an agar to isolate colistin resistant E. coli. Colistin is
another “last resort” antimicrobial, so it is important to monitor if resistance in E. coli
to colistin is occurring in food samples. Colistin resistance in E. coli isolates may
involve a number of resistance genes such as mcr-1, mcr-2 and mcr-3. These mcr
genes are considered particularly important as they are usually carried on genetic
elements known as plasmids. As plasmids are “mobile” (can pass from one
bacterium to another), the resistance genes located on them can potentially be
shared with other bacteria within the gut.
In total during 2020, 327 samples of fresh chicken were collected of which 315 were
eligible for testing. The 315 eligible retail chicken meat samples were collected from
England (n=274), Scotland (n=20), Wales (n=11), and Northern Ireland (n=10) from
ten different supermarket chains.
Sample collection was impacted by the coronavirus pandemic. Monthly sampling
was suspended for 3 months from April to June 2020, resuming in July. Sample
numbers were adjusted in subsequent months to reach the target of 300 samples.
The types of chicken meat collected were whole chicken (n=127), chicken breast
(n=113) and other cuts, including quarters, legs, thighs & drumsticks (n=75). Of the
samples collected, 58.7% and 41.2% had skin on or off respectively. Breast
samples were the main sample type from which skin was removed. Of the 315
samples, 309 were stated as originating from the UK, five from Poland and one from
Ireland.
No growth was observed from any of the samples (meaning the test results were
negative and the bacteria were therefore not resistant to carbapenem
antimicrobials) on the two agars that selected for carbapenem-resistant E. coli.
Forty-one (13.0%) of the samples gave rise to E. coli on MacConkey agar + 1 mg/L
cefotaxime. These positive results imply the E. coli were resistant to cefotaxime.
MIC analysis of these 41 isolates found that 39 of the total number of samples
tested (12.4%) expressed an ESBL-phenotype resistance (including two isolates
additionally expressed the AmpC phenotype resistance). The remaining two of

Page 7 of 85
these 41 E. coli isolates (0.63%) expressed an AmpC-phenotype resistance but not
ESBL-phenotype resistance.
The observed frequencies of recovery of ESBL-phenotype E. coli from samples
from individual supermarkets ranged from 0% to and 22.1% of the samples tested
per supermarket, including those with an AmpC+ESBL-phenotype.
A total of 54 of all the samples tested, representing 17.1%, gave rise to growth on
the ESBL-only specific agar and a total of 3 (0.95%) of all the samples tested were
positive for the mcr-1 transferable colistin resistance gene. These three samples all
originated from Poland.
A further two samples were also originally positive for mcr-3 when multiple suspect
colonies was tested. However, it was not possible to isolate individual mcr-3 positive
E. coli from the mix, so these results must be considered equivocal.
Using MIC tests, the isolates from the AmpC/ESBL specific agar were tested for the
degree of resistance to a total of 19 antimicrobials. Based on the MIC results,
isolates were determined as resistant or sensitive to a particular antimicrobial using
cut-offs known as ECOFFs (Epidemiological Cut Offs published by EUCAST). The
ECOFF distinguishes between organisms without and with phenotypically
expressed resistance mechanisms for a bacterial species to an antimicrobial.
None of the 41 isolates from the AmpC/ESBL specific agar were microbiologically
resistant to the ‘last resort’ carbapenem antimicrobials imipenem and meropenem or
to colistin. The MIC of ertapenem against one AmpC+ESBL-phenotype isolate was
just above the previous EUCAST ECOFF (currently there is only a tentative ECOFF
for ertapenem), and as such was microbiologically resistant. This isolate was not
clinically resistant though, using EUCAST clinical breakpoint..
None of the E. coli were resistant to the antibiotics temocillin or tigecycline.
Only one isolate was resistant to the antibiotic’s azithromycin or gentamicin, whilst
about 60% of isolates were resistant to the quinolone antibiotics (ciprofloxacin or
nalidixic acid) or to chloramphenicol.
Isolates obtained from agar with 1 mg/L cefotaxime were all resistant to cefotaxime
and to antibiotics of a similar type, such as ampicillin and ceftazidime and most were
also resistant to cefepime.
Most of the isolates were resistant to the older antibiotics’ sulfamethoxazole and
tetracyclines, and approximately 50% were resistant to trimethoprim.

Page 8 of 85
Genetic tests (whole genome sequencing) showed that most of the E. coli isolates
from the ESBL agar carried the blaCTX-M gene which confers resistance to third
generation cephalosporin antimicrobials, and has been frequently detected in E. coli
from chickens and chicken meat in previous studies, including the 2016 and 2018
surveys.
None of the meat samples had bacterial counts of background E. coli (isolates
obtained from agar without antibiotics) or presumptive AmpC/ESBL-producing E.
coli above the detection limit (when using the EU method) of 3,000 E. coli colony
forming units (cfu) per gram of meat.
In summary, the results in 2020 showed that 12.4% and 1.6% of retail chicken meat
samples were positive for ESBL or AmpC-phenotype E. coli, respectively (including
the three isolates with the combined AmpC/ESBL-phenotype in both the ESBL or
AmpC-phenotype groups) on the AmpC/ESBL specific agar.
Whilst there was an increase in the percentage of isolates with an ESBL-phenotype
there was a decrease in the percentage of isolates with an AmpC-phenotype
between 2018 and 2020. Overall, between 2018 and 2020, the percentages of
samples positive on the AmpC/ESBL specific agar remained almost identical at
13.6% and 13.0%, respectively.
None of the samples were positive for carbapenem-resistant E. coli on either of the
two carbapenem selective agars.
Between the 2016 and 2018 EU surveys1 there was a significant reduction in the
proportion of chicken samples positive on the AmpC/ESBL specific agar and the
ESBL agar. Comparison with a paper on UK samples tested in 2013/142 also
showed a significant reduction in samples positive for ESBL-producing E. coli
between 2013/14 and the 2016 EU survey (65.4% to 29.7%), albeit sampling and
isolation methods were similar, but not identical for the two studies.
The 2018 report for chicken meat samples1 suggests that these drops in the level of
antimicrobial-resistant E. coli on retail chicken meat since 2013/14 may be linked to
the restriction by the British Poultry Council to the use of third- and fourth-generation
cephalosporins in flocks used for poultry meat production in the UK in 2012 as part
of antimicrobial stewardship.3
The 2020 survey results suggest that the proportions of AmpC or ESBL-phenotype
E. coli in retail chicken have not changed since 2018. There was a slight increase in
the proportions of samples that were positive on the ESBL-specific agar compared

Page 9 of 85
to the 2018. This was the first year that retail chicken samples were found to be
positive for mcr plasmid- mediated colistin resistant E. coli.
It should be considered that 2020 was an unusual year due to the impact of the
coronavirus pandemic, although there is no reason to suppose this affected the
proportions of retail chicken meat positive for AMR E. coli.

Page 10 of 85
2. Executive Summary
In accordance with European Directive 2003/99/EC on the monitoring of zoonoses
and zoonotic agents, Member States (MS) are obliged to ensure that procedures
are in place to monitor and report on the occurrence of antimicrobial resistance
(AMR) in zoonotic organisms. The European Commission Implementing Decision
2013/652/EU, which came into force 1 January 2014, outlines the technical
requirements for AMR testing, as well as the organisms and livestock species in
which AMR must be monitored and reported. Mandatory requirements are set out
for MS to monitor and report AMR data for Salmonella spp., Campylobacter jejuni,
indicator commensal Escherichia coli, AmpC and extended-spectrum beta-
lactamase (ESBL) E. coli and carbapenemase-producing E. coli.
This report outlines the procedures put in place to fulfil these requirements for UK
retail chicken meat in 2020 for AmpC, ESBL and carbapenem-resistant E. coli,
following European Union (EU) guidelines and methods. Further testing of retail
beef, chicken and pork is being considered based on surveillance priorities.
The requirements (with additional detailed guidance from the EU Reference
Laboratory for Antimicrobial Resistance) state that 300 retail chicken meat samples
should be tested by culture for E. coli on MacConkey agar containing 1 mg/L of the
cephalosporin antimicrobial cefotaxime. E. coli isolates cultured from such media
are expected to show third generation cephalosporin resistance which may include
ESBL and / or AmpC type resistance and should be further tested by performing
Minimum Inhibitory Concentrations (MICs) to determine their susceptibility to a
panel of antimicrobials.
Samples were also tested for carbapenem-resistant E. coli on chromID® carba and
chromID® OXA-48 agars as recommended by the EU and viable counts pre-
enrichment were performed on MacConkey agar containing ± 1 mg/L cefotaxime,
according to an EU protocol.
At the request of the FSA (non-harmonised testing outside the remit of Decision
2013/652/EU) samples were also plated to CHROMagar™ ESBL for specific
detection of ESBL-producing E. coli. E. coli from this agar were tested for the
presence and sequence type of blaCTX-M, blaOXA, blaSHV and blaTEM genes by WGS.
Additionally, samples were plated MacConkey agar containing 2 mg/L colistin, for

Page 11 of 85
detection of colistin-resistant E. coli that may harbour mcr-1,2,3 transferable colistin
resistance genes.
As in previous survey years, the Animal and Plant Health Agency (APHA) worked in
conjunction with Hallmark Veterinary Compliance Services, who arranged sampling,
collection and posting of samples to APHA.
In total, 327 samples of fresh chicken meat were collected of which 315 were
eligible for testing. The 315 eligible chicken samples were collected across four UK
countries (England, Scotland, Wales and Northern Ireland) in proportion to their
human population size. To account for potential missing data, HallMark added an
extra 5% of samples into the sampling plan. The 2020 poultry sampling plan used
“proportionate stratified sampling” to allocate samples to NUTS-3 (NUTS -
Nomenclature des Unités territoriales statistiques) areas and the samples were
collected in proportion to population size.
In agreement with the FSA, the types of chicken to be sampled included both whole
chicken carcasses and chicken joints/portions such as quarters, legs, thighs,
drumsticks, breasts. Only fresh chicken with skin on or off was collected. Processed,
pre-prepared including goujons, ready-based, marinated, seasoned, herbed, stuffed,
“cook in the bag”, breaded, battered chicken, frozen or cooked chicken were all
excluded. Whilst free range and organic meats were not specifically selected as part
of sampling, they were included as part of sampling.
The 315 eligible retail chicken meat samples were collected from England (n=274),
Scotland (n=20), Wales (n=11), and Northern Ireland (n=10) from ten different
supermarket chains. Sample collection was impacted by the coronavirus pandemic
‘lockdown’ restrictions, with monthly sampling being suspended for 3 months from
April to June 2020, resuming in July. Sample numbers were adjusted in subsequent
months to reach the target of 300 samples.
The types of chicken meat collected were whole chicken (n=127), chicken breast
(n=113) and other cuts, including quarters, legs, thighs & drumsticks (n=75). Of the
samples collected, 58.7% and 41.2% had skin on or off, respectively, and breast
samples were the main sample type from which skin was removed. Of the 315
samples, 309 were stated as originating from the UK, five from Poland and one from
Ireland.
A bespoke APHA in-house SOP based on published EU methods was written for
the purpose of this and previous studies and agreed with the FSA before

Page 12 of 85
commencement of work. The method involved homogenisation of 27 grams of meat
in 243 mls Buffered Peptone Water (BPW) yielding 270 mls of BPW:meat
homogenate. In line with EFSA guidance as outlined in the APHA internal SOP, the
27 grams of meat was taken as skin if possible. If less than 27 grams of skin was
available, then this was supplemented with surface muscle, and surface muscle was
used entirely for skinless samples.
From this homogenate, a 20 ml aliquot was taken prior to incubation for viable
counts and the remaining 250 mls was incubated at 37 ± 1ºC for 18-22 hours,
before plating to the selective agars. The method has the theoretical potential to
detect one target (e.g. AmpC/ESBL-producing, mcr, carbapenem-resistant) E. coli in
25 grams of meat.
Between 6 and 86 samples were tested from the 10 different supermarket chains.
Of the 315 samples tested, 41 (13.0%, 95% confidence interval 9.5% to 17.2%)
grew on MacConkey agar + 1 mg/L cefotaxime.
Between 2.8% and 23.3% of samples from eight of the ten supermarkets gave rise
to E. coli on MacConkey agar + 1 mg/L cefotaxime. A total of 18 samples, all of
which were taken from the other two supermarkets, were negative.
A total of 54 samples, representing 17.1% of all the samples tested (95%
confidence interval 13.1% to 21.8%) of samples tested gave rise to growth of
presumptive ESBL-producing E. coli on CHROMagar™ ESBL. For these 54 isolates
from CHROMagar™ ESBL, most were positive for the blaCTX-M gene and most of the
CTX-M sequence types were blaCTX-M 55, then blaCTX-M 1, then blaCTX-M 27. Single
isolates were positive for blaCTX-9 or blaCTX-M 14. Two isolates were positive for blaSHV-
134 and four isolates were only positive for blaTEM-1b.
None of the samples were positive on the two carbapenem-containing agars.
A total of 3 out of 315 or 0.95% (95% confidence interval 0.2% to 2.8%) samples
that all originated from Poland were positive for the mcr-1 transferable colistin
resistance gene. A further two samples were also originally positive for mcr-3 when
a “sweep” of multiple suspect colonies was tested, but it was not possible to isolate
individual mcr-3 positive E. coli from the “sweep” of colonies, despite sub-culture of
multiple different colonies from primary culture plates, so these results must be
considered equivocal.

Page 13 of 85
None of the samples pre-enrichment gave rise to presumptive AmpC/ESBL E. coli-
producing counts on MacConkey agar ± 1 mg/L cefotaxime above the detection
level of 3,000 cfu/gram of meat, based on the EU method for performing counts.
Determination of MICs of isolates to a panel of relevant antimicrobials, coupled with
interpreting strains as sensitive or resistant using ECOFFs (as published by
EUCAST4), allowed phenotypic characterisation of third-generation cephalosporin
resistance. An ESBL-phenotype was inferred if the isolates were resistant to
cefotaxime and / or ceftazidime, but susceptible to cefoxitin and the isolates showed
clavulanate synergy with cefotaxime and / or ceftazidime. An AmpC-phenotype was
inferred if cefotaxime / clavulanate and ceftazidime / clavulanate synergy was not
shown and isolates were resistant to cefotaxime, ceftazidime and cefoxitin.
It should be noted that a new EU Decision 2020/1729 repealing the EU decision
2013/652/EU was issued on the 17th November 2020. This decision affects the
ECOFFs for some antibiotics, such as nalidixic acid and meropenem. To ensure
that results are consistent with previous reports and for comparability with the EFSA
monitoring, the 2013/652/EU ECOFFs have been applied to MIC results in this
study.
By MICs, 39/41 of the isolates from MacConkey agar + 1 mg/L cefotaxime were
found to have ESBL-phenotype E. coli, including 2 isolates that had an
AmpC+ESBL-phenotype, representing 12.4% (95% confidence interval, 9.0% to
16.5%) of all the samples tested..
Also by MICs, 2/41 of the isolates from MacConkey agar + 1 mg/L cefotaxime were
found to have AmpC-phenotype E. coli, excluding the 2 isolates that also had an
ESBL-phenotype, representing 0.63% (95% confidence interval, 0.1% to 2.3%) of all
the samples tested.
If including the AmpC+ESBL-phenotype isolates, 1.3% (95% confidence interval,
0.3% to 3.2%) of the samples tested had an AmpC-phenotype E. coli. Between 0%
and 22.1% of the samples tested per supermarket had an ESBL-phenotype E. coli,
including those with an AmpC+ESBL-phenotype.
None of the 41 isolates from the AmpC/ESBL-specific agar were microbiologically
resistant to the ‘last resort’ carbapenem antimicrobials imipenem and meropenem or
to colistin. The MIC of ertapenem against one AmpC+ESBL-phenotype isolate was
just above the previous EUCAST ECOFF (currently there is only a tentative ECOFF
for ertapenem), and as such was microbiologically resistant. This isolate was not

Page 14 of 85
clinically resistant, if assessed using the EUCAST clinical breakpoint of > 0.5 mg/L
to denote resistance.
None of the isolates were resistant to the antibiotics temocillin or tigecycline.
Only one isolate was resistant to azithromycin or gentamicin, whilst about 60% of
isolates were resistant to the quinolone antibiotics (ciprofloxacin or nalidixic acid) or
to chloramphenicol.
As would be expected, as the isolates were obtained from agar with 1 mg/L
cefotaxime, all were resistant to the beta-lactam antimicrobials ampicillin,
cefotaxime and ceftazidime and most were also resistant to cefepime. All AmpC or
AmpC+ESBL-phenotype isolates were resistant to cefoxitin as resistance to this
antibiotic is what defines isolates as AmpC phenotype.
Most of the isolates were resistant to the older antibiotics sulfamethoxazole and
tetracycline, and about 50% were resistant to trimethoprim.
In summary, none of the samples were positive for carbapenem-resistant E. coli on
the two carbapenem-selective agars.
Results for 2020 showed that 12.4% and 1.6% of retail chicken meat samples from
MacConkey agar + 1 mg/L cefotaxime were positive for ESBL or AmpC-phenotype
E. coli respectively (including the three isolates with the combined AmpC+ESBL-
phenotype in both the ESBL- or AmpC-phenotype groups).
Whilst there was an increase in the percentage of isolates with an ESBL-phenotype,
there was a decrease in the percentage of isolates with an AmpC-phenotype
between 2018 and 2020. Overall, between 2018 and 2020, the percentages of
samples positive on MacConkey agar + 1 mg/L cefotaxime remained almost
identical at 13.6% and 13.0%, respectively.
Using CHROMagar™ ESBL, 54 of all the samples tested representing 17.1% were
positive for presumptive ESBL-phenotype E. coli. Most of these were positive for
blaCTX-M. In 2018 the predominate blaCTX-M type was blaCTX-M 1, whilst for 2020
samples the blaCTX-M types were more varied, but predominantly blaCTX-M 55, then
blaCTX-M 1 and then blaCTX-M 27, but also blaCTX-M 1.
Between the 2016 and 2018 EU surveys1 there was a significant reduction in the
proportion of chicken samples positive on both MacConkey agar + 1 mg/L
cefotaxime and CHROMagar™ ESBL (p-value, < 0.0001 in both cases), and in the

Page 15 of 85
proportion of samples being confirmed as positive for AmpC or ESBL-phenotype E.
coli (p-value, < 0.0001 in both cases).
Comparison with a paper on UK samples tested in 2013/142 also showed a
significant reduction in samples positive for ESBL-producing E. coli between
2013/14 and the 2016 EU survey (65.4% to 29.7%), albeit sampling and isolation
methods were similar, but not identical for the two studies.
The 2018 report for chicken meat samples1 suggests that these drops in the level of
antimicrobial-resistant E. coli on retail chicken meat since 2013/14 may be linked to
the British Poultry Council restriction of the use of third- and fourth-generation
cephalosporins in flocks used for poultry meat production in the UK in 2012 as part
of antimicrobial stewardship.3
The results for 2020 suggest that the proportions of AmpC or ESBL-phenotype E.
coli in retail chicken has not changed since 2018. There was a slight increase in the
proportions of the samples positive on CHROMagar™ ESBL compared to the 2018
results and this was the first year that retail chicken samples were found to be
positive for mcr plasmid- mediated, colistin-resistant E. coli.
It should be considered that 2020 was an unusual year due to the impact of the
coronavirus pandemic, although there is no reason to suppose this affected the
proportions of retail chicken meat positive for AMR E. coli.
In view of the isolation of mcr-1 from retail chicken meat for the first time in the UK,
some future ongoing monitoring of AMR retail meats in the UK would seem prudent.

Page 16 of 85
3. Glossary
• AmpC phenotype – A phenotype of resistance to cephalosporin
antimicrobials such as cephalothin, cefazolin, cefoxitin, most penicillins, and
β-lactamase inhibitor-β-lactam combinations.
• AmpC enzyme – Enzyme conferring AmpC type resistance
• AMR – Antimicrobial resistance
• APHA – Animal and Plant Health Agency
• BPW – Buffered Peptone broth, a liquid media widely used to grow bacteria
• CRL – Community Reference Laboratory
• CTX-M – group of ESBL enzymes that give bacteria resistance to
cephalosporin antimicrobials.
• Enterobacteriaceae – Family of bacteria including many common gut
bacteria such as Escherichia coli or E. coli
• CA-ESBL - CHROMagar™ ESBL, for isolation of ESBL-producing E. coli
• CARBA - ChromID® CARBA agar, for isolation of carbapenemase resistant
E. coli
• COL - Colistin
• CTX – Cefotaxime
• ECOFF – Epidemiological Cut Off value (with respect to antimicrobial
resistance)
• EN - Norme Européenne /Europäische Norm (European Standard)
• ESBL – Extended Spectrum β-lactamase. Enzymes that are capable of
breaking down many penicillin type antimicrobials, including cephalosporin
antimicrobials
• EU – European Union
• EUCAST - European Committee on Antimicrobial Susceptibility Testing
• FSA – Food Standards Agency
• HCCA - α-Cyano-4-hydroxycinnamic acid
• ISO - International Organisation for Standardisation
• MALDI ToF – Matrix-Assisted Laser Desorption / Ionization Time-of-Flight
• MCA – MacConkey agar
• MCA-COL – MacConkey agar + 2 mg/L colistin

Page 17 of 85
• MCA-CTX - MacConkey agar + 1 mg/L cefotaxime
• MIC – Minimum Inhibitory Concentration
• MS – Member States
• NUTS - Nomenclature of Units for Territorial Statistics
• OXA-48 - ChromID® OXA-48 agar, for isolation of carbapenemase resistant
E. coli
• PBS – Phosphate Buffered saline
• QC – Quality control
• SOP – Standard Operating Procedure

Page 18 of 85
4. Materials and Methods
Sampling criteria – Taken from the HallMark report with permission
The 2020 AMR sampling plan was designed by the Food Standards Agency (FSA).
It included the collection of 315 chicken samples, comprising three food groups.
For Year 6 of the EU Harmonised Survey (chicken), FSA required to keep the
sampling plan the same as for 2018, using the Kantar market share data in order to
make the results from 2020 more directly comparable to the 2018 results.
As a brief, there are 109 NUTS3 regions which covered 80% of the UK population.
The number of samples in each NUTS3 region was proportional to the population
size of these 109 regions combined. Kantar’s regions codes were used to determine
the market share % among these 109 regions.
For example, the first 19 samples were from 7 NUTS3 regions and they all belonged
to the same Kantar region (East of England); the retailer (shop) and cuts % from the
Kantar East of England data were used. These were all based on the instructions
FSA prescribed.
For further details, refer to FSA Proposals for the sampling plan (2018).
The FSA looked into how the population data (NUTS-3) should map to the regions
in the Kantar market share data. Kantar make use of ITV regions and have supplied
a map, rather than a precise geographical location. From this map (assisted by
other information about ITV regions available online), FSA allocated the most
appropriate Kantar ITV region to each NUTS-3 area. It was not an exact match, but
it was considered adequate assigning samples more-or-less in proportion to
regional market share. The population data was updated to include the Kantar ITV
regions.
Work performed at APHA Weybridge
All the methodology with respect to the work performed is detailed in eight internal
APHA Standard operating procedures (SOPs, not included in this report, held at
APHA).

Page 19 of 85
These SOPs are:-
• Isolation of background (indicator commensal) and antibiotic resistant
Enterobacteriales from meats and caecal contents according to EU and / or
APHA protocols (CBU 0278, version 9 – 20-05-2020).
• Microbank -70ºC Bacterial Storage System (CBU 0155).
• Identification of Bacteria by Oxidase (BA 050) and Indole Spot Test – a Rapid
Method for Bacteria (BA0130) and by MALDI ToF (BAC 0334).
• Minimum Inhibitory Concentration (MIC) – The Sensititre Method (BA0604).
• Oxidase (BA 050).
• Indole Spot Test – a Rapid Method for Bacteria (BA 0130).
• Identification of bacteria by MALDI ToF (BAC0334).
• Real Time PCR for plasmid-mediated colistin resistance genes mcr-1, mcr-2
and mcr-3 (BAC0415).
The methodology for each of these aspects is summarised briefly below.
Isolation of background (indicator commensal) and antibiotic resistant
Enterobacteriales from meats and caecal contents according to EU and / or
APHA protocols
The methodology follows that outlined in EU documents, and the SOP CBU 0278 is
based on these EU methods as below for the work outlined in this report:-
• EU method - Isolation of ESBL, AmpC and carbapenemase producing E. coli
from fresh meat – Version 7, December 2019.
• EU method - Validation of selective MacConkey agar plates supplemented with
1 mg/L cefotaxime for monitoring of ESBL and AmpC-producing E. coli in meat
and animals – Version 3, November 2017.
• EU method – Validation of selective and indicative agar plates for monitoring of
carbapenemase-producing E. coli – Version 2, January 2015.
• EU method - Quantification of ESBL/AmpC-producing E. coli in caecal content
and fresh meat samples – Version 1, December 2017.

Page 20 of 85
PDF files of the most recent versions of the above EU methods can be found on-
line.
In brief, 27 grams of the retail meat sample collected, transported and stored under
conditions as stipulated by the EU protocols, was homogenised in ~ 100 ml (from
243 ml sterile chilled BPW) of sterile chilled BPW, before adding this homogenate to
the remaining BPW and gently mixing, providing 270 ml of BPW homogenate. In line
with EFSA guidance as outlined in the APHA internal SOP, the 27 grams of meat
was taken as skin if possible. If less than 27 grams of skin was available, then this
was supplemented with surface muscle and surface muscle was used entirely for
skinless samples.
From this 270 ml BPW homogenate, 20 mls was taken for the viable bacterial
counts. Viable counts were performed according to the EU protocol with slight
variation. This variation was homogenisation of one meat portion per sample in
chilled BPW only, compared to one portion for counts in chilled saline and another
portion for enrichment in chilled BPW. The full rationale and validation of this
variation, which was approved by the FSA and the Danish Technical University
(DTU) is outlined in Appendix 1.
Briefly, the method involved plating 100 μl BPW homogenate prior to incubation to
MacConkey agar containing ± 1 mg/L cefotaxime. These two agars are used to
enumerate the number of presumptive E. coli and the number of presumptive
AmpC/ESBL-producing E. coli on the meat samples. The EU method states that at
least 30 colonies must be counted to give an accurate estimate of the viable counts
and this limits the detection level to 3,000 cfu/g of meat.
The remaining 250 mls of BPW homogenate (e.g. 25 grams of meat and 225 mls of
BPW as per EU protocols) was incubated aerobically at 37 ± 1ºC for 18-22 hours.
The incubated BPW / meat homogenate was used to inoculate (10µl) MacConkey
agar containing 1 mg/L cefotaxime (MCA-CTX), chromID® CARBA (CARBA) and
chromID® OXA-48 (OXA-48).
Samples were also plated to CHROMagar™ ESBL (CA-ESBL), for specific
detection of ESBL-producing E. coli and to MacConkey agar containing 2 mg/L
colistin (MCA-COL), for detection of colistin resistant E. coli, and these were
additional non-EU stipulated screening agars added at the request of the FSA (UK
non-harmonised tests).

Page 21 of 85
All plates were incubated aerobically and were QC tested prior to use, according to
EU or APHA methods as appropriate, as outlined in the SOP.
MCA-CTX and MCA-COL plates were incubated for 18-22 hours at 44 ± 0.5 °C
before checking for lactose fermenting colonies. Other media were incubated at 37
± 1ºC for 18-22 hours, before checking for presumptive E. coli.
Lactose fermenters from MCA-CTX were assumed to be presumptive AmpC /
EBSL E. coli, red/purple colonies from CA-ESBL were assumed to be presumptive
ESBL-producing E. coli and pink to burgundy colour colonies from CARBA and
OXA-48 agars were assumed to be presumptive carbapenem resistant E. coli.
Three single presumptive E. coli from each of these agars were plated again to the
agar of origin to ensure purity prior to confirming one of the isolates as E. coli, and
then storing this isolate pending further tests.
Overall, this method post enrichment in BPW has the theoretical potential to detect
one E. coli of interest per 25 grams of meat.
From MCA-COL plates, a sweep of ~ 10 to 20 lactose fermenters (based on SOP
BAC 0415) was used to prepare a crude DNA sample for detection of mcr-1, mcr-2
and mcr-3 plasmid mediated colistin resistance genes by real time PCR. A sweep
was taken to increase the sensitivity of detection of the mcr genes.
Storage of purified E. coli isolates of interest prior to further tests
Isolates from MCA-CTX agar and if present from CARBA and OXA-48 agars will be
stored for up to five years to comply with EU requirements. Isolates were stored in
duplicate, on “beads” (frozen in cryogenic material at -70ºC).
For “beads,” purified bacterial culture was aseptically transferred using a 10 µl loop
from the pure culture on agar to a commercial “beads” tube. The cryogenic liquid
and bacterial growth were mixed in the tube, before removing most of the
supernatant cryogenic liquid, and then storing the tube at - 70ºC.
Identification of bacteria by MALDI ToF or confirmation of lactose fermenters
as E. coli using oxidase and indole tests
For lactose fermenters isolated from MCA-CTX at 44ºC, combined use of oxidase
and indole tests as described by in-house SOPs, was used to confirm isolates as E.
coli. Presumptive E. coli from other agars, such as CA-ESBL, CARBA and OXA-48,
were first streaked to MCA and incubated for 18-22 hours at 44 ± 0.5 °C to confirm

Page 22 of 85
isolates as lactose fermenters. If isolates were lactose fermenters, they were
identified as E. coli by combined use of oxidase and indole tests as described by in-
house SOPs.
For the oxidase and indole tests, a single well isolated colony was taken from MCA
or MCA-CTX agar, plated onto blood agar and incubated overnight at 37ºC. Growth
from the blood agar was then used to perform oxidase and indole tests.
For the oxidase test, in-brief, a portion of bacterial colony to be tested was taken
with a sterile plastic loop and rubbed onto filter paper impregnated with oxidase
reagent. A deep purple colour developing within 10 seconds was taken to be
“oxidase positive". The indole test was performed in the same way but using filter
paper impregnated with James reagent (BioMerieux). Within 10 seconds, a positive
reaction was indicated by the presence of a colour change to pink/red. Lactose
fermenter colonies from MCA-CTX that grew at 44ºC were confirmed as E. coli if
oxidase negative and indole positive.
MALDI ToF was used for identification of problem isolates giving equivocal results
by other tests only if required, and was used as described by an in-house SOP and
based on that previously described.5 For MALDI ToF identifications if required,
isolates were also grown on blood agar. A small amount of bacterial growth was
applied to the metal target plate. Growth on the target plates was overlaid with 1 µl
of 70% formic acid to perform a partial protein extraction and allowed to dry. Each
spot was then overlaid with 1 µl of HCCA matrix, and again this was allowed to dry
before the target plate was loaded into the MALDI ToF machine. Using Biotyper
software, resulting spectra from the MALDI ToF run were searched against the
Bruker database of spectra, and if the resulting score was ≥ 2.000, this was taken
as reliable identification to the species level, dependant also on consistency score
and caveats that might apply for some bacteria species.
Determination of Minimum Inhibitory Concentrations (MICs) by broth micro
dilution.
MICs were performed as described in our in house SOP (BA0604), based on EN
ISO 20776-1:2006.
E. coli isolates were inoculated into Mueller Hinton broth at a suitable dilution for
application to commercially prepared plates containing two fold dilution series of
antimicrobial compounds in accordance with Decision 2013/652/EU. Following

Page 23 of 85
incubation aerobically at 37oC for 18 hours, the plates were examined, and growth
end points established for each antimicrobial to provide MIC’s. Microbiologically
resistant and susceptible interpretation for the MIC’s were obtained by comparison
with ECOFF’s published by EUCAST based Decision 2013/652/EU.
It should be noted that a new EU Decision 2020/1729 repealing the EU decision
2013/652/EU was issued on the 17th November 2020. This decision affects the
ECOFFs for some antibiotics, such as nalidixic acid and meropenem. So that results
are consistent with previous reports and for comparability with the EFSA monitoring,
the 2013/652/EU ECOFFs have been applied to MICs in this study.
For E. coli, the presence of carbapenemase producing strains, Extended Spectrum
Beta Lactamase producers (ESBL) or AmpC enzyme producers were determined
initially by assessing isolate MIC’s against the microbiological breakpoints for
meropenem, cefotaxime and ceftazidime.
Any isolates showing meropenem MIC’s greater than 0.125mg/l, cefotaxime MIC’s
greater than 0.25mg/l or ceftazidime MIC’s greater than 0.5mg/l were tested against
a further panel of antimicrobials. This further panel of antibiotics included
cefotaxime, ceftazidime, cefotaxime / clavulanate, ceftazidime / clavulanate,
imipenem, ertapenem, temocillin, cefoxitin, cefepime and meropenem.
Consequently, isolates have MICs for all of these confirmatory antimicrobials where
an MIC greater than the cut off values stated was observed for any of the screening
compounds (cefotaxime, ceftazidime or meropenem) included in the first panel of
antimicrobials.
Isolates confirmed resistant to meropenem were to be considered to carry a
carbapenemase.
The presence of ESBL-producing E. coli strains was determined as follows: Isolates
resistant to one or both of cefotaxime and ceftazidime that also had an MIC of
greater than 0.125mg/l against cefepime and also showed a reduction in MIC of ≥ 8
fold against combined cefotaxime / clavulanate or ceftazidime / clavulanate when
compared with the cephalosporin alone were considered to carry an ESBL.
Isolates resistant to cefotaxime or ceftazidime that also had an MIC of greater than
8mg/l against cefoxitin and showed no reduction to MIC’s or a reduction of less than
three dilution steps for cefotaxime or ceftazidime in the presence of clavulanate
were considered to be carrying an AmpC enzyme.

Page 24 of 85
Detection and sequencing of blaCTX-M, blaOXA, blaSHV and blaTEM
Presence of blaCTX-M, blaOXA, blaSHV and blaTEM from CA-ESBL and subsequent
sequencing was performed by Illumina whole genome sequencing (WGS).
Resulting FASTQ files were assembled using “SPAdes - St Petersburg aligner”6 and
analysed using DTU pipelines “ResFinder 4.1.”7
Plasmid mediated colistin resistance genes mcr-1, mcr-2 and mcr-3
Samples that gave rise to lactose fermenting colonies on MCA-COL were tested for
the presence of plasmid-mediated colistin resistance genes mcr-1, mcr-2 and mcr-3
by real time (RT) PCR, according to an in-house SOP (BAC0415). To make
detection more sensitive, a “sweep” of ~ 10 to 20 colonies was taken to prepare the
crude DNA for RT-PCR.
If the initial “sweep” was PCR positive, multiple individual suspect E. coli colonies (up
to 10 as available) were further examined by PCR for mcr-1, 2 and 3 genes.
It should be noted that only lactose fermenters with an E. coli phenotype were
investigated. As such it is possible that mcr if detected in the original “sweep,” but not
in isolated colonies, it could be present in other bacterial genera. This might include
non-target lactose fermenters such as Klebsiella and Citrobacter8 as well as non-
lactose fermenters.
Individual suspected mcr E. coli colonies were, at the request of the FSA, subjected
to illumina whole genome sequencing (WGS).
Resulting FASTQ files were assembled using “SPAdes - St Petersburg aligner”6 and
analysed using DTU pipelines “MLST,”9 “SpeciesFinder,”10 “ResFinder 4.1,”7
“VirulenceFinder,”11 and “PlasmidFinder.”12

Page 25 of 85
5. Results
General considerations
An excellent working partnership continued with the company contracted by FSA to
supply the meat samples (HallMark Veterinary and Compliance Services) in
previous years. Communication between the two organisations and all other aspects
of the partnership were highly satisfactory.
Sampling
The number of samples planned and collected per NUTS-1 region is shown in Table
1.
Table 1 – Number of samples per NUTS-1 area†
NUTS-1 Location Name No. samples
planned
No. samples
completed
Difference
UKF/UKH E. England 19 19 0
UKD Lancashire 33 32 -1
UKH/UKI London 65 65 0
UKF/UKG/UKJ/UKK Midlands 53 53 0
UKC North East 10 10 0
UKN Northern Ireland 10 10 0
UKM Scotland 19 20 1
UKJ/UKK South 37 37 0
UKK South West 21 21 0
UKL Wales+W 11 11 0
UKE/UKF Yorkshire 37 37 0
Total - 315 315 0
† Sourced from the HallMark report with permission

Page 26 of 85
The shops from which the samples were obtained in the UK are shown below (Table
2).
Table 2 – Collected samples* completed per retail chain, per UK region†
Retailer code England Wales Scotland Northern Ireland
United Kingdom
A 16 0 2 0 18
B 6 0 0 0 6
C 73 4 5 4 86
D 30 1 3 0 34
E 27 2 3 2 34
F 12 0 0 0 12
G 37 1 2 2 42
H 8 0 0 0 8
I 33 1 2 0 36
J 32 2 3 2 39
Total 274 11 20 10 315
* Above retailers supply at least 80% of the market share for chicken meat
† Taken from HallMark report with permission
In agreement with the FSA, the types of chicken to be sampled included both whole
chicken carcasses and chicken joints/portions such as quarters, legs, thighs,
drumsticks, breasts. Only fresh chicken with skin on or off was collected. Processed,
pre-prepared including goujons, ready-based, marinated, seasoned, herbed, stuffed,
“cook in the bag”, breaded, battered chicken, frozen or cooked chicken were all
excluded.
Details of the meat samples tested
In total, 327 samples of fresh chicken were collected and tested of which 315 were
eligible for testing (Table 3).
Only fresh chicken with skin on or off was collected. Samples were collected each
month with the exceptions of April, May and June 2020, when sampling was
temporarily suspended in view of the COVID-19 pandemic. Samples were from
England (n=274), Scotland (n=20), Wales (n=11), and Northern Ireland (n=10). The
types of chicken meat collected were whole chicken (n=127, all skin on), chicken
breast (n=113, of which 1 was skin on) and other cuts, including quarters, legs,

Page 27 of 85
thighs & drumsticks (n=75, of which 57 were skin on). The samples collected by
region and the number that were positive for AmpC/ESBL-phenotype E. coli on
MCA-CTX agar are shown in Table 3. The stated origin of the chicken samples was
UK (n=309), Poland (n=5) and Ireland (n=1).
Samples positive for AmpC/ESBL or carbapenem resistant E. coli – EU
harmonised test
Of the 315 samples tested, between 6 and 86 samples were tested from the 10
different supermarket chains (Tables 4 and 5). Of these 315 samples, 41 (13.0%,
95% confidence interval 9.5% to 17.2%) were positive for E. coli on MCA-CTX..
Between 2.8% and 23.3% of samples from eight of the supermarkets gave rise to E.
coli on MCA-CTX (Table 4). A total of 18 samples, all of which were taken from the
other two supermarkets, were negative (Table 4). None of the samples were
positive on the two carbapenem agars (Table 3).
MIC results for isolates from MCA-CTX – EU harmonised test
By MICs (Tables 6 and 7), 39/41 of the E. coli from MCA-CTX were found to have
an ESBL-phenotype E. coli (including 2 isolates that had an AmpC+ESBL-
phenotype), representing 12.4% (95% confidence interval, 9.0% to 16.5%) of all the
315 eligible samples tested..
Also, by MICs, 2/41 of the E. coli from MCA-CTX were found to have an AmpC-
phenotype E. coli (excluding the 2 isolates that also had an ESBL-phenotype),
representing 0.63% (95% confidence interval, 0.1% to 2.3%) of all the 315 eligible
samples tested.
If including the AmpC+ESBL-phenotype isolates, 1.3% (95% confidence interval,
0.3% to 3.2%) of the 315 samples tested had an AmpC-phenotype E. coli. Between
0% and 22.1% of the samples tested per supermarket had an ESBL-phenotype E.
coli, including those with an AmpC+ESBL-phenotype.
None of the 41 E. coli from MCA-CTX were microbiologically resistant (when
ECOFFs were applied to the MIC results) to the ‘last resort’ carbapenem
antimicrobials imipenem and meropenem or to colistin (Tables 6 and 7 and Figure
2).
One AmpC+ESBL-phenotype isolate was just above the EUCAST ECOFF for the
carbapenem antimicrobial ertapenem with an MIC of 0.12 mg/L (ECOFF > 0.06

Page 28 of 85
mg/L), and as such was microbiologically resistant. This isolate was not clinically
resistant (using EUCAST clinical breakpoint of > 0.5 mg/L to denote resistance).
Additionally, none of the isolates were resistant to the antibiotics temocillin or
tigecycline.
Only 1/41 of the E. coli from MCA-CTX were resistant to azithromycin or
gentamicin, whilst about 60% of these E. coli were resistant to the quinolone
antibiotics (ciprofloxacin or nalidixic acid) or to chloramphenicol (Table 7).
Isolates obtained from agar with 1 mg/L cefotaxime, all were resistant to the beta β-
lactam antimicrobials ampicillin, cefotaxime and ceftazidime and most were also
resistant to cefepime. All AmpC or AmpC+ESBL-phenotype isolates were resistant
to cefoxitin as resistance to this antibiotic is what defines isolates as AmpC
phenotype.
Most of the isolates were resistant to the older antibiotics sulfamethoxazole and
tetracycline, and about 50% were resistant to trimethoprim.
A summary of 2018 and 2020 MICs results were compared for isolates obtained
from MCA-CTX (Table 7 and Figure 2). This showed a decrease in the numbers of
AmpC phenotypes isolated for 2020 compared to 2018 and conversely an increase
in ESBL phenotypes isolated. Also, of interest was the increase in the numbers of
ESBL phenotype isolates resistant to chloramphenicol in 2020 compared to 2018.
Counts of presumptive E. coli on MCA and MCA-CTX agars – EU harmonised
test
Using the EU method “Quantification of ESBL/AmpC-producing Escherichia coli in
caecal content and fresh meat samples” none of the chicken meat samples gave
rise to background E. coli on MCA (e.g. E. coli obtained from media without
antibiotics) or to presumptive ESBL/AmpC-producing E. coli on MCA-CTX.
Presumptive ESBL-producing E. coli from CA-ESBL and WGS results - UK
non-harmonised additional test
A total of 54 samples, representing 17.1% (95% confidence interval 13.1% to
21.8%) of samples tested overall, gave rise to growth of presumptive ESBL-
producing E. coli on CA-ESBL (Table 8). Most of these were positive for blaCTX-M. In
2018 the predominate blaCTX-M type was blaCTX-M 1, whilst for 2020 samples the
blaCTX-M types were more varied. Most of the CTX-M sequence types were blaCTX-M

Page 29 of 85
55, then blaCTX-M 1, then blaCTX-M 27. Single isolates were positive for blaCTX-9 or blaCTX-M
14. Two isolates were positive for blaSHV-134, four isolates were only positive for bla-
TEM-1b and for some isolates (n=6) no ESBL type genes were detected. The samples
that were positive on both CA-ESBL and MCA-CTX are shown in Table 9.
Comparison of samples positive between 2016 and 2020 from MCA-CTX and
CA-ESBL
The results for all, skin on and skin off samples positive on MCA-CTX and CA-ESBL
for surveys in 2016, 2018 and 2020 can be seen in Figure 1.
It was interesting to note that the proportion of retail chicken samples collected that
were skinless has risen from 28.4% of samples in 2016 to 41.3% of samples in
2020.
A reduction in the proportion of samples positive on MCA-CTX can clearly be seen
between 2016 and 2018, although this plateaus out between 2018 and 2020. There
was a slight increase in the proportion of samples positives on MCA-CTX for skin on
samples between 2018 and 2020, but a decrease for skin off samples.
The graph also illustrates the increase in percentage of samples positive on CA-
ESBL between 2018 and 2020 overall, particularly for skin on samples, although
there was a reduction in the percentage of skin off samples positive.
Plasmid mediated colistin resistance genes mcr-1, mcr-2 and mcr-3 - ESBL -
UK non-harmonised additional test
Three of the 315 retail chicken meat samples tested were confirmed as positive for
mcr-1-carrying E. coli (Tables 10, 11, 13, 1 and 15). These three meat samples were
obtained from one retail supermarket chain from three different parts of the UK on 5-
8-20, 6-10-20 and 8-10-20. The origin of all three samples was stated to be Poland.
For the three samples from which mcr-1-positive E. coli were recovered, multiple
colonies were characterised by PCR, short read WGS and MIC determination, with
bacterial identity confirmed by MALDI ToF (Tables 10-14).
In two further chicken retail meat samples where the PCR of the initial “sweep” of ~
10 to 20 suspect E. coli colonies was positive for mcr-3 (Tables 11 and 13), it was not
possible to isolate individual mcr-3 positive E. coli despite sub-culture of multiple
different colonies from primary culture plates. These two chicken meat samples were

Page 30 of 85
obtained from a different supermarket chain to the mcr-1 positive samples and
originated in the UK.
Only lactose fermenters with an E. coli phenotype were investigated. As such it is
possible that the mcr-3 gene could be present in other bacterial genera. This might
include non-target lactose fermenters such as Klebsiella and Citrobacter8 as well as
non-lactose fermenters.
For sample 2798047 only one of the colonies was mcr-1-positive by WGS (Tables
10 and 11), and the other two isolates were identified as Hafnia alvei. Hafnia alvei
has been described as naturally resistant to colistin and can be readily isolated from
mammalian guts and food.13
The colony that was mcr-1 positive was E. coli with a predicted serotype O153:H21
and ST162. E. coli O153:H21 has previously been described as an EPEC strain,14,
but neither eae or shiga toxin genes were detected in this isolate from the WGS
data. This isolate was positive for the resistance genes aadA5, blaTEM-1B, catA1,
dhfrA17, qnrB19, mcr-1.1 and tetB conferring resistance to older antibiotics such as
streptomycin, ampicillin, chloramphenicol, quinolones, colistin and tetracycline
respectively.
For sample 563345 one of the colonies was also identified as Hafnia alvei and the
other two as E. coli, but this sample did not give rise to mcr-positive single colonies.
One of the E. coli colonies (Table 12) was predicted serotype O25 which can be
associated with the human pandemic clone O25:H4 ST131.15 This isolate was E.
coli O25:H5 and although there were multiple MLST matches, none were ST131
(Table 12).
Samples 2798073 and 2672451 each gave rise to 3 and 4 colonies respectively
that were all confirmed as E. coli carrying the mcr-1 gene (Tables 13 and 14). Of
these seven isolates, two from each sample were ST744. As such at least four of
the seven isolates from these two meat samples were similar, and there was at least
some commonality in the resistance genes and plasmids seen in all seven isolates.
MICs of antibiotics against the eight E. coli confirmed to be carrying the mcr-1 gene
by WGS are shown in tables 15-18.
All mcr-1 postive E. coli were resistant to colistin, as would be expected, and also
resistant to the quinolone antibiotics ciprofloxacin and nalidixic acid (Table 15).
Resistance to the quinolone antibiotics correlated with the WGS data as all isolates

Page 31 of 85
had mutations in gyrA and all but one of the isolates also had mutations in parC
(tables 11, 13, 14).
All of the mcr-1 postive E. coli were resistant to ampicillin, but susceptible to
cefotaxime, ceftazidime and meropenem (Table 16). Again, this correlates with the
WGS data in that all isolates had a blaTEM gene that confers resistance to ampicillin,
but none had genes likely to confer resistance to cefotaxime, ceftazidime or
meropenem.
Most of the mcr-1 postive E. coli were resistant to the older antibiotics
sulfamethoxazole, tetracycline, and trimethoprim (Table 17) and such resistance in
general correlated with the presence of sul, tet and dhfr resistance genes (Tables
11, 13, 14).
Finally, all mcr-1 postive E. coli were sensitive to azithromycin and tigecycline, but
all but two were resistant to chloramphenicol (Table 18). All of the mcr-1 postive E.
coli resistant to chloramphenicol were positive for the catA gene (Tables 11, 13, 14).
At the request of the FSA, further work was performed on the mcr-1 E. coli to resolve
the plasmids as reported in Appendix 2.

Page 32 of 85
Table 3 - Number of samples collected by regions and isolates tested by MICs.
NUTS 3 or other political structure used in
sample allocation
Total
number of
samples
collected
Number (% of samples) of
isolates available for AMR
testing [ESBL-, AmpC-
producing E. coli]
Number of isolates
available for AMR
testing
[Carbapenemase-
producing E.coli]
Number of
isolates
tested by
MICs
Aberdeen City and Aberdeenshire 4 0 (0) 0 0
Barking & Dagenham and Havering 3 1 (33.3) 0 1
Barnet 1 0 (0) 0 0
Barnsley, Doncaster and Rotherham 5 1 (20) 0 1
Bath & North East Somerset, North Somerset and
South Gloucestershire
4 2 (50) 0 2
Berkshire 6 1 (16.7) 0 1
Bexley and Greenwich 3 0 (0) 0 0
Birmingham 7 1 (14.3) 0 1
Bournemouth and Poole 2 0 (0) 0 0
Bradford 3 1 (33.3) 0 1
Brent 3 1 (33.3) 0 1
Brighton and Hove 2 0 (0) 0 0
BRol, City of 3 0 (0) 0 0

Page 33 of 85
Bromley 2 0 (0) 0 0
Buckinghamshire CC 3 0 (0) 0 0
Calderdale and Kirklees 4 0 (0) 0 0
Cambridgeshire CC 4 0 (0) 0 0
Cardiff and Vale of Glamorgan 3 1 (33.3) 0 1
Central Hampshire 3 0 (0) 0 0
Central Valleys 2 0 (0) 0 0
Cheshire East 2 0 (0) 0 0
Cheshire West and Chester 2 0 (0) 0 0
Clackmannanshire and Fife 3 0 (0) 0 0
Cornwall and Isles of Scilly 3 1 (33.3) 0 1
Coventry 2 1 (50) 0 1
Croydon 2 0 (0) 0 0
Devon CC 5 0 (0) 0 0
Dorset CC 3 0 (0) 0 0
Dudley 2 0 (0) 0 0
Durham CC 3 1 (33.3) 0 1
Ealing 2 0 (0) 0 0
East Kent 3 0 (0) 0 0
East Lancashire 2 0 (0) 0 0
East Merseyside 3 0 (0) 0 0

Page 34 of 85
East of Northern Ireland 3 0 (0) 0 0
East Riding of Yorkshire 2 0 (0) 0 0
East Surrey 2 0 (0) 0 0
East Sussex CC 3 0 (0) 0 0
Edinburgh, City of 3 1 (33.3) 0 1
Enfield 2 0 (0) 0 0
Essex Haven Gateway 3 0 (0) 0 0
Essex Thames Gateway 3 1 (33.3) 0 1
Flintshire and Wrexham 2 0 (0) 0 0
Glasgow City 4 0 (0) 0 0
Gloucestershire 4 0 (0) 0 0
Greater Manchester North East 4 1 (25) 0 1
Greater Manchester North West 4 0 (0) 0 0
Greater Manchester South East 3 0 (0) 0 0
Greater Manchester South West 3 0 (0) 0 0
Gwent Valleys 2 1 (50) 0 1
Hackney and Newham 4 0 (0) 0 0
Haringey and Islington 4 1 (25) 0 1
Harrow and Hillingdon 3 0 (0) 0 0
Heart of Essex 2 0 (0) 0 0
Hertfordshire 7 0 (0) 0 0

Page 35 of 85
Hounslow and Richmond upon Thames 3 0 (0) 0 0
Inverclyde, East Renfrewshire and Renfrewshire 2 0 (0) 0 0
Kensington & Chelsea and Hammersmith &
Fulham
1 0 (0) 0 0
Kent Thames Gateway 2 1 (50) 0 1
Lambeth 2 0 (0) 0 0
Leeds 5 1 (20) 0 1
Leicester 2 0 (0) 0 0
Leicestershire CC and Rutland 4 0 (0) 0 0
Lewisham and Southwark 4 0 (0) 0 0
Lincolnshire 4 0 (0) 0 0
Liverpool 3 0 (0) 0 0
Manchester 2 0 (0) 0 0
Merton, Kingston upon Thames and Sutton 3 1 (33.3) 0 1
Mid Kent 2 1 (50) 0 1
Mid Lancashire 1 0 (0) 0 0
North and North East Lincolnshire 2 1 (50) 0 1
North Hampshire 2 0 (0) 0 0
North Lanarkshire 2 1 (50) 0 1
North Northamptonshire 2 1 (50) 0 1
North Nottinghamshire 3 1 (33.3) 0 1

Page 36 of 85
North of Northern Ireland 2 0 (0) 0 0
North Yorkshire CC 4 1 (25) 0 1
Northumberland 2 0 (0) 0 0
Norwich and East Norfolk 2 0 (0) 0 0
Nottingham 2 0 (0) 0 0
Outer Belfast 2 0 (0) 0 0
Oxfordshire 4 1 (25) 0 1
Redbridge and Waltham Forest 3 1 (33.3) 0 1
Sandwell 2 0 (0) 0 0
Sheffield 3 0 (0) 0 0
Shropshire CC 2 0 (0) 0 0
Somerset 3 0 (0) 0 0
South and West Derbyshire 3 0 (0) 0 0
South Hampshire 3 1 (33.3) 0 1
South Lanarkshire 2 0 (0) 0 0
South Nottinghamshire 2 0 (0) 0 0
South West Wales 2 0 (0) 0 0
Staffordshire CC 5 1 (20) 0 1
Suffolk 4 0 (0) 0 0
Tower Hamlets 1 1 (100) 0 1
Tyneside 5 2 (40) 0 2

Page 37 of 85
Wakefield 2 0 (0) 0 0
Wandsworth 3 0 (0) 0 0
Warwickshire 3 1 (33.3) 0 1
West and South of Northern Ireland 3 0 (0) 0 0
West Essex 2 1 (50) 0 1
West Kent 2 0 (0) 0 0
West Northamptonshire 2 1 (50) 0 1
West Surrey 5 3 (60) 0 3
West Sussex (North East) 2 1 (50) 0 1
West Sussex (South West) 3 0 (0) 0 0
Wiltshire 3 0 (0) 0 0
Wirral 2 1 (50) 0 1
Worcestershire 3 0 (0) 0 0
Total 315 41 0 41

Page 38 of 85
Table 4 - Number of samples per supermarket tested that gave rise to E. coli on MCA-CTX with resistance phenotypes.
Supermarket
Code
Total
number of
samples
tested
No. positive on
MCA-CTX agar (%)*
ESBL-phenotype
confirmed by MICs
(%)*
AmpC-phenotype
confirmed by MICs
(%)*
AmpC/ESBL-
phenotype
confirmed by MICs
(%)*
A 18 3 (16.7) 3 (16.7) 0 (0) 0 (0)
B 6 0 (0) 0 (0) 0 (0) 0 (0)
C 86 20 (23.3) 19 (22.1) ** 3 (3.5) ** 2 (2.3)
D 34 5 (14.7) 5 (14.7) 0 (0) 0 (0)
E 34 1 (2.9) 1 (2.9) 0 (0) 0 (0)
F 12 0 (0) 0 (0) 0 (0) 0 (0)
G 42 2 (4.8) 2 (4.8) 0 (0) 0 (0)
H 8 1 (12.5) 1 (12.5) 0 (0) 0 (0)
I 36 1 (2.8) 1 (2.8) 0 (0) 0 (0)
J 39 8 (20.5) 7 (17.9) 1 (2.6) 0 (0)
Total 315 41 39 4 2
* %’s are based on total numbers of samples tested per supermarket
** These values include isolates with an AmpC+ESBL-phenotype

Page 39 of 85
Table 5 - Samples positive on for E. coli on MCA-CTX with MIC phenotype.
Sample
number
Date
tested
Super-market
code
Skin on or off Food
Category
Sampling Location (NUTS3) Phenotype
from MICs
462539 03/11/2020 C On Other cuts Bath and North East Somerset, North
Somerset & South Gloucestershire
ESBL
462541 09/11/2020 C On Other cuts West Surrey ESBL
462543 09/11/2020 C On Whole chicken West Surrey ESBL
462597 09/11/2020 E On Whole chicken Oxfordshire ESBL
462684 03/11/2020 J On Other cuts Edinburgh, City of ESBL
462700 04/11/2020 C On Other cuts Tower Hamlets ESBL
462703 04/11/2020 J On Other cuts Barking & Dagenham and Havering ESBL
462815 04/12/2020 C Off Other cuts Redbridge and Waltham Forest ESBL
462816 04/12/2020 J On Whole chicken Brent ESBL
512143 07/12/2020 A Off Chicken breast Tyneside ESBL
512147 04/12/2020 C On Other cuts Merton, Kingston upon Thames and Sutton ESBL
540894 04/03/2020 J On Whole chicken Greater Manchester North East AmpC
560648 05/08/2020 C On Whole chicken North Yorkshire CC AmpC
560654 06/08/2020 J On Whole chicken Tyneside ESBL
560848 10/07/2020 G On Whole chicken Kent Thames Gateway ESBL

Page 40 of 85
560906 10/02/2020 C On Whole chicken West Sussex (North East) ESBL
560966 13/01/2020 I On Other cuts Coventry ESBL
560971 08/01/2020 D On Whole chicken North Nottinghamshire ESBL
563132 07/10/2020 C On Other cuts Gwent Valleys ESBL
563133 07/10/2020 J On Other cuts Cardiff and Vale of Glamorgan ESBL
563165 08/09/2020 C On Whole chicken Staffordshire CC ESBL+Amp
C
563320 04/11/2020 A On Other cuts Bradford ESBL
563384 11/09/2020 C On Other cuts Birmingham ESBL
563600 10/07/2020 C On Whole chicken Wirral ESBL+Amp
C
2664374 10/02/2020 A On Other cuts Cornwall and Isles of Scilly ESBL
2664383 08/01/2020 D Off Chicken breast North Lanarkshire ESBL
2664391 13/01/2020 D Off Chicken breast Warwickshire ESBL
2664433 10/07/2020 D Off Chicken breast South Hampshire ESBL
2672451 09/10/2020 H On Other cuts Barnsley, Doncaster and Rotherham ESBL
2797770 07/12/2020 C Off Chicken breast North Northamptonshire ESBL
2797771 07/12/2020 C Off Chicken breast West Northamptonshire ESBL
2797783 04/12/2020 J Off Chicken breast Essex Thames Gateway ESBL
2797849 04/12/2020 C Off Other cuts West Essex ESBL
2797865 07/12/2020 J On Other cuts Durham CC ESBL

Page 41 of 85
2797896 09/11/2020 C Off Chicken breast West Surrey ESBL
2797898 03/11/2020 C Off Chicken breast Bath and North East Somerset, North
Somerset & South Gloucestershire
ESBL
2797973 04/11/2020 C Off Chicken breast Leeds ESBL
2797979 04/11/2020 C Off Other cuts Haringey and Islington ESBL
2798033 11/09/2020 C Off Chicken breast Berkshire ESBL
2798055 10/07/2020 G On Other cuts Mid Kent ESBL
2978071 05/08/2020 D Off Chicken breast North and North East Lincolnshire ESBL

Page 42 of 85
Table 6 - MIC results of 19 antimicrobials against all E. coli from MacConkey agar +
1 mg/L cefotaxime with AmpC (A) ESBL (E) or AmpC + ESBL (A+E) phenotype.
Resistant (R) or Sensitve (S) to differet antimicrobials
Sample
Number
Phen
otype A
MP
AZ
I
FE
P
CT
X
FO
X
CA
Z
CH
L
CIP
NA
L
CS
T
ET
P
IMP
ME
M
GE
N
TM
C
TE
T
TG
C
SU
L
TM
P
462539 E R S R R S R R R R S S S S S S R S R R
462541 E R S R R S R R R R S S S S S S R S R R
462543 E R S R R S R R R R S S S S S S R S R S
462597 E R S R R S R R S S S S S S S S R S R S
462684 E R S R R S R R R R S S S S S S R S R R
462700 E R S R R S R R R R S S S S S S R S R R
462703 E R S R R S R R S S S S S S S S R S R S
462815 E R S R R S R S S S S S S S S S R S R S
462816 E R R S R S R S R R S S S S S S R S R R
512143 E R S R R S R R S S S S S S S S R S R R
512147 E R S R R S R R R R S S S S S S R S R R
540894 A R S R R R R S R R S S S S S S R S S S
560648 A R S S R R R S R S S S S S S S R S R S
560654 E R S R R S R R R R S S S S S S R S R R
560848 E R S R R S R S S S S S S S S S R S R S
560906 E R S R R S R R R R S S S S S S R S R R
560966 E R S R R S R R R R S S S S S S S S R R
560971 E R S R R S R S S S S S S S S S R S R S
563132 E R S R R S R S R S S S S S S S R S S S
563133 E R S R R S R R R R S S S S S S R S R R
563165 A+E R S R R R R S S S S S S S S S R S S S
563320 E R S R R S R R S S S S S S S S R S R S
563384 E R S S R S R S R R S S S S S S S S S S
563600 A+E R S R R R R R R R S R S S S S R S R R

Page 43 of 85
Sample
Number
Phen
otype
AM
P
AZ
I
FE
P
CT
X
FO
X
CA
Z
CH
L
CIP
NA
L
CS
T
ET
P
IMP
ME
M
GE
N
TM
C
TE
T
TG
C
SU
L
TM
P
266437
4 E R S R R S R R R R S S S S R S R S R R
266438
3 E R S R R S R R R R S S S S S S R S R S
266439
1 E R S R R S R S S S S S S S S S R S R S
266443
3 E R S R R S R R R R S S S S S S R S R R
267245
1 E R S R R S R S R R S S S S S S R S R R
279777
0 E R S R R S R R S S S S S S S S R S R R
279777
1 E R S R R S R R R R S S S S S S R S R R
279778
3 E R S R R S R R R R S S S S S S R S R R
279784
9 E R S R R S R S S S S S S S S S S S R R
279786
5 E R S R R S R S S S S S S S S S S S S S
279789
6 E R S R R S R R R R S S S S S S R S R R
279789
8 E R S R R S R R R R S S S S S S R S R R
279797
3 E R S R R S R R R R S S S S S S R S R R
279797
9 E R S R R S R R R R S S S S S S R S R R

Page 44 of 85
Sample
Number
Phen
otype
AM
P
AZ
I
FE
P
CT
X
FO
X
CA
Z
CH
L
CIP
NA
L
CS
T
ET
P
IMP
ME
M
GE
N
TM
C
TE
T
TG
C
SU
L
TM
P
279803
3 E R S R R S R R R R S S S S S S R S R R
279805
5 E R S R R S R S S S S S S S S S R S R S
297807
1 E R S R R S R S S S S S S S S S R S R S
R – Resistant; S – Sensitive.
Any isolates with an ESBL phenotype would have shown synergy with cefotaxime
and or ceftazidime + clavulanic acid – not shown in above.
AMP – ampicillin (R > 8 mg/L); AZM – azithromycin (R > 16 mg/L); FEP –
cefepime (R > 0.125 mg/L); CTX – cefotaxime (R > 0.25 mg/L); FOX – cefoxitin (R >
8); CAZ – ceftazidime (R > 8 mg/L); CHL – chloramphenicol (R > 16 mg/L; CIP –
ciprofloxacin (R > 0.064 mg/L); NAL - nalidixic acid (R > 16 mg/L); CST – colistin (R
> 2 mg/L); ETP – Ertapenem (R > 0.064 mg/L); IPM – Imipenem (R > 0.5 mg/);
MEM – Meropenem (R > 0.125 mg/L); GEN – gentamicin (R > 2 mg/L); TMC -
temocillin (R > 32mg/L); TET – tetracycline (R > 8); TGC - tigecycline (R > 0.5); SUL
– sulfamethoxazole (R > 64 mg/L); TMP - trimethoprim (R > 2 mg/L).
Interpretative criteria according to tables 1and 4 in Commission Implementing
Decision 2013/652/EU.

Page 45 of 85
Table 7 - Summary of resistance phenotypes for E. coli from MacConkey agar + 1 mg/L cefotaxime - Comparison between 2018 and 2020 isolates.
Number resistant 2018 in brackets.
Antimicrobial ESBL* ESBL* AmpC** AmpC**
Ampicillin 39/39 (26/26) 2/2 (16/16)
Azithromycin 1/39 (0/26) 0/2 (0/16)
Cefepime 37/39 (26/26) 1/2 (13/16)
Cefotaxime 39/39 (26/26) 2/2 (16/16)
Cefoxitin 2/39* (3/26*) 2/2 (16/16)
Ceftazidime 39/39 (26/26) 2/2 (16/16)
Chloramphenicol 26/39 (2/26) 0/2 (0/16)
Ciprofloxacin 25/39 (13/26) 2/2 (4/16)
Colistin 0/39 (0/26) 0/2 (0/16)
Ertapenem 1/39b (0/26) 0/2 (0/16)
Gentamicin 1/39 (0/26) 0/2 (3/16)
Imipenem 0/39 (0/26) 0 /2 (0/16)
Meropenem 0/39 (0/26) 0/2 (0/16)
Nalidixic Acid 24/39 (12/26) 1/2 (4/16)
Sulfamethoxazole 35/39 (25/26) 1/2 (6/16)
Temocillin 0/39 (0/26) 0/2 (0/16)
Tetracycline 35/39 (22/26) 2/2 (6/16)
Tigecycline 0/39 (0/26) 0/2 (0/16)
Trimethoprim 24/39 (7/26) 0/2 (1/16)
Orange highlight denotes the four different cephalosporin antimicrobials which were tested; Cefepime, Cefotaxime, Cefoxitin and Ceftazidime. Grey highlight denotes the three carbapenem antimicrobials ertapenem, imipenem and meropenem and colistin (all last resort antimicrobials). a Microbiologically resistant using EUCAST ECOFFS b One AmpC+ESBL 2020 isolate was microbiologically but not clinically resistant to ertapenem. * Includes isolates with an AmpC/ESBL-phenotype which show resistance to cefoxitin ** Does not include isolates with an AmpC/ESBL-phenotype

Page 46 of 85
Table 8 - Samples positive for E. coli on CHROMagar™ ESBL.
Sample
number
Date
tested
Super-
market
code
Skin on or off Food
Category
Sampling Location (NUTS3) Presence of blaCTX, blaOXA,
blaSHV and blaTEM genes from
WGS data
462331 08/10/2020 C On Whole chicken Hertfordshire CTX-M-55
462539 03/11/2020 C On Other cuts Bath and North East Somerset, North
Somerset & South Gloucestershire
CTX-M-55
462541 09/11/2020 C On Other cuts West Surrey CTX-M-55
462543 09/11/2020 C On Whole chicken West Surrey CTX-M-55
462597 09/11/2020 E On Whole chicken Oxfordshire None
462684 03/11/2020 J On Other cuts Edinburgh, City of CTX-M-55
462700 04/11/2020 C On Other cuts Tower Hamlets TEM-1b
462703 04/11/2020 J On Other cuts Barking & Dagenham and Havering None
462726 04/12/2020 C On Whole chicken Croydon CTX-M14, TEM-1b
462815 04/12/2020 C Off Other cuts Redbridge and Waltham Forest CTX-M-55
512143 07/12/2020 A Off Chicken breast Tyneside SHV-134
560645 05/08/2020 J On Other cuts East Riding of Yorkshire CTX-M-55
560648 05/08/2020 C On Whole chicken North Yorkshire CC CTX-M-55
560654 06/08/2020 J On Whole chicken Tyneside CTX-M-55

Page 47 of 85
Sample
number
Date
tested
Super-
market
code
Skin on or off Food
Category
Sampling Location (NUTS3) Presence of blaCTX, blaOXA,
blaSHV and blaTEM genes from
WGS data
560848 10/07/2020 G On Whole chicken Kent Thames Gateway CTX-M-1
560899 04/02/2020 C On Whole chicken Cheshire East CTX-M-27
560906 10/02/2020 C On Whole chicken West Sussex (North East) CTX-M-55
560917 10/07/2020 I On Whole chicken North Hampshire CTX-M-1
560929 09/07/2020 C On Other cuts Gloucestershire CTX-M-55
560930 09/07/2020 I On Whole chicken Gloucestershire CTX-M-1
560966 13/01/2020 I On Other cuts Coventry TEM-1b
563132 07/10/2020 C On Other cuts Gwent Valleys None
563133 07/10/2020 J On Other cuts Cardiff and Vale of Glamorgan CTX-M-55
563165 08/09/2020 C On Whole chicken Staffordshire CC TEM-1b
563181 11/09/2020 D On Whole chicken Buckinghamshire CC CTX-M-1
563197 09/10/2020 J On Other cuts Mid Lancashire CTX-M-55
563320 04/11/2020 A On Other cuts Bradford None
563384 11/09/2020 C On Other cuts Birmingham None
563442 05/08/2020 I On Other cuts South and West Derbyshire None
563444 05/08/2020 J On Other cuts Leicester CTX-M-55

Page 48 of 85
Sample
number
Date
tested
Super-
market
code
Skin on or off Food
Category
Sampling Location (NUTS3) Presence of blaCTX, blaOXA,
blaSHV and blaTEM genes from
WGS data
563551 13/07/2020 G On Other cuts Hounslow and Richmond upon Thames CTX-M-1
563569 04/08/2020 J On Whole chicken East Sussex CC CTX-M-55
563600 10/07/2020 C On Whole chicken Wirral CTX-M-55
2664374 10/02/2020 A On Other cuts Cornwall and Isles of Scilly CTX-M-27
2664383 08/01/2020 D Off Chicken breast North Lanarkshire TEM-1b
2664391 13/01/2020 D Off Chicken breast Warwickshire CTX-M-1
2664433 10/07/2020 D Off Chicken breast South Hampshire CTX-M-27
2672451 09/10/2020 H On Other cuts Barnsley, Doncaster and Rotherham CTX-M-1
2797770 07/12/2020 C Off Chicken breast North Northamptonshire SHV-134
2797771 07/12/2020 C Off Chicken breast West Northamptonshire CTX-M-55
2797783 04/12/2020 J Off Chicken breast Essex Thames Gateway CTX-M-55
2797849 04/12/2020 C Off Other cuts West Essex CTX-M-55
2797865 07/12/2020 J On Other cuts Durham CC ND
2797896 09/11/2020 C Off Chicken breast West Surrey CTX-M-55
2797898 03/11/2020 C Off Chicken breast Bath and North East Somerset, North
Somerset & South Gloucestershire
CTX-M-55

Page 49 of 85
Sample
number
Date
tested
Super-
market
code
Skin on or off Food
Category
Sampling Location (NUTS3) Presence of blaCTX, blaOXA,
blaSHV and blaTEM genes from
WGS data
2797973 04/11/2020 C Off Chicken breast Leeds CTX-M-55
2797979 04/11/2020 C Off Other cuts Haringey and Islington CTX-M-55
2798033 11/09/2020 C Off Chicken breast Berkshire CTX-M-55
2798034 11/09/2020 C Off Chicken breast Berkshire CTX-M-55
2798037 11/09/2020 J Off Chicken breast Berkshire CTX-M-55
2798055 10/07/2020 G On Other cuts Mid Kent CTX-M-1
2798056 13/07/2020 C Off Chicken breast Ealing CTX-M-9
2798058 13/07/2020 C Off Chicken breast Hounslow and Richmond upon Thames CTX-M-1
2798067 10/07/2020 F Off Chicken breast North Hampshire CTX-M-1, TEM-1d
ND – Not determined

Page 50 of 85
Table 9 - Samples positive for E. coli on both MacConkey agar + 1 mg/L cefotaxime and CHROMagar™ ESBL.
Sample
number
Date
tested
Super-market
code
Skin on or
off
Food
Category
Sampling Location (NUTS3)
462539 03/11/2020 C On Other cuts Bath & North East Somerset, North Somerset and
South Gloucestershire
462541 09/11/2020 C On Other cuts West Surrey
462543 09/11/2020 C On Whole chicken West Surrey
462597 09/11/2020 E On Whole chicken Oxfordshire
462684 03/11/2020 J On Other cuts Edinburgh, City of
462700 04/11/2020 C On Other cuts Tower Hamlets
462703 04/11/2020 J On Other cuts Barking & Dagenham and Havering
462815 04/12/2020 C Off Other cuts Redbridge and Waltham Forest
512143 07/12/2020 A Off Chicken breast Tyneside
560648 05/08/2020 C On Whole chicken North Yorkshire CC
560654 06/08/2020 J On Whole chicken Tyneside
560848 10/07/2020 G On Whole chicken Kent Thames Gateway
560906 10/02/2020 C On Whole chicken West Sussex (North East)
560966 13/01/2020 I On Other cuts Coventry
563132 07/10/2020 C On Other cuts Gwent Valleys
563133 07/10/2020 J On Other cuts Cardiff and Vale of Glamorgan

Page 51 of 85
563165 08/09/2020 C On Whole chicken Staffordshire CC
563320 04/11/2020 A On Other cuts Bradford
563384 11/09/2020 C On Other cuts Birmingham
563600 10/07/2020 C On Whole chicken Wirral
2664374 10/02/2020 A On Other cuts Cornwall and Isles of Scilly
2664383 08/01/2020 D Off Chicken breast North Lanarkshire
2664391 13/01/2020 D Off Chicken breast Warwickshire
2664433 10/07/2020 D Off Chicken breast South Hampshire
2672451 09/10/2020 H On Other cuts Barnsley, Doncaster and Rotherham
2797770 07/12/2020 C Off Chicken breast North Northamptonshire
2797771 07/12/2020 C Off Chicken breast West Northamptonshire
2797783 04/12/2020 J Off Chicken breast Essex Thames Gateway
2797849 04/12/2020 C Off Other cuts West Essex
2797865 07/12/2020 J On Other cuts Durham CC
2797896 09/11/2020 C Off Chicken breast West Surrey
2797898 03/11/2020 C Off Chicken breast Bath & North East Somerset, North Somerset and
South Gloucestershire
2797973 04/11/2020 C Off Chicken breast Leeds
2797979 04/11/2020 C Off Other cuts Haringey and Islington
2798033 11/09/2020 C Off Chicken breast Berkshire
2798055 10/07/2020 G On Other cuts Mid Kent

Page 52 of 85
Figure 1 - Percentages of chicken meat samples (skin on or off) positive for E. coli on MacConkey agar + 1 mg/L cefotaxime and
CHROMagar™ ESBL for 2016, 2018 and 2020.
28.4
45.1
38.8
60.7
30.4
25
43.8
33.7
13.611.2
18.3
10
6.8
16.4
41.3
13.01 14.0511.54
17.1418.92
14.62
ALL SAMPLES % SKIN OFF
% + MC-CTX % + MC-CTX SKIN ON
% + MC-CTX SKIN OFF
% + CA-ESBL % + CA-ESBL SKIN ON
% + CA-ESBL SKIN OFF
Pe
rce
nta
ge o
f sa
mp
les
po
siti
ve
Type of sample or results
2016 2018 2020

Page 53 of 85
Figure 2 - Breakdown of resistance to antibiotics for AmpC- and ESBL-phenotype E. coli from isolated on MacConkey agar + 1 mg/L
cefotaxime from retail chicken meat in 2018 and 2020.
Less than 5% but greater than zero – MIC results for azithromycin, ertapenem and gentamicin against 2020 ESBLs.
100 95 100
5
10067 64 62
90 9062
100 100 100
12
100
850 46
96 85
27
100
50
100
100
100
100
50
50100
100
81
100
100
100
25
19
25
38
38
6
ESBL 2020 ESBL 2018 AmpC 2020 AmpC 2018
Values in bars are percentages of isolates resistantResults of less than 5% not visible

Page 54 of 85
Table 10 – Details of mcr positive meat samples and overall mcr results by PCR and WGS.
Meat sample ID Meat type Sampling date
Stated sources Initial “sweep” RT PCR result
Colony Reference a
Repeat mcr RT PCR result on purified colony
mcr by WGS analysis
2798047 Chicken breast 5-8-20
Supermarket H Lewisham and Southwark Poland
mcr-1 3 Negative * Negative *
mcr-1 7 Negative * Negative *
mcr-1 10 Not tested mcr-1
563345 Whole chicken 3-8-20
Supermarket G Inverclyde, East Renfrewshire and Renfrewshire UK
mcr-3** 1 Negative * Negative *
mcr-3** 5 Negative * Negative *
mcr-3** 10 Negative * Negative *
2798073 Chicken breast 6-10-20
Supermarket H Greater Manchester North West Poland
mcr-1 a mcr-1 mcr-1
mcr-1 b mcr-1 mcr-1
mcr-1 c mcr-1 mcr-1
mcr-1 d mcr-1 Not tested
mcr-1 e mcr-1 Not tested
2672451 Other cuts 8-10-20
Supermarket H Barnsley, Doncaster and Rotherham Poland
mcr-1 a mcr-1 mcr-1
mcr-1 b mcr-1 mcr-1
mcr-1 c mcr-1 mcr-1
mcr-1 d mcr-1 mcr-1
Please note: Red/Bold text – These isolates were confirmed by WGS to be
Hafnia alvei – see tables 11 and 12. All other isolates were E. coli.
a – As available, up to 10 colonies may be selected for further investigation. Only

Page 55 of 85
those with the correct phenotype are subject to further tests such as PCR and WGS.
Negative results are also shown in order to provide information on the different
colonies of interest that were progressed to repeat PCR and / or WGS.
* Initial “sweeps” positive, but PCR and WGS on sub-cultured bacterial isolates was
negative for mcr genes.
** A further meat sample (whole chicken) 462641 sampled on 2-11-20 was also
initially positive for mcr-3 based on “sweep” results only. No single mcr-3-positive E.
coli colonies could be isolated from this meat sample.

Page 56 of 85
Table 11 – WGS results for isolates from meat sample 2798047.
Meat sample ID Meat type Sampling date
Colony replicate (E. coli serotype)
All AMR genes detected
Mutations in QRDRs‡
MLST† (% ID)
Plasmid type Bacterial ID*
2798047 Chicken breast 5-8-20
3 (NA)
blaACC-5 dfrA17 tet(B)
ND ND Col(Ye4449) IncFIB(AP001918)
Hafnia alvei
2798047 Chicken breast 5-8-20
7 (NA)
aadA5 blaACC-1c dfrA17
ND ND Col(Ye4449) Col(pHAD28 IncFIB(AP001918)
Hafnia alvei
2798047 Chicken breast 5-8-20
10 (O153:H21)
aadA5 blaTEM-1B catA1, dhfrA17 qnrB19 mcr-1.1, tetB
gyrA 162 (100%)
Col(pHAD28) IncFIB(AP001918) IncFIC(FII) IncHI2 IncHI2A IncI2(Delta) IncX1
E. coli
† - MLST compared to DTU Escherichia coli#1 - Achtman scheme. ND – No match
for MLST. * Bacterial ID was determined by MALDI-ToF or from the WGS data. ‡ -
QRDR – quinolone resistance determining region. NA – Not applicable.

- 57 -
Table 12 – WGS results for isolates from meat sample 563345.
Meat sample ID Meat type Sampling date
Colony replicate (E. coli serotype)
All AMR genes detected
Mutations in QRDRs‡
MLST† (% ID)
Plasmid type Bacterial ID*
563345 Whole chicken 3-8-20
1 (NA)
blaACC-1a ND ND Col(MG828) Col(pHAD28) Col440I ColpVC IncFIC(FII)
Hafnia alvei
563345 Whole chicken 3-8-20
5 (O?:H4/45)
aph(6)-Id aph(3'')-Ib blaACC-1a
ND 1011 (100%)
Col(BS512) Col(Ye4449) IncFIB(AP001918) IncFIC(FII)
E. coli
563345 Whole chicken 3-8-20
10 (O25:H5)
aadA1 aph(3'')-Ib aph(6)-Id blaTEM-1B dhfrA1, sul2
ND 10, 1585, 5720
Col(BS512) ColpVC IncFIB(AP001918) IncFIC(FII) IncI1-I(Gamma) p0111
E. coli
† - MLST compared to DTU Escherichia coli#1 - Achtman scheme. ND – No match
for MLST. * Bacterial ID was determined by MALDI-ToF or from the WGS data. ‡ -
QRDR – quinolone resistance determining region. NA – Not applicable.
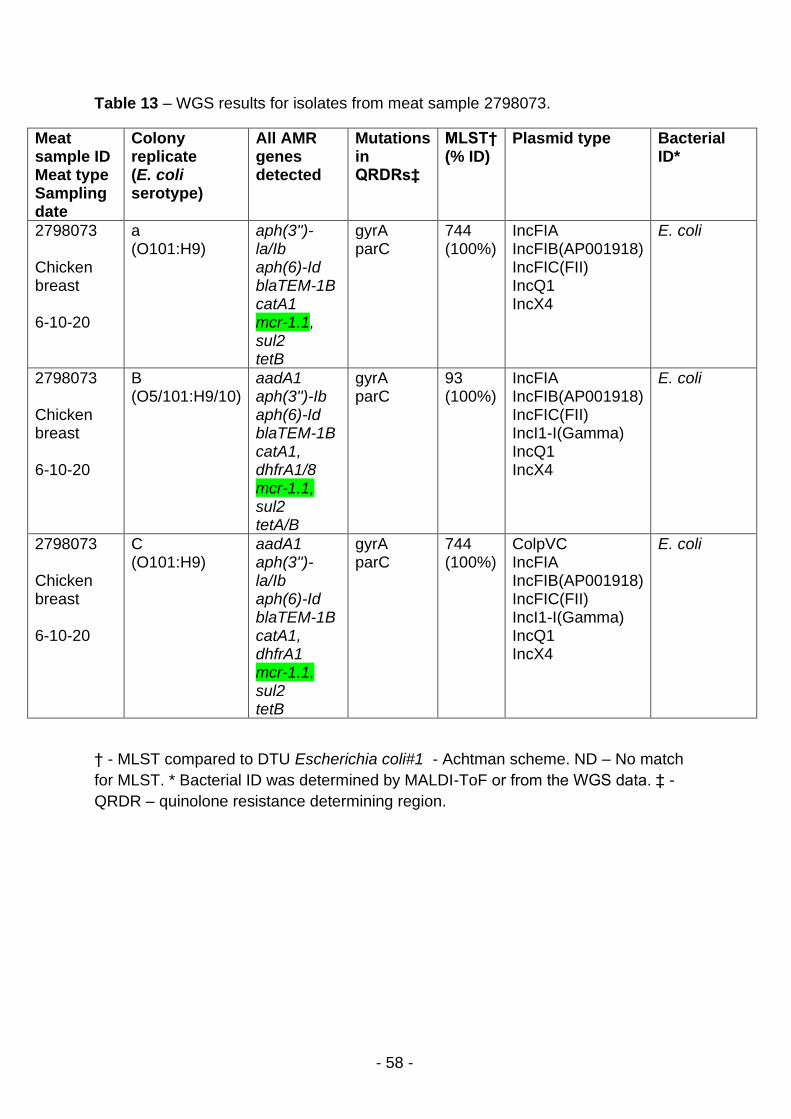
- 58 -
Table 13 – WGS results for isolates from meat sample 2798073.
Meat sample ID Meat type Sampling date
Colony replicate (E. coli serotype)
All AMR genes detected
Mutations in QRDRs‡
MLST† (% ID)
Plasmid type Bacterial ID*
2798073 Chicken breast 6-10-20
a (O101:H9)
aph(3'')-la/Ib aph(6)-Id blaTEM-1B catA1 mcr-1.1, sul2 tetB
gyrA parC
744 (100%)
IncFIA IncFIB(AP001918) IncFIC(FII) IncQ1 IncX4
E. coli
2798073 Chicken breast 6-10-20
B (O5/101:H9/10)
aadA1 aph(3'')-Ib aph(6)-Id blaTEM-1B catA1, dhfrA1/8 mcr-1.1, sul2 tetA/B
gyrA parC
93 (100%)
IncFIA IncFIB(AP001918) IncFIC(FII) IncI1-I(Gamma) IncQ1 IncX4
E. coli
2798073 Chicken breast 6-10-20
C (O101:H9)
aadA1 aph(3'')-la/Ib aph(6)-Id blaTEM-1B catA1, dhfrA1 mcr-1.1, sul2 tetB
gyrA parC
744 (100%)
ColpVC IncFIA IncFIB(AP001918) IncFIC(FII) IncI1-I(Gamma) IncQ1 IncX4
E. coli
† - MLST compared to DTU Escherichia coli#1 - Achtman scheme. ND – No match
for MLST. * Bacterial ID was determined by MALDI-ToF or from the WGS data. ‡ -
QRDR – quinolone resistance determining region.
- 59 -
Table 14 – WGS results for isolates from meat sample 2672451.
Meat sample ID Meat type Sampling date
Colony replicate (E. coli serotype)
All AMR genes detected
Mutations in QRDRs‡
MLST† (% ID)
Plasmid type Bacterial ID*
2672451 Other cuts 8-10-20
A (O?:H27)
aph(6)-Id aadA24 aph(3'')-Ib blaTEM-1B dhfrA1/14 lnu(G) mcr-1.1, sitABCD, sul2 tetA
gyrA parC
7941 (100%)
Col(MG828) IncFIA IncFIB(AP001918) IncFIC(FII) IncI1-I(Gamma) IncX4
E. coli
2672451 Other cuts 8-10-20
B (O101:H9/27)
aadA1 aph(6)-Id aph(3'')-Ib blaTEM-1B catA1 dhfrA1/14 mcr-1.1, sul2 tetA/B
gyrA parC
7941 (100%)
IncFIA IncFIB(AP001918) IncFIC(FII) IncI1-I(Gamma) IncX4
E. coli
2672451 Other cuts 8-10-20
C (O101:H9/27)
aph(6)-Id aph(3'')-Ib blaTEM-1B catA1 dhfrA1/14 lnu(G) mcr-1.1, sul2 tetA/B
gyrA parC
744 (100%)
IncFIA IncFIB(AP001918) IncFIC(FII) IncI1-I(Gamma) IncX4
E. coli
2672451 Other cuts 8-10-20
D (ND)
aadA1 blaTEM-1B/102/182 catA1 dhfrA1 lnu(G) mcr-1.1 sitABCD, sul2 tetB
gyrA parC
744 (100%)
IncFIA IncFIB(AP001918) IncFIC(FII) IncFII(pSE11) IncI1-I(Gamma) IncX4
E. coli
† - MLST compared to DTU Escherichia coli#1 - Achtman scheme. ND – No match
for MLST or Not determined. * Bacterial ID was determined by MALDI-ToF or from
the WGS data. ‡ - QRDR – quinolone resistance determining region.

Page 60 of 85
Table 15 – MICs of colistin and quinolone antibiotics against E. coli carrying mcr-1.
Isolate ID Ant* MIC R or S Ant* MIC R or S Ant* MIC R or S
2798047-COL-10 CIP = 8 R NAL > 128 R COL = 8 R
2798073-COLa CIP > 8 R NAL > 128 R COL = 4 R
2798073-COLb CIP > 8 R NAL > 128 R COL = 4 R
2798073-COLc CIP > 8 R NAL > 128 R COL = 4 R
2672451-COLa CIP > 8 R NAL > 128 R COL = 4 R
2672451-COLb CIP > 8 R NAL > 128 R COL = 8 R
2672451-COLc CIP > 8 R NAL > 128 R COL = 8 R
2672451-COLd CIP > 8 R NAL > 128 R COL = 4 R
Ant* - Antibiotic
R – Resistant
CIP – Ciprofloxacin, NAL – Nalidixic acid, COL – Colistin.
Microbiologically resistant and susceptible interpretation for the MIC’s were obtained by comparison with ECOFF’s published by
EUCAST.

- 61 -
Table 16 – MICs of beta-lactam antibiotics including meropenem against E. coli carrying mcr-1.
Isolate ID Ant* MIC R or S Ant* MIC R or S Ant* MIC R or
S
Ant* MIC R or S
2798047-COL-10 AMP > 64 R CTX <= 0.25 S CAZ <= 0.5 S MER <= 0.03 S
2798073-COLa AMP > 64 R CTX <= 0.25 S CAZ <= 0.5 S MER <= 0.03 S
2798073-COLb AMP > 64 R CTX <= 0.25 S CAZ <= 0.5 S MER <= 0.03 S
2798073-COLc AMP > 64 R CTX <= 0.25 S CAZ <= 0.5 S MER <= 0.03 S
2672451-COLa AMP > 64 R CTX <= 0.25 S CAZ <= 0.5 S MER <= 0.03 S
2672451-COLb AMP > 64 R CTX <= 0.25 S CAZ <= 0.5 S MER <= 0.03 S
2672451-COLc AMP > 64 R CTX <= 0.25 S CAZ <= 0.5 S MER <= 0.03 S
2672451-COLd AMP > 64 R CTX <= 0.25 S CAZ <= 0.5 S MER <= 0.03 S
Ant* - Antibiotic
R – Resistant, S – Sensitive.
AMP – Ampicillin, CTX – Cefotaxime, CAZ - ceftazidime, MER – Meropenem.
Microbiologically resistant and susceptible interpretation for the MIC’s were obtained by comparison with ECOFF’s published by
EUCAST.

- 62 -
Table 17 – MICs of sulfamethoxazole, tetracycline and trimethoprim against E. coli carrying mcr-1.
Antibiotic Ant* MIC R or S Ant* MIC R or S Ant* MIC R or S
2798047-COL-10 SUL <= 8 S TET <= 2 S TRIM <= 0.25 S
2798073-COLa SUL > 1024 R TET > 64 R TRIM > 32 R
2798073-COLb SUL > 1024 R TET > 64 R TRIM <= 0.25 S
2798073-COLc SUL > 1024 R TET > 64 R TRIM > 32 R
2672451-COLa SUL > 1024 R TET > 64 R TRIM > 32 R
2672451-COLb SUL > 1024 R TET = 64 R TRIM > 32 R
2672451-COLc SUL > 1024 R TET > 64 R TRIM > 32 R
2672451-COLd SUL > 1024 R TET > 64 R TRIM > 32 R
Ant* - Antibiotic
R – Resistant, S – Sensitive.
SUL – sulfamethoxazole, TET – tetracycline, TRIM – trimethoprim.
Microbiologically resistant and susceptible interpretation for the MIC’s were obtained by comparison with ECOFF’s published by
EUCAST.

- 63 -
Table 18 – MICs of azithromycin, chloramphenicol, gentamicin and tigecycline against E. coli carrying mcr-1.
Isolate ID Ant* MIC R or S Ant* MIC R or S Ant* MIC R or S Ant* MIC R or S
2798047-COL-10 AZI <= 2 S CHL > 128 R GENT <= 0.5 S TIG <= 0.25 NOINTP
2798073-COLa AZI = 8 S CHL = 128 R GENT <= 0.5 S TIG <= 0.25 NOINTP
2798073-COLb AZI = 8 S CHL = 128 R GENT <= 0.5 S TIG <= 0.25 NOINTP
2798073-COLc AZI = 8 S CHL = 128 R GENT <= 0.5 S TIG <= 0.25 NOINTP
2672451-COLa AZI = 8 S CHL <= 8 S GENT <= 0.5 S TIG <= 0.25 NOINTP
2672451-COLb AZI = 4 S CHL <= 8 S GENT <= 0.5 S TIG <= 0.25 NOINTP
2672451-COLc AZI = 8 S CHL = 128 R GENT <= 0.5 S TIG = 0.5 NOINTP
2672451-COLd AZI = 8 S CHL > 128 R GENT <= 0.5 S TIG <= 0.25 NOINTP
Ant* – Antibiotic
R – Resistant, S – Sensitive.
R – Resistant, S – Sensitive. NOINT – no interpretation for resistant or sensitive.
AZI – azithromycin, CHL – Chloramphenicol, GENT – gentamycin, TIG – tigecycline.
Microbiologically resistant and susceptible interpretation for the MIC’s were obtained by comparison with ECOFF’s published by
EUCAST.

Page 64 of 85
6. Discussion
Comparisons with previous years
The results for the 2016 EU/FSA survey for presumptive ESBL- and/or AmpC-
producing E. coli from retail chicken meat showed a significant decrease in the
proportion of samples positive for ESBL-producing E. coli compared to a previous
(2013/14) UK study. It should be noted however, that the sampling strategies and
isolation methods were similar, but not identical between these two studies.2, 16 A
major finding for the testing of the 20181 chicken meat samples was a further
significant reduction in the proportion of samples positive for presumptive ESBL-
and/or AmpC-producing E. coli compared with the 2016 survey,16 which did use
identical methods. These results were published in 2020 in a paper entitled “A
decline in the occurrence of extended‐spectrum β‐lactamase‐producing Escherichia
coli in retail chicken meat in the UK between 2013 and 2018.”17 It was considered
that “significant reductions in antimicrobials used in the UK poultry meat sector
between 2012 and 2016 may be linked to significant reductions in AmpC/ESBL‐
phenotype E. coli in retail chicken between 2013/14 and 2018”.17
Of interest, the EFSA report for 2017/18 samples also showed a reduction in the
prevalence of presumptive ESBL- and/or AmpC-producing E. coli in broiler meat
from several MS between 2016 and 2018.18 Overall EFSA reported that the
prevalence of presumptive ESBL- and/or AmpC-producing E. coli in meat from
broilers in 2018 was 39.8%, which is markedly lower compared to 57.4% in 2016.18
UK results from 2020 suggest that the proportions of retail chicken samples positive
for presumptive ESBL- and/or AmpC-producing E. coli have not changed since
2018, since in 2018/20 13.6% and 13.0% of samples respectively were positive for
ESBL and/or AmpC-producing E. coli on MCA-CTX. The drop from 65.4% in the
2013/14 study to 29.7% in the 2016 study being positive for ESBL-producing E. coli
was statistically significant, as mention previously.
Examining the results in more detail, for 2020 (compared to 2016/2018 surveys),
12.4% (29.7%/8.4%) and 1.6% (16.3%/6.1%) of retail chicken meat samples were
positive for presumptive ESBL- or AmpC-phenotype E. coli respectively (including
the three isolates with the combined AmpC+ESBL-phenotype in both the ESBL or
AmpC-phenotype groups) on MCA-CTX.

- 65 -
Between 2018 and 2020 on MCA-CTX the proportions of samples positive have
remained almost identical, although there has been an increase in the percentage of
isolates with an ESBL-phenotype, and a decrease in the percentage with an AmpC-
phenotype. This was also illustrated by the use of CA-ESBL which selects more
specifically for ESBL-phenotype E. coli. In 2020, 54 samples representing 17.1% of
samples were positive for ESBL-phenotype E. coli, compared to 30.4% positive in
2016 and 10% positive in 2018. An increase between 2018 and 2020 from 10% to
17.1% positive for ESBL-phenotype E. coli on CA-ESBL.
There was also an observed change in the types of CTX-M genes isolated in E. coli
from CA-ESBL. In 2018 the predominate blaCTX-M type for E. coli from CA-ESBL
was blaCTX-M 1, whilst for 2020 samples the blaCTX-M types were more varied. Most of
the CTX-M sequence types were blaCTX-M 55, then blaCTX-M 1, then blaCTX-M 27. Single
isolates were positive for blaCTX-9 or blaCTX-M 14. Two isolates were positive for blaSHV-
134, four isolates were only positive for blaTEM-1b and some isolate (n=6) were not
positive for any specific ESBL gene. blaSHV-134 was first described in 2012 in
Klebsiella pneumoniae from a patient in Spain.19 blaSHV-134 has also recently been
described in a paper reviewing SHV ESBLs, where it has been reported to be an
ESBL type enzyme detected in Klebsiella pneumoniae and associated with an IS26
mobile genetic element and plasmid borne.20
Resistance to last resort antibiotics
As in previous years, none of the samples gave rise to isolates on the two agars that
selected for carbapenem- resistant E. coli, suggesting that in the UK retail chicken
meat samples are not contaminated with carbapenem resistant E. coli.
With respect to the last resort antibiotic colistin though, in China, there was reported
to be a rapid rise of the ESBL and mcr-1 genes in E. coli of chicken origin between
2008 and 2014.21 In a recent study in the Netherlands, mcr-1 was detected from
24.8% of 214 retail chicken meat samples.22 E. coli carrying the plasmid-mediated
colistin resistance gene mcr-1 have also been reported from retail chicken in other
countries such as South Korea23 and Latin America.24 A German study examining
over 10,600 E. coli isolates from the national monitoring on zoonotic agents from the
years 2010–2015 for phenotypic colistin resistance found that the highest
prevalence of mcr-1 was detected in the turkey food chain (10.7%), followed by
broilers (5.6%).25 In a 2019 study of retail meat, bacteria of the Enterobacteriaceae

- 66 -
family carrying the mcr-1 gene were detected in 21% (18/86) of the examined
samples, especially in turkey meat and liver (16/24 positive for mcr-1 or 66.7%)
originating from EU and non-EU countries.8
In this 2020 UK survey, 3/315 retail chicken samples were found to be positive for
mcr-1-bearing E. coli. To our knowledge this is the first detection of mcr-1-positive
E. coli in retail chicken meat in the UK. All three chicken products came from
Poland. Eight mcr-1 positive E. coli isolated from the three positive meat samples
were characterised by WGS.
The authors of the Chinese study suggested that mcr-1 emerged and rose under the
heavy selective pressure of antimicrobial usage in the animal husbandry in the last
decade.21 Of note is that the UK poultry meat sector stopped using polymixins
(colistin) in 2016.3
Performing MICs against the mcr-1 positive isolates confirmed that all were colistin
resistant, but none were resistant to cefotaxime. Whilst the Chinese study reported
the co-existence of CTX-M genes and mcr-1, WGS did not detect any ESBL genes
in the eight mcr-1 positive isolates detected in the UK survey and this correlated
with the sensitivity to cefotaxime. Other MIC results correlated well with the WGS
results.
Further context of whole genome sequencing studies
Apart from resistance genes, WGS was able to identify the ST, plasmids and give a
predicted serotype. This information allowed for some comparison between these
eight mcr-1-positive isolates and mcr-1-positive isolates from poultry meat in other
countries.
Four of the isolates from two of the meat samples were positive for ST744 mcr-1 E.
coli and ST744 mcr-1 E. coli has previously been detected in turkey meat from
Brazil, Germany and Poland,8 which could possible suggest some shared origins of
such E. coli, but further work such as comparative analysis of core genomes would
be needed to elucidate this further.
A further two isolates from two of the meat samples were positive for ST93 or
ST162 mcr-1 E. coli. These STs have both been detected in turkey meat from
Poland and also from Germany for ST162.8

- 67 -
A Swiss study that analysed mcr-1 E. coli from poultry and turkey meat and from
humans revealed that each of the six isolates tested in their study had a distinct ST,
suggesting a high degree of clonal diversity amongst these isolates of different
origins.26 In the Swiss study the mcr-1 plasmids were transferred by transformation
and transferrable IncI2 and IncX4 mcr-1 plasmids were found associated with
human and food isolates. The authors suggested that “epidemic” plasmids rather
than specific E. coli clones might be responsible for the spread of the mcr-1 gene
along the food chain.26
For the mcr-1 E. coli in the UK survey, WGS results showed seven of the isolates
from two of the samples harboured IncX4 plasmids and the remaining sample was
positive for an mcr-1 E. coli harbouring an IncI2(Delta) plasmid. These plasmids
were not verified as encoding the mcr-1 gene in the eight positive isolates.
Traceback of mcr-1 positive samples
All the mcr-1 positive samples had their stated country of origin as being Poland.
FSA trace back investigations found that the three chicken meat samples positive
for mcr-1 E. coli originated from two approved premises in Poland. The products
were distributed straight from Poland to the UK retail market, with no additional
cutting/processing or repackaging of product in the UK. It is therefore likely that the
contamination occurred in Poland rather than in the UK. Additionally, the UK retailer
followed up with the Polish supplier regarding the use of colistin and confirmed that
colistin was used on the flock of chickens under investigation.
Samples initially positive for mcr-3
The lack of confirmation of the mcr-3 status of a further five meat samples from
purified E. coli may be because other lactose fermenters such as Klebsiella and
Citrobacter8 or non-lactose fermenters carried mcr-3. The current APHA protocol
used to detect mcr genes focuses on E. coli.
Another explanation may be that mcr-3 positive E. coli were outnumbered by
isolates that were chromosomally resistant to colistin. Previous studies have
detected chromosome-mediated mcr-3 variants in Aeromonas veronii from chicken
meat.27 As Aeromonas are non-lactose fermenters, if such isolates that were mcr-3

- 68 -
positive were contaminating the mcr-3 positive samples in this study, they would
have only been detected in the initial “sweep” of multiple colonies, and not when
lactose fermenters were purified and subsequently tested.
MIC results
MIC results of E. coll from MCA-CTX were in general similar to results from the
2018 study, when E. coli were recovered from this agar.
None of the 41 isolates from the AmpC/ESBL specific agar were microbiologically
resistant to the ‘last resort’ carbapenem antimicrobials imipenem and meropenem or
to colistin. The MIC of ertapenem against one AmpC+ESBL-phenotype isolate was
just above the previous EUCAST ECOFF (currently there is only a tentative ECOFF
for ertapenem), and as such was microbiologically resistant. This isolate was not
clinically resistant though, using EUCAST clinical breakpoint of > 0.5 mg/L to denote
resistance.
Studies have shown that ertapenem resistance can arise in E. coli in the absence
of carbapenem resistance genes. This can be due to factors such as overproduction
of AmpC β-lactamase and decreased expression of outer membrane porins such as
OmpC/OmpF28 and also for CTX-M positive isolates that have reduction of outer
membrane proteins,29
There was a decrease in the numbers of presumptive AmpC-phenotype E. coli
isolated in 2020 compared to the numbers detected in 2018. Conversely there was
an increase in presumptive ESBL-phenotype E. coli isolated between 2018 and
2020. EFSA report that in animal populations/food matrices, isolates with a
presumptive ESBL-phenotype were more common than isolates with a presumptive
AmpC-phenotype in the majority of the countries, although the occurrence of the
different phenotypes did vary considerably among the Member States (MSs) and in
some countries the AmpC-phenotype dominated.18
Comparison with results from other countries
In 2018, EFSA report that AMR monitoring of broiler meat was performed by 28
MSs and four non-MSs.18 As in 2016 there was marked variations between MSs for

- 69 -
the prevalence of samples positive for presumptive ESBL and/or AmpC-producing
E. coli.18 Overall EFSA reported that the prevalence of presumptive ESBL- and/or
AmpC-producing E. coli in meat from broilers from all participating countries in 2018
was 39.8%, compared to 13.6% UK retail chicken samples positive in 2018.18

- 70 -
7. Conclusions
• The proportion of retail chicken samples positive for presumptive ESBL-producing
and AmpC-producing E. coli using the EU recommended agar MCA-CTX was
similar to 2018 results at 13.0%. This compares to 45.1% of chicken meat samples
being positive on this agar in 2016. There was a slight increase in the proportions of
samples positive for presumptive ESBL-producing E. coli using the ESBL specific
agar CA-ESBL.
• None of the UK retail chicken samples tested in 2020 were positive for E. coli on the
two carbapenemase agars, although one presumptive AmpC+ESBL-phenotype
isolate from MCA-CTX agar was microbiologically resistant, but clinically sensitive to
the carbapenem antimicrobials ertapenem. It is possible that such resistance might
be attributed to porin loss29 or increased expression of AmpC,28 although this was
not investigated.
• Three (0.95%) of the UK retail chicken samples tested in 2020 were positive for
plasmid-mediated colistin resistance encoded for by mcr-1. This is the first time the
authors are aware that mcr-1 E. coli have been detected from retail chicken meat in
the UK. The country of origin of these mcr-1- positive chicken samples was Poland.
These isolates showed similarity (based on ST and plasmids) to mcr-1 E. coli
isolated from poultry meat in Europe.
• Long read sequencing showed the mcr-1 gene in E. coli from two samples were
present on an Inc-X4 plasmid and highly conserved. These two plasmids also
showed high sequence identity with the mcr-1 IncX-4 bearing plasmid from pig
faeces (RB5) that has been reported previously from the UK. There was however
little similarity in E. coli from the third chicken meat sample with other mcr-1
plasmids.
• The predominant CTX M types recovered from retail chicken meat (mainly CTX-M-1
and CTX-M-55) differ to those causing mainly human disease in the UK, since the
major type causing disease in humans is the pandemic O25-ST131 CTX-M-15-
producing clone.30 This suggests, as stated in previous years and by a Public Health
England publication,30 that chicken meat is not a major source of ESBLs in humans,

- 71 -
since none of the samples were positive for CTX-M-15. There was an increase in
samples positive for CTX-M-55 rather than CTX-M-1 E. coli compared to previous
years.
• Using the EU method with a detection limit of 3,000 cfu/g, none of the retail chicken
meat samples gave rise to counts of background E. coli on MCA or to presumptive
ESBL/AmpC-producing E. coli on MCA-CTX media.
• In view of the isolation of mcr-1 from retail chicken meat for the first time in the UK,
some future ongoing monitoring of AMR retail meats in the UK would seem prudent.

- 72 -
8. Appendix 1 - Viable counts of E. coli from chicken meat samples homogenised in Buffered Peptone water (BPW) or saline.
Aim
The EU method for performing viable bacterial counts states to homogenise meat
samples in chilled saline. To comply with this method would require two lots of
homogenisations for each meat sample tested. One sample in saline for the E. coli
counts, and one sample in BPW for enrichment prior to plating on selective agars.
This not only increases work, but also means that two different aliquots per sample
would be processed potentially giving different results for counts and post enrichment,
since two different aliquots of the original chicken sample would be tested.
With the agreement of the DTU and the FSA, it was agreed to compare different
methods of homogenisation (in chilled BPW or chilled saline) of chicken meat samples
for recovery of E. coli to determine if counts were comparable using both methods of
homogenisation.
Comparison was performed using routine chicken meat samples, and spiked chicken
meat samples.
Caveat
Low spike levels of chicken meat were chosen to be representative of low levels of
organisms in actual meat samples.
The EU method states that “To ensure an accurate estimate of the number of E. coli
cells (both ESBL/AmpC and total E. coli) in the original sample, plates with > 300
colonies and < 30 colonies should not be used for CFU counts” 31.
The APHA limit of detection of 100 cfu/gram and not the EU detection limit of 3,000
cfu/gram is given in this report.
It should be considered that at the lower two spike levels the colonies were less than
30 per agar plate and as such would be below the EU detection limit. These low
counts tend to lead to the variation seen between replicates.
Conclusions
Performing viable bacteria counts on both test and spiked retail meat samples
following homogenisation in saline and BPW, provided very similar results.
All 51 routine test meat samples were found to containcounts below the detection limit
of 3,000 cfu/gram (EU method), regardless of homogenisation method.
As such it is considered appropriate to homogenise meat samples in chilled BPW
only, and not chilled BPW and additionally chilled saline.

- 73 -
Abstract
For a total of routine 51 meat samples, although there was limited variation in viable
bacterial counts following homogenisation in saline and BPW, the variation seen was
only between zero, one, two or three detected colonies on agars. Such a level of
variation would likely be seen when plating technical replicates.
As most of these routine retail meat samples were negative (below the detection limit
of 100 cfu/gram) for E. coli, an experiment where meats were spiked with ESBL-
producing E. coli was also performed.
Spike levels were chosen to represent just below, about 5x and about 50x the APHA
limit of detection. It should be considered that no data were available as to the
percentages of isolates that would be recovered from such spiking experiments, as it
would not be 100%. In all, 120 spiked samples were tested, with 5 replicates per spike
condition per experiment. Two experiments were performed.
At the lowest spike level just below the limit of detection, E. coli were not detected
following homogenisation in saline for five replicates, but was detected following
homogenisation in BPW, but only one colony was detected per sample, and thus very
close to no detection as for homogenisation in saline.
At the mid-spike level, which was five times the limit of detection, mean results for the
five replicates in duplicate experiments were very similar (about two logs) on
MacConkey agar following homogenisation in saline or BPW.
At the mid-spike level, mean results for the five replicates in duplicate experiments
were lower on MacConkey + 1 mg/L cefotaxime agar than MacConkey agar alone,
following homogenisation in saline and BPW. These lower counts may represent a
recovery issue of the spike strain on antibiotic-containing MacConkey + 1 mg/L
cefotaxime agar.
On MacConkey + 1 mg/L cefotaxime agar mean results for the five replicates in
duplicate experiments were very similar following homogenisation in saline and BPW,
in particular when the variation between replicates is considered.
As for other spike levels, mean results at the higher spike level of ~ 5000 cfu/gram
were very similar following homogenisation in saline and BPW, in view of the standard
deviations of replicates.
Method
Routine samples over a two month period were homogenised either in chilled saline
(25 grams + 225 mls) or BPW (27 grams + 243 mls), prior to performing viable counts
on MacConkey agar and MacConkey agar + 1 mg/L cefotaxime, as per EU protocols.
As numbers of E. coli from routine samples are often below the detection limit, retail
chicken samples were also spiked with ESBL-producing E. coli.

- 74 -
For meat spiking, sufficient quantities of diced chicken (two different experiments,
each with a different batch of meat) were purchased from a retail store. Samples were
weighed out into 15 x 27 gram portion (for homogenisation with 243 mls of BPW) and
15 x 25 gram portions (for homogenisation with 225 mls of saline).
Five replicate 25 gram and five replicate 27 gram portions of meat were spiked with
two different levels of ESBL-producing E. coli per experiment, prior to homogenisation
and counts as above.
Results and discussion
Routine meats
Fifty-one routine meat samples were tested for viable counts following
homogenisation in saline and BPW.
Most of the counts for there 51 routine samples were below the detection limit,
including all counts on MacConkey agar + 1 mg/L cefotaxime.
A total of three of the 51 routine meat samples homogenised in BPW gave rise to
counts of 100 to 200 cfu/gram on MacConkey agar. It should be considered this
represents only one or two colonies and as such only just above the minimum
detectable number of colonies.
Six meat samples homogenised in saline gave rise to counts of 100 to 300 cfu/gram
on MacConkey agar. It should be considered this represents only one to three
colonies.
The results suggest equivalence between homogenisation in saline or BPW for test
retail meat samples.
Spiked meat samples
Retail diced chicken was spiked at ~ 50 cfu/gram (just below the limit of detection), ~
500 cfu/gram in duplicate experiments (close to limit of detection) and ~ 5000
cfu/gram with an ESBL-producing E. coli (Table 1).
On MacConkey agar, in view of the standard deviation between replicates, mean
results were very similar for samples homogenised in saline or BWP. Additionally,
mean counts were within one log of the spike, although generally below the spike
level, which may represent some binding of the spike bacteria to the chicken meat.
Counts on MacConkey agar + 1 mg/L cefotaxime were below those on MacConkey
agar despite the spike strain being an ESBL-producing E. coli. This may represent a
recovery problem for the isolate plated direct to antibiotic containing medium without
enrichment. For this agar, taking into account the standard deviation between
replicates, counts were similar following homogenisation of meats in saline or BPW.

- 75 -
The results suggest equivalence between homogenisation in saline or BPW for test
spiked retail meat samples, bearing in mind variation between replicates that may
represent different levels of binding of spike strain to meat samples.

- 76 -
Table 1. Viable counts of E. coli from spiked chicken meat samples homogenised in
saline or BPW – Results on McConkey agar.
Approximate
Spike level cfu/gram
(Experiment number
Mean (standard
deviation) of
cfu/gram on different
agar for replicate
(n=5) spiked chicken
meat : Saline
Mean (standard
deviation) of cfu/gram on
different agar for
replicate (n=5) spiked
chicken meat : BPW
50 (1) 0 (0) 100* (0)
500 (1) 260 (134) 480 (238)
500 (2) 180 (303) 220 (204)
5000 (2) 2040 (862) 1040 (611)
Limit of detection is 100 cfu/gram: This detection limit increases to 3,000 cfu/gram if
at least 30 colonies need to be counted as per EU method.31
* For the purpose of this study any colonies observed were counted, so 100 cfu/gram
represents one colony only on an agar plate.

- 77 -
Table 2. Viable counts of E. coli from spiked chicken meat samples homogenised in
saline or BPW – Results on McConkey CTX agar.
Approximate
Spike level cfu/gram
(Experiment number)
Mean (standard
deviation) of cfu/gram
on different agar for
replicate (n=5) spiked
chicken meat: Saline
Mean (standard
deviation) of cfu/gram
on different agar for
replicate (n=5) spiked
chicken meat: BPW
50 (1) 0 (0) 0 (0)
500 (1) 0 (0) 300 (212)
500 (2) 20 (45) 0 (0)
5000 (2) 340 (168) 460 (780)
Limit of detection is 100 cfu/gram: This detection limit increases to 3,000 cfu/gram if
at least 30 colonies need to be counted as per EU method.31
* For the purpose of this study any colonies seen were counted, so 100 cfu/gram
represents one colony only on an agar plate.

- 78 -
9. Appendix 2 – Further molecular characterisation of mcr-1 plasmids
Background
This report contains results for further WGS analysis for mcr-1 E. coli from three
chicken meat samples. At the request of the FSA, long read sequencing was
performed on mcr-1 E. coli from chicken meat to resolve the plasmid type and the
additional results are included here.
Results and discussion
Long read sequencing was performed on selected isolates from all three of the mcr-
1 positive samples; hybrid assemblies produced from long- and short-read data was
used to resolve the mcr bearing plasmid genome for further characterisation.
The results showed the mcr-1 gene in E. coli from two samples (C_2672451 and
C_2798073) were present on an Inc-X4 plasmid. Comparison of the resolved mcr-1
Inc-X4 plasmid genomes indicated both to be highly conserved within E. coli
isolated from these chicken meat samples (Figure 1). It also showed high sequence
identity with the mcr-1 IncX-4 bearing plasmid from pig faeces (RB5) that has been
reported previously from the UK.32 However, we noted little similarity in E. coli from
the third chicken meat sample (C_2798047) with other mcr-1 plasmids. The WGS
data from this isolate was run through the APHA SeqFinder AMR pipeline to
investigate this discrepancy. It showed that the mcr-1 gene was present at very low
copy number in this isolate, indicating the mcr-1 plasmid was possibly unstable
within the host E. coli. Further work is required in future to understand why the mcr-
1 IncX4 plasmid was unstable in this E. coli host background but not others.
Conclusions
In a recent study in the Netherlands, mcr-1 was detected from 24.8% of 214 retail
chicken meat samples, and the presence of Enterobacteriaceae carrying mcr1 was
confirmed from 34 of the positives.22 E. coli carrying the plasmid mediated colistin
resistance gene have also been reported from retail chicken in other countries such
as South Korea23 and Latin America.24

- 79 -
However, this is to our knowledge the first reported occurrence of mcr E. coli from
retail chicken meat in the UK. The results from our study indicates that the mcr-1
gene is carried in an Inc-X4 plasmid which was identical to that found in previously
reported E. coli isolated from pigs in the UK. We are not clear why the mcr- 1 Inc-X4
plasmid was unstable in one E. coli isolated but can speculate that it may be due to
the genetic background of the host. Phylogenetic analysis performed in future may
provide insight as to whether particular E. coli lineages are more likely to harbour
the mcr-1 plasmids more stably due to some fitness attribute associated with them.

- 80 -
Figure 1 - Comparison of the resolved genome of a mcr-1 Inc-X4 plasmid from an
E. coli isolated from a chicken meat sample with other mcr-1 E. coli.

- 81 -
10. References
1. FSA. RDFS102109 - EU Harmonised Surveillance of Antimicrobial Resistance
(AMR) in E. coli from Retail Meats (Year 4 - Chicken).
https://www.food.gov.uk/sites/default/files/media/document/surveillance-of-
antimicrobial-resistance-amr-in-e.-coli-from-retail-meats-in-uk-2018-year-4-
chicken.pdf.
https://doi.org/10.1111/j.1745-4565.2010.00295.x
2. Randall LP, Lodge MP, Elviss NC et al. Evaluation of meat, fruit and vegetables
from retail stores in five United Kingdom regions as sources of extended-spectrum
beta-lactamase (ESBL)-producing and carbapenem-resistant Escherichia coli.
International Journal of Food Microbiology 2017; 241: 283-90.
https://doi.org/10.1016/j.ijfoodmicro.2016.10.036
3. VMD. UK Veterinary Antibiotic Resistance and Sales Surveillance Report.
https://www.gov.uk/government/uploads/system/uploads/attachment_data/file/58234
1/1051728-v53-UK-VARSS_2015.pdf.
4. EUCAST. MIC and zone diameter distributions and ECOFFs.
https://www.eucast.org/mic_distributions_and_ecoffs/.
5. Randall LP, Lemma F, Koylass M et al. Evaluation of MALDI-ToF as a method
for the identification of bacteria in the veterinary diagnostic laboratory. Research in
veterinary science 2015; 101: 42-9. https://doi.org/10.1016/j.rvsc.2015.05.018
6. Bankevich A, Nurk S, Antipov D et al. SPAdes: A New Genome Assembly
Algorithm and Its Applications to Single-Cell Sequencing. Journal of Computational
Biology 2012; 19: 455-77. https://doi.org/10.1089/cmb.2012.0021
7. Zankari E, Hasman H, Cosentino S et al. Identification of acquired antimicrobial
resistance genes. J Antimicrob Chemother 2012; 67: 2640-4.
8. Gelbicova T, Barakova A, Florianova M et al. Dissemination and Comparison of
Genetic Determinants of mcr-Mediated Colistin Resistance in Enterobacteriaceae via
Retailed Raw Meat Products. Front Microbiol 2019; 10: 2824.
https://doi.org/10.3389/fmicb.2019.02824

- 82 -
9. Larsen MV, Cosentino S, Rasmussen S et al. Multilocus sequence typing of total-
genome-sequenced bacteria. J Clin Microbiol 2012; 50: 1355-61.
https://doi.org/10.1128/jcm.06094-11
10. Larsen MV, Cosentino S, Lukjancenko O et al. Benchmarking of methods for
genomic taxonomy. J Clin Microbiol 2014; 52: 1529-39.
11. Joensen KG, Scheutz F, Lund O et al. Real-time whole-genome sequencing for
routine typing, surveillance, and outbreak detection of verotoxigenic Escherichia coli.
J Clin Microbiol 2014; 52: 1501-10.
https://doi.org/10.1128/jcm.03617-13
12. Carattoli A, Zankari E, Garcia-Fernandez A et al. In silico detection and typing of
plasmids using PlasmidFinder and plasmid multilocus sequence typing. Antimicrob
Agents Chemother 2014; 58: 3895-903.
https://doi.org/10.1128/aac.02412-14
13. Jayol A, Saly M, Nordmann P et al. Hafnia, an enterobacterial genus naturally
resistant to colistin revealed by three susceptibility testing methods. J Antimicrob
Chemother 2017; 72: 2507-11.
https://doi.org/10.1093/jac/dkx154
14. Ori EL, Takagi EH, Andrade TS et al. Diarrhoeagenic Escherichia coli and
Escherichia albertii in Brazil: pathotypes and serotypes over a 6-year period of
surveillance. Epidemiol Infect 2018: 1-9.
15. Ewers C, Grobbel M, Stamm I et al. Emergence of human pandemic O25:H4-
ST131 CTX-M-15 extended-spectrum-beta-lactamase-producing Escherichia coli
among companion animals. J Antimicrob Chemother 2010; 65: 651-60.
https://doi.org/10.1093/jac/dkq004
16. FSA. RDFS102109 - EU Harmonised Surveillance of Antimicrobial Resistance
(AMR) in E. coli from Retail Meats (Year 2 - Chicken).
https://www.food.gov.uk/sites/default/files/media/document/fs102109y2.pdf.
17. Randall LP, Horton RH, Chanter JI et al. A decline in the occurrence of extended-
spectrum beta-lactamase-producing Escherichia coli in retail chicken meat in the UK

- 83 -
between 2013 and 2018. J Appl Microbiol 2021; 130: 247-57.
https://doi.org/10.1111/jam.14687
18. European Food Safety A, European Centre for Disease P, Control. The European
Union Summary Report on Antimicrobial Resistance in zoonotic and indicator bacteria
from humans, animals and food in 2017/2018. EFSA J 2020; 18: e06007.
https://doi.org/10.2903/j.efsa.2020.6007
19. Sanchez-Romero I, Asensio A, Oteo J et al. Nosocomial outbreak of VIM-1-
producing Klebsiella pneumoniae isolates of multilocus sequence type 15: molecular
basis, clinical risk factors, and outcome. Antimicrob Agents Chemother 2012; 56:
420-7. https://doi.org/10.1128/aac.05036-11
20. Liakopoulos A, Mevius D, Ceccarelli D. A Review of SHV Extended-Spectrum
beta-Lactamases: Neglected Yet Ubiquitous. Front Microbiol 2016; 7: 1374.
https://doi.org/10.3389/fmicb.2016.01374
21. Wu C, Wang Y, Shi X et al. Rapid rise of the ESBL and mcr-1 genes in Escherichia
coli of chicken origin in China, 2008-2014. Emerg Microbes Infect 2018; 7: 30.
https://doi.org/10.1038/s41426-018-0033-1
22. Schrauwen EJA, Huizinga P, van Spreuwel N et al. High prevalence of the mcr-1
gene in retail chicken meat in the Netherlands in 2015. Antimicrobial resistance and
infection control 2017; 6: 83.
https://doi.org/10.1186/s13756-017-0242-8
23. Kim J, Hwang BK, Choi H et al. Erratum: Kim, J.; et al. Characterization of mcr-1-
Harboring Plasmids from Pan Drug-Resistant Escherichia coli Strains Isolated from
Retail Raw Chicken in South Korea. Microorganisms 2019, 7, 344. Microorganisms
2019; 7.
https://doi.org/10.3390/microorganisms7100470
24. Monte DF, Mem A, Fernandes MR et al. Chicken Meat as a Reservoir of Colistin-
Resistant Escherichia coli Strains Carrying mcr-1 Genes in South America.
Antimicrob Agents Chemother 2017; 61.
https://doi.org/10.1128/aac.02718-16

- 84 -
25. Irrgang A, Roschanski N, Tenhagen BA et al. Prevalence of mcr-1 in E. coli from
Livestock and Food in Germany, 2010-2015. PLoS One 2016; 11: e0159863.
https://doi.org/10.1371/journal.pone.0159863
26. Zurfluh K, Nuesch-Inderbinen M, Klumpp J et al. Key features of mcr-1-bearing
plasmids from Escherichia coli isolated from humans and food. Antimicrob Resist
Infect Control 2017; 6: 91.
https://doi.org/10.1186/s13756-017-0250-8
27. Ling Z, Yin W, Li H et al. Chromosome-Mediated mcr-3 Variants in Aeromonas
veronii from Chicken Meat. Antimicrob Agents Chemother 2017; 61.
https://doi.org/10.1128/aac.01272-17
28. Guillon H, Tande D, Mammeri H. Emergence of ertapenem resistance in an
Escherichia coli clinical isolate producing extended-spectrum beta-lactamase AmpC.
Antimicrob Agents Chemother 2011; 55: 4443-6.
https://doi.org/10.1128/aac.01513-10
29. Dupont H, Choinier P, Roche D et al. Structural Alteration of OmpR as a Source
of Ertapenem Resistance in a CTX-M-15-Producing Escherichia coli O25b:H4
Sequence Type 131 Clinical Isolate. Antimicrob Agents Chemother 2017; 61.
https://doi.org/10.1128/aac.00014-17
30. Day MJ, Hopkins KL, Wareham DW et al. Extended-spectrum beta-lactamase-
producing Escherichia coli in human-derived and foodchain-derived samples from
England, Wales, and Scotland: an epidemiological surveillance and typing study.
Lancet Infect Dis 2019; 19: 1325-35.
https://doi.org/10.1016/s1473-3099(19)30273-7
31. DTU. Quantification of ESBL/AmpC-producing Escherichia coli in caecal content
and fresh meat samples. https://www.eurl-ar.eu/CustomerData/Files/Folders/21-
protocols/399_esbl-ampc-quantification-protocol-19-03-2018.pdf.
https://doi.org/10.26226/morressier.56d6be73d462b80296c9732a
32. Duggett NA, Sayers E, AbuOun M et al. Occurrence and characterization of
mcr-1-harbouring Escherichia coli isolated from pigs in Great Britain from 2013 to
2015. Journal of Antimicrobial Chemotherapy 2017; 72: 691-5.

- 85 -