2011 depestele fdi_ijms_quantifying-causes-of-discard-variability

Final Report Evaluating the Condition and Discard Mortality of Skates Following Capture and
Handling in the Sea Scallop Dredge Fishery.
Award Number: 12-SCA-15 VIMS Marine Resource Report No. 2015-6 Submitted to: National Marine Fisheries Service Northeast Fisheries Science Center Cooperative Research Program 166 Water Street Woods Hole, Massachusetts 02543-1026 Submitted by: David B. Rudders Virginia Institute of Marine Science College of William and Mary Gloucester Point, Virginia Ryan J. Knotek and James A. Sulikowski University of New England Biddeford, ME John A. Mandleman New England Aquarium Boston, MA Hugues P. Benoît Department of Fisheries and Oceans Canada Moncton, NB May 29, 2015

1. Introduction
In the U.S. commercial fishing industry (marine) approximately 12.7% (~ 607
million lbs.) of all landings are discarded annually (NMFS 2014). However, the fate
(dead or alive) of these fish has typically gone unaccounted for in population assessments
(Alverson et al., 1994; Hall et al., 2000) because of the numerous factors and species-
specific differences that effect discard survival and make data inherently difficult to
collect (Davis, 2002). Due to this lack of information the ability to provide accurate post-
release mortality (PRM) estimates of discarded fish has become of the most significant
issues affecting current marine fisheries management (Davis, 2002).
In the limited studies to date, a common approach to investigate PRM has been to
capture animals and then monitor their short-term survival with seafloor holding pens and
on-board aquaria (Benoît et al., 2010, 2012; Mandelman et al., 2013; Depestele et al.,
2014). While such studies can provide management with short-term survival estimates
and best-practice frameworks that reflect the fishery, they are frequently laden with
caveats (Benoît et al., 2010, 2012; Mandelman et al., 2013, Depestele et al., 2014). For
example, this approach can both inflate (i.e. due to stress from crowding/confinement,
forced thermal changes and recompression, lack of foraging ability) and deflate (i.e. via
shielding from predation from birds and other marine species) mortality risk, thus biasing
study results relative to what might occur under non-experimental conditions (i.e.
Weltersbach and Strehlow, 2013). Moreover, confinement in cages or aquaria can only
account for the initial few days post-release, despite the strong likelihood that additional
fatalities would occur beyond that monitoring window. In addition, the number of
animals that can be evaluated (given the logistics of containment dimensions and cost of
at-sea operation) in these studies can limit the statistical power and make it difficult to
account for all possible factors influencing survival (Benoît et al. 2010). To overcome
these limitations, rapidly assessed, semi-quantitative indices used as proxies for survival
can be applied to both discarded animals and subsamples kept for holding periods, to
integrate a wider-range of fishing conditions that can affect discards (e.g. Barkley and
Cadrin, 2012; Mandelman et al., 2013; Depestele et al., 2014; Benoît et al., 2015). These
quantitative indices are most effective as proxies when their design includes various
predictors of survival, such as overt physical trauma and reflex impairment (van Beek et
al., 1990; Benoît et al., 2010, 2012; Depestele et al., 2014). Using the probability of a
given index score (conditional on capture factors) and the probability of survival
(conditional on the quantitative proxy), this type of study is able to obtain representative
estimates of PRM (Benoît et al., 2015).
The order Rajiformese (i.e. skates) is in particular need of PRM estimates given
the 47.9% increase in U.S. landings over the past 10 years (~ 11.4 million lbs. captured in
2013; FAO 2014) and the significantly high levels of bycatch, which can be nearly six
times greater than total landings (~ 72.3 million lbs. discarded in 2010; NMFS 2014). In
addition to these high discard rates, concern for skate populations is exacerbated by their
K-selected life history strategy (e.g. slow development, low fecundity, long longevity,
and late age-at-maturity) that makes them vulnerable to PRM as bycatch in the
commercial fishing industry (e.g. Waring, 1984; Hoening and Gruber, 1990; Sulikowski
et al., 2003). Despite these issues there is still a lack of PRM information in the U.S, with
the majority of research taking place in other geographical regions and with different
species. Reports of short-term mortality from these studies vary from 3 to 59% and can
be species-specific and dependent upon gear-type and other relevant technical (e.g. tow
duration and catch biomass), biological (e.g. size), and environmental (e.g. air
temperature) factors (e.g. Benoît, 2006; Enever et al., 2009; Benoît et al., 2010, 2012;
Mandelman et al., 2013; Depestele et al., 2014). The sole investigation of skate PRM in
the U.S. was performed in the Northwest Atlantic Ocean (NWAO) and was focused on
the commercial otter trawl fishery (Mandelman et al., 2013).
Fisheries in the U.S. NWAO are responsible for nearly 96% (~ 69 million lbs.) of
the total U.S. skate bycatch. Of these fisheries, the New England (NE) scallop dredge
fishery has the second highest discard rate (~ 26 million lbs. of skate discarded annually;
NMFS 2014), making this gear-type a critical PRM concern for management and
conservation. This concern is amplified given the need for effective management in the
most valuable fishery in the U.S. NWAO, with an estimated ex-vessel value of over 467
million U.S. dollars in the 2013 fishing year. Thus, the primary objective of this study
was to quantify PRM rates of the three most commonly captured skate species (little
skate, Leucoraja erinacea; winter skate, Leucoraja ocellata; barndoor skate, Dipturus
laevis) using extended holding periods in a novel on-deck tank system equipped with a
refrigerated seawater system (Knotek et al., 2015). The secondary objective of this study
was to evaluate the variety of factors (e.g. tow duration, depth, catch biomass, sex, size)
that could influence PRM and formulate a best practice framework to reduce mortality in
the fishery.
2. Methods 2.1. Study overview PRM trials were performed aboard four commercial scallop-fishing vessels (Fishing
Vessels: F/Vs “Weatherly”, “Ranger”, “Araho”, and “Resolution”) that ranged in length
from 95 to118 ft. Data were collected over six seven-day cruises on Georges Bank and
waters offshore of Long Island, New York, USA (NW Atlantic). These research trips
occurred from May to September in 2012 and 2013. Fishing was conducted under normal
fishing conditions and practices, using standard 4-inch ring commercial scallop dredges
with a dredge width of 15 to 15.5 ft and 10-inch square mesh twine tops. Bottom
seawater and air temperatures ranged from 8.3 to 13.0°C and 8.7 to 23.6°C, respectively.
The gradient between bottom seawater and air temperatures ranged from 0.4 to 12.5°C.
Fishing was conducted on soft (i.e. sand) substrate.
2.2. Fishing research protocol A total of 295 tows were conducted during the six research cruises. Tow speed was
approximately 4.5 to 5.0 knots. During each trip, tow duration (10 – 90 min) was
randomized to account for variations in tow length (minimum and maximum) that are
typically observed in the scallop fishery. Bottom seawater and air temperature profiles
were recorded with HOBO temperature loggers (Onset Computer Corporation, Bourne,
MA, USA) fastened to the scallop dredge and positioned on-deck. Catch biomass was
recorded as the number of scallop bushels collected by deck hands (i.e. harvesting
scallops).
2.3. Post-release mortality experiment

All catch from experimental tows was deposited on deck and culled by commercial
fishermen for harvestable scallops, after which a subsample of the remaining skates (i.e.
discards) were sampled. The exception was for skates that were captured in short duration
tows (<10 min), which were sampled immediately and quickly placed in refrigerated
seawater once the dredge was recovered such that they could serve as minimally harmed
experimental “controls”.
To account for variations in air exposure, exposure times for skates other than the
control subject were varied from 0 to 30 min (maximum duration seen in fishery).
Exposure time was the time the dredge was removed from the water to the time skates
were sampled and either released to the sea or to the deck tanks (explained further in
Section 2.3.2). Sampling of individual skates involved an assessment of reflex
impairment and physical injury (see methods Section in 2.3.1), recording of the species,
sex, and total length (TL, cm) and tagging with a coded dart tag (Floy Tag & Mfg. Inc.,
Seattle, WA, USA)
2.3.1. Health indicators Skates were scored based on reflex impairment and physical trauma indices (i.e. health
indicators). Five reflexes were selected for this study using a modified approach from
Davis (2007). To validate the use of individual reflexes, preliminary testing was
conducted on control skates (i.e. healthy and unstressed) at the University of New
England Marine Science Center under the protocol described by Davis (2010). These
skates were kept in a 186 × 104 × 63 cm holding tank equipped with a flow-through (38
L min-1 turnover rate) seawater system. Skates were fed daily ad libitum throughout the
experiment. To determine the appropriate reflexes (i.e. consistently present in control
skates), skates were tested for the same ten reflexes every seven days, throughout July of
2012. The five most consistent reflexes (Table 1) were then chosen for the reflex
impairment index that would be used in the field PRM trials.
At-sea, each reflex was tested individually and conservatively scored as present or
absent, such that the reflex in question was considered absent when any doubt in the
response existed (reducing any observer biases). Reflex impairment was evaluated
immediately upon handling and took approximately 30 seconds per animal. Each skate
was then assessed using a categorical injury code (1-3) developed by Mandelman et al.
(2013) to determine the degree of overt physical trauma (Table 2, Fig. 1).
2.3.2. Holding tank trials A subsample of skates (representative of the ranges of air exposure and health indicators)
were transferred into one of six on-deck holding tanks (Promens Saint John Inc., Saint
John, New Brunswick, Canada; Model: MS1400; internal dimensions: 110 cm × 96 cm ×
80 cm) following evaluation (described in Section 2.3) and held for 2 to 118 hours (Fig.
2). Tanks were equipped with a flow-through, refrigerated seawater system (Knotek et
al., in review) that cooled surface intake water to mimic bottom water temperatures.
Although species and number of skate varied within each tank, biomass was kept
constant (i.e. ~8-10 smaller individuals; ~2-4 larger individuals). Tanks were monitored
every six-hours and if a mortality was observed, the individual was removed and replaced
with a skate from subsequent tows. Following 72-hour trials, mortality was recorded and
living skates were re-evaluated using the aforementioned health indicators, before being
released.
2.4. Analysis The data recorded for each skate consisted of tow-specific fishing conditions and
practices, initial health indicator scores, and the elapsed time until mortality (i.e.
uncensored) or live release (i.e. right-censored) if the skate was selected for holding tank
trials. The later form of longitudinal data (i.e. time interval) was considered right-
censored because we are unable to make inferences regarding their survival beyond the
observation period in holding tanks. A survival analysis was therefore used in this study
for its ability to accommodate our longitudinal data and model the probability of survival
as a function of time (e.g. Cox and Oakes, 1984; Benoît et al., 2012, 2015). In addition,
survival was modeled specific to health indicators, given our belief that injury and reflex
scores have the ability to integrate the various fishing conditions and practices, and
individual traits that affect survival (Anderson and Phillips, 1981; Agresti, 2002, pp. 277-
279; Wood et al., 1983; Davis, 2002; Broadhurst et al., 2006). The effect of these factors

on health indicators was therefore considered in separate analyses. All analyses were
performed separately for each species and
2.4.1. Health indicators ability to predict survival The data recorded for each skate consisted of the initial health indicator scores and the
elapsed time until mortality (i.e. uncensored) or live release from holding tanks (i.e. right-
censored). The later form of longitudinal data was considered right-censored because we
are unable to make inferences regarding their survival beyond the observation period in
holding tanks. A survival analysis was therefore used in this study for its ability to
accommodate our longitudinal data and model the probability of survival as a function of
time (e.g. Cox and Oakes 1984; Benoît et al. 2012, 2015).
To validate reflex impairment and injury code as suitable predictors for
intraspecific short-term survival, we used a mixed-effects Cox proportional-hazards
model (CPHM; Cox, 1972; Therneau and Grambsch, 2000). This model is defined as:
ℎ�(𝑡𝑡) = ℎ0(𝑡𝑡)exp (X′𝛽𝛽 + Z′𝑏𝑏) (1) where ℎ�(𝑡𝑡) is the estimated hazard function, instantaneous probability of mortality at
time 𝑡𝑡, which is a function of a baseline hazard function ℎ0(𝑡𝑡), a vector of covariates X′
(i.e. five reflexes and injury code) and a Gaussian random effect 𝑍𝑍′ (i.e. tow-specific).
This class of survival analysis is semi-parametric in that it makes no assumption about
the shape of ℎ�(𝑡𝑡) (i.e. baseline hazard function), but assumes that the ratio of hazards for
two individuals is constant over time and is a function of covariates. The CPHM was
therefore first used to validate which health indicators were suitable for each species (i.e.
best set of covariates). Partial maximum likelihood was used to estimate parameters
(Cox, 1972; Ripatti and Palmgren, 2000).
Model building began by fitting a fully saturated (i.e. all relevant covariates)
mixed-effect CPHM (Eq. (1)). To determine if the random effect was appropriate, a
likelihood ratio statistic was computed against a chi-squared distribution and resulting P-
value corrected for boundary testing. If the random effect was not significant (P < 0.05),
the model was built using fixed-effects CPHM, whereas mixed-effects CPHMs were used

in other scenarios. To find the most parsimonious set of health indicators, model selection
followed protocol from Benoît et al. (2010). Based on this protocol the covariates were
incrementally added to the intercept-only model and compared using Akaike’s
Information Criterion corrected for small sample sizes (AICc; Burnham and Anderson,
2002). An additional covariate to the candidate model was only retained if the model
ΔAICc ≥ 3 unit reduction. For models that had an equal amount of covariates but
different compositions, if the ΔAICc was ≤ 3, the models were considered equally
plausible and both were retained. Following this analysis we performed formal log-rank
tests to assess the differences in survival curves as a function of the selected health
indicator scores, and in cases where there was no statistical difference between curves (P
< 0.05), the data was combined for the purpose of our survival analysis. All data were
analyzed using R 3.1.0 (R-Core Development, 2014).
2.4.2. Predicting short-term survival based on health indicators To estimate the survival of each species as function of time for a given response level
(i.e. based on the combination of health indicators selected previously in Section 2.4.1)
we used CPHMs. Model fits were then compared to the empirical Kaplan-Meier survival
curve (KM; Kaplan and Meier, 1958), which is a solely a function of the data as it
follows the proportion of individuals alive within each time interval during the holding
tank trials. For KM curves, the probability of survival within each time interval 𝑖𝑖 is
defined as:
�̂�𝑆(𝑡𝑡) = ∏𝑡𝑡𝑖𝑖 ≤ 𝑡𝑡 �𝑛𝑛𝑖𝑖−𝑚𝑚𝑖𝑖
𝑛𝑛𝑖𝑖� (2)
where �̂�𝑆(𝑡𝑡) is the probability of survival at time 𝑡𝑡, 𝑛𝑛𝑖𝑖 is the number of skates at risk of
mortality within the time interval 𝑖𝑖, and 𝑚𝑚𝑖𝑖 is the number of mortalities during 𝑖𝑖.
2.4.3. Estimating short-term using fishery-scale observations To estimate the species-specific short-term survival for the larger sample of skate
discarded during the study (i.e. more representative of fishery-scale conditions) we
combined the injury and reflex impairment scores selected in Section 2.4.1 with survival
rates estimated with CPHMs (Eq. (1)). Predictions of survival were made up until 72
hours and Monte Carol simulations based on bootstrapping were used to estimate the
variation in survival rate (Efron and Tibshirani, 1993, Benoît et al., 2012). In each
individual Monte Carlo iteration, tows were sampled with replacement from the data to
capture uncertainties of selecting each tow for observation. Furthermore the individuals
within each selected tow were sampled with replacement, to also account for
uncertainties of selecting an individual for health indicator assessment. See Benoît et al.
(2012) for additional details.
2.4.4. Factors potentially influencing mortality The effect of fishing conditions and practices and individual traits (Table 3) on injury and
reflex indices were estimated using different modeling techniques because of the varying
nature in ranking of the data and belief that both indices likely affect mortality via
different underlying mechanisms (i.e. physical trauma vs. physiological stress). The
inherent ranking within ordinal injury scores led to our choice of a multinomial
proportional-odds model (POM) based on cumulative logits (e.g. Benoît et al., 2010). In
addition, a random effect term was included to account for subjectivity in scoring by
different researchers and possible within-tow correlations (e.g. Pinheiro and Bates, 2000;
Hartzel et al., 2001; Sheu, 2002; Zuur et al., 2009) due to the clustered nature of the data
(i.e. large numbers of each species of skate within a single tow). This model is defined as:
logit�𝑃𝑃�𝑌𝑌𝑖𝑖𝑖𝑖 ≤ 𝑣𝑣�X′
𝑖𝑖𝑖𝑖,𝑢𝑢𝑖𝑖�� = 𝛼𝛼𝑣𝑣 + X′𝑖𝑖𝑖𝑖𝛽𝛽 + 𝑢𝑢𝑖𝑖, where 𝑢𝑢𝑖𝑖~𝑁𝑁(0,𝜎𝜎2) (6) where 𝑌𝑌𝑖𝑖𝑖𝑖 is the observed injury code for a skate 𝑗𝑗 captured in tow 𝑖𝑖, 𝑣𝑣 is the injury score,
𝛼𝛼𝑣𝑣 is intercept for each level of injury, X′𝑖𝑖𝑖𝑖 is the covariate design matrix, 𝛽𝛽 is the vector
of parameters values for the covariates, and 𝑢𝑢𝑖𝑖 is the random effect drawn from a normal
distribution with a mean of zero and variance 𝜎𝜎2 (Agresti, 2002, pp. 275-277; Carrière
and Bouyer, 2006). For 𝛼𝛼𝑣𝑣, only two values can be estimated because 𝑃𝑃(𝑌𝑌𝑖𝑖 ≤ 3) must
equal one, and therefore only two distinct probabilities can exist. 𝑃𝑃�𝑌𝑌𝑖𝑖𝑖𝑖 ≤ 𝑣𝑣�X′𝑖𝑖𝑖𝑖,𝑢𝑢𝑖𝑖� is
the probability that the observed injury score for a skate is less than or equal to the injury
score 𝑣𝑣, conditional on the covariates and random effect. The model was fit using the
adaptive Guass-Hermite quadrature approximation to integrate across the random effects
(Pinheiro and Bates, 1995; Hartzel et al., 2001) and the Newton-Raphson method was
used to maximize the likelihood and find estimates of the parameters.
Model building started with fitting a fully saturated model with all relevant fixed
effects (i.e. those that had the potential to influence physical trauma), which included tow
duration, depth, catch biomass, sex, and TL. To determine if the random effect was
appropriate we used the procedure previously described for CPHMs, and subsequently to
find the most parsimonious set of covariates to explain the variation in injury scores, we
used a forward selection process based on AICc as described above (refer to Section
2.4.1). The predicted responses from POMs are based on the ordering of injury-level
specific intercepts 𝛼𝛼𝑣𝑣, while the effect of the covariate is based upon a common slope
across injury levels. To determine if separate slopes for the effects of covariates on each
injury score were more appropriate than common slopes, we also fit generalized logits
models (Carrière and Bouyer, 2006) for the covariates retained in the best-fit POM
following the approach used by Benoît et al. (2010). Generalized logits and proportional
odds models were compared using AICc.
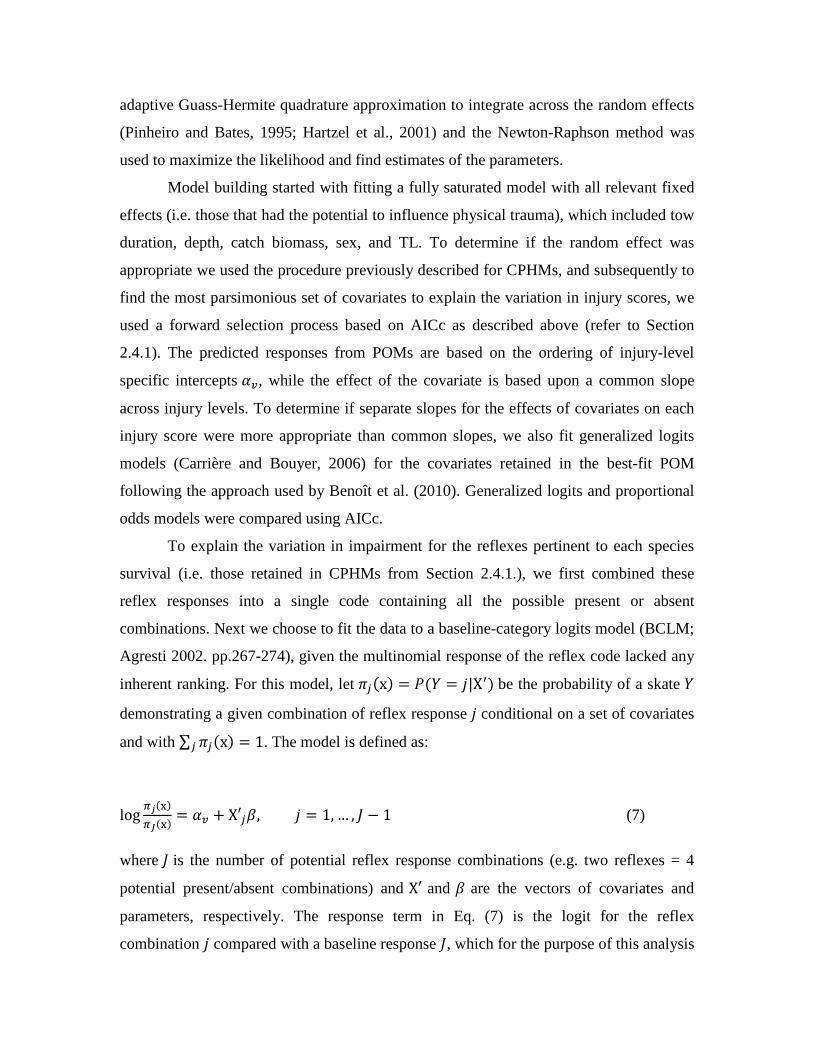
To explain the variation in impairment for the reflexes pertinent to each species
survival (i.e. those retained in CPHMs from Section 2.4.1.), we first combined these
reflex responses into a single code containing all the possible present or absent
combinations. Next we choose to fit the data to a baseline-category logits model (BCLM;
Agresti 2002. pp.267-274), given the multinomial response of the reflex code lacked any
inherent ranking. For this model, let 𝜋𝜋𝑖𝑖(x) = 𝑃𝑃(𝑌𝑌 = 𝑗𝑗|X′) be the probability of a skate 𝑌𝑌
demonstrating a given combination of reflex response 𝑗𝑗 conditional on a set of covariates
and with ∑ 𝜋𝜋𝑖𝑖(x)𝑖𝑖 = 1. The model is defined as:
log 𝜋𝜋𝑗𝑗(x)
𝜋𝜋𝐽𝐽(x) = 𝛼𝛼𝑣𝑣 + X′𝑖𝑖𝛽𝛽, 𝑗𝑗 = 1, … , 𝐽𝐽 − 1 (7)
where 𝐽𝐽 is the number of potential reflex response combinations (e.g. two reflexes = 4
potential present/absent combinations) and X′ and 𝛽𝛽 are the vectors of covariates and
parameters, respectively. The response term in Eq. (7) is the logit for the reflex
combination 𝑗𝑗 compared with a baseline response 𝐽𝐽, which for the purpose of this analysis

was unimpaired (i.e. all reflexes present) reflex combination. A random effect was not
considered in this analysis because we felt the nature of the data (i.e. reflexes scored on a
present or absent scale) would reduce bias and produce a very small observer effect. This
is in contrast to injury code, where there subjectivity could exist in choosing between
adjacent categories (i.e. a more pronounced observer effect). Any remaining random
effect in this analysis would therefore be due to data clustering and unobserved factors.
This can be important when the number of observations in a cluster (i.e. within each tow)
is relatively large, while the number of cluster is modest. However in this study the
number of skates sampled in each tow was modest compared to the much larger number
of tows, which suggests that random effect is less important for this analysis. Maximum
likelihood estimation was used to fit the BLCM (Agresti, 2002, pp. 272-274).
A forward selection process based on AICc values was used to find a
parsimonious set of covariates to explain variation in reflex responses. The set of
covariates considered in the BLCM consisted of tow duration, depth, catch biomass, air
exposure duration, temperature differential, sex, and TL, all of which were considered to
have potential to comprise the physiological state of a skate (i.e. influencing reflex
responses; Raby et al., 2012). To evaluate the fit of our final model we compared the
predicted response probabilities with field observations of reflex responses binned into
six bins of equal size (based on the appropriate covariate). Predictions of reflex response
probabilities were obtained via the logit-transformation (Agresti, 2002, pp. 271-272) of
Eq. (7):
𝜋𝜋𝑖𝑖(x) =exp (𝛽𝛽′𝑗𝑗X)
∑ exp (𝛽𝛽′ℎX)𝐽𝐽ℎ=1
, where 𝛽𝛽𝐽𝐽 = 0 and 𝑗𝑗 = 1, … , 𝐽𝐽 (8)
To obtain confidence intervals for the predicted probabilities from Eq. (8) we performed
an empirical bootstrap (Efron and Tibshirani, 1993) with tows sampled with replacement
from the population.
3. Results In this study a total of 4216 skates were evaluated (little skate: n = 2634; winter skate: n
= 1313; and barndoor skate: n = 269), with a subsample of 334 skates (little skate: n =

179; winter skate: n = 116; and barndoor skate: n = 39) held in holding tanks for PRM
trials.
3.1. Post-release mortality with respect to health indicators 3.1.1. Health indicators ability to predict short-term post-release mortality The best-fit CPHMs for little and winter skate retained the same set of health indicators:
injury code and back fly and gag reflex impairments (Table 5). Injury scores 1 and 2 for
both species were combined for the remainder the survival analysis, given there were
little to no statistical difference in survivorship (little skate: χ2 = 5.3, df = 1, p = 0.02,
winter skate: χ2 = 1.6, df = 1, p = 0.206) or hazard ratios between each level (little skate:
p = 0.26; winter skate: p = 0.31; Table 5). No health indicators were retained in the best-
fit model for barndoor skate (i.e. intercept-only model supported) and therefore we were
unable to predict PRM as function with health indicators for this species.
3.1.2. Post-release mortality during holding tank trials The CPHM survival estimates varied between both little and winter skate and for initial
health indicator scores (Fig. 3). Estimates of survival ranged from 82.9 to 6.1% (Fig. 3A,
C) and 95.9 to 4.9% (Fig. 3B, D) for little and winter skate, respectively, with increasing
physical trauma and added reflex impairment negatively impacting the probability of
survival. For these species, CPHMs fit the KM survival curves reasonably well for larger
sample sizes (i.e. n > 10), but when sample sizes for a given health indicator combination
were low it was difficult to compare the model fit because the KM curves are an inverse
function of sample size. Barndoor skate survival was analyzed using only the empirical
KM survival curve (i.e. since health indicators were not appropriate predictors) and
resulted in an overall 11.2% probability of survival (Fig. 4).
3.1.3. Estimating short-term PRM with fishery-scale observations of health indicators The overall trend in the proportion of skate observed in each injury code was similar for
each species (Table 6), such that lowest proportions were seen for little to no injury (code
1) and highest for moderate (code 2). For reflex impairment, little and winter skate were
found to have a comparable trend with impaired back fly and unimpaired gag reflex as

the most common, followed by both reflexes unimpaired (Table 6). Whereas barndoor
skate observations displayed highest proportions for complete reflex impairment and an
impaired back fly and unimpaired gag reflex (Table 6).
The average estimated short-term survival rate (up to 72-hours) for skate was
species-specific. Winter skate had a higher rate of survival than little skate (65.2% ± 0.05
and 49.1% ± 0.03, respectively; Table 7) and although we were unable to estimate PRM
for barndoor based on health indicators, the higher observed proportion of impaired
individuals (Table 6) suggests that mortality would likely be low.
3.2. Factors potentially influencing health indicators and post-release mortality 3.2.1. Barndoor-specific No covariates (including the random effect term) produced a reduction in AICc large
enough for selection in the final CPHM for barndoor skate (Table 8). This is likely due to
an overall small sample size for this species (n = 39). Barndoor were not included in the
following results because injury code was not selected in the plausible CPHM (Section
3.1.1).
3.2.2. Injury code The random effect term was not significant for either little or winter skate in the fully
saturated covariate POMs. The final POMs for these skate species indicated that tow
duration had a significant effect on the level of injury, while the POM for little skate also
retained the depth covariate (Table 9). Tow duration had the largest effect size (relative
risk) for winter skate injury, whereas depth was more influential for little skate. Tow
duration was found to have a negative impact on the injury code (i.e. extended tow
durations increased the probability of having a higher degree of physical trauma) for both
little and winter skate (Table 9; Fig. 5A-D), while depth had a positive impact on little
skate injury (Table 9; Fig. 5A-C) with greater physical trauma observed at shallower
depths (e.g. Fig. 5A) than at depth (e.g. Fig. 5C). POMs for both species were considered
to fit the data well based upon comparisons of predicted probabilities (contingent on final
POMs and selected covariates) and observed proportions of skate with each injury code
for each species (little skate: Fig. 5A-C; winter skate: Fig. 5D). There was no evidence to

support generalized logits models (i.e. separate slopes specific to each injury code) for
any covariate in finals models for either species (Table 9).
3.2.3. Reflex impairment The final BCLMs for little and winter skate both suggested that tow duration had a
significant effect on reflex impairment. In addition, temperature gradient and tow depth
were retained for the little skate model, while the winter skate BCLM selected for deck
duration. Tow duration had an overall similar effect on both species (regardless of
varying levels of other covariate effects; Fig. 6, 7) with an increase in tow duration
leading to further reflex impairment (i.e. from unimpaired to completely impaired). In
addition, the reflex combination of an unimpaired back fly and impaired gag response
was the least likely for both species (Fig. 6, 7), regardless of the scenario. For little skate,
increases in temperature gradient led to a lower probability of a completely unimpaired
individual, a higher probability of an impaired back fly and present gag reflex, and
relatively no change in the likelihood of the other reflex combinations (Fig. 6A-C).
Moreover for little skate, an increase in tow depth causes a higher probability for an
impaired back fly and present gag reflex, while the odds of complete impairment
decrease, and there is little to no effect on the other combinations (Fig. 6D-F). In the
winter skate BCLM, extended bouts of aerial exposure led to an increased overall reflex
impairment, while the trend of the combination present back fly and impaired gag
response (i.e. as tow duration lengthens there is an increase followed by a decrease in
probability) shifted towards shorter tow durations (Fig. 7A-C). The unimpaired back fly
and absent gag reflex combination was relatively unaffected by variations in air exposure.
BCLMs for both species fit the data reasonably well based on comparisons of predicted
and observed probabilities of a skate exhibiting a certain reflex combination (little skate:
Fig. 6, winter skate: Fig. 7), however low sample sizes within given bins of covariates led
to some uncertainty. Correlations between predicted and observed combinations for both
species models were intermediate (little skate: 0.39; winter skate: 0.41).
4. Discussion 4.1. Post-release mortality of discarded skates The use of health indicators (e.g. vitality, condition, injury, and reflex impairment
indices) on fish to prior to release has become increasingly well established in literature
as an effective tool for predicting PRM of discards in both teleosts and elasmobranchs
(Laptikhovsky, 2004; Enever et al., 2009; Humborstad et al., 2009; Barkley and Cadrin,
2012; Benoît et al., 2012; Mandelman et al. 2013; Raby et al. 2012; Depestele et al.,
2014; Gallagher et al., 2014). The advantage to this technique is that once proven for a
given species and fishery (via tagging or extended holding trials) it becomes a simple and
inexpensive way to expand research efforts across broader scales of time and space, to
better understand how the various fishing conditions and practices affect survival (Benoît
et al., 2010, 2012).
In this study we determined that injury and reflex impairment indices were
appropriate for modeling the survival of discarded skate. Previous studies have shown
that injury codes based on overt physical trauma can effectively predict skate survival
(Mandelman et al., 2013; Depestele et al., 2014), while other studies have used pseudo-
reflex impairments (e.g. levels of overall body movement) incorporated into a vitality
index (Benoît et al., 2010) as another effective measure. The present study, however, is
the first occasion where individual reflexes have shown a proven relationship with PRM
for skate. By combining these two health indicators we are able to evaluate mortality
from a physical trauma (i.e. injury code) and physiological standpoint (i.e. reflex code),
given that reflex impairment serves as a proxy for a comprised physiological state (Raby
et al., 2012).
Estimates of short-term survival (via rates associated health indicators) applied to
field observations suggest that species-specific differences in PRM exist in the scallop
dredge fishery. Barndoor skate are likely most susceptible to capture and handling (PRM
upwards of 90%, however this is based only upon the KM method), while little skate
have a moderate capacity to deal with these fishing pressures (PRM of 51%), and winter
skate are the most resilient (PRM of 35%). Species-specific survival rates for skates
(Rajidae) within a given fishery have also been reported from demersal trawlers in the

Bristol Channel (Enever et al., 2009), as well as for little and winter skate captured by
otter-trawl in the NW Atlantic (Mandelman et al., 2013). In the later study, winter skate
were also found to be more robust to the rigors of capture than little skate (PRM of 9 and
22%, respectively). However, little and winter skate exhibit nearly a two and four-fold
increase in mortality when captured in the scallop dredge fishery. It is possible that the
inflation in PRM is an artifact of increased deck durations during sampling (otter-trawl:
10 min; scallop dredge: 10-30 min) that have also been attributed to more dramatic rises
in mortality for winter skate captured in the Canadian trawl fishery (PRM of 50%, deck
duration: 1-2 hours; Benoît, 2006). Discard PRM has also been reported as highly
dependent upon gear type (Chopin and Arimoto, 1995; Davis, 2002) and in this scenario
we can directly compare the physical trauma in the otter-trawl and scallop dredge,
because the injury code used for these study was identical. As such, the proportion of
individuals in worse condition (i.e. injury codes 2 and 3) nearly doubles in the scallop
dredge fishery for both little (.35 to .78) and winter (.39 to .81) skate. Therefore, the
increase in physical trauma (and subsequent inflation of mortality) may be attributed to
the steel infrastructure and metal rings of the dredge, as opposed to the softer and less
abrasive twine of the otter-trawl gear.
This study also revealed differences in survivorship in little and winter skate
across varying levels of injury and reflex impairment (Fig. 3A-D). For example, both
species experienced increases in PRM as physical condition deteriorated (i.e. higher
injury codes). This trend has been well documented for skates (Benoît et al., 2012;
Mandelman et al. 2013; Depestele et al., 2014) and other elasmobranchs (Hueter and
Manire, 1994; Campana et al., 2009; Braccinni et al., 2012). Mortality was also shown to
increase for little and winter skate as reflexes impairment increased (with an absent gag
reflex associated with a higher PRM than an impaired back fly). As mentioned earlier, the
relationship between reflexes and survival has not yet been reported for skates in any
fishery, however other studies have shown that added impairment to reflexes in
elasmobranches can lead to lower survivorship (Gallagher et al., 2014).
4.2. Factors influencing health indicators and survival

The impact of fishing conditions and practices and individual traits on the health
indicators for skate was evaluated across a wide range of conditions (Table 3) that were
typical to the standard scallop dredge fishing operations. The relative impact of these
factors on injury and reflex impairment is therefore providing a more realistic view of the
mechanisms driving differences in PRM.
Tow duration had the most consistent influence on little and winter skate health
indicators, however because we were unable to pinpoint the exact time skate entered the
dredge and therefore the duration each animal was exposed to the capture event, the
actual impact is inherently limited (Neilson et al., 1989). Despite this limitation the
overall effect of tow duration was consistent for both species, with extended tows
producing higher injury codes (Fig. 5), added reflex impairment (Fig. 6), and increased
mortality. This positive relationship has also been reported for little and winter skate in
the NW Atlantic otter-trawl fishery (Mandelman et al. 2013), as well as for other species
of skate (Cedrola et al., 2005; Enever et al., 2009). The impact of tow duration on
observed injuries for little skate also appeared to vary by depth (most pronounced impact
in shallowest waters; Fig. 5A). Increases in fishing depth were also associated with less
physical damage and reflex impairment, and lower mortality rates in little skate. For fish
with physoclistous swim bladders such as Atlantic cod, Gadus morhua (e.g. Benoît et al.,
2010), rapid changes in depth that occur during capture can lead to barotrauma and
potentially mortality, however, skate lack a swim bladder and are therefore not likely to
succumb to this scenario (e.g. Milliken et al., 1999; Mandelman and Farrington, 2007;
Mandelman et al. 2013). The impact of depth on little skate observed in this study
requires further investigation to understand the mechanism, but it is possible that fishing
a shallower depth alters the behavior of the dredge in such a way that it intensifies the
physical interaction and physiological stress of a captured animal.
Reflex impairment for little skate was also influenced by changes in temperature
gradient (between bottom seawater and air temperatures experienced on deck), such that
steeper gradients led to additional impairment and consequent mortality. This relationship
characterized previously by Cicia et al. (2012) suggests that acute temperature increases
from water to air (ΔT= + 9°C) accompanied by bouts of aerial exposure can lead to
physiological perturbations, inhibiting reflexes (Davis, 2007; Raby et al., 2012), and

inflating PRM. The temperature gradient observed for little skate in this study range from
0.5 to 12.5°C, corroborating with the findings of Cicia et al. (2012). Mandelman et al.
(2013) found a similar trend in temperature change for winter skate in the otter-trawl
fishery. Extended periods of time left on deck were also shown to increase reflex
impairment in winter skate. This relationship is frequently observed for teleosts and
elasmobranchs and is a product of the gill lamellae collapsing during aerial exposure,
which inhibits gas exchange (Ferguson and Tufts, 1992) and leads to physiological
disturbances that are additive with time, disrupting normal reflex response, and
increasing the probability of delayed mortality (Gingerich et al., 2007). Other influential
factors that have been reported for skate species in other fisheries include sex (winter
skate, Mandelman et al., 2013); catch biomass (skate (Rajidae), Benoît et al., 2010); and
length (skate (Rajidae), Depestele et al., 2014).
4.3. Holding tank limitations and considerations
The effective estimation of discard mortality of skate using holding periods in on-deck
aquaria (such as this study) is an appropriate and commonly used technique in
commercial fisheries, however careful consideration must be involved in study design
and interpretation of results. For example, confinement within holding tanks can
exacerbate post-capture and handling stress when the experiment is unable to best mimic
natural conditions (e.g. temperature, pressure, or stocking densities), which can then lead
to artificial mortality (Broadhurst et al., 2006; Portz et al. 2006). To validate the use of
our holding tank and technique, Knotek et al. (2015) reported that the tank system was
effectively able to mimic bottom temperature regimes and that the flow-through
configuration of the system ensured appropriate water conditions throughout holding
trials (e.g. dissolved oxygen). Furthermore, while some flow-through systems violate the
assumption of independence between replicates because of a single-flow design
throughout multiple tanks (van Beek et al., 1990; Kaiser and Spencer, 1995), our system
has separate flow-through for each of the six tanks (i.e. providing a replicate tank design).
Factors that we cannot account for within this study design include the added risks of
predation and disease upon discarding.

4.4. Implications for management and conclusions Based upon the various factors that influence survival for skate captured in the scallop
dredge fishery, limitations on extended tow durations (upwards of 90 min) would likely
be the best candidate to consider if put into a best-practice framework for reducing
overall skate discard mortality. If additional concern were to be placed on little skate,
fishing restricted to times of the year when the water column is well mixed and the
temperature gradient is minimal, would likely further decrease mortality for this species.
Reducing deck duration by prioritizing both culling of the pile and the immediate return
of discards would also increase survival of winter skate. More research (i.e. increased
sample size) must be performed on barndoor skate, to better understand the mechanisms
driving what appears to be the highest PRM of any of the captured skate species in the
NW Atlantic.
5. Communication of Results 5.1. Presentations Benoît HP, Capizzano CW, Knotek RJ, Dean MJ, Goldman KJ, Mandelman JW,
Rudders DB, Sulikowski JA. 2014. A generalized model for longitudinal short
and long-term mortality data for commercial fishery discards and recreational
fishery catch-and-releases. ICES Workshop on Methods for Estimating Discard
Survival. Copenhagen, Denmark.
Knotek RJ, Rudders DB, Mandelman JA, Benoît HP, Sulikowski JA. 2014. The survival
of rajids discarded in the New England scallop dredge fishery. In: Annual
Meeting of American Fisheries Society; August 17 – August 21; Quebec, QC,
Canada.
Knotek RJ, Rudders DB, Mandelman JA, Benoît HP, Sulikowski JA. 2014. The survival
of rajids discarded in the New England scallop dredge fishery. In: Joint Meeting
of Ichthyologists and Herpetologists; July 30 – August 3; Chattanooga, TN, USA.

Knotek RJ, Rudders DB, Mandelman JA, Benoît HP, Sulikowski JA. 2014. The survival
of rajids discarded in the New England scallop dredge fishery. In: Northeast Fish
and Wildlife Conference; April 13 - April 15; Portland, ME, USA.
Knotek RJ, Rudders DB, Mandelman JA, Benoît HP, Sulikowski JA. 2014. The survival
of rajids discarded in the New England scallop dredge fishery. In: Annual
Meeting of American Fisheries Society Southern New England Division; January
29; Hadley, MA, USA.
5.2. Published works Benoît HP, Capizzano CW, Knotek RJ, Rudders DB, Sulikowski JA, Dean MJ, Hoffman
WS, Zemeckis DR, Mandelman JW. 2015. A generalized model for longitudinal
short and long-term mortality data for commercial fishery discards and
recreational fishery catch-and-releases. ICES Journal of Marine Science.
Knotek RJ, Gill SM, Rudders DB, Mandelman JW, Benoît HP, Sulikowski JA. 2015.
The development of a refrigerated flow-through seawater system for at-sea
operation and estimation of post-release mortality. In press: Fisheries Research
Journal
Knotek RJ, Rudders DB, Mandelman JA, Benoît HP, Sulikowski JA. The survival
of rajids discarded in the New England scallop dredge fishery. In prep.
5.3. Non-published works
Knotek RJ, Rudders DB, Mandelman JW, Sulikowski JA. September 2013.
Fisherman, scientists investigate skate mortality in scallop dredges. Commercial
Fisheries News 41(1): 10 & 38.

Literature Cited
Agresti, A. 2002. Categorical data analysis. 2nd ed. John Wiley and Sons Inc., Hoboken,
New Jersey.
Alverson, D.L., Freeberg, M.H., Murawski, S.A., Pope, J.G. 1994. A global assessment
of fisheries bycatch and discards, FAO Fisheries Technical Paper 339, 233 pp.
Food and Agriculture Organization of the United Nations, Rome, Italy.
Anderson, J.A., Philips, P.R. 1981. Regression, discrimination, and measurement
models for ordered categorical variables. Appl. Stat. 30, 22–31.
Barkley, A.S., Cadrin, S.X. 2012. Discard Mortality Estimation of Yellowtail Flounder
Using Reflex Action Mortality Predictors. Tran. Amer. Fish. Soc. 141:3, 638-644.
Benoît, H.P. 2006. Estimated discards of winter skate (Leucoraja ocellata) in the southern
Gulf of St. Lawrence, 1971–2004. In: DFO Can. Sci. Adv. Sec. Res. Doc.
2006/002.
Benoît, H.P., Hurlbut, T., Chassé, J., 2010. Assessing the factors influencing discard
mortality of demersal fishes in four fisheries using a semi-quantitative indicator
of survival potential. Fish. Res. 106: 436–447.
Benoît, H.P., Hurlbut, T., Chasse´, J., Jonsen, I.D. 2012. Estimating fishery-scale rates of
discard mortality using conditional reasoning. Fish. Res. 125–126: 318–330.
Benoît, H.P., Capizzano, C.W., Knotek, R.J., Rudders, D.B., Sulikowski, J.A., Dean.
M.J., Hoffman, W.S., Zemeckis, D.R., Mandelman, J.W. 2015. A generalized
model for longitudinal short and long-term mortality data for commercial fishery
discards and recreational fishery catch-and-releases. ICES Journal of Marine
Science.

Braccini, M., Van Rijn, J., Frick, L. 2012. High Post-Capture Survival for Sharks, Rays
and Chimaeras Discarded in the Main Shark Fishery of Australia. PLoS ONE
7(2): e32547. doi:10.1371/journal.pone.0032547
Broadhurst, M.K., Suuronen, P., Hulme, A. 2006. Estimating collateral mortality from
towed fishing gear. Fish Fish. 7: 180–218.
Burnham, K.P., Anderson, D.R. 2002. Model Selection and Multimodel Inference: A
Practical Information Theoretic Approach, 2nd ed. Springer-Verlag, New York.
Campana, S.E., Joyce, W., Manning, M.J. 2009. Bycatch and discard mortality in
commercially caught blue sharks Prionace glauca assessed using archival satellite
pop-up tags. Mar. Ecol. Prog. Ser. 387: 241–253.
Carrière, I., Bouyer, J. 2006. Random-effect models for ordinal responses: application
to self-reported disability among older persons. Rev. Epidemiol. Sante Publique
54: 61–72.
Cedrola, P.V., Gonzalez, A.D., Pettovello, A.D. 2005. Bycatch of skates
(Elasmobranchii:Arhynchobatidae, Rajidae) in the Patagonian red shrimp fishery.
Fish. Res. 71: 141–150.
Chopin, F.S., Arimoto, T., Inoue, Y. 1996. A comparison of the stress response and
mortality of sea bream Pagrus major captured by hook and line and trammel net.
Fish. Res. 28: 277–289.
Cox, D.R. 1972. Regression models and life tables. J. R. Stat. Soc. B 34: 187–200.
Cox, D.R., Oakes, D. 1984. Analysis of Survival Data. Chapman and Hall Ltd, London.

Cicia, A.M., Schlenker, L.S., Sulikowski, J.A., Mandelman, J.M. 2012. Seasonal
variations in the physiological stress response to discrete bouts of aerial exposure
in the little skate, Leucoraja erinacea. Comp. Biochem. Physiol. A 162: 130–138.
Davis, M.W. 2002. Key principles for understanding fish bycatch discard mortality. Can.
J. Fish. Aquat. Sci. 59: 1834–1843.
Davis, M.W. 2007. Simulated fishing experiments for predicting delayed mortality rates
using reflex impairment in restrained fish. ICES J Mar Sci 64: 1535−1542.
Depestele, J., Desender, M., Benoît, H. P., Polet, H., Vincx, M. 2014. Short-term
survival of discarded target fish and non-target invertebrate species in the
“eurocutter” beam trawl fishery of the southern North Sea. Fish. Res. 154: 82–92.
Efron, B., Tibshirani, R. 1993. An Introduction to the Bootstrap. Chapman and Hall, NY.
Enever, R., Revill, A.S., Grant, A. 2009. Discarding in the North Sea and on the
historical efficacy of gear-based technical measures in reducing discards. Fish.
Res. 95: 40–46.
Ferguson, R.A., Tufts, B.L. 1992. Physiological effects of brief air exposure in
exhaustively exercised rainbow trout (Oncorhynchus mykiss): implications for
“catch and release” Fish. Can. J. Fish. Aquatic Sci. 49: 1157–1161.
Gallagher A.J., Serafy, J.E., Cooke, S.J., Hammerschlag, N. 2014. Physiological stress
response, reflex impairment, and survival of five sympatric shark species
following experimental capture and release. Mar. Eco. Prog. Ser. 496: 207-218.
Gingerich, A.J., Cooke, S.J., Hanson, K.C., Donaldson, M.R., Hasler, C.T., Sucki, C.D.,
Arlinghaus, R. 2007. Evaluation of the interactive effects of air exposure duration
and water temperature on the condition and survival of angled and released Fish.

Fish. Res. 86: 169–178.
Hartzel, J., Agresti, A., and Caffo, B. 2001. Multinomial logit random effects models.
Stat. Model. 1: 81–102.
Hall, M.A., Alversonà, D.L., Metuzals, K.I. 2000. By-catch: problems and solutions.
Mar. Pollut. Bull. 41: 204−219.
Hoenig, J.M., and Gruber, S.H. 1990. Life-history patterns in the elasmobranchs:
implications for fisheries management. NOAA Tech. Rep. NMFS, 90: 1–16.
Hueter, R.E., Manire, C.A. 1994. Bycatch and catch-release mortality of small sharks
in the Gulf coast nursery grounds of Tampa Bay and Charlotte Harbor. Mote
Marine Technical Report, No. 368, 183 pp.
Humborstad, O.B., Davis, M.W., Løkkeborg, S. 2009. Reflex impairment as a measure
of vitality and survival potential of Atlantic cod (Gadus morhua). Fish Bull. 107L
395–402.
Kaiser, M.J., Spencer, B.E. 1995. Survival of by-catch from a beam trawl. Mar. Ecol.
Prog. Ser. 126: 31–38.
Kaplan, E.L., Meier, P. 1958. Nonparametric estimation from incomplete observations. J.
Am. Stat. Assoc. 53: 457–481.
Knotek, R.J., Gill, S.M., Rudders, D.B., Mandelman, J.W., Benoît, H.P., Sulikowski, J.A.
2015. The development of a refrigerated flow-through seawater system for at-sea
operation and estimation of post-release mortality. In press: Fish. Res.
Laptikhovsky, V.V. 2004. Survival rates for rays discarded by the bottom trawl squid
fishery off the Falkland Islands. Fish. Bull. 102: 757–759.
Mandelman, J.W., Cicia, A.M., Ingram, G.W., Jr, Driggers,W. B., III, Coutre, K.M., and
Sulikowski, J.A. 2013. Short-term post release mortality of skates (family
Rajidae) discarded in a western North Atlantic commercial otter trawl fishery.
Fish. Res. 139: 76–84.
Mandelman, J.W., and Farrington, M.A. 2007. The estimated short term discard mortality
of a trawled elasmobranch, the spiny dogfish (Squalus acanthias). Fish. Res. 83:
238–245.
Milliken, H.O., Farrington, M., Carr, H.A., and Lent, E. 1999. Survival of Atlantic cod
(Gadus morhua) in the Northwest Atlantic longline fishery. Mar. Technol. Soc. J.
33: 19–24.
Neilson, J.D., Waiwood, K.G., Smith, S.J. 1989. Survival of Atlantic halibut
(Hippoglossus hippoglossus) caught by longline and otter trawl gear. Can. J. Fish.
Aquat. Sci. 46: 887–897.
Pinheiro, J.C., Bates, D.M. 2000. Mixed-effects Models in S and S-PLUS. Springer-
Verlag, NY
Portz, D.E., Woodley, C.M., Cech Jr., J.J. 2006. Stress-associated impacts of short-term
holding on fishes. Rev. Fish Biol. Fish. 16: 125–170.
R Core Team. 2015. R: A Language and Environment for Statistical Computing. R
Foundation for Statistical Computing, Vienne, Austria. http://www.R-project.org.
Raby, G.D., Donaldson, M.R., Hinch, S.G., Patterson, D.A. 2012. Validation of reflex
indicators for measuring vitality and predicting the delayed mortality of wild coho
salmon bycatch released from fishing gears. J. Appl. Ecol. 49: 90−98.

Ripatti, S., Palmgren, J. 2000. Estimation of multivariate frailty models using penalized
partial likelihood. Biometrics 56: 1016–1022.
Sheu, C.F. 2002. Fitting mixed-effects models for repeated ordinal outcomes with
the NLMIXED procedure. Behav. Res. Meth. Ins. Comput. 34: 151–157.
Sulikowski, J.A., Morin, M.D., Suk, S.H., Howell, W.H. 2003. Age and growth estimates
of the winter skate (Leucoraja ocellata) in the western Gulf of Maine. Fish. Bull.
101: 405–413.
Therneau, T.M., Grambsch, T.M. 2000. Modeling Survival Data: Extending the Cox
Model. Springer, New York.
Van Beek, F.A., Leeuwen, P.I., Rijnsdorp, A.D. 1990. On the survival of plaice and sole
discards in the otter trawl and beam trawl fisheries in the North Sea. Neth. J. Sea
Res. 26: 151–160.
Waring, G.T. 1984. Age, growth and mortality of the little skate off the northwest coast
of the United States. Trans. Am. Fish. Soc. 113: 314–321.
Weltersbach, M.S., Strehlow, H.V. 2013. Dead or alive—estimating post-release
mortality of Atlantic cod in the recreational fishery. ICES J. Mar. Sci.
70: 864–872.
Wood, C.M., Turner, J.D., Graham, M.S. 1983. Why do fish die after severe exercise? J.
Fish. Bio. 22: 189–201.
Zuur, A.F., Ieno, E.N., Elphick, C.S. 2009. A protocol for data exploration to avoid
common statistical problems. Methods Ecol. Evol. 1: 3–14.

Table 1. Description of stimulus and response for each reflex tested in the field. Reflex
impairment were conservatively assessed such that any doubt in response was considered
an impaired response.
Reflex Stimulus Response
Back fly Skate lifted by the base of tail Dorsal contraction of body and wings
Body flex Skate positioned dorsal side up and restrained with a hand on each pectoral wing
Active escape (e.g. muscle tension)
Gag Skate positioned ventral side up and 1/8” wooden dowel inserted into back of mouth
Extrusion of mouth forcing out probe
Spinal Skate positioned ventral side up and the abdominal cavity is massaged
Ventral contraction of wings and tail
Righting Skate is positioned ventral side up and released into holding tank
Actively righting itself within 10 seconds
Table 2. Description of injury code (based on overt physical trauma) developed by
Mandelman et al. (2012) that was used to assess pre-discarded skates.
Injury code Description
1 Little to no physical trauma (< 10 mm lacerations, no hemorrhaging or internal bleeding)
2 Moderate physical trauma (11-20 mm lacerations, slight to moderate hemorrhaging or internal bleeding)
3 Extensive physical trauma (>20 mm lacerations, extensive hemorrhaging or internal bleeding)

Table 3. Mean [minimum, maximum] values for potential explanatory variables
collected during each cruise the subsample of skates that were kept in holding tanks for
mortality trials.
Variable May 20 – May 25
Jun 23 – Jun 31
Jul 23 – Jul 31
Aug 27 – Sept 3
Tow duration (min) 36.5 [5, 85] 39.5 [5, 90] 45.2 [4, 94] 50.2 [5, 105]
Tow depth (m) 58.4 [48.5, 70.4]
69.7 [54.5, 86.5]
75.2 [61.3, 87.8]
42.4 [33.8, 55.8]
Bushels (harvestable scallops) 6.2 [1.5, 12] 3.6 [0, 11.5] 5.2 [0, 18] 4.5 [0.1, 26]
Air duration (min) 13.0 [1.2, 30] 8.8 [1.2, 28.4]
9.7 [0.9, 25.6] 14.3 [1.7, 29]
Bottom seawater temp (°C) 8.29 11.04 11.08 12.99
Surface seawater temp (°C)
10.0 [8.8, 11.3]
14.4 [12.3, 16.5]
20.4 [15.3, 23.6]
21.1 [19.8, 23.1]
Seawater gradient temp (°C) 1.7 [0.5, 3] 3.4 [1.3, 5.5] 9.4 [4.2,
12.5] 8.1 [6.8,
10.1]
Air temp (°C) 15.0 [12.3, 17.2]
18.0 [14.8, 21.3]
22.4 [18.8, 28]
22.2 [20.1, 27.8]
Table 4. Mean [minimum, maximum] values for potential explanatory variables collected
in this study for all skates that were releases or kept in holding tanks for mortality trials.
Variable Release Hold
Tow duration (min) 48.7 [4.0, 105.0] 44.8 [4.0, 105.0]
Tow depth (m) 64.9 [33.8, 90.2] 63.1 [33.8, 87.8]
Bushels (harvestable scallops) 6.5 [0.0, 26.0] 4.2 [0.0, 26.0]
Air duration (min) 15.0 [0.3, 168.5] 11.7 [0.9, 30.0]
Temperature (°C)
Bottom seawater 11.0 [8.3, 13.0] 11.3 [8.3, 13.0]
Surface seawater 16.8 [8.7, 23.2] 17.5 [8.8, 23.6]
Seawater gradient 5.7 [0.4, 11.5] 6.20 [0.5, 12.5]
Air 19.4 [11.4, 30.8] 20.1 [12.3, 28.0]

Table 5. Health indicators affecting little and winter skate PRM: parameter estimates and
standard errors (SE) for the final Cox proportional-hazards model. Significant p-values (<
0.05) are denoted with an asterisk.
Table 6. Mean proportion and standard error of observed injury and reflex combinations
for little, winter, and barndoor skate.
Species Parameter Exp (estimate) SE p-value Little Injury = 2 1.479 0.349 0.2626 Injury = 3 3.091 0.347 0.0011* Back = Present 0.321 0.444 0.0106* Gag = Present 0.567 0.237 0.0167* Winter Injury = 2 2.247 0.803 0.3131 Injury = 3 6.854 0.756 0.0108* Back = Present 0.144 0.618 0.0017* Gag = Present 0.384 0.403 0.0177*
Health indicators Mean proportion Injury Back Gag Little skate Winter skate Barndoor skate 1 Present Present 0.08 (0.01) 0.09 (0.01) 0.01 (0.00)
Present Absent 0.01 (0.00) 0.01 (0.00) 0.02 (0.01)
Absent Present 0.12 (0.01) 0.08 (0.01) 0.04 (0.01)
Absent Absent 0.01 (0.00) 0.01 (0.01) 0.04 (0.02)
2 Present Present 0.10 (0.01) 0.17 (0.02) 0.04 (0.02)
Present Absent 0.02 (0.00) 0.03 (0.01) 0.04 (0.02)
Absent Present 0.31 (0.01) 0.26 (0.02) 0.28 (0.04)
Absent Absent 0.06 (0.01) 0.06 (0.01) 0.22 (0.03)
3 Present Present 0.02 (0.00) 0.04 (0.01) 0.01 (0.00)
Present Absent 0.01 (0.00) 0.01 (0.01) 0.00 (0.00)
Absent Present 0.17 (0.01) 0.15 (0.02) 0.11 (0.03)
Absent Absent 0.09 (0.01) 0.09 (0.01) 0.19 (0.04)

Table 7. Estimated short-term discard survival rate (%; up to 72 hours) and standard error
for little, winter, and barndoor skate. Little and winter skate estimates are based on the
Cox proportional-hazards model with survival as function of injury and back and gag
reflexes.
Survival Species Mean Std. Error Little 49.1 0.03 Winter 65.2 0.05
Table 8. Single-covariate Cox proportional-hazards models during the forward selection
process (first step) for barndoor skate, and the ΔAICc relative to the intercept-only
model.
Parameter ΔAICc Tow duration -1.89 Depth +1.84 Bushels of scallops +1.25 Air exposure +1.95 Temperature gradient +1.49 Sex +1.62 TL +1.41
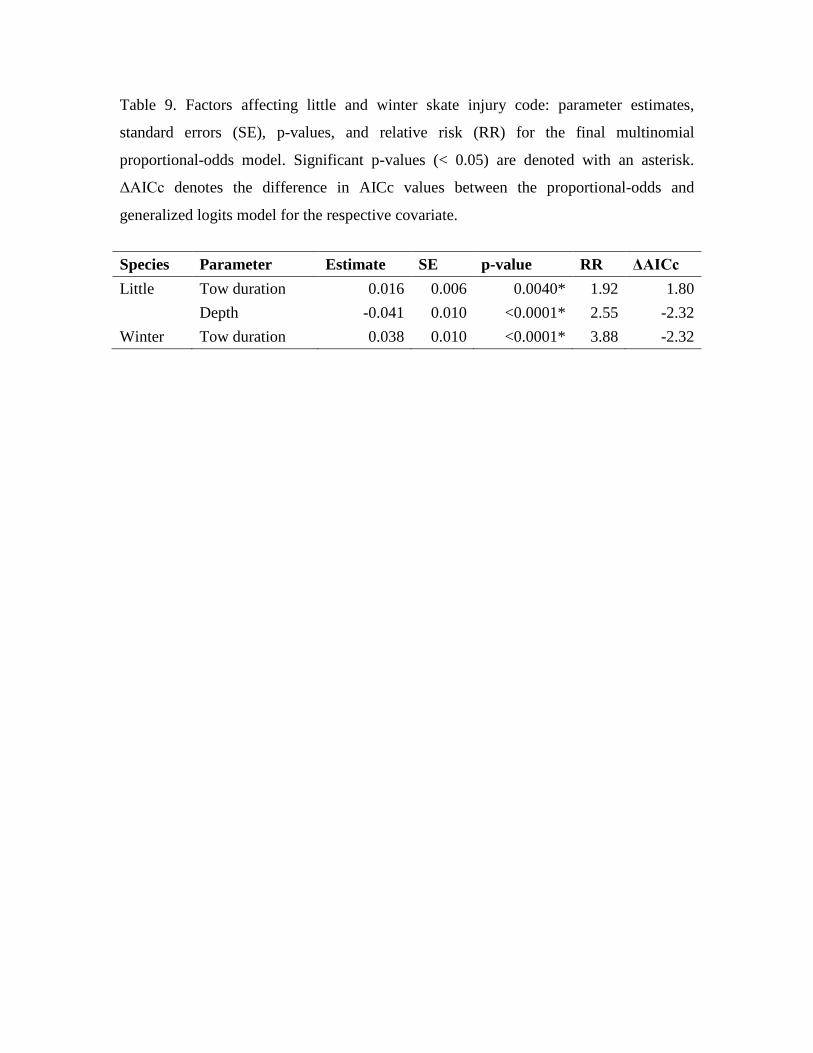
Table 9. Factors affecting little and winter skate injury code: parameter estimates,
standard errors (SE), p-values, and relative risk (RR) for the final multinomial
proportional-odds model. Significant p-values (< 0.05) are denoted with an asterisk.
ΔAICc denotes the difference in AICc values between the proportional-odds and
generalized logits model for the respective covariate.
Species Parameter Estimate SE p-value RR ΔAICc Little Tow duration 0.016 0.006 0.0040* 1.92 1.80 Depth -0.041 0.010 <0.0001* 2.55 -2.32 Winter Tow duration 0.038 0.010 <0.0001* 3.88 -2.32
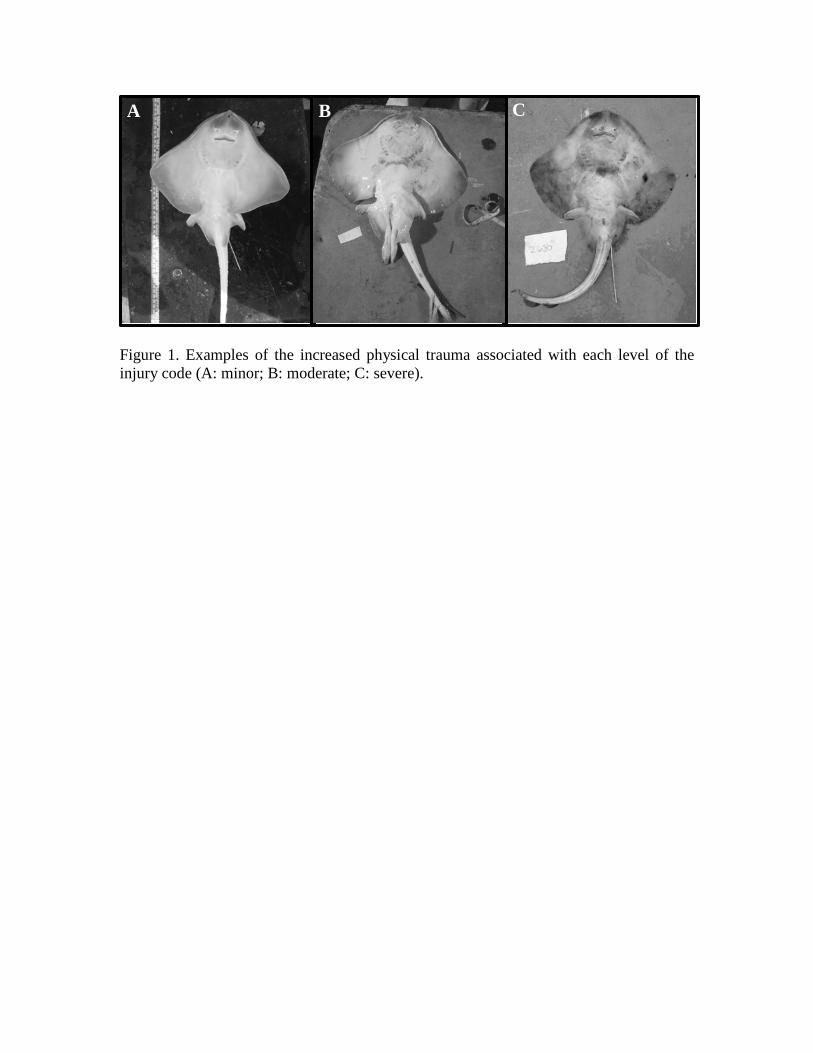
Figure 1. Examples of the increased physical trauma associated with each level of the injury code (A: minor; B: moderate; C: severe).
A B C

Figure 2. Frequency distribution of the duration of holding period for all species (A),
little skate (B), winter skate (C), and barndoor skate (D). Post-holding period, all live
skates were released overboard and considered a censored observation during the
analysis.
Little skate
B
Multispecies
A
C
Winter skate
D
Barndoor skate

Figure 3. Probability of survival over time for little (left panels) and winter (right panels)
skate with respect to initial injury (top panels: codes 1 and 2, bottom panels: code 3) and
reflex impairment scores (colors and line types). Shaded areas represent 95% confidence
intervals from the empirical Kaplan-Meier survival curve and are plotted up until the last
observation for the respective combination of health indicator scores. The lines represent
the Cox proportional-hazards model fits. Number of observations for a given combination
of health indicators is shown next to the model fit line.
Little skate Winter skate Injury = 1&
2 Injury = 3

Figure 4. Kaplan-Meier survival estimate for barndoor skate during holding tank trials.
Dashed lines indicate the 95% confidence intervals and sample size is given in the top
right corner of the figure.

Figure 5. Predicted probabilities of a skate belonging to a certain injury code (shaded
area) using proportional odds model with separate slopes for each injury code.
Probabilities for little skate are a function of tow duration (continuous), while tow depth
was binned into three different levels (equal and based on observed range; A-C), and for
winter skate, a function of tow duration (continuous). Injury code shading is as follows:
code 1 (light grey), code 2 (dark grey), and code 3 (black). Expanding circles represent
the relative proportion of individuals observed within each injury code in given bins of
the covariate.
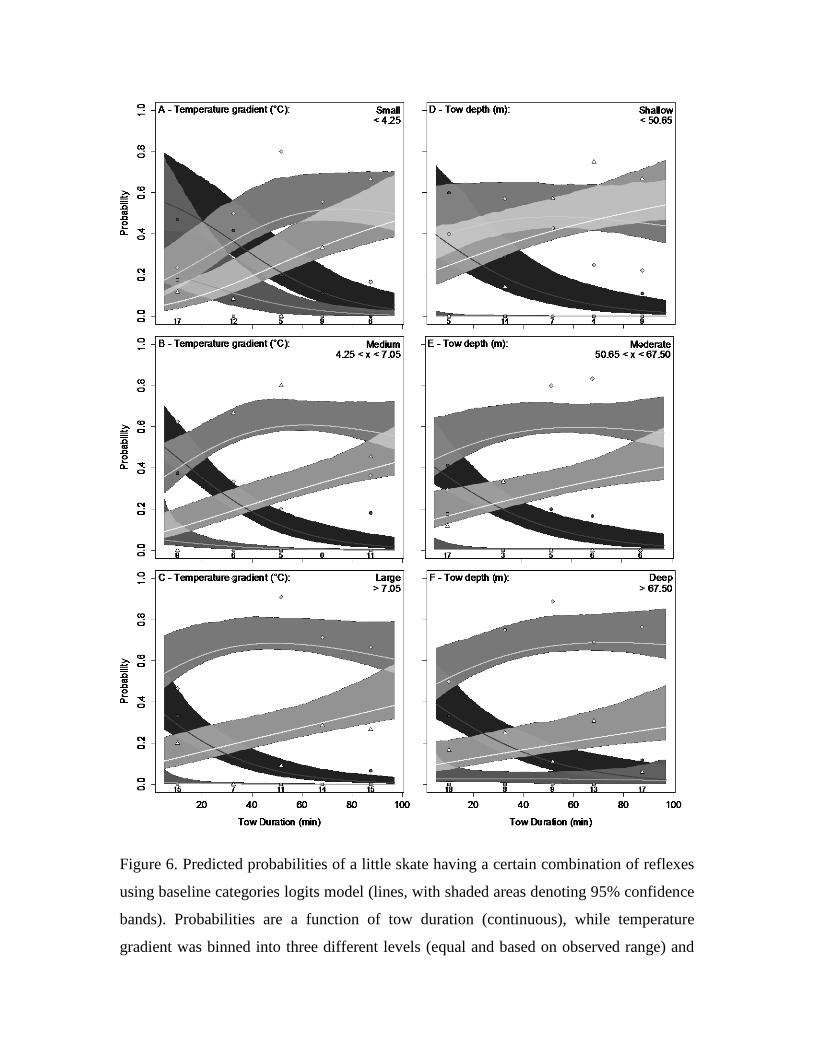
Figure 6. Predicted probabilities of a little skate having a certain combination of reflexes
using baseline categories logits model (lines, with shaded areas denoting 95% confidence
bands). Probabilities are a function of tow duration (continuous), while temperature
gradient was binned into three different levels (equal and based on observed range) and

tow depth held at the mean (A-C), or while temperature gradient was held at the mean
and tow depth was similarly binned into three different levels (D-F). Reflex code coloring
is as follows: Present-present (dark grey), present-absent (dark-medium grey), absent-
present (medium-light grey), and absent-absent (light grey). Symbols represent the
relative proportion of individuals observed within each reflex code in the given bins of
the covariate. Observed skate sample sizes for each bin are indicated on the x-axis of
each plot.
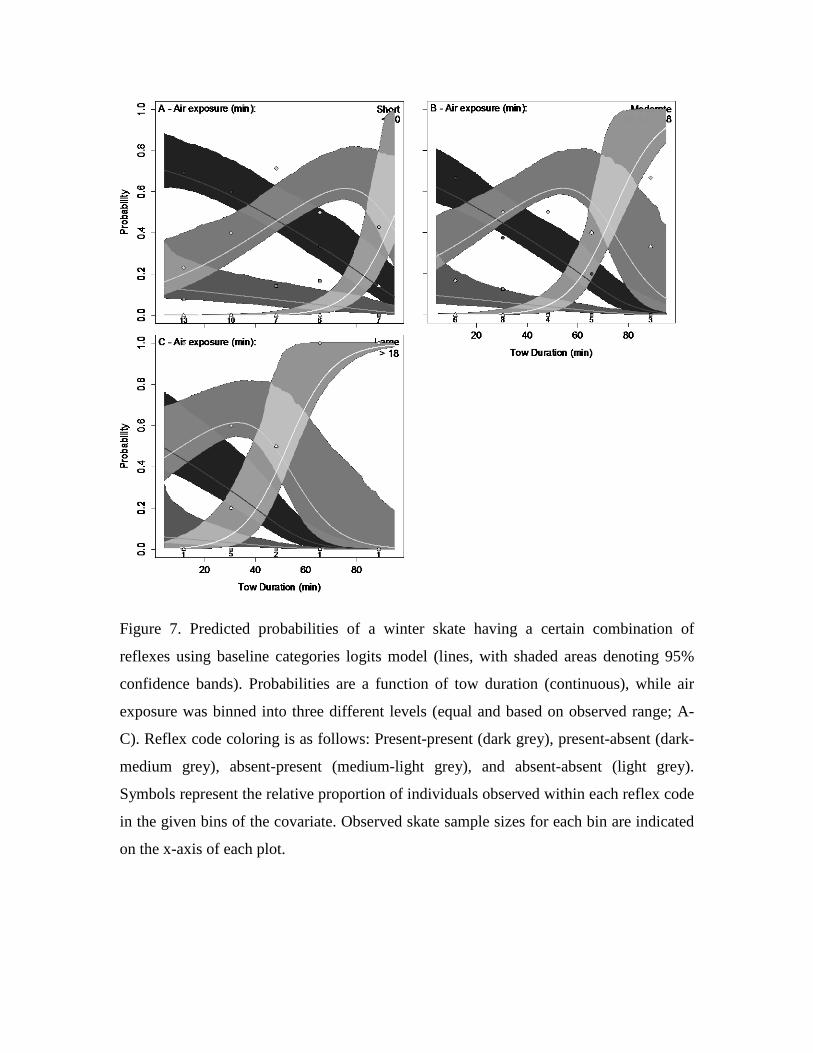
Figure 7. Predicted probabilities of a winter skate having a certain combination of
reflexes using baseline categories logits model (lines, with shaded areas denoting 95%
confidence bands). Probabilities are a function of tow duration (continuous), while air
exposure was binned into three different levels (equal and based on observed range; A-
C). Reflex code coloring is as follows: Present-present (dark grey), present-absent (dark-
medium grey), absent-present (medium-light grey), and absent-absent (light grey).
Symbols represent the relative proportion of individuals observed within each reflex code
in the given bins of the covariate. Observed skate sample sizes for each bin are indicated
on the x-axis of each plot.