Final Report Euromet Project 599 COMPARISON OF …COMPARISON OF VOLTAGE RATIO STANDARDS" Renata ......
31
Final Report Euromet Project 599 "COMPARISON OF VOLTAGE RATIO STANDARDS" Renata Styblíková, Karel Draxler (CMI, CZ, pilot laboratory) and Beat Jeckelmann (METAS, CH) Participants: Wolfgang Waldmann (BEV, A) Rudolf Kämpfer (METAS, CH) Esa-Pekka Suomalainen (MIKES-HUT, FI) János Gellén, Attila Boros, István Szunyogh (OMH, HU) Boguslaw Paczek (GUM, PL) Ricardo Martin Berjano, Fernando Garnacho Vecino (LCOE,E) Ján Gašparovič (SEPS LPT, SK) April 2005 CZECH METROLOGY INSTITUTE Laboratory of Fundamental Metrology V Botanice 4, CZ-150 72 Prague 5 Phone: +420 257 288 3111, http://www.cmi.cz
-
Upload
duongduong -
Category
Documents
-
view
222 -
download
2
Transcript of Final Report Euromet Project 599 COMPARISON OF …COMPARISON OF VOLTAGE RATIO STANDARDS" Renata ......
Final Report
Euromet Project 599
"COMPARISON OF VOLTAGE RATIO STANDARDS"
Renata Styblíková, Karel Draxler (CMI, CZ, pilot laboratory)
and
Beat Jeckelmann (METAS, CH)
Participants: Wolfgang Waldmann (BEV, A) Rudolf Kämpfer (METAS, CH) Esa-Pekka Suomalainen (MIKES-HUT, FI) János Gellén, Attila Boros, István Szunyogh (OMH, HU) Boguslaw Paczek (GUM, PL) Ricardo Martin Berjano, Fernando Garnacho Vecino (LCOE,E) Ján Gašparovič (SEPS LPT, SK)
April 2005
CZECH METROLOGY INSTITUTE Laboratory of Fundamental Metrology
V Botanice 4, CZ-150 72 Prague 5 Phone: +420 257 288 3111, http://www.cmi.cz

Euromet 599 – Final report – Draft B
2
Abstract
Seven European national metrology institutes and one commercial laboratory participated in this international comparison of instrument voltage transformers in the range of primary voltage 5 kV up to 22 kV.
Two instrument voltage transformers (IVT) with transformation ratios (5 and 10) kV/100 V and 22 kV/100 V served as transfer standards. The measured quantities were the voltage ratio error and the phase displacement. The measurements were performed at a frequency of 50 Hz and with a burden of B = 1 VA at unity power factor. The errors of the transfer standards were measured with (40, 60, 80, 100 and 120) % of the rated value of the primary voltage.
By result processing it was supposed that results of individual laboratories are not correlated. The comparison reference values (CRVs) and their uncertainties were calculated as weighted means. The consistency of the CRVs was checked using the χ2 test and Birge ratio. The confidence coefficient E of individual laboratories was calculated for CRVs, which did not pass the Birge ratio test. Results of laboratories with E > 1,5 were not included in the calculation of the corrected CRVs.
The differences from the CRVs and their uncertainties presented in tables and graphs are the results of the comparison. The good results of this comparison prove the good calibration capabilities of the participants in the field of instrument transformers.

Euromet 599 – Final report – Draft B
3
1. Introduction
AC voltage ratio is one of two basic parameters in the area of metrology of instrument transformers and it is very important for the measurement of electric energy. In trade with electric energy, the accuracy of measurement has to be ensured within given limits. To support the many transformer manufacturers relying on national standards as a source of traceability, the comparison of these standards at the European level is of great importance.
The relevant quantity for the measurement of high AC voltage is the ratio of the primary and secondary voltage for an instrument transformer, which is a complex value. The errors of this ratio are given as the ratio error and the phase displacement. These two quantities are the subject of this international comparison.
The Euromet project No. 599 titled “Comparison of voltage ratio standards” started in the beginning of June 2000 with participants from eight European countries including the Czech Metrology Institute (CMI) in Prague as pilot laboratory.
The participating laboratories were asked to follow their usual measurement procedure corresponding to their best measurement capabilities taking into account the allowed time frame for the comparison.
2. Participants
The participants and their affiliation, the eight institutes involved, are listed in Table 1 in order of the transfer standard circulation:
R. Styblíková, K. Draxler CMI, Czech Metrology Institute, V Botanice 4, 150 72 Prague 5, Czech Republic
J. Gašparovič SEPS LPT, Slovak electricity transmission system, 919 24 Križovany nad Dudváhom, Slovak Republic
J. Gellén, A. Boros, I. Szunyogh
OMH, National Office of Measures, Nemetvölgyi ut 37-39, 1124 Budapest XII, Hungary
W. Waldmann BEV, Federal Office of Metrology and Surveying, Arltgasse 35, 1160 Vienna, Austria
B. Paczek GUM, Central Office of Measures, Elektoralna 2, 00-139 Warsaw, Poland
E-P. Suomalainen MIKES-HUT, Helsinki University of Technology, High Voltage Institute, Otakaari 5L, 02150 ESPOO, Finland
B. Jeckelmann, R. Kämpfer METAS, Swiss Federal Office of Metrology and Accreditation, Lindenweg 50, 3003 Bern-Wabern, Switzerland
R. Martin Berjano, F. Garnacho Vecino
LCOE, Laboratorio Central Oficial de Electrotecnia, José Gutiérrez Abascal 2, 28006 Madrid, Spain
Table 1

Euromet 599 – Final report – Draft B
4
3. Measured quantities
The measured quantities were the voltage ratio error εU and the phase displacement δU. The voltage ratio error εU is defined as:
P
PUSU U
UkU −=ε . (1)
The phase displacement δU is defined as the phase difference between the secondary voltage US and the primary voltage UP; it is considered as positive when the secondary voltage phasor US leads the primary voltage phasor, εU: voltage ratio error [% or ppm], δU: phase displacement [ ' or µrad], UP: actual value of the primary voltage [V], US: actual value of the secondary voltage [V], kU: transformation ratio [-], B: burden [VA], cos β power factor of burden for sinusoidal waveforms [-]. 4. Transfer standards
Standard Voltage Transformer Tettex 4823:
rated primary voltage: (5 and 10) kV rated secondary voltage: 100 V rated burden: B = 1 VA real ser. number: 141'925 accuracy: ± 0.03 %; ± 1.5' weight: approx. 20 kg Standard Voltage Transformer Tettex 4820:
rated primary voltage: 22 kV rated secondary voltage: (100 and 110) V rated burden: B = 1 VA real ser. number: 141'885 accuracy: ± 0.03 %; ± 1.5' weight: approx. 50 kg 5. Organization of the comparison
The transfer standards were transported in two wooden containers, screwed to the bottom and hold in place by styrofoam. It was not necessary to transport the standards personally because they are rather robust devices. Due to the well-constructed transport containers, no damage of the transfer standards occurred during the comparison measurement.
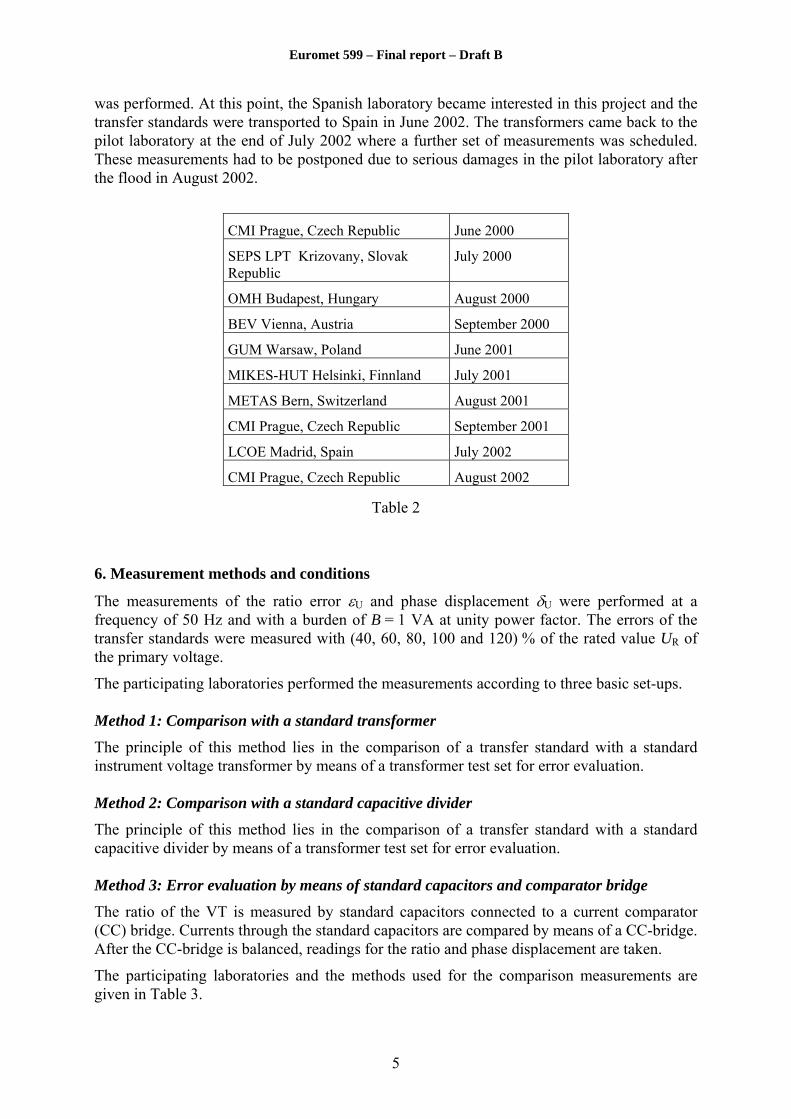
The time schedule of the comparison is apparent from Table 2. The transfer standards were transported around the participating laboratories according to the planed schedule up to September 2001 when they arrived at the CMI in Prague where a second set of measurements
Euromet 599 – Final report – Draft B
5
was performed. At this point, the Spanish laboratory became interested in this project and the transfer standards were transported to Spain in June 2002. The transformers came back to the pilot laboratory at the end of July 2002 where a further set of measurements was scheduled. These measurements had to be postponed due to serious damages in the pilot laboratory after the flood in August 2002.
CMI Prague, Czech Republic June 2000
SEPS LPT Krizovany, Slovak Republic
July 2000
OMH Budapest, Hungary August 2000
BEV Vienna, Austria September 2000
GUM Warsaw, Poland June 2001
MIKES-HUT Helsinki, Finnland July 2001
METAS Bern, Switzerland August 2001
CMI Prague, Czech Republic September 2001
LCOE Madrid, Spain July 2002
CMI Prague, Czech Republic August 2002
Table 2
6. Measurement methods and conditions
The measurements of the ratio error εU and phase displacement δU were performed at a frequency of 50 Hz and with a burden of B = 1 VA at unity power factor. The errors of the transfer standards were measured with (40, 60, 80, 100 and 120) % of the rated value UR of the primary voltage.
The participating laboratories performed the measurements according to three basic set-ups. Method 1: Comparison with a standard transformer
The principle of this method lies in the comparison of a transfer standard with a standard instrument voltage transformer by means of a transformer test set for error evaluation. Method 2: Comparison with a standard capacitive divider
The principle of this method lies in the comparison of a transfer standard with a standard capacitive divider by means of a transformer test set for error evaluation. Method 3: Error evaluation by means of standard capacitors and comparator bridge
The ratio of the VT is measured by standard capacitors connected to a current comparator (CC) bridge. Currents through the standard capacitors are compared by means of a CC-bridge. After the CC-bridge is balanced, readings for the ratio and phase displacement are taken.
The participating laboratories and the methods used for the comparison measurements are given in Table 3.

Euromet 599 – Final report – Draft B
6
Laboratory Method t [°C] Burden B [VA]; cos β f [Hz]
CMI 1 23,0 ± 0,5 B = (1 ± 0,002) VA; cos β = (1 ± 0,002) 50 ± 0,05
SEPS LPT 2 23,0 ± 1,0 B = 1 VA; cos β = 1 50 ± 0,05
OMH 1 23,0 ± 2,0 B = 1 VA; cos β = 1 50
BEV 1 22,0 ± 2,0 B = 1 VA; cos β = 1 50
GUM 1 22,0 B = 1 VA; cos β = 1 49,95 ± 0,04
MIKES-HUT 3 26,0 ± 1,0 B = (1 ± 0,003) VA; cos β = (1 ± 0,001) 50
METAS 1 23,0 ± 1,0 B = 1 VA; cos β = 1 50
LCOE 1 23 ± 2,0 B = 1 VA; cos β = 1 50
Table 3
7. Used standards and equipment
Austria - BEV - MWB NUZG 35 standard IVT for ratios (5; 10; 22) kV/100 V - Zera system for instrument transformer testing for ratios (5; 10) kV/100 V - Tettex 2767 automatic transformer test set for ratio 22 kV/100 V
Czech Republic - CMI - Tettex 4820 standard IVT for ratios (5; 10; 22) kV/100 V - Tettex 2767 automatic transformer test set
Finland - MIKES-HUT - Micafil PG1 standard capacitor, 100 pF/200 kV - Tettex 3320 standard capacitors, 1 nF/2 kV; 10 nF/2 kV - Tettex 2809 current comparator bridge
Hungary - OMH - standard IVT MWB NUZG 35 for ratios (5; 10; 22) kV/100 V - voltage transformer measuring bridge VTT, man. TU Budapest
Poland - GUM - Siemens VT0155 standard IVT for ratios (5; 10; 22) kV/100 V - Tettex 2767 automatic transformer test set
Slovak Republic - SEPS LPT - Tettex NVDD 3 standard IVT for ratios (5; 10) kV/100 V - Tettex 4854b capacitive and electronic divider for ratio 22 kV/100 V - Tettex 2767 automatic transformer test set
Spain - LCOE - Tettex 4829A standard IVT for ratios (5; 10; 22) kV/100 V - Tettex 2767 automatic transformer test set
Switzerland - METAS - METAS standard IVT for ratios (5; 10; 22) kV/100 V - MWB TAB 79U voltage transformer test system
8. Traceability

Euromet 599 – Final report – Draft B
7
Each participant supplied a statement of traceability for the used standard. Table 4 shows if the measurements are traceable to their own national standards or to another national laboratory.
Laboratory Traceable to own national standards
Traceable to other national standards
CMI x
SEPS LPT x
OMH x x
BEV x
GUM x
MIKES-HUT x
METAS x x
LCOE x
Table 4
9. Results of measurement 9. 1. Method of results evaluation
The participating laboratories reported the measurement results including uncertainties to the pilot laboratory CMI in Prague, where they were evaluated according to [1]. The pilot laboratory calculated the resulting comparison reference value (CRV) as the weighted mean according to the formula
( )
( )∑
∑
=
−
=
−
= n
LL
L
n
LL
ru
u
1
2
1
2
ε
εεε ,
( )
( )L
n
L
n
LLL
ru
u
δ
δδδ
∑
∑
=
−
=
−
=
1
2
1
2
, (2)
where εr, δr are reference values for the ratio error and phase displacement, εL, δL, results of ratio error and phase displacement of each
participating laboratory, u(εL), u(δL) standard deviations (standard uncertainties) of the ratio error
and phase displacement results as reported by the individual laboratories,
n is the number of participating laboratories.
The standard uncertainties of the CRV for the ratio error u(εr) and the phase displacement u(δr) are given by the formulae
( )( )L
n
L
r
uu
εε
∑=
−
=
1
2
1 , ( )
( )∑=
−
=n
LL
r
uu
1
2
1
δδ . (3)
Euromet 599 – Final report – Draft B
8
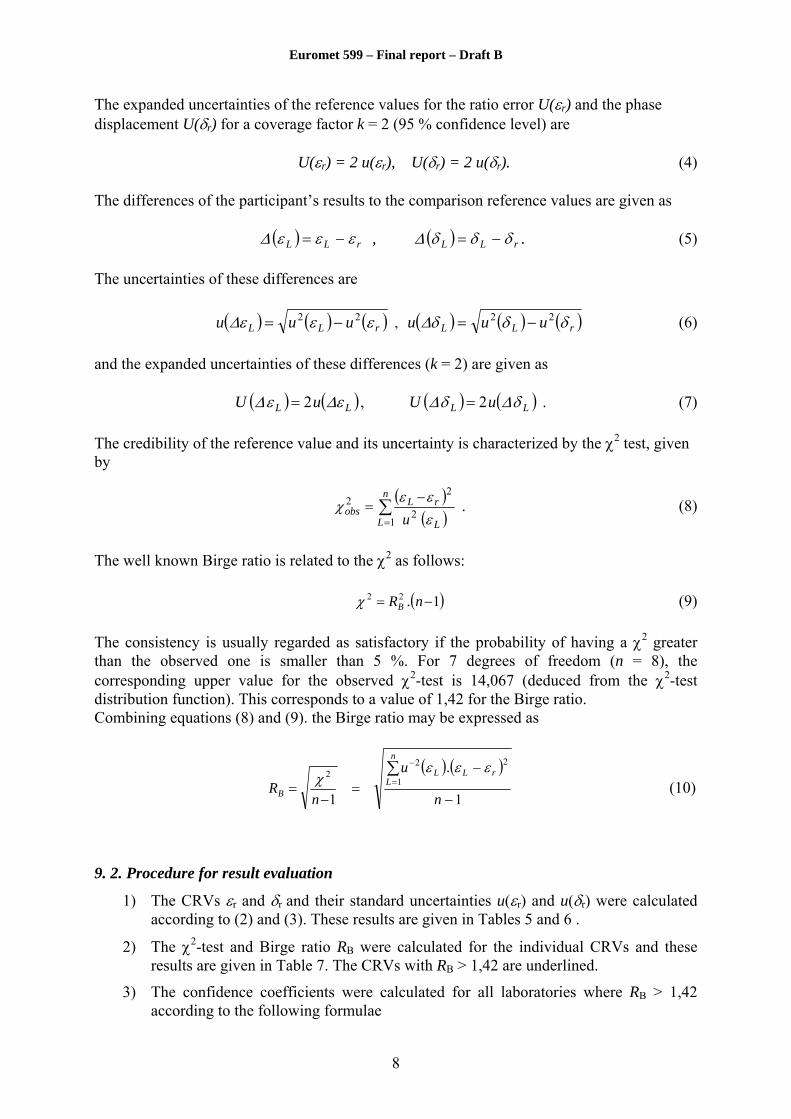
The expanded uncertainties of the reference values for the ratio error U(εr) and the phase displacement U(δr) for a coverage factor k = 2 (95 % confidence level) are U(εr) = 2 u(εr), U(δr) = 2 u(δr). (4)
The differences of the participant’s results to the comparison reference values are given as
( ) rLL εεε∆ −= , ( ) rLL δδδ∆ −= . (5)
The uncertainties of these differences are ( ) ( ) ( )rLL uuu εεε∆ 22 −= , ( ) ( ) ( )rLL uuu δδδ∆ 22 −= (6) and the expanded uncertainties of these differences (k = 2) are given as ( ) ( )LL uU ε∆ε∆ 2= , ( ) ( )LL uU δ∆δ∆ 2= . (7) The credibility of the reference value and its uncertainty is characterized by the χ2 test, given by
( )( )∑
=
−=
n
L L
rLobs u1
2
22
εεε
χ . (8)
The well known Birge ratio is related to the χ2 as follows:
( )122 −= n.RBχ (9)
The consistency is usually regarded as satisfactory if the probability of having a χ2 greater than the observed one is smaller than 5 %. For 7 degrees of freedom (n = 8), the corresponding upper value for the observed χ2-test is 14,067 (deduced from the χ2-test distribution function). This corresponds to a value of 1,42 for the Birge ratio. Combining equations (8) and (9). the Birge ratio may be expressed as
( ) ( )
11
2
1
22
−
−=
−=
∑=
−
n
.u
nR
rLL
n
LB
εεεχ (10)
9. 2. Procedure for result evaluation
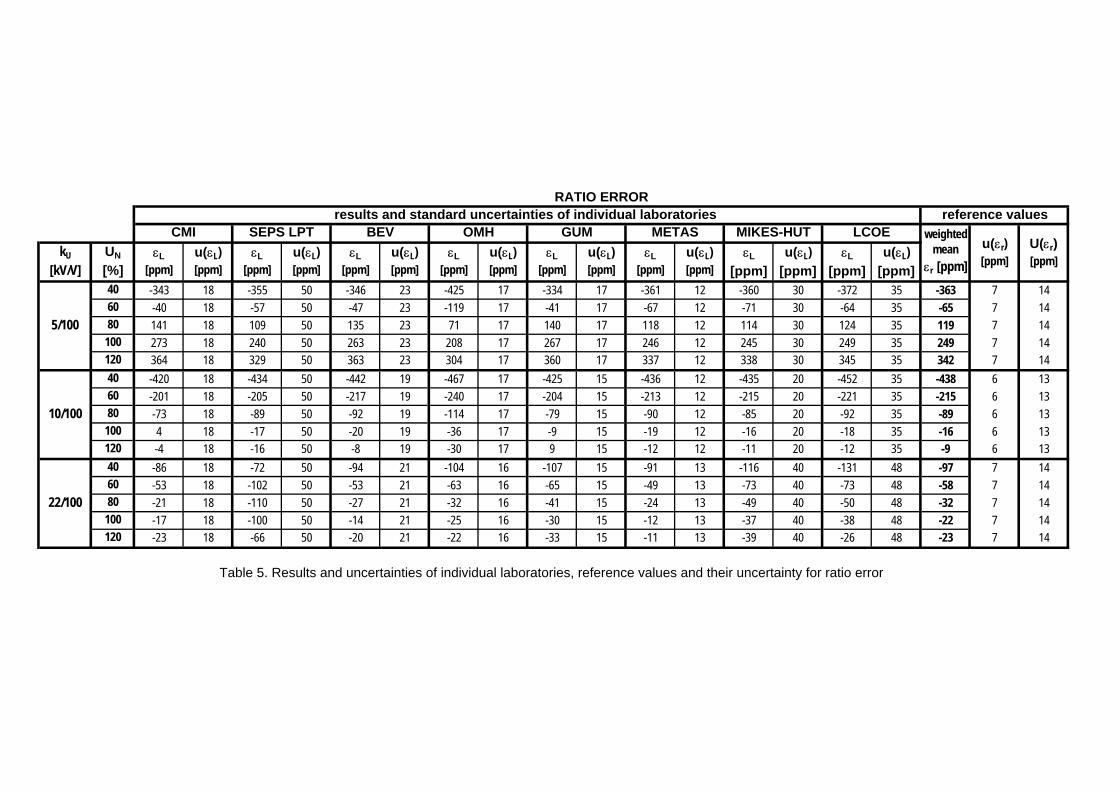
1) The CRVs εr and δr and their standard uncertainties u(εr) and u(δr) were calculated according to (2) and (3). These results are given in Tables 5 and 6 .
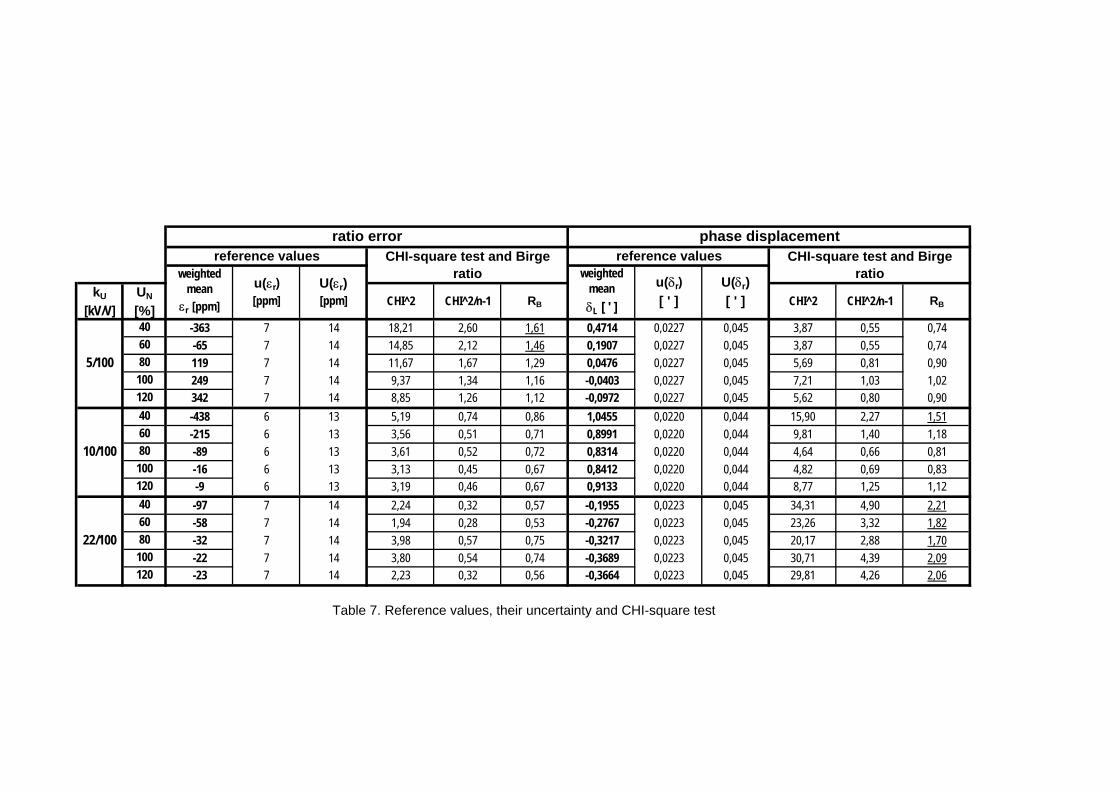
2) The χ2-test and Birge ratio RB were calculated for the individual CRVs and these results are given in Table 7. The CRVs with RB > 1,42 are underlined.
3) The confidence coefficients were calculated for all laboratories where RB > 1,42 according to the following formulae

Euromet 599 – Final report – Draft B
9
( ) ( )L
LLn u
Eε
εε
∆
∆=
2 , ( ) ( )L
LLn u
Eδ
δδ
∆
∆=
2 . (11)
These confidence coefficients are given in Table 8. Laboratories with En > 1,5 are underlined.
4) The results of the laboratories with confidence coefficient En > 1,5 were not included in the calculation of the corrected CRVs. Final reference values calculated without these laboratories are given in Tables 9 and 10. Outlier results are underlined.
5) The χ2-test and Birge ratios RB for the final reference values were calculated and the results are given in Table 11. It is obvious that all final reference values fulfill the required criterion RB < 1,42.
6) The resulting differences between the results of the individual laboratories and the final CRVs calculated according to (5) and their expanded uncertainties calculated according to (6) and (7) are given in Tables 12 and 13.
Note: As the outliers (underlined) are no longer correlated with the CRV, the formulae for the uncertainties U(∆εL) and U(∆δL) change for the outliers; they become:
( ) ( ) ( ) ( ) ( ) ( )rLLrLL uuUuuU δδδεεε 2222 2 ,2 +=∆+=∆
7) Graphical results from Tables 12 and 13 are shown in Graphs in Fig. 1 - 30.
10. Final remarks
Eight European laboratories participated in this international comparison of AC voltage ratio standards up to 22 kV at a frequency of 50 Hz. Three different measurement methods were used during the comparison: comparison with a standard transformer, comparison with a capacitive divider and current comparator bridge with standard capacitors. The reference values and their uncertainties were calculated as weighted means according to the above mentioned formulae. The consistency of the CRVs was checked using the χ2 test and Birge ratio. The confidence coefficient E of individual laboratories was calculated for CRVs, which did not pass the Birge ratio test. Results of laboratories with E > 1,5 were not included in the calculation of the corrected CRVs.
By result processing it was supposed that results of individual laboratories are not correlated. There is no direct traceability between national standards of participating laboratories in this comparison.
Traceability of national standards of some laboratories on PTB was not taken in to account. The correlated component of resulting uncertainty of individual national standards represents only uncertainty of PTB standards. Other components (burden and its power factor, transformer test set, adjusting of measured voltage etc.) are not correlated.
Test measurements have shown that the temperature coefficient of the transport transformers is very low (smaller than 1 ppm/°C) and therefore no correction needs to be applied even for the laboratories measuring at 22°C or 26°C. Individual laboratories included the temperature influence in to their result uncertainties.

Euromet 599 – Final report – Draft B
10
The differences from the CRVs and their uncertainties presented in tables and graphs are the results of the comparison.
The good results of this comparison prove the good calibration capabilities of the participants in the field of instrument transformers.
The authors express their thanks to Dr. Hans Bachmair for final review of the Final Report.
References
[1] BIPM-IEC-ISO-OIML. Guide to the Expression of the Uncertainty in Measurement 1993. [2] IEC 60044-2: Inductive voltage transformers. 1997. [3] Cox M. G.: The Evaluation of Key Comparison Data. Metrologia 39, pp. 589-595, 2002. [4] Draxler K. – Styblíková R. – Waldman W. – Jakab A.: International Comparison of AC Current Ratio
Standards 50 Hz. Proc. of "XVI IMEKO World Congress", Vienna, September 25. - 28. 2000. Volume V, pp. 247 – 252.
CMIkU
[kV/V]UN
[%]εL
[ppm] u(εL) [ppm]
εL [ppm]
u(εL) [ppm]
εL [ppm]
u(εL) [ppm]
εL [ppm]
u(εL) [ppm]
εL [ppm]
u(εL) [ppm]
εL [ppm]
u(εL) [ppm]
εL
[ppm] u(εL)
[ppm]εL
[ppm] u(εL)
[ppm]40 -343 18 -355 50 -346 23 -425 17 -334 17 -361 12 -360 30 -372 35 -363 7 1460 -40 18 -57 50 -47 23 -119 17 -41 17 -67 12 -71 30 -64 35 -65 7 1480 141 18 109 50 135 23 71 17 140 17 118 12 114 30 124 35 119 7 14
100 273 18 240 50 263 23 208 17 267 17 246 12 245 30 249 35 249 7 14120 364 18 329 50 363 23 304 17 360 17 337 12 338 30 345 35 342 7 1440 -420 18 -434 50 -442 19 -467 17 -425 15 -436 12 -435 20 -452 35 -438 6 1360 -201 18 -205 50 -217 19 -240 17 -204 15 -213 12 -215 20 -221 35 -215 6 1380 -73 18 -89 50 -92 19 -114 17 -79 15 -90 12 -85 20 -92 35 -89 6 13
100 4 18 -17 50 -20 19 -36 17 -9 15 -19 12 -16 20 -18 35 -16 6 13120 -4 18 -16 50 -8 19 -30 17 9 15 -12 12 -11 20 -12 35 -9 6 1340 -86 18 -72 50 -94 21 -104 16 -107 15 -91 13 -116 40 -131 48 -97 7 1460 -53 18 -102 50 -53 21 -63 16 -65 15 -49 13 -73 40 -73 48 -58 7 1480 -21 18 -110 50 -27 21 -32 16 -41 15 -24 13 -49 40 -50 48 -32 7 14
100 -17 18 -100 50 -14 21 -25 16 -30 15 -12 13 -37 40 -38 48 -22 7 14120 -23 18 -66 50 -20 21 -22 16 -33 15 -11 13 -39 40 -26 48 -23 7 14
10/100
22/100
Table 5. Results and uncertainties of individual laboratories, reference values and their uncertainty for ratio error
U(εr) [ppm]
5/100
u(εr) [ppm]
MIKES-HUT LCOEMETAS
RATIO ERRORresults and standard uncertainties of individual laboratories reference values
SEPS LPT BEV OMH GUM weighted mean
εr [ppm]

CMIkU
[kV/V]UN
[%]δU
[ ' ] u(δL) [ ' ]
δU
[ ' ] u(δL) [ ' ]
δU
[ ' ] u(δL) [ ' ]
δU
[ ' ] u(δL) [ ' ]
δU
[ ' ] u(δL) [ ' ]
δU
[ ' ] u(δL) [ ' ]
δU
[ ' ] u(δL) [ ' ]
δU
[ ' ] u(δL) [ ' ]
40 0,513 0,055 0,555 0,15 0,469 0,08 0,498 0,06 0,44 0,09 0,420 0,039 0,527 0,06 0,440 0,12 0,4714 0,0227 0,04560 0,235 0,055 0,281 0,15 0,168 0,08 0,213 0,06 0,16 0,09 0,140 0,039 0,245 0,06 0,200 0,12 0,1907 0,0227 0,04580 0,096 0,055 0,150 0,15 -0,041 0,08 0,113 0,06 0,02 0,09 0,000 0,039 0,087 0,06 0,030 0,12 0,0476 0,0227 0,045100 0,013 0,055 0,068 0,15 -0,149 0,08 0,038 0,06 -0,08 0,09 -0,090 0,039 -0,003 0,06 -0,040 0,12 -0,0403 0,0227 0,045120 -0,042 0,055 0,019 0,15 -0,225 0,08 -0,062 0,06 -0,12 0,09 -0,130 0,039 -0,069 0,06 -0,050 0,12 -0,0972 0,0227 0,04540 0,944 0,055 1,356 0,15 1,156 0,065 0,942 0,055 1,07 0,09 1,050 0,039 1,123 0,06 1,050 0,12 1,0455 0,0220 0,04460 0,795 0,055 1,169 0,15 0,969 0,065 0,863 0,055 0,92 0,09 0,890 0,039 0,965 0,06 0,940 0,12 0,8991 0,0220 0,04480 0,790 0,055 1,087 0,15 0,823 0,065 0,835 0,055 0,85 0,09 0,810 0,039 0,885 0,06 0,830 0,12 0,8314 0,0220 0,044100 0,902 0,055 1,061 0,15 0,804 0,065 0,825 0,055 0,84 0,09 0,800 0,039 0,867 0,06 0,840 0,12 0,8412 0,0220 0,044120 0,989 0,055 1,149 0,15 0,865 0,065 0,863 0,055 0,92 0,09 0,900 0,039 0,955 0,06 0,960 0,12 0,9133 0,0220 0,04440 -0,146 0,055 -0,864 0,15 -0,085 0,065 -0,358 0,055 -0,10 0,09 -0,170 0,04 -0,154 0,06 -0,160 0,16 -0,1955 0,0223 0,04560 -0,244 0,055 -0,913 0,15 -0,192 0,065 -0,361 0,055 -0,21 0,09 -0,260 0,04 -0,257 0,06 -0,250 0,16 -0,2767 0,0223 0,04580 -0,302 0,055 -0,949 0,15 -0,231 0,065 -0,351 0,055 -0,27 0,09 -0,320 0,04 -0,315 0,06 -0,320 0,16 -0,3217 0,0223 0,045100 -0,308 0,055 -0,970 0,15 -0,258 0,065 -0,533 0,055 -0,28 0,09 -0,350 0,04 -0,335 0,06 -0,310 0,16 -0,3689 0,0223 0,045120 -0,339 0,055 -1,038 0,15 -0,278 0,065 -0,495 0,055 -0,27 0,09 -0,340 0,04 -0,322 0,06 -0,330 0,16 -0,3664 0,0223 0,045
10/100
22/100
weighted mean δL [ ' ]
Table 6. Results and uncertainties of individual laboratories, reference values and their uncertainty for phase displacement
U(δr) [ ' ]
5/100
u(δr) [ ' ]
MIKES-HUT LCOEMETAS
PHASE DISPLACEMENTresults and standard uncertainties of individual laboratories reference values
SEPS LPT BEV OMH GUM
kU
[kV/V]UN
[%]CHI^2 CHI^2/n-1 RB CHI^2 CHI^2/n-1 RB
40 -363 7 14 18,21 2,60 1,61 0,4714 0,0227 0,045 3,87 0,55 0,7460 -65 7 14 14,85 2,12 1,46 0,1907 0,0227 0,045 3,87 0,55 0,7480 119 7 14 11,67 1,67 1,29 0,0476 0,0227 0,045 5,69 0,81 0,90
100 249 7 14 9,37 1,34 1,16 -0,0403 0,0227 0,045 7,21 1,03 1,02120 342 7 14 8,85 1,26 1,12 -0,0972 0,0227 0,045 5,62 0,80 0,9040 -438 6 13 5,19 0,74 0,86 1,0455 0,0220 0,044 15,90 2,27 1,5160 -215 6 13 3,56 0,51 0,71 0,8991 0,0220 0,044 9,81 1,40 1,1880 -89 6 13 3,61 0,52 0,72 0,8314 0,0220 0,044 4,64 0,66 0,81
100 -16 6 13 3,13 0,45 0,67 0,8412 0,0220 0,044 4,82 0,69 0,83120 -9 6 13 3,19 0,46 0,67 0,9133 0,0220 0,044 8,77 1,25 1,1240 -97 7 14 2,24 0,32 0,57 -0,1955 0,0223 0,045 34,31 4,90 2,2160 -58 7 14 1,94 0,28 0,53 -0,2767 0,0223 0,045 23,26 3,32 1,8280 -32 7 14 3,98 0,57 0,75 -0,3217 0,0223 0,045 20,17 2,88 1,70
100 -22 7 14 3,80 0,54 0,74 -0,3689 0,0223 0,045 30,71 4,39 2,09120 -23 7 14 2,23 0,32 0,56 -0,3664 0,0223 0,045 29,81 4,26 2,06
reference valuesphase displacement
CHI-square test and Birge ratioweighted
mean δL [ ' ]
u(δr) [ ' ]
U(δr) [ ' ]
Table 7. Reference values, their uncertainty and CHI-square test
ratio errorreference values CHI-square test and Birge
ratioweighted mean εr [ppm]
u(εr) [ppm]
U(εr) [ppm]
5/100
10/100
22/100

kU
[kV/V] errorUN
[%]CMI SEPS
LPT BEV OMH GUM METAS MIKES HUT LCOE
5/100 ratio error 40 0,61 0,08 0,40 1,98 0,94 0,12 0,06 0,13
5/100 ratio error 60 0,76 0,08 0,43 1,72 0,78 0,08 0,10 0,02
22/100 phase displacement 40 0,49 2,25 0,91 1,61 0,55 0,39 0,37 0,11
22/100 phase displacement 60 0,33 2,14 0,69 0,84 0,38 0,25 0,18 0,08
22/100 phase displacement 80 0,20 2,11 0,74 0,29 0,30 0,03 0,06 0,01
22/100 phase displacement 100 0,61 2,03 0,91 1,63 0,51 0,29 0,30 0,19
22/100 phase displacement 120 0,27 2,26 0,72 1,28 0,55 0,40 0,40 0,12
Table 8. Confidence coefficients for results with RB > 1,42; outllier identification

CMIkU
[kV/V]UN
[%]εL
[ppm] u(εL) [ppm]
εL [ppm]
u(εL) [ppm]
εL [ppm]
u(εL) [ppm]
εL [ppm]
u(εL) [ppm]
εL [ppm]
u(εL) [ppm]
εL [ppm]
u(εL) [ppm]
εL [ppm]
u(εL) [ppm]
εL [ppm]
u(εL) [ppm]
40 -343 18 -355 50 -346 23 -425 17 -334 17 -361 12 -360 30 -372 35 -351 7 1560 -40 18 -57 50 -47 23 -119 17 -41 17 -67 12 -71 30 -64 35 -55 7 1580 141 18 109 50 135 23 71 17 140 17 118 12 114 30 124 35 119 7 14
100 273 18 240 50 263 23 208 17 267 17 246 12 245 30 249 35 249 7 14120 364 18 329 50 363 23 304 17 360 17 337 12 338 30 345 35 342 7 1440 -420 18 -434 50 -442 19 -467 17 -425 15 -436 12 -435 20 -452 35 -438 6 1360 -201 18 -205 50 -217 19 -240 17 -204 15 -213 12 -215 20 -221 35 -215 6 1380 -73 18 -89 50 -92 19 -114 17 -79 15 -90 12 -85 20 -92 35 -89 6 13
100 4 18 -17 50 -20 19 -36 17 -9 15 -19 12 -16 20 -18 35 -16 6 13120 -4 18 -16 50 -8 19 -30 17 9 15 -12 12 -11 20 -12 35 -9 6 1340 -86 18 -72 50 -94 21 -104 16 -107 15 -91 13 -116 40 -131 48 -97 7 1460 -53 18 -102 50 -53 21 -63 16 -65 15 -49 13 -73 40 -73 48 -58 7 1480 -21 18 -110 50 -27 21 -32 16 -41 15 -24 13 -49 40 -50 48 -32 7 14
100 -17 18 -100 50 -14 21 -25 16 -30 15 -12 13 -37 40 -38 48 -22 7 14120 -23 18 -66 50 -20 21 -22 16 -33 15 -11 13 -39 40 -26 48 -23 7 14
RATIO ERROR
Table 9. Corrected reference values for ratio error without outliers (outliers underlined)
10/100
22/100
weighted mean
εr [ppm] u(εr) [ppm]
MIKES-HUT LCOEU(εr) [ppm]
5/100
results and standard uncertainties of individual laboratories reference valuesSEPS LPT BEV OMH GUM METAS

CMIkU
[kV/V]UN
[%]δU
[ ' ] u(δL) [ ' ]
δU
[ ' ] u(δL) [ ' ]
δU
[ ' ] u(δL) [ ' ]
δU
[ ' ] u(δL) [ ' ]
δU
[ ' ] u(δL) [ ' ]
δU
[ ' ] u(δL) [ ' ]
δU
[ ' ] u(δL) [ ' ]
δU
[ ' ] u(δL) [ ' ]
40 0,513 0,055 0,555 0,15 0,469 0,08 0,498 0,06 0,440 0,09 0,420 0,039 0,527 0,06 0,440 0,12 0,4714 0,0227 0,04560 0,235 0,055 0,281 0,15 0,168 0,08 0,213 0,06 0,160 0,09 0,140 0,039 0,245 0,06 0,200 0,12 0,1907 0,0227 0,04580 0,096 0,055 0,150 0,15 -0,041 0,08 0,113 0,06 0,020 0,09 0,000 0,039 0,087 0,06 0,030 0,12 0,0476 0,0227 0,045
100 0,013 0,055 0,068 0,15 -0,149 0,08 0,038 0,06 -0,080 0,09 -0,090 0,039 -0,003 0,06 -0,040 0,12 -0,0403 0,0227 0,045120 -0,042 0,055 0,019 0,15 -0,225 0,08 -0,062 0,06 -0,120 0,09 -0,130 0,039 -0,069 0,06 -0,050 0,12 -0,0972 0,0227 0,04540 0,944 0,055 1,356 0,15 1,156 0,065 0,942 0,055 1,070 0,09 1,050 0,039 1,123 0,06 1,050 0,12 1,0455 0,0220 0,04460 0,795 0,055 1,169 0,15 0,969 0,065 0,863 0,055 0,920 0,09 0,890 0,039 0,965 0,06 0,940 0,12 0,8991 0,0220 0,04480 0,790 0,055 1,087 0,15 0,823 0,065 0,835 0,055 0,850 0,09 0,810 0,039 0,885 0,06 0,830 0,12 0,8314 0,0220 0,044
100 0,902 0,055 1,061 0,15 0,804 0,065 0,825 0,055 0,840 0,09 0,800 0,039 0,867 0,06 0,840 0,12 0,8412 0,0220 0,044120 0,989 0,055 1,149 0,15 0,865 0,065 0,863 0,055 0,920 0,09 0,900 0,039 0,955 0,06 0,960 0,12 0,9133 0,0220 0,04440 -0,146 0,055 -0,864 0,15 -0,085 0,065 -0,358 0,055 -0,100 0,09 -0,170 0,04 -0,154 0,06 -0,160 0,16 -0,1446 0,0247 0,04960 -0,244 0,055 -0,913 0,15 -0,192 0,065 -0,361 0,055 -0,210 0,09 -0,260 0,04 -0,257 0,06 -0,250 0,16 -0,2623 0,0226 0,04580 -0,302 0,055 -0,949 0,15 -0,231 0,065 -0,351 0,055 -0,270 0,09 -0,320 0,04 -0,315 0,06 -0,320 0,16 -0,3075 0,0226 0,045
100 -0,308 0,055 -0,970 0,15 -0,258 0,065 -0,533 0,055 -0,280 0,09 -0,350 0,04 -0,335 0,06 -0,310 0,16 -0,3195 0,0247 0,049120 -0,339 0,055 -1,038 0,15 -0,278 0,065 -0,495 0,055 -0,270 0,09 -0,340 0,04 -0,322 0,06 -0,330 0,16 -0,3512 0,0226 0,045
PHASE DISPLACEMENT
Table 10. Corrected reference values for phase displacement without outliers (outliers underlined)
10/100
22/100
weighted mean δL [ ' ]
u(δr) [ ' ]
MIKES-HUT LCOEU(δr) [ ' ]
5/100
results and standard uncertainties of individual laboratories reference valuesSEPS LPT BEV OMH GUM METAS

kU
[kV/V]UN
[%]CHI^2 CHI^2/n-1 RB CHI^2 CHI^2/n-1 RB
40 -351 7 15 2,40 0,40 0,63 0,4714 0,0227 0,045 3,87 0,55 0,7460 -55 7 15 2,88 0,48 0,69 0,1907 0,0227 0,045 3,87 0,55 0,7480 119 7 14 11,67 1,67 1,29 0,0476 0,0227 0,045 5,69 0,81 0,90100 249 7 14 9,37 1,34 1,16 -0,0403 0,0227 0,045 7,21 1,03 1,02120 342 7 14 8,85 1,26 1,12 -0,0972 0,0227 0,045 5,62 0,80 0,9040 -438 6 13 5,19 0,74 0,86 1,0455 0,0220 0,044 15,90 2,27 1,5160 -215 6 13 3,56 0,51 0,71 0,8991 0,0220 0,044 9,81 1,40 1,1880 -89 6 13 3,61 0,52 0,72 0,8314 0,0220 0,044 4,64 0,66 0,81100 -16 6 13 3,13 0,45 0,67 0,8412 0,0220 0,044 4,82 0,69 0,83120 -9 6 13 3,19 0,46 0,67 0,9133 0,0220 0,044 8,77 1,25 1,1240 -97 7 14 2,24 0,32 0,57 -0,1446 0,0247 0,049 1,53 0,31 0,5560 -58 7 14 1,94 0,28 0,53 -0,2623 0,0226 0,045 4,86 0,81 0,9080 -32 7 14 3,98 0,57 0,75 -0,3075 0,0226 0,045 2,29 0,38 0,62100 -22 7 14 3,80 0,54 0,74 -0,3195 0,0247 0,049 1,77 0,35 0,59120 -23 7 14 2,23 0,32 0,56 -0,3512 0,0226 0,045 9,31 1,55 1,25
Table 11. CHI-square test for corrected results (corrected results underlined)
22/100
u(δr) [ ' ]
U(δr) [ ' ]
5/100
10/100
ratio error phase displacementreference values CHI-square test and Birge
ratioreference values CHI-square test and Birge
ratioweighted mean
εr [ppm]
u(εr) [ppm]
U(εr) [ppm]
weighted mean δL [ ' ]

kU
[kV/V]UN
[%]εL - εr [ppm]
U (∆εL) [ppm]
εL - εr [ppm]
U (∆εL) [ppm]
εL - εr [ppm]
U (∆εL) [ppm]
εL - εr [ppm]
U (∆εL) [ppm]
εL - εr [ppm]
U (∆εL) [ppm]
εL - εr [ppm]
U (∆εL) [ppm]
εL - εr [ppm]
U (∆εL) [ppm]
εL - εr [ppm]
U (∆εL) [ppm]
40 8 32 -4 99 6 42 -74 37 17 31 -10 19 -9 58 -21 6860 15 32 -2 99 8 42 -64 37 14 31 -12 19 -16 58 -9 6880 22 32 -10 99 16 43 -48 31 21 31 -1 20 -5 58 5 69
100 24 32 -9 99 14 43 -41 31 18 31 -3 20 -4 58 0 69120 22 32 -13 99 21 43 -38 31 18 31 -5 20 -4 58 3 6940 18 33 4 99 -5 36 -29 30 13 28 2 20 3 38 -14 6960 14 33 10 99 -2 36 -25 30 11 28 2 20 0 38 -6 6980 16 33 0 99 -2 36 -25 30 10 28 -1 20 4 38 -3 69
100 21 33 -1 99 -3 36 -20 30 7 28 -3 20 0 38 -2 69120 6 33 -7 99 2 36 -21 30 18 28 -3 20 -2 38 -3 6940 11 32 25 99 4 40 -7 29 -10 27 6 22 -19 79 -34 9460 5 32 -44 99 5 40 -5 29 -7 27 9 22 -15 79 -15 9480 11 32 -78 99 5 40 0 29 -9 27 8 22 -17 79 -18 94
100 5 32 -78 99 8 40 -3 29 -8 27 10 22 -15 79 -16 94120 -1 32 -43 99 3 40 1 29 -10 27 12 22 -16 79 -3 94
BEV OMH GUM METAS MIKES-HUT LCOE
Table 12. Differences between results of individual laboratories and reference value and their uncertainties for ratio error
5/100
10/100
22/100
CMI SEPS LPTdifferences of the participants results to the reference value and their uncertainties

kU
[kV/V]UN
[%]δL - δR
[ ' ]U (∆δL)
[ ' ]δL - δR
[ ' ]U (∆δL)
[ ' ]δL - δR
[ ' ]U (∆δL)
[ ' ]δL - δR
[ ' ]U (∆δL)
[ ' ]δL - δR
[ ' ]U (∆δL)
[ ' ]δL - δR
[ ' ]U (∆δL)
[ ' ]δL - δR
[ ' ]U (∆δL)
[ ' ]δL - δR
[ ' ]U (∆δL)
[ ' ]40 0,041 0,100 0,084 0,297 -0,003 0,153 0,027 0,111 -0,031 0,174 -0,051 0,063 0,056 0,111 -0,031 0,23660 0,045 0,100 0,090 0,297 -0,023 0,153 0,022 0,111 -0,031 0,174 -0,051 0,063 0,054 0,111 0,009 0,23680 0,048 0,100 0,102 0,297 -0,088 0,153 0,066 0,111 -0,028 0,174 -0,048 0,063 0,039 0,111 -0,018 0,236100 0,054 0,100 0,108 0,297 -0,109 0,153 0,078 0,111 -0,040 0,174 -0,050 0,063 0,037 0,111 0,000 0,236120 0,055 0,100 0,116 0,297 -0,127 0,153 0,035 0,111 -0,023 0,174 -0,033 0,063 0,028 0,111 0,047 0,23640 -0,102 0,101 0,310 0,297 0,111 0,122 -0,104 0,101 0,024 0,175 0,004 0,064 0,077 0,112 0,004 0,23660 -0,104 0,101 0,270 0,297 0,070 0,122 -0,036 0,101 0,021 0,175 -0,009 0,064 0,066 0,112 0,041 0,23680 -0,042 0,101 0,256 0,297 -0,008 0,122 0,004 0,101 0,019 0,175 -0,021 0,064 0,054 0,112 -0,001 0,236100 0,060 0,101 0,220 0,297 -0,037 0,122 -0,016 0,101 -0,001 0,175 -0,041 0,064 0,026 0,112 -0,001 0,236120 0,076 0,101 0,236 0,297 -0,049 0,122 -0,050 0,101 0,007 0,175 -0,013 0,064 0,042 0,112 0,047 0,23640 -0,001 0,098 -0,719 0,304 0,060 0,120 -0,213 0,121 0,045 0,173 -0,025 0,063 -0,009 0,109 -0,015 0,30660 0,019 0,100 -0,651 0,303 0,070 0,122 -0,099 0,100 0,052 0,174 0,002 0,066 0,005 0,111 0,012 0,30780 0,006 0,100 -0,641 0,303 0,076 0,122 -0,043 0,100 0,038 0,174 -0,012 0,066 -0,007 0,111 -0,012 0,307100 0,011 0,098 -0,651 0,304 0,061 0,120 -0,213 0,121 0,039 0,173 -0,031 0,063 -0,016 0,109 0,009 0,306120 0,013 0,100 -0,687 0,303 0,073 0,122 -0,144 0,100 0,081 0,174 0,011 0,066 0,029 0,111 0,021 0,307
differences of the participants results to the reference value and their uncertaintiesCMI SEPS LPT BEV OMH GUM METAS MIKES-HUT LCOE
Table 13. Differences between results of individual laboratories and reference value and their uncertainties for phase displacement
22/100
5/100
10/100
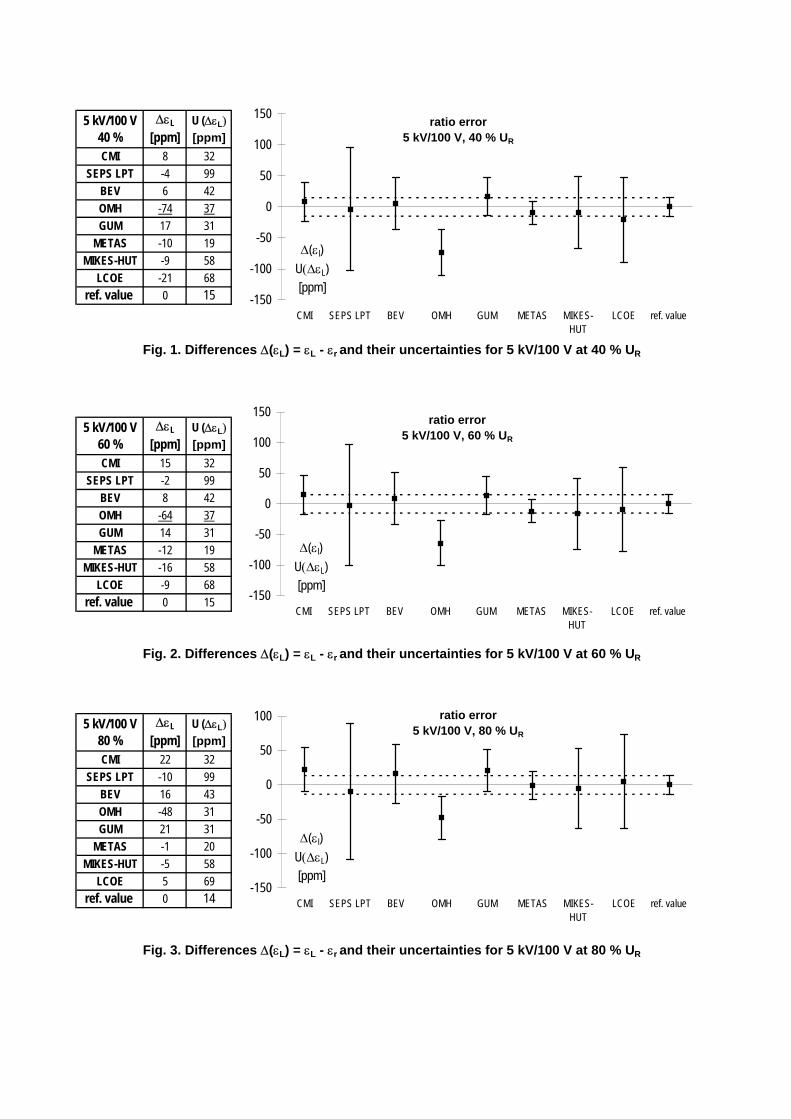
5 kV/100 V 40 %
∆εL
[ppm]U (∆εL) [ppm]
"+" Uref
"-" Uref
CMI 8 32 15 -15SEPS LPT -4 99 15 -15
BEV 6 42 15 -15OMH -74 37 15 -15GUM 17 31 15 -15
METAS -10 19 15 -15MIKES-HUT -9 58 15 -15
LCOE -21 68 15 -15ref. value 0 15 15 -15
5 kV/100 V 60 %
∆εL
[ppm]U (∆εL) [ppm]
"+" Uref
"-" Uref
CMI 15 32 15 -15SEPS LPT -2 99 15 -15
BEV 8 42 15 -15OMH -64 37 15 -15GUM 14 31 15 -15
METAS -12 19 15 -15MIKES-HUT -16 58 15 -15
LCOE -9 68 15 -15ref. value 0 15 15 -15
5 kV/100 V 80 %
∆εL
[ppm]U (∆εL) [ppm]
"+" Uref
"-" Uref
CMI 22 32 14 -14SEPS LPT -10 99 14 -14
BEV 16 43 14 -14OMH -48 31 14 -14GUM 21 31 14 -14
METAS -1 20 14 -14MIKES-HUT -5 58 14 -14
LCOE 5 69 14 -14ref. value 0 14 14 -14
Fig. 1. Differences ∆(εL) = εL - εr and their uncertainties for 5 kV/100 V at 40 % UR
Fig. 2. Differences ∆(εL) = εL - εr and their uncertainties for 5 kV/100 V at 60 % UR
Fig. 3. Differences ∆(εL) = εL - εr and their uncertainties for 5 kV/100 V at 80 % UR
ratio error5 kV/100 V, 40 % UR
-150
-100
-50
0
50
100
150
CMI SEPS LPT BEV OMH GUM METAS MIKES-HUT
LCOE ref. value
∆(εl)U(∆εL)[ppm]
ratio error5 kV/100 V, 60 % UR
-150
-100
-50
0
50
100
150
CMI SEPS LPT BEV OMH GUM METAS MIKES-HUT
LCOE ref. value
∆(εl)U(∆εL)[ppm]
ratio error5 kV/100 V, 80 % UR
-150
-100
-50
0
50
100
CMI SEPS LPT BEV OMH GUM METAS MIKES-HUT
LCOE ref. value
∆(εl)U(∆εL)[ppm]

5 kV/100 V 100 %
∆εL
[ppm]U (∆εL) [ppm]
"+" Uref
"-" Uref
CMI 24 32 14 -14SEPS LPT -9 99 14 -14
BEV 14 43 14 -14OMH -41 31 14 -14GUM 18 31 14 -14
METAS -3 20 14 -14MIKES-HUT -4 58 14 -14
LCOE 0 69 14 -14ref. value 0 14 14 -14
5 kV/100 V 120 %
∆εL
[ppm]U (∆εL) [ppm]
"+" Uref
"-" Uref
CMI 22 32 14 -14SEPS LPT -13 99 14 -14
BEV 21 43 14 -14OMH -38 31 14 -14GUM 18 31 14 -14
METAS -5 20 14 -14MIKES-HUT -4 58 14 -14
LCOE 3 69 14 -14ref. value 0 14 14 -14
Fig. 5. Differences ∆(εL) = εL - εr and their uncertainties for 5 kV/100 V at 120 % UR
Fig. 4. Differences ∆(εL) = εL - εr and their uncertainties for 5 kV/100 V at 100 % UR
ratio error5 kV/100 V, 100 % UR
-150
-100
-50
0
50
100
150
CMI SEPS LPT BEV OMH GUM METAS MIKES-HUT
LCOE ref. value
∆(εl)U(∆εL)[ppm]
ratio error5 kV/100 V, 120 % UR
-150
-100
-50
0
50
100
CMI SEPS LPT BEV OMH GUM METAS MIKES-HUT
LCOE ref. value
∆(εl)U(∆εL)[ppm]

∆εL
[ppm]U (∆εL) [ppm] "+" Uref "-" Uref
18 33 13 -134 99 13 -13-5 36 13 -13-29 30 13 -1313 28 13 -132 20 13 -133 38 13 -13
-14 69 13 -130 13 13 -13
∆εL
[ppm]U (∆εL) [ppm] "+" Uref "-" Uref
14 33 13 -1310 99 13 -13-2 36 13 -13-25 30 13 -1311 28 13 -132 20 13 -130 38 13 -13-6 69 13 -130 13 13 -13
∆εL
[ppm]U (∆εL) [ppm] "+" Uref "-" Uref
16 33 13 -130 99 13 -13-2 36 13 -13-25 30 13 -1310 28 13 -13-1 20 13 -134 38 13 -13-3 69 13 -130 13 13 -13
Fig. 7. Differences ∆(εL) = εL - εr and their uncertainties for 10 kV/100 V at 60 % UR
Fig. 8. Differences ∆(εL) = εL - εr and their uncertainties for 10 kV/100 V at 80 % UR
10 kV/100 V 80 %CMI
SEPS LPTBEVOMHGUM
10 kV/100 V 40 %CMI
SEPS LPTBEVOMHGUM
METASMIKES-HUT
LCOEref. value
10 kV/100 V 60 %CMI
Fig. 6. Differences ∆(εL) = εL - εr and their uncertainties for 10 kV/100 V at 40 % UR
SEPS LPTBEVOMHGUM
METASMIKES-HUT
LCOEref. value
METASMIKES-HUT
LCOEref. value
ratio error10 kV/100 V, 40 % UR
-150
-100
-50
0
50
100
150
CMI SEPS LPT BEV OMH GUM METAS MIKES-HUT
LCOE ref. value
∆(εl)U(∆εL)[ppm]
ratio error10 kV/100 V, 60 % UR
-100
-50
0
50
100
150
CMI SEPS LPT BEV OMH GUM METAS MIKES-HUT
LCOE ref. value
∆(εl)U(∆εL)[ppm]
ratio error10 kV/100 V, 80 % UR
-150
-100
-50
0
50
100
150
CMI SEPS LPT BEV OMH GUM METAS MIKES-HUT
LCOE ref. value
∆(εl)U(∆εL)[ppm]
∆εL
[ppm]U (∆εL) [ppm] "+" Uref "-" Uref
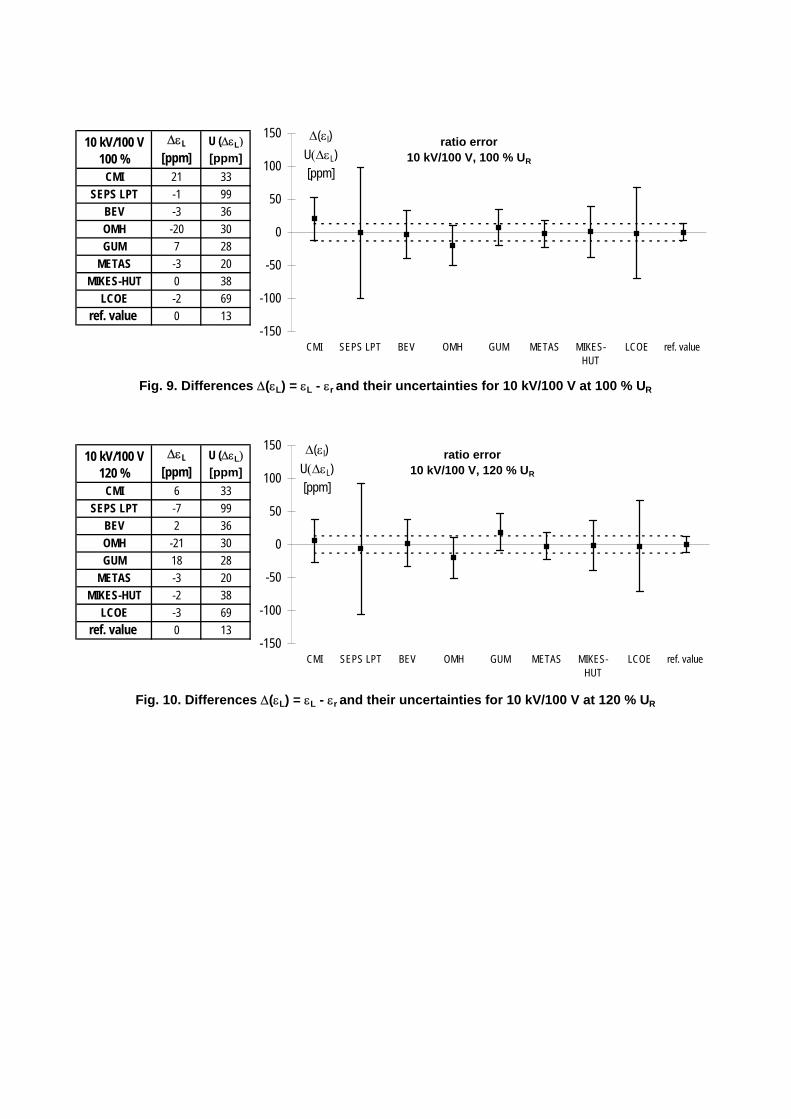
21 33 13 -13-1 99 13 -13-3 36 13 -13-20 30 13 -137 28 13 -13-3 20 13 -130 38 13 -13-2 69 13 -130 13 13 -13
∆εL
[ppm]U (∆εL) [ppm] "+" Uref "-" Uref
6 33 13 -13-7 99 13 -132 36 13 -13
-21 30 13 -1318 28 13 -13-3 20 13 -13-2 38 13 -13-3 69 13 -130 13 13 -13
Fig. 9. Differences ∆(εL) = εL - εr and their uncertainties for 10 kV/100 V at 100 % UR
Fig. 10. Differences ∆(εL) = εL - εr and their uncertainties for 10 kV/100 V at 120 % UR
10 kV/100 V 100 %
CMISEPS LPT
BEVOMHGUM
BEV
METASMIKES-HUT
LCOEref. value
10 kV/100 V 120 %
CMISEPS LPT
LCOEref. value
OMHGUM
METASMIKES-HUT
ratio error10 kV/100 V, 100 % UR
-150
-100
-50
0
50
100
150
CMI SEPS LPT BEV OMH GUM METAS MIKES-HUT
LCOE ref. value
∆(εl)U(∆εL)[ppm]
ratio error10 kV/100 V, 120 % UR
-150
-100
-50
0
50
100
150
CMI SEPS LPT BEV OMH GUM METAS MIKES-HUT
LCOE ref. value
∆(εl)U(∆εL)[ppm]

∆εL
[ppm]U (∆εL) [ppm] "+" Uref "-" Uref
11 32 14 -1425 99 14 -144 40 14 -14-7 29 14 -14-10 27 14 -146 22 14 -14
-19 79 14 -14-34 94 14 -140 14 14 -14
∆εL
[ppm]U (∆εL) [ppm]
"+" Uref "-" Uref
5 32 14 -14-44 99 14 -145 40 14 -14-5 29 14 -14-7 27 14 -149 22 14 -14
-15 79 14 -14-15 94 14 -140 14 14 -14
∆εL
[ppm]U (∆εL) [ppm]
"+" Uref "-" Uref
11 32 14 -14-78 99 14 -145 40 14 -140 29 14 -14-9 27 14 -148 22 14 -14
-17 79 14 -14-18 94 14 -140 14 14 -14
22 kV/100 V 40 %CMI
SEPS LPTBEVOMHGUM
METASMIKES-HUT
LCOEref. value
22 kV/100 V 60 %CMI
Fig. 11. Differences ∆(εL) = εL - εr and their uncertainties for 22 kV/100 V at 40 % UR
SEPS LPTBEVOMHGUM
METASMIKES-HUT
LCOEref. value
22 kV/100 V 80 %CMI
SEPS LPTBEVOMHGUM
METASMIKES-HUT
LCOEref. value
Fig. 13. Differences ∆(εL) = εL - εr and their uncertainties for 22 kV/100 V at 80 % UR
Fig. 12. Differences ∆(εL) = εL - εr and their uncertainties for 22 kV/100 V at 60 % UR
ratio error22 kV/100 V, 40 % UR
-150
-100
-50
0
50
100
150
CMI SEPS LPT BEV OMH GUM METAS MIKES-HUT
LCOE ref. value
∆(εl)U(∆εL)[ppm]
ratio error22 kV/100 V, 60 % UR
-200
-150
-100
-50
0
50
100
CMI SEPS LPT BEV OMH GUM METAS MIKES-HUT
LCOE ref. value
∆(εl)U(∆εL)[ppm]
ratio error22 kV/100 V, 80 % UR
-200
-150
-100
-50
0
50
100
CMI SEPS LPT BEV OMH GUM METAS MIKES-HUT
LCOE ref. value
∆(εl)U(∆εL)[ppm]

∆εL
[ppm]U (∆εL) [ppm]
"+" Uref "-" Uref
5 32 14 -14-78 99 14 -148 40 14 -14-3 29 14 -14-8 27 14 -1410 22 14 -14-15 79 14 -14-16 94 14 -140 14 14 -14
∆εL
[ppm]U (∆εL) [ppm]
"+" Uref "-" Uref
-1 32 14 -14-43 99 14 -143 40 14 -141 29 14 -14
-10 27 14 -1412 22 14 -14-16 79 14 -14-3 94 14 -140 14 14 -14
Fig. 15. Differences ∆(εL) = εL - εr and their uncertainties for 22 kV/100 V at 120 % UR
22 kV/100 V 100 %
CMI
SEPS LPT
SEPS LPTBEVOMHGUM
Fig. 14. Differences ∆(εL) = εL - εr and their uncertainties for 22 kV/100 V at 100 % UR
LCOEref. value
22 kV/100 V 120 %
CMI
LCOEref. value
OMHGUM
METASMIKES-HUT
BEV
METASMIKES-HUT
ratio error22 kV/100 V, 100 % UR
-200
-150
-100
-50
0
50
100
CMI SEPS LPT BEV OMH GUM METAS MIKES-HUT
LCOE ref. value
∆(εl)U(∆εL)[ppm]
ratio error22 kV/100 V, 120 % UR
-200
-150
-100
-50
0
50
100
150
CMI SMU BEV OMH GUM METAS MIKES-HUT
LCOE ref. value
∆(εl)U(∆εL)[ppm]
SEPSLPT

∆δL
[ ' ]U (∆δL)
[ ' ]"+" Uref "-" Uref
0,041 0,100 0,045 -0,0450,084 0,297 0,045 -0,045-0,003 0,153 0,045 -0,0450,027 0,111 0,045 -0,045-0,031 0,174 0,045 -0,045-0,051 0,063 0,045 -0,0450,056 0,111 0,045 -0,045-0,031 0,236 0,045 -0,0450,000 0,045 0,045 -0,045
∆δL
[ ' ]U (∆δL)
[ ' ]"+" Uref "-" Uref
0,045 0,100 0,045 -0,0450,090 0,297 0,045 -0,045-0,023 0,153 0,045 -0,0450,022 0,111 0,045 -0,045-0,031 0,174 0,045 -0,045-0,051 0,063 0,045 -0,0450,054 0,111 0,045 -0,0450,009 0,236 0,045 -0,0450,000 0,045 0,045 -0,045
∆δL
[ ' ]U (∆δL)
[ ' ]"+" Uref "-" Uref
0,048 0,100 0,045 -0,0450,102 0,297 0,045 -0,045-0,088 0,153 0,045 -0,0450,066 0,111 0,045 -0,045-0,028 0,174 0,045 -0,045-0,048 0,063 0,045 -0,0450,039 0,111 0,045 -0,045-0,018 0,236 0,045 -0,0450,000 0,045 0,045 -0,045
Fig. 16. Differences ∆(δL) = δL - δr and their uncertainties for 5 kV/100 V at 40 % UR
Fig. 17. Differences ∆(δL) = δL - δr and their uncertainties for 5 kV/100 V at 60 % UR
Fig. 18. Differences ∆(δL) = δL - δr and their uncertainties for 5 kV/100 V at 80 % UR
LCOEref. value
OMHGUM
METASMIKES-HUT
5 kV/100 V 80 %CMI
SEPS LPTBEV
5 kV/100 V 40 %CMI
SEPS LPTBEVOMHGUM
METASMIKES-HUT
LCOE
5 kV/100 V 60 %CMI
ref. value
METASMIKES-HUT
ref. value
LCOE
SEPS LPTBEVOMHGUM
phase displacement5 kV/100 V, 40 % UR
-0,3-0,2-0,10,00,10,20,30,40,5
CMI SEPS LPT BEV OMH GUM METAS MIKES-HUT
LCOE ref. value
∆(δl)U(∆δL)
[ ' ]
phase displacement5 kV/100 V, 60 % UR
-0,3-0,2-0,10,00,10,20,30,40,5
CMI SEPS LPT BEV OMH GUM METAS MIKES-HUT
LCOE ref. value
∆(δl)U(∆δL)
[ ' ]
phase displacement5 kV/100 V, 80 % UR
-0,3-0,2-0,10,00,10,20,30,40,5
CMI SEPS LPT BEV OMH GUM METAS MIKES-HUT
LCOE ref. value
∆(δl)U(∆δL)
[ ' ]

∆δL
[ ' ]U (∆δL)
[ ' ]"+" Uref "-" Uref
0,054 0,100 0,045 -0,0450,108 0,297 0,045 -0,045-0,109 0,153 0,045 -0,0450,078 0,111 0,045 -0,045-0,040 0,174 0,045 -0,045-0,050 0,063 0,045 -0,0450,037 0,111 0,045 -0,0450,000 0,236 0,045 -0,0450,000 0,045 0,045 -0,045
∆δL
[ ' ]U (∆δL)
[ ' ]"+" Uref "-" Uref
0,055 0,100 0,045 -0,0450,116 0,297 0,045 -0,045-0,127 0,153 0,045 -0,0450,035 0,111 0,045 -0,045-0,023 0,174 0,045 -0,045-0,033 0,063 0,045 -0,0450,028 0,111 0,045 -0,0450,047 0,236 0,045 -0,0450,000 0,045 0,045 -0,045
Fig. 20. Differences ∆(δL) = δL - δr and their uncertainties for 5 kV/100 V at 120 % UR
Fig. 19. Differences ∆(δL) = δL - δr and their uncertainties for 5 kV/100 V at 100 % UR
LCOEref. value
OMHGUM
METASMIKES-HUT
5 kV/100 V 120 %
CMISEPS LPT
BEV
METASMIKES-HUT
LCOEref. value
SEPS LPTBEVOMHGUM
5 kV/100 V 100 %
CMI
phase displacement5 kV/100 V, 100 % UR
-0,3-0,2-0,10,00,10,20,30,40,5
CMI SEPS LPT BEV OMH GUM METAS MIKES-HUT
LCOE ref. value
∆(δl)U(∆δL)
[ ' ]
phase displacement5 kV/100 V, 120 % UR
-0,4-0,3-0,2-0,10,00,10,20,30,40,5
CMI SEPS LPT BEV OMH GUM METAS MIKES-HUT
LCOE ref. value
∆(δl)U(∆δL)
[ ' ]

∆δL
[ ' ]U (∆δL)
[ ' ]"+" Uref "-" Uref
-0,102 0,101 0,044 -0,0440,310 0,297 0,044 -0,0440,111 0,122 0,044 -0,044-0,104 0,101 0,044 -0,0440,024 0,175 0,044 -0,0440,004 0,064 0,044 -0,0440,077 0,112 0,044 -0,0440,004 0,236 0,044 -0,0440,000 0,044 0,044 -0,044
∆δL
[ ' ]U (∆δL)
[ ' ]"+" Uref "-" Uref
-0,104 0,101 0,044 -0,0440,270 0,297 0,044 -0,0440,070 0,122 0,044 -0,044-0,036 0,101 0,044 -0,0440,021 0,175 0,044 -0,044-0,009 0,064 0,044 -0,0440,066 0,112 0,044 -0,0440,041 0,236 0,044 -0,0440,000 0,044 0,044 -0,044
∆δL
[ ' ]U (∆δL)
[ ' ]"+" Uref "-" Uref
-0,042 0,101 0,044 -0,0440,256 0,297 0,044 -0,044-0,008 0,122 0,044 -0,0440,004 0,101 0,044 -0,0440,019 0,175 0,044 -0,044-0,021 0,064 0,044 -0,0440,054 0,112 0,044 -0,044-0,001 0,236 0,044 -0,0440,000 0,044 0,044 -0,044
10 kV/100 V 40 %CMI
SEPS LPTBEVOMHGUM
METASMIKES-HUT
LCOEref. value
10 kV/100 V 60 %
Fig. 21. Differences ∆(δL) = δL - δr and their uncertainties for 10 kV/100 V at 40 % UR
CMISEPS LPT
BEVOMHGUM
METASMIKES-HUT
LCOEref. value
10 kV/100 V 80 %CMI
SEPS LPT
Fig. 22. Differences ∆(δL) = δL - δr and their uncertainties for 10 kV/100 V at 60 % UR
BEVOMHGUM
METASMIKES-HUT
LCOEref. value
Fig. 23. Differences ∆(δL) = δL - δr and their uncertainties for 10 kV/100 V at 80 % UR
phase displacement10 kV/100 V, 40 % UR
-0,3
-0,1
0,1
0,3
0,5
0,7
CMI SEPS LPT BEV OMH GUM METAS MIKES-HUT
LCOE ref. value
∆(δl)U(∆δL)
[ ' ]
phase displacement10 kV/100 V, 60 % UR
-0,3
-0,1
0,1
0,3
0,5
0,7
CMI SEPS LPT BEV OMH GUM METAS MIKES-HUT
LCOE ref. value
∆(δl)U(∆δL)
[ ' ]
phase displacement10 kV/100 V, 80 % UR
-0,3
-0,1
0,1
0,3
0,5
0,7
CMI SEPS LPT BEV OMH GUM METAS MIKES-HUT
LCOE ref. value
∆(δl)U(∆δL)
[ ' ]

∆δL
[ ' ]U (∆δL)
[ ' ]"+" Uref "-" Uref
0,060 0,101 0,044 -0,0440,220 0,297 0,044 -0,044-0,037 0,122 0,044 -0,044-0,016 0,101 0,044 -0,044-0,001 0,175 0,044 -0,044-0,041 0,064 0,044 -0,0440,026 0,112 0,044 -0,044-0,001 0,236 0,044 -0,0440,000 0,044 0,044 -0,044
∆δL
[ ' ]U (∆δL)
[ ' ]"+" Uref "-" Uref
0,076 0,101 0,044 -0,0440,236 0,297 0,044 -0,044-0,049 0,122 0,044 -0,044-0,050 0,101 0,044 -0,0440,007 0,175 0,044 -0,044-0,013 0,064 0,044 -0,0440,042 0,112 0,044 -0,0440,047 0,236 0,044 -0,0440,000 0,044 0,044 -0,044
Fig. 25. Differences ∆(δL) = δL - δr and their uncertainties for 10 kV/100 V at 120 % UR
10 kV/100 V 100 %
CMISEPS LPT
BEVOMHGUM
METASMIKES-HUT
LCOEref. value
10 kV/100 V 120 %
CMISEPS LPT
Fig. 24. Differences ∆(δL) = δL - δr and their uncertainties for 10 kV/100 V at 100 % UR
BEV
LCOEref. value
OMHGUM
METASMIKES-HUT
phase displacement10 kV/100 V, 100 % UR
-0,3
-0,1
0,1
0,3
0,5
0,7
CMI SEPS LPT BEV OMH GUM METAS MIKES-HUT
LCOE ref. value
∆(δl)U(∆δL)
[ ' ]
phase displacement10 kV/100 V, 120 % UR
-0,3
-0,1
0,1
0,3
0,5
0,7
CMI SEPS LPT BEV OMH GUM METAS MIKES-HUT
LCOE ref. value
∆(δl)U(∆δL)
[ ' ]
∆δL
[ ' ]U (∆δL)
[ ' ]"+" Uref "-" Uref
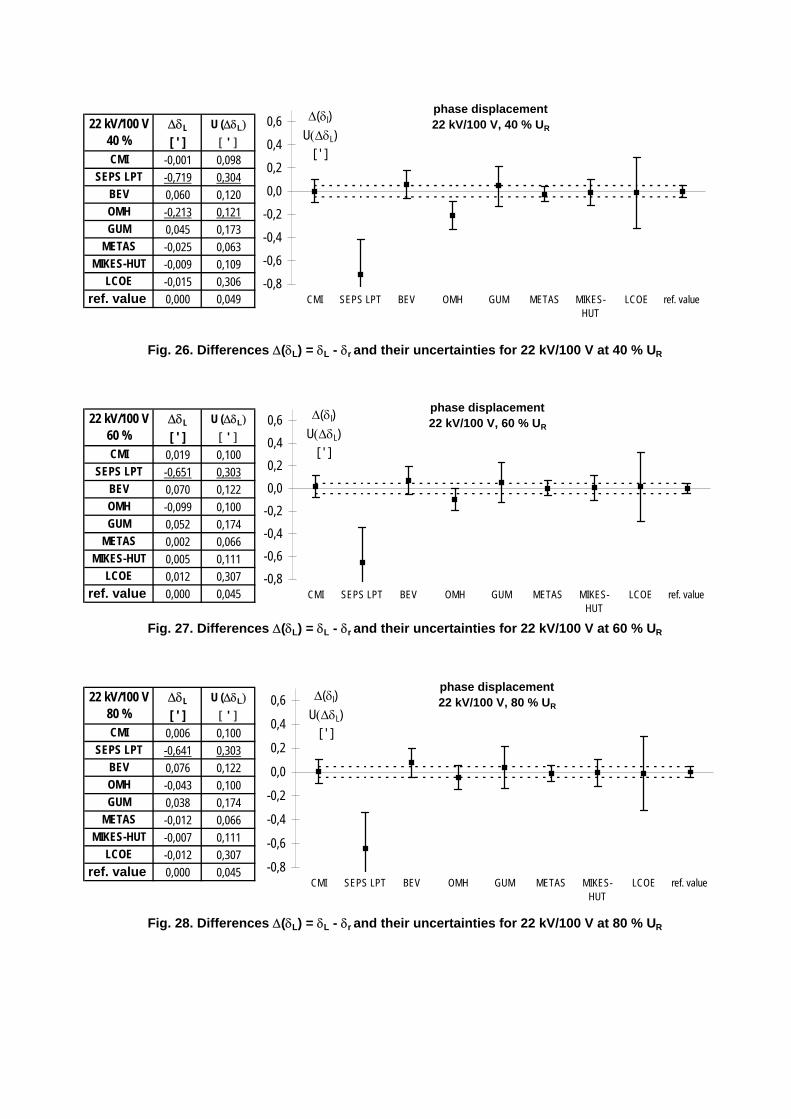
-0,001 0,098 0,049 -0,049-0,719 0,304 0,049 -0,0490,060 0,120 0,049 -0,049-0,213 0,121 0,049 -0,0490,045 0,173 0,049 -0,049-0,025 0,063 0,049 -0,049-0,009 0,109 0,049 -0,049-0,015 0,306 0,049 -0,0490,000 0,049 0,049 -0,049
∆δL
[ ' ]U (∆δL)
[ ' ]"+" Uref "-" Uref
0,019 0,100 0,045 -0,045-0,651 0,303 0,045 -0,0450,070 0,122 0,045 -0,045-0,099 0,100 0,045 -0,0450,052 0,174 0,045 -0,0450,002 0,066 0,045 -0,0450,005 0,111 0,045 -0,0450,012 0,307 0,045 -0,0450,000 0,045 0,045 -0,045
∆δL
[ ' ]U (∆δL)
[ ' ]"+" Uref "-" Uref
0,006 0,100 0,045 -0,045-0,641 0,303 0,045 -0,0450,076 0,122 0,045 -0,045-0,043 0,100 0,045 -0,0450,038 0,174 0,045 -0,045-0,012 0,066 0,045 -0,045-0,007 0,111 0,045 -0,045-0,012 0,307 0,045 -0,0450,000 0,045 0,045 -0,045
Fig. 28. Differences ∆(δL) = δL - δr and their uncertainties for 22 kV/100 V at 80 % UR
MIKES-HUTLCOE
ref. value
BEVOMHGUM
METAS
ref. value
22 kV/100 V 80 %CMI
SEPS LPT
Fig. 27. Differences ∆(δL) = δL - δr and their uncertainties for 22 kV/100 V at 60 % UR
GUMMETAS
MIKES-HUTLCOE
CMISEPS LPT
BEVOMH
MIKES-HUTLCOE
ref. value
22 kV/100 V 60 %
Fig. 26. Differences ∆(δL) = δL - δr and their uncertainties for 22 kV/100 V at 40 % UR
BEVOMHGUM
METAS
22 kV/100 V 40 %CMI
SEPS LPT
phase displacement22 kV/100 V, 40 % UR
-0,8
-0,6
-0,4
-0,2
0,0
0,2
0,4
0,6
CMI SEPS LPT BEV OMH GUM METAS MIKES-HUT
LCOE ref. value
∆(δl)U(∆δL)
[ ' ]
phase displacement22 kV/100 V, 60 % UR
-0,8-0,6-0,4-0,20,00,20,40,6
CMI SEPS LPT BEV OMH GUM METAS MIKES-HUT
LCOE ref. value
∆(δl)U(∆δL)
[ ' ]
phase displacement22 kV/100 V, 80 % UR
-0,8
-0,6
-0,4
-0,2
0,0
0,2
0,4
0,6
CMI SEPS LPT BEV OMH GUM METAS MIKES-HUT
LCOE ref. value
∆(δl)U(∆δL)
[ ' ]

∆δL
[ ' ]U (∆δL)
[ ' ]"+" Uref "-" Uref
0,011 0,098 0,049 -0,049-0,651 0,304 0,049 -0,0490,061 0,120 0,049 -0,049-0,213 0,121 0,049 -0,0490,039 0,173 0,049 -0,049-0,031 0,063 0,049 -0,049-0,016 0,109 0,049 -0,0490,009 0,306 0,049 -0,0490,000 0,049 0,049 -0,049
∆δL
[ ' ]U (∆δL)
[ ' ]"+" Uref "-" Uref
0,013 0,100 0,045 -0,045-0,687 0,303 0,045 -0,0450,073 0,122 0,045 -0,045-0,144 0,100 0,045 -0,0450,081 0,174 0,045 -0,0450,011 0,066 0,045 -0,0450,029 0,111 0,045 -0,0450,021 0,307 0,045 -0,0450,000 0,045 0,045 -0,045
LCOEref. value
Fig. 29. Differences ∆(δL) = δL - δr and their uncertainties for 22 kV/100 V at 100 % UR
MIKES-HUT
OMHGUM
METAS
CMI
Fig. 30. Differences ∆(δL) = δL - δr and their uncertainties for 22 kV/100 V at 120 % UR
LCOEref. value
22 kV/100 V 120 %
CMISEPS LPT
BEV
METASMIKES-HUT
SEPS LPTBEVOMHGUM
22 kV/100 V 100 %
phase displacement22 kV/100 V, 100 % UR
-0,8
-0,6
-0,4
-0,2
0,0
0,2
0,4
0,6
CMI SEPS LPT BEV OMH GUM METAS MIKES-HUT
LCOE ref. value
∆(δl)U(∆δL)
[ ' ]
phase displacement22 kV/100 V, 120 % UR
-0,8
-0,6
-0,4
-0,2
0,0
0,2
0,4
0,6
CMI SEPS LPT BEV OMH GUM METAS MIKES-HUT
LCOE ref. value
∆(δl)U(∆δL)
[ ' ]