FINAL REPORT DEVELOPMENT OF LEFT-TURN … · Federal Highway Administration ... commonly called the...
72
FINAL REPORT DEVELOPMENT OF LEFT-TURN LANE GUIDELINES FOR SIGNALIZED AND UNSIGNALIZED INTERSECTIONS Vijayendra R. Lakkundi Graduate Research Assistant Brian Park, Ph.D. Faculty Research Scientist and Research Assistant Professor of Civil Engineering Nicholas J. Garber, Ph.D., P.E. Faculty Research Engineer and Professor of Civil Engineering Michael D. Fontaine, P.E. Research Scientist Virginia Transportation Research Council (A Cooperative Organization Sponsored Jointly by the Virginia Department of Transportation and the University of Virginia) In Cooperation with the U.S. Department of Transportation Federal Highway Administration Charlottesville, Virginia March 2004 VTRC 04-R11
Transcript of FINAL REPORT DEVELOPMENT OF LEFT-TURN … · Federal Highway Administration ... commonly called the...

FINAL REPORT
DEVELOPMENT OF LEFT-TURN LANE GUIDELINES FOR SIGNALIZED AND UNSIGNALIZED INTERSECTIONS
Vijayendra R. Lakkundi Graduate Research Assistant
Brian Park, Ph.D.
Faculty Research Scientist and
Research Assistant Professor of Civil Engineering
Nicholas J. Garber, Ph.D., P.E. Faculty Research Engineer
and Professor of Civil Engineering
Michael D. Fontaine, P.E.
Research Scientist
Virginia Transportation Research Council (A Cooperative Organization Sponsored Jointly by the
Virginia Department of Transportation and the University of Virginia)
In Cooperation with the U.S. Department of Transportation
Federal Highway Administration
Charlottesville, Virginia
March 2004 VTRC 04-R11

ii
DISCLAIMER
The contents of this report reflect the views of the authors, who are responsible for the facts and the accuracy of the data presented herein. The contents do not necessarily reflect the official views or policies of the Virginia Department of Transportation, the Commonwealth Transportation Board, or the Federal Highway Administration. This report does not constitute a standard, specification, or regulation.
Copyright 2004 by the Commonwealth of Virginia.

iii
ABSTRACT
It is generally accepted that the level of service (LOS) at intersections significantly affects the overall LOS of the road system. It is also known that the LOS at an intersection can be adversely affected by frequently allowing left-turning vehicles to block through traffic. In addition, crash rates tend to be higher at intersections than on through sections of a road. The separation of left-turning vehicles from through traffic is therefore an important condition for the safe and effective operation of intersections.
Existing guidelines for installing left-turn lanes have several limitations. They are mainly based on the traffic volumes at the intersection, and they use deterministic models with fixed gap acceptance and/or left-turn maneuver times. In addition, the guidelines for left-turn lanes for unsignalized intersections and signalized intersections must be specific for the type of intersection.
In this study, new left-turn guidelines for both unsignalized and signalized intersections were developed on the basis of well-validated event-based simulation programs. Guidelines for unsignalized intersections were based on the percentage of left turns blocking through vehicles, whereas the guidelines for signalized intersections were developed using a minimum left-turn volume of either 85% left-turn capacity or LOS E delay (55 seconds/vehicle). In addition to the general guidelines, a prioritization tool that can be used to prioritize candidate intersections was developed. The prioritization tool accounts for both operational and safety aspects.

FINAL REPORT
DEVELOPMENT OF LEFT-TURN LANE GUIDELINES FOR SIGNALIZED AND UNSIGNALIZED INTERSECTIONS
Vijayendra R. Lakkundi
Graduate Research Assistant
Brian Park, Ph.D. Research Assistant Professor of Civil Engineering
and Faculty Research Scientist
Nicholas J. Garber, Ph.D.
Professor of Civil Engineering and
Faculty Research Scientist
Michael D. Fontaine, P.E. Research Scientist
INTRODUCTION
It is generally accepted that the level of service (LOS) at intersections can significantly affect the overall LOS of a road. It is also known that the LOS at an intersection can be adversely affected by frequently allowing the left-turning vehicles to block the through traffic. Crash rates also tend to be higher at intersections than on through sections of a road. The separation of left-turning vehicles from through traffic can be an important condition for the safe and effective operation of an intersection.
Existing guidelines use the volume of left-turn traffic, the volume of through traffic, and the volume of traffic opposing the left-turn maneuver to determine whether a left-turn lane is needed at an intersection. The most frequently applied guidelines for determining the need for a left-turn lane were developed from analytical equations for specific left-turn percentages for unsignalized intersections and for specific g/C ratios for signalized intersections. The unsignalized guidelines are available as tables in the American Association of State Highway and Transportation Officials� (AASHTO) A Policy on the Geometric Design of Highways and Streets, commonly called the Green Book (2001). These guidelines are not available for all percentages of left-turning vehicles and do not go below 5% left turns. In the development of these guidelines, the researchers also assumed a fixed value for the critical gap, which represents a simplification of reality. In contrast to unsignalized intersections, there are no widely accepted guidelines for installing left-turn lanes at signalized intersections. For the guidelines that do exist, the researchers did not develop separate guidelines for different percentages of left-turning vehicles.

2
PURPOSE AND SCOPE The purpose of this study was to develop left-turn lane guidelines for signalized and unsignalized intersections. Specific objectives were as follows:
• Critically evaluate existing guidelines for providing left-turn lanes at unsignalized and signalized intersections through a literature review.
• Determine how engineers at the Virginia Department of Transportation (VDOT) use
existing guidelines. • Develop, calibrate, and validate event-based simulation models to simulate traffic at
unsignalized and simple two-phase signalized intersections. • Develop new guidelines for left-turn lanes using the event-based simulation models
that are applicable for all turning percentages. • Create a prioritization system for ranking the need for left-turn lane improvements
among a number of candidate intersections.
This study was limited to developing guidelines for installing left-turn lanes at signalized and unsignalized intersections. Developing guidelines for left-turn signal phasing was not within the scope of this study. Although each event-based simulation program used for developing guidelines in this project could theoretically simulate any condition seen in the field, the scope of each program was limited to ensure that program coding could be completed in a timely manner. Thus, the scope of the program was defined as follows:
• A maximum of four approaches can be simulated using this program. • The program can handle all kinds of lane sharing and also accommodate up to four
lanes on a given approach. • Unsignalized intersections on undivided highways are considered for only left-turn
lane guidelines. VDOT�s Road Design Manual (2002) dictates that left-turn lanes are to be provided for traffic on non-access controlled divided highways.
• The signalized intersection program can simulate actuated intersections but assumes
simple two-phase signals.
• The model is applicable only for left-turn lane analysis and cannot be used for right-turn lane analysis.
• At signalized intersections, left-turns on the subject link must be permitted.
• The effect of available sight distance and grades on the approaches is not examined
explicitly.

3
• The signalized program is a decision making tool for installing a left-turn lane and should not be used to determine left-turn phasing.
METHODOLOGY The research approach in this study involved (1) a literature review, (2) a survey on the usage of existing left-turn lane guidelines, (3) field data collection and reduction, (4) development of event-based simulation model, (5) validation of the simulation model, and (6) development of new guidelines.
Literature Review
The current literature and previous research in this area were reviewed as the first task in this study. The Virginia Transportation Research Council (VTRC) library and the University of Virginia libraries were used for this purpose.
Survey on Usage of Existing Left-turn Lane Guidelines
In order to understand how VDOT engineers use current left-turn lane guidelines, an online survey of VDOT resident engineers and district traffic engineers was conducted. A complete questionnaire of the survey is provided in Appendix A.
Field Data Collection and Reduction Data Collection Site Selection
Field data had to be collected at existing intersections to gather information that could be used to calibrate and validate the event-based simulation programs. The district traffic engineers were asked to provide sites that were suitable for the study. All sites had to have a shared lane (left and through), and signalized sites had to have permitted phasing for the left-turning vehicles. Sites that had large opposing volumes and large delays for left-turning traffic were preferred. Potential sites had to meet the following criteria:
Unsignalized site requirements: • shared lane (left + through) on the subject link • frequent instances of left-turn vehicles blocking through vehicles • adequate shoulder width on the approaches so that the data collection crew could
work safely

4
Signalized site requirements: • shared lane (left + through) on the subject link • frequent instances of left-turn vehicles blocking through vehicles • adequate shoulder width on the approach to safely park the Smart Travel Van (STV)
(Other safety conditions, such as no power cables within 10 feet of the mast, are also required for the safe operation of the STV.)
• permitted left turns on the subject link and the opposing link.
The research team visited 54 sites (11 signalized intersections and 40 unsignalized intersections) suggested by the district traffic engineers and also obtained average annual daily traffic (AADT) counts on available sites. Based on traffic volumes and site characteristics, these sites were classified as �good,� �intermediate,� or �inappropriate.� The good sites were the ones where data collection could be carried out safely, and the inappropriate sites were the sites where data collection was not possible because of safety concerns. For some sites, although the safety criteria were met, sufficient volumes were not observed during the visit. Since there was a possibility of volumes being higher during peak hours, these sites were classified as intermediate.
Data Collection at Signalized Intersections
The STV was used to collect data on traffic volume, queue length, speed and headways at signalized intersections. The STV is a state-of�the-art van equipped with a computer and two cameras on the mast that can capture the traffic data. The Autoscope program was installed in the computer of the STV. Autoscope is a video detection package, which collects traffic volumes, speeds, time headways, etc. The mast of the STV measures 45 feet when fully raised and gives a bird�s-eye view of the intersection. This van was used because it could capture the full view of the intersection including (in some cases) the signal heads. Data were collected for approximately 2 hours at each intersection during either the morning or evening peak hours.
The Autoscope program was used to set up speed and count detectors. The count detector did not have any length in the direction of the traffic flow and counted only the number of vehicles that passed over it. It recorded the time at which the vehicle was activated and deactivated the detector. These times were recorded to within a 1-second accuracy. There was also a global positioning system (GPS) in the STV that recorded the times of each detector activation and de-activation within a 1-millisecond accuracy. This was used to calculate the headways in the opposing flow. The cameras of the STV covered the subject link approach so that the end of the queue was visible (see Figure 1). From these tapes, the queue length (number of cars) at the end of each red phase was calculated in the laboratory. This was used during the validation of the simulation program. The approximate location of a typical count detector is also shown on the subject link and opposing link of Figure 1. Actuated signalized intersections do not maintain a constant cycle length since the phase
lengths change depending on arrival patterns. Furthermore, the camera on the STV did not always capture the signal heads. Therefore a computer program was written to record signal-
timing changes. Whenever the user pressed a character in the keyboard, the program recorded the character and time. This program was installed on the laptop that was carried to the field during

5
Figure 1. Layout of Data Collection Scheme the data collection. Whenever a phase change occurred, a key (�r� for red, �g� for green, and �y� for yellow) was pressed. The difference of the times between consecutive values in the text file gives the time for which the signal showed green, yellow, or red. The changes in signal phase times observed in the field were obtained using these procedures. All the signalized sites recommended by the engineers were fully actuated or semi-actuated; hence the cycle lengths as well as the green times were not constant.

6
Data Collection at Unsignalized Intersections
At unsignalized intersections, three cameras mounted on tripods were used for data collection. Two were Sony DV cameras that gave a time stamp in 1/30th of a second. This was necessary since the gap acceptances and rejections required an accuracy of less than 1 second. These two DV cameras (Cameras 1 and 3 in Figure 2) were placed at the ends of the
Figure 2. Typical Camera Coverage at Unsignalized Intersection

7
intersections looking at opposing and subject link flows. The third camera was placed to cover the intersection area as sometimes the queue blocked the view of the other two cameras, thereby preventing the recording of the gaps that were rejected or accepted. The DV cameras collected the traffic volumes while the gap acceptance/rejections were collected from the center camera and/or the DV cameras. Figure 2 shows the typical camera coverage that was followed for the data collection at unsignalized intersections. The subject link and the opposing link are also shown in Figure 2. Data were also collected for approximately 2 hours at each intersection during either the morning or evening peak hours. Data Reduction
The video data were processed to determine and/or verify information on arrivals, gap acceptances, and traffic counts. Vehicle arrival times on both subject and opposing links were recorded. In addition, vehicle turning movements were also recorded. While a left-turning vehicle on the subject link was waiting for an acceptable gap, time gaps of opposing vehicle and their acceptance or rejection were recorded. Geometric and Traffic Data
The geometric and traffic characteristics of each intersection were identified and used as input data for the event-based simulation program developed in this project. These data included:
• number of approaches • number of lanes on each approach • turn attribute of each lane (left only, right only, etc.) • volumes on each approach • percentage of turns on each approach • operating speed.
Critical Gap Data
The critical gap of the drivers plays an important role in the delays experienced by the left-turning vehicles and therefore will determine whether the shared lane will be blocked or not. This dictates the need for the separate left-turn lane. It was necessary to measure the critical gap of the vehicles in the field to examine left-turn behavior.
As mentioned earlier, for both signalized and unsignalized intersections, the arrival time at the stop line of each left-turning vehicle on the subject link was recorded. The arrival time at the stop line of each opposing vehicle was also recorded. The difference in these times would be the gap that is available for the left-turning vehicle. The left-turning vehicle would accept or reject this available gap; therefore, all these gaps were measured and classified as �R� for rejections and �A� for acceptances. A curve showing the rejections and acceptances was plotted for that particular site. The intersection of the curve for A and R gave the gap above which drivers would accept and below which drivers would reject, which is the critical gap at that

8
particular site. This was done for both signalized and unsignalized intersections. The procedure described here can be found in Garber and Hoel (1999). Assume that t1 and t2 are two times that differ by ∆t, t2 = t1 + ∆t. Using similar triangles, it could be shown that the critical gap, tc, is
)()()(
1 mrpnmrtttc −+−
−∆+= [1]
where
m = number of accepted gaps less than t1 r = number of rejected gaps greater than t1 n = number of accepted gaps less than t2 p = number of rejected gaps greater than t2.
This calculation of critical gaps was done for all the sites and was used for the simulation
program input. The results of these sites from the program were compared with the field values. Measures of Effectiveness Data
The measures of effectiveness (MOEs) data that were reduced from the tapes of the data collection sites were used to validate the event-based simulation program. The MOEs examined included �number of stopped left-turning vehicles� at unsignalized sites and �green times on the subject link,� �average left-turn vehicle stopped delay,� and the �maximum queue length on the subject link� at signalized sites. Since the traffic signal controller at these sites was actuated, the green times were not constant for all cycles. The main MOE data that were extracted from the videotapes for signalized and unsignalized intersection are described as follows:
• MOEs for signalized intersections. The queues that were present (on the subject link) at the beginning of green times were counted from the videotapes. These were used in validating the simulation program. In other words, the queue length counter was incorporated in the program and the queue lengths generated by the program was compared with the ones seen in the field. In addition to the queue length, left-turn vehicle delay was also reduced from the videotapes. The times of left-turn vehicle arrivals and departures were recorded from the videotapes, and each left-turn vehicle delay was calculated by subtracting arrival time from departure time. An average left-turn vehicle delay from the field was compared with the distribution of average left-turn delays from the simulation output.
• MOEs for unsignalized intersections. The MOE used for validation of the
unsignalized model was �number of left-turning vehicles that were stopped� on the subject link. These data were reduced at every site by examining the subject link and manually counting the number of left-turning vehicles that had to stop at the intersection.

9
Development of Event-Based Simulation Model
Event-based simulation programs were developed in this study because existing commercial programs do not directly provide various MOEs needed for developing left-turn lane guidelines. In addition, an event-based simulation tends to be easier to code and execute faster than microscopic simulations, given that the analyst cannot use a commercial package and thus will have to develop the original software.
The event-based simulation programs developed in the project are part of a complete package named the Left Turn Guidelines Analysis Package (LTGAP). In an event-based simulation, the program has a list of events and jumps (in time) from one event to another. For example, the arrival of the vehicles on a particular approach is an event, as are the departures and signal phase changes. The system time moves in steps from one event to another rather than moving in a fixed time steps. The LTGAP is composed of three parts: (1) unsignalized intersection simulation program, (2) signalized intersection simulation program, and (3) user interface for data entry and display of results.
The unsignalized and signalized intersection simulation programs were written in C++, and the interface was developed using Microsoft Visual Studio .Net program.
Validation of Simulation Model
Each event-based simulation model was validated using observed data from the field. As mentioned earlier, the model for the unsignalized intersection was validated based on the number of left-turn vehicle stopped, whereas the model for signalized intersections was validated using maximum queue length and left-turn stopped delay.
Multiple simulation runs were made to account for variability in stochastic simulation program output. A total of 100 runs were made for each test site, and the distribution of the measures of effectiveness was compared with the field data using a histogram.
Development of New Guidelines
The guidelines developed by previous researchers were investigated, and the possibility of developing guidelines based on pure operational savings (such as delay savings) was also investigated by conducting a preliminary cost-benefit analysis. Separate guidelines were developed for signalized and unsignalized intersections using the event-based simulation program developed and validated in this study.

10
Guidelines for Unsignalized Intersections
The event-based simulation program was run for various combinations of input variables to develop proposed left-turn lane guidelines. The follow levels of input variables were used to generate new guidelines:
• percentage of left-turning vehicles = 3%, 5%, 10%, 20%, 30% • operating speed = 40 mph, 50 mph, 60 mph • advancing volume, VA, = 100 to 800 vehicles per hour (vph) by 50-vph increment • opposing volume, VO, = 100 to 800 vph by 50-vph increment.
The maximum advancing and opposing volumes of 800 vph were used because 800 is the
practically highest acceptable volume that can be used for determining left-turn lanes at unsignalized intersection. Traffic volumes of more than 800 vph would justify signalization of the intersection. The criterion used for developing the guidelines was the percentage of time through-vehicles were delayed. This was interpolated to find the volumes at their critical values. This was plotted for all combinations of left-turn percentages. The critical percentages of time that through vehicles were delayed were adopted from those used by Harmelink (1967). Guidelines for Signalized Intersections Pre-timed Signals
The program was run for all combinations of g/C (0.1 through 0.8 in 0.1 increments), cycle length (60, 80, and 100 seconds), number of lanes (four and six lanes), and percentage of left-turn vehicles (3%, 5%, 10%, 20%, and 30%). The capacity of the advancing volume, VA, and the left-turn delay were calculated using the event-based simulation model. The proposed guidelines recommended that a left-turn lane be installed when the volume-capacity (v/c) ratio exceeded 0.85 or the delay exceeded 55 seconds/vehicle (LOS E cutoff). The guidelines were developed in the form of tables. Actuated Signals The simulation program could be applied (using the LTGAP interface) to any actuated controller settings. In the case of actuated signals, the guidelines were not developed in the form of tables and/or graphs. This is due to the complexity involved in the actuated signal control. Average cycle length and green times are to be estimated through multiple simulation runs and are to be applied to pretimed signalized guidelines. Length of Left-turn Lane In case the proposed left-turn lane guidelines recommend the installation of a left-turn lane, the length of the lane needs to be determined. Given that the purpose of installing a left-

11
turn lane is to prevent left-turn overflows, the probability of left-turn lane overflows for varying left-turn bay lengths was investigated using the event-based simulation program. Recommended left-turn lane length is provided in the form of a graph at a given traffic volume, geometry, and intersection control type. In other words, the probability of left-turn bay overflow is plotted against left-turn bay length. At each left-turn bay length, 100 simulation runs were made to obtain an average left-turn bay overflow probability. Left-turn bay length was evaluated from 0 to 1,200 feet in every 50 feet for signalized intersections and was varied from 0 to 500 feet in every 50 feet for unsignalized intersections. Prioritization Tool
Traffic engineers are sometimes faced with a problem of allocating limited funds to a set of candidate intersections that are considered for left-turn lane installation. Under these circumstances, a ranking methodology that prioritizes the candidate intersections on the basis of both safety and mobility measures is needed. A unique prioritization tool that considers both operational and safety aspects of installing left-turn lanes was developed in this project. This tool can be used to provide rankings of multiple candidate intersections.
The prioritization methodology tool is applicable for both signalized and unsignalized intersections. The ranking score of individual site is calculated using the following equation.
isiioi NSWNOWRS ×+×= [2] where RSi = ranking score of i-th intersection Wo = weight factor for mobility measure (default value = 0.5) NOi = normalized operational measure score of i-th intersection Ws = weight factor for safety surrogate measure (default value = 0.5) NSi = normalized safety surrogate measure score of i-th intersection Wo + Ws = 1. The normalized operational measure score at intersection i is calculated as follows.
( )OONO i
i max= [3]
where Oi = operational measure at intersection i max(O) = maximum operational measure from all candidate intersections. As noted earlier, unsignalized and signalized intersections are using different operational measures. The percentage of left-turn vehicles blocking through vehicles is used for unsignalized intersection, and the v/c ratio and left-turn delay of left-turn vehicles are used for signalized intersections.

12
The normalized safety surrogate score, NSi, is based on two conflict opportunities: left-turn and rear-end conflict opportunites. The reduction in confict opportunities with added left-turn lane is calculated, and then it is normalized by dividing maximum value among candidate intersections.
( )COCONSi ∆
∆=max
[4]
where ∆COi = reduction in conflict opportunities with added left-turn lane at intersection i max(∆COi) = maximum reduction value from all candidate intersections.
The conflict opportunities calculated in the event-based simulation program are used as a safety surrogate measure. A left-turn conflict opportunity is assumed to occur when a left-turn maneuver is made within 2 seconds of the critical gap period, whereas rear-end conflicts occur whenever a vehicle joins a queue. Both left-turn and rear-end conflict opportunities are treated equally. Detailed procedures on the calculation of conflict opportunities can be found in Ha and Berg (1995).
RESULTS
Literature Review Guidelines for Unsignalized Intersections
The first guidelines for unsignalized intersections were developed by Harmelink (1967), and these guidelines are still used by traffic engineers in the field. Harmelink calculated the probability of through vehicles being blocked by the left-turning vehicles using analytical equations. He obtained the critical values of these probabilities (for different speeds) from a survey of practicing engineers. He recommended the installation of left-turn lanes at volumes where his analytical equations produced these probabilities. Harmelink probabilities, obtained from the judgment of a panel of traffic engineers, are shown in Table 1. The guidelines obtained by Harmelink are shown in Table 2. These guidelines are also available in the AASHTO Green Book (2001).
Table 1. Probability Values Used in Harmelink Guidelines
Approach Speed (mph) Design Operating Probability (ρ)
50 40 0.02 60 50 0.015 70 60 0.01
Source: Harmelink (1967).
13
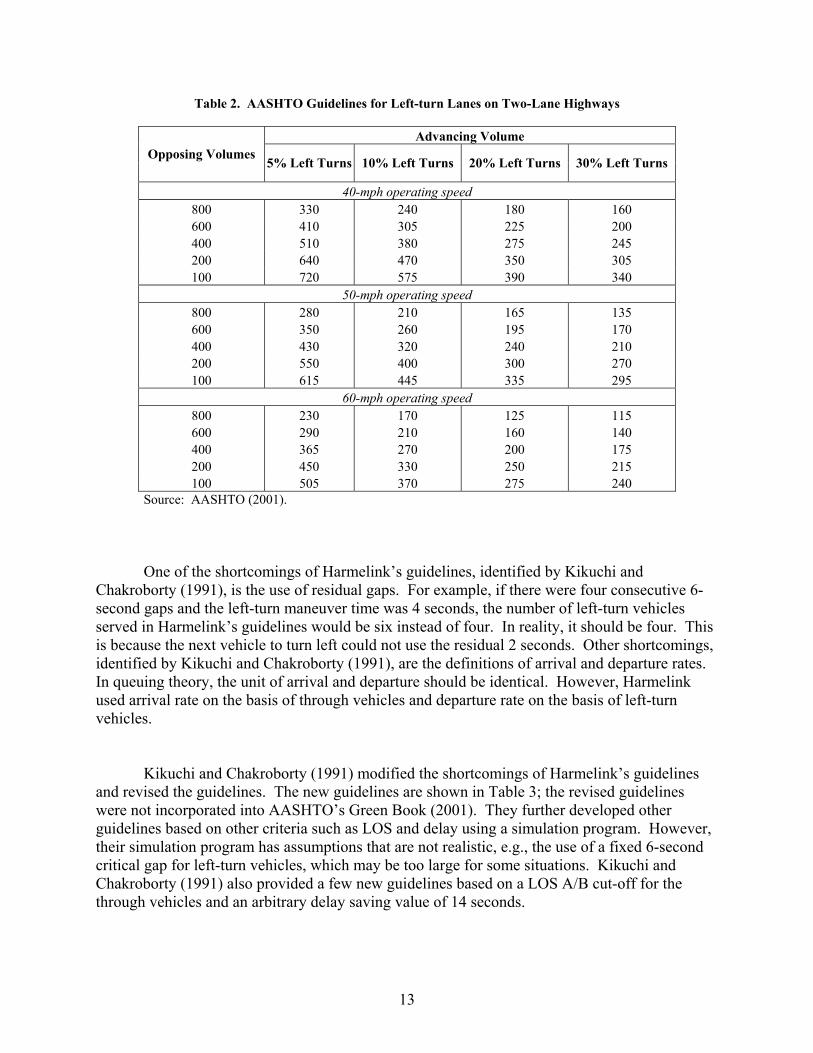
Table 2. AASHTO Guidelines for Left-turn Lanes on Two-Lane Highways
Advancing Volume Opposing Volumes
5% Left Turns 10% Left Turns 20% Left Turns 30% Left Turns
40-mph operating speed 800 330 240 180 160 600 410 305 225 200 400 510 380 275 245 200 640 470 350 305 100 720 575 390 340
50-mph operating speed 800 280 210 165 135 600 350 260 195 170 400 430 320 240 210 200 550 400 300 270 100 615 445 335 295
60-mph operating speed 800 230 170 125 115 600 290 210 160 140 400 365 270 200 175 200 450 330 250 215 100 505 370 275 240
Source: AASHTO (2001).
One of the shortcomings of Harmelink�s guidelines, identified by Kikuchi and Chakroborty (1991), is the use of residual gaps. For example, if there were four consecutive 6-second gaps and the left-turn maneuver time was 4 seconds, the number of left-turn vehicles served in Harmelink�s guidelines would be six instead of four. In reality, it should be four. This is because the next vehicle to turn left could not use the residual 2 seconds. Other shortcomings, identified by Kikuchi and Chakroborty (1991), are the definitions of arrival and departure rates. In queuing theory, the unit of arrival and departure should be identical. However, Harmelink used arrival rate on the basis of through vehicles and departure rate on the basis of left-turn vehicles.
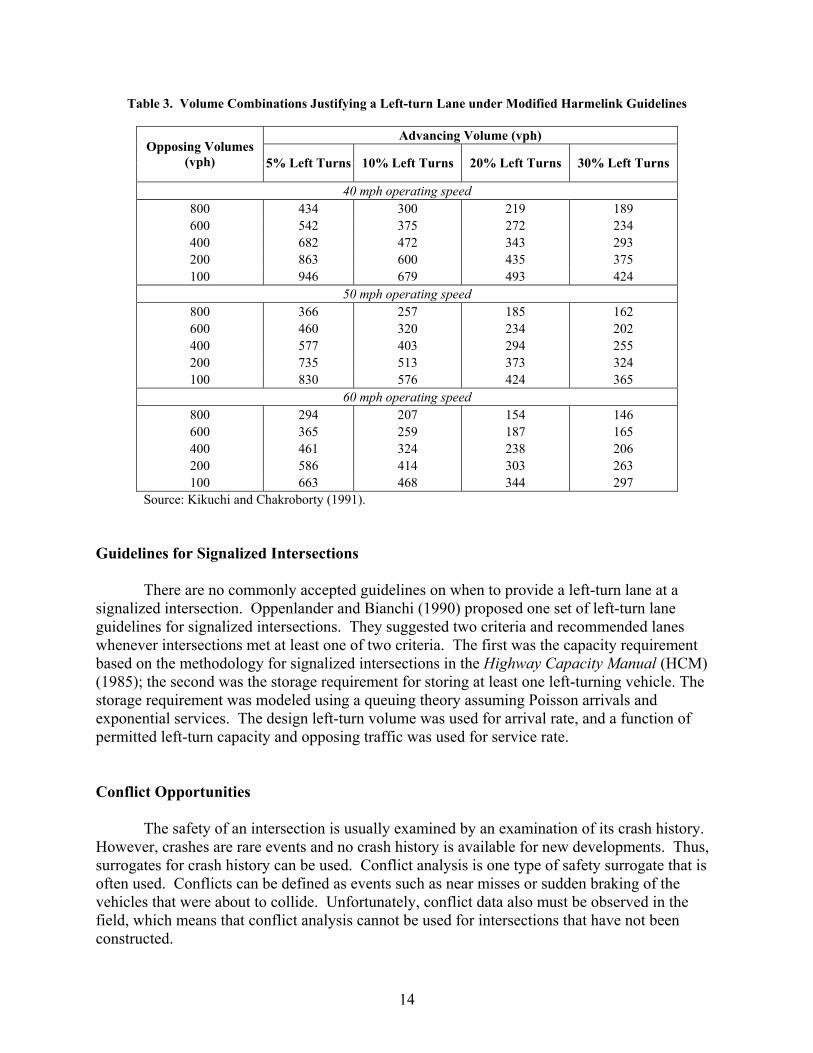
Kikuchi and Chakroborty (1991) modified the shortcomings of Harmelink�s guidelines and revised the guidelines. The new guidelines are shown in Table 3; the revised guidelines were not incorporated into AASHTO�s Green Book (2001). They further developed other guidelines based on other criteria such as LOS and delay using a simulation program. However, their simulation program has assumptions that are not realistic, e.g., the use of a fixed 6-second critical gap for left-turn vehicles, which may be too large for some situations. Kikuchi and Chakroborty (1991) also provided a few new guidelines based on a LOS A/B cut-off for the through vehicles and an arbitrary delay saving value of 14 seconds.
14
Table 3. Volume Combinations Justifying a Left-turn Lane under Modified Harmelink Guidelines
Advancing Volume (vph) Opposing Volumes
(vph) 5% Left Turns 10% Left Turns 20% Left Turns 30% Left Turns
40 mph operating speed 800 434 300 219 189 600 542 375 272 234 400 682 472 343 293 200 863 600 435 375 100 946 679 493 424
50 mph operating speed 800 366 257 185 162 600 460 320 234 202 400 577 403 294 255 200 735 513 373 324 100 830 576 424 365
60 mph operating speed 800 294 207 154 146 600 365 259 187 165 400 461 324 238 206 200 586 414 303 263 100 663 468 344 297
Source: Kikuchi and Chakroborty (1991). Guidelines for Signalized Intersections
There are no commonly accepted guidelines on when to provide a left-turn lane at a signalized intersection. Oppenlander and Bianchi (1990) proposed one set of left-turn lane guidelines for signalized intersections. They suggested two criteria and recommended lanes whenever intersections met at least one of two criteria. The first was the capacity requirement based on the methodology for signalized intersections in the Highway Capacity Manual (HCM) (1985); the second was the storage requirement for storing at least one left-turning vehicle. The storage requirement was modeled using a queuing theory assuming Poisson arrivals and exponential services. The design left-turn volume was used for arrival rate, and a function of permitted left-turn capacity and opposing traffic was used for service rate. Conflict Opportunities
The safety of an intersection is usually examined by an examination of its crash history. However, crashes are rare events and no crash history is available for new developments. Thus, surrogates for crash history can be used. Conflict analysis is one type of safety surrogate that is often used. Conflicts can be defined as events such as near misses or sudden braking of the vehicles that were about to collide. Unfortunately, conflict data also must be observed in the field, which means that conflict analysis cannot be used for intersections that have not been constructed.

15
Ha and Berg (1995) defined another type of safety surrogate as conflict opportunities. A conflict opportunity occurs when there is a potential for a collision between two vehicles. There are two main types of conflict opportunities: left-turning conflicts and rear-end conflicts. If an opposing vehicle is too close to the left-turning vehicle as the vehicle makes the turn, the event could be treated as a left-turn conflict opportunity. Similarly, there is an opportunity for a rear-end collision to occur whenever every single vehicle joins the queue. Therefore every vehicle joining the queue could be treated as a rear-end conflict opportunity. An advantage of conflict opportunities is that they can be generated theoretically based on volumes, traffic control, and intersection geometry. This means that, unlike conflicts, conflict opportunities can be estimated for intersections that have not yet been constructed.
Survey Results
Fifty-two of 60 (85%) engineers responded to the survey. As seen in Figure 3, there appears to be some confusion about the application of the Harmelink guidelines to signalized intersections. Harmelink guidelines developed for unsignalized intersections are not supposed to be applied for signalized intersections. Measures such as left-turn charts, accident experience, LOS based on the HCM (2000), etc., were combined in the �others� shown in the Figure 3. The total responses do not add up to 52 because some engineers did not respond to this question.
The respondents were also generally happy with the performance of the guidelines they used, as indicated in Figure 4. It is interesting to note that none of the engineers thought the current guidelines called for lanes when they were not needed.
The usage of the different methods/guidelines for unsignalized intersections is shown in Figure 5. Again, many respondents said they are using Harmelink guidelines for installing left-turn lanes at unsignalized intersections.
The majority of the engineers seemed to be happy with the current unsignalized guidelines. Figure 6 describes their responses.
Figure 3. Comments Regarding Use of Current Guidelines for Signalized Intersections

16
Figure 4. Comments Regarding Guidelines Currently Used for Signalized Intersections
Figure 5. Comments Regarding Usage of Particular Guidelines for Unsignalized Intersections
Figure 6. Comments on Satisfaction With Current Guidelines for Unsignalized Intersections
17
Data Collection and Reduction
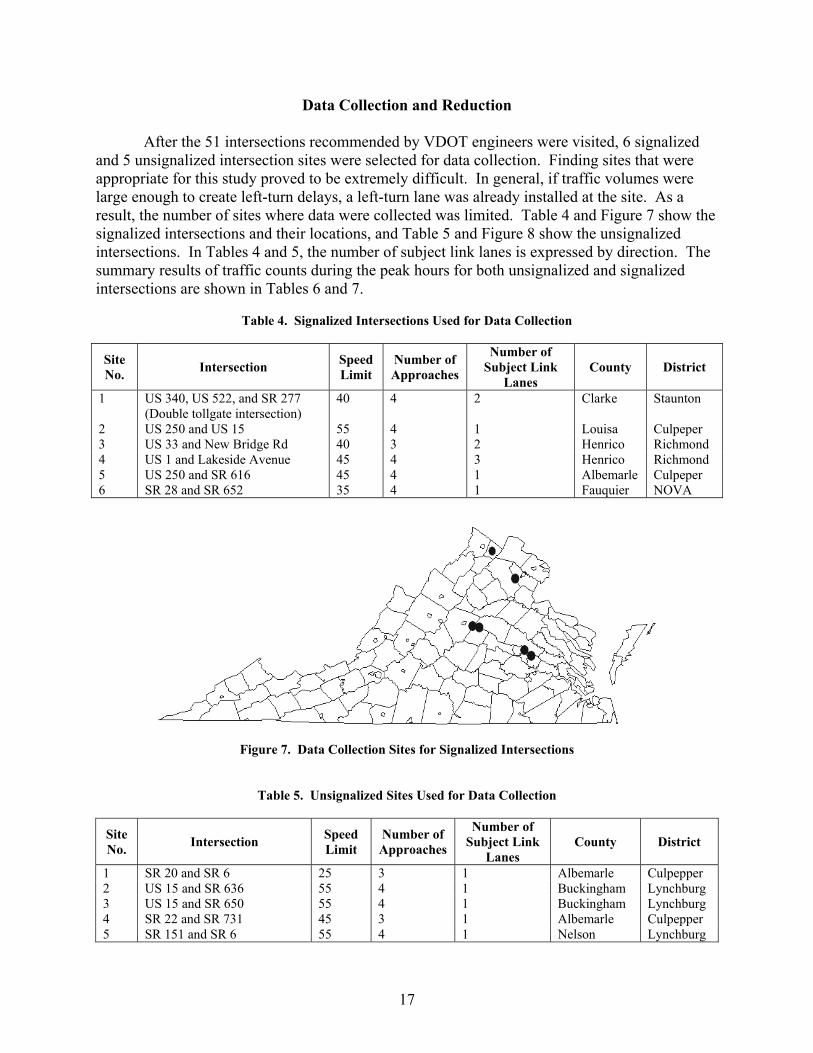
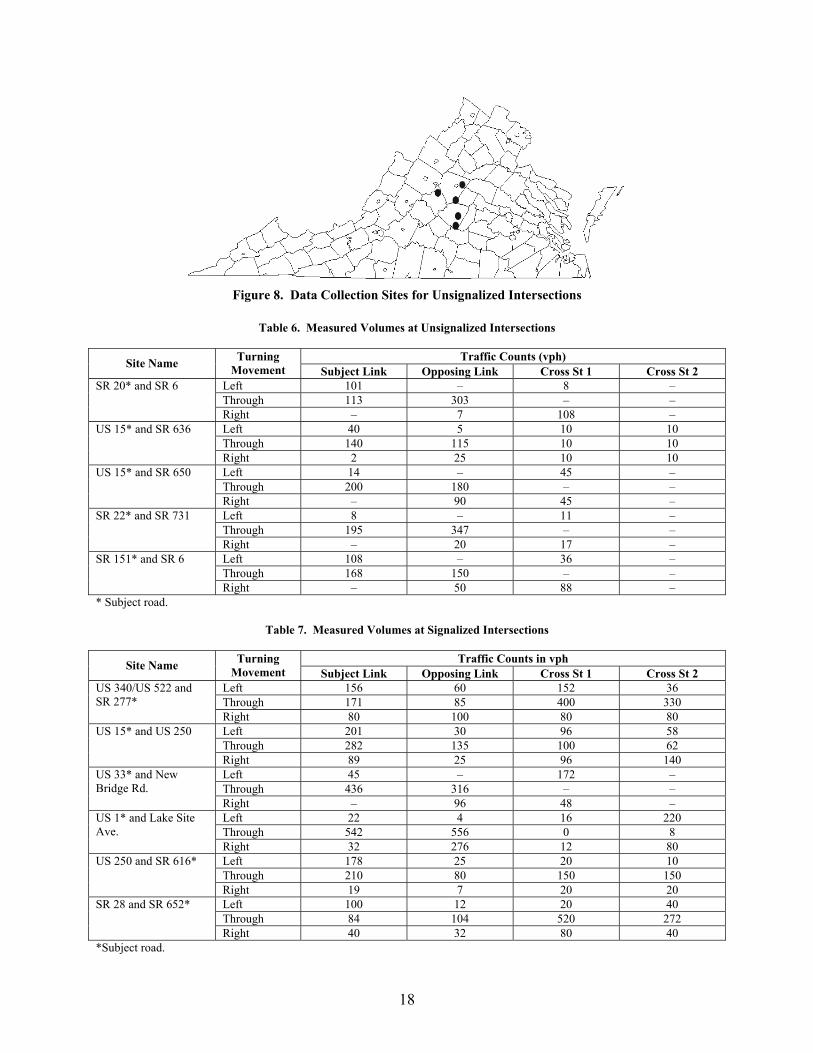
After the 51 intersections recommended by VDOT engineers were visited, 6 signalized and 5 unsignalized intersection sites were selected for data collection. Finding sites that were appropriate for this study proved to be extremely difficult. In general, if traffic volumes were large enough to create left-turn delays, a left-turn lane was already installed at the site. As a result, the number of sites where data were collected was limited. Table 4 and Figure 7 show the signalized intersections and their locations, and Table 5 and Figure 8 show the unsignalized intersections. In Tables 4 and 5, the number of subject link lanes is expressed by direction. The summary results of traffic counts during the peak hours for both unsignalized and signalized intersections are shown in Tables 6 and 7.
Table 4. Signalized Intersections Used for Data Collection
Site No. Intersection Speed
Limit Number of Approaches
Number of Subject Link
Lanes County District
1 US 340, US 522, and SR 277 (Double tollgate intersection)
40 4 2 Clarke Staunton
2 US 250 and US 15 55 4 1 Louisa Culpeper 3 US 33 and New Bridge Rd 40 3 2 Henrico Richmond 4 US 1 and Lakeside Avenue 45 4 3 Henrico Richmond 5 US 250 and SR 616 45 4 1 Albemarle Culpeper 6 SR 28 and SR 652 35 4 1 Fauquier NOVA
Figure 7. Data Collection Sites for Signalized Intersections
Table 5. Unsignalized Sites Used for Data Collection
Site No. Intersection Speed
Limit Number of Approaches
Number of Subject Link
Lanes County District
1 SR 20 and SR 6 25 3 1 Albemarle Culpepper 2 US 15 and SR 636 55 4 1 Buckingham Lynchburg 3 US 15 and SR 650 55 4 1 Buckingham Lynchburg 4 SR 22 and SR 731 45 3 1 Albemarle Culpepper 5 SR 151 and SR 6 55 4 1 Nelson Lynchburg
18
Figure 8. Data Collection Sites for Unsignalized Intersections
Table 6. Measured Volumes at Unsignalized Intersections
Traffic Counts (vph) Site Name Turning
Movement Subject Link Opposing Link Cross St 1 Cross St 2 Left 101 � 8 � Through 113 303 � �
SR 20* and SR 6
Right � 7 108 � Left 40 5 10 10 Through 140 115 10 10
US 15* and SR 636
Right 2 25 10 10 Left 14 � 45 � Through 200 180 � �
US 15* and SR 650
Right � 90 45 � Left 8 � 11 � Through 195 347 � �
SR 22* and SR 731
Right � 20 17 � Left 108 � 36 � Through 168 150 � �
SR 151* and SR 6
Right � 50 88 � * Subject road.
Table 7. Measured Volumes at Signalized Intersections
Traffic Counts in vph Site Name Turning Movement Subject Link Opposing Link Cross St 1 Cross St 2
Left 156 60 152 36 Through 171 85 400 330
US 340/US 522 and SR 277*
Right 80 100 80 80 Left 201 30 96 58 Through 282 135 100 62
US 15* and US 250
Right 89 25 96 140 Left 45 � 172 � Through 436 316 � �
US 33* and New Bridge Rd.
Right � 96 48 � Left 22 4 16 220 Through 542 556 0 8
US 1* and Lake Site Ave.
Right 32 276 12 80 Left 178 25 20 10 Through 210 80 150 150
US 250 and SR 616*
Right 19 7 20 20 Left 100 12 20 40 Through 84 104 520 272
SR 28 and SR 652*
Right 40 32 80 40 *Subject road.

19
Critical Gap Reduction Tables 8 and 9 show the critical gap values calculated for the left turns on the subject link at unsignalized and signalized intersections.
Table 8. Field Measured Critical Gap of Left Turns at Unsignalized Intersections
Site ID Intersection Critical Gap (sec)
1 SR 20 and SR 6 5.8 2 US 15 and SR 636 5.9 3 US 15 and SR 650 6.5 4 SR 22 and SR 731 3.7* 5 SR 151 and SR 6 4.4
*Critical gap estimated on basis of 8 left-turn vehicles.
Table 9. Field Measured Critical Gap of Left-turns at Signalized Intersections
Headway Distributions
The headways at the signalized sites were important as the gaps in traffic flow dictate the cycle length (since all the signalized sites had fully actuated controllers) and other MOEs. The inter-arrival (gap) distribution was tested at the signalized sites and was following negative exponential distributions. All sites passed the Kolmogorov-Smirnov test for α = 0.05. The results of these tests are summarized in Table 10. Based on these results, the program was coded such that it produced vehicles according to a negative exponential distribution.
Table 10. Kolmogorov-Smirnov (K-S) Test Results at Signalized Intersections
Site ID Intersection Calculated K-S Test Statistics
Theoretical K-S Test Statistic (from table)
Negative Exponential K-S Test (α = 0.05)
Result 1 US 340, US 522, and SR 277 0.075 0.090 Accepted 2 US 15 and US 250 0.037 0.059 Accepted 3 US 33 and New Bridge Road 0.041 0.058 Accepted 4 US 1 and Lakeside Avenue 0.028 0.059 Accepted 5 US 250 and SR 616 0.010 0.068 Accepted 6 SR 28 and SR 652 0.027 0.101 Accepted
Site ID Intersection Critical Gap (sec) 1 US 340, US 522, and SR 277 3.75 2 US 250 and US 15 4.4 3 US 33 and New Bridge Rd 6.9 4 US 1 and Lakeside 6.2 5 US 250 and SR 616 4.0 6 SR 28 and SR 652 4.5

20
Event-Based Simulation Program
The event-based simulation programs developed in the project are part of a complete package named the Left Turn Guidelines Analysis Package (LTGAP). The LTGAP is composed of three parts as shown in Figure 9:
1. unsignalized intersection simulation program 2. signalized intersection simulation program 3. user interface for data entry and display of results.
Figure 9. Basic Structure of LTGAP
21
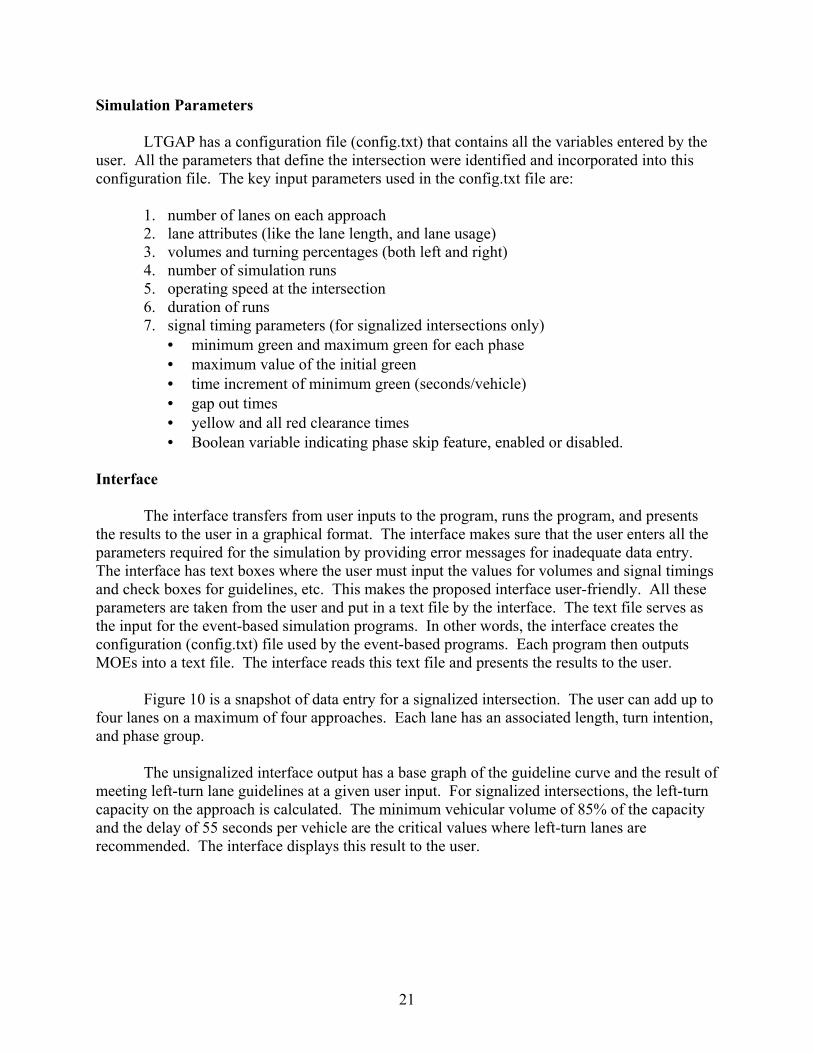
Simulation Parameters
LTGAP has a configuration file (config.txt) that contains all the variables entered by the user. All the parameters that define the intersection were identified and incorporated into this configuration file. The key input parameters used in the config.txt file are:
1. number of lanes on each approach 2. lane attributes (like the lane length, and lane usage) 3. volumes and turning percentages (both left and right) 4. number of simulation runs 5. operating speed at the intersection 6. duration of runs 7. signal timing parameters (for signalized intersections only)
• minimum green and maximum green for each phase • maximum value of the initial green • time increment of minimum green (seconds/vehicle) • gap out times • yellow and all red clearance times • Boolean variable indicating phase skip feature, enabled or disabled.
Interface
The interface transfers from user inputs to the program, runs the program, and presents the results to the user in a graphical format. The interface makes sure that the user enters all the parameters required for the simulation by providing error messages for inadequate data entry. The interface has text boxes where the user must input the values for volumes and signal timings and check boxes for guidelines, etc. This makes the proposed interface user-friendly. All these parameters are taken from the user and put in a text file by the interface. The text file serves as the input for the event-based simulation programs. In other words, the interface creates the configuration (config.txt) file used by the event-based programs. Each program then outputs MOEs into a text file. The interface reads this text file and presents the results to the user.
Figure 10 is a snapshot of data entry for a signalized intersection. The user can add up to four lanes on a maximum of four approaches. Each lane has an associated length, turn intention, and phase group.
The unsignalized interface output has a base graph of the guideline curve and the result of meeting left-turn lane guidelines at a given user input. For signalized intersections, the left-turn capacity on the approach is calculated. The minimum vehicular volume of 85% of the capacity and the delay of 55 seconds per vehicle are the critical values where left-turn lanes are recommended. The interface displays this result to the user.

22
Figure 10. Screen Shot of Input Data Entry Interface in LTGAP Unsignalized Program
The unsignalized intersection simulation is simpler than the signalized simulation since there are fewer conflict opportunities that occur. At unsignalized intersections, the only events are the arrivals and the departures of vehicles on various approaches. Cars on the minor streets have a lower priority than the major street traffic. In addition, the left-turning vehicles must look for a sufficient gap in the opposing traffic before they can successfully execute the left-turn maneuver.
Left-turn and rear-end conflict opportunities are counted in the program during the simulation. The method in which they are counted is explained in the �Methodology� section. These conflict opportunities are used as safety surrogate measures and are used to prioritize the candidate sites. Vehicle Generation and Arrival-Departure Module
The arrivals of vehicles in LTGAP are predetermined by the program and depend on the volumes entered by the user. The average time-headway is calculated from the volumes, and the vehicles are generated on that approach with that mean headway according to a negative exponential distribution. The departures are calculated �on the fly� by the program. If the vehicle did not stop at the intersection, the departure time is equal to the arrival time, but if the vehicle had to stop at the intersection, its departure time is calculated and assigned. At
23
unsignalized intersections, left-turn vehicles might have to stop because of the lack of a suitable gap and through vehicles may be forced to stop while a left-turning vehicle is waiting for an acceptable gap. A turning movement is assigned to every vehicle depending on the proportion of vehicles turning left and right on the approach as entered by the user. For example, the user enters a left-turning proportion of 0.3, and then 30% of all the vehicles generated by the program on that approach will be left-turning vehicles. Stochastic Gap Acceptance Module As discussed earlier, critical gap plays an important role in determining the delay experienced by the left-turning vehicles. In the real world, the critical gap is not constant for the driver population. To account for this variability, the program estimates the mean critical gap of the driver population based on the HCM (1985) unless the user provides a field-measured critical gap value. As the field data matched better with the 1985 HCM critical gap model than that of 2000 HCM, the 1985 HCM was adopted for this study. It is noted that the proposed 2000 HCM critical gap model was developed on the basis of a limited number of sites, and the R2 value of the regression model was 0.12 for the major street left-turn vehicles (Tian et al., 2000).
To estimate the standard deviation of the critical gaps, the bootstrap method (Efron and Tibshirani, 1993) was used. The bootstrap method is a procedure in which the samples are selected from the original samples with replacement and the standard deviation of the critical gap is estimated over multiple samples. The results indicated that the standard deviation was almost constant at 0.25. It is assumed that the critical gap varies according to a normal distribution. Thus, the mean critical gap is determined from the 1985 HCM and the standard deviation of 0.25 was used. The impact of heavy vehicles on the critical gap was not explicitly considered in this study.
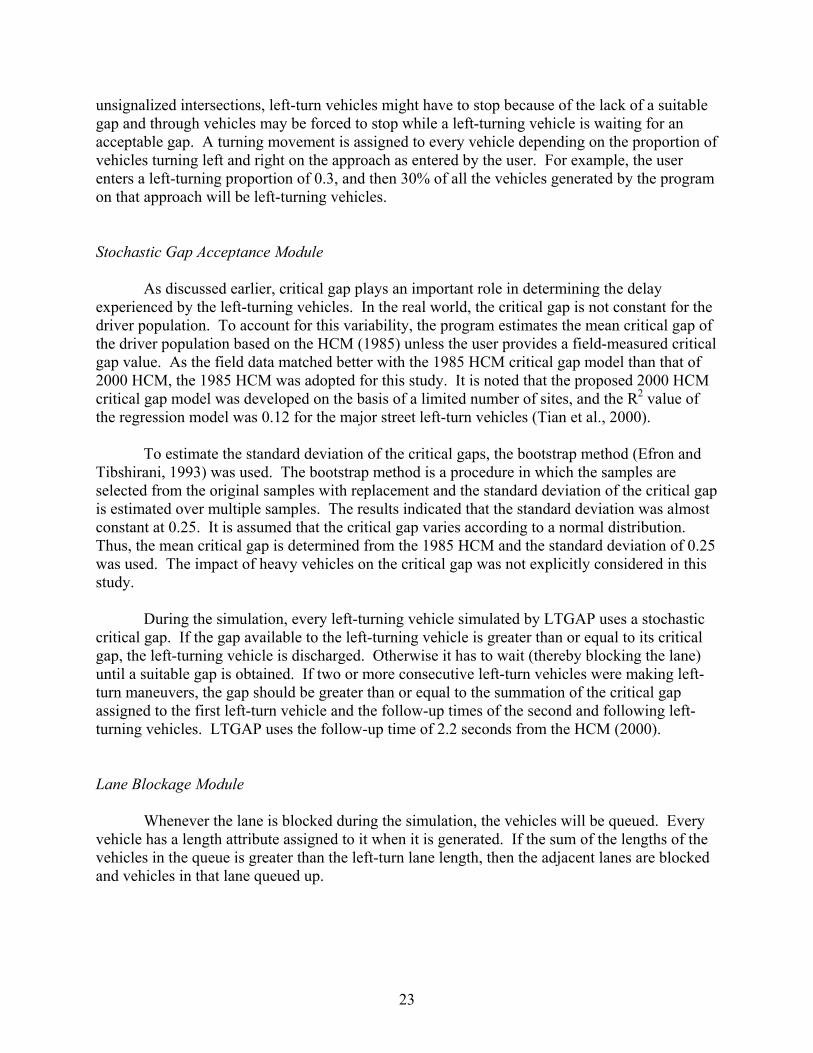
During the simulation, every left-turning vehicle simulated by LTGAP uses a stochastic critical gap. If the gap available to the left-turning vehicle is greater than or equal to its critical gap, the left-turning vehicle is discharged. Otherwise it has to wait (thereby blocking the lane) until a suitable gap is obtained. If two or more consecutive left-turn vehicles were making left-turn maneuvers, the gap should be greater than or equal to the summation of the critical gap assigned to the first left-turn vehicle and the follow-up times of the second and following left-turning vehicles. LTGAP uses the follow-up time of 2.2 seconds from the HCM (2000). Lane Blockage Module
Whenever the lane is blocked during the simulation, the vehicles will be queued. Every vehicle has a length attribute assigned to it when it is generated. If the sum of the lengths of the vehicles in the queue is greater than the left-turn lane length, then the adjacent lanes are blocked and vehicles in that lane queued up.

24
Queue Dissipation Module
When the queue starts dissipating in LTGAP, the basic assumption is that vehicle headways at saturation flow are constant at 2 seconds. Therefore, departure times of successive vehicles in the queue differ by 2 seconds. MOE Counter
LTGAP was coded with a counter that keeps the counts of applicable MOEs throughout the simulations. These counters do not start counting the MOE until the warm-up time is passed at the beginning of each run. These MOEs were used to validate LTGAP results. For the unsignalized intersection validation, the MOE used was �number of left-turning vehicles stopped� in the simulation (per hour). This MOE was updated whenever the left-turning vehicle on the subject link was stopped. Example
The operation of the unsignalized module is best illustrated through a simple example. Assume that the user wants to simulate a T-intersection (three approaches) with one lane of traffic on each direction (NB, SB, and EB) as shown in Figure 11. All lanes are shared and are assumed to be of infinite length; the subject link is the NB approach (subject link is the link where the left-turn improvement study is being conducted). Assume there are no right turns at the intersection (right-turn volume = 0) and the percentage left-turn is 10%. Further assume that the volumes on the NB and SB approaches (as entered by the user) are 500 vph each and the volume on the EB approach is 100 vph.
In the LTGAP simulation program, vehicles are generated at random intervals by
following a negative exponential distribution and the turn intention is assigned based on the percentages of left, through, and right turns. When the left-turn vehicle is being processed in the program (say, on the NB approach), the program checks for gaps on the opposing approach (the difference in the arrival times of opposing vehicles, in this case, SB vehicles). If the observed gap is greater than the critical gap of the vehicle, the maneuver takes place. If not, the left-turn vehicle waits until a suitable gap is obtained. While the vehicle is waiting, newly arriving vehicles are forced to wait (since the lane is blocked). The arrival and departure log is maintained at all times in the simulation. The arrival and departure time of each vehicle, its turn direction (left, through, or right), and the lane/approach used are also recorded in the log.
The instances of left-turn vehicles blocking the through vehicles are counted during the simulation. If the counted number is greater than the critical probability value in Table 1, then the left-turn lane is warranted for that particular volume combination and in that simulation run. This is the MOE used in recommending the left-turn lane for unsignalized intersections. Moreover, there are counters in the program that count the left-turn and rear-end conflict opportunities occurring on the subject link. These conflict opportunities were used for the prioritization tool.

25
Figure 11. Layout of Typical T-Intersection Termination of the Simulation
The simulation run ends when the specified time limit of the run is reached. The user, in the configuration file, specifies the duration of each run and the number of runs required. The LTGAP program will cease running when all the runs are completed. Since all the MOEs are written in the text files on the fly, LTGAP need not perform any calculations once the simulations are completed.

26
Actuated Signal Program
The signalized program was used to generate left-turn guidelines for a two-phase pre-timed signal, although it is capable of modeling actuated signals. All of the sites where field data were collected were actuated signals. For actuated signals, each phase has a maximum and minimum green with a gap-out time. The program has the features of simultaneous gap out and phase skip, which often occur at rural intersections. Simultaneous gap-out allows the current phase to change to the next phase only when both approaches of the current phase had gap-outs. This feature plays an important role where there are unequal volumes on the major street. Some candidate sites had unequal volumes on the major street. In the sites where data were collected, phase skipping was observed. This meant that unless there was a demand call on the side street, major street green would continue even after the maximum green. The events in the signalized program are vehicle arrivals, vehicle departures, and signal changes. Although the program has the above-described features, its functions are limited and it does not consider the following features:
• pedestrian phases • delayed presence detection and locking/non-locking type detectors • overlap of phases in the timing plan • reduction of gap-out times with time • protected lefts (with or without exclusive left-turn lanes) on the subject link • recall on/off feature • signal preemption.
Optimization of Signal Timing Plan Before Simulation
In the signalized simulation, the cycle length entered by the user is optimized before the simulation was started since the existing timing plan might be outdated. The user also has an option of not optimizing the timing plan and just simulating the current conditions in the field. Since optimization of cycle length is not the primary focus of this study, Webster�s equation for optimum cycle length was used.
io Y
LC∑−+=
155.1
[5]
where Co = optimum cycle length
L = total lost time for the cycle, which is the sum of the lost times for individual phases Yi = maximum of v/S for all phases, where v is the volume and S is the adjusted
saturation flow rate.
The saturation flow rate has to be adjusted for shared lane approaches, and the adjustment depends on the g/C ratio. Therefore iteration has to be performed with an initial approximation of the cycle length. Since the cycle length, C, of an actuated signal varies, an initial cycle length
27
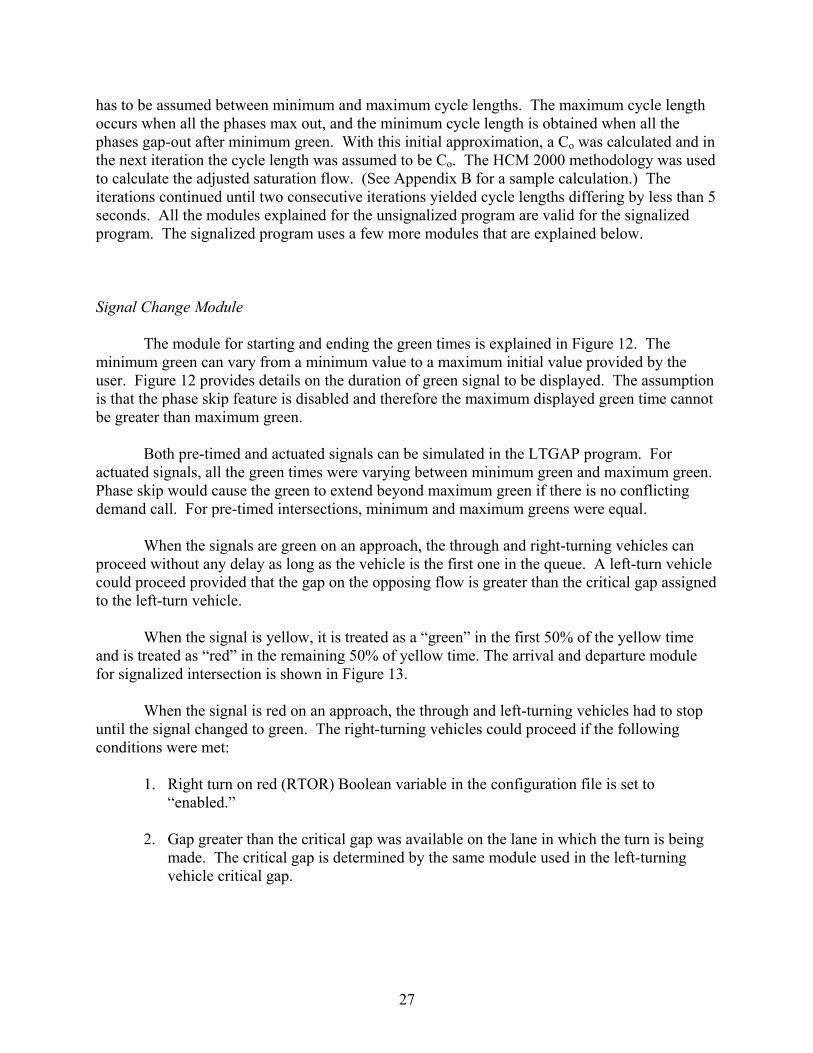
has to be assumed between minimum and maximum cycle lengths. The maximum cycle length occurs when all the phases max out, and the minimum cycle length is obtained when all the phases gap-out after minimum green. With this initial approximation, a Co was calculated and in the next iteration the cycle length was assumed to be Co. The HCM 2000 methodology was used to calculate the adjusted saturation flow. (See Appendix B for a sample calculation.) The iterations continued until two consecutive iterations yielded cycle lengths differing by less than 5 seconds. All the modules explained for the unsignalized program are valid for the signalized program. The signalized program uses a few more modules that are explained below. Signal Change Module
The module for starting and ending the green times is explained in Figure 12. The minimum green can vary from a minimum value to a maximum initial value provided by the user. Figure 12 provides details on the duration of green signal to be displayed. The assumption is that the phase skip feature is disabled and therefore the maximum displayed green time cannot be greater than maximum green.
Both pre-timed and actuated signals can be simulated in the LTGAP program. For
actuated signals, all the green times were varying between minimum green and maximum green. Phase skip would cause the green to extend beyond maximum green if there is no conflicting demand call. For pre-timed intersections, minimum and maximum greens were equal.
When the signals are green on an approach, the through and right-turning vehicles can proceed without any delay as long as the vehicle is the first one in the queue. A left-turn vehicle could proceed provided that the gap on the opposing flow is greater than the critical gap assigned to the left-turn vehicle.
When the signal is yellow, it is treated as a �green� in the first 50% of the yellow time and is treated as �red� in the remaining 50% of yellow time. The arrival and departure module for signalized intersection is shown in Figure 13.
When the signal is red on an approach, the through and left-turning vehicles had to stop
until the signal changed to green. The right-turning vehicles could proceed if the following conditions were met:
1. Right turn on red (RTOR) Boolean variable in the configuration file is set to
�enabled.� 2. Gap greater than the critical gap was available on the lane in which the turn is being
made. The critical gap is determined by the same module used in the left-turning vehicle critical gap.

28
Figure 12. Flowchart of Green Time Module for Actuated Signal in LTGAP

29
Figure 13. Vehicle Arrival-Departure Module for Signalized Intersections in LTGAP
MOE Counter
The counters in the signalized program generate the MOEs used in the validation. The MOEs are maximum queue length and stop delay for the left-turn vehicles on the subject link. The maximum queue length counter in the program was updated whenever a vehicle joined the queue and the signal was red. The maximum queue length counter did not update itself when the signal was green. In other words, this counter did not consider the queue build-up that would continue (for the initial portion of the green) even as the signal turns green. When this MOE was reduced from the tapes, this point was kept in mind and vehicle counting stopped as soon as the signal turned green. Example
Consider a fully actuated, two-phase, intersection with four approaches and one lane of traffic for all directions of traffic as shown in Figure 14. Assume all lanes are shared and the

30
Figure 14. Layout of Typical Four-Leg Signalized Intersection maximum and minimum greens are 10 and 30 seconds, respectively. Further assume that there are 10% left-turn vehicles and 10% right-turn vehicles on all approaches and the volume on each approach is 500 vph. The gap-out time for that particular controller is 2.5 seconds, with the yellow and all red times being 4 and 2 seconds, respectively.
The program generates vehicles on each approach according to the demand volumes (500 vph on all approaches in this case). It also generates the left-turn and right-turn vehicles

31
according to the user defined percentages (10% in this case). This module for generation of the vehicles is identical in the actuated and unsignalized simulation programs.
The actuated program handles two more events than does the unsignalized simulation program. These events are the change of signal from green to red and the change of signal from red to green. The vehicles have to start discharging (or stop discharging) depending on these events. Moreover, these events depend on the arrivals of the vehicles (i.e., gap-outs). The program keeps track of the times of vehicle arrivals on each approach and checks for gaps on green approaches until the gap-out or max-out occurs. The program first optimizes the timing plan, if opted, entered by the user for the particular volumes before it starts the simulation. This optimization is performed using the optimum cycle length equation as proposed by Webster. The user has an option of evaluating the current signal settings without optimizing them. For the calculation of v/s for the shared lanes, the HCM procedure is adopted.
For phase 1, NB and SB approaches have green. The vehicles are currently being discharged from these approaches. The through vehicles leave the intersection as the green is on, where left-turn vehicles will make turning maneuvers as long as sufficient gaps in the opposing flow are available. Assume that the gap-out occurs for this phase at t = 20 seconds. The program calculates the gap in the traffic flow by subtracting the departures of consecutive vehicles on the approach. If this gap is greater than the specified gap-out time (say, 2.5 seconds), the approach is termed as gapped-out for that phase. Then the vehicles queued up on the other approaches (EB and WB) are discharged at a saturation headway of 2 seconds at t = 26. Note that 6 seconds is the sum of the yellow and all red times. Again the same conditions for the signal change have to be satisfied (max-outs and conflicting demand call, or simultaneous gap-out) for the green to be served to the NB-SB phase again. The system keeps track of the vehicle arrivals, and the time the signal changes are also determined ahead of time by the program. The MOEs used for validation of this program are stop delay for the left-turning vehicles on the subject link and the maximum queue length on the subject link. The program calculates the amount of time the signal was green on a particular approach. In addition, the program calculates the number of vehicles that are in the queue at the end of the red phase. They were compared with the values reduced from the videotapes. The performance of the program and the results of the validation of the program are discussed in detail in the �Results� section. Pre-timed signals are a special case of actuated signal. If the minimum green and the maximum green of the actuated signal become equal, the signal becomes a pre-timed signal. So the discussions are valid for pre-timed signals as well. To use the simulation program for pre-timed signals, the maximum green and the minimum green must be set to be identical.

32
Validation of Program Unsignalized Simulation Program As mentioned in the �Methodology� section, the number of left-turning vehicles that stopped at the intersection was selected as an MOE in the validation of the event-based program. This field MOE was reduced from the videotapes. The results of this data reduction are shown in Table 11. These sites were simulated in the program, and the same MOE was calculated for 100 times through multiple simulation runs. Two sample histograms of the MOE that were output from the program and the appropriate field value are shown in Figures 15 and 16. Similar validation was done at other sites, and the field values were observed to vary close to the mean of the simulations. It can be concluded that the unsignalized simulation program reflects field conditions very well.
Table 11. Field Measured MOEs at Unsignalized Intersections
Site ID
Intersection Name Total Left-Turn Volume on the
Subject Link (vph)
Observed Number of Left Turning Vehicles That Stopped (vph)
Simulated Average of Number of Left Turning
Vehicles that Stopped (100 Simulations)
1 SR 20 and SR 6 101 31 37 2 US 15 and SR 636 40 0 0.95 3 SR 151 and SR 6 108 20 17 4 SR 22 and SR 731 8 0 2.6 5 US 15 and SR 650 14 6 5.44
Figure 15. Histogram of Number of Stopped Left-turn Vehicles at SR 20 and SR 6
33
Figure 16. Histogram of Number of Stopped Left-turn Vehicles at US 15 and SR 650
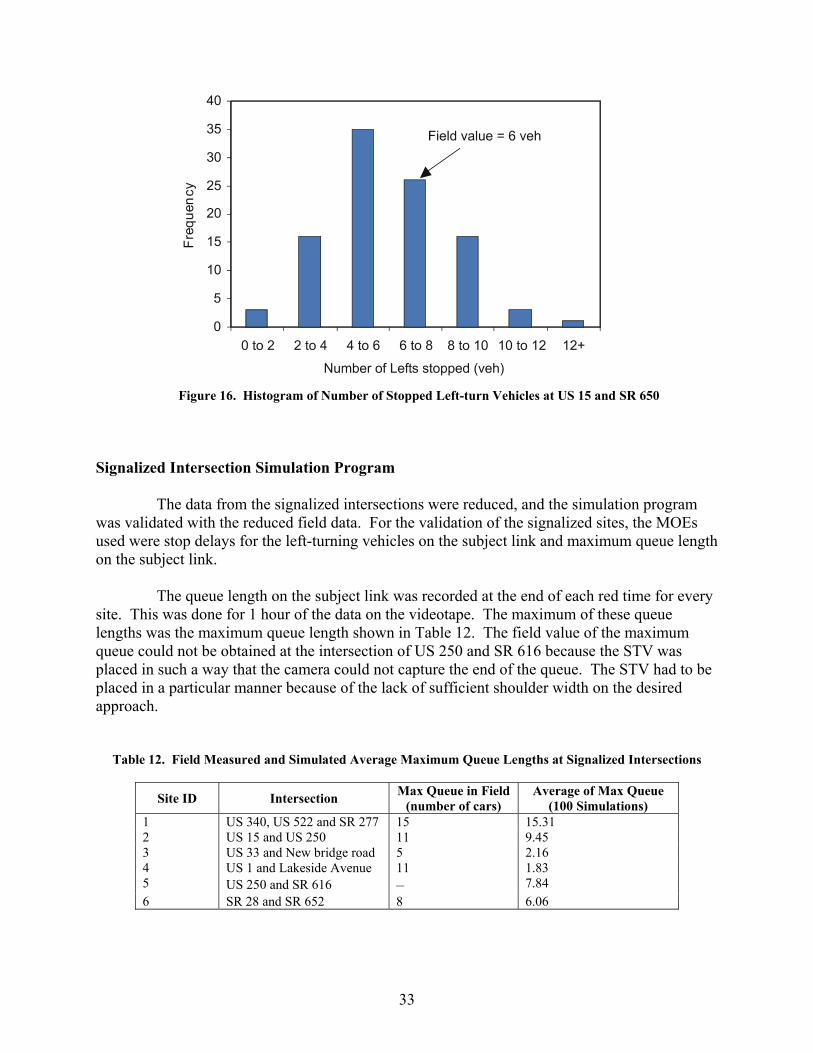
Signalized Intersection Simulation Program The data from the signalized intersections were reduced, and the simulation program was validated with the reduced field data. For the validation of the signalized sites, the MOEs used were stop delays for the left-turning vehicles on the subject link and maximum queue length on the subject link. The queue length on the subject link was recorded at the end of each red time for every site. This was done for 1 hour of the data on the videotape. The maximum of these queue lengths was the maximum queue length shown in Table 12. The field value of the maximum queue could not be obtained at the intersection of US 250 and SR 616 because the STV was placed in such a way that the camera could not capture the end of the queue. The STV had to be placed in a particular manner because of the lack of sufficient shoulder width on the desired approach.
Table 12. Field Measured and Simulated Average Maximum Queue Lengths at Signalized Intersections
Site ID Intersection Max Queue in Field (number of cars)
Average of Max Queue (100 Simulations)
1 US 340, US 522 and SR 277 15 15.31 2 US 15 and US 250 11 9.45 3 US 33 and New bridge road 5 2.16 4 US 1 and Lakeside Avenue 11 1.83 5 US 250 and SR 616 � 7.84 6 SR 28 and SR 652 8 6.06
34
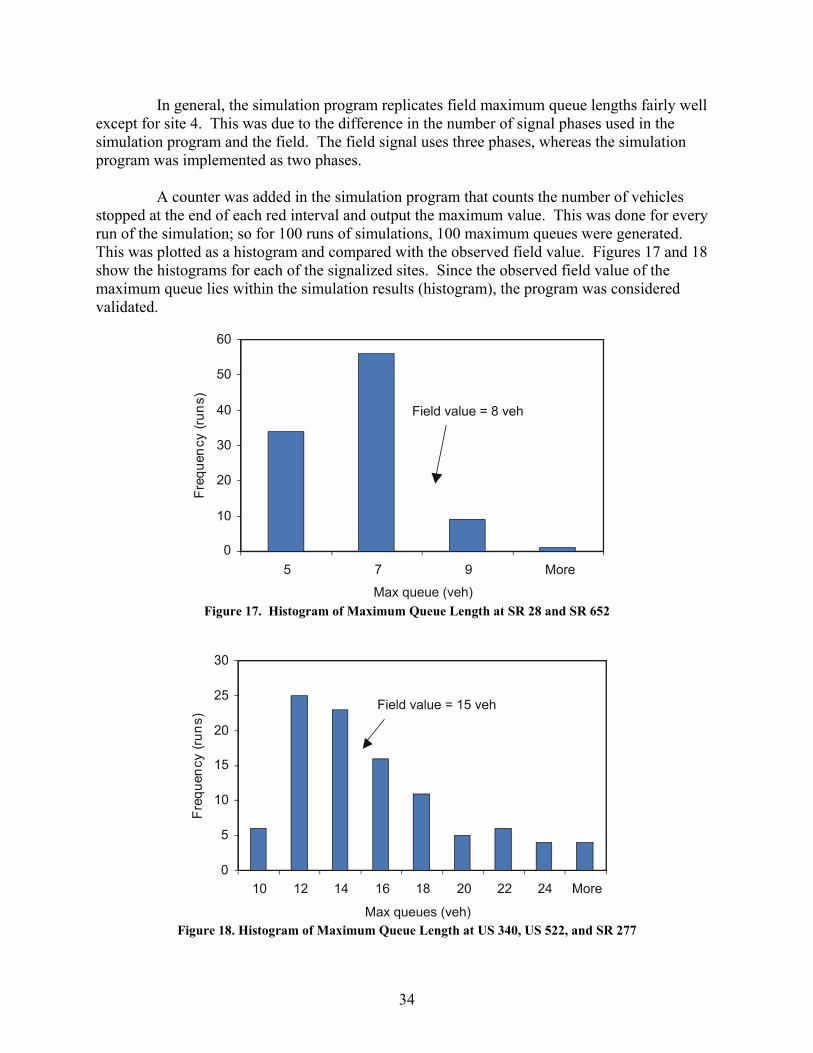
In general, the simulation program replicates field maximum queue lengths fairly well except for site 4. This was due to the difference in the number of signal phases used in the simulation program and the field. The field signal uses three phases, whereas the simulation program was implemented as two phases. A counter was added in the simulation program that counts the number of vehicles stopped at the end of each red interval and output the maximum value. This was done for every run of the simulation; so for 100 runs of simulations, 100 maximum queues were generated. This was plotted as a histogram and compared with the observed field value. Figures 17 and 18 show the histograms for each of the signalized sites. Since the observed field value of the maximum queue lies within the simulation results (histogram), the program was considered validated.
Figure 17. Histogram of Maximum Queue Length at SR 28 and SR 652
Figure 18. Histogram of Maximum Queue Length at US 340, US 522, and SR 277
35
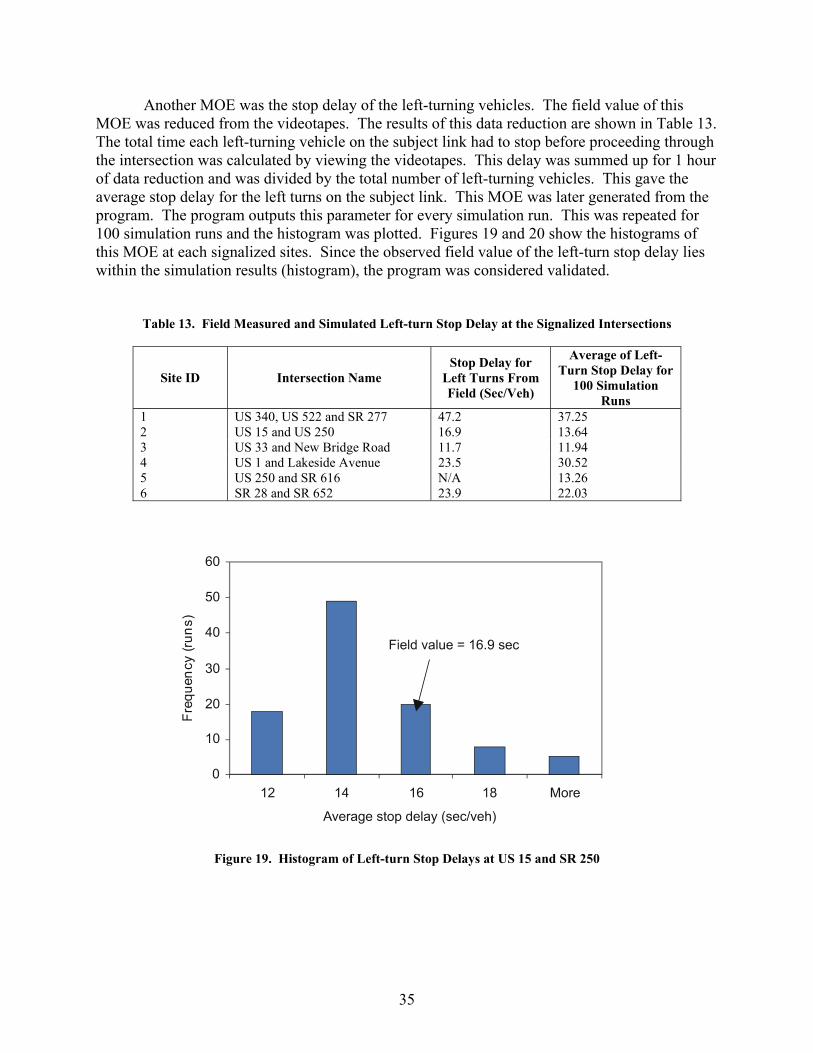
Another MOE was the stop delay of the left-turning vehicles. The field value of this MOE was reduced from the videotapes. The results of this data reduction are shown in Table 13. The total time each left-turning vehicle on the subject link had to stop before proceeding through the intersection was calculated by viewing the videotapes. This delay was summed up for 1 hour of data reduction and was divided by the total number of left-turning vehicles. This gave the average stop delay for the left turns on the subject link. This MOE was later generated from the program. The program outputs this parameter for every simulation run. This was repeated for 100 simulation runs and the histogram was plotted. Figures 19 and 20 show the histograms of this MOE at each signalized sites. Since the observed field value of the left-turn stop delay lies within the simulation results (histogram), the program was considered validated.
Table 13. Field Measured and Simulated Left-turn Stop Delay at the Signalized Intersections
Site ID Intersection Name Stop Delay for
Left Turns From Field (Sec/Veh)
Average of Left-Turn Stop Delay for
100 Simulation Runs
1 US 340, US 522 and SR 277 47.2 37.25 2 US 15 and US 250 16.9 13.64 3 US 33 and New Bridge Road 11.7 11.94 4 US 1 and Lakeside Avenue 23.5 30.52 5 US 250 and SR 616 N/A 13.26 6 SR 28 and SR 652 23.9 22.03
Figure 19. Histogram of Left-turn Stop Delays at US 15 and SR 250
36
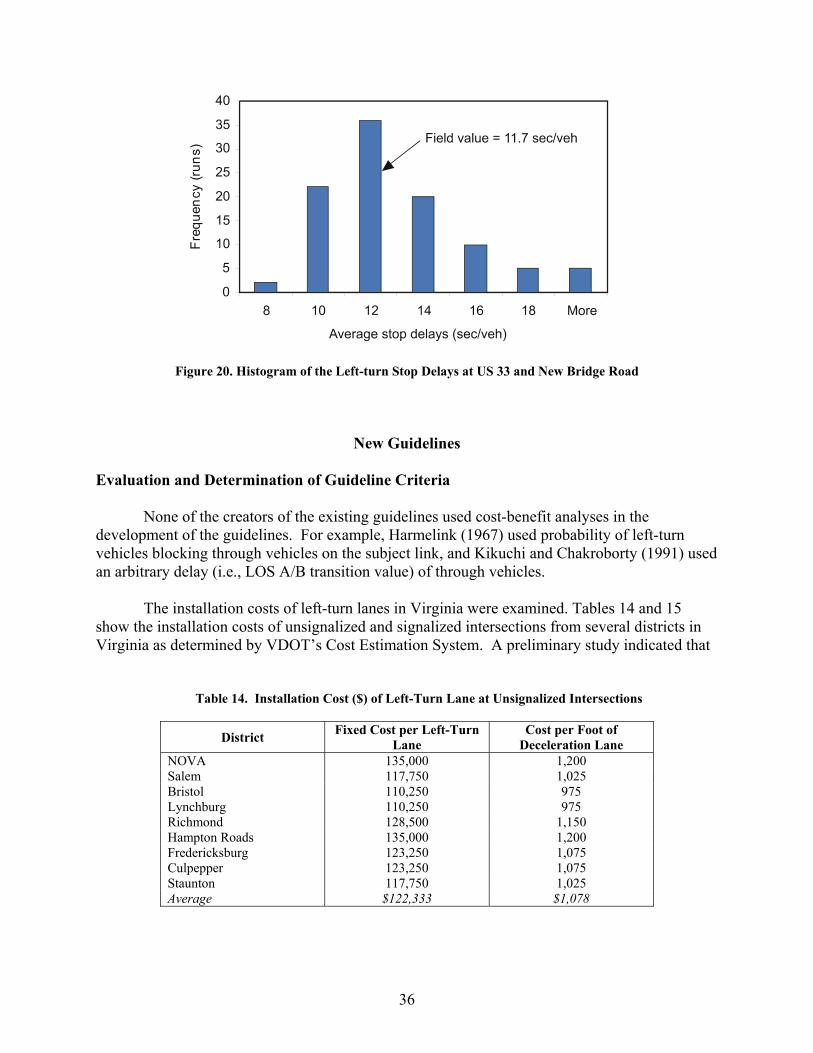
Figure 20. Histogram of the Left-turn Stop Delays at US 33 and New Bridge Road
New Guidelines Evaluation and Determination of Guideline Criteria
None of the creators of the existing guidelines used cost-benefit analyses in the development of the guidelines. For example, Harmelink (1967) used probability of left-turn vehicles blocking through vehicles on the subject link, and Kikuchi and Chakroborty (1991) used an arbitrary delay (i.e., LOS A/B transition value) of through vehicles.
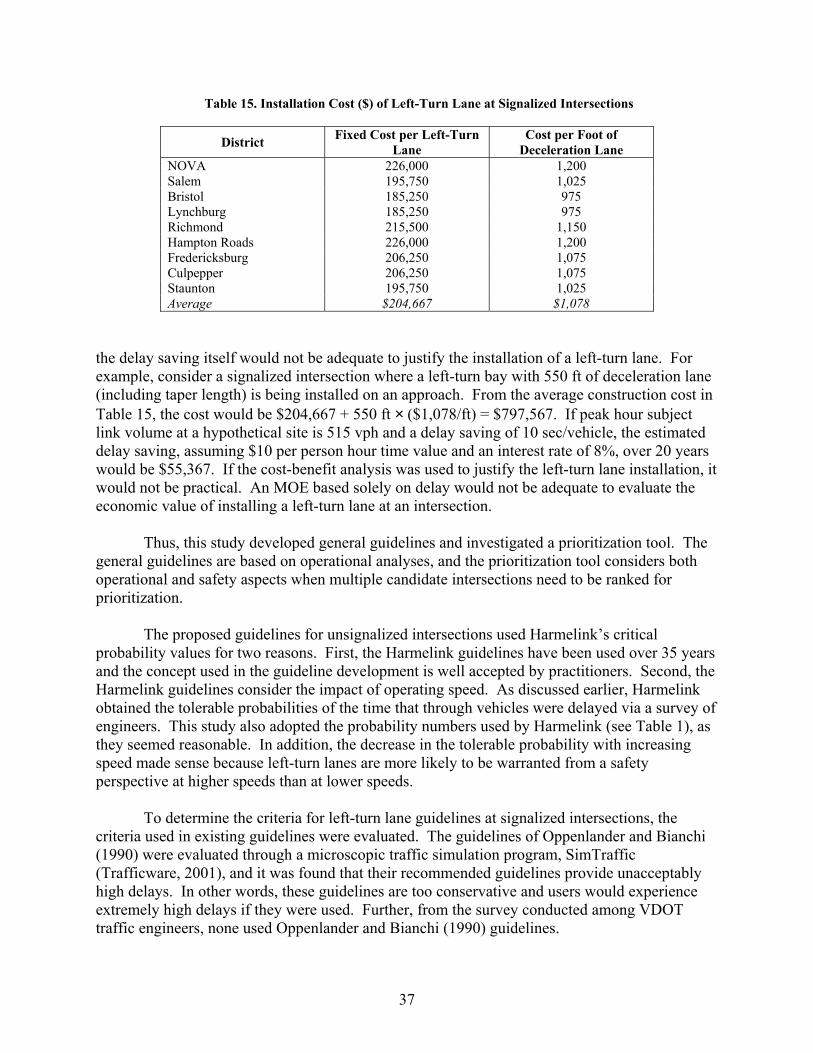
The installation costs of left-turn lanes in Virginia were examined. Tables 14 and 15 show the installation costs of unsignalized and signalized intersections from several districts in Virginia as determined by VDOT�s Cost Estimation System. A preliminary study indicated that
Table 14. Installation Cost ($) of Left-Turn Lane at Unsignalized Intersections
District Fixed Cost per Left-Turn Lane
Cost per Foot of Deceleration Lane
NOVA 135,000 1,200 Salem 117,750 1,025 Bristol 110,250 975 Lynchburg 110,250 975 Richmond 128,500 1,150 Hampton Roads 135,000 1,200 Fredericksburg 123,250 1,075 Culpepper 123,250 1,075 Staunton 117,750 1,025 Average $122,333 $1,078
37
Table 15. Installation Cost ($) of Left-Turn Lane at Signalized Intersections
District Fixed Cost per Left-Turn Lane
Cost per Foot of Deceleration Lane
NOVA 226,000 1,200 Salem 195,750 1,025 Bristol 185,250 975 Lynchburg 185,250 975 Richmond 215,500 1,150 Hampton Roads 226,000 1,200 Fredericksburg 206,250 1,075 Culpepper 206,250 1,075 Staunton 195,750 1,025 Average $204,667 $1,078
the delay saving itself would not be adequate to justify the installation of a left-turn lane. For example, consider a signalized intersection where a left-turn bay with 550 ft of deceleration lane (including taper length) is being installed on an approach. From the average construction cost in Table 15, the cost would be $204,667 + 550 ft × ($1,078/ft) = $797,567. If peak hour subject link volume at a hypothetical site is 515 vph and a delay saving of 10 sec/vehicle, the estimated delay saving, assuming $10 per person hour time value and an interest rate of 8%, over 20 years would be $55,367. If the cost-benefit analysis was used to justify the left-turn lane installation, it would not be practical. An MOE based solely on delay would not be adequate to evaluate the economic value of installing a left-turn lane at an intersection.
Thus, this study developed general guidelines and investigated a prioritization tool. The general guidelines are based on operational analyses, and the prioritization tool considers both operational and safety aspects when multiple candidate intersections need to be ranked for prioritization.
The proposed guidelines for unsignalized intersections used Harmelink�s critical probability values for two reasons. First, the Harmelink guidelines have been used over 35 years and the concept used in the guideline development is well accepted by practitioners. Second, the Harmelink guidelines consider the impact of operating speed. As discussed earlier, Harmelink obtained the tolerable probabilities of the time that through vehicles were delayed via a survey of engineers. This study also adopted the probability numbers used by Harmelink (see Table 1), as they seemed reasonable. In addition, the decrease in the tolerable probability with increasing speed made sense because left-turn lanes are more likely to be warranted from a safety perspective at higher speeds than at lower speeds.
To determine the criteria for left-turn lane guidelines at signalized intersections, the criteria used in existing guidelines were evaluated. The guidelines of Oppenlander and Bianchi (1990) were evaluated through a microscopic traffic simulation program, SimTraffic (Trafficware, 2001), and it was found that their recommended guidelines provide unacceptably high delays. In other words, these guidelines are too conservative and users would experience extremely high delays if they were used. Further, from the survey conducted among VDOT traffic engineers, none used Oppenlander and Bianchi (1990) guidelines.

38
A combination of delay and v/c ratio was used to determine the need for a left-turn lane at signalized intersections. When the 85th percentile capacity volume was used for the guideline, left-turn vehicle delays higher than 55 seconds per vehicle were often observed. In order to maintain left-turn vehicle delay at or lower than LOS E, a delay criterion was also added. Thus, the proposed general guidelines for signalized intersections were based on two criteria: 85% of left-turn capacity and average left-turn delay of 55 seconds per vehicle. The guidelines were developed using the lowest value of these two criteria obtained from the event-based signalized intersection program.
To determine the capacity of a signalized intersection, several steps had to be followed. Traffic demand volume on a subject link volume was increased to a large value (e.g., 2000 vehicles/lane), and turning percentages and all other demands were kept as they were. An average left-turn throughput on a subject link from 100 multiple simulation runs determined estimated left-turn capacity. LTGAP Guidelines Unsignalized Intersection Guidelines
The LTGAP guidelines for unsignalized intersections were developed by analyzing the percentages of left turns blocking through vehicles using the unsignalized intersection simulation program. Multiple simulation runs were made for each combination of opposing and advancing vehicle volumes and left-turn percentages under varying operating speed conditions. An intersection meets the requirement for left-turn lane installation if the intersection of advancing and opposing volumes lies above the guideline line. LTGAP guidelines are in the form of graphs for unsignalized intersections. A sample of LTGAP guidelines under 20% left-turn vehicles on advancing volume is shown in Figure 21. A complete set of guidelines is provided in Appendix C.
Figure 21. Sample LTGAP Guideline for Unsignalized Intersections (20% left turn)

39
Two samples of LTGAP guidelines were compared with the existing Harmelink (1967) and Kikuchi and Chakroborty (1991) guidelines as shown in Figures 22 and 23. The proposed
Figure 22. Comparison of LTGAP and Harmelink, and Kikuchi Guidelines (5% left turns, 40 mph speed)
Figure 23. Comparison of LTGAP, Harmelink, and Kikuchi and Chakroborty Guidelines (20% left turns, 60 mph speed)
40
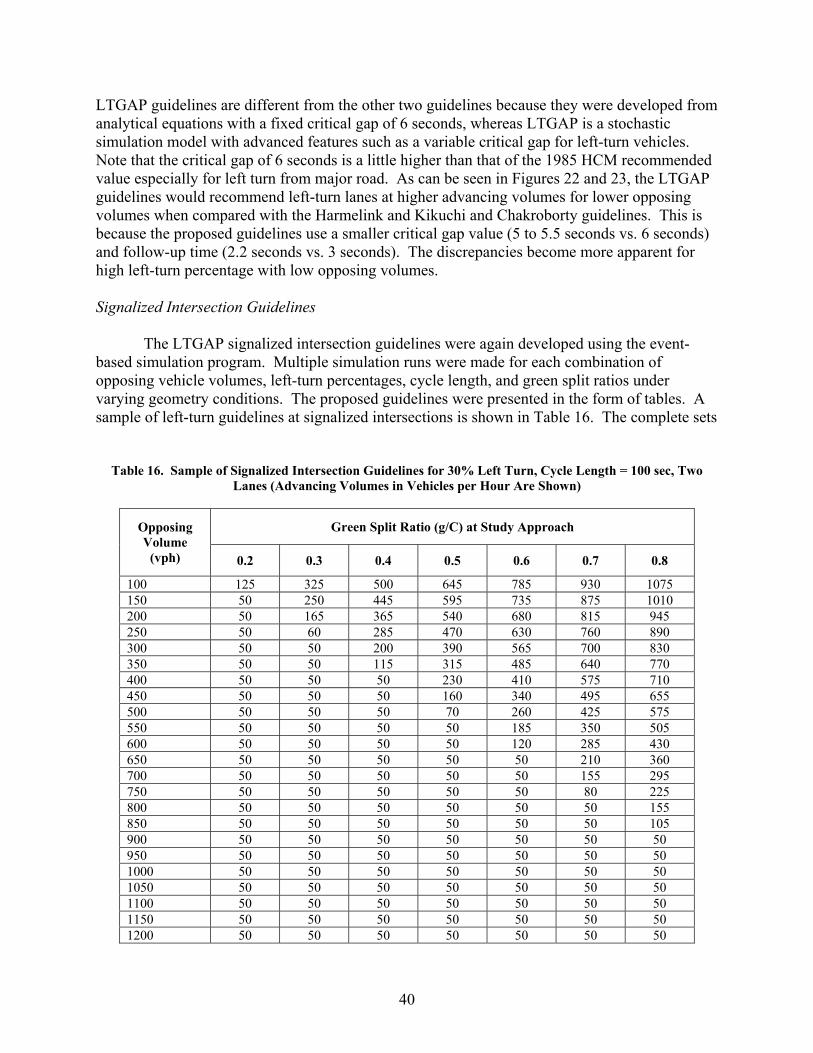
LTGAP guidelines are different from the other two guidelines because they were developed from analytical equations with a fixed critical gap of 6 seconds, whereas LTGAP is a stochastic simulation model with advanced features such as a variable critical gap for left-turn vehicles. Note that the critical gap of 6 seconds is a little higher than that of the 1985 HCM recommended value especially for left turn from major road. As can be seen in Figures 22 and 23, the LTGAP guidelines would recommend left-turn lanes at higher advancing volumes for lower opposing volumes when compared with the Harmelink and Kikuchi and Chakroborty guidelines. This is because the proposed guidelines use a smaller critical gap value (5 to 5.5 seconds vs. 6 seconds) and follow-up time (2.2 seconds vs. 3 seconds). The discrepancies become more apparent for high left-turn percentage with low opposing volumes. Signalized Intersection Guidelines The LTGAP signalized intersection guidelines were again developed using the event-based simulation program. Multiple simulation runs were made for each combination of opposing vehicle volumes, left-turn percentages, cycle length, and green split ratios under varying geometry conditions. The proposed guidelines were presented in the form of tables. A sample of left-turn guidelines at signalized intersections is shown in Table 16. The complete sets
Table 16. Sample of Signalized Intersection Guidelines for 30% Left Turn, Cycle Length = 100 sec, Two Lanes (Advancing Volumes in Vehicles per Hour Are Shown)
Green Split Ratio (g/C) at Study Approach Opposing Volume
(vph) 0.2 0.3 0.4 0.5 0.6 0.7 0.8
100 125 325 500 645 785 930 1075 150 50 250 445 595 735 875 1010 200 50 165 365 540 680 815 945 250 50 60 285 470 630 760 890 300 50 50 200 390 565 700 830 350 50 50 115 315 485 640 770 400 50 50 50 230 410 575 710 450 50 50 50 160 340 495 655 500 50 50 50 70 260 425 575 550 50 50 50 50 185 350 505 600 50 50 50 50 120 285 430 650 50 50 50 50 50 210 360 700 50 50 50 50 50 155 295 750 50 50 50 50 50 80 225 800 50 50 50 50 50 50 155 850 50 50 50 50 50 50 105 900 50 50 50 50 50 50 50 950 50 50 50 50 50 50 50 1000 50 50 50 50 50 50 50 1050 50 50 50 50 50 50 50 1100 50 50 50 50 50 50 50 1150 50 50 50 50 50 50 50 1200 50 50 50 50 50 50 50
41
of guidelines for two-lane and four-lane approaches are provided in Appendices D and E, respectively. The guidelines are shown in terms of advancing volumes in vehicles per hour for a given left-turn percentage, opposing volume, cycle length, and green split ratio. For example, for a left-turn percentage of 30%, cycle length of 100 sec, green ratio of 0.5, and opposing volume of 400 vph, an advancing volume of 230 vph (from Table 16) or above would justify the installation of a left-turn lane.
Since the actuated signalized intersection does not maintain fixed cycle length and green
times, these parameters are estimated from the event-based simulation. The simulation program uses minimum and maximum green times, gap-out times, and other parameters and outputs average green times and cycle length. Thus, these estimated average cycle lengths and g/C ratios are applied to the developed guidelines.
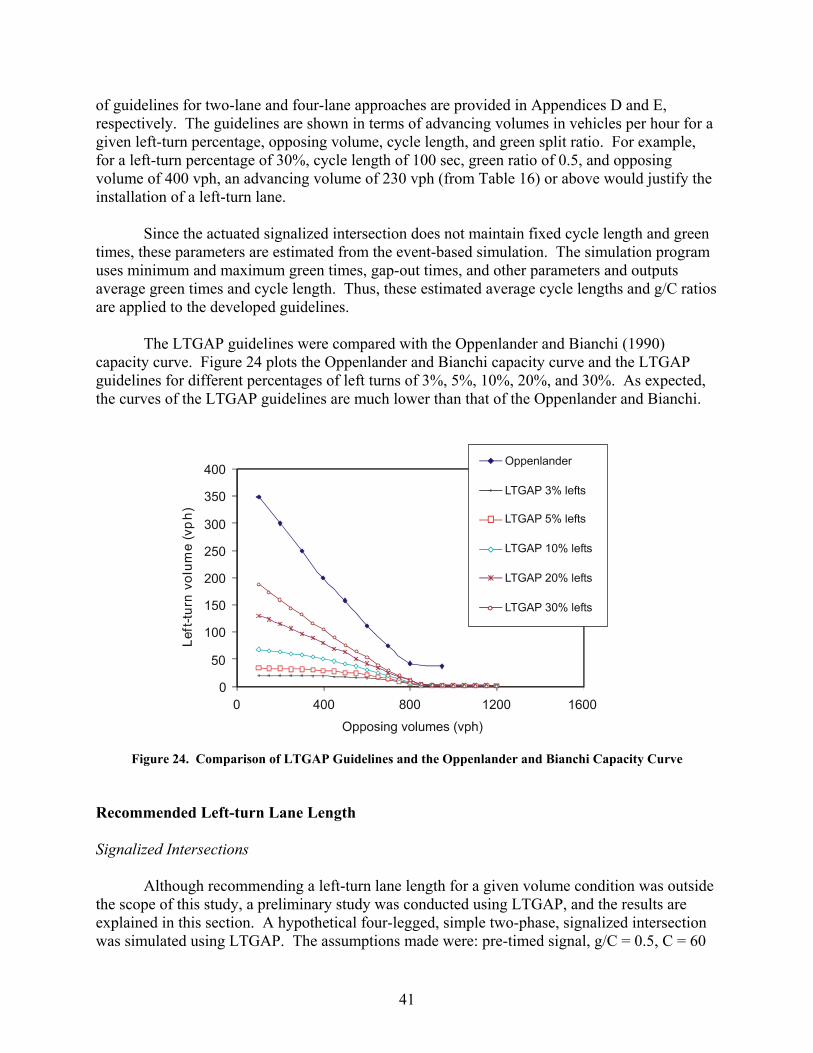
The LTGAP guidelines were compared with the Oppenlander and Bianchi (1990) capacity curve. Figure 24 plots the Oppenlander and Bianchi capacity curve and the LTGAP guidelines for different percentages of left turns of 3%, 5%, 10%, 20%, and 30%. As expected, the curves of the LTGAP guidelines are much lower than that of the Oppenlander and Bianchi.
Figure 24. Comparison of LTGAP Guidelines and the Oppenlander and Bianchi Capacity Curve
Recommended Left-turn Lane Length Signalized Intersections
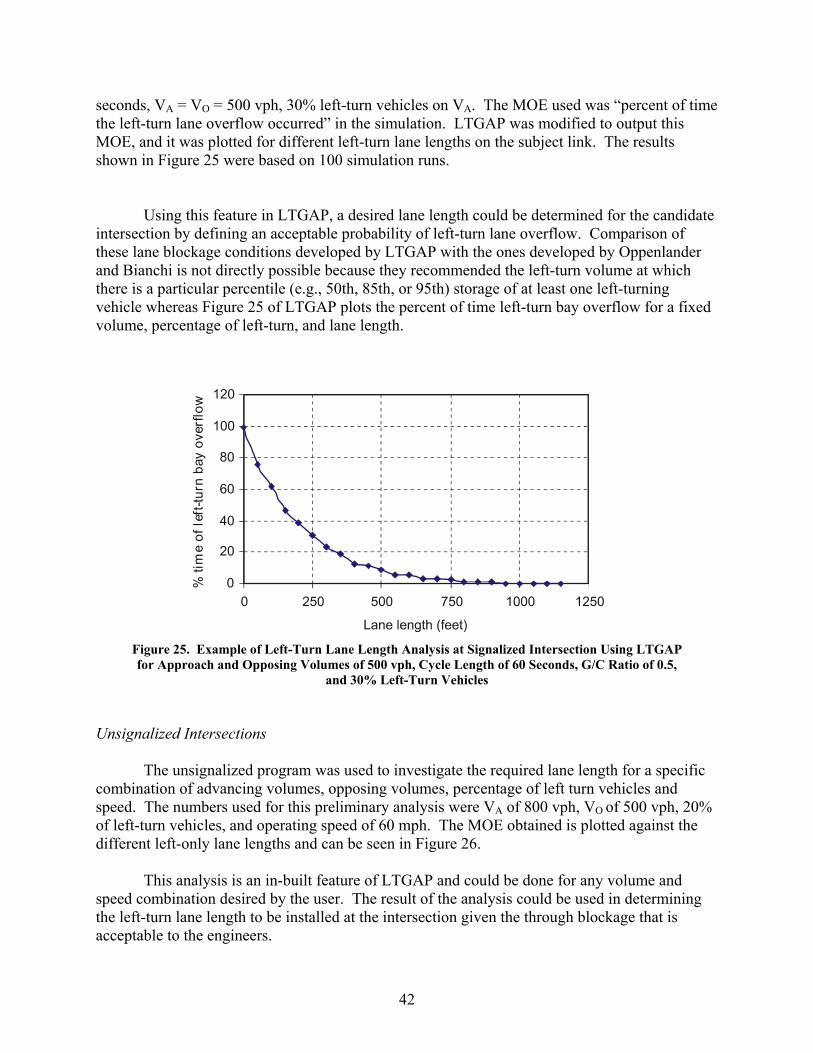
Although recommending a left-turn lane length for a given volume condition was outside the scope of this study, a preliminary study was conducted using LTGAP, and the results are explained in this section. A hypothetical four-legged, simple two-phase, signalized intersection was simulated using LTGAP. The assumptions made were: pre-timed signal, g/C = 0.5, C = 60
42
seconds, VA = VO = 500 vph, 30% left-turn vehicles on VA. The MOE used was �percent of time the left-turn lane overflow occurred� in the simulation. LTGAP was modified to output this MOE, and it was plotted for different left-turn lane lengths on the subject link. The results shown in Figure 25 were based on 100 simulation runs.
Using this feature in LTGAP, a desired lane length could be determined for the candidate
intersection by defining an acceptable probability of left-turn lane overflow. Comparison of these lane blockage conditions developed by LTGAP with the ones developed by Oppenlander and Bianchi is not directly possible because they recommended the left-turn volume at which there is a particular percentile (e.g., 50th, 85th, or 95th) storage of at least one left-turning vehicle whereas Figure 25 of LTGAP plots the percent of time left-turn bay overflow for a fixed volume, percentage of left-turn, and lane length.
Figure 25. Example of Left-Turn Lane Length Analysis at Signalized Intersection Using LTGAP for Approach and Opposing Volumes of 500 vph, Cycle Length of 60 Seconds, G/C Ratio of 0.5,
and 30% Left-Turn Vehicles Unsignalized Intersections
The unsignalized program was used to investigate the required lane length for a specific combination of advancing volumes, opposing volumes, percentage of left turn vehicles and speed. The numbers used for this preliminary analysis were VA of 800 vph, VO of 500 vph, 20% of left-turn vehicles, and operating speed of 60 mph. The MOE obtained is plotted against the different left-only lane lengths and can be seen in Figure 26.
This analysis is an in-built feature of LTGAP and could be done for any volume and
speed combination desired by the user. The result of the analysis could be used in determining the left-turn lane length to be installed at the intersection given the through blockage that is acceptable to the engineers.
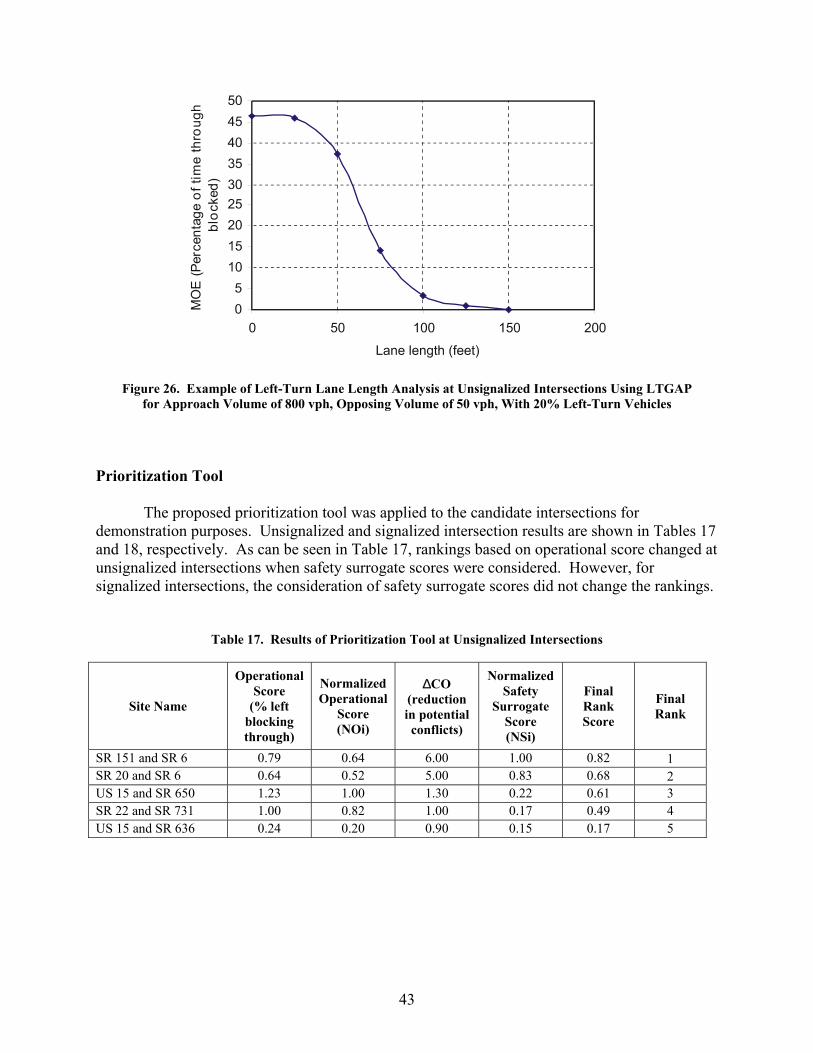
43
Figure 26. Example of Left-Turn Lane Length Analysis at Unsignalized Intersections Using LTGAP
for Approach Volume of 800 vph, Opposing Volume of 50 vph, With 20% Left-Turn Vehicles
Prioritization Tool
The proposed prioritization tool was applied to the candidate intersections for demonstration purposes. Unsignalized and signalized intersection results are shown in Tables 17 and 18, respectively. As can be seen in Table 17, rankings based on operational score changed at unsignalized intersections when safety surrogate scores were considered. However, for signalized intersections, the consideration of safety surrogate scores did not change the rankings.
Table 17. Results of Prioritization Tool at Unsignalized Intersections
Site Name
Operational Score
(% left blocking through)
Normalized Operational
Score (NOi)
∆CO (reduction in potential conflicts)
Normalized Safety
Surrogate Score (NSi)
Final Rank Score
Final Rank
SR 151 and SR 6 0.79 0.64 6.00 1.00 0.82 1 SR 20 and SR 6 0.64 0.52 5.00 0.83 0.68 2 US 15 and SR 650 1.23 1.00 1.30 0.22 0.61 3 SR 22 and SR 731 1.00 0.82 1.00 0.17 0.49 4 US 15 and SR 636 0.24 0.20 0.90 0.15 0.17 5

44
Table 18. Results of Prioritization Tool at Signalized Intersections
Site Name Operational Score
Normalized Operational
Score (NOi)
∆CO (reduction in potential conflicts)
Normalized Safety
Surrogate Score (NSi)
Final Rank Score
Final Rank
US 15 and US 250 0.50 1 259.1 1 1 1 US 250 and SR 616 0.45 0.89 235.1 0.90 0.90 2
SR 28 and SR 652 0.34 0.68 154.7 0.59 0.64 3 US 33 and New Bridge Rd. 0.23 0.47 0.02 0.000077 0.23 4
CONCLUSIONS In this study, new left-turn guidelines for unsignalized and signalized intersections were developed on the basis of well-validated event-based simulation programs. Guidelines for unsignalized intersections were based on the percentage of left-turns blocking through vehicles, and guidelines for signalized intersections were developed using minimum left-turn volume of either 85% left-turn capacity or LOS E delay (55 seconds/vehicle). In addition to the general guidelines, a prioritization tool that can be used to prioritize candidate intersections was developed. The prioritization tool accounts for both operational and safety aspects. The following conclusions were drawn from this study.
• The existing guidelines for unsignalized intersections proposed by Harmelink (1967) and Kikuchi and Chakroborty (1991) are applicable for only particular (fixed) percentages of left turns, and they are based on analytical deterministic models.
• The existing guidelines for signalized intersections developed by Oppenlander and
Bianchi (1990) are not applicable for actuated intersections, and they do not consider the effect of percentages of left-turn vehicles. A simulation-based evaluation indicated that these guidelines are conservative (i.e., difficult to justify left-turn lane installation) such that left-turn vehicles would experience a high delay.
• Most surveyed engineers are satisfied with the performance of the existing guidelines.
However, there seems to be confusion regarding the application of Harmelink�s guidelines. In some cases, they were used for signalized intersections even though they were developed for unsignalized intersections.
• Left-turn lane guidelines cannot be economically justified with only vehicle delay
savings because the cost of construction is very high and delay savings are so small, especially for low-volume unsignalized intersections. In addition, the benefits of
45
safety improvements are not easily quantified. This may be why none of the existing guidelines were developed using cost-benefit analysis.
• The guidelines proposed in this study require higher volumes than those of the
Harmelink guidelines in justifying the installation of left-turn lanes at unsignalized intersections. This is mainly because the critical gap of today�s drivers is likely to be smaller than that of 1960s when Harmelink developed his guidelines. This is primarily due to better vehicle performance.
• The prioritization tool developed in this study allows traffic engineers to determine
rankings of candidate intersections using operational and safety surrogate measures. Users can change weights between operational and safety surrogate aspects. For unsignalized intersections, reduction in conflict opportunities with the added left-turn lane is used as the MOE for a safety surrogate; for signalized intersections, the normalized left-turn volume/capacity ratio on the subject link is used.
RECOMMENDATIONS 1. The guidelines, shown as Appendices C, D, and E, developed in this study should be pilot
tested in a few districts in Virginia to obtain general opinions of the engineers. If the responses are positive enough, the guidelines should be included in the VDOT Road Design Manual. They should also be integrated into existing efforts regarding land development, site access, and access management work.
2. It should be made clear that the Harmelink guidelines were developed for unsignalized
intersections and should not be applied to signalized intersections. In addition, left-turn lane guidelines should be identified as either �signalized intersection guidelines� or �unsignalized intersection guidelines� in the literature to minimize potential misuse.
3. As the proposed guidelines are solely based on the operational performance measures,
traffic engineers need to consider the impact of safety before making decisions on installing left-turn lanes.
CONSIDERATIONS FOR FUTURE RESEARCH • The LTGAP program developed in this study does not fully implement multi-phase actuated
signal controls. An installation of a left-turn lane at a signalized intersection could further improve its operation by implementing an exclusive left-turn phasing. It is recommended that further research be conducted for developing left-turn phasing guidelines.
• If the proposed guidelines are accepted by VDOT, the interface of the prototype LTGAP
program should be enhanced for professional use. Especially, the prioritization tool demonstrated in the project needs to be further incorporated into LTGAP.

46
• The safety surrogate measure used in this study was solely based on conflict opportunities. Future research should quantify the extent to which conflict opportunities can predict crashes such that the impact of safety can be better incorporated into the prioritization tool.
ACKNOWLEDGMENTS
The authors acknowledge the support given by all the wonderful people at the Virginia
Transportation Research Council and offer special thanks to Lewis Woodson and Lance Dougald for their valuable help in collecting the data for this project.
REFERENCES
American Association of State Highway & Transportation Officials. A Policy on the Geometric Design of Highways and Streets. Washington, DC, 2001.
Efron, B. and R.J. Tibshirani. An Introduction to the Bootstrap. Chapman & Hall, New York,
1993. Garber, N.J. and Hoel, L.A. Traffic and Highway Engineering, Third Edition, Brooks/Cole,
Pacific Grove, California, 2001. Ha, T.-J. and W.D. Berg. Development of Safety-Based Level of Service Criteria for Isolated
Signalized Intersections. Transportation Research Record 1484. Transportation Research Board, Washington, DC, 1995, pp. 98-104.
Harmelink, M.D. Volume Warrants for Left-Turn Storage Lanes at Unsignalized Grade
Intersections. Highway Research Record 211, 1967, pp. 1-18. Kikuchi, S. and P. Chakroborty. Analysis of Left-Turn-Lane Warrants at Unsignalized T-
intersections on Two-Lane Roadways. Transportation Research Record 1327. Transportation Research Board, Washington DC, 1991, pp. 80-88.
Oppenlander, P.E. and J.C. Bianchi. Guidelines for Left-Turn Lanes. In Compendium of
Technical Papers, 60th Annual Meeting, August 5-8, 1990, Orlando, Florida, Institute of Transportation Engineers, Washington, D.C.
Trafficware. SimTraffic 5.0 Users� Guide. Albany, California, 2001. Transportation Research Board. Highway Capacity Manual. Special Report 209. Washington,
DC, 1985.

47
Transportation Research Board. Highway Capacity Manual. Special Report 209. Washington, DC, 2000.
Tian, Z.Z., R. Troutbeck, M. Kyte, W. Brilon, M. Vandehey, W. Kittelson, and B. Robinson. A
Further Investigation on Critical Gap and Follow-up Time. Transportation Research Circular E-C018. Transportation Research Board, Washington, DC, June 2000.
Virginia Department of Transportation, Location and Design Division. Road Design Manual,
Richmond, 2002.

48

49
APPENDIX A
SURVEY QUESTIONNAIRE The following survey was conducted from 03/24/2003 to 03/28/2003 on the usage of left-turn lane guidelines in the state of Virginia. The responses were collected from resident engineers as well as the district traffic engineers throughout Virginia Department of Transportation (VDOT). Questions:
• How do you determine whether a left-turn lane is needed at a signalized intersection? Please state the source of any guideline that you use.
• How do you rate the effectiveness of this method? (Check one)
i. Guidelines often call for a left-turn lane where it is not needed. ii. Guidelines sometimes call for a left-turn lane where it is not needed
iii. Guidelines usually do a good job of determining when a left-turn lane is needed. iv. Guidelines sometimes do not call for a left-turn lane when one is needed. v. Guidelines often do not call for a left-turn lane when one is needed.
b. Are there any special situations that you think the guidelines handle poorly?
c. How do you determine whether a left-turn lane is needed at an unsignalized intersection?
Please state the source of any guideline that you use.
d. How do you rate the effectiveness of this method (check one) i. Guidelines often call for a left-turn lane where it is not needed.
ii. Guidelines sometimes call for a left-turn lane where it is not needed iii. Guidelines usually do a good job of determining when a left-turn lane is needed. iv. Guidelines sometimes do not call for a left-turn lane when one is needed. v. Guidelines often do not call for a left-turn lane when one is needed.
e. Are there any special situations that you think the guidelines handle poorly?
f. Do you have any general comments about the methods used by VDOT to determine
whether a left-turn lane is needed at an intersection?
g. Your name h. Title i. District j. Residency k. Phone number.

50

51
APPENDIX B
CYCLE LENGTH OPTIMIZATION IN LTGAP LTGAP determines the max greens for the different phases at an actuated signal using the HCM 2000 methodology and optimum cycle length using Webster�s formula. The cycle length at an actuated signal is assumed to be the sum of maximum greens of all phases and yellow and red clearance times. Webster proposed the following formula for the optimum cycle length.
∑−+=
io Y
LC1
55.1 [B-1]
where Co = Optimum cycle length L = Total lost time for all phases Yi = Sum of volume to saturation flow ratio (i.e., v/s) for critical movements. In order to estimate Yi, saturation flow rate should be known. The cycle length and green times should be known to calculate adjusted saturation flow rate. Thus, the determination of green times and saturation flow rate requires iteration. LTGAP starts from a cycle length and determines maximum green times according to equal degree of saturation, and calculates adjusted saturation flow rate using the sample procedure shown in Table B-1. Then, optimum cycle length, Co, is calculated using Webster�s equation shown above. The Co, if different from initial cycle length, provides new maximum green times and used to calculate updated adjusted saturation flow rate. These iterations continue until two consecutive cycle lengths are close enough, say less than 5 seconds.
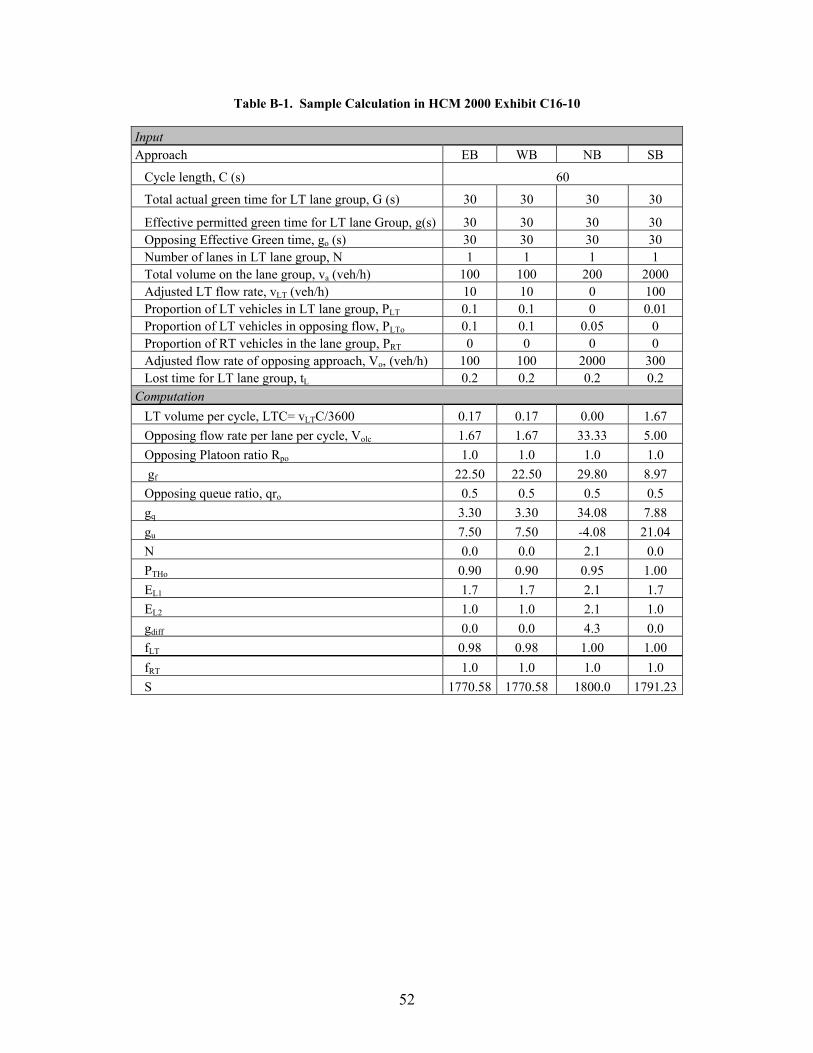
52
Table B-1. Sample Calculation in HCM 2000 Exhibit C16-10
Input Approach EB WB NB SB
Cycle length, C (s) 60
Total actual green time for LT lane group, G (s) 30 30 30 30
Effective permitted green time for LT lane Group, g(s) 30 30 30 30 Opposing Effective Green time, go (s) 30 30 30 30 Number of lanes in LT lane group, N 1 1 1 1 Total volume on the lane group, va (veh/h) 100 100 200 2000 Adjusted LT flow rate, vLT (veh/h) 10 10 0 100 Proportion of LT vehicles in LT lane group, PLT 0.1 0.1 0 0.01 Proportion of LT vehicles in opposing flow, PLTo 0.1 0.1 0.05 0 Proportion of RT vehicles in the lane group, PRT 0 0 0 0 Adjusted flow rate of opposing approach, Vo, (veh/h) 100 100 2000 300 Lost time for LT lane group, tL 0.2 0.2 0.2 0.2
Computation LT volume per cycle, LTC= vLTC/3600 0.17 0.17 0.00 1.67 Opposing flow rate per lane per cycle, Volc 1.67 1.67 33.33 5.00 Opposing Platoon ratio Rpo 1.0 1.0 1.0 1.0 gf 22.50 22.50 29.80 8.97 Opposing queue ratio, qro 0.5 0.5 0.5 0.5 gq 3.30 3.30 34.08 7.88 gu 7.50 7.50 -4.08 21.04 N 0.0 0.0 2.1 0.0 PTHo 0.90 0.90 0.95 1.00 EL1 1.7 1.7 2.1 1.7 EL2 1.0 1.0 2.1 1.0 gdiff 0.0 0.0 4.3 0.0 fLT 0.98 0.98 1.00 1.00 fRT 1.0 1.0 1.0 1.0 S 1770.58 1770.58 1800.0 1791.23
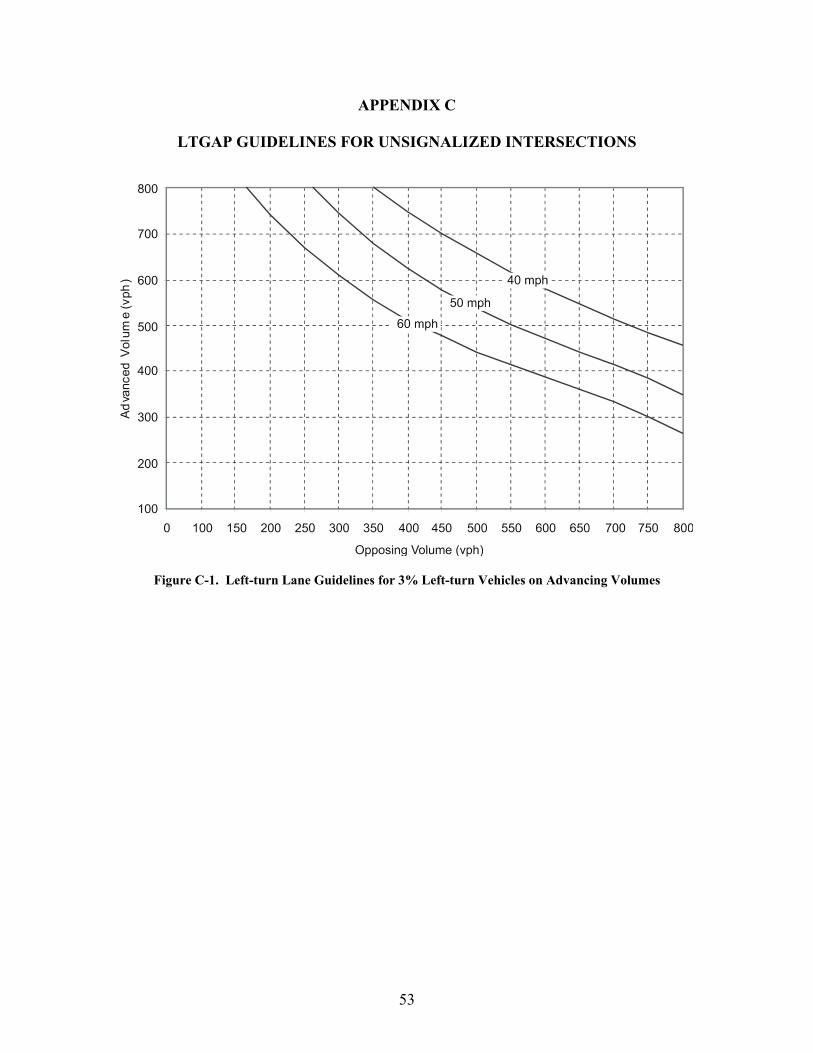
53
APPENDIX C
LTGAP GUIDELINES FOR UNSIGNALIZED INTERSECTIONS
Figure C-1. Left-turn Lane Guidelines for 3% Left-turn Vehicles on Advancing Volumes

54
Figure C-2. Left-turn Lane Guidelines for 5% Left-turn Vehicles on Advancing Volumes

55
Figure C-3. Left-turn Lane Guidelines for 10% Left-turn Vehicles on Advancing Volumes

56
Figure C-4. Left-turn Lane Guidelines for 20% Left-turn Vehicles on Advancing Volumes

57
Figure C-5. Left-turn Lane Guidelines for 30% Left-turn Vehicles on Advancing Volumes

58

59
APPENDIX D
LTGAP GUIDELINES AT PRE-TIMED SIGNALIZED INTERSECTIONS (TWO-LANE APPROACHES)
Advancing volume (vph) for 3% left turn
3 Cycle length = 60 seconds Cycle length = 80 seconds Cycle length = 100 seconds Green Ratios Green Ratios Green Ratios
Opposing volume (vph)
0.2 0.3 0.4 0.5 0.6 0.7 0.8 0.2 0.3 0.4 0.5 0.6 0.7 0.8 0.2 0.3 0.4 0.5 0.6 0.7 0.8
100 225 400 550 705 855 1005 1155 235 415 565 715 865 1020 1170 230 420 570 720 875 1025 1175 150 155 395 545 695 845 995 1145 155 405 555 710 860 1010 1160 120 395 565 715 865 1020 1165 200 50 365 540 685 840 985 1130 50 370 550 695 850 1000 1145 50 355 550 705 855 1005 1160 250 50 295 520 675 825 975 1120 50 290 535 685 840 985 1135 50 250 540 695 845 990 1140 300 50 75 500 665 810 965 1110 50 85 505 670 825 970 1125 50 75 475 675 830 980 1135 350 50 50 425 645 800 950 1095 50 50 425 660 810 960 1110 50 50 400 660 815 965 1120 400 50 50 245 630 785 935 1075 50 50 240 625 795 945 1090 50 50 155 615 800 950 1100 450 50 50 65 540 760 915 1055 50 50 70 535 770 930 1075 50 50 60 520 775 925 1080 500 50 50 50 395 740 890 1035 50 50 50 390 740 905 1055 50 50 50 395 730 905 1065 550 50 50 50 120 650 865 1020 50 50 50 125 645 880 1030 50 50 50 120 630 890 1035 600 50 50 50 55 515 830 1000 50 50 50 50 515 845 1005 50 50 50 50 490 840 1015 650 50 50 50 50 300 755 975 50 50 50 50 310 740 975 50 50 50 50 270 745 990 700 50 50 50 50 80 660 905 50 50 50 50 85 635 945 50 50 50 50 65 680 955 750 50 50 50 50 50 475 825 50 50 50 50 55 465 820 50 50 50 50 50 435 845 800 50 50 50 50 50 130 725 50 50 50 50 50 205 705 50 50 50 50 50 290 730 850 50 50 50 50 50 75 530 50 50 50 50 50 75 605 50 50 50 50 50 70 580 900 50 50 50 50 50 50 330 50 50 50 50 50 55 375 50 50 50 50 50 50 370 950 50 50 50 50 50 50 140 50 50 50 50 50 50 200 50 50 50 50 50 50 90 1000 50 50 50 50 50 50 50 50 50 50 50 50 50 50 50 50 50 50 50 50 65 1050 50 50 50 50 50 50 50 50 50 50 50 50 50 50 50 50 50 50 50 50 50 1100 50 50 50 50 50 50 50 50 50 50 50 50 50 50 50 50 50 50 50 50 50 1150 50 50 50 50 50 50 50 50 50 50 50 50 50 50 50 50 50 50 50 50 50 1200 50 50 50 50 50 50 50 50 50 50 50 50 50 50 50 50 50 50 50 50 50
Note: Criteria based on using 85% or less of left-turn capacity and providing average left-turn delay of 55 seconds or less per vehicle

60
Advancing volume (vph) for 5% left turn
5 Cycle length = 60 seconds Cycle length = 80 seconds Cycle length = 100 seconds Green Ratios Green Ratios Green Ratios
Opposing volume (vph)
0.2 0.3 0.4 0.5 0.6 0.7 0.8 0.2 0.3 0.4 0.5 0.6 0.7 0.8 0.2 0.3 0.4 0.5 0.6 0.7 0.8
100 220 395 545 695 845 995 1145 220 410 560 710 855 1010 1160 210 410 565 715 865 1015 1170 150 130 385 535 680 835 980 1130 125 395 545 695 845 995 1145 85 380 550 705 850 1005 1150 200 50 335 520 670 820 965 1110 50 340 530 675 830 980 1125 50 320 535 685 835 985 1135 250 50 245 505 655 800 945 1090 50 240 510 665 815 960 1110 50 205 500 670 820 970 1115 300 50 50 445 635 785 925 1070 50 55 445 645 790 945 1085 50 50 425 645 800 945 1095 350 50 50 360 605 760 905 1055 50 50 345 620 770 920 1070 50 50 315 605 775 925 1070 400 50 50 180 545 735 885 1030 50 50 180 550 745 895 1045 50 50 125 530 750 900 1050 450 50 50 50 455 710 860 1000 50 50 50 455 710 860 1020 50 50 50 420 695 870 1020 500 50 50 50 285 630 820 965 50 50 50 290 630 835 980 50 50 50 265 625 835 990 550 50 50 50 80 530 790 935 50 50 50 85 530 800 960 50 50 50 75 515 790 955 600 50 50 50 50 395 720 905 50 50 50 50 400 700 915 50 50 50 50 370 695 920 650 50 50 50 50 190 605 855 50 50 50 50 195 605 870 50 50 50 50 180 605 870 700 50 50 50 50 50 485 770 50 50 50 50 65 490 775 50 50 50 50 50 475 770 750 50 50 50 50 50 305 650 50 50 50 50 50 315 665 50 50 50 50 50 290 665 800 50 50 50 50 50 100 515 50 50 50 50 50 100 540 50 50 50 50 50 90 545 850 50 50 50 50 50 50 365 50 50 50 50 50 50 385 50 50 50 50 50 50 380 900 50 50 50 50 50 50 190 50 50 50 50 50 50 210 50 50 50 50 50 50 200 950 50 50 50 50 50 50 50 50 50 50 50 50 50 55 50 50 50 50 50 50 65 1000 50 50 50 50 50 50 50 50 50 50 50 50 50 50 50 50 50 50 50 50 50 1050 50 50 50 50 50 50 50 50 50 50 50 50 50 50 50 50 50 50 50 50 50 1100 50 50 50 50 50 50 50 50 50 50 50 50 50 50 50 50 50 50 50 50 50 1150 50 50 50 50 50 50 50 50 50 50 50 50 50 50 50 50 50 50 50 50 50 1200 50 50 50 50 50 50 50 50 50 50 50 50 50 50 50 50 50 50 50 50 50
Note: Criteria based on using 85% or less of left-turn capacity and providing average left-turn delay of 55 seconds or less per vehicle

61
Advancing volume (vph) for 10% left turn
10 Cycle length = 60 seconds Cycle length = 80 seconds Cycle length = 100 seconds
Green Ratios Green Ratios Green Ratios Opposing
volume (vph)
0.2 0.3 0.4 0.5 0.6 0.7 0.8 0.2 0.3 0.4 0.5 0.6 0.7 0.8 0.2 0.3 0.4 0.5 0.6 0.7 0.8
100 200 380 530 680 830 975 1120 200 395 545 690 840 990 1135 180 385 550 695 845 995 1145 150 80 350 510 660 805 950 1095 80 350 520 670 815 960 1105 50 340 525 675 820 965 1115 200 50 285 485 630 780 920 1060 50 290 495 640 785 935 1075 50 260 485 650 790 940 1085 250 50 185 440 600 750 890 1030 50 175 435 615 755 900 1045 50 145 410 615 760 910 1050 300 50 50 365 575 715 855 990 50 50 365 575 725 875 1010 50 50 335 560 725 875 1015 350 50 50 260 510 680 815 955 50 50 250 505 690 830 970 50 50 220 495 690 840 975 400 50 50 95 425 645 785 920 50 50 105 415 645 790 930 50 50 65 405 635 800 940 450 50 50 50 330 560 750 885 50 50 50 315 560 750 890 50 50 50 300 555 765 905 500 50 50 50 185 475 685 835 50 50 50 190 480 690 855 50 50 50 165 455 690 855 550 50 50 50 50 370 610 795 50 50 50 50 375 610 805 50 50 50 50 360 600 810 600 50 50 50 50 265 515 720 50 50 50 50 245 520 735 50 50 50 50 240 515 730 650 50 50 50 50 115 415 635 50 50 50 50 115 425 645 50 50 50 50 90 430 645 700 50 50 50 50 50 295 555 50 50 50 50 50 310 555 50 50 50 50 50 325 570 750 50 50 50 50 50 190 435 50 50 50 50 50 210 470 50 50 50 50 50 185 465 800 50 50 50 50 50 50 330 50 50 50 50 50 70 360 50 50 50 50 50 50 350 850 50 50 50 50 50 50 220 50 50 50 50 50 50 245 50 50 50 50 50 50 255 900 50 50 50 50 50 50 90 50 50 50 50 50 50 105 50 50 50 50 50 50 120 950 50 50 50 50 50 50 50 50 50 50 50 50 50 50 50 50 50 50 50 50 50
1000 50 50 50 50 50 50 50 50 50 50 50 50 50 50 50 50 50 50 50 50 50 1050 50 50 50 50 50 50 50 50 50 50 50 50 50 50 50 50 50 50 50 50 50 1100 50 50 50 50 50 50 50 50 50 50 50 50 50 50 50 50 50 50 50 50 50 1150 50 50 50 50 50 50 50 50 50 50 50 50 50 50 50 50 50 50 50 50 50 1200 50 50 50 50 50 50 50 50 50 50 50 50 50 50 50 50 50 50 50 50 50
Note: Criteria based on using 85% or less of left-turn capacity and providing average left-turn delay of 55 seconds or less per vehicle

62
Advancing volume (vph) for 20% left turn
Cycle length = 60 seconds Cycle length = 80 seconds Cycle length = 100 seconds Green Ratios Green Ratios Green Ratios
Opposing volume (vph)
0.2 0.3 0.4 0.5 0.6 0.7 0.8 0.2 0.3 0.4 0.5 0.6 0.7 0.8 0.2 0.3 0.4 0.5 0.6 0.7 0.8
100 170 360 505 650 795 940 1080 170 360 515 665 805 950 1095 150 355 520 670 815 960 1105 150 65 300 475 615 755 900 1035 55 300 485 625 770 910 1045 50 285 485 625 770 910 1055 200 50 225 425 575 715 850 985 50 220 420 580 725 860 1000 50 195 410 590 725 865 1005 250 50 125 350 535 665 800 935 50 120 345 540 675 815 945 50 85 335 525 680 815 955 300 50 50 270 465 620 750 885 50 50 265 465 630 770 900 50 50 250 460 635 770 900 350 50 50 175 390 565 705 835 50 50 170 385 565 715 850 50 50 155 370 560 720 850 400 50 50 50 295 490 660 780 50 50 50 300 490 665 795 50 50 50 285 490 670 805 450 50 50 50 215 410 585 735 50 50 50 220 420 590 740 50 50 50 205 405 595 740 500 50 50 50 115 330 510 675 50 50 50 115 325 510 685 50 50 50 110 325 510 685 550 50 50 50 50 250 440 605 50 50 50 50 240 445 605 50 50 50 50 250 430 605 600 50 50 50 50 155 365 515 50 50 50 50 165 355 530 50 50 50 50 160 350 530 650 50 50 50 50 65 270 440 50 50 50 50 70 275 450 50 50 50 50 60 270 450 700 50 50 50 50 50 190 355 50 50 50 50 50 190 370 50 50 50 50 50 195 370 750 50 50 50 50 50 120 285 50 50 50 50 50 120 295 50 50 50 50 50 95 290 800 50 50 50 50 50 50 220 50 50 50 50 50 50 220 50 50 50 50 50 65 215 850 50 50 50 50 50 50 140 50 50 50 50 50 50 140 50 50 50 50 50 50 155 900 50 50 50 50 50 50 60 50 50 50 50 50 50 75 50 50 50 50 50 50 65 950 50 50 50 50 50 50 50 50 50 50 50 50 50 50 50 50 50 50 50 50 50
1000 50 50 50 50 50 50 50 50 50 50 50 50 50 50 50 50 50 50 50 50 50 1050 50 50 50 50 50 50 50 50 50 50 50 50 50 50 50 50 50 50 50 50 50 1100 50 50 50 50 50 50 50 50 50 50 50 50 50 50 50 50 50 50 50 50 50 1150 50 50 50 50 50 50 50 50 50 50 50 50 50 50 50 50 50 50 50 50 50 1200 50 50 50 50 50 50 50 50 50 50 50 50 50 50 50 50 50 50 50 50 50
Note: Criteria based on using 85% or less of left-turn capacity and providing average left-turn delay of 55 seconds or less per vehicle

63
Advancing volume (vph) for 30% left turn
Cycle length = 60 seconds Cycle length = 80 seconds Cycle length = 100 seconds Green Ratios Green Ratios Green Ratios
Opposing volume (vph)
0.2 0.3 0.4 0.5 0.6 0.7 0.8 0.2 0.3 0.4 0.5 0.6 0.7 0.8 0.2 0.3 0.4 0.5 0.6 0.7 0.8
100 150 335 485 625 770 910 1050 150 335 495 640 780 925 1065 125 325 500 645 785 930 1075 150 50 270 445 580 720 855 990 50 265 445 590 730 865 1005 50 250 445 595 735 875 1010 200 50 190 375 530 665 795 930 50 185 370 540 675 810 945 50 165 365 540 680 815 945 250 50 95 300 470 610 745 870 50 90 295 475 620 755 880 50 60 285 470 630 760 890 300 50 50 220 400 565 685 805 50 50 220 395 565 700 820 50 50 200 390 565 700 830 350 50 50 140 325 490 630 750 50 50 135 320 485 640 765 50 50 115 315 485 640 770 400 50 50 50 245 410 565 695 50 50 50 250 415 575 705 50 50 50 230 410 575 710 450 50 50 50 170 340 490 635 50 50 50 165 340 500 650 50 50 50 160 340 495 655 500 50 50 50 85 260 420 560 50 50 50 85 275 420 575 50 50 50 70 260 425 575 550 50 50 50 50 190 340 485 50 50 50 50 195 350 495 50 50 50 50 185 350 505 600 50 50 50 50 125 275 415 50 50 50 50 130 285 430 50 50 50 50 120 285 430 650 50 50 50 50 60 210 360 50 50 50 50 60 210 355 50 50 50 50 50 210 360 700 50 50 50 50 50 140 280 50 50 50 50 50 155 285 50 50 50 50 50 155 295 750 50 50 50 50 50 80 220 50 50 50 50 50 75 225 50 50 50 50 50 80 225 800 50 50 50 50 50 50 150 50 50 50 50 50 50 170 50 50 50 50 50 50 155 850 50 50 50 50 50 50 95 50 50 50 50 50 50 105 50 50 50 50 50 50 105 900 50 50 50 50 50 50 50 50 50 50 50 50 50 50 50 50 50 50 50 50 50 950 50 50 50 50 50 50 50 50 50 50 50 50 50 50 50 50 50 50 50 50 50
1000 50 50 50 50 50 50 50 50 50 50 50 50 50 50 50 50 50 50 50 50 50 1050 50 50 50 50 50 50 50 50 50 50 50 50 50 50 50 50 50 50 50 50 50 1100 50 50 50 50 50 50 50 50 50 50 50 50 50 50 50 50 50 50 50 50 50 1150 50 50 50 50 50 50 50 50 50 50 50 50 50 50 50 50 50 50 50 50 50 1200 50 50 50 50 50 50 50 50 50 50 50 50 50 50 50 50 50 50 50 50 50
Note: Criteria based on using 85% or less of left-turn capacity and providing average left-turn delay of 55 seconds or less per vehicle

64

65
APPENDIX E
LTGAP GUIDELINES AT PRE-TIMED SIGNALIZED INTERSECTIONS (FOUR-LANE APPROACHES)
Advancing volume (vph) for 3% left turn
3 Cycle length = 60 seconds Cycle length = 80 seconds Cycle length = 100 seconds Green Ratios Green Ratios Green Ratios
Opposing volume (vph)
0.2 0.3 0.4 0.5 0.6 0.7 0.8 0.2 0.3 0.4 0.5 0.6 0.7 0.8 0.2 0.3 0.4 0.5 0.6 0.7 0.8
100 500 800 1100 1400 1645 1650 1650 525 820 1120 1420 1640 1645 1650 510 835 1135 1430 1635 1645 1645 150 460 790 1090 1390 1635 1655 1660 470 815 1110 1410 1635 1650 1660 450 825 1125 1420 1635 1650 1650 200 395 780 1080 1375 1630 1660 1650 400 805 1105 1395 1635 1650 1655 330 795 1115 1410 1630 1645 1645 250 250 750 1070 1365 1610 1650 1650 215 755 1090 1385 1620 1650 1650 135 730 1105 1395 1620 1650 1650 300 70 685 1055 1350 1600 1650 1655 50 690 1075 1370 1605 1650 1650 50 640 1070 1380 1605 1650 1655 350 50 580 1010 1335 1585 1650 1655 50 580 1015 1355 1595 1650 1650 50 520 1000 1365 1600 1645 1650 400 50 425 930 1315 1570 1650 1650 50 435 950 1340 1575 1655 1655 50 300 885 1315 1585 1650 1650 450 50 205 830 1235 1555 1640 1655 50 170 835 1245 1550 1650 1650 50 130 800 1235 1560 1645 1645 500 50 90 715 1145 1520 1635 1645 50 80 750 1165 1535 1635 1660 50 70 640 1140 1530 1640 1650 550 50 50 585 1050 1425 1625 1650 50 50 545 1040 1435 1625 1650 50 50 495 1020 1455 1625 1655 600 50 50 375 945 1355 1595 1645 50 50 385 915 1370 1615 1650 50 50 320 895 1330 1610 1655 650 50 50 215 795 1235 1575 1645 50 50 155 795 1240 1600 1645 50 50 95 775 1205 1590 1650 700 50 50 65 610 1085 1480 1640 50 50 70 635 1090 1500 1645 50 50 50 600 1120 1505 1635 750 50 50 50 425 960 1345 1620 50 50 50 440 975 1370 1630 50 50 50 450 920 1415 1630 800 50 50 50 220 800 1210 1610 50 50 50 280 905 1230 1600 50 50 50 180 810 1225 1625 850 50 50 50 140 610 1075 1500 50 50 50 115 630 1110 1510 50 50 50 80 590 1075 1500 900 50 50 50 60 435 885 1315 50 50 50 60 425 915 1375 50 50 50 50 375 935 1320 950 50 50 50 50 205 740 1195 50 50 50 50 180 755 1170 50 50 50 50 185 715 1235 1000 50 50 50 50 65 595 1015 50 50 50 50 100 550 1020 50 50 50 50 90 550 1050 1050 50 50 50 50 60 375 830 50 50 50 50 50 375 875 50 50 50 50 80 350 870 1100 50 50 50 50 50 130 605 50 50 50 50 50 135 620 50 50 50 50 50 155 675 1150 50 50 50 50 50 90 380 50 50 50 50 50 155 460 50 50 50 50 50 70 445 1200 50 50 50 50 50 50 200 50 50 50 50 50 65 220 50 50 50 50 50 50 255
Note: Criteria based on using 85% or less of left-turn capacity and providing average left-turn delay of 55 seconds or less per vehicle.

66
Advancing volume (vph) for 5% left turn
5 Cycle length = 60 seconds Cycle length = 80 seconds Cycle length = 100 seconds Green Ratios Green Ratios Green Ratios
Opposing volume (vph)
0.2 0.3 0.4 0.5 0.6 0.7 0.8 0.2 0.3 0.4 0.5 0.6 0.7 0.8 0.2 0.3 0.4 0.5 0.6 0.7 0.8
100 480 790 1090 1390 1630 1660 1655 495 815 1110 1410 1635 1655 1650 480 825 1125 1420 1630 1645 1650 150 430 780 1075 1370 1625 1660 1650 430 800 1095 1390 1625 1650 1655 405 810 1110 1405 1630 1645 1655 200 345 750 1060 1350 1610 1655 1650 335 750 1080 1370 1605 1655 1660 275 740 1090 1385 1610 1645 1655 250 185 680 1040 1335 1585 1650 1650 155 680 1060 1350 1590 1650 1655 95 650 1050 1365 1590 1645 1655 300 50 595 975 1315 1560 1650 1655 50 585 985 1330 1565 1650 1655 50 550 960 1340 1570 1645 1660 350 50 480 890 1250 1535 1640 1650 50 470 885 1260 1545 1640 1660 50 405 870 1260 1550 1635 1650 400 50 335 790 1160 1510 1630 1650 50 320 780 1180 1515 1630 1655 50 240 770 1165 1515 1625 1650 450 50 155 700 1070 1425 1610 1655 50 115 680 1070 1445 1610 1655 50 95 650 1070 1430 1615 1650 500 50 50 590 970 1340 1580 1650 50 50 565 985 1340 1590 1650 50 50 555 975 1325 1585 1645 550 50 50 420 850 1225 1550 1635 50 50 410 860 1205 1565 1645 50 50 365 825 1200 1560 1640 600 50 50 250 745 1105 1445 1620 50 50 220 735 1135 1455 1630 50 50 190 720 1100 1460 1625 650 50 50 75 600 1015 1355 1595 50 50 95 605 1015 1345 1600 50 50 50 555 975 1360 1605 700 50 50 50 450 870 1200 1550 50 50 50 440 850 1235 1540 50 50 50 485 870 1215 1555 750 50 50 50 290 725 1075 1400 50 50 50 335 730 1085 1440 50 50 50 250 715 1090 1410 800 50 50 50 170 570 930 1270 50 50 50 150 600 975 1310 50 50 50 70 560 960 1290 850 50 50 50 50 425 800 1110 50 50 50 50 445 820 1145 50 50 50 50 415 835 1180 900 50 50 50 50 305 655 990 50 50 50 50 270 710 1005 50 50 50 50 290 675 1000 950 50 50 50 50 135 550 845 50 50 50 50 135 565 870 50 50 50 50 85 515 850 1000 50 50 50 50 50 355 710 50 50 50 50 50 410 725 50 50 50 50 50 385 745 1050 50 50 50 50 50 235 590 50 50 50 50 50 245 570 50 50 50 50 20 205 650 1100 50 50 50 50 50 105 425 50 50 50 50 50 75 405 50 50 50 50 50 65 455 1150 50 50 50 50 50 50 245 50 50 50 50 50 90 260 50 50 50 50 50 50 310 1200 50 50 50 50 50 50 155 50 50 50 50 50 50 185 50 50 50 50 50 50 110
Note: Criteria based on using 85% or less of left-turn capacity and providing average left-turn delay of 55 seconds or less per vehicle.
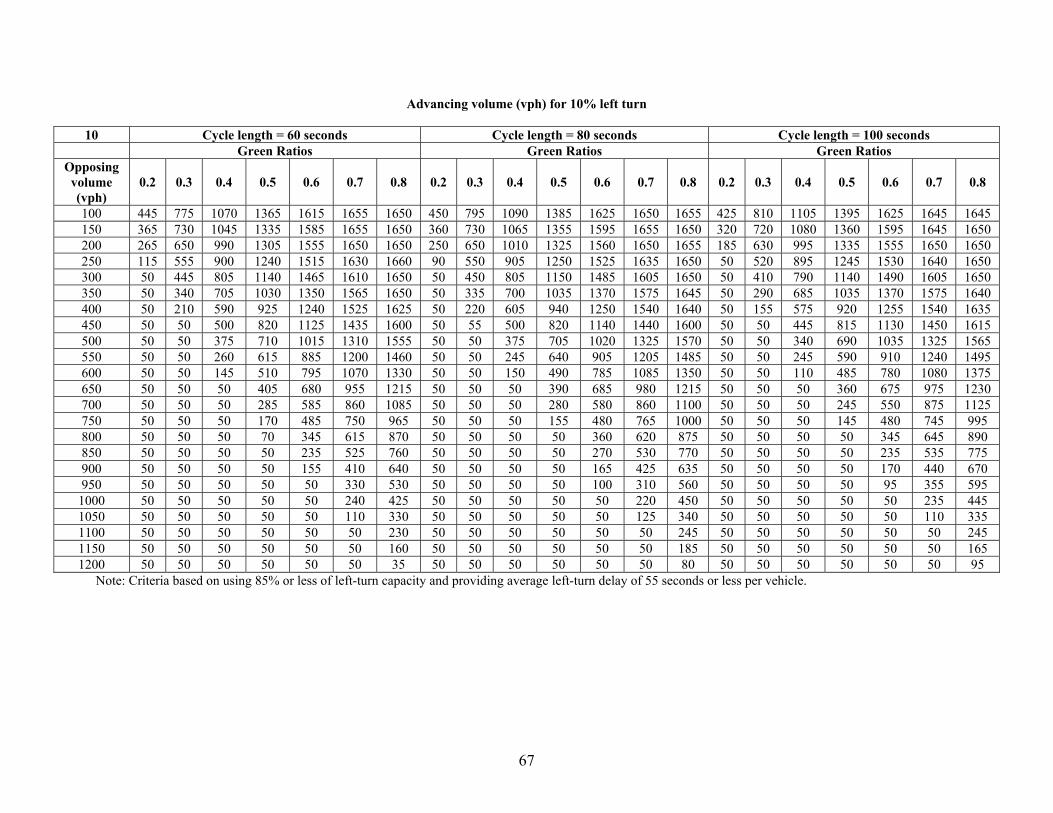
67
Advancing volume (vph) for 10% left turn
10 Cycle length = 60 seconds Cycle length = 80 seconds Cycle length = 100 seconds Green Ratios Green Ratios Green Ratios
Opposing volume (vph)
0.2 0.3 0.4 0.5 0.6 0.7 0.8 0.2 0.3 0.4 0.5 0.6 0.7 0.8 0.2 0.3 0.4 0.5 0.6 0.7 0.8
100 445 775 1070 1365 1615 1655 1650 450 795 1090 1385 1625 1650 1655 425 810 1105 1395 1625 1645 1645 150 365 730 1045 1335 1585 1655 1650 360 730 1065 1355 1595 1655 1650 320 720 1080 1360 1595 1645 1650 200 265 650 990 1305 1555 1650 1650 250 650 1010 1325 1560 1650 1655 185 630 995 1335 1555 1650 1650 250 115 555 900 1240 1515 1630 1660 90 550 905 1250 1525 1635 1650 50 520 895 1245 1530 1640 1650 300 50 445 805 1140 1465 1610 1650 50 450 805 1150 1485 1605 1650 50 410 790 1140 1490 1605 1650 350 50 340 705 1030 1350 1565 1650 50 335 700 1035 1370 1575 1645 50 290 685 1035 1370 1575 1640 400 50 210 590 925 1240 1525 1625 50 220 605 940 1250 1540 1640 50 155 575 920 1255 1540 1635 450 50 50 500 820 1125 1435 1600 50 55 500 820 1140 1440 1600 50 50 445 815 1130 1450 1615 500 50 50 375 710 1015 1310 1555 50 50 375 705 1020 1325 1570 50 50 340 690 1035 1325 1565 550 50 50 260 615 885 1200 1460 50 50 245 640 905 1205 1485 50 50 245 590 910 1240 1495 600 50 50 145 510 795 1070 1330 50 50 150 490 785 1085 1350 50 50 110 485 780 1080 1375 650 50 50 50 405 680 955 1215 50 50 50 390 685 980 1215 50 50 50 360 675 975 1230 700 50 50 50 285 585 860 1085 50 50 50 280 580 860 1100 50 50 50 245 550 875 1125 750 50 50 50 170 485 750 965 50 50 50 155 480 765 1000 50 50 50 145 480 745 995 800 50 50 50 70 345 615 870 50 50 50 50 360 620 875 50 50 50 50 345 645 890 850 50 50 50 50 235 525 760 50 50 50 50 270 530 770 50 50 50 50 235 535 775 900 50 50 50 50 155 410 640 50 50 50 50 165 425 635 50 50 50 50 170 440 670 950 50 50 50 50 50 330 530 50 50 50 50 100 310 560 50 50 50 50 95 355 595 1000 50 50 50 50 50 240 425 50 50 50 50 50 220 450 50 50 50 50 50 235 445 1050 50 50 50 50 50 110 330 50 50 50 50 50 125 340 50 50 50 50 50 110 335 1100 50 50 50 50 50 50 230 50 50 50 50 50 50 245 50 50 50 50 50 50 245 1150 50 50 50 50 50 50 160 50 50 50 50 50 50 185 50 50 50 50 50 50 165 1200 50 50 50 50 50 50 35 50 50 50 50 50 50 80 50 50 50 50 50 50 95
Note: Criteria based on using 85% or less of left-turn capacity and providing average left-turn delay of 55 seconds or less per vehicle.

68
Advancing volume (vph) for 20% left turn
20 Cycle length = 60 seconds Cycle length = 80 seconds Cycle length = 100 seconds Green Ratios Green Ratios Green Ratios
Opposing volume (vph)
0.2 0.3 0.4 0.5 0.6 0.7 0.8 0.2 0.3 0.4 0.5 0.6 0.7 0.8 0.2 0.3 0.4 0.5 0.6 0.7 0.8
100 380 720 1035 1330 1575 1655 1655 385 735 1060 1350 1585 1655 1655 360 725 1070 1360 1590 1645 1655 150 285 625 955 1285 1525 1635 1660 290 630 965 1300 1535 1645 1655 250 615 965 1310 1535 1640 1655 200 180 530 845 1155 1475 1600 1650 175 530 845 1175 1485 1610 1650 130 505 850 1180 1490 1610 1650 250 75 420 735 1035 1340 1545 1645 55 415 735 1050 1355 1560 1640 50 395 725 1050 1360 1560 1645 300 50 330 625 915 1205 1495 1605 50 320 635 930 1220 1505 1615 50 285 615 910 1225 1510 1615 350 50 230 530 800 1080 1355 1545 50 220 525 815 1090 1375 1565 50 185 505 810 1095 1380 1570 400 50 130 435 700 955 1215 1485 50 120 435 705 970 1235 1500 50 90 405 695 975 1245 1510 450 50 50 325 605 845 1090 1350 50 50 345 605 850 1115 1355 50 50 325 605 855 1125 1380 500 50 50 250 515 745 975 1220 50 50 250 520 745 980 1250 50 50 235 505 755 990 1225 550 50 50 170 410 640 860 1080 50 50 165 420 645 880 1100 50 50 150 390 645 890 1125 600 50 50 70 335 565 750 980 50 50 95 330 570 775 980 50 50 50 330 540 770 990 650 50 50 50 245 455 650 875 50 50 50 250 455 675 870 50 50 50 225 460 660 890 700 50 50 50 170 370 570 760 50 50 50 180 400 580 775 50 50 50 140 375 585 770 750 50 50 50 95 290 475 650 50 50 50 95 290 485 680 50 50 50 80 295 485 670 800 50 50 50 50 205 390 585 50 50 50 50 225 420 590 50 50 50 50 215 400 580 850 50 50 50 50 140 315 490 50 50 50 50 155 330 495 50 50 50 50 165 350 510 900 50 50 50 50 80 240 410 50 50 50 50 90 250 410 50 50 50 50 65 250 420 950 50 50 50 50 50 190 335 50 50 50 50 50 180 325 50 50 50 50 50 175 325 1000 50 50 50 50 50 105 255 50 50 50 50 50 150 270 50 50 50 50 50 135 290 1050 50 50 50 50 50 65 200 50 50 50 50 50 65 200 50 50 50 50 50 70 210 1100 50 50 50 50 50 50 140 50 50 50 50 50 50 145 50 50 50 50 50 50 145 1150 50 50 50 50 50 50 65 50 50 50 50 50 50 95 50 50 50 50 50 50 90 1200 50 50 50 50 50 50 50 50 50 50 50 50 50 50 50 50 50 50 50 50 50
Note: Criteria based on using 85% or less of left-turn capacity and providing average left-turn delay of 55 seconds or less per vehicle.

69
Advancing volume (vph) for 30% left turn
30 Cycle length = 60 seconds Cycle length = 80 seconds Cycle length = 100 seconds Green Ratios Green Ratios Green Ratios
Opposing volume (vph)
0.2 0.3 0.4 0.5 0.6 0.7 0.8 0.2 0.3 0.4 0.5 0.6 0.7 0.8 0.2 0.3 0.4 0.5 0.6 0.7 0.8
100 335 675 1010 1305 1555 1645 1655 340 685 1025 1325 1560 1645 1655 310 675 1025 1335 1560 1645 1650 150 240 560 880 1195 1495 1610 1655 240 575 885 1210 1495 1620 1655 205 550 885 1215 1505 1625 1650 200 140 455 750 1050 1360 1550 1640 135 455 765 1060 1375 1565 1645 95 435 750 1070 1380 1565 1650 250 50 350 640 915 1205 1485 1595 50 355 645 930 1220 1500 1610 50 330 635 930 1220 1510 1610 300 50 255 535 805 1060 1325 1540 50 265 535 805 1080 1345 1545 50 230 520 800 1085 1355 1560 350 50 180 445 685 935 1175 1430 50 175 440 695 940 1200 1450 50 150 420 700 950 1215 1475 400 50 90 350 580 840 1050 1290 50 110 365 585 825 1085 1305 50 50 325 580 820 1085 1320 450 50 50 265 480 705 920 1160 50 50 265 510 720 945 1175 50 50 235 480 715 950 1170 500 50 50 210 425 615 810 1015 50 50 185 410 625 820 1040 50 50 175 410 615 840 1050 550 50 50 120 330 515 700 900 50 50 120 335 530 715 910 50 50 105 325 525 725 930 600 50 50 60 245 430 625 795 50 50 55 250 440 630 805 50 50 50 235 440 625 800 650 50 50 50 180 360 525 695 50 50 50 180 365 535 715 50 50 50 170 355 540 710 700 50 50 50 120 285 440 600 50 50 50 115 285 465 610 50 50 50 125 295 445 630 750 50 50 50 60 230 380 510 50 50 50 55 230 380 535 50 50 50 50 235 400 530 800 50 50 50 50 160 290 445 50 50 50 50 155 315 455 50 50 50 50 165 310 455 850 50 50 50 50 110 245 365 50 50 50 50 110 260 395 50 50 50 50 105 240 375 900 50 50 50 50 55 195 305 50 50 50 50 50 195 330 50 50 50 50 65 180 310 950 50 50 50 50 50 130 250 50 50 50 50 50 145 255 50 50 50 50 50 140 250 1000 50 50 50 50 50 70 195 50 50 50 50 50 80 185 50 50 50 50 50 95 205 1050 50 50 50 50 50 50 135 50 50 50 50 50 50 160 50 50 50 50 50 50 160 1100 50 50 50 50 50 50 75 50 50 50 50 50 50 110 50 50 50 50 50 50 105 1150 50 50 50 50 50 50 65 50 50 50 50 50 50 55 50 50 50 50 50 50 55 1200 50 50 50 50 50 50 50 50 50 50 50 50 50 50 50 50 50 50 50 50 50
Note: Criteria based on using 85% or less of left-turn capacity and providing average left-turn delay of 55 seconds or less per vehicle.