
Final Report Biomass
67
DESIGN OF A BIOMASS POWER PLANT (L-R) Ankush, Amit, Siddhant, Neel, Raghav, Gowtham Sponsor Name: Dr. Steven Trimble 8 th May, 2014
-
Upload
neel-patel -
Category
Documents
-
view
63 -
download
0
Transcript of Final Report Biomass

DESIGN OF A BIOMASS POWER PLANT
(L-R) Ankush, Amit, Siddhant, Neel, Raghav, Gowtham
Sponsor Name: Dr. Steven Trimble
8th
May, 2014
2
Team Member Page
Each of the members of this group has contributed to and reviewed this final project, and agrees with its
contents.
Signed,
Amit Mehta
Ankush Kumar
Gowtham Ranganathan
Neel Patel
Raghav Kushagra
Siddhant Datta

3
Executive Summary:
The following report is a documentation of the steps and processes followed in completing the graduate
project for Ira A. Fulton School of Engineering, Mechanical Engineering graduate program. The details are
presented to meet the Accreditation Board for Engineering and Technology criteria that demonstrate the ability
of the team to function as successful engineers in a professional environment.
The team worked for preliminary design of a Biomass Power Plant with a capacity of 3MW electrical
power. Fuel in the form of woodchips is burnt in the combustor where the chemical energy is converted into
heat energy. By utilizing this energy high pressure steam is generated and directed to drive the turbine, which
in turn transfers the power to drive the electric generator through a common shaft. The most important project
requirement is to achieve minimum cost of electricity with maximum possible plant efficiency. The federal
rules related to emission and environmental aspects were also taken into consideration.
The detailed preliminary design is presented in section 6 of this report. The electric power output was found
to be 3MW. The cost of electricity was .22 cents/KWh. The plant efficiency was 24 percent. After carrying out
the entire design process the team recommends that in order to make a viable biomass power plant the sponsor
should consider building a higher capacity plant of around 25MW as the component cost would increase only
marginally but the cost of electricity would come down drastically.
The final design is simply a proof that the expected outcome can be achieved. For the purposes of the
project, the capacity of power required to be produced was achieved. However, with further development, we
can achieve a lower cost of electricity than a coal fired power plant. Within the allotted time, the team
accomplished all of the set requirements which were required for the successful design of the Biomass plant
Final Conceptual Design

4
Table of Contents Page No.
ABET Criteria/ Final Report cross reference table 8
1. Introduction 9
1.1 Design Need 9
1.2 Problem Statement 10
1.3 Physics Involved 11
1.4 Project Scope and Limitations 11
1.5 Societal Impact 12
1.6 Applicable Contemporary Engineering Issues 12
1.7 ABET Accreditation and the Assessment Fair 12
1.8 Report Organization 12
1.9 Project Notebook 13
2. Final Design Description 13
2.1 Design Description Overview 13
2.2 Method of Operation 14
2.3 Key Features and Benefits 15
2.4 Cost Results 15
2.5 Requirements/Validation Matrix 16
3. Design Process and Project Planning 17
3.1 Integrated Product Design and Support (IPDS) Process 17
3.2 Project Plan 18
3.2.1 Overview 18
3.2.2 Pre-Concept Design 19
3.2.3 Strategies to Address Key Issues 21
3.2.4 Technical Approach 22
3.2.5 Project Management Approach 23

5
3.2.6 Risk Management Plan 24
3.2.7 Work Breakdown Structure and WBS Dictionary 25
3.2.8 Project Schedules 29
4. Requirements and Constraints 30
4.1 Needs to Requirements 30
4.2 Applicable Standards and Regulations 31
4.3 Validation Methods 32
4.4 Requirements/Validation Matrix 33
5. Conceptual Design 34
5.1 Functional Block Diagram 34
5.2 Research of Prior Art 35
5.3 Conceptual Design Options 38
5.4 Method of Selecting Final Conceptual Design 39
5.5 Final Selection Comparisons and Rationale 42
5.6 Analyses 43
5.7 Prototype Final Conceptual Design 44
6. Preliminary Design 45
6.1 Configuration Block Diagram 45
6.2 Analysis Plan and Results 46
6.3 Failure Modes and Effects Analysis 54
6.4 System Optimization 56
6.5 Trade Studies 59
7. Project Performance 61
8. Project Conclusions 64
9. Recommendations 65
10. Appendices 66
6
List of Figures:
Figure1.1: Boise Cascade LLC- Biomass Plant
Figure1.2: Schematic of a working Biomass plant
Figure 1.3: Basic Physics block diagram
Figure 2.1: Final Preliminary Sketch of Biomass Power Plant
Figure 2.2: Process Flow Diagram
Figure 2.3: Graph of Plant Efficiency vs Plant Cost
Figure 3.1: Integrated Product Development and Support Process
Figure 3.2 Project Plan flow for Biomass Power Plant
Figure 3.3 Schematic of Biomass Direct Combustion System
Figure 3.4: Gantt chart
Figure 5.1: Functional Block Diagram of Biomass power Plant
Figure 5.2: Livestock waste storage facility
Figure 5.3: Woodchips storage facility
Figure 5.4: Bubbling fluidized bed combustion boiler
Figure 5.5: The direct combustion method
Figure 5.6: Co- Firing methods
Figure 5.7: Simple Rankine Cycle
Figure 5.8: Rankine cycle with reheat
Figure 5.9: Rankine cycle with Regeneration
Figure 7.1 Gantt chart showing team progress
Figure 7.2 Labor Chart Biomass Power Plant

7
List of Tables:
Table 2.1 Cost and Technical Data
Table 2.2: Features and Benefits
Table 2.3: Performance Results
Table 2.4: Cost Chart
Table 2.5: Requirement Validation Matrix
Table 3.1: Engineering Requirements
Table 3.2: SWOT Analysis table
Table 3.3 Biomass Power Generation Modes
Table 3.4: Possible Risks and its Solution
Table 3.5: Work Breakdown Structure
Table 3.6: Task allocation table
Table 3.6: Task allocation table (cont.)
Table 4.1 House of Quality
Table 4.2 Requirement Matrix
Table 5.1: Criteria for fuel selection
Table 5.2: Criteria for Combustor selection
Table 5.3: Decision Matrix for fuel
Table 5.4: Decision Matrix for Combustion Method
Table 5.5: Decision Matrix for Rankine Cycle
Table 7.1 Labor Chart for Biomass Power Plant
Table 10.1: Emission Standards
Table 10.2: Probability of Failure (Reference)
Table 10.3: Severity of Failure
8
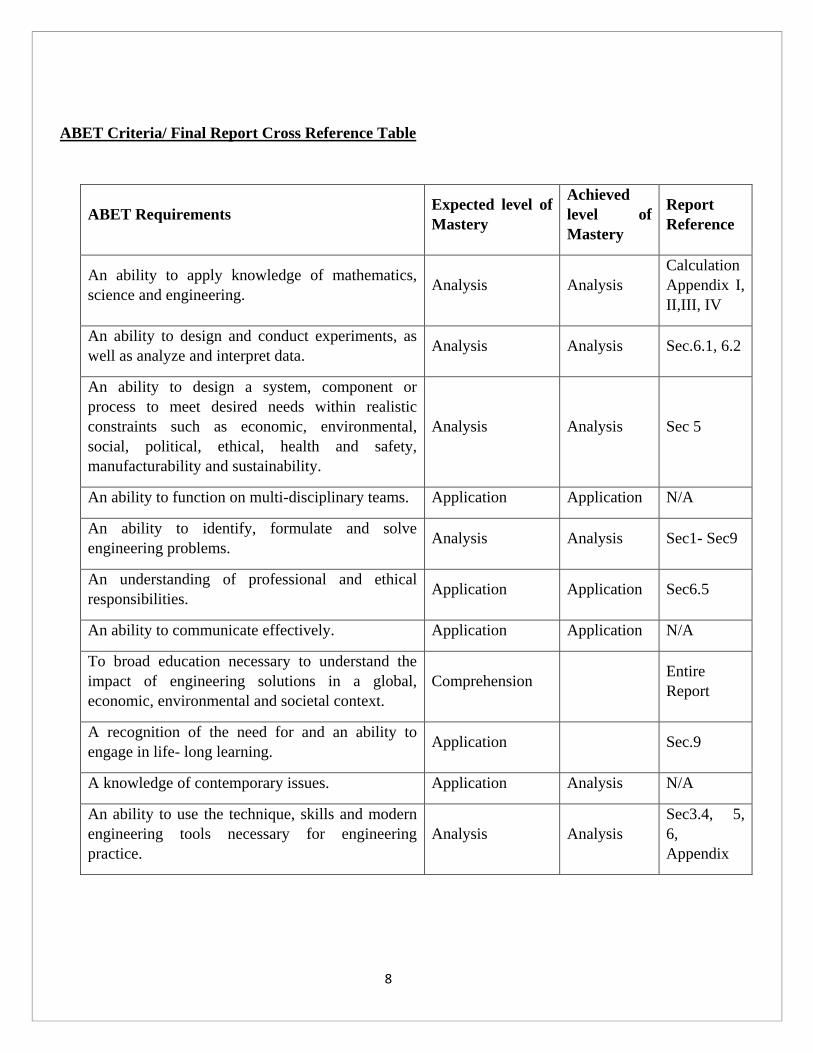
ABET Criteria/ Final Report Cross Reference Table
ABET Requirements Expected level of
Mastery
Achieved
level of
Mastery
Report
Reference
An ability to apply knowledge of mathematics,
science and engineering. Analysis Analysis
Calculation
Appendix I,
II,III, IV
An ability to design and conduct experiments, as
well as analyze and interpret data. Analysis Analysis Sec.6.1, 6.2
An ability to design a system, component or
process to meet desired needs within realistic
constraints such as economic, environmental,
social, political, ethical, health and safety,
manufacturability and sustainability.
Analysis Analysis Sec 5
An ability to function on multi-disciplinary teams. Application Application N/A
An ability to identify, formulate and solve
engineering problems. Analysis Analysis Sec1- Sec9
An understanding of professional and ethical
responsibilities. Application Application Sec6.5
An ability to communicate effectively. Application Application N/A
To broad education necessary to understand the
impact of engineering solutions in a global,
economic, environmental and societal context.
Comprehension Entire
Report
A recognition of the need for and an ability to
engage in life- long learning. Application Sec.9
A knowledge of contemporary issues. Application Analysis N/A
An ability to use the technique, skills and modern
engineering tools necessary for engineering
practice.
Analysis Analysis
Sec3.4, 5,
6,
Appendix

9
1. Introduction
This project report is for the MAE 598 “Energy Systems Engineering” class conducted at Arizona State
University during the time period 01/10/2014 to 05/02/2014. The report addresses the need for a Biomass plant
of 3MWe capacity with minimum cost of electricity.
The deliverables of the project are:
(1) Final Project Report
(2) Final Presentation
(3) Project Notebook.
The sponsor for this project is Dr. Steven Trimble, the instructor for the course. The project team
consists of the following members: Ankush Kumar, Neel Patel, Raghav Kushagra, Amit Mehta, Gowtham
Ranganathan and Siddhant Datta.
This section of the report introduces the project by describing the design need, the resulting project
problem statement, the societal impact, the projects role in ABET accreditation, the organization of the report
and the use of the project notebook.
1.1 Design Need
The design need was a 3MWe capacity Biomass Power Plant with minimum cost of electricity. This
would not only result in increased profit for the customer but the employment and economic growth of the area
would also increase significantly.
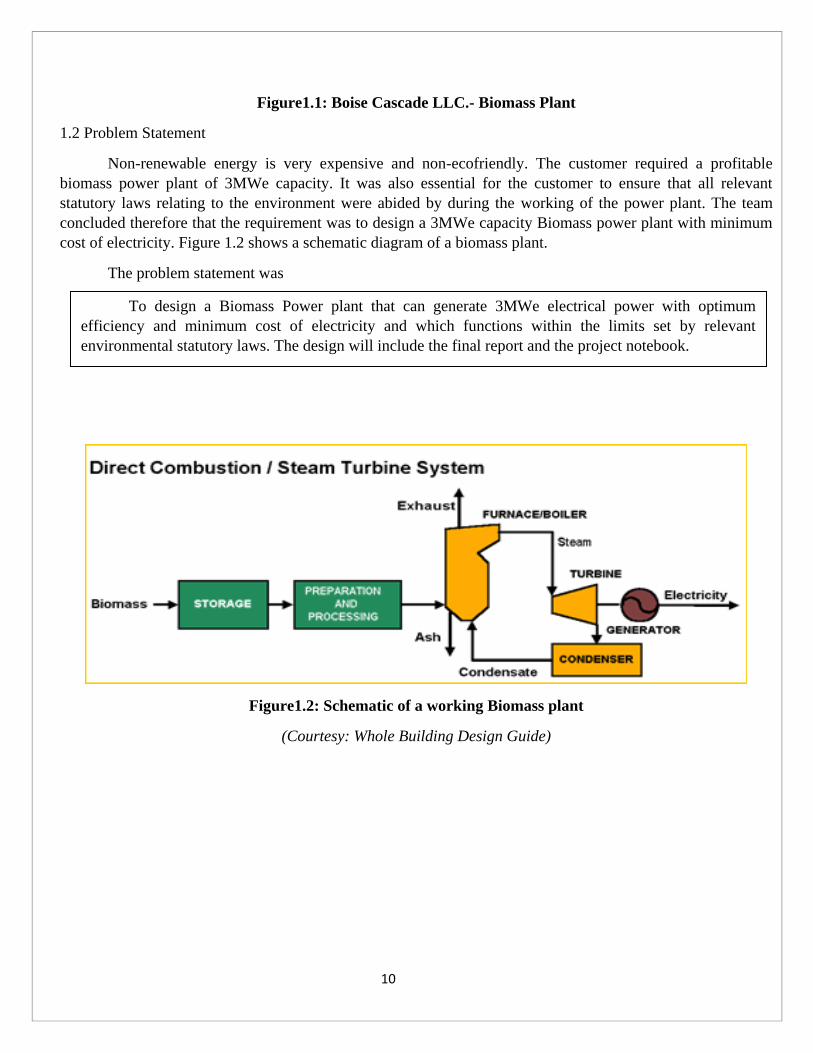
The following figure is an example of 11MW electrical power plant at Medford Oregon.
10
Figure1.1: Boise Cascade LLC.- Biomass Plant
1.2 Problem Statement
Non-renewable energy is very expensive and non-ecofriendly. The customer required a profitable
biomass power plant of 3MWe capacity. It was also essential for the customer to ensure that all relevant
statutory laws relating to the environment were abided by during the working of the power plant. The team
concluded therefore that the requirement was to design a 3MWe capacity Biomass power plant with minimum
cost of electricity. Figure 1.2 shows a schematic diagram of a biomass plant.
The problem statement was
Figure1.2: Schematic of a working Biomass plant
(Courtesy: Whole Building Design Guide)
To design a Biomass Power plant that can generate 3MWe electrical power with optimum
efficiency and minimum cost of electricity and which functions within the limits set by relevant
environmental statutory laws. The design will include the final report and the project notebook.
11
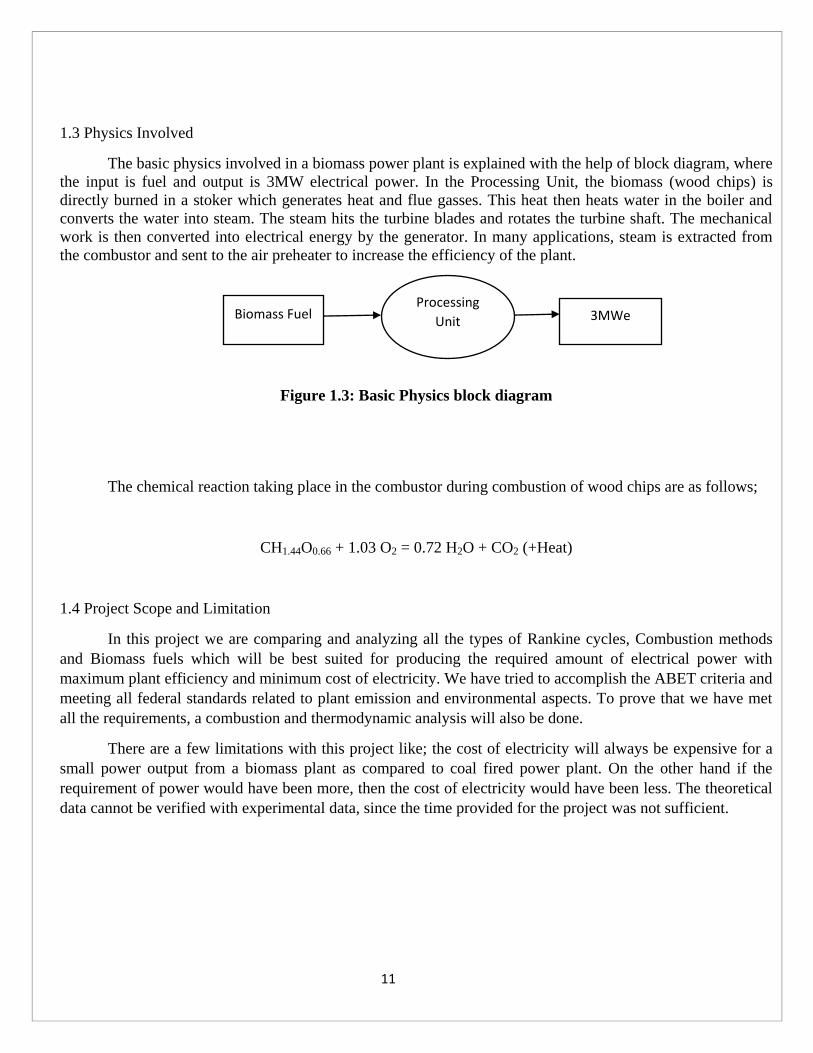
1.3 Physics Involved
The basic physics involved in a biomass power plant is explained with the help of block diagram, where
the input is fuel and output is 3MW electrical power. In the Processing Unit, the biomass (wood chips) is
directly burned in a stoker which generates heat and flue gasses. This heat then heats water in the boiler and
converts the water into steam. The steam hits the turbine blades and rotates the turbine shaft. The mechanical
work is then converted into electrical energy by the generator. In many applications, steam is extracted from
the combustor and sent to the air preheater to increase the efficiency of the plant.
Figure 1.3: Basic Physics block diagram
The chemical reaction taking place in the combustor during combustion of wood chips are as follows;
CH1.44O0.66 + 1.03 O2 = 0.72 H2O + CO2 (+Heat)
1.4 Project Scope and Limitation
In this project we are comparing and analyzing all the types of Rankine cycles, Combustion methods
and Biomass fuels which will be best suited for producing the required amount of electrical power with
maximum plant efficiency and minimum cost of electricity. We have tried to accomplish the ABET criteria and
meeting all federal standards related to plant emission and environmental aspects. To prove that we have met
all the requirements, a combustion and thermodynamic analysis will also be done.
There are a few limitations with this project like; the cost of electricity will always be expensive for a
small power output from a biomass plant as compared to coal fired power plant. On the other hand if the
requirement of power would have been more, then the cost of electricity would have been less. The theoretical
data cannot be verified with experimental data, since the time provided for the project was not sufficient.
Processing
Unit Biomass Fuel 3MWe

12
1.5 Social Impact
One of the major challenges facing engineering is developing clean, sustainable source of energy. This
Biomass plant will set an example of generating electricity through renewable sources like wood chips. Since
we know that our planet is very fragile and greenhouse gasses are rising it is our duty to switch from non-
renewable sources to renewable sources.
Biomass plant can create local business, job opportunities and support the rural economy. Many
biomass fuels generate low levels of such atmospheric pollutants as sulphur dioxide and CO2. Modern biomass
combustion systems are highly sophisticated, offering combustion efficiency and emission levels comparable
with the best fossil fuel boilers. The customers will have a healthy environment to stay in.
1.6 Applicable Contemporary Engineering Issues
The Biomass plant has to face many contemporary engineering issues, and they are as follows;
(1). There are a wide number of choices in selecting biomass materials and each present unique utilization
challenges. Heating value, percent volatiles, total ash and moisture content, ash constituents, and particle size
of the fuel are key parameters to consider in designing the plant. The ability to match the biomass fuel
attributes with the unique boiler requirements is a key consideration.
(2). One of the limitations of biomass products such as wood chips is the relatively low, volumetric heating
value or energy density compared to coal or other fuels, requiring a significantly higher volume to be handled
and stored.
(3).Biomass fuels with moisture levels between 20% and 40% create concerns for degradation and spontaneous
combustion.
(4).The fuel cost, location, fuel handling, reliability and dependability, partnerships, and subsidies need to be
addressed for biomass fuels to become a cost-effective, main stream alternative.
1.7 ABET Accreditation and Assessment Fair
The graduate project also serves as a method of evaluating the mechanical engineering program at
Arizona State University. The ABET Criteria/ Final Report Cross Reference Table is provided to help ABET
project assessors find objective evidence in the final report for meeting each of the ABET criteria.
1.8 Report Organization
The report is divided into 9 sections. Section 1 discusses the societal need, the project problem
statement and the project scope. Section 2 presents the solution to the problem statement, i.e., the final
design description in the form of a matrix. The next few sections describe the design/development
process, i.e., Design Process and Project Plan, Requirements, Conceptual Design and Preliminary
Design. Section 7 discusses the team‟s project effectiveness. Section 8 covers the project conclusions
and Section 9 provides go-forward recommendations. Following Section 9 are the Appendices.

13
1.9 Project Notebook
The team organizes all its work into a Team Project Notebook that is used throughout the
project to document the work. The notebook contains detailed descriptions of all trade studies,
analyses, tests, and team decisions. The final report is written as a comprehensive, stand-alone
document. However, it refers to the notebook as needed to direct the reader to more detailed
information regarding the design.
2. Final Design Description
This section describes the final design that meets the customer needs. The remaining part of this report
explains the design process that resulted in this final preliminary design.
2.1 Design Description Overview
The Figure 2.1 shows the final preliminary design & components of the biomass power plant
developing power of 3MW. Steam enters in the turbine at 800 Psi pressure and 840 F. To achieve these
conditions biomass fuel (Wood chips with 20% MC) are burnt in combustor and develop gases at 1800 F. The
hot flue gases are passed through boiler to generate steam.
To remove the moisture content wood chips are processed in drier before sending to combustor. As
shown in the figure flue gases at 350 F from combustor are allowed to go through drier before going to stack
and then to atmosphere. Overall efficiency of the plant is 27.89%.
14
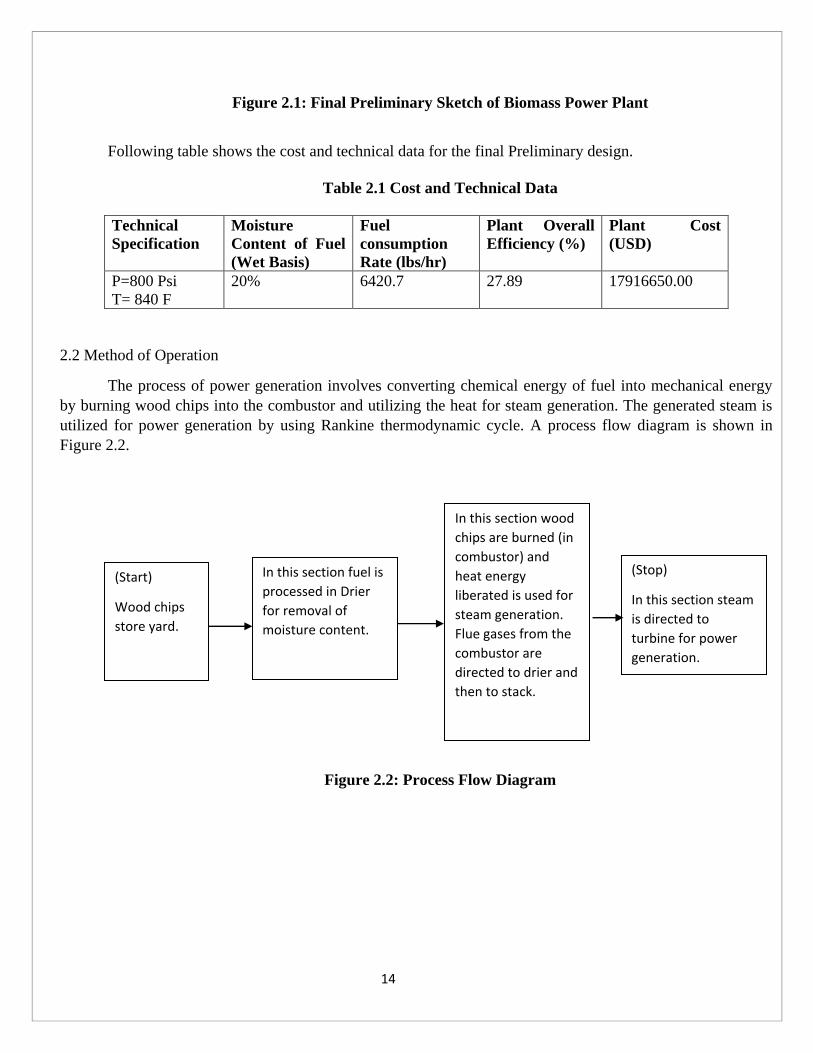
Figure 2.1: Final Preliminary Sketch of Biomass Power Plant
Following table shows the cost and technical data for the final Preliminary design.
Table 2.1 Cost and Technical Data
Technical
Specification
Moisture
Content of Fuel
(Wet Basis)
Fuel
consumption
Rate (lbs/hr)
Plant Overall
Efficiency (%)
Plant Cost
(USD)
P=800 Psi
T= 840 F
20% 6420.7 27.89 17916650.00
2.2 Method of Operation
The process of power generation involves converting chemical energy of fuel into mechanical energy
by burning wood chips into the combustor and utilizing the heat for steam generation. The generated steam is
utilized for power generation by using Rankine thermodynamic cycle. A process flow diagram is shown in
Figure 2.2.
Figure 2.2: Process Flow Diagram
(Start)
Wood chips
store yard.
In this section fuel is
processed in Drier
for removal of
moisture content.
In this section wood
chips are burned (in
combustor) and
heat energy
liberated is used for
steam generation.
Flue gases from the
combustor are
directed to drier and
then to stack.
(Stop)
In this section steam
is directed to
turbine for power
generation.
15
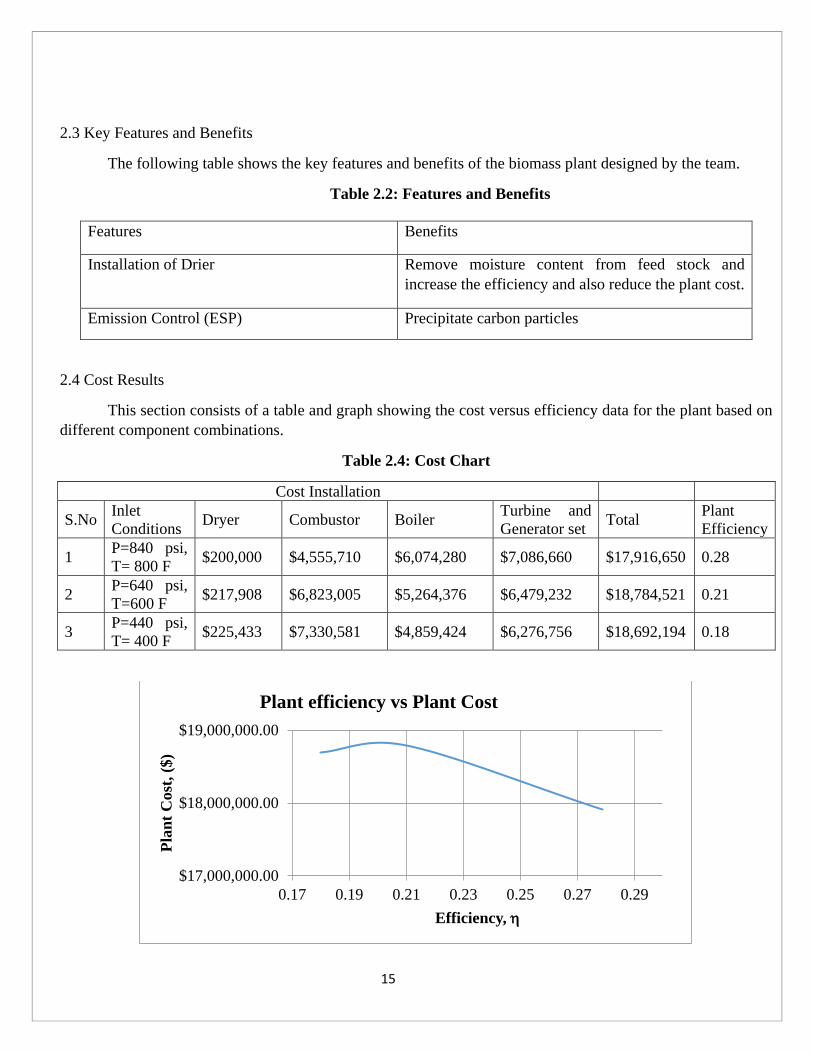
2.3 Key Features and Benefits
The following table shows the key features and benefits of the biomass plant designed by the team.
Table 2.2: Features and Benefits
Features Benefits
Installation of Drier Remove moisture content from feed stock and
increase the efficiency and also reduce the plant cost.
Emission Control (ESP) Precipitate carbon particles
2.4 Cost Results
This section consists of a table and graph showing the cost versus efficiency data for the plant based on
different component combinations.
Table 2.4: Cost Chart
Cost Installation
S.No Inlet
Conditions Dryer Combustor Boiler
Turbine and
Generator set Total
Plant
Efficiency
1 P=840 psi,
T= 800 F $200,000 $4,555,710 $6,074,280 $7,086,660 $17,916,650 0.28
2 P=640 psi,
T=600 F $217,908 $6,823,005 $5,264,376 $6,479,232 $18,784,521 0.21
3 P=440 psi,
T= 400 F $225,433 $7,330,581 $4,859,424 $6,276,756 $18,692,194 0.18
$17,000,000.00
$18,000,000.00
$19,000,000.00
0.17 0.19 0.21 0.23 0.25 0.27 0.29
Pla
nt
Cost
, ($
)
Efficiency,
Plant efficiency vs Plant Cost
16
Figure 2.4: Graph of Plant Efficiency vs Plant Cost
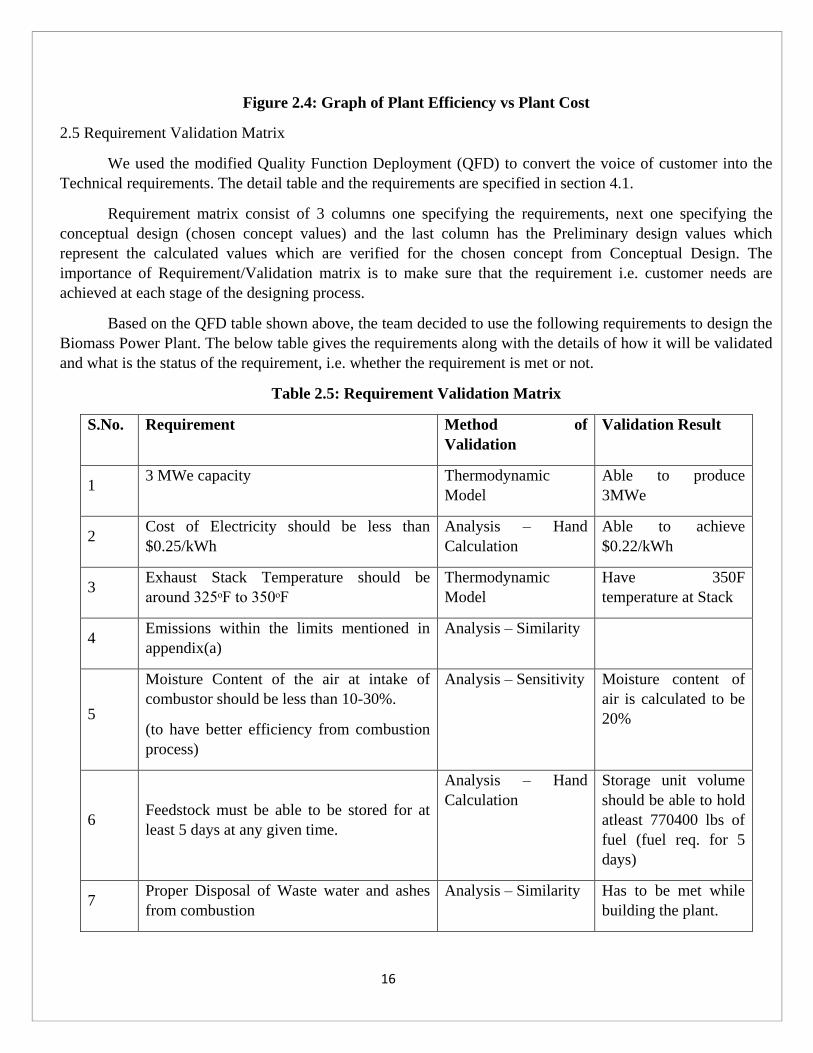
2.5 Requirement Validation Matrix
We used the modified Quality Function Deployment (QFD) to convert the voice of customer into the
Technical requirements. The detail table and the requirements are specified in section 4.1.
Requirement matrix consist of 3 columns one specifying the requirements, next one specifying the
conceptual design (chosen concept values) and the last column has the Preliminary design values which
represent the calculated values which are verified for the chosen concept from Conceptual Design. The
importance of Requirement/Validation matrix is to make sure that the requirement i.e. customer needs are
achieved at each stage of the designing process.
Based on the QFD table shown above, the team decided to use the following requirements to design the
Biomass Power Plant. The below table gives the requirements along with the details of how it will be validated
and what is the status of the requirement, i.e. whether the requirement is met or not.
Table 2.5: Requirement Validation Matrix
S.No. Requirement Method of
Validation
Validation Result
1 3 MWe capacity Thermodynamic
Model
Able to produce
3MWe
2 Cost of Electricity should be less than
$0.25/kWh
Analysis – Hand
Calculation
Able to achieve
$0.22/kWh
3 Exhaust Stack Temperature should be
around 325ᵒF to 350ᵒF
Thermodynamic
Model
Have 350F
temperature at Stack
4 Emissions within the limits mentioned in
appendix(a)
Analysis – Similarity
5
Moisture Content of the air at intake of
combustor should be less than 10-30%.
(to have better efficiency from combustion
process)
Analysis – Sensitivity Moisture content of
air is calculated to be
20%
6 Feedstock must be able to be stored for at
least 5 days at any given time.
Analysis – Hand
Calculation
Storage unit volume
should be able to hold
atleast 770400 lbs of
fuel (fuel req. for 5
days)
7 Proper Disposal of Waste water and ashes
from combustion
Analysis – Similarity Has to be met while
building the plant.

17
3. Design Process and Project Planning
The team followed the Integrated Product Development and Support (IPDS) design process to design the 3
MWe Biomass Power Plant. The project is planned to optimize by using the sensitivity study of various
variables with respect to Cost of Electricity (COE) and uses it to fix the appropriate values of each variable to
optimize the COE. The Section 7 includes the detail presentation of the team‟s actual project conduct in terms
of schedules and budgets.
3.1. IPDS Design Process
The IPDS Design Process has 6 phases by which the customer needs are converted into deliverable
products with support and improvement. The process flow of IPDS is shown below.
Figure 3.1: Integrated Product Development and Support Process
The six phases of IPDS process is explained briefly below.
1. It starts with collecting customer needs from the customers, based on the customer needs the
team develops a Pre-Concept design to get the proposal approved from the management.
2. Once the project is approved the team begins with developing various Concept to meet the
requirements of the customer needs.
3. From which one best concept is selected and carried forward to the Preliminary Design where
the components are selected for the Design.
4. In the next step the team does Detailed Designing to fix the component dimensions to match the
selected design parameters.
5. After which the prototype is developed to do testing and quality check.
18
6. In next step, the product is delivered and the team works continuously to provide support and
improvement till the committed period or the life of product.
For this Class Project, our team goes only through Preliminary Design i.e. till third phase of IPDS
process.
3.2 Project Plan
This section explains how the team has planned to do the Biomass Power Plant Project.
3.2.1 Overview
The team was formed based upon the interest of the individual to work for the given problem
statement by the Professor. In the end there were 6 individuals who were interested to work for Biomass
Power Plant. After which the each individual committed to work for Biomass Project with single motive
which is best for the team at each and every stage of the progress.
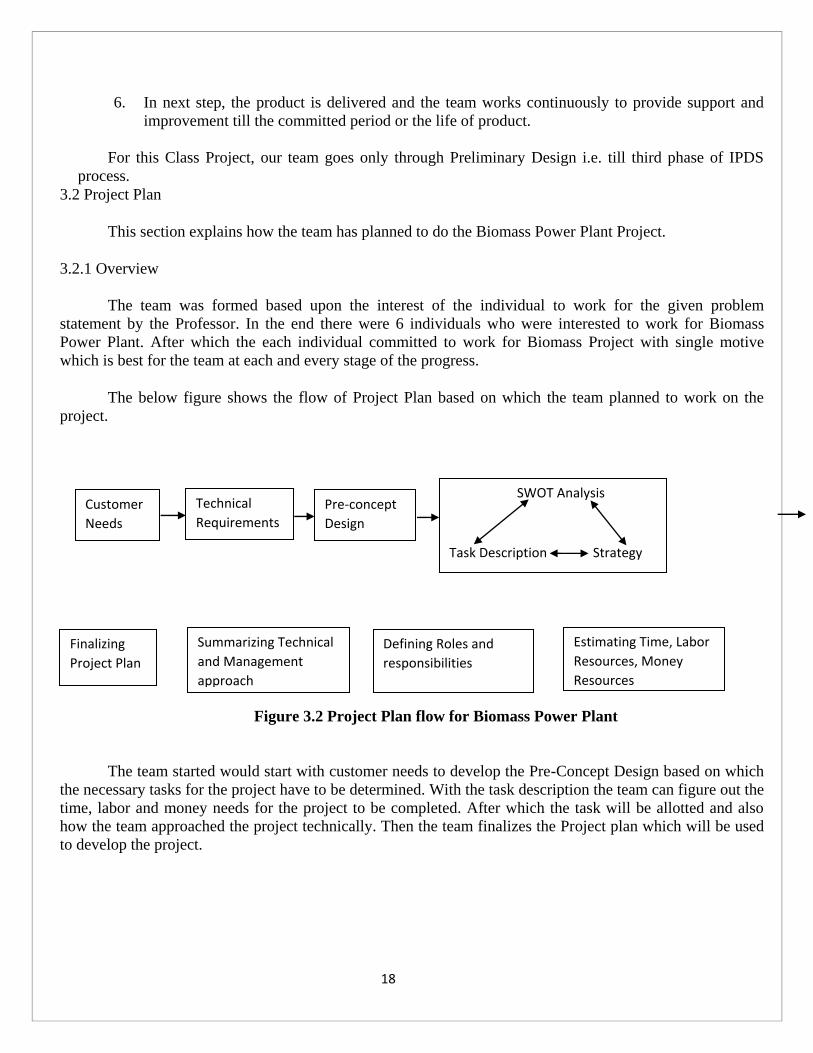
The below figure shows the flow of Project Plan based on which the team planned to work on the
project.
Figure 3.2 Project Plan flow for Biomass Power Plant
The team started would start with customer needs to develop the Pre-Concept Design based on which
the necessary tasks for the project have to be determined. With the task description the team can figure out the
time, labor and money needs for the project to be completed. After which the task will be allotted and also
how the team approached the project technically. Then the team finalizes the Project plan which will be used
to develop the project.
SWOT Analysis
Task Description Strategy
Customer
Needs
Technical
Requirements Pre-concept
Design
Estimating Time, Labor
Resources, Money
Resources
Defining Roles and
responsibilities
Summarizing Technical
and Management
approach
Finalizing
Project Plan

19
3.2.2 Pre-Concept Design
The Team began to prepare the Pre-Concept design with a set of Technical Requirements which are
derived from the problem statement obtained from the customers based upon their needs. The list of 3 basic
engineering requirements used to develop pre-concept design is given in the below table.
Table 3.1: Engineering Requirements
3MWe Electricity using Bio-waste
Emission meeting state and federal laws
Cost of electricity lesser than $0.25/kWh
Based on the pre-requirements shown above the team developed Biomass power plant with realistic
but non-optimized pre-concept design. The pre-concept design developed by the team is shown in the below
figure.
Figure 3.3 Schematic of Biomass Direct Combustion System

20
The biomass is feed into the boiler which generates steam which is then used to run the turbine
connected to the generator to produce electricity. The exhaust gas from boiler is feed to the stack via Heat
Exchanger. The steam from turbine is condensed and pump to heat exchanger to get preheated in it by the
exhaust gas and if feed to the boiler.
The pre-concept design explained above will be discarded when the conceptual design is started. That
is, the team will create a new and more complete set of requirements and a structured conceptual process will
be followed to make sure the entire design space is explored.

21
3.2.3 Strategies to Address key success
In order to tackle any issues the team will face during the project phases a SWOT analysis is
developed in which the list of strength, weakness, opportunities and threat which the team will have during
the project phase is listed below in the table.
Table 3.2: SWOT Analysis table
S.No. Item Description S.No. Item Description
Strength Weakness
1 MATLAB
Programming skills is a
big advantage. Use
computer to perform big
calculations in a short
time.
1 New to the
field
The Project execution
and planning may be
delayed. Less experience
may lead to wrong
decisions.
2 CATIA V5 CAD modelling of the
power plant. 2 Documentation
Preparing prefect
documentation is difficult
3
Conceptual
Design
Experience
Better understanding of
Conceptual design and
Concept generation
techniques
3 Time
management
Poor time management
may lead to heavy
workloads towards the
end of the project.
4 Project
Experience
Aide in the organization
of the project
5 Thermal
Analysis
Required to calculate the
properties of steam as
well as aide in the
thermal analysis of the
plant.
Opportunities Threat
1 Biomass
plant visit
A visit to an established
plant can give the
invaluable experience.
1 Failure to meet
plan
Schedules should be
followed, but due to
unavoidable and
sometimes lethargic the
plans might not be met.
2
Relations
with
suppliers
With the help of
Professor who has many
industrial contacts the
suppliers are reachable
and maintaining a good
relationship is important
to obtain details.
2 Limited
resources
Allocation must be
optimized; otherwise the
overall result may be
affected.
3
Industrial
Project
Experience
Team members
experience in the field
will help in the project
building.
3 Unforeseen
Circumstances
Extraordinary
circumstances may lead
to a delay in the schedule
tasks completion
22
3.2.4 Technical Approach
To design and develop a Biomass plant, various factors need to be answered and considered. A
suitable approach is displayed as follows;
1. Provide a detailed scope of work for the plant:
1.1 Feasibility studies- Includes determination of various components in the plant.
1.2 Identifying issues- Project proposal will only succeed or fail on the public perception of
its environmental effects.
1.3 Site selection- A systematic approach is needed to ensure that the chosen site meets
the environmental, civil and engineering requirements.
1.4 Planning applications & Enquires- This includes applications of permission from the
government and the county for a bunch of laws.
1.5 Project design and summary.
1.6 Conceptual design.
1.7 Plant design.
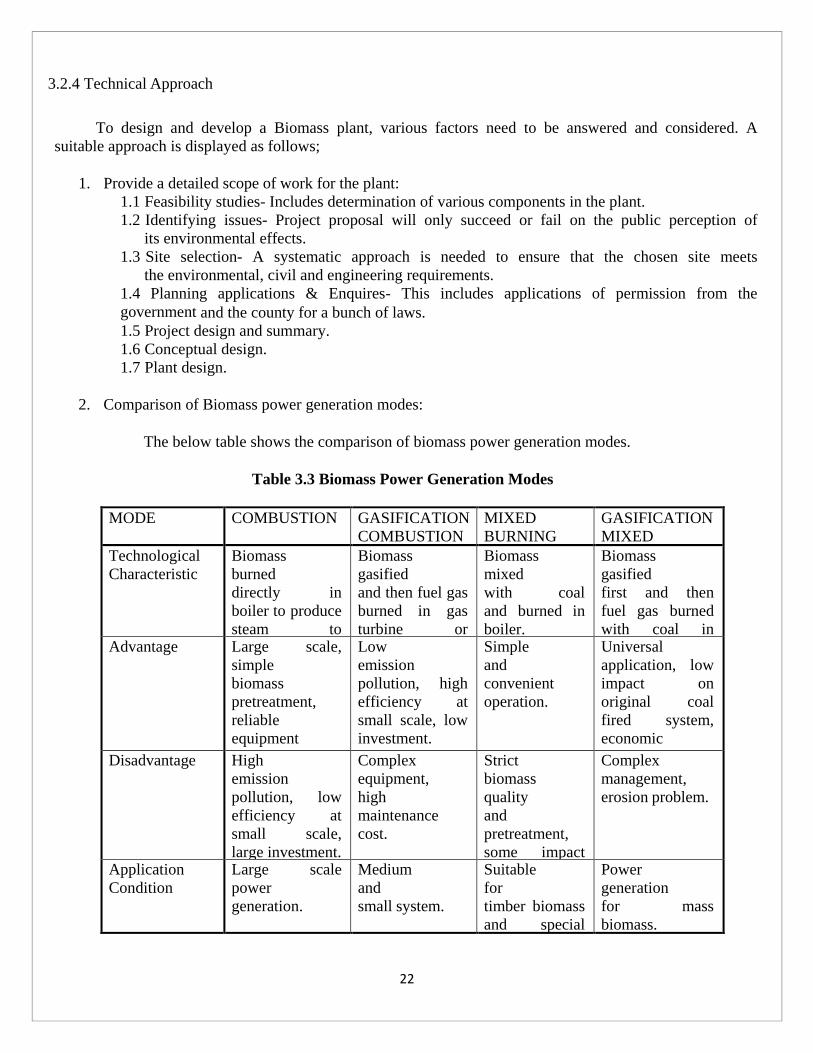
2. Comparison of Biomass power generation modes:
The below table shows the comparison of biomass power generation modes.
Table 3.3 Biomass Power Generation Modes
MODE COMBUSTION GASIFICATION COMBUSTION
MIXED
BURNING
GASIFICATION MIXED
BURNING Technological Characteristic
Biomass
burned directly in
boiler to produce
steam to
generate
electricity.
Biomass
gasified and then fuel gas
burned in gas
turbine or
engine.
Biomass
mixed with coal
and burned in
boiler.
Biomass
gasified first and then
fuel gas burned
with coal in
boiler. Advantage Large scale,
simple biomass
pretreatment,
reliable
equipment
and low running
cost.
Low
emission pollution, high
efficiency at
small scale, low
investment.
Simple
and convenient
operation.
Universal application, low
impact on
original coal
fired system,
economic
benefit. Disadvantage High
emission pollution, low
efficiency at
small scale,
large investment.
Complex equipment,
high
maintenance
cost.
Strict
biomass quality
and
pretreatment,
some impact
on original
system.
Complex management,
erosion problem.
Application Condition
Large scale
power generation.
Medium
and small system.
Suitable
for timber biomass
and special
boiler.
Power
generation for mass
biomass.
23
3. Process flow chart.
4. Utility requirements like Natural Gas Fuel Supply, Water Supply, Waste Water Treatment/
Disposal, Solid Disposal.
5. Environmental aspects related to air and solid emission, dust, noise, storm water, fuel delivery traffic. 3.2.5 Management Approach
This section explains how the team has planned to meet the project in term of management aspects
right from preparing project plan to design a preliminary design of the Biomass power plant. Main aim of the
project is to present a Preliminary Design, Conceptual Design of a Biomass Power Plant that can generate
3MW of power without producing any hazardous materials into the environment and meeting all other
requirements of the project.
Management Functions
- The base plan for the plan is to focus on weekly task while keeping in mind the final deliverables
- The Project Plan is organized in such a way that each member has equal number of work allotted to
them and allowances are given for any unforeseen events.
- The Plan is in controlled manner without giving any excess work to anyone.
Usage of Project Plan
- Project Plan is just a reference material which is to be followed to achieve the goal, but when the
project proceeds, the plan will be changed according for the development and issues without influence
the final goal.
Meetings
- Meetings have been planned for twice a week on Thursday and Saturday in Noble Library
- The minutes of the meeting are written down for future references
- The meeting agenda is pre-planned and time for the meeting is changed according to the agendas
- A Common drive is been created to share each member work which can be view by all other
members, which helps in saving time during meeting.
- Focus of the meeting is to discuss any changes in anybody work and compiling the deliverable and
also
on priority of things to be focus and how to change the approach as need.
24
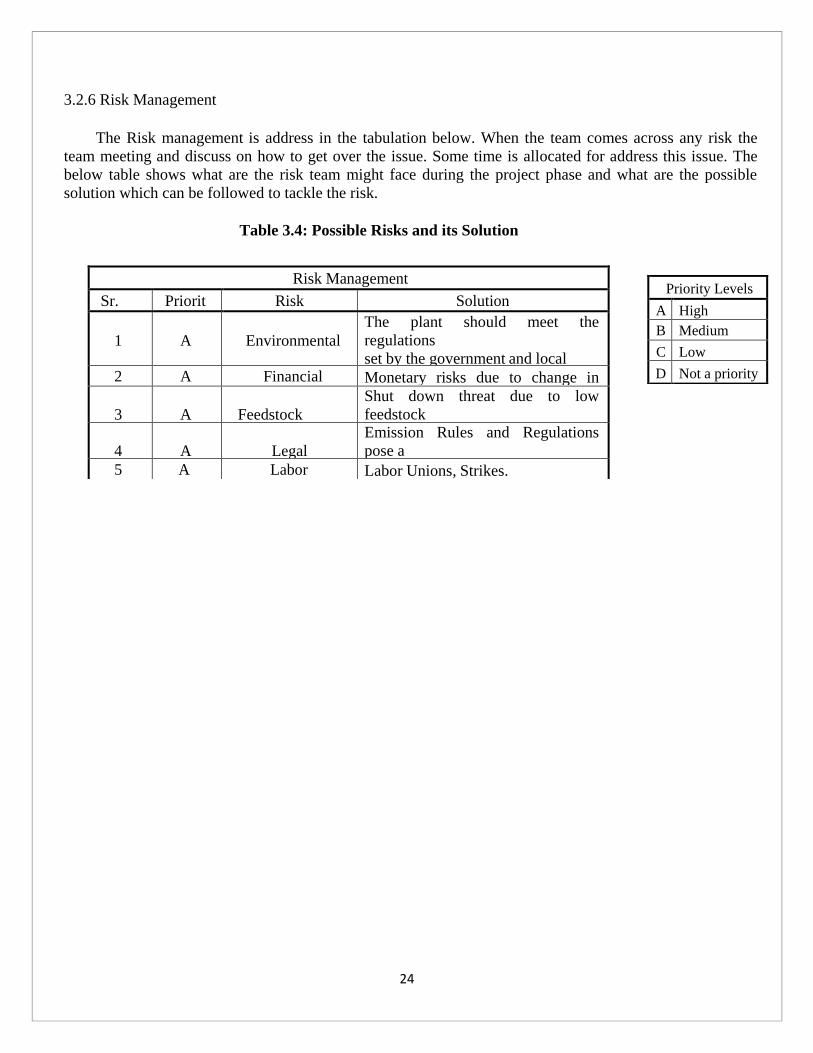
3.2.6 Risk Management
The Risk management is address in the tabulation below. When the team comes across any risk the
team meeting and discuss on how to get over the issue. Some time is allocated for address this issue. The
below table shows what are the risk team might face during the project phase and what are the possible
solution which can be followed to tackle the risk.
Table 3.4: Possible Risks and its Solution
Priority Levels
A High
B Medium
C Low
D Not a priority
Risk Management
Sr.
No.
Priorit
y
Risk Solution
1
A
Environmental
The plant should meet the
regulations set by the government and local authorities. 2 A Financial Monetary risks due to change in
profits.
3
A
Feedstock
Supply
Shut down threat due to low
feedstock supply.
4
A
Legal
Emission Rules and Regulations
pose a major threat. 5 A Labor Labor Unions, Strikes.
25
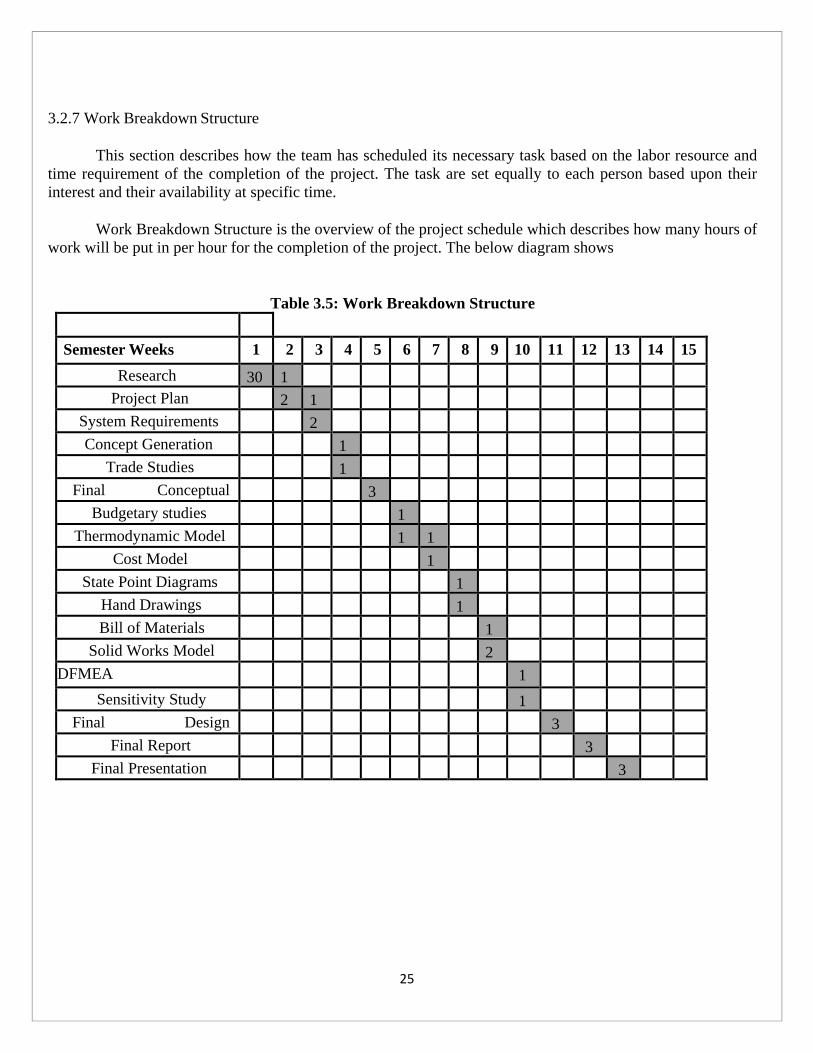
3.2.7 Work Breakdown Structure
This section describes how the team has scheduled its necessary task based on the labor resource and
time requirement of the completion of the project. The task are set equally to each person based upon their
interest and their availability at specific time.
Work Breakdown Structure is the overview of the project schedule which describes how many hours of
work will be put in per hour for the completion of the project. The below diagram shows
Table 3.5: Work Breakdown Structure
H
o
u
r
s
p
e
r
w
e
e
k
Semester Weeks 1 2 3 4 5 6 7 8 9 10 11 12 13 14 15
Research 30 1
0
Project Plan 2
0
1
0
System Requirements 2
0
Concept Generation 1
5
Trade Studies 1
5
Final Conceptual
Design
3
0
Budgetary studies 1
5
Thermodynamic Model 1
5
1
5
Cost Model 1
5
State Point Diagrams 1
5
Hand Drawings 1
5
Bill of Materials 1
5
Solid Works Model 2
0
DFMEA 1
5
Sensitivity Study 1
5
Final Design
Description
3
0
Final Report 3
0
Final Presentation 3
0

26
Assuming X hours for research, we are calculating the working hours for the rest based on it.
Research – X Project Plan – X
Requirements – 2X Concept Generation –2X
Final Conceptual Draft - 2X
Hand drawings – X
Creating Bill of Materials - .75X
State Point Diagrams - .5X
Cost Model – X
Final Drafting – 2X
Collecting Budgetary Info - X
Trade Studies - .5X
Cost of Electricity – .5X
Thermo model - .75X
Solid Works model - .5X
DFMEA - .5X
Sensitivity Study – X
Risk Management – X
Documentation – 4X
Miscellaneous – 2X
Presentation – 2X
Total Hours - 27X
Project Deliverables
Project Plan
Conceptual Design Draft Final Design Draft Presentation
Total No. of Hours needed = 27X
No. of Hours committed per week = 6 hours
Total no. of weeks = 10
No. of Members in team = 6
Total No. of working hours by the Team = 360 hours
27
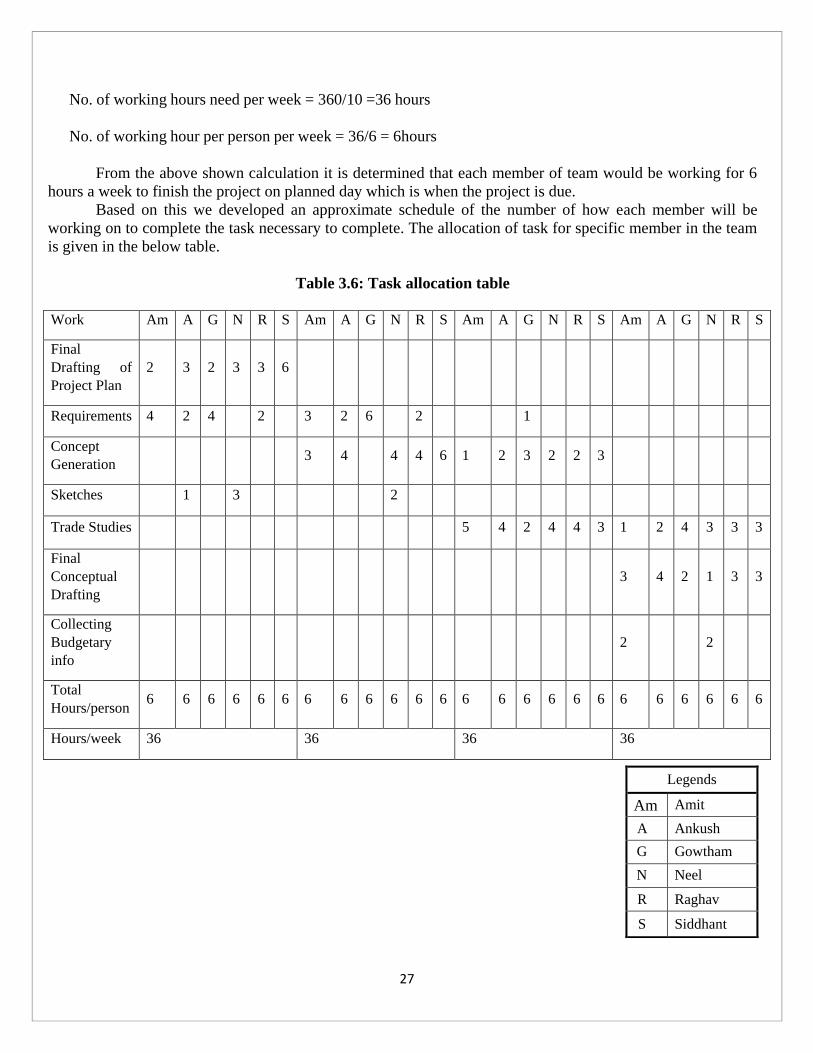
No. of working hours need per week = 360/10 =36 hours
No. of working hour per person per week = 36/6 = 6hours
From the above shown calculation it is determined that each member of team would be working for 6
hours a week to finish the project on planned day which is when the project is due.
Based on this we developed an approximate schedule of the number of how each member will be
working on to complete the task necessary to complete. The allocation of task for specific member in the team
is given in the below table.
Table 3.6: Task allocation table
Work Am A G N R S Am A G N R S Am A G N R S Am A G N R S
Final
Drafting of
Project Plan
2 3 2 3 3 6
Requirements 4 2 4 2 3 2 6 2 1
Concept
Generation 3 4 4 4 6 1 2 3 2 2 3
Sketches 1 3 2
Trade Studies 5 4 2 4 4 3 1 2 4 3 3 3
Final
Conceptual
Drafting
3 4 2 1 3 3
Collecting
Budgetary
info
2 2
Total
Hours/person 6 6 6 6 6 6 6 6 6 6 6 6 6 6 6 6 6 6 6 6 6 6 6 6
Hours/week 36 36 36 36
Legends
Am Amit
A Ankush
G Gowtham
N Neel
R Raghav
S Siddhant

28
Table 3.6: Task allocation table (cont.)
As shown in the above table, it is estimated the completion of project will take up to 19th
week. This
matches to the due date of the project. In case if the team couldn‟t meet the schedule the team member has
agreed upon to work extra hours to complete the project on time.
Work Am A G N R S Am A G N R S Am A G N R S Am A G N R S
Thermo-
model 4 3 2
COE model 5 2 3
Cost of
Electricity(Op
timization)
3 3 4 2 2
State Pt
Diagrams 3 3 2 2
Hand
Drawings 4 4
Creating Bill
of Materials 4 4
Solid works
model 2 2
DFMEA 4 3 3
Sensitivity
Study 4 4 3 1
Risk analysis 3 4 2
Final Drafting 2 2 4 5 2 1 2
Final Report 4 6 5 6 4 6
Total
hours/person 5 6 6 6 6 6 6 6 6 6 6 6 6 6 6 6 6 6 6 6 6 6 6 6
Total
hours/week 35 36 36 36
29
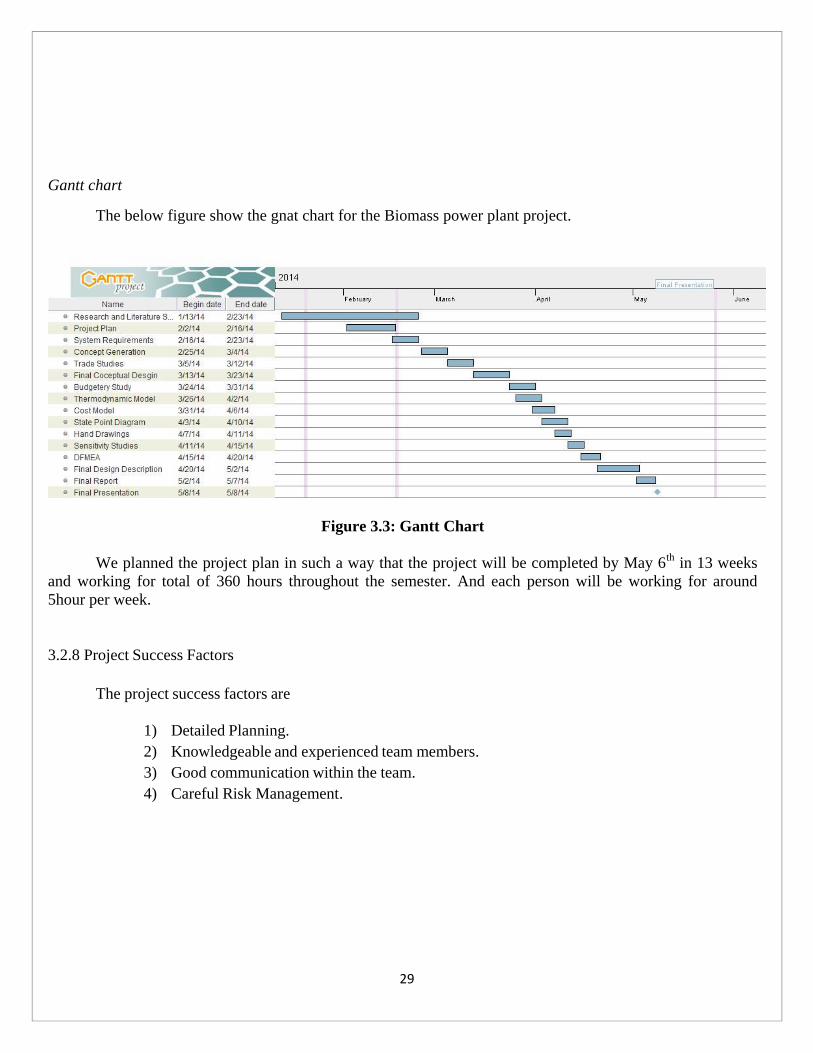
Gantt chart
The below figure show the gnat chart for the Biomass power plant project.
Figure 3.3: Gantt Chart
We planned the project plan in such a way that the project will be completed by May 6th
in 13 weeks
and working for total of 360 hours throughout the semester. And each person will be working for around
5hour per week.
3.2.8 Project Success Factors
The project success factors are
1) Detailed Planning.
2) Knowledgeable and experienced team members.
3) Good communication within the team.
4) Careful Risk Management.
30
4. Requirements and Constraints
Requirements are the entities that describe the specification of the design problem which are derived
from the customer needs. A design problem is usually based upon the needs of the customer life. The design
problem is generally formulated with additional requirements by the designer which includes customer needs
and things that are required to fulfil the customer requirements. The problem is generally specified by a set of
design goals and requirements.
Constrains are generally requirements which have limits or restriction values given to them. For
example: the cost should not exceed $2 million or downtime should not exceed 10 days in a year. The
environmental laws are also consider as constrains which generally have to be under the specified limit.
Requirement/Validation Matrix
Requirement matrix consist of 3 columns one specifying the requirements, next one specifying the
conceptual design (chosen concept values) and the last column has the Preliminary design values which
represent the calculated values which are verified for the chosen concept from Conceptual Design. The
importance of Requirement/Validation matrix is to make sure that the requirement i.e. customer needs are
achieved at each stage of the designing process.
In section 4.4, a modified form of Requirement Validation Matrix is shown, which shows the
requirements in the first column, how it will be validated by the team and the result of validation status in the
following columns.
4.1 Needs to Requirements
There are various ways to convert the Voice of Customers into the technical requirements one of the
way is to use House of Quality table (Quality Function Deployment(QFD)). QFD is a tool used by many
industries to convert their customer needs into the Technical requirements which are then used by the Designers
to choose a Concept from the number of available concepts. QFD also gives the relationship between various
customer needs which helps in understanding design process better.
The team has used a modified form of House of quality to derive the Technical requirements from the
Customer Needs. The Customer Needs were derived from the problem statement, which are then converted to
Technical requirements. The below table shows customer needs and its equivalent one or two technical
requirements along with their strength of relationship which are being weighted as 1, 3 or 9. In which, 1 being
very poor, 3 being weak and 9 being strong relationship.

31
In below table, the first column has the set of Customer requirements and the top row specifies its
corresponding Technical Requirements. In Biomass Power Plant, problem statement „Cheap Electricity‟ is the
basis, so it is a customer need and its equivalent technical requirements is „Cost not to exceed $.50kW/hr‟ and
their relationship is strong which is indicated by 9 in the cell where they both intersect. Similarly all other
customer needs and their corresponding technical requirements are shown in below table.
Table 4.1 House of Quality 1 – Poor Relation
3 – Weak Relation
9 – Strong relations
Customer needs/ Technical
Requirements
3 M
We
capac
ity
Cost
not
to
exce
ed
$.5
0kW
/hr
Volu
me
of
the
Chopper
Cap
acit
y s
hould
be
4.5
to 6
Tons
Dow
nti
me
should
n‟t
be
more
than
120hr/
yr
Dis
posa
l of
Was
te
wat
er a
nd a
shes
More
th
an
10%
mois
ture
conte
nt
in f
uel
Aro
und 3
50ᵒC
Exhau
st
Sta
ck T
emper
ature
Cheap Electricity 3 9 1 1 1 1 1
Less environmental Pollution 1 1 1 1 9 1 1
Use waste woods/weeds 1 1 1 1 1 9 1
Less odor 1 1 1 1 9 3 1
Continuous supply of electricity 1 1 9 9 9 9
Produce electricity for a specified
area 9 3 1 3 1 1 1
4.2 Applicable Standards and Regulations
The major standards and regulation of the given problem i.e. for a power generation from a Bio-mass
Power Plant are identified based on the environmental requirements and the process requirements to produce
3MW of electricity from the Biomass Plant from the given fuel. Some of the standards and regulation for
Biomass are given below:-
Exhaust emission from the power plant should follow NAAQS1
The odor from the plant should not be more than that mentioned in the regulations.
The ash content should be less than that mentioned in the regulations.
1 National Ambient Air Quality Standards (NAAQS) see appendix for details
32
4.3 Validation Methods
The requirements need to be validated to meet the customer needs by at least one of the following
validation process
1. Analysis – Similarity
In this method, the process/component used to develop the Power Plant is compared to one of
existing/existed plant to validate whether the plant meets certain requirements.
2. Analysis – Sensitivity
In this method, a graph is drawn to study how a variable will be varied with respect to other
variable, which helps in understanding the behavior of the variables.
3. Analysis – Computational
In this method, a computational model is developed in one of software packages and it is
analyzed to check whether the design meets the requirements.
4. Prototype Testing
In this method, the team builds a smaller version of the product/component to test it under the
real time condition to check whether the system will produce the required outcome.
5. Analysis – Hand Calculation
This is most generally used method, wherein the team does the thermodynamic calculation by
assuming certain assumptions and does the calculation to see whether the assumption meet the required
results, if not the assumptions are changed and calculations are re-done till the required results are
achieved.

33
4.4 Requirements/Validation Matrix
Based on the QFD table shown above, the team decided to use the following requirements to design the
Biomass Power Plant. The below table gives the requirements along with the details of how it will be validated
and what is the status of the requirement, i.e. whether the requirement is met or not.
Table 4.2 Requirement Matrix
S.No. Requirement Method of
Validation
Validation Result
1 3 MWe capacity Thermodynamic
Model
Able to produce
3MWe
2 Cost of Electricity should be less than
$0.25/kWh
Analysis – Hand
Calculation
Able to achieve
$0.22/kWh
3 Exhaust Stack Temperature should be
around 325ᵒF to 350ᵒF
Thermodynamic
Model
Have 350F
temperature at Stack
4 Emissions within the limits mentioned in
appendix(a)
Analysis – Similarity
5
Moisture Content of the air at intake of
combustor should be less than 10-30%.
(to have better efficiency from combustion
process)
Analysis – Sensitivity Moisture content of
air is calculated to be
20%
6 Feedstock must be able to be stored for at
least 5 days at any given time.
Analysis – Hand
Calculation
Storage unit volume
should be able to hold
atleast 770400 lbs of
fuel (fuel req. for 5
days)
7 Proper Disposal of Waste water and ashes
from combustion
Analysis – Similarity Has to be met while
building the plant.

34
5. Conceptual Design
Biomass energy is abundant and renewable. It has developed into an alternative source of energy and
reduced our dependency on conventional fossil fuels. However, biomass energy is also quite expensive and
inefficient compared to conventional fossil fuels. It was hense concluded that to build a viable biomass power
plant, topmost priority had to be given to reduced cost of electricity (COE) and emissions, and increased
efficiency. The major factors affecting the COE, efficiency and efficiency of a power plant are
Type of fuel
How the energy of fuel is converted to electrical energy
In this section, these two things will be analysed and based on efficiency, emissions and COE, optimum
comceptual design shall be presented.
5.1 Functional Block Diagram
Figure 5.1: Functional Block Diagram of Biomass Power Plant
As shown in Fig 5.1 the basic functions of the power plant are as follows
1) Delivery of appropriate fuel to the power plant.
2) Grinding and drying of fuel to enable direct delivery to energy conversion system
3) Converting chemical energy of fuel to heat energy with the help of a combustor and heat
exchanger.
4) Converting the available heat energy to electrical energy with a turbine generator set.
5) Proper disposal of byproducts of energy conversion process based on requirements
6) Optimum waste heat rejection to ensure high efficiency.
Delivery of fuel Storage and
preparation of fuel for energy conversion
Conversion of chemical energy of fuel to heat energy
Conversion of heat energy to electrical
energy
Waste Energy
Rejection
Proper disposal of
byproducts
35
5.2 Research and prior art
The factors which critically affect the efficiency, emissions and cost of a biomass power plant are
Fuel
Chemical to heat energy conversion
Thermodynamic Cycle
5.2.1 Fuel
Most of the existing power plants all use solid biomass fuel in the form of wood chips to heat water to
generate steam; however some also use agricultural waste products like fruit pits and corn cobs, or landfill gas
like methane and alcohol fuels like ethanol. The steam is then use to rotate a turbine and generator to generate
electricity.
5.2.2 Heat Energy eneration
Most power plants use direct combustion where biomass is burnt directly in boiler to produce steam.
This is a fairly mature technology with low running cost and simple biomass pretreatment. Another way to
extract chemical energy of biomass is gasification combustion where solid biomass first breaks down to form a
flammable gas which can then be burnt to generate heat. However gasification requires complex equipment and
high maintenance cost.
Other methods include mixed burning where biomass is mixed with coal and burnt in a boiler. This
method requires strict biomass pretreatment and quality which would increase cost. Other ways include
Biomass liquefaction via pyrolysis which is similar to gasification, or biogas anaerobic digestion where biomass
is first converted to biogas which is then burnt to generate heat. When compared to direct combustion all these
methods have significant disadvantages in terms of maintenance and cost. After exploring all the options, direct
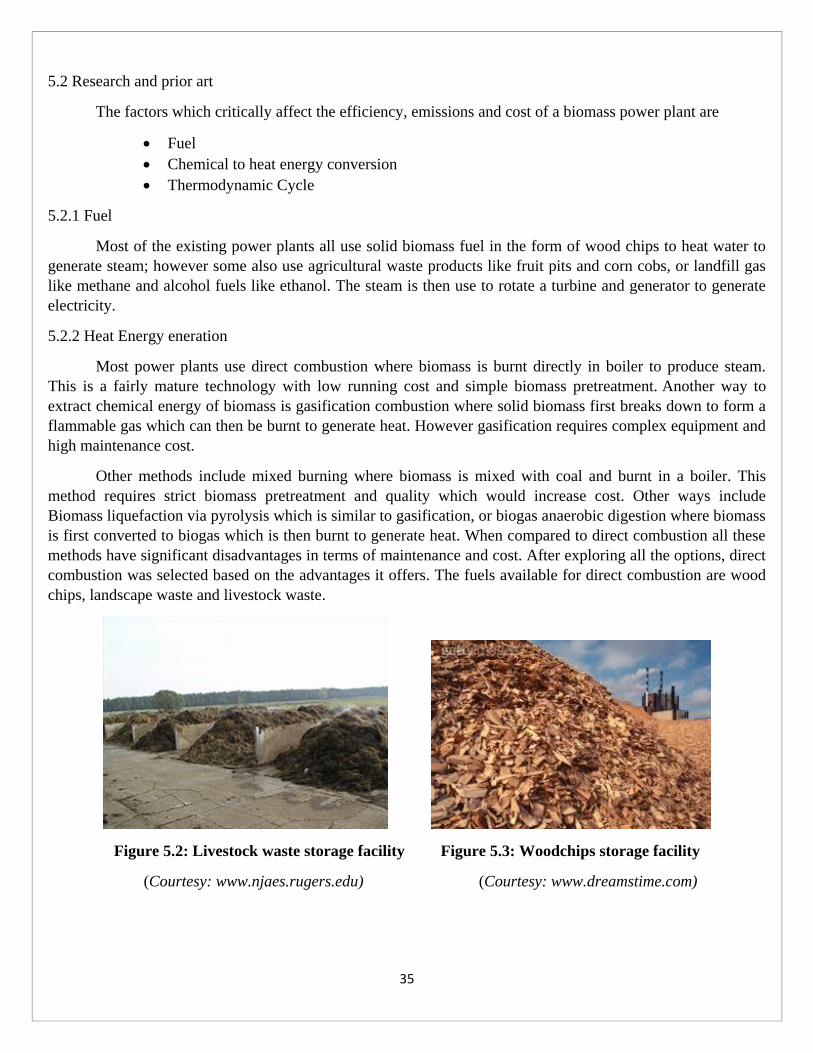
combustion was selected based on the advantages it offers. The fuels available for direct combustion are wood
chips, landscape waste and livestock waste.
Figure 5.2: Livestock waste storage facility Figure 5.3: Woodchips storage facility
(Courtesy: www.njaes.rugers.edu) (Courtesy: www.dreamstime.com)

36
5.2.3 Combustion:
The two most commonly used methods for biomass firing are stoker boilers and fluidized bed boilers.
Either of these can be fueled entirely by biomass fuel or co-fired with a combination of biomass and coal.
Stoker boilers employ direct fire combustion of solid fuels with excess air, producing hot flue gases which then
produce steam in the heat exchange section of the boiler. Fluidized bed boilers are the most recent type of boiler
developed for solid fuel combustion.
The primary driving force for development of fluidized bed combustion is reduced sulphur and nitrogen
dioxide emissions. In this method fuel is burnt in a bed of hot inert, or incombustible, particles suspended by an
upward flow of combustion air that is injected from the bottom of the combustor to keep the bed in a floating or
fluidized state. The scrubbing action of the bed material on the fuel enhances the combustion process by
stripping away the carbon dioxide and solids residue that normally forms around the fuel particles.
Note: The Co-Firing method has lately become popular in the coal based thermal power plants; thanks to
the easy availability of biomass(refer to appendix b). The cost of the fuel per kWe has reduced significantly in
europe and north american companies by using the co-firing method. However, this method can be emploed
only in large scale power plant (>100MWe).
Figure 5.4: Bubbling Fluidized Bed Figure 5.5: The Direct Combustion Method
Combustion boiler
(Courtesy : www.energy-enviro.fi) (Courtesy : www.busytrade.com)
37
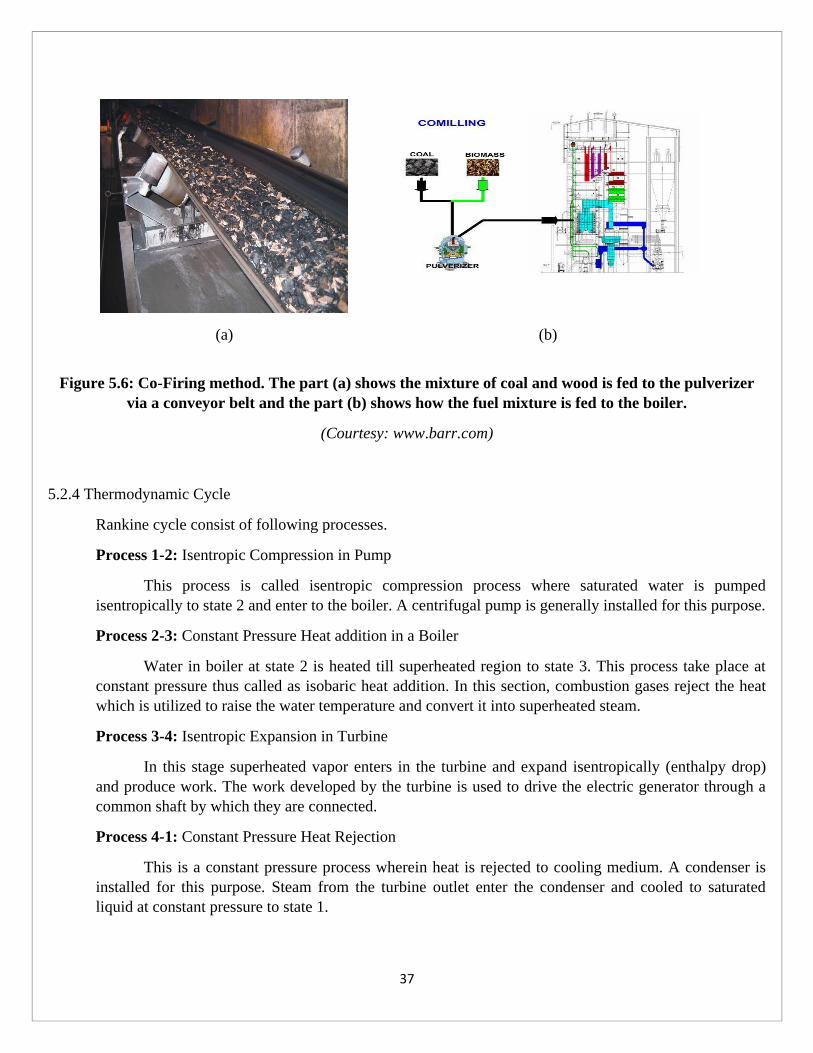
(a) (b)
Figure 5.6: Co-Firing method. The part (a) shows the mixture of coal and wood is fed to the pulverizer
via a conveyor belt and the part (b) shows how the fuel mixture is fed to the boiler.
(Courtesy: www.barr.com)
5.2.4 Thermodynamic Cycle
Rankine cycle consist of following processes.
Process 1-2: Isentropic Compression in Pump
This process is called isentropic compression process where saturated water is pumped
isentropically to state 2 and enter to the boiler. A centrifugal pump is generally installed for this purpose.
Process 2-3: Constant Pressure Heat addition in a Boiler
Water in boiler at state 2 is heated till superheated region to state 3. This process take place at
constant pressure thus called as isobaric heat addition. In this section, combustion gases reject the heat
which is utilized to raise the water temperature and convert it into superheated steam.
Process 3-4: Isentropic Expansion in Turbine
In this stage superheated vapor enters in the turbine and expand isentropically (enthalpy drop)
and produce work. The work developed by the turbine is used to drive the electric generator through a
common shaft by which they are connected.
Process 4-1: Constant Pressure Heat Rejection
This is a constant pressure process wherein heat is rejected to cooling medium. A condenser is
installed for this purpose. Steam from the turbine outlet enter the condenser and cooled to saturated
liquid at constant pressure to state 1.
38
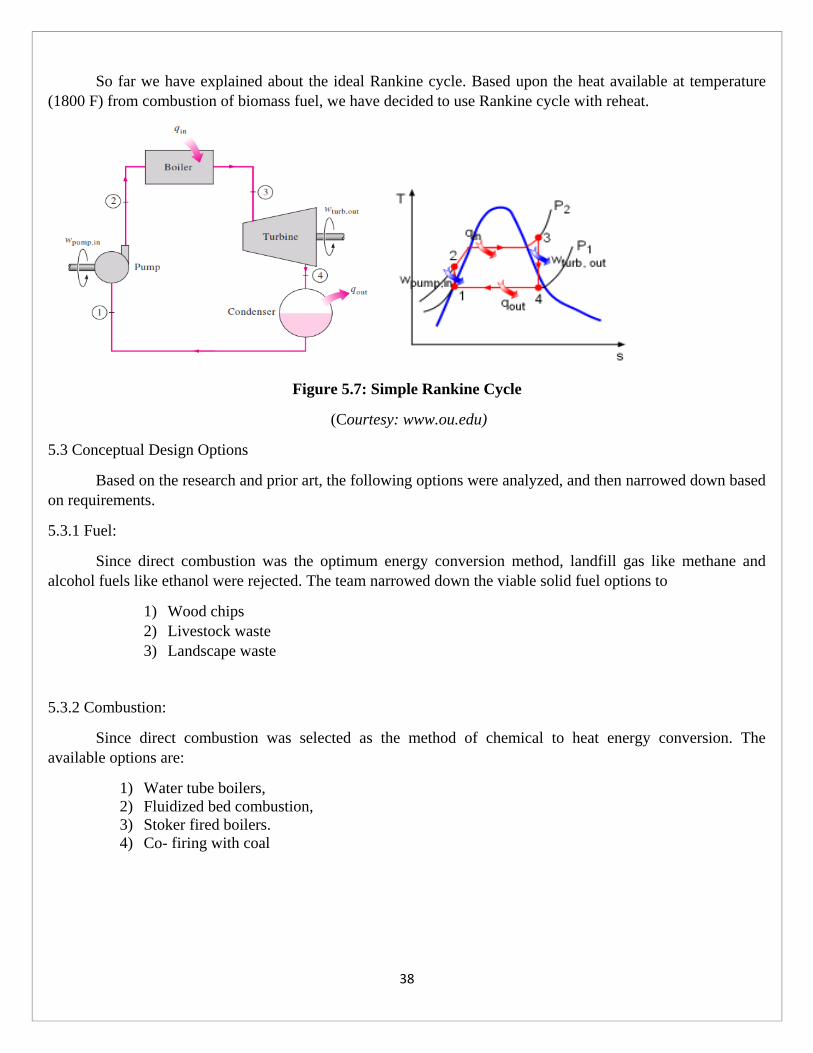
So far we have explained about the ideal Rankine cycle. Based upon the heat available at temperature
(1800 F) from combustion of biomass fuel, we have decided to use Rankine cycle with reheat.
Figure 5.7: Simple Rankine Cycle
(Courtesy: www.ou.edu)
5.3 Conceptual Design Options
Based on the research and prior art, the following options were analyzed, and then narrowed down based
on requirements.
5.3.1 Fuel:
Since direct combustion was the optimum energy conversion method, landfill gas like methane and
alcohol fuels like ethanol were rejected. The team narrowed down the viable solid fuel options to
1) Wood chips
2) Livestock waste
3) Landscape waste
5.3.2 Combustion:
Since direct combustion was selected as the method of chemical to heat energy conversion. The
available options are:
1) Water tube boilers,
2) Fluidized bed combustion,
3) Stoker fired boilers.
4) Co- firing with coal
39
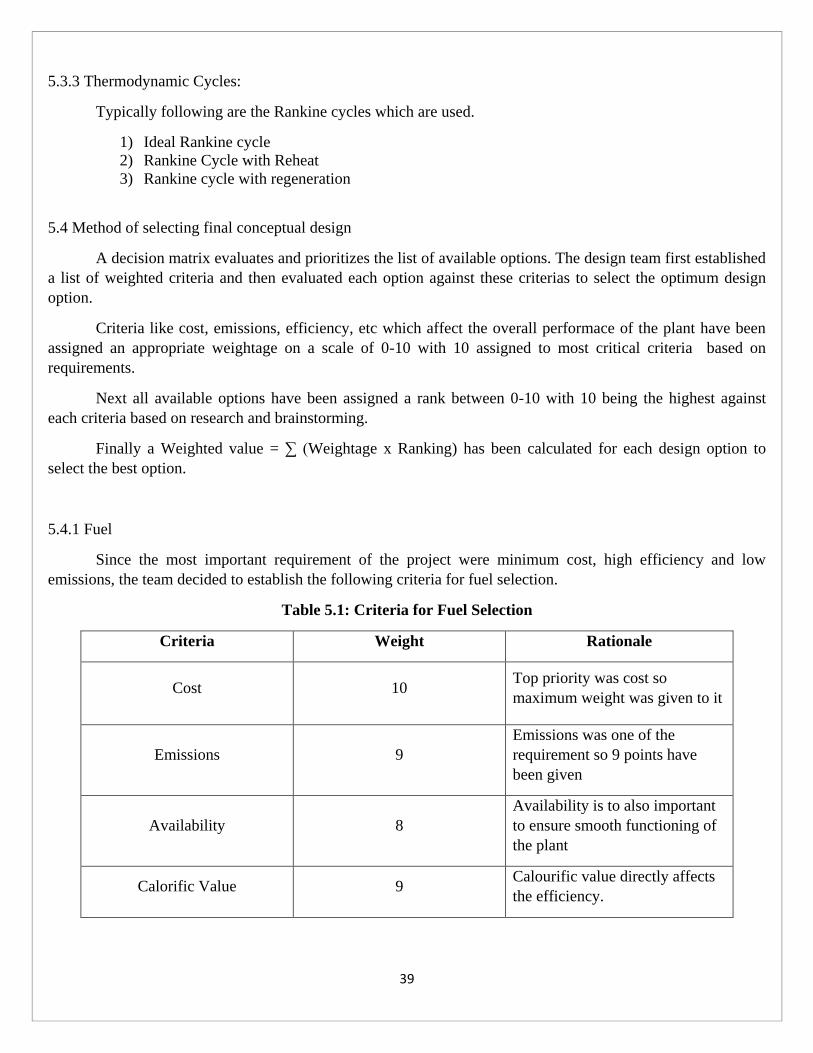
5.3.3 Thermodynamic Cycles:
Typically following are the Rankine cycles which are used.
1) Ideal Rankine cycle
2) Rankine Cycle with Reheat
3) Rankine cycle with regeneration
5.4 Method of selecting final conceptual design
A decision matrix evaluates and prioritizes the list of available options. The design team first established
a list of weighted criteria and then evaluated each option against these criterias to select the optimum design
option.
Criteria like cost, emissions, efficiency, etc which affect the overall performace of the plant have been
assigned an appropriate weightage on a scale of 0-10 with 10 assigned to most critical criteria based on
requirements.
Next all available options have been assigned a rank between 0-10 with 10 being the highest against
each criteria based on research and brainstorming.
Finally a Weighted value = ∑ (Weightage x Ranking) has been calculated for each design option to
select the best option.
5.4.1 Fuel
Since the most important requirement of the project were minimum cost, high efficiency and low
emissions, the team decided to establish the following criteria for fuel selection.
Table 5.1: Criteria for Fuel Selection
Criteria Weight Rationale
Cost 10 Top priority was cost so
maximum weight was given to it
Emissions 9
Emissions was one of the
requirement so 9 points have
been given
Availability 8
Availability is to also important
to ensure smooth functioning of
the plant
Calorific Value 9 Calourific value directly affects
the efficiency.
40
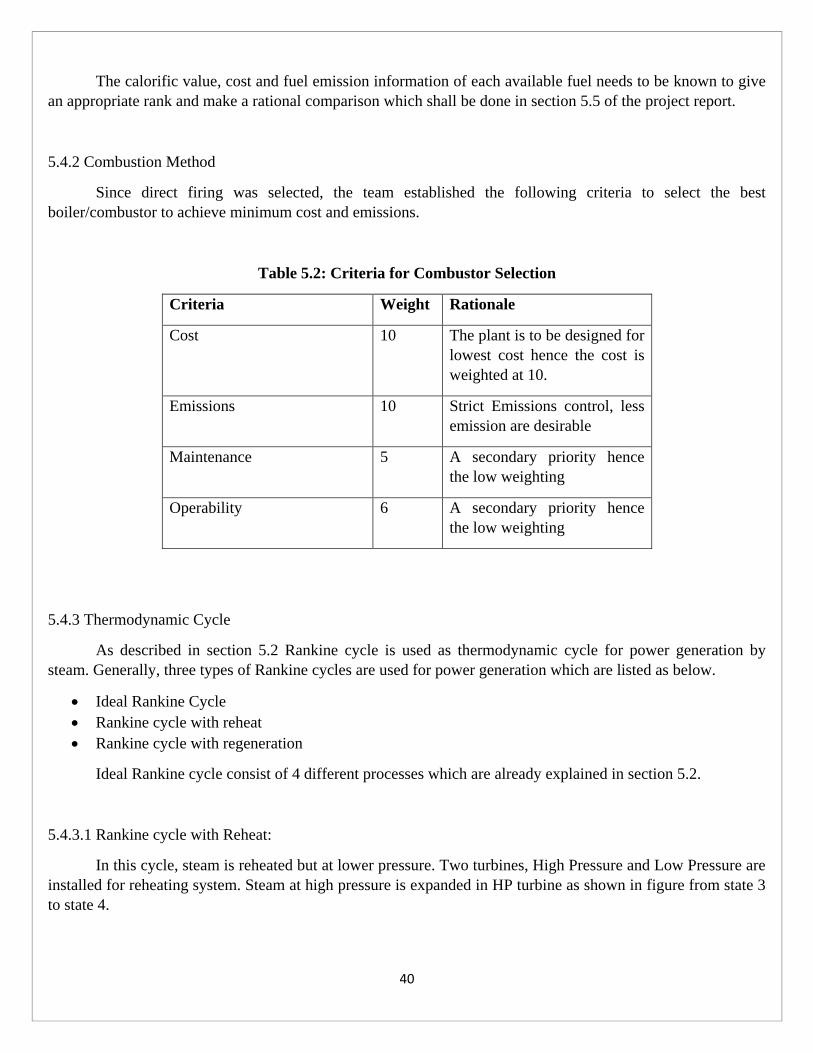
The calorific value, cost and fuel emission information of each available fuel needs to be known to give
an appropriate rank and make a rational comparison which shall be done in section 5.5 of the project report.
5.4.2 Combustion Method
Since direct firing was selected, the team established the following criteria to select the best
boiler/combustor to achieve minimum cost and emissions.
Table 5.2: Criteria for Combustor Selection
Criteria Weight Rationale
Cost 10 The plant is to be designed for
lowest cost hence the cost is
weighted at 10.
Emissions 10 Strict Emissions control, less
emission are desirable
Maintenance 5 A secondary priority hence
the low weighting
Operability 6 A secondary priority hence
the low weighting
5.4.3 Thermodynamic Cycle
As described in section 5.2 Rankine cycle is used as thermodynamic cycle for power generation by
steam. Generally, three types of Rankine cycles are used for power generation which are listed as below.
Ideal Rankine Cycle
Rankine cycle with reheat
Rankine cycle with regeneration
Ideal Rankine cycle consist of 4 different processes which are already explained in section 5.2.
5.4.3.1 Rankine cycle with Reheat:
In this cycle, steam is reheated but at lower pressure. Two turbines, High Pressure and Low Pressure are
installed for reheating system. Steam at high pressure is expanded in HP turbine as shown in figure from state 3
to state 4.

41
Now, steam at state 4 is directed to boiler for reheating which resulted out steam at higher temperature
and i.e. state 5. Now steam is expanded in LP turbine to state 6. Advantage of reheat is that, efficiency of the
plant is increased because we are using the same amount of heat for producing more work as without reheat.
Further, if we look at the turbine outlet which is nothing but at state 6 steam is saturated and have good quality
i.e. dryness fraction is 1.
Impact of good quality of steam is good working life of turbine blades. But this system leads to increase
in cost because for reheating we have to install super-heaters which are having expensive MOC (material of
construction). Because of their exotic metallurgy and high temperature operating conditions, cost will be
increased to a significant amount. So, weighted matrix study need to be carried out for the selection or rejection
of this system.
Figure 5.8 Rankine Cycle with Reheat
(Courtesy: www.ou.edu)
42
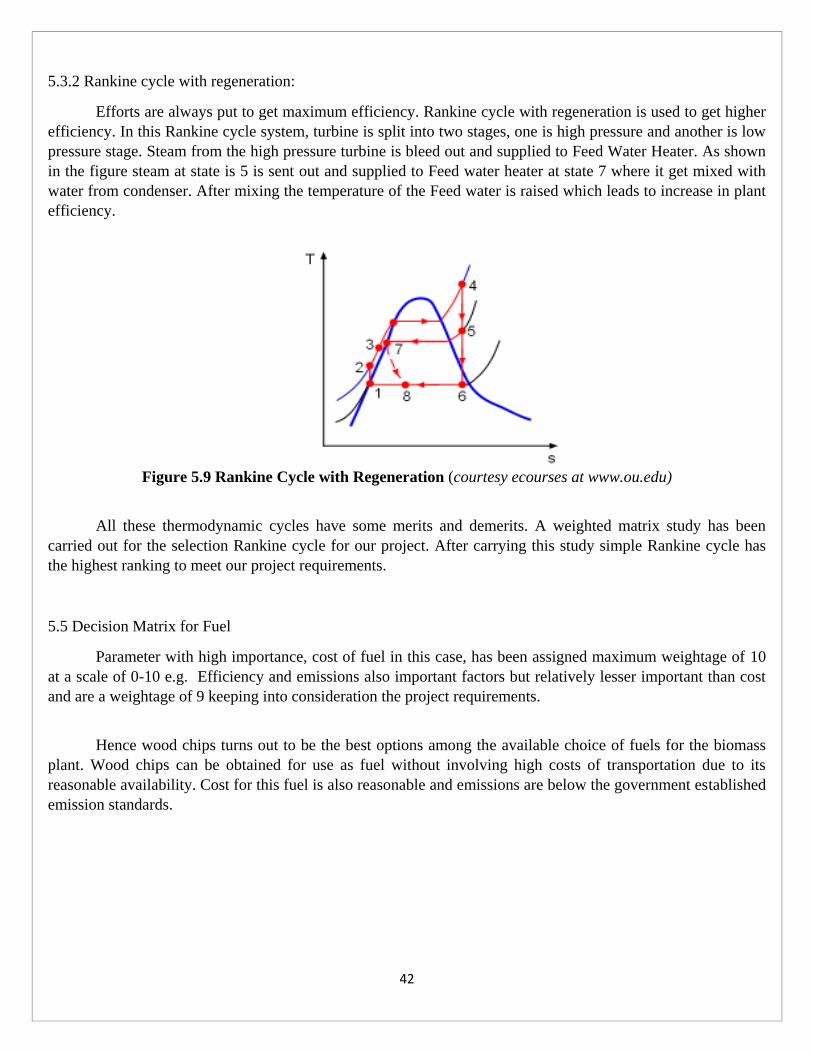
5.3.2 Rankine cycle with regeneration:
Efforts are always put to get maximum efficiency. Rankine cycle with regeneration is used to get higher
efficiency. In this Rankine cycle system, turbine is split into two stages, one is high pressure and another is low
pressure stage. Steam from the high pressure turbine is bleed out and supplied to Feed Water Heater. As shown
in the figure steam at state is 5 is sent out and supplied to Feed water heater at state 7 where it get mixed with
water from condenser. After mixing the temperature of the Feed water is raised which leads to increase in plant
efficiency.
Figure 5.9 Rankine Cycle with Regeneration (courtesy ecourses at www.ou.edu)
All these thermodynamic cycles have some merits and demerits. A weighted matrix study has been
carried out for the selection Rankine cycle for our project. After carrying this study simple Rankine cycle has
the highest ranking to meet our project requirements.
5.5 Decision Matrix for Fuel
Parameter with high importance, cost of fuel in this case, has been assigned maximum weightage of 10
at a scale of 0-10 e.g. Efficiency and emissions also important factors but relatively lesser important than cost
and are a weightage of 9 keeping into consideration the project requirements.
Hence wood chips turns out to be the best options among the available choice of fuels for the biomass
plant. Wood chips can be obtained for use as fuel without involving high costs of transportation due to its
reasonable availability. Cost for this fuel is also reasonable and emissions are below the government established
emission standards.
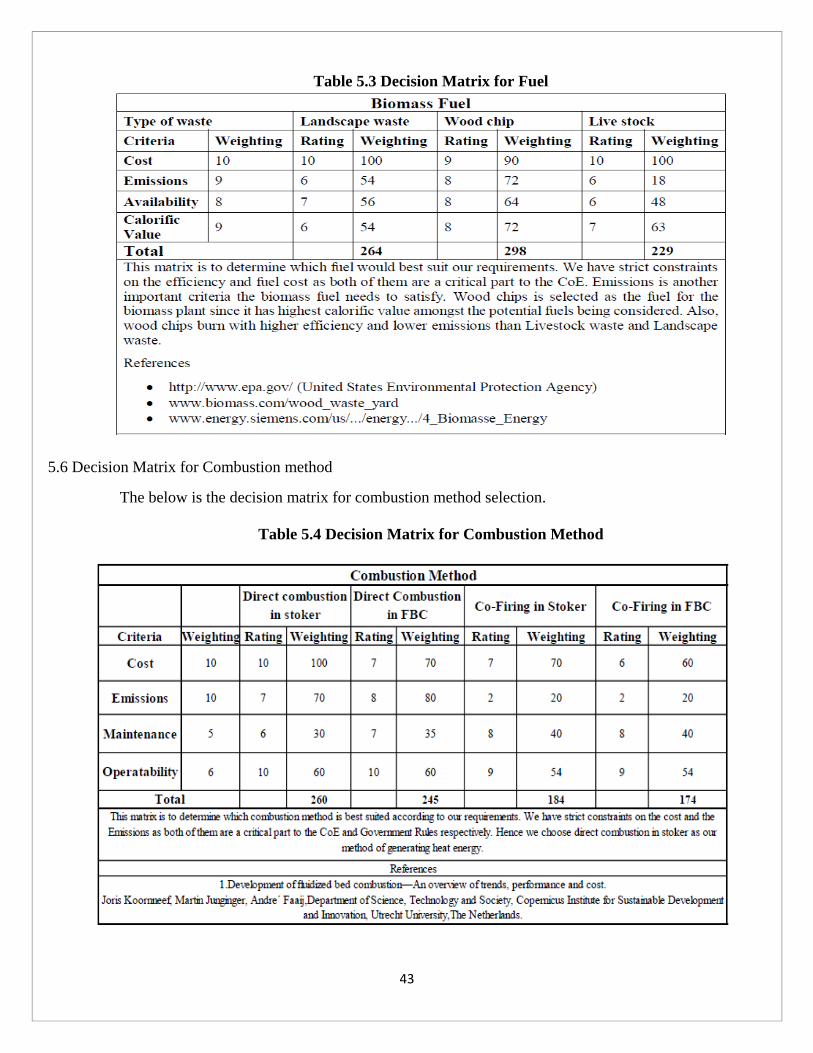
43
Table 5.3 Decision Matrix for Fuel
5.6 Decision Matrix for Combustion method
The below is the decision matrix for combustion method selection.
Table 5.4 Decision Matrix for Combustion Method
44
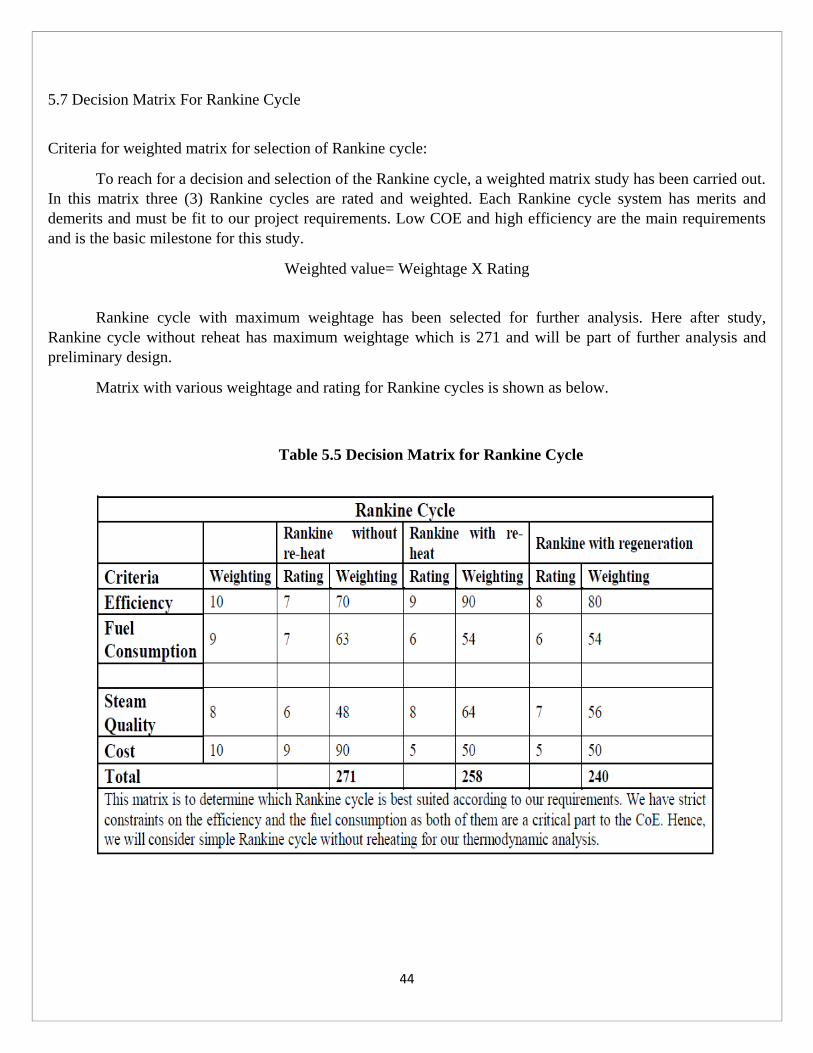
5.7 Decision Matrix For Rankine Cycle
Criteria for weighted matrix for selection of Rankine cycle:
To reach for a decision and selection of the Rankine cycle, a weighted matrix study has been carried out.
In this matrix three (3) Rankine cycles are rated and weighted. Each Rankine cycle system has merits and
demerits and must be fit to our project requirements. Low COE and high efficiency are the main requirements
and is the basic milestone for this study.
Weighted value= Weightage X Rating
Rankine cycle with maximum weightage has been selected for further analysis. Here after study,
Rankine cycle without reheat has maximum weightage which is 271 and will be part of further analysis and
preliminary design.
Matrix with various weightage and rating for Rankine cycles is shown as below.
Table 5.5 Decision Matrix for Rankine Cycle
45
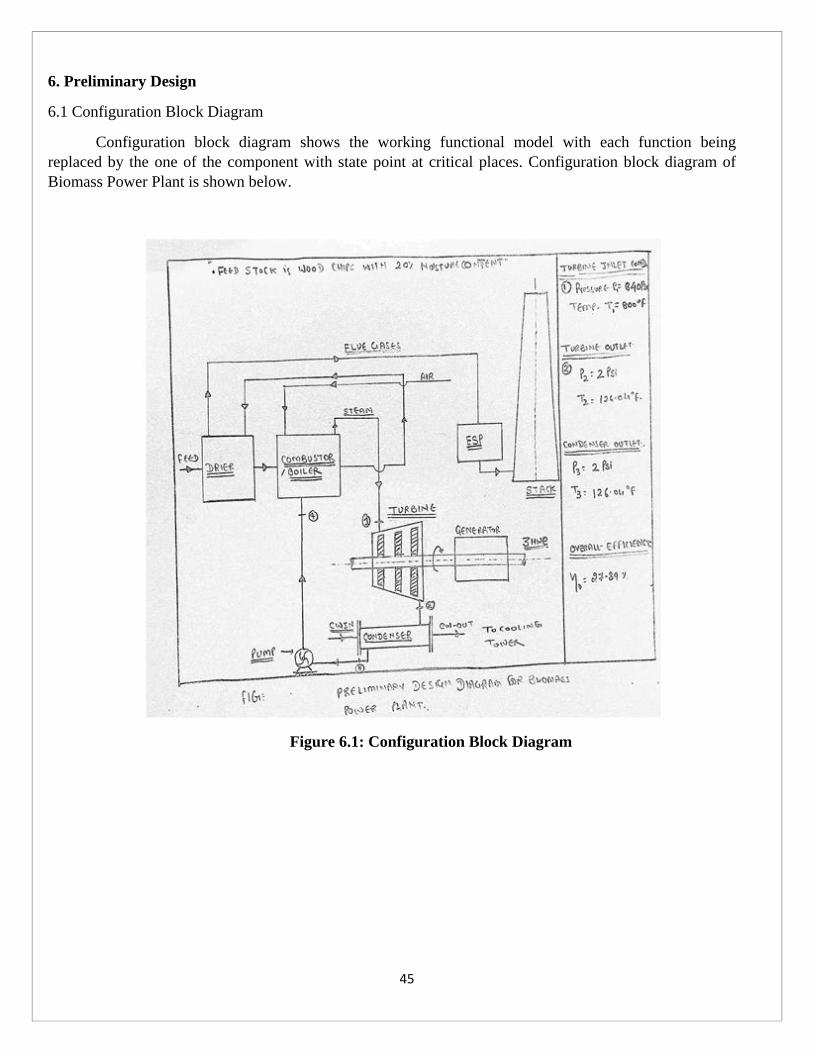
6. Preliminary Design
6.1 Configuration Block Diagram
Configuration block diagram shows the working functional model with each function being
replaced by the one of the component with state point at critical places. Configuration block diagram of
Biomass Power Plant is shown below.
Figure 6.1: Configuration Block Diagram

46
6.2 Analysis Plan and Results
We followed the following flow chart for analysis plan to design the design point with the main
objective to minimize the COE (cost of electricity) with maximum efficiency. From the design points we
optimized the COE from the sensitivity study of we did on various design variables.
Figure 6.2: Analysis Plan
We did thermodynamic analysis for three different inlet conditions to figure out which condition is
more efficient. The below table shows the three inlet conditions with their efficiency.
For 3 different Turbine
Inlet conditions
800 psi, 840F
600 psi, 640F
400 psi, 440F
Thermodynamic Efficiency &
Steam mass flow rate
Combustor Analysis for 3
different moisture content
(20%, 30%, 40%)
Calculation of Overall
Efficiency
Various Design Points
Sensitivity Study Optimum Design point for
minimum COE

47
Table 6.1: Efficiency of Rankine
Inlet Condition of Turbine (P & T) Efficiency (%)
800 psi, 840F 29.86
600 psi, 640F 26.35
400 psi, 444.7F 24.3
We have considered wood chips with 3 different moisture contents and calculated the air by fuel
ratio for complete combustion of the Biomass Fuel. The table (6.3) shows the mass flow rate of the air.
Table 6.2: Air/Fuel Ratio
Moisture Content of fuel (%, wet basis) Air/ Fuel Ratio
20 5.22
30 4.847
40 4.5
For all the inlet conditions and along with the Air/Fuel ratio, we have calculated the mass flow rate
of the fuel for the combustor using the below given formula.
Mass flow rate of fuel (m) = Desired power output / (LHV * Overall efficiency)
where, LHV – low heat value (BTU/lb)
m - Mass flow rate is in lb/hr
The below table show the mass flow rate at different inlet condition of the turbine.
48
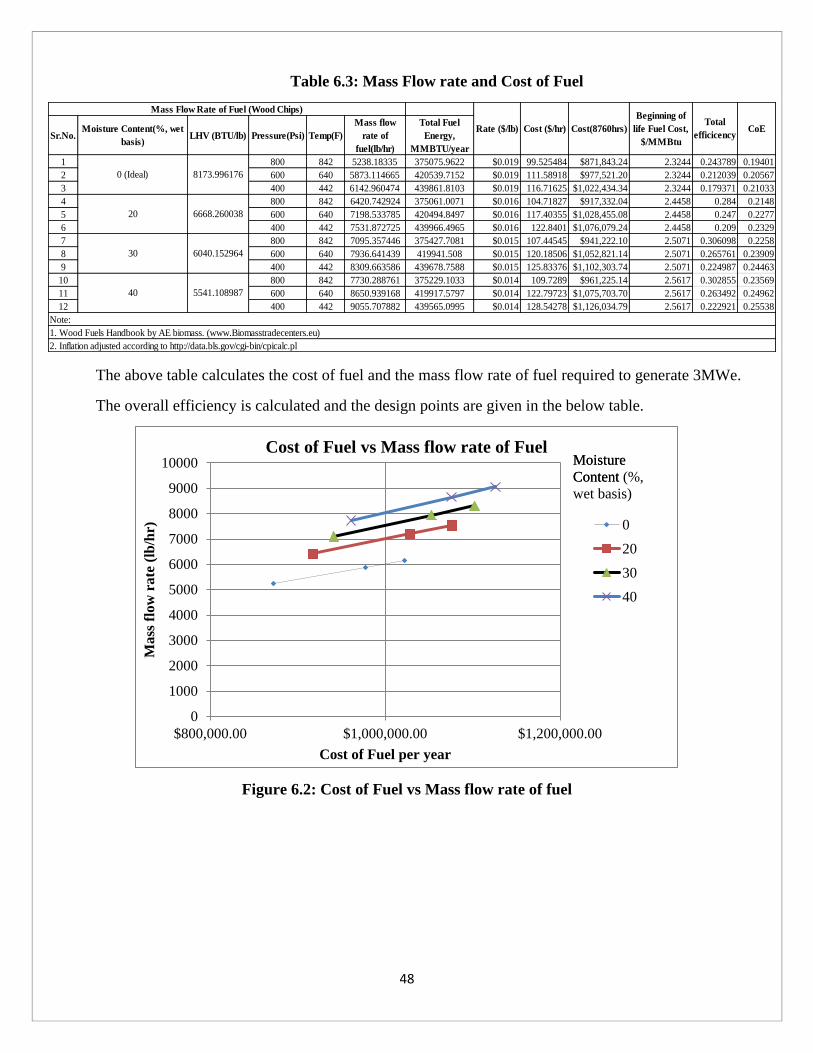
Table 6.3: Mass Flow rate and Cost of Fuel
The above table calculates the cost of fuel and the mass flow rate of fuel required to generate 3MWe.
The overall efficiency is calculated and the design points are given in the below table.
Figure 6.2: Cost of Fuel vs Mass flow rate of fuel
Sr.No.Moisture Content(%, wet
basis)LHV (BTU/lb) Pressure(Psi) Temp(F)
Mass flow
rate of
fuel(lb/hr)
Total Fuel
Energy,
MMBTU/year
1 800 842 5238.18335 375075.9622 $0.019 99.525484 $871,843.24 2.3244 0.243789 0.19401
2 600 640 5873.114665 420539.7152 $0.019 111.58918 $977,521.20 2.3244 0.212039 0.20567
3 400 442 6142.960474 439861.8103 $0.019 116.71625 $1,022,434.34 2.3244 0.179371 0.21033
4 800 842 6420.742924 375061.0071 $0.016 104.71827 $917,332.04 2.4458 0.284 0.2148
5 600 640 7198.533785 420494.8497 $0.016 117.40355 $1,028,455.08 2.4458 0.247 0.2277
6 400 442 7531.872725 439966.4965 $0.016 122.8401 $1,076,079.24 2.4458 0.209 0.2329
7 800 842 7095.357446 375427.7081 $0.015 107.44545 $941,222.10 2.5071 0.306098 0.2258
8 600 640 7936.641439 419941.508 $0.015 120.18506 $1,052,821.14 2.5071 0.265761 0.23909
9 400 442 8309.663586 439678.7588 $0.015 125.83376 $1,102,303.74 2.5071 0.224987 0.24463
10 800 842 7730.288761 375229.1033 $0.014 109.7289 $961,225.14 2.5617 0.302855 0.23569
11 600 640 8650.939168 419917.5797 $0.014 122.79723 $1,075,703.70 2.5617 0.263492 0.24962
12 400 442 9055.707882 439565.0995 $0.014 128.54278 $1,126,034.79 2.5617 0.222921 0.25538
2. Inflation adjusted according to http://data.bls.gov/cgi-bin/cpicalc.pl
1. Wood Fuels Handbook by AE biomass. (www.Biomasstradecenters.eu)
CoE
Note:
Total
efficicency
Beginning of
life Fuel Cost,
$/MMBtu
5541.108987
Cost(8760hrs)Rate ($/lb) Cost ($/hr)
20
30
40
Mass Flow Rate of Fuel (Wood Chips)
0 (Ideal) 8173.996176
6668.260038
6040.152964
0
1000
2000
3000
4000
5000
6000
7000
8000
9000
10000
$800,000.00 $1,000,000.00 $1,200,000.00
Ma
ss f
low
rate
(lb
/hr)
Cost of Fuel per year
Cost of Fuel vs Mass flow rate of Fuel
0
20
30
40
Moisture
Content
Moisture
Content (%,
wet basis)

49
Overall efficiency of the Power Plant was calculated using the below formula and the values are in table
Overall efficiency = Efficiency of Drier * Efficiency of Power unit * Efficiency of combustor
From this we calculated the fuel required per year which is,
Fuel required/per yr = Amount of the fuel required per hour (lbs) * 8760
Table 6.4: Overall Efficiency of the Plant for all Design Points
Design
Points
Moisture
Content of
Fuel (%)
(wet basis)
Inlet Condition
at Turbine (P &
T)
Mass Flow rate
of Fuel (lbs/hr)
Overall
Efficiency (%)
1
20
800 psi, 840F 6420.74 28.36
2 600 psi, 640F 7198.53 24.7
3 400 psi, 444F 7531.87 20.90
4
30
800 psi, 840F 7095.35 28.36
5 600 psi, 640F 7936.64 24.7
6 400 psi, 444F 8309.66 20.90
7
40
800 psi, 840F 7730.28 28.36
8 600 psi, 640F 8650.93 24.7
9 400 psi, 444F 9055.70 20.90
50
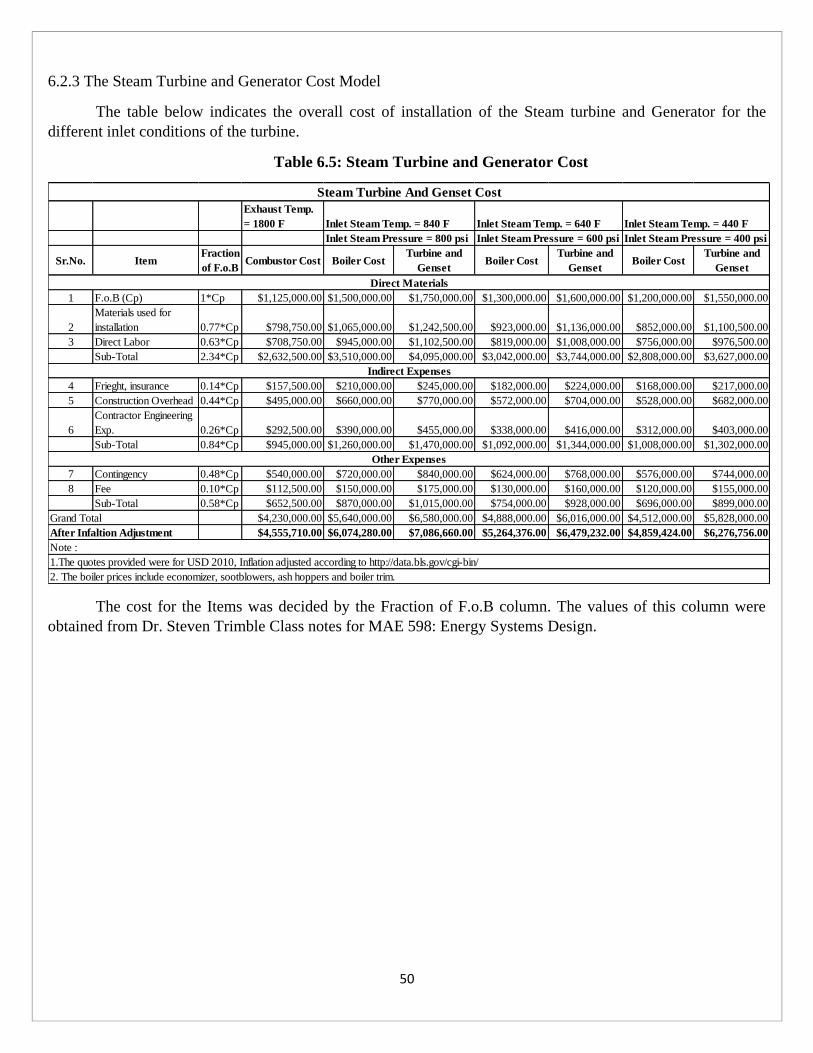
6.2.3 The Steam Turbine and Generator Cost Model
The table below indicates the overall cost of installation of the Steam turbine and Generator for the
different inlet conditions of the turbine.
Table 6.5: Steam Turbine and Generator Cost
The cost for the Items was decided by the Fraction of F.o.B column. The values of this column were
obtained from Dr. Steven Trimble Class notes for MAE 598: Energy Systems Design.
Exhaust Temp.
= 1800 F Inlet Steam Temp. = 640 F Inlet Steam Temp. = 440 F
Inlet Steam Pressure = 600 psi Inlet Steam Pressure = 400 psi
Sr.No. ItemFraction
of F.o.BCombustor Cost Boiler Cost
Turbine and
GensetBoiler Cost
Turbine and
GensetBoiler Cost
Turbine and
Genset
1 F.o.B (Cp) 1*Cp $1,125,000.00 $1,500,000.00 $1,750,000.00 $1,300,000.00 $1,600,000.00 $1,200,000.00 $1,550,000.00
2
Materials used for
installation 0.77*Cp $798,750.00 $1,065,000.00 $1,242,500.00 $923,000.00 $1,136,000.00 $852,000.00 $1,100,500.00
3 Direct Labor 0.63*Cp $708,750.00 $945,000.00 $1,102,500.00 $819,000.00 $1,008,000.00 $756,000.00 $976,500.00
Sub-Total 2.34*Cp $2,632,500.00 $3,510,000.00 $4,095,000.00 $3,042,000.00 $3,744,000.00 $2,808,000.00 $3,627,000.00
4 Frieght, insurance 0.14*Cp $157,500.00 $210,000.00 $245,000.00 $182,000.00 $224,000.00 $168,000.00 $217,000.00
5 Construction Overhead 0.44*Cp $495,000.00 $660,000.00 $770,000.00 $572,000.00 $704,000.00 $528,000.00 $682,000.00
6
Contractor Engineering
Exp. 0.26*Cp $292,500.00 $390,000.00 $455,000.00 $338,000.00 $416,000.00 $312,000.00 $403,000.00
Sub-Total 0.84*Cp $945,000.00 $1,260,000.00 $1,470,000.00 $1,092,000.00 $1,344,000.00 $1,008,000.00 $1,302,000.00
7 Contingency 0.48*Cp $540,000.00 $720,000.00 $840,000.00 $624,000.00 $768,000.00 $576,000.00 $744,000.00
8 Fee 0.10*Cp $112,500.00 $150,000.00 $175,000.00 $130,000.00 $160,000.00 $120,000.00 $155,000.00
Sub-Total 0.58*Cp $652,500.00 $870,000.00 $1,015,000.00 $754,000.00 $928,000.00 $696,000.00 $899,000.00
$4,230,000.00 $5,640,000.00 $6,580,000.00 $4,888,000.00 $6,016,000.00 $4,512,000.00 $5,828,000.00
$4,555,710.00 $6,074,280.00 $7,086,660.00 $5,264,376.00 $6,479,232.00 $4,859,424.00 $6,276,756.00
1.The quotes provided were for USD 2010, Inflation adjusted according to http://data.bls.gov/cgi-bin/
2. The boiler prices include economizer, sootblowers, ash hoppers and boiler trim.
Note :
After Infaltion Adjustment
Grand Total
Inlet Steam Temp. = 840 F
Inlet Steam Pressure = 800 psi
Steam Turbine And Genset Cost
Direct Materials
Indirect Expenses
Other Expenses
51
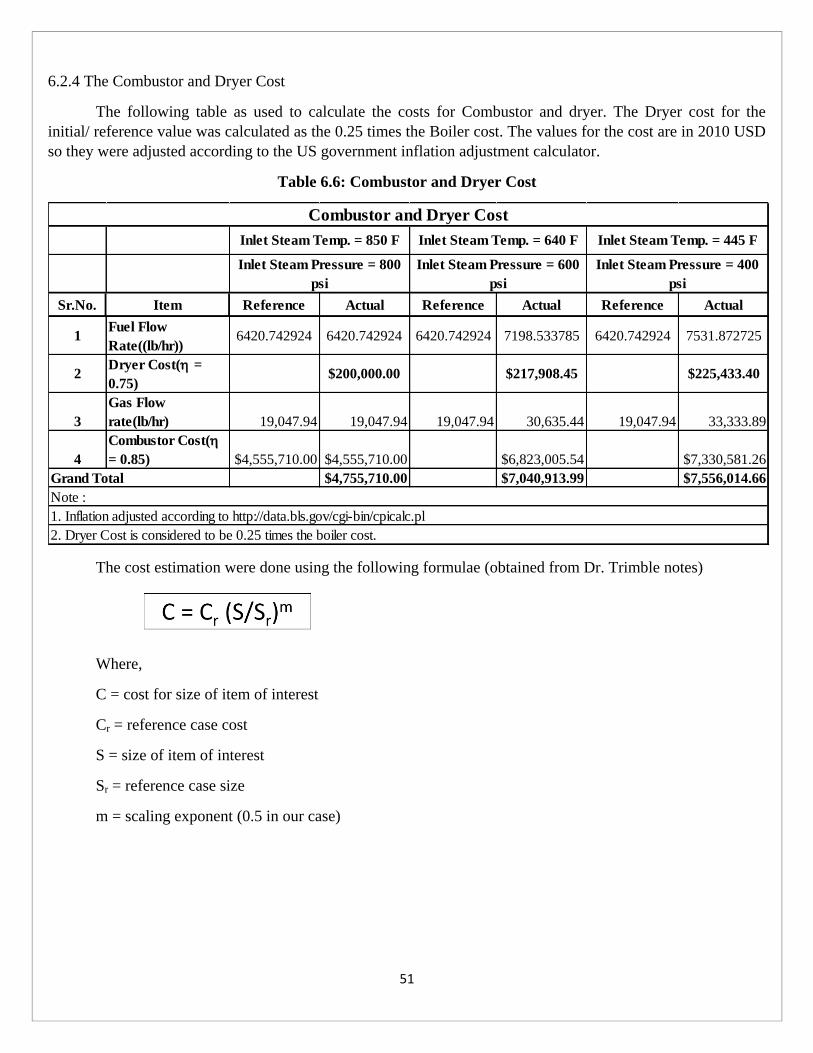
6.2.4 The Combustor and Dryer Cost
The following table as used to calculate the costs for Combustor and dryer. The Dryer cost for the
initial/ reference value was calculated as the 0.25 times the Boiler cost. The values for the cost are in 2010 USD
so they were adjusted according to the US government inflation adjustment calculator.
Table 6.6: Combustor and Dryer Cost
The cost estimation were done using the following formulae (obtained from Dr. Trimble notes)
Where,
C = cost for size of item of interest
Cr = reference case cost
S = size of item of interest
Sr = reference case size
m = scaling exponent (0.5 in our case)
Sr.No. Item Reference Actual Reference Actual Reference Actual
1Fuel Flow
Rate((lb/hr))6420.742924 6420.742924 6420.742924 7198.533785 6420.742924 7531.872725
2Dryer Cost( =
0.75)$200,000.00 $217,908.45 $225,433.40
3
Gas Flow
rate(lb/hr) 19,047.94 19,047.94 19,047.94 30,635.44 19,047.94 33,333.89
4
Combustor Cost(
= 0.85) $4,555,710.00 $4,555,710.00 $6,823,005.54 $7,330,581.26
$4,755,710.00 $7,040,913.99 $7,556,014.66
2. Dryer Cost is considered to be 0.25 times the boiler cost.
Combustor and Dryer Cost
1. Inflation adjusted according to http://data.bls.gov/cgi-bin/cpicalc.pl
Inlet Steam Pressure = 400
psi
Inlet Steam Temp. = 445 FInlet Steam Temp. = 850 F
Inlet Steam Pressure = 800
psi
Inlet Steam Temp. = 640 F
Inlet Steam Pressure = 600
psi
Grand Total
Note :

52
6.2.5 Cost of Installation of the plant
The Cost of Installation was calculated using the inflated costs calculated from the previous tables.
Table 6.7: Cost of Installation
The following plot explains the relation between the plant efficiency and plant cost. We observe that the
maximum efficiency was obtained for the plant with lowest cost.
Figure 6.3: Plot to decide the cost effective plant setup
Sr.No. Inlet Conditions Dryer Combustor Boiler Turbine and Genset TotalPlant
Efficiency
1 P = 840 psi, T= 800 F $200,000.00 $4,555,710.00 $6,074,280.00 $7,086,660.00 $17,916,650.00 0.28
2 P = 640 psi, T=600 F $217,908.45 $6,823,005.54 $5,264,376.00 $6,479,232.00 $18,784,521.99 0.25
3 P = 440 psi, T= 400 F $225,433.40 $7,330,581.26 $4,859,424.00 $6,276,756.00 $18,692,194.66 0.21
Cost Installation
$17,000,000.00
$18,000,000.00
$19,000,000.00
0.200.210.220.230.240.250.260.270.280.290.30Pla
nt
Cost
, ($
)
Efficiency,
Plant efficiency vs Plant Cost

53
6.2.6 Cost of Electricity (CoE)
The Cost of electricity (CoE) was calculated using the costs and data obtained from the previous calculations
above. Some of the assumptions include the FCR, CF and O&M charges. The minimum CoE was obtained for
the 800 psi and 840 F. Hence we have selected these inlet conditions for our turbine.
Table 6.8: Cost of Electricity Calculations
Note: CoE units are in $/kWh.
Inlet Steam Temp. =
840 F
Inlet Steam Temp. =
640 F
Inlet Steam Temp. =
440 F
Inlet Steam Pressure
= 800 psi
Inlet Steam Pressure
= 600 psi
Inlet Steam Pressure =
400 psi
1
1.1 Fixed charge rate, FCR($) 0.18 0.18 0.18
1.2 Capital Cost, CI($) $17,916,650.00 $18,784,521.99 $18,692,194.66
1.3 Capcity Factor, CF 0.7 0.7 0.7
1.4 Rated Capcity, (MWe) 3 3 3
Fixed charges($) 0.175309687 0.183801585 0.182898186
2 O& M Charges($/kWh) 0.01 0.01 0.01
3
3.1Beginning of life Fuel Cost,
$/MMBtu2.45 2.45 2.45
3.2
3.2.1 Rankine cycle Efficiency 0.2986 0.26 0.22
3.2.2 Dryer Efficiency 1 1 1
3.2.3 Combustor Efficiency 0.95 0.95 0.95
Total Efficiency 0.2837 0.2470 0.2090
Fuel Charges 0.029486022 0.033863563 0.040020574
4 Cost of Electricity, CoE $0.2148 $0.2277 $0.2329
2. The Value of FCR, Capacity Factor and O&M charges were referred from Dr.Trimbles MAE 598 class notes.
Turbine Input ConditionsSr. No.
Cost of Electricity Calculations
Note:
1. Inflation adjusted according to http://data.bls.gov/cgi-bin/cpicalc.pl
Overall Plant Efficiency
Fixed Charges
Fuel Cost($)

54
6.3 DFMEA
Design Failure Mode Effective Analysis (DFMEA) is a method used in many industries to figure out
what are the possible failures of the system, what are its possibilities of occurrences, what is the severity and
how can a failure which is occurring could be detected. DFMEA combines the 3 potential things stated above
(i.e. Probability of occurrences (P), Severity of the failure (S) and its Detection rate (D)) to find the Risk
Priority Number (RPN). RPN predicts whether the design is acceptable or not. A pre-defined table is present to
check whether the obtained RPN is satisfactory or not and this pre-defined table is based on the probability,
severity and detection.
The Priority and severity reference sheet is shown at the appendix based on which the team
calculated RPN. The below table shows how the RPN is calculated.
Table 6.7: Risk Priority Number
As shown in the above table, there are certain values which are in unacceptable range meanwhile
some have low risk. A to E represents the Probability of failure occurrence while I to VI represents Severity of
the failure.

55
The below table shows the DFMEA for the Biomass Power Plant.
Table 6.8: DFMEA for Biomass Power Plant
The above table shows the potential 5 majors failures that might occur, with their severity, detection
rate and what action is required to stop the failure from damaging the entire system. As one can see, all the
failure which might occur have acceptable risk factor and so design which we have selected can go on to real
world and potentially there won‟t be any failure.
Item Potential
Failure mode
Causes Prob -
ability
Severity Detection RPN
Turbine Corrosion of
Blades
Moisture content
of steam
D IV Moderate High
Combustor Explosion of
Boilers
Over-heating of
Combustors
A V Low Moderate
Pipe flow Leakage of
Steam pipes
High pressure &
Maintenance deficiency
B II Moderate Low
Heat
Exchanger
Wear damage High pressure C III Low Moderate
Pump Neglect to
Pump water
Maintenance Deficiency B II High Low

56
6.4 System Optimization
The main aim of the project is to provide cheap electricity and the team planned to optimize the Cost of
Electricity (COE). COE depends on the following variables and team studied the sensitivity of each variable
with the cost of electricity and found the sweet point of each variable.
Sensitivity study was done for the following variables,
Mass Flow rate of the fuel
Overall efficiency of Plant
Moisture content of Fuel
Mass Flow Rate of Fuel vs Cost of Electricity
The relationship between the mass flow rate of fuel and the COE is shown in the below figure.
Figure 6.3: COE vs Mass Flow Rate of Fuel
As shown in the figure the COE increases with mass flow rate of fuel required per year. And it is
clear the mass flow rate has to be minimum.
$0.22
$0.22
$0.23
$0.23
$0.24
$0.24
$0.25
370000 380000 390000 400000 410000 420000 430000 440000 450000
CO
E
Mass Flow Rate of Fuel (MMBTU/yr)
COE vs Mass Flow rate of Fuel
COE vs Mass Flow rate of Fuel

57
Overall efficiency of Plant vs Cost of Electricity
The relationship between the overall efficiency and the COE is shown in the below figure.
Figure 6.4: COE vs Overall Efficiency
As shown above the COE increases when the efficiency is less and it is clear it is better to choose
better efficiency plant.
Moisture Content of Fuel vs COE
To determine the minimum cost of electricity we have to plot all the CoE against the mass flow
rates of the fuel. We hence infer that the minimum CoE is for the case where the inlet condition of the
steam are P=800psi and T=840 F.
0.19
0.2
0.21
0.22
0.23
0.24
0.25
0.26
0.2 0.22 0.24 0.26 0.28 0.3
Cost
of
Ele
ctri
cit
y,$/k
Wh
Plant Efficiency
Comparison of CoE and Plant Efficiency
MC_0
MC_20
MC_30
MC_40

58
The relationship between the Moisture Content of Fuel and the COE is shown in the below figure.
Table 6.5: COE vs Moisture Content of Fuel
The above figure shows that COE increases with respect to increase in Moisture Content of Air. So lower
the moisture content its better.
0.17
0.18
0.19
0.2
0.21
0.22
0.23
0.24
0.25
0.26
5000 6000 7000 8000 9000 10000
Cost
of
Ele
ctri
cit
y, C
oE
($/k
Wh
)
Mass Flow Rate of Fuel (lb/hr)
Mass flow rates vs CoE for Different Moisture Content
MC_0
MC_20
MC_30
MC_40

59
6.5 Trade Study
Following are the major components which have major contribution in plant cost and being used for trade
studies.
1. Steam Turbine
2. Combustors/ Boiler
3. Condenser
Table 6.9: Trade Study of Components
Steam Turbine Technical Specifications Decision
SVSS, Back Pressure
Condensing By Elliott
Ebara
50 kW- 2.6MWe
Inlet Pressure= 900 Psig
Inlet Temp= 900 F
Rentech
Rentech 3.0 MWe
Inlet Pressure 800Psi &
Temp= 850F
MARC 1( Modular
Arrangement Concept)
MAN Steam Turbines
2-3.5MWe
Inlet Pressure =870 Psi
Inlet Temp=842 F
Boilers
Rentech Boiler Outlet Condition
Pressure= 800 Psi & Temp
850 F
Rentech
Steam Condenser
Plate type –Alfa Laval
make
Shell & Tube Type
Shell & Tube Type -
Double Pipe Heat
Exchanger

60
Comments:
Rentech make of steam turbines are used for analysis because we are having technical and cost data for
these turbines.
Boiler make is Rentech and cost data has been provided by the instructor.
Steam condenser is selected based upon compact design, ease of maintenance.

61
7.1 Schedule
A Gantt chart showing the actual progress of the team is shown in figure 8.1. This Gantt chart helped
the team keep track of the amount of work for each phase of the project. The chart helped the team keep track of
the milestones and the deadlines to be met. The labor put in was in accordance with the requirements of the
chart. More time was spent on the more difficult tasks at hand.
Figure 7.1 Gantt chart showing team progress
The importance of meeting deadlines and staying on course with the plan was realized early on. Team
meetings were held every week and appropriate progress was made at every meeting. The minutes of the
meeting were recorded in the team notebook. The team notebook contains the research done by all team
members while also identifying the possible roadblocks and limitations as a team. An initial estimate of the time
required for the various phases of the project was drawn out and efforts were made to stick to the plan.
Whenever the team faced bottlenecks during the process, the team members helped each other out and ensured
that the schedule was followed accurately. Once a particular task was accomplished, the team consulted with
Dr. Trimble and asked for his review. This ensured that a task once completed did not require more time later
on.
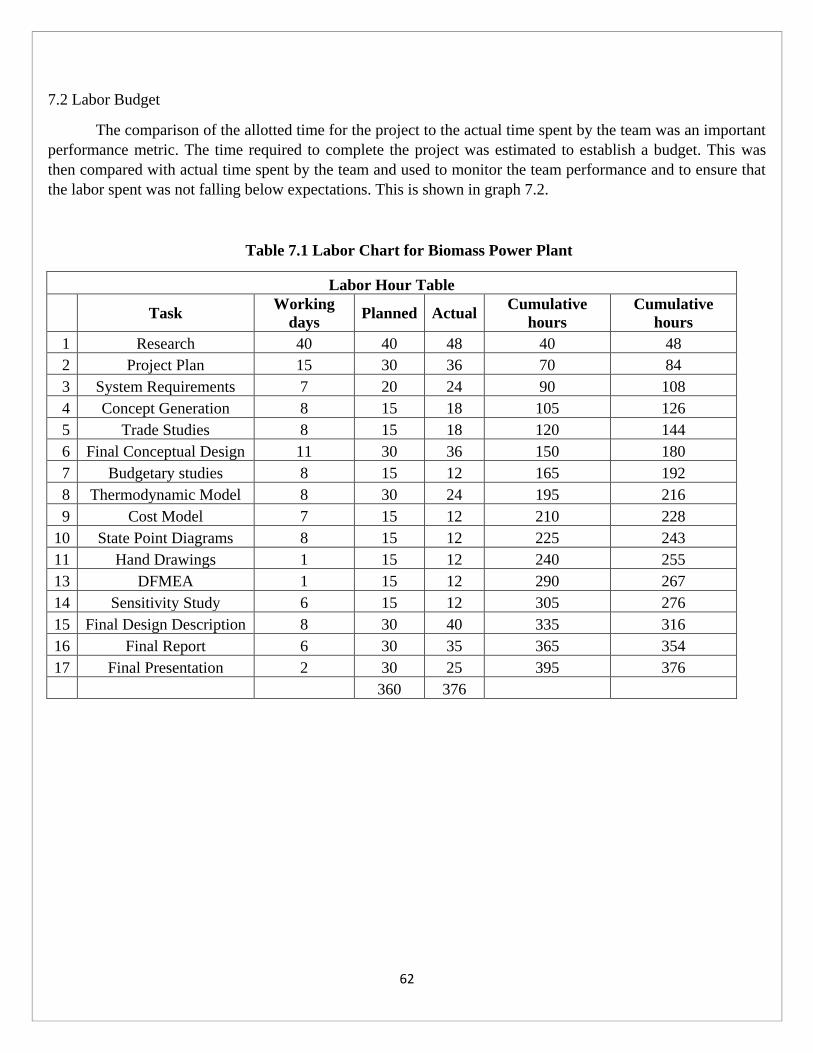
62
7.2 Labor Budget
The comparison of the allotted time for the project to the actual time spent by the team was an important
performance metric. The time required to complete the project was estimated to establish a budget. This was
then compared with actual time spent by the team and used to monitor the team performance and to ensure that
the labor spent was not falling below expectations. This is shown in graph 7.2.
Table 7.1 Labor Chart for Biomass Power Plant
Labor Hour Table
Task
Working
days Planned Actual
Cumulative
hours
Cumulative
hours
1 Research 40 40 48 40 48
2 Project Plan 15 30 36 70 84
3 System Requirements 7 20 24 90 108
4 Concept Generation 8 15 18 105 126
5 Trade Studies 8 15 18 120 144
6 Final Conceptual Design 11 30 36 150 180
7 Budgetary studies 8 15 12 165 192
8 Thermodynamic Model 8 30 24 195 216
9 Cost Model 7 15 12 210 228
10 State Point Diagrams 8 15 12 225 243
11 Hand Drawings 1 15 12 240 255
13 DFMEA 1 15 12 290 267
14 Sensitivity Study 6 15 12 305 276
15 Final Design Description 8 30 40 335 316
16 Final Report 6 30 35 365 354
17 Final Presentation 2 30 25 395 376
360 376
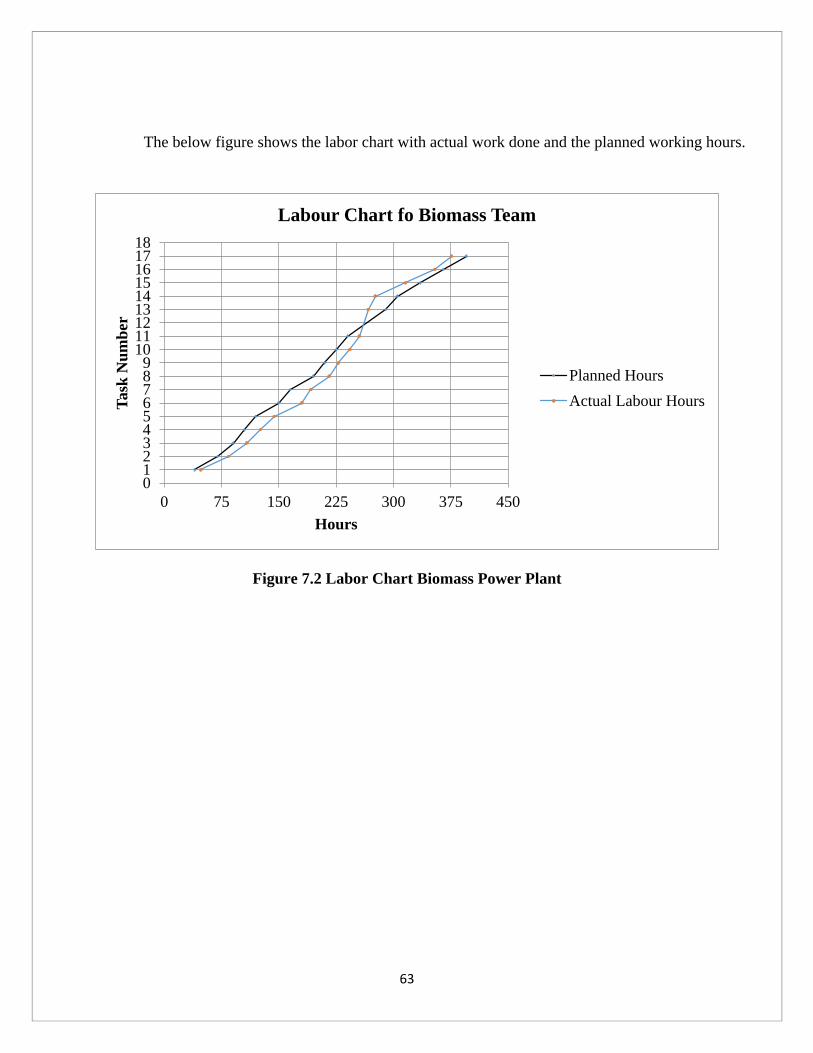
63
The below figure shows the labor chart with actual work done and the planned working hours.
Figure 7.2 Labor Chart Biomass Power Plant
0123456789
101112131415161718
0 75 150 225 300 375 450
Task
Nu
mb
er
Hours
Labour Chart fo Biomass Team
Planned Hours
Actual Labour Hours

64
8. Project Conclusion
The following conclusions were made by the design team based on analysis.
The cost of electricity was calculated to be $ 0.229/kWh
The rated output of the plant was 3MWe
Exhaust stack temperature was found to be 350 F.
Components selected in Preliminary Design are according to the Emission Standards specified in
appendix.
In final design, the dryer should be designed to bring moisture content of fuel to twenty percent
Based on fuel consumption calculation fuel storage area should be designed in final design to
accommodate 800,000 pounds of fuel.
Arrangement has to be done for proper waste water and ash disposal.
The team finished the project on 8th
May which was at par with the planned date. The labor budget also
was in line in with the planned budget. The team realized that teamwork was the key to success. The team also
learnt about how to do research on various topics. The team understood the importance of maintaining good
communication during the entire process quite early on in the project and established various methods to ensure
that every team member was well informed about the progress and their respective roles. The team also learnt
that unforeseen circumstances can often affect the project schedule and it is important that an appropriate
cushion time be provided in the project plan to compensate for the same.

65
9. Recommendation
The below are the main recommendations for the implementation of Biomass Power Plant.
The cost of electricity was found to be high compared to conventional methods of producing
electricity. The team therefore recommends that the customer consider increasing the capacity of
plant to about 100MWe as the capital cost would increase marginally but the cost of electricity
would reduce drastically.
The team also recommends installing the plant at a location where wood chips are easily
available in abundance and where easy disposal of waste water and ash is possible
More detailed analysis of turbine inlet condition could be done to obtain optimum plant
efficiency and lowest cost of electricity.
Action have to be taken when the failure of components is detected to minimize severity and
probability of the failure mode.

66
10. Appendices
10.1 Appendix for section 4. Requirement
National Ambient Air Quality Standards (NAAQS) table is shown below.
Table 10.1: Emission Standards
10.2 Appendix for DFMEA
The Probability of Failure rate is selected based on the below table.
Table 10.2: Probability of Failure (Reference)
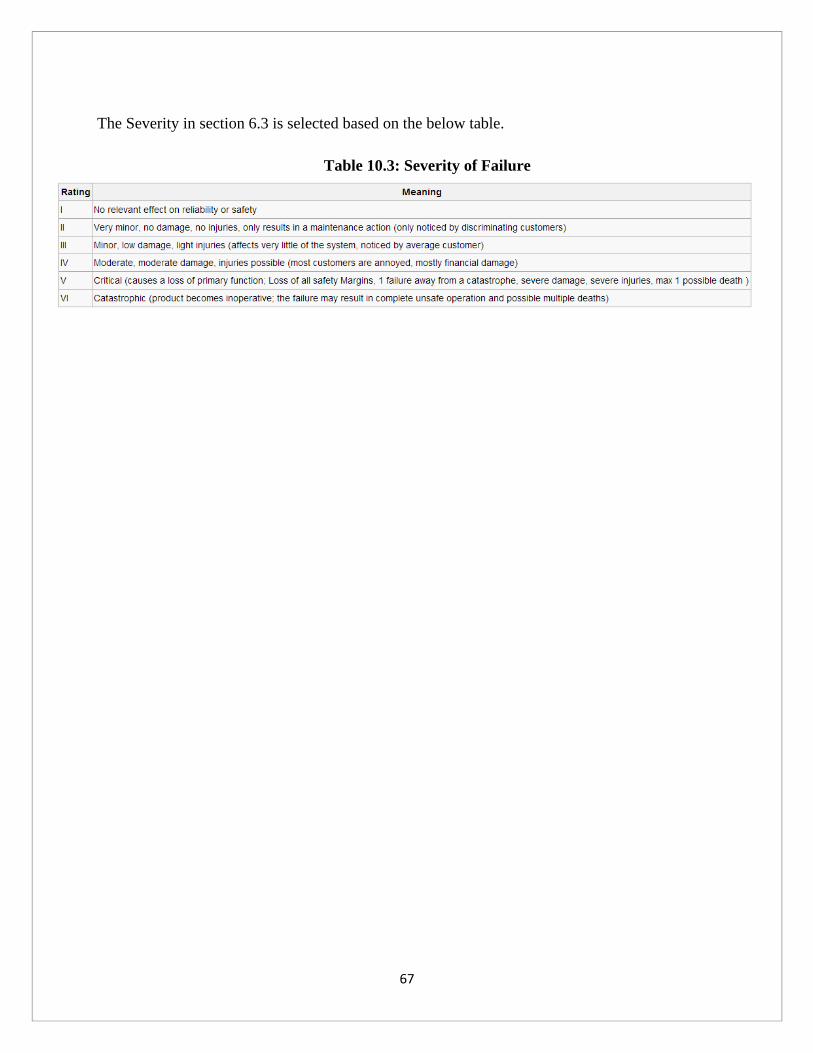
67
The Severity in section 6.3 is selected based on the below table.
Table 10.3: Severity of Failure