
FINAL REPORT - Baltic region...FINAL REPORT ANALYSIS OF PROJECTS IN 2007-2013 AND SETTING BASELINES...
156
FINAL REPORT ANALYSIS OF PROJECTS IN 2007-2013 AND SETTING BASELINES AND TARGETS FOR THE INDICATORS 2014-2020 Intended for Investitionsbank Schleswig-Holstein, Managing Authority of the Baltic Sea Region Programme 2007-2013 Reference Baltic Sea Region Programme: Analysis of projects in 2007-2013 and setting baselines and targets for the indicators 2014-2020 Date July 2015
Transcript of FINAL REPORT - Baltic region...FINAL REPORT ANALYSIS OF PROJECTS IN 2007-2013 AND SETTING BASELINES...

FINAL REPORT
ANALYSIS OF PROJECTS IN 2007-2013 AND
SETTING BASELINES AND TARGETS FOR THE
INDICATORS 2014-2020
Intended for
Investitionsbank Schleswig-Holstein, Managing Authority of the Baltic Sea Region
Programme 2007-2013
Reference
Baltic Sea Region Programme: Analysis of projects in 2007-2013 and setting
baselines and targets for the indicators 2014-2020
Date
July 2015

Analysis of projects in 2007-2013 and setting baselines and targets for the indicators 2014-2020 2

Analysis of projects in 2007-2013 and setting baselines and targets for the indicators 2014-2020 3
EXECUTIVE SUMMARY
Since the EU enlargement in 2004, the Baltic Sea region has increasingly become an area of great
importance within the European Union. The Baltic Sea Region Programme (BSRP) is one of 13
European transnational cooperation programmes (a financing tool), specifically contributing to the
implementation of the EU Strategy for the Baltic Sea Region (EUSBSR).1 The overall strategic
objective of the 2007-2013 BRSP has been “to strengthen the development towards a sustainable,
competitive and territorially integrated Baltic Sea region by connecting potentials over the
borders”2.With consideration to the Europe 2020 Strategy, four thematic priorities were set for the
2007-2013 BSRP: 1) Fostering innovations, 2) Internal and external accessibility, 3) Baltic Sea as
a common resource and 4) Attractive & competitive cities and regions. In May 2014, the
subsequent and forthcoming Baltic Sea Region Programme 2014-2020 was approved and the main
objective for the new period of BSRP 2014-2020 is to strengthen the integrated territorial
development and cooperation for a more innovative, better accessible and sustainable Baltic Sea
Region.
The Investitionsbank Schleswig-Holstein, appointed Managing Authority of the Baltic Sea Region
Programme 2007-2013, has assigned Ramböll Management Consulting, hereafter RMC, to carry
out a strategic evaluation of projects in the 2007-2013 BSRP. This strategic evaluation of the BSRP
2007-2014 involves an analysis of the project portfolio with regard to achieved results and
produced outputs as well as setting baselines for the qualitative indicators in the 2014-2020
Programme. Thus, the assignment consisted of two separate but yet coherent objectives:
Objective I: Analysis of the project portfolio of the 2007-2013 BSRP with regard to achieved
results and produced outputs
Objective II: Setting baselines for the qualitative indicators in the 2014-2020 BSRP
Ramböll‟s assignment has been divided into two parts. Part I is primarily focused on the first of the
two objectives, while the second objective has been addressed in Part II of the report. For the
analysis of the 2007-2013 BSRP project portfolio a particular focus has been put on the analysis
whether the achieved results were sustainable and of added value, on the durability of outputs,
and finally on the involvement of end-users by the respective projects building mainly on
qualitative elements. For the second objective, the main focus has been to develop a methodology
for assessing the development of the institutional capacity in the BSR at different points in time
through the development of baselines and targets for different dimensions of institutional capacity-
building.
Part I of strategic evaluation
The methodological approach for Part I has included the following elements: (1) Programme
overview and analysis of project portfolio, (2) selection of 15 projects from the 2007-2013 BSRP
for in-depth analysis, (3) Data collection involving desk-research and targeted interviews with
project partnership, end-users and target group(s) as well as Priority Area Coordinators (PACs)
and Horizontal Action Leaders (HALs), (4) Analysis of empirical material with regard to the three
main evaluation themes defined for the strategic evaluation. Overall, the analysis sought to
answer following main questions:
In how far are project outcomes used by the project partnership beyond the project lifetime
and which factors have facilitated the identified development?
How have current projects contributed to the institutional capacity-building in the Baltic Sea
region in selected thematic areas?
How did the 2007-2013 BRSP contribute to the (successful) implementation of the EUSBSR
and the EU2020 strategy?
1 European Commission (2009): European Union Strategy for the Baltic Sea Region 2 Baltic Sea Region Programme 2007-2013

Analysis of projects in 2007-2013 and setting baselines and targets for the indicators 2014-2020 4
The case studies show, in general, that the 15 projects have reached the main goals set for each
project respectively, findings based on interviews and outputs and results in final project reports.
The programme has resulted in durable outcomes such as for instance the formalisation of
networks, increased strategic importance of project theme within partnership organisations and
development of new concepts and tools applied by project partners and end-users. These
outcomes could also be seen as contributing to institutional capacity-building in the BSR. Through
the case studies, several good examples have been identified that is building institutional capacity
in the region.
The analysis show that the BSRP has contributed to both the EUBSR and the EU2020 by gathering
and mobilizing stakeholders from around the Baltic Sea Region, developing and transferring
knowledge, providing analyses and other evidence to guide policy processes, and creating strong
platforms for longer-term action. The strategic evaluation does however show that there are a
number of Programme features that currently hinder its contribution to EU Strategies.
The interim report (Part I of the strategic evaluation) was discussed by the Monitoring Committee
of the Baltic Sea Region Programme in Warsaw November 25th 2014 and was approved by the
Monitoring Committee in December 2014.
Part II of strategic evaluation
For Part II of the strategic evaluation, focus has been on setting baseline and targets for
qualitative indicators for the 2014-2020 BSRP. For the programming period 2014-2020 the EU
Commission proposes a stronger result orientation in the field of Structural Policy. Among others,
one requirement in this context is to define a result indicator for each specific objective of a
Cooperation Programme. Given the wide geographical coverage and range of topics covered by the
BSRP the result indicators developed is focused on capacity-building among the programmes
target group. In order to practically analyse the potential contribution of the future Interreg Baltic
Sea Region Cooperation Programme on capacity-building, five dimensions of institutional capacity
have been identified:
- Enhanced institutionalised knowledge and competence
- Improved governance structures and organizational set-up
- More efficient use of human and technical resources
- Better ability to attract new financial resources
- Increased capability to work in transnational environment
In order to use the result indicators as an effective instrument to monitor changes in the
programme region, the situation on institutional capacity needs to be captured at the beginning,
mid-term and at the end of the funding period. For the purpose of this, Ramböll has chosen a
methodological approach which allow for a repeatable and comparable procedure and analysis of
the situations at different points in time.
In order to define baselines and targets, a wide range of thematic experts of the Baltic Sea Region
have been addressed through an online-survey and additional interviews with the aim to reflect on
the results of the survey and fill remaining gaps. The experts represent the thematic fields that are
covered by the specific objectives and represent the eight EU-Member States as well as the three
partner countries Belarus, Norway and (parts of) Russia of the Cooperation Programme 2014-
2020.
The survey conducted resulted in indicated baselines and targets for different characteristics of the
five dimensions of institutional capacity-building. Through the complimentary interviews with
thematic experts, the indicated baselines and targets could be verified. The results from the
survey and interviews indicate that different dimensions of institutional capacity prove to be

Analysis of projects in 2007-2013 and setting baselines and targets for the indicators 2014-2020 5
challenging for the different specific objectives, even within the same priority area. Also, there are
regional differences in the institutional capacity in the Baltic Sea Region and therefore, different
measures are needed in different parts of the region. In order to assess the development of the
institutional capacity of the BSR, the online-survey will be repeated in 2018, 2020 and 2023. This
will allow for a structured follow-up on the development of the Baltic Sea region throughout and
after the funding period.
Part II of the strategic evaluation was presented on the Monitoring Committee of Baltic Sea Region
Programme meeting in Stockholm April 28th 2015 where it was discussed and approved by the
Monitoring Committee.

Analysis of projects in 2007-2013 and setting baselines and targets for the indicators 2014-2020 6
CONTENTS
EXECUTIVE SUMMARY 3
PART I OF STRATEGIC EVALUATION
EXECUTIVE SUMMARY 9 1. INTRODUCTION 14 1.1 Context of the strategic evaluation 14 1.2 Structure of Interim report 16 2. METHODOLOGY 17 2.1 Programme overview and analysis of project portfolio 17 2.2 Selection of projects for in-depth analysis 18 2.3 Data collection 19 2.4 Evaluation guide and focus of project analysis 19 3. ANALYSIS OF SELECTED PROJECTS IN THE 2007-2013 BSRP 21 4. USE OF PROJECT OUTCOMES BEYOND PROJECT LIFETIME 23 4.1 Overview of main project outcomes 23 4.2 Sustainable project outcomes within partnership organisations 24 4.3 Involvement of end-users – success factors 28 4.4 Durability of project outcomes outside project partnership 30 4.5 Contributing and hindering factors to creating durable outcomes 32 4.6 Pertinence and relevance of project investments 35 5. CAPACITY BUILDING OF ACTORS IN THE REGION 37 5.1 Enhanced institutionalised knowledge and competence 38 5.2 Improved governance structures and organisational set-up 40 5.3 More efficient use of human and technical resources 41 5.4 Better ability to attract new financial resources 43 5.5 Increased capability to work in transnational environment 45 5.6 Differences in type of capacity building based on priority theme 47 6. CONTRIBUTION OF THE BSRP TO EUROPEAN STRATEGIES 52 6.1 Relation and Contribution to the EUBSR and EU2020 Strategy 52 6.2 Importance of the BSR Programme in Relation to other Funding Instruments 54 7. CONCLUSIONS AND RECOMMENDATIONS 56 7.1 Conclusions 56 7.2 Recommendations 60 ANNEX 1 CRITICAL REFLECTION OF THE ANALYSIS 63 ANNEX 2 LIST OF INTERVIEWEES 64 ANNEX 3 INTERVIEW GUIDELINES 68 ANNEX 4 BIBLIOGRAPHY 71
PART II OF STRATEGIC EVALUATION
EXECUTIVE SUMMARY 74 1. INTRODUCTION 80 1.1 The context of the strategic evaluation 80 1.2 Structure of final report 81

Analysis of projects in 2007-2013 and setting baselines and targets for the indicators 2014-2020 7
2. METHODOLOGY 82 2.1 Survey 83 2.2 Interviews 85 3. RESULTS OF THE ONLINE-SURVEY WITH THEMATIC EXPERTS 87 3.1 Specific objective 1.1: Research and innovation infrastructure 87 3.2 Specific objective 1.2: Smart specialisation 91 3.3 Specific objective 1.3: Non-technological innovation 95 3.4 Specific objective 2.1: Clear waters 99 3.5 Specific objective 2.2: Renewable energy 103 3.6 Specific objective 2.3: Energy efficiency 107 3.7 Specific objective 2.4: Resource-efficient blue growth 111 3.8 Specific objective 3.1: Interoperability of transport modes 116 3.9 Specific objective 3.2: Accessibility of remote areas and areas affected by
demographic change 120 3.10 Specific objective 3.3: Maritime safety 124 3.11 Specific objective 3.4: Environmentally friendly shipping 129 3.12 Specific objective 3.5: Environmentally friendly urban mobility 133 APPENDIX 1 SUPPLEMENTARY DATA FROM SURVEY 137 APPENDIX 2 LIST OF INTERVIEWED EXPERTS 156

Analysis of projects in 2007-2013 and setting baselines and targets for the indicators 2014-2020 8
Intended for
Investitionsbank Schleswig-Holstein, Managing Authority of the Baltic Sea Region
Programme 2007-2013
Reference
Baltic Sea Region Programme: Analysis of projects in 2007-2013 and setting
baselines and targets for the indicators 2014-2020
Date
April 2015
PART I
ANALYSIS OF PROJECTS IN 2007-
2013 AND CONTRIBUTION TO
EU2020 AND EUBSR STRATEGIES

Analysis of projects in 2007-2013 and setting baselines and targets for the indicators 2014-2020 9
EXECUTIVE SUMMARY
Since the EU enlargement in 2004, the Baltic Sea region has increasingly become an area of great
importance within the European Union. The Baltic Sea Region Programme (BSRP) is one of 13
European transnational cooperation programmes (a financing tool), specifically contributing to the
implementation of the EU Strategy for the Baltic Sea Region (EUSBSR). Thereby, the EU has
established a comprehensive strategy, covering several EU policies, targeted at a „macro-region‟.3
The overall strategic objective of the 2007-2013 BRSP has been “to strengthen the development
towards a sustainable, competitive and territorially integrated Baltic Sea region by connecting
potentials over the borders”4.With consideration to the Europe 2020 Strategy, four thematic
priorities were set for the 2007-2013 BSRP: 1) Fostering innovations, 2) Internal and external
accessibility, 3) Baltic Sea as a common resource and 4) Attractive & competitive cities and
regions (however the 4th priority has not been in focus of this interim report). In May 2014, the
subsequent and forthcoming Baltic Sea Region Programme 2014-2020 was approved and the main
objective for the new period of BSRP 2014-2020 is to strengthen the integrated territorial
development and cooperation for a more innovative, better accessible and sustainable Baltic Sea
Region.
The Investitionsbank Schleswig-Holstein, appointed Managing Authority of the Baltic Sea Region
Programme 2007-2013, has assigned Ramböll Management Consulting, hereafter RMC, to carry
out a strategic evaluation of projects in the 2007-2013 BSRP. This strategic evaluation of the BSRP
2007-2014 involves an analysis of the project portfolio with regard to achieved results and
produced outputs as well as setting baselines for the qualitative indicators in the 2014-2020
Programme. Thus, the assignment consisted of two separate but yet coherent objectives:
Objective I: Analysis of the project portfolio of the 2007-2013 BSRP with regard to achieved
results and produced outputs
Objective II: Setting baselines for the qualitative indicators in the 2014-2020 BSRP
This interim report focuses solely on the first objective relating to the analysis of selected projects
of the 2007-2013 BSRP. The second objective on setting the baseline for qualitative indicators in
the 2014-2020 programme is provided by RMC in a background paper to the Interim report (15
October 2014).
For the analysis of the 2007-2013 BSRP project portfolio a particular focus has been put on the
analysis whether the achieved results were sustainable and of added value, on the durability of
outputs, and finally on the involvement of end-users by the respective projects building mainly on
qualitative elements. The assignment was to identify success factors, with a particular focus on the
sustainability of outputs, contribution to capacity-building in the BSR and the contribution of the
2007-2013 BSRP to the EUBSR and EU2020 strategies. The objective has primarily been to
improve the understanding of the (successful) interventions rather than verifying that individual
project or overall Programme goals have been met.
The methodological approach has included the following elements: (1) Programme overview and
analysis of project portfolio (all 90 projects receiving funding), (2) selection of 15 projects from
the 2007-2013 BSRP for in-depth analysis, (3) Data collection involving primarily desk-research of
project- and BSRP documentation and targeted interviews with project partnership, end-users and
target group(s) as well as Priority Area Coordinators (PACs) and Horizontal Action Leaders (HALs),
(4) Analysis of empirical material with regard to the three main evaluation themes defined for the
strategic evaluation.
The main methods for data collection has primarily been the conduction of more than 100
interviews with relevant stakeholders including representatives of the Programme management
3 European Commission (2009): European Union Strategy for the Baltic Sea Region 4 Baltic Sea Region Programme 2007-2013

Analysis of projects in 2007-2013 and setting baselines and targets for the indicators 2014-2020 10
bodies and the European Commission as well as lead partners, project partners, end-users and
target group(s).The case studies also withheld a thorough desk research of important
documentation related to each case, such as final and interim reports. In regards to evaluate the
Programme‟s and the projects relation to the EUBSR and the EU2020, targeted interviews with
PACs and HALs were conducted. The aim was primarily to better understand the BSRP‟s
contribution to the EUSBSR and to the EU2020. Overall, the analysis was seeking answers to three
main themes of questions:
In how far are project outcomes used by the project partnership beyond the project lifetime
and which factors have facilitated the identified development?
How have current projects contributed to the institutional capacity-building in the Baltic Sea
region in selected thematic areas?
How did the 2007-2013 BRSP contribute to the (successful) implementation of the EUSBSR
and the EU2020 strategy?
Conclusions
The case studies show, in general, that the 15 projects have reached the main goals set for each
project respectively, findings based on interviews and outputs and results in final project reports.
Further, the analysis made the following findings:
Regarding the particular focus on the sustainability of outputs: The most frequent types of
sustainable outcomes in the sense that the prerequisites for the continuation of outcomes are for
instance the formalisation of networks and activities after project completion, increased strategic
importance of project theme within partnership organisations and development of new concepts
and tools applied by project partners. The main types of project outcomes and solutions for end-
users and target group have been identified such as utilisation of tools and methods developed
within BSRP projects and input for future legislation, policy and investments, affecting long-term
strategies of private firms. Since the end-users and target groups varies between projects, ranging
from private companies to regional or national decision-making bodies and authorities, industry
associations, higher educational bodies, etc. in general, end-users representing wider target
group(s) have not been involved in the initial planning and formation of the projects analysed. The
main success factors for securing a constructive involvement of end-users in the projects have
been for example to involve end-users early on in the project, engaging them in formulating
project goals and identifying needs and clearly defined incentives for industry participation in the
sense of having a clear and attractive offer towards industry and involve competencies in the
project with great insight and knowledge on end-users needs.
In the context of the sustainability of outputs the issue of relevance and pertinence of physical
investments has also been analysed. The result shows that four out of 15 projects have pursued
an investment in technical equipment deemed necessary for the completion of projects. In
general, the investments made within the four projects have contributed to the realisation of
project goals and are regarded as being necessary for the completion of the projects.
Regarding the contribution to capacity-building in the BSR: The case studies clarified three
main project outcomes leading to enhanced institutionalised knowledge and competence:
Knowledge is made accessible through manuals, guidelines etc. where the information and
format is adapted to the end-users taking part of it, making it useful.
Making guidelines, manuals etc. is also a way of making knowledge obtained within the project
used after project completion.
The forming of a structured and established network that continues working together with the
core issue after project completion.
The development of guidelines is a big part of enhancing institutionalized knowledge and
competence for projects. However, the guidelines differ in the sense of who they are directed at,

Analysis of projects in 2007-2013 and setting baselines and targets for the indicators 2014-2020 11
depending on the end-users of the different projects. Projects aiming at improving internal and
external accessibility, direct their reports, guidelines etc. to investors to a higher degree than
other projects. Regarding the management of the Baltic Sea as a common resource, the projects
direct their reports and guidelines to policymakers to a higher extent.
Among the cases there are several good examples where both technical solutions and ways of
cooperating for more efficient use of technical and human resources, are developed within projects
focusing on innovation and management of the Baltic Sea as a common resource. On the other
hand, for projects dealing with improving internal and external accessibility this dimension of
capacity building knowledge and networking have been more crucial for project outcomes.
All projects have increased the partners‟ capability to work in a transnational environment.
Through the making of contact with institutions/persons in other countries in the relevant thematic
field work in a transnational environment is strengthened both during the project time and after its
completion as well. Participating in the projects has, as an effect, made cooperation across borders
easier. The forming of transnational networks this dimension has for instance given new
perspectives on borders (regional, national) in infrastructure planning.
Regarding the contribution of the 2007-2013 BSRP to the EUBSR and EU2020 strategies:
The analysis show that the BSRP has contributed to both the EUBSR and the EU2020 by gathering
and mobilizing stakeholders from around the Baltic Sea Region, developing and transferring
knowledge, providing analyses and other evidence to guide policy processes, and creating strong
platforms for longer-term action. These activities are viewed as initial contributions or first steps
towards realizing the longer-term, more ambitious goals of the EU Strategies. However, the BSRP
has clearer, more direct links and contributions to the EUSBSR than the EU2020 Strategy.
Although there are efforts to ensure that there are clear linkages between flagship projects, the
objectives of the PA/HAs, and the (two) EU Strategies, it is difficult to follow the connection
between (relatively small) flagship projects and the ambitious objectives/targets that currently
exist for the PA/HAs. The BSRP is viewed as a key funding instrument because of its project and
seed money investments, and because of the strategic links that the BSR Programme Secretariat
has developed with PACs and HALs – helping ensure that investments have strategic relevance to
the EUSBSR. Funds and political backing from (primarily) national sources are of equal importance
to addressing the objectives of the EUSBSR. It is important that national governments are
committed both to supporting/engaging in project activities and integrating project results into
policy processes.
Although the BSRP provides important contributions to the EUSBSR (and indirectly to EU2020)
through its strategic-level dialogue with PACs/HALs, project and seed funding, and project results,
there are a number of Programme features that currently hinder its contribution to EU Strategies.
These features include the limited project timeframes, the lack of possibilities to invest in
transnational innovation activities (with more involvement of business), administrative procedures
and requirements, and limitations to involving partners outside of the eight EU member countries.
RMC’s recommendations for the future
Taking into account the results of the analysis RMC proposes a number of recommendations
regarding both the overall Programme level serving as input for the 2014-2020 BSRP as well as
serving as basis for formation of individual future projects within the Programme.
RMC‟s main overarching recommendations on how to facilitate sustainable outcomes are the
following:
Promote efforts safeguarding sustainable outcomes of project
Make the most of utilisation of project outcomes beyond partnership
Emphasize the added value of BSRP involvement towards academia

Analysis of projects in 2007-2013 and setting baselines and targets for the indicators 2014-2020 12
Create incentives for industry involvement
Facilitate an effective project organisation
Secure a close cooperation with strategic projects
RMC‟s recommendations on the continuation of Capacity building of actors in the region are:
Projects should work on adapting developed documentation (guidelines etc) to the relevant
end-users or target group
Develop activities to form close cooperation and focus on committing parties to work together
Look into what technical solutions could be relevant to save time and human resources
Improve the ability to attract new financial resources
Increase the partners‟ capability to work transnationally projects should facilitate partners‟
ability to make contact with relevant partners at institutions in other BSR countries
RMC‟s recommendations concerning the contribution to European Strategies are:
Develop a more structured exchange between PACs/HALs (and their Steering Committees) and
the BSR Programme Secretariat
Support the development of “effect logics” which can help projects communicate how they
contribute to realizing the strategic objectives
Adopt more flexible approaches to allow adjustments in project partnerships and budget
allocations during the project implementation phase
Adopt new regulations to foster increased business involvement and transnational innovation
activities
Leverage the BSRP Monitoring Committee to reinforce efforts to communicate and integrate
project results into policy processes

Analysis of projects in 2007-2013 and setting baselines and targets for the indicators 2014-2020 13
CONTENTS OF PART I
PART I OF STRATEGIC EVALUATION
EXECUTIVE SUMMARY 9 1. INTRODUCTION 14 1.1 Context of the strategic evaluation 14 1.2 Structure of Interim report 16 2. METHODOLOGY 17 2.1 Programme overview and analysis of project portfolio 17 2.2 Selection of projects for in-depth analysis 18 2.3 Data collection 19 2.4 Evaluation guide and focus of project analysis 19 3. ANALYSIS OF SELECTED PROJECTS IN THE 2007-2013 BSRP 21 4. USE OF PROJECT OUTCOMES BEYOND PROJECT LIFETIME 23 4.1 Overview of main project outcomes 23 4.2 Sustainable project outcomes within partnership organisations 24 4.3 Involvement of end-users – success factors 28 4.4 Durability of project outcomes outside project partnership 30 4.5 Contributing and hindering factors to creating durable outcomes 32 4.6 Pertinence and relevance of project investments 35 5. CAPACITY BUILDING OF ACTORS IN THE REGION 37 5.1 Enhanced institutionalised knowledge and competence 38 5.2 Improved governance structures and organisational set-up 40 5.3 More efficient use of human and technical resources 41 5.4 Better ability to attract new financial resources 43 5.5 Increased capability to work in transnational environment 45 5.6 Differences in type of capacity building based on priority theme 47 6. CONTRIBUTION OF THE BSRP TO EUROPEAN STRATEGIES 52 6.1 Relation and Contribution to the EUBSR and EU2020 Strategy 52 6.2 Importance of the BSR Programme in Relation to other Funding Instruments 54 7. CONCLUSIONS AND RECOMMENDATIONS 56 7.1 Conclusions 56 7.2 Recommendations 60 ANNEX 1 CRITICAL REFLECTION OF THE ANALYSIS 63 ANNEX 2 LIST OF INTERVIEWEES 64 ANNEX 3 INTERVIEW GUIDELINES 68 ANNEX 4 BIBLIOGRAPHY 71
TABLES
Table 1 Funds committed and projects approved ................................................................... 15 Table 2 Selected projects for in-depth case studies ............................................................... 18 Table 3 Main thematic evaluation questions .......................................................................... 20 Table 4 Understanding of main beneficiary types of the BSRP ................................................. 21 Table 5 Overview of sustainable outcome categories within and outside partnerships (examples in
brackets) ......................................................................................................................... 24 Table 6 Type of investments made within selected projects .................................................... 35 Table 7 - Main and secondary effects of projects on the five capacity-building dimensions .......... 38 Table 8 Projects are divided into the relevant priorities of the BSR Programme 2007-2013 ......... 47 Table 9: Estimated percent of total funding for projects/activities within the scope of PAs/HAs ... 54

Analysis of projects in 2007-2013 and setting baselines and targets for the indicators 2014-2020 14
1. INTRODUCTION
The Investitionsbank Schleswig-Holstein, appointed Managing Authority of the Baltic Sea Region
Programme 2007-2013, has assigned Ramböll Management Consulting, hereafter RMC, to carry
out a strategic evaluation of projects in the 2007-2013 Baltic Sea Region Programme (BSRP). The
assignment consists of two separate but yet coherent objectives:
Objective I: Analysis of the project portfolio of the 2007-2013 BSRP with regard to achieved
results and produced outputs
Objective II: Setting baselines for the qualitative indicators in the 2014-2020 BSRP
This interim report concerns primarily the first objective including an analysis of the 2007-2013
program project portfolio. The second objective on setting the baseline for qualitative indicators in
the 2014-2020 programme is provided in a background paper to the Interim report dating 15
October 2014.
1.1 Context of the strategic evaluation
1.1.1 Policy context
Since the EU enlargement in 2004, the area of the BSRP has increasingly become an area of great
importance within the European Union. With its population of 147 million people and a share of
almost 30 percent of the EU‟s total gross domestic product, the Baltic Sea Region (BSR) is a major
economic actor both on the European level and with regard to the central Russian market. The
BSRP is one of 13 European transnational cooperation programmes, specifically contributing to the
implementation of the EU Strategy for the Baltic Sea Region (EUSBSR) adopted in October 2009
by the European Council. Thereby, the European Union established its first comprehensive
strategy, covering several EU policies, targeted at a „macro-region‟.5 The overall strategic objective
of the 2007-2013 BSRP has been “to strengthen the development towards a sustainable,
competitive and territorially integrated Baltic Sea region by connecting potentials over the
borders.”6 Under consideration of the Europe 2020 Strategy, four thematic priorities were set for
the 2007-2013 BSRP:
1. Fostering innovations
2. Internal and external accessibility
3. Baltic Sea as a common resource
4. Attractive & competitive cities and regions7
Funding of the BSRP originates from the European Regional Development Fund (ERDF), from
national Norwegian sources and the European Neighbourhood Programme Instrument (ENPI). The
financial support available for 2007-2013 amounted to 208 million Euros from the ERDF, 8.8
million Euros from the ENPI and 6 million Euros from Norway (total 222.8 million Euros, plus
national co-financing). Of these funds, 215 million Euros has been committed to 90 projects, of
which 9 is classified as strategic projects in turn expected to address vital challenges for the
development of the BSR.8
5 European Commission (2009): European Union Strategy for the Baltic Sea Region 6 Baltic Sea Region Programme 2007-2013 7 The fourth thematic priority ‟Attractive and competitive cities and regions is not of focus in this Interim Report. 8 Baltic Sea Region Programme: Fact Sheet (updated 26 feb 2013)

Analysis of projects in 2007-2013 and setting baselines and targets for the indicators 2014-2020 15
Table 1 Funds committed and projects approved
Funds committed to projects (ERDF+ENPI+NO,
million EUR)
Number of approved projects (of which strategic
projects)
Priority 1 - Fostering innovations 59,4 28 (3)
Priority 2 - Internal and external accessibility
44,5 18 (2)
Priority 3 - Baltic Sea as a common resource
64,0 21 (3)
Priority 4 - Attractive & competitive cities and regions
47,2 23 (1)
TOTAL 215,1 90 (9)
Source: Baltic Sea Region Programme: Fact Sheet (updated 26 feb 2013)
On the 14th of May 2014, the 2014-2020 BSRP was approved by the Joint Programming
Committee. Within this Programme, the ERDF will provide EUR 263.8 million of funding with
additional funding from the European Neighbourhood Instrument (ENI) and Norway.9 The main
objective for the 2014-2020 BSRP is “to strengthen the integrated territorial development and
cooperation for a more innovative, better accessible and sustainable Baltic Sea Region”.
1.1.2 Evaluation context
As stated above, the strategic evaluation of the BSRP 2007-2014 involves an analysis of the
project portfolio with regard to achieved results and produced outputs as well as setting baselines
for the qualitative indicators in the 2014-2020 Programme. The Interim report focuses solely on
the first objective relating to the analysis of selected projects of the 2007-2013 BSRP.
For the analysis of the 2007-2013 BSRP project portfolio a particular focus is put on the
analysis whether the achieved results were sustainable and of added value, on the durability of
outputs, and finally on the involvement of end-users by the respective projects building mainly on
qualitative elements. Focus of the analysis is partly to identify success factors in creating
sustainable outcomes in the region. The strategic evaluation of the BSRP thereby differs from
traditional ex-post evaluations in the sense that the focus is also on the formative (sustainability of
results and best practice solutions) rather than merely on the strictly summative (assessment of
achieved results and output) aspects of the programme. Through this approach, the objective is
primarily to improve the understanding of the (successful) interventions rather than verifying that
individual project or overall Programme goals have been met.
For setting baselines for the qualitative indicators in the 2014-2020 BSRP, an analysis of
the 2007-2013 BSRP outcomes has served as input to the establishment of baselines and targets.
The baselines describe the status quo and gaps in selected fields in the region and the contribution
of the 2007-2013 BSRP projects to these. This approach is based on the assumption that the
2014-2020 BSRP will build on the achievements of its predecessor so that the outcome/impact of
the current Programme can methodologically be attributed to the future Programme‟s expected
outcome/impact in the region An analysis of the 90 projects from the 2007-2013 BSRP funding
period and their contribution to capacity-building has been carried out, verifying the importance
and relevance of this approach. In order to practically analyse the potential contribution of the
programme on capacity-building, the concept of institutional capacity has been further specified.
Different dimensions of capacity-building have been explored and, based on the potential influence
of the BSRP on funded projects as well as on an understanding of central elements needed to
improve institutional capacity, five dimensions have been identified. The results are provided in a
background paper on setting baselines for the qualitative indicators in the 2014-2020 BSRP.
9 Baltic Sea Region Programme 2014-2020 Fact Sheet (http://eu.baltic.net/redaktion/download.php?id=2518&type=file)

Analysis of projects in 2007-2013 and setting baselines and targets for the indicators 2014-2020 16
1.2 Structure of Interim report
After this introduction the report explains in Chapter 2 the methodological approach of the
analysis. In Chapter 3 the process of the analysis is further being described including an outline for
the process. The following chapters deal with the analysis: Use of the project outcomes beyond
project lifetime (Chapter 4), Capacity building of the actors in the regions (Chapter 5) and
Contribution of the BSRP to the European strategies (Chapter 6). In the concluding Chapter 7, the
final conclusions are elaborated and the second part that chapter RMC is proposing our
recommendations for further development. In Annex 1 gives RMC its critical reflections on the
analysis, in Annex 2 List of interviewees, Annex 3 Interview guidelines and finally Annex 4 is the
Bibliography.

Analysis of projects in 2007-2013 and setting baselines and targets for the indicators 2014-2020 17
2. METHODOLOGY
In the following chapter, the applied methodology for the strategic evaluation of the 2007-2013
BSRP is presented, focusing solely on the analysis of the 2007-2013 BSRP project portfolio. As
indicated in previous sections, the strategic evaluation of the 2007-2013 BSRP put emphasis on
achieved results and produced outputs, with a particular focus on the sustainability of outputs,
contribution to capacity-building in the BSR and the contribution of the 2007-2013 BSRP to the
EUBSR and EU2020 strategies. The analytical framework consists of several subsequent steps.
These steps can be summarised as in the following:
Programme overview and analysis of project portfolio (all 90 projects receiving funding)
Selection of 15 projects from the 2007-2013 BSRP for in-depth analysis
Data collection involving primarily desk-research of project- and BSRP documentation and
targeted interviews with project partnership, end-users and target group(s) as well as Priority
Area Coordinators (PACs) and Horizontal Action Leaders (HALs)
Analysis of empirical material with regard to the three main evaluation themes defined for the
strategic evaluation
The subsequent steps of the analysis can be illustrated as in the figure below. Each step is further
developed in the following sections.
Figure 1 Interim report - overview of main methodological steps
2.1 Programme overview and analysis of project portfolio
The first step for the analysis of the 2007-2013 BSRP was a systematic mapping of the entire
project portfolio including all 90 projects resulting in a programme overview. For this purpose,
data from the BSRP project database and final and interim reports of the projects were used.10 It
was important to structure the projects in a framework to enable an overview covering all
significant parameters of the projects so that all types of projects were covered in the next phase
of analysis (i.e. in-depth case studies). A number of pre-defined parameters were used to
structure the project catalogue for this purpose:
Thematic priority of projects corresponding to both the 2007-2013 and 2014-2014
BSRP
10 http://eu.baltic.net/Project_Database.5308.html

Analysis of projects in 2007-2013 and setting baselines and targets for the indicators 2014-2020 18
Geography (of lead partner)
Budget allocated for the project (including investments in projects)
Indication of flagship project
Project end-date
Overarching results/outputs as stated in project reports
The 2007-2013 BSRP was first summarised in the form of a “programme fiche”, visualising the
profile of the Programme, activities funded by the Programme and their dispersion based upon
thematic priority group, geography (lead partner, partner country/region), budget allocation,
application call and strategic importance of project.
As part of the Programme overview, an analysis and systematic review of the project portfolio was
performed with focus on main outputs, common and priority specific results and outcomes
stemming from the final or interim progress reports of each project. This part of the evaluation
was mainly of summative character and served as a basis primarily for setting baselines for the
qualitative indicators in the 2014-2020 BSRP. All of the above listed data was summarised thereby
providing us with a project overview needed to make a structured project selection for further
analysis, described in more detail below.
2.2 Selection of projects for in-depth analysis
Based on the programme overview and the overarching analysis of the project portfolio, 17
projects funded by the 2007-2013 BSRP were selected for in-depth analysis in close cooperation
with the MA/JTS. Selected projects were chosen on the merits of being representative for the BSRP
as a whole in accordance to the parameters defined above, relating to thematic priority of both the
2007-2013 and 2014-2020 BSRP; lead partner country; flagship projects, budget and end-date.
Out of the 17 projects chosen, 15 were selected for in-depth case studies after a first round of
interviews with primarily project leaders of each project.
The 15 projects serving as the base for the case studies are presented below together with
associated thematic priority and specific objective in the 2007-2013 and 2014-2020 BSRP
respectively.
Table 2 Selected projects for in-depth case studies
Project name Programme Priority 2007-2013
Programme Specific Objective 2014-2020
Science Link P1: Fostering Innovations
1.1 Research and innovation infrastructures
StarDust P1: Fostering Innovations
1.2 Smart specialisation
Best Agers P1: Fostering Innovations
1.3 Non-technological innovation
Longlife P1: Fostering Innovations
2.3 Energy Efficiency
REMOWE P1: Fostering Innovations
2.2 Renewable energy
TransBaltic P2: Internal and external accessibility
3.1 Interoperability of transport modes
EWTC II P2: Internal and external accessibility
3.1 Interoperability of transport modes
BGLC P2: Internal and external accessibility
3.2 Accessibility of remote areas and areas affected by demographic change
EfficienSea P2: Internal and external accessibility
3.3 Maritime safety
BSR InnoShip P2: Internal and external accessibility
3.4 Environmentally friendly shipping
Baltic Biogas Bus P2: Internal and external accessibility
3.5 Environmentally friendly urban mobility
Aquabest P3: Baltic Sea as a common resource
2.4 Resource-efficient blue growth
Submariner P3: Baltic Sea as a common resource
2.4 Resource-efficient blue growth

Analysis of projects in 2007-2013 and setting baselines and targets for the indicators 2014-2020 19
CHEMsea P3: Baltic Sea as a common resource
2.1 Clear waters
PURE P3: Baltic Sea as a common resource
2.1 Clear waters
2.3 Data collection
The main methods for data collection have been desk-based research and, primarily, interviews
with relevant stakeholders including representatives of the Programme management bodies and
the European Commission as well as lead partners, project partners, end-users and target
group(s). Approximately 5-7 targeted interviews were conducted for each project. In the first
phase, interviews were held with project leaders and a selection of project partners, from which
end-users and target group(s) were identified. The case studies also withheld a thorough desk
research of important documentation related to each case, such as final and interim reports. In
regards to evaluate the Programme‟s and the projects relation to the EUBSR and the EU2020,
targeted interviews with Priority Area Coordinators (PACs) and Horizontal Action Leaders (HALs)
were conducted. The aim was primarily to better understand the BSRP‟s contribution to the EU
Strategy for the EUSBSR and to the EU2020.
The main data collection methods for the analysis of projects in the 2007-2013 BSRP can be
summarised as follows:
A total of 17 interviews with lead partners representing the initial projects chosen for in-
depth analysis
37 interviews with project partners representing the 15 projects chosen for case studies
A total of 37 interviews with end-users and target group(s) of the 15 projects
respectively
A total of 12 interviews with PACs and HALs
Desk research including final and progress reports of selected projects; other
outputs/publications and reports of finalised projects; Final evaluation report of external
strategic evaluation 2010/2011, etc.
The interviews serving as the main empirical material for the analysis have been conducted
between August-October 2014.
2.4 Evaluation guide and focus of project analysis
The case studies took a summative as well as formative approach in the sense that the focus laid
both on project outcomes and their sustainability, as well as lessons learned to serve as input for
the 2014-2020 BSRP. The methodological perspective for conducting the in-depth analysis, guiding
the analytical framework and data collection, was a theory-based approach. In essence, theory-
based evaluations are to be understood as the explication of a theory or model of how a
programme or policy causes the intended or observed outcomes and an evaluation that is at least
partly guided by this model. One central aspect of taking such an approach lies in the view that
financial resources within programmes such as the BSRP should be additional and give room to try
new approaches, methods and instruments in regional development, growth and policy. They
should not to be invested in „regular‟ activities, but allow for exploratory projects.11 Therefore we
must understand the "why it works" beyond the "does it work”.12 Without an answer to this
question “little can be said about the worth of the programme, nor can advice be provided about
future directions”.13 Therefore, the rationale behind applying this view in evaluations is to move
away from focusing solely on describing outcomes of an intervention, to explaining both what is
realised and how the suggested outcome was realised (and if the change is sustainable) in order to
repeat successful interventions.
11 Brulin et al (2013) 12 Riché, (2012) 13 Mayne, (1999)

Analysis of projects in 2007-2013 and setting baselines and targets for the indicators 2014-2020 20
This perspective resting on a theory-based approach has guided the analysis of the 15 projects in
the 2007-2013 BSRP, with the main focus of identifying type of solutions with a particularly
high/durable impact to the region and describing why such solutions bears a particularly high
impact. The main thematic evaluation questions guiding the analysis are provided below.
Table 3 Main thematic evaluation questions14
Theme 1: Use of
project outcomes
beyond project
lifetime
1.1. In how far are project outcomes used/promoted by the actual
project partnership beyond the project lifetime? Are project
outcomes taken up in the region and applied outside the
partnership, i.e. are they actually durable and used by relevant
actors?
1.2 Were project investments pertinent, i.e. did they contribute to
solving issues tackled by the projects? Was it justified to implement
them in a transnational cooperation project?
1.3 Which types of end-users and/or multipliers of the project
outcomes can be identified? Which are the main factors having
positively influenced the involvement of end-users and take-over of
project outcomes and solutions?
Theme 2: Capacity-building of actors in the region
2.1 How have current projects contributed to the institutional
capacity-building in the region in selected thematic areas?
a) Enhanced institutionalised knowledge and competence;
b) Improved governance structures and organisational set-up;
c) More efficient use of human and technical resources (databases,
technical solutions, small infrastructure etc.);
d) Better ability to attract new financial resources;
e) Increased capability to work in transnational environment.
Theme 3: Contribution of the Baltic Sea Region Programme to the EU Strategy for the Baltic Sea Region
and to the Europe 2020 Strategy
3.1 How did the Programme contribute to the (successful)
implementation of the EU Strategy for the Baltic Sea Region
(EUSBSR)?
3.2 How did the Programme contribute to the (successful)
implementation of the Europe 2020 Strategy?
The question of contribution of the BRSP to European strategies entails how the Programme
contributed to the (successful) implementation of the EUSBSR and EU2020 strategy respectively.
While previous strategic evaluations has drawn conclusions and recommendations based on the
mapping of projects in each of the Programme‟s four priority areas according to their relation and
relative contribution, the current evaluation has used a different approach primarily based on
interviews with a sampling of projects and Priority Area Coordinators (PACs) and Horizontal Action
Leaders (HALs) working within the EUSBSR. These interviews were also used to better understand
existing gaps in capacity-building in the region (as a part of understanding needs in the coming
period).
14 The evaluation questions relating to setting baselines and target for the 2014-2020 programme period is not included as they are
presented in a separate background paper dating 15 October 2014.

Analysis of projects in 2007-2013 and setting baselines and targets for the indicators 2014-2020 21
3. ANALYSIS OF SELECTED PROJECTS IN THE 2007-2013
BSRP
As described in the methodological outline in chapter 2, the focus of analysis is made with regard
primarily to whether achieved results are sustainable, contributes to institutional capacity building
in the region and to what degree the 2007-2013 Programme contributes to the EUBSR and
EU2020 strategies.
The analysis, as stated earlier, is not a traditional ex-post evaluation in the sense that it will
examine the effectiveness and efficiency of the Programme and their impact on economic, social
and territorial cohesion and to what degree project goals were met.15 Instead, the analysis
consists of a systematic approach to outcomes and solutions produced by the projects, with the
focus to identify solutions deemed more probable to produce durable impacts to the region.
A total of 15 projects funded under the 2007-2013 BSR-programme were selected for in-depth
case studies. The selected projects for analysis represent all priority themes of both the 2007-
2013 and 2014-2020 Programme.
Within the framework of the analysis, impact is mainly understood as the use of project outcomes
beyond the project lifetime. In this analysis, durability is used as equivalent to sustainability due
to the fact that the BSR programme uses durability in its monitoring and evaluation guidelines.
Following EC Evaluation Guidelines16, sustainability is defined as the continuation of the longevity
of benefits from project outcomes after cessation of the project.
As project outcomes and their sustainability will differ based on (i) the role a specific actor had
within the actual project (i.e. level of involvement) and (ii) how the project intervention relates to
the actor itself (i.e. depending on type of actor), the outcome of the intervention will differ among
project partners, end-users and target groups. How these main types of beneficiaries are defined
is outlined in the table below and governs the way outcomes of selected projects are perceived
and described.
Table 4 Understanding of main beneficiary types of the BSRP
Term Understanding of beneficiary
project partners The organisations (irrespective of type) formally involved in the initial
project application and project period who has received funds for the
completion of the project.
end user(s) An organisation that the project has included in the activities performed
within the project, but who are not responsible for carrying out the project
itself or has received funds to do so.
target group(s) The broader group(s) that the project is targeting, but that has not actively
participated in any activities of the project
In the following sections the results of the case studies carried out within the framework of the
analysis are presented in more detail. The outline and empirical ground of the analysis of projects
in the 2007-2013 programme presented in the remainder of this chapter can be illustrated such as
in the figure below.
15 EC (2004). The Programming period 2014-2020. Guidance Document on Monitoring and Evaluation – European Regional Development
Fund and Cohesion Fund – Concepts and Reommendations. March 2014. 16 EC Working Document No 5: “Indicative Guidelines on Evaluation Methods: Evaluation during the programming periods”. April 2007;
The Evaluation Plan of the Baltic Sea Region Programme 2007-2013.

Analysis of projects in 2007-2013 and setting baselines and targets for the indicators 2014-2020 22
Figure 2 Outline of project analysis

Analysis of projects in 2007-2013 and setting baselines and targets for the indicators 2014-2020 23
4. USE OF PROJECT OUTCOMES BEYOND PROJECT LIFETIME
The main purpose of analysing the use of project outcomes beyond project lifetime is to assess in
how far the project outcomes are durable. This also includes an analysis of whether end-users
were involved sufficiently and to identify factors that positively influenced the take-over of project
outcomes by end-users. Within the framework the analysis of project in the 2007-2013 BSRP, our
focus lay on answering how and in what ways project outcomes and solutions of a sustainable
character have been produced. The answers to such questions will be presented primarily at an
aggregated level, drawing generic lessons from all case studies carried out, at the same time
exemplifying with tangible experiences from analysed projects.
The overarching theme on the use of project outcomes beyond project lifetime is divided into a
number of sub-questions/perspectives. These sub-questions are provided below.
What is the main type of outcomes stemming from the projects (project partners and end-
users/target group respectively)?
In how far are project outcomes used/promoted by the actual project partnership beyond
the project lifetime?
To what degree have end-uses and target group(s) been involved and in what way has
this affected project outcome? How has the involvement of end-users influenced take-over of
project outcomes and solutions?
Are project outcomes durable and used by relevant actors outside the partnership (i.e.
end-users and target groups)? What factors contributed to the durability of outcomes?
Were investments made within the projects pertinent and relevant to implement in a
transnational cooperation project?
The 15 case studies serves as the main input for addressing the sub-questions listed above. The
summative analysis of results and outputs of all projects within the 2007-2013 programme is
provided in the Background Paper – Defining Result Indicators for the Cooperation Programme
2014-2020. In the following sections, each of the six sub-questions is addressed respectively.
4.1 Overview of main project outcomes
In order to identify outcomes and solutions produced by the projects with a particularly
high/durable impact to the region, a systematic review and categorisation of each project on an
aggregated level has been performed. In the following sections, each of these categories of
produced outcomes stemming from the 15 case studies will be further elaborated. The outcomes
are further divided into part depending on whether the beneficiary was part of the project
partnership or an end-user/target group of the project.

Analysis of projects in 2007-2013 and setting baselines and targets for the indicators 2014-2020 24
Table 5 Overview of sustainable outcome categories within and outside partnerships (examples in brackets)
Main types of project
outcomes and solutions
within project partnership
Formalisation of networks and activities after project completion (EWTC Association, CHEMSEA Center of Excellence)
Increased strategic importance of project theme within partnership organisations (influencing transport plans - Baltic Bio Bus, TransBaltic)
Development of new concepts and tools applied by project partners (export of Demola concept within StarDust, services for industrial use of research
infrastructures – ScienceLink)
Main types of project
outcomes and solutions
outside project partnership
(i.e. among end-users and
target groups)
Utilization of tools and methods outside partnership
(the Longlife certification, Dynamic Sensitive Mapping – EfficienSea, Best Practice Manual - InnoShip)
Input for future legislation, policy and public investments (investments stemming from Baltic Bio Bus,
Port Investments EWCT II, Good practices PURE, impact assessments - InnoShip)
Affecting long-term strategies of firms (increased focus on Age management – Best Agers, internal research priorities – ScienceLink)
Basis for further project-based initiatives (TransBaltic-->TranGovernance, Aquabest-->Baltic Blue
Growth, etc.)
4.2 Sustainable project outcomes within partnership organisations
In this section the focus is on how far project outcomes are used/promoted by the actual project
partnership beyond the project lifetime, i.e. among the project partners since project completion.
This entails the way in which outcomes of the project are applied in the project partners‟
organisations while assessing its strategic importance for the organisation itself.
Firstly, one must acknowledge that the project partnerships consists of a heterogeneous group of
organisational types ranging from (among other) municipalities and municipal federations, regional
decision making bodies, ministries, national authorities, research organisations and universities.
Privately owned organisations have not been involved as project partners within the 2007-2013
Programme. The ways in which project outcomes are utilised by project partners after project
completion can furthermore take many forms. In order to review how project outcomes can be
used by the project partnership beyond project completion, a categorisation of project outcomes
has been developed. This systemic review has resulted in three broad categories of sustainable
outcomes among the partnerships including the (i) Formalisation of partnership network and
activities, (ii) Increased strategic importance of project theme among project partnerships and (iii)
New organisational methods and tools used/promoted by individual partners.
The abovementioned outcomes should be viewed as separate from those aspects of capacity
building discussed in chapter 5 below. Instead, the focus lies on the different forms for how project
outcomes are used beyond project completion and what facilitated the durability of such
outcomes. The three categories of sustainable outcomes are described in more detail below,
followed by examples of each outcome respectively.
Formalisation of networks and activities after project completion: One significant
outcome of the 2007-2013 Programme is the establishment of formal networks stemming from
the activities within the projects. Several project activities have resulted in project partners
continuing the work carried out within the projects as an effect of the increased awareness of
the actuality of the topic at hand. This, however, does not primarily relates to the formation of

Analysis of projects in 2007-2013 and setting baselines and targets for the indicators 2014-2020 25
new projects involving the partnership as with the development of TransGovernance from
TransBaltic, Baltic Blue Growth from Aquabest or More Baltic Biogas Busses from Baltic Biogas
Bus. For such continuing projects, especially within established themes as transport, it is
important to note that individual projects and their extension very much is part of a chain of
projects that has been ongoing since the 1990‟s. Projects like these gathers actors on a high,
strategic level and is very much about exchanging knowledge and maintaining existing
networks (in the case such networks exists on strategic level in all partner countries). The
main focus when discussing the formalisation of networks here relates instead to when project
partners in one way or another establishes new forms of formal networks or resources as a
result of the project outside the traditional project structure, safeguarding the continuing work
with the project theme. This, in turn, is considered as having a significant effect on the
traditional work of each partner organisation respectively. In the figure below some examples
of project activities are described, contributing to further development activities.
Increased strategic importance of project theme within partnership organisations:
Given the transnational aspect of projects within the BSRP, it is deemed to be forerunners of
member states in certain aspects of the projects where the issue at hand has had a different
strategic weight politically. To build on the experiences of successful individual member states
within the Baltic Sea Region within key areas are in several of the case studies a strong
success factor for creating sustainable outcomes among all project partners. Based on the case
study analysis of selected projects, two main forms of outcomes stemming from such
circumstances can be identified. Firstly, for individual project partners the topic of focus has
proven to be given substantial additional weight and long-term strategic importance as a result
of the project. This, in turn, naturally alters the way the individual organisations work with
issues of the projects after project completion. Secondly, project partners experience in
general an increased awareness and topic-specific knowledge following from participating in
the project, affecting long-term strategic investments made in the regions. These separate but
Formalisation of resources and networks stemming from the 2007-2013 BSR
Programme
The stakeholder network EWTC Association established under the EWTC II project was
assigned to continue and administer the project outputs after project completion. Since project
completion, EWTC Association has doubled in size, gathering around 30 members from a total
of 13 countries. Among these members, 5-6 are original project partners promoting the project
activities carried out during the project period. The project has thereby led to a deepened
cooperation between the partaking countries. The EWTC Association is today viewed among the
project partners as a natural platform for cooperation between public and private stakeholders.
The ScienceLink project is another example of where in principal all project partners have
signed a letter of intent stating the continued work of the project, at their own expense, until
further external project funds are made available. This is viewed as a result of the learning
process that has taken place during the project among project partners, where the need of
continued activities in promoting the core goals of the project has become visible. The Longlife
project represents another form of continued formal cooperation as a result of the project in
the form of the Longlife Institute, assigned to further elaborate the main tools developed within
the project. Furthermore, InnoShip facilitated the emergence of a Clean Shipping expert
network on a national level.
After project completion, the partnership of CHEMSEA has contributed to the formation of a
Center of excellence serving as a consulting body for organizations and government officials.
The Center of excellence is a new form of organizational set-up for the researchers involved
with the issues of the project and safeguards that the transnational work within this research
area continues also in the permanent, transnational Baltic CWA-advisory body also formed as a
result of the project.

Analysis of projects in 2007-2013 and setting baselines and targets for the indicators 2014-2020 26
yet coherent forms of sustainable outcomes manifest themselves in different ways as
exemplified below.
Development of new concepts and tools applied by project partners: The outcome of
many projects within the BSRP must be considered on a long-term basis and whether the
project itself managed to move a technical or policy area forward. Several examples have been
identified from the case studies of how project outcomes are sustained among project partner
organisations after project completion based on concepts and tools developed within the
project. This relates to some degree to the capacity building dimension of a more efficient use
of human and technical resources, but deserves to be acknowledged also as an outcome
having a sustainable impact on the partner organisations themselves. It also relates to some
degree to organisational learning, where the continuing process of developing new ways of
refining the way organisations work is further accelerated by participation in the BSRP.
Examples of how new concepts have been developed during the course of the project and
thereby resulting in a sustainable change in the ways partner organisations work is provided
below.
Strategic investments by partnership organisations following increased awareness
and knowledge of project theme
In the Baltic Biogas Bus project, partners represented countries where biogas production
and use in busses as fuel was not equally developed, or not developed at all, compared to
the lead partner country. The project however was successful in presenting the advantages
with this fuel-type for public transport use. Stemming from the Biogas Bus project, a brand
new fleet of busses are now up and running in the City of Tarttu in Esonia and a new
transport plan was developed for the city valid until 2016, as well as a new way of thinking
at a political level in terms of public transport and environmental friendly non-fossil fuel. The
TransBaltic project has resulted in, among other, that individual regional authorities being
able to relate their regional transport network planning to the European development,
considered as being very valuable. Similar outputs can be viewed from the EWTC II project
where some project outputs have made their way into regional transport plans of certain
regions, the key strategic document for future investments in infrastructure.

Analysis of projects in 2007-2013 and setting baselines and targets for the indicators 2014-2020 27
Concept development and new forms of working towards end-users and target
group(s)
The ScienceLink project has led some of the project partners such as the organisation
Invest in Skåne to move away from considering tasks of promoting industrial use of
research infrastructures as a niche dealt with within a single project, to something that is
relevant for many areas of the organisation‟s work with promoting the material sciences
industry in the region. This includes hiring of staff with expert knowledge on the topic of the
project to ensure continuing strategic work on the issue. Other sustainable outcomes from
the ScienceLink project for primarily the research partners involved such as MAX-Lab and
DESY include new methods of working towards industry as well as new knowledge on the
possibilities and demand from firms of the research being performed at such facilities,
making an impact in the ways these research infrastructures are addressing and dealing
with industry today. Similar developments can be observed among project partners in other
projects such as the Baltic Biogas Bus, where the knowledge on biogas and gas as fuel
has increased and public infrastructure such as public water companies are changing to
biogas and new forms of cooperation with technical universities in the region for public
bodies at both state and local level. In the BestAgers project, partner states that they
have developed recommendations and tools for employers on how to work with age
management, train managers and employees and developing tools on how to individualize
the working place being implemented by private companies.
A telling example of the development and learning of new concepts can be identified also in
the StarDust project, with the establishment of the Demola concept (company-student
innovation platform). Demola started as a concept in Finland and was established in three
other countries as a result from the cooperation in StarDust. This and other new models for
communication, intelligence, strategy development relating to facilitating innovation are
being used by intermediaries such as cluster organisations as a direct result of the project.

Analysis of projects in 2007-2013 and setting baselines and targets for the indicators 2014-2020 28
4.3 Involvement of end-users – success factors
This section set out to describe the involvement of end-users and target groups within the projects
as well as identifying the main factors having positively influenced the involvement of end-users
and take-over of project outcomes and solutions. End-users and target groups obviously varies
between projects, ranging from private companies to regional or national decision-making bodies
and authorities, industry associations, higher educational bodies, etc.
In general, end-users representing wider target group(s) have not been involved in the initial
planning and formation of the projects analysed. However, projects are often initiated by actors
with in-depth knowledge of such group‟s needs, may it be new tools, knowledge or networks. The
main conclusions drawn from the case studies on the issue of involving end-users in the projects
are listed and described in more detail below.
Involve end-users early on in the project - For some projects such as EWTC II we can
identify problems in involving end-users in the form of private companies during the project
period. However, the project has been successful in involving such private companies in the
continuing work in the form of the EWTC Association, which is the organization that will
promote the project results after its completion. Involvement of the private sector has proven
difficult mainly due to limited interest and engagement of certain stakeholders. This is
probably due to an envisaged risk of handing over critical business information‟s to
competitors. One success factor for creating durable results is however to formalize
cooperation between associated partners early on. The private companies engaged in
formulating a common set of goals and in identifying needs have also been the ones most
faithful and engaged in the project period and subsequent activities through the EWTC
Association. Within CHEMSEA, both type of end-users/target group such as National Ministries
of environment and private companies operating in the Baltic Sea were involved already in the
planning phase of the project as well as in developing guidelines that served as one main
output of the project.
Secure a close cooperation with related strategic projects – Projects such as
TransBaltic is very much focused on creating networks with relevant actors on a political level
serving as the target group of the project. Since the project is working on a high strategic
level, project end-users involve national governments and authorities, regional public actors,
private transport sector as well as the European Commission. On this background, the project
have seen the need to cooperate with other relevant project by attracting 12-15 organisations
including the Commission, PAC and the northern dimension transport partnership to its
meetings through a network approach. This are to be viewed as a success factor for
distinguishing the project at hand in a wider context and in so doing involving the most
relevant target group(s) in project activities.
Clearly define incentives for industry participation– One of the main challenges identified
in engaging private companies in the projects of the 2007-2013 BSRP is a lack of clearly
formulated incentives for industry participation. This can for example be seen in the
BestAgers project where limited involvement of end-users is primarily due to difficulties in
creating motivation for participation. Within the Longlife project, end-users involved
construction companies with more or less experience of developing methods for energy
efficient buildings. However, companies not applying such technology soon will be forced to do
so due to new regulation in certain member states. When a higher level of energy efficiency in
buildings thereby is required, the project database developed comes in handy for these
companies, who will have methods at hand to build and design more energy efficient buildings
thereby creating incentives for participating in the project. The BSR InnoShip project
managed to create incentives and involve, in particular, larger companies though the
establishment of the Clean Shipping Award and by so doing raising awareness among the
target group of the issue of focus for the project. The ScienceLink project managed to engage
firms, mainly SMEs, in new forms of advanced research building greater knowledge and
competitiveness of such firms. The main success factors involving end-users (namely firms) in

Analysis of projects in 2007-2013 and setting baselines and targets for the indicators 2014-2020 29
the ScienceLink project has been ability to (i) have a clear and attractive offer, (ii) conduct
intense marketing of the offer on a broad basis using intermediaries such as cluster
organisations, (iii) involving competencies in the project with great insight and knowledge on
end-users needs. These three success factors can be viewed as generic when working towards
a target group consisting of mainly private firms.
New networks serves as an important incentive for target group involvement – The
possibility to improve your professional network is a strong incentive for end-user and target
group involvement in projects under the BSR Programme. End-users and target group (s) of
StarDust were mostly SMEs and different cluster organizations, SME-networks and
research/innovation milieus within the Baltic Sea Region. Approximately 850 SMEs were
involved in innovation activities during the project. The main factors having positively
influenced the end users is the focus of solving societal challenges in the BSR (which also
affects business opportunities such as within the maritime area) and the international networks
that can be created by cluster organizations, creating business and innovation contacts within
their own sector as well as between sectors. Some of the activities used in StarDust such as
Innovation camp makes it even easier to involve end-users and can be used as best practise.
The Demola concept that was expanded to new countries in the BSR by StarDust also involves
students and private companies in innovation activities.
Involving end-users and target group(s) in demand-driven innovation processes
In the REMOWE project, end-users were involved in order to facilitate the development of
methods and industry-related guidelines through meetings, workshops and also serving as
experts. This high level of involvement with local business and industry provided project
partners with a better understanding of target group‟s needs and demands. Especially
mentioned are the innovation sessions that the local government of Silesia in Poland
organized. The sessions involved end-users in workshops where they were given the
opportunity to influence and test the developed methods of the project based on what was
important to them and what they expected from the local government. From this, new
methods could be developed safeguarding the durability of outcomes in a longer perspective
according to end-user needs.
At the start of Aquabest project, the Finnish Fish Farmers‟ Association (end-user) expected
answers and solutions to issues/challenges that the companies in the industry (fish farming)
are facing. The key expectations the association had were linked to legislation, especially
environmental legislation and the related bureaucracy. The research carried out within the
project provided the association with important knowledge of the parameters of action, i.e.
what is possible and what is not regarding these questions. This information is crucial when
the association advocated for their member organisations‟ interests and deals with the
national authorities. The project (Aquabest) thereby put emphasis on focusing on practical
problems from the start that had been identified by an important end-user in the initial
phase of the project. This is to be viewed as an preferred approach for safeguarding
outcomes relevant for identified end-users and target group(s).

Analysis of projects in 2007-2013 and setting baselines and targets for the indicators 2014-2020 30
4.4 Durability of project outcomes outside project partnership
In this section the focus is on how far project outcomes are durable and taken up by relevant
actors outside the partnership, i.e. end-users and target group(s). Furthermore, a systemic review
is carried out relating to what factors are seen as decisive for achieving the utilization of project
outcomes and solutions by end-users and target group(s).
End-users involved directly in projects co-funded by the Baltic Sea Programme naturally gain
insights and greater awareness of the project theme as a result of participating in project-related
activities. For example, within the StarDust project end-users in the form of cluster organisations
and universities emphasise the networks developed on innovation issues within the project,
directly leading to new structures such as the Demola concept first developed in Finland
(Prototyping new products and services between companies and students). However, the main
factors influencing the durability of project outcomes among the wider target group, thereby not
involved in targeted activities within the projects, are indirect activities in the form of input on new
policies affecting the target group or the development of standardised tools or guidelines used by
the target group after project completion.
Despite the different perspectives and end-users/target group(s) of the projects, it is possible to
develop a typology on what type of outcomes are considered most sustainable in the sense that
they are applied by actors outside the partnership after project completion. The in-depth analysis
of the 15 projects clearly indicates that the outcome of projects is taken up by external actors in
primarily four ways:
The use of support and guidance tools developed within the scope of the project by end-
users and target group(s)
Knowledge developed within the project serving as input for future legislation and public
policy, in turn affecting the framework in which the target group operates
Affecting long-term strategies of private firms directly involved in project related
activities, in turn creating a framework for the wider target group adapt the same strategy in
order to stay competitive within a certain field
Activities carried out within the projects serving as a starting point for new project-based
initiatives involving similar or new types of end-users
Each of the above listed durable outcomes is presented in more detail below, followed by an
analysis on the contributing and hindering factors for facilitating such outcomes.
Use of tools developed within the project: A specific type of project outcomes with
potential of particularly high and durable impact are different forms of guidelines, certifications
and support document developed within the projects. One such example is the CHEMSEA
project, where recommendations, predictive tools, guidelines and contingency plans concerning
different aspects of chemical warfare agents were developed that are now being used in
different forms by the target group(s) including fisheries and others working in the Baltic Sea
that may encounter chemical munitions as well as government officials dealing with
environmental issues on a policy level (e.g. Environmental Ministries). The EfficienSea project
is another example where concrete tools where developed now used by the target group
including for example a tool for coastal zone management (Dynamic Sensitivity Mapping) and
a real time tool for prediction of risks for vessels in a defined sea area. Within the EWTC II
project where the Book of green corridors was developed, providing guidelines useful in future
planning. One project end-user testifies that the project has enabled their company to develop
more efficient, and the amount of goods transported in an east-west direction has increased.

Analysis of projects in 2007-2013 and setting baselines and targets for the indicators 2014-2020 31
Serving as input for future legislation, policy and public investments: A critical way in
which project outcomes of the 2007-2013 BSRP lives on is through the impact it has had on
different aspects of public policy. There are several examples of this from the previous
programme period. The unique guide compiled by the PURE-project ”Good Practices in Sludge
Management” was used as a basis for The Baltic Marine Environment Protection Commissions
(HELCOM) new environmental recommendations. Within the Aquabest project, data from
present licensing systems and voluntary regulation schemes have been collected from BSR
countries and currently suggestions for incentive-based and more flexible regulation schemes
are being drafted. The project furthermore issued recommendations on change of legislation
for example in Sweden and Finland and The European Commission, (DG Mare and DG Envi)
have all used Aquabest originated data on the basis of their decisions. Within the Baltic biogas
bus project, end-users are mainly made up of politicians in various countries within the BSR
now making use of the research and reports stemming from the project in their transport plans
and for future procurements of biogas busses. The EfficienSea project have been able to
affect the policy process in the area of aquaculture, a sector highly regulated and controlled by
the environmental authorities while influencing some requirements to standardization that
might be made by the IMO.
How project outcomes are used in the political process and facilitates needed
investments
A specific way in which project outcomes are made durable outside the partnership after
project completion is that its results serves as the basis for strategic investments. Within
Programme priority 2 (2007-2013): Improving internal and external accessibility of the
BSR on such outcome can be identified with longstanding effects for the wider target
group. The results from EWTC II project have had a direct effect on the Danish transport
infrastructure program. On the 21st of March 2013 a political agreement was publicized on
new infrastructure projects in Denmark. The report from task 4E in EWTC II was the main
documentation for the political decision to invest 10.5 mio. DKK in Padborg intermodal
terminal as well as a decision to invest 58,5 mio. DKK to promote intermodal transport
between rail and sea in Esbjerg Harbor. Funds for the two projects has been allocated from
the state budget. Results from the projects were thereby used directly in the political
process, and resulted in two investment projects with the aim to strengthen rail freight and
intermodal transport in Denmark and on the east-west corridor.
At the initial phase of the InnoShip project, there was an intense discussion on the EU
Sulphur Directive and the International Maritime Organisations‟ new emissions restrictions.
The InnoShip project managed to produce information to support political decision-making
in the Baltic Sea region through, among other, economic impacts assessments of the
legislation which was of great use for decision-makers due to the relevance of the topic.
Developing tools used by end-users and target group(s) after project completion
The Longlife project has developed the Longlife certification – a standard for energy
efficiency in buildings that is customized to the climate conditions in the BSR. A longlife
catalogue has been developed where architects and engineers (building, wastewater, heat
etc.) meet in the planning stages of a construction work so that materials for the building can
be selected. The construction company Bayer has built an eco-commercial centre in Berlin and
somewhat 30 houses in Denmark have been built using the catalogue and its processes. All
these buildings have been certified according to the longlife standards, complying with those
of EU2020. In Lithuania and Poland, the project and the Longlife certification have provided
input and spurred the development of new legislation regarding the energy efficiency of
buildings. With the developed database providing methods for energy efficient building, it will
be easier for construction companies to adapt to the new legislation

Analysis of projects in 2007-2013 and setting baselines and targets for the indicators 2014-2020 32
Affecting long-term strategies of private firms: The BSR Programme has the potential of
affecting both long-term strategies of private firms directly involved in project related
activities, as well as the wider target group (i.e. other firms) who implement equivalent
strategies in order to stay competitive. In the ScienceLink project, we can identify examples
of private firms given the possibility to conduct experiments at large-scale research
infrastructures within the BSR. From this three main outcomes with long-term potential can be
identified (i) firms gain knowledge of new types of research possibilities within the whole BSR
which otherwise would not occur, (ii) conducting experiments at these infrastructures enables
them to confirm/disregard a research question within the company, and (iii) affect the internal
strategy of the firm to build competences within the research area at hand. All three types of
effects can be identified for the ScienceLink project. However, if the impact on end-user(s) and
the wider target group is to be relevant, involved firms need to see a strategic gain of
investing in the use and large scale research infrastructures while such infrastructures need to
facilitate the costs of conducting experiments for industrial partners.
Another form of internal strategies being affected by participation in a project within the 2007-
2013 BSRP is the Baltic biogas Bus project where private firms working in the field of public
transport has acquired biogas busses due to new public procurements made from the project
partners. Within the Best Agers project, the main outcomes is not a change within
participating organisations and project partners but within those private firms that make up
the end-users of the project where a focus on age management has become a part of their
internal strategy. SME-end user interviewed within the StarDust project, as an example,
furthermore identifies new market opportunities, new networks and increased understanding in
the BSR countries and joint pre studies in the maritime area as a direct outcome which will
have an impact on their future operations.
Basis for further project-based initiatives involving end-users – A substantial proportion
of projects within the 2007-2013 BSR-programme are striving for long-term impacts.
Development of a certain issue irrespective of the priority areas of the programme are to be
viewed as a gradual development of a policy area. Single projects are thereby best considered
as being either facilitator of new efforts within a field serving as the basis for future project
initiatives or a follow-up of prior project initiatives with emphasis on key issues stemming from
such projects. Outcomes from Aquabest, for example, are being included in the next flagship
project Baltic Blue Growth. For projects such as BCGL, they play an important role in serving
end-users (in this case ports and logistic parks) with new networks and knowledge but are
dependent on future projects to stay relevant. The project in this sense corrects a market
failure of providing such knowledge and networks within the BSR that are best served in future
projects involving new end-users and partly new target group(s). As an example, some of the
private companies involved in the TransBaltic project also committed to the extension project
TransGovernance.
4.5 Contributing and hindering factors to creating durable outcomes
Based on primarily the review of sustainable outcomes presented above, it is of interest to
disentangle what external factors are seen as decisive for achieving the utilization of project
outcomes and solutions by end-users and target group(s) after project completion. As discussed in
previous chapters, the involvement of end-users could be seen as decisive for the take-up of
project results among end-users in latter stages. The involvement of intermediaries working
towards or representing the target group(s) could however be a more effective way of obtaining
sustainable outcomes of the projects based on their newly found knowledge of the target group in
question. Projects that have been developed within the 2007-2013 BSRP typically involve highly
complex challenges requiring a solid understanding of the target group/end-user needs. Industrial
reference groups or similar providing input on the formation of projects are nonetheless seldom
visible in the projects analysed. However, often contextual factors are brought forward in
interviews with those projects managing to produce sustainable outcomes. These contextual
factors are listed below.

Analysis of projects in 2007-2013 and setting baselines and targets for the indicators 2014-2020 33
The project’s scope influence the possibilities to create durable project outcomes –
Several respondents emphasises that the width and scope of the project‟s main topic of focus
is directly related to the possibilities of (i) creating a clear and attractive offer for the
involvement of primarily private companies, and (ii) the possibility to engage policymakers in
facilitating needed changes and investments within the policy area. Well-balanced and defined
project goals and visions clearly facilitates the communication of the project‟s intervention
logic, in turn creating a solid ground for attracting end-user and target group attention and
uptake of project outcomes.
Knowledge of end-users and target group characteristics – The projects within the BSR
2007-2013 Programme involves different end-users and target group(s) ranging from private
companies to cluster organisations, public associations, universities and regional decision-
making bodies. There must be a solid understanding of the differences between such target
groups both respectively and within each type of target group. Some sectors of industry are
more conservative than others and certain type of policies are less likely to be adapted by
decision-making bodies in the short term than others. Projects are therefore suggested by
several respondents to be subject to a more detailed analysis on the risks associated with
specific end-user and target group(s) possibilities to absorb project outcome in the short term.
Timing of the project intervention - Timing of the projects matter and is an aspect that
should be taken into account when determining the potential for sustainable and durable
project outcomes both ex-ante and ex-post. One example of when timing was of the essence is
the Baltic Biogas Bus project. In specific member states there was no market for biogas
busses prior to the project, at the same time as there was a need to lower CO2 emissions in
order to correspond to EU Climate targets, acting as a motivation for decision-makers to
introduce policies in line with the vision of the project. Another example is the Submariner
project, receiving a great deal of attention since it was in line with the European Commission‟s
Blue Growth Policy or the BCGL project where new regulation for sea transport facilitated the
move of transport flows from the Mediterranean to rail. Also the ScienceLink project can be
said to have particularly good timing seeing that a number of new research infrastructures
(e.g. European Spallation Source, MAX IV-laboratory) is to be built in the region. To safeguard
that project activities and its outline are in line with current external developments are seen as
one of the main positive determinants influencing the ability to produce sustainable project
outcomes.

Analysis of projects in 2007-2013 and setting baselines and targets for the indicators 2014-2020 34
The importance of external political decisions for creating sustainable outcomes
Although the main project goals have been reached, it is often decisions outside the scope
of the projects that determine the sustainability of outcomes among the end-users
involved in the project and the wider target group. A good example of this is the
ScienceLink project. A great number of firms involved in the project have gained new
insights in new research methods and techniques available in the BSR through subsidised
access to research infrastructures. However, the capital cost of this type of research for
firms is fairly high and requires a long term investment. One main determinant for the
possibility of firms making use of the knowledge gained within the project and returning to
such infrastructures, thereby creating a sustainable outcome, will be the costs of
conducting and analysing experiment as well as making the infrastructures available for
industry. These questions are mainly of political character and outside the scope of the
project. This proves the need for strategic lobbying efforts where its outcome is governed
by political factors outside the capacity of the involved project partners.
A good example of when communication and lobbying efforts has created good
preferences for sustainable project outcomes is the Baltic Biogas Bus project. Political
decisions are the basis for success in the development and procurement of biogas busses
so it was very important to have strong policy makers on board to help make the outcome
happen. One of the success criteria was holding seminars in different countries and
engaging politicians in these seminars and not just experts. It made it part of the political
agenda. 20 seminars were held, two of them in St Petersburg, which lead to the project
being invited to speak at around 30 conferences spreading the results of the project and
providing information about to different stakeholders. In Tartu in Estonia a brand new fleet
of busses are now up and running and they have a new transport plan making sure that
the number of biogas busses will increase until 2016. Partly thanks to lobbying and
information activities by the project, the county of Hordaland in western Norway has
decided to purchase 75 biogas buses and build a biogas production plant in Bergen.

Analysis of projects in 2007-2013 and setting baselines and targets for the indicators 2014-2020 35
4.6 Pertinence and relevance of project investments
A total of four projects among the 15 case studies involved investments in different forms of
physical assets, primarily in the form of technical equipment deemed necessary for the completion
of projects. The four projects included in the analysis EfficienSEA, Baltic Biogas Bus, PURE and
CHEMsea. Type of investments in the four projects analysed is provided below.
Table 6 Type of investments made within selected projects
EfficienSEA Establishing necessary broadband links for e-Navigation Test Bed
Equip VTSs for e-Navigation
Equip participating vessels for e-Navigation
Building the e-Navigation WEB information server
Equip AtoNs with AIS & related e-Navigation services
ARC GIS upgrade
Acquisition of SW for a structured web site and acquisition of licenses for GIS based modelling
Baltic Biogas Bus Mobile biogas fuelling station
PURE Chemical phosphorus removal
CHEMsea Online metal preconcentration module for ICP/MS
Water purifying system
ADCP Current meter
Materials for upgrading of remotely operated vehicle (ROV)
Liquid chromatograph for CWA analysis
Cages for in-situ experiments on marine organisms
PC station with „Statistical‟ software
An important question is whether the investments made within the projects, as specified above,
were pertinent and relevant, thereby contributing to addressing project goals. Furthermore it is of
great interest to analyse whether it was justified to implement them in a transnational cooperation
project under the BSRP.
In general, the investments made within the four projects have contributed to the realisation of
project goals and are regarded as being necessary for the completion of the projects. However, if
the project structure from the outset were defined in a way necessitating a specific type of
investments for its realisation, such an analysis bears little relevance. At the same time, it is
reasonable to argue that projects of a specific technical nature are deemed to need certain types
of investments in order to be realised and attract relevant project partners and end-users. The
investments in tangible equipment made in the projects are in general at the same time only
fractional and not the main output of the project at hand. Rather, they serve as the basis for
conducting experiments or gather information necessary for moving projects further. For all
projects analysed the investments are viewed as necessary for enabling the realisation of project
outcomes and providing tangible and evidence-based results from the projects.
One example of the argument made above is the EfficienSea project where only minor physical
investments were made in IT-equipment. These investments were viewed necessary as they
served the basis for vessels (end-users) acting as test units within the project. Furthermore, in
order to engage private vessels as testing units a prerequisite was the promise that participation
in the project would not bear any costs for the companies involved.
The justification of physical investments in transnational cooperation projects such as the BSRP
differs between the analysed projects. One type of prerequisite making it viable to implement
them in a transnational setting are discrepancies between member states and the need to provide
all project partners with relevant equipment for safeguarding a higher and uniform level of
analysis. One such example is the investments made in Liquid chromatograph for CWA analysis
within the CHEMsea project. This equipment was regarded necessary to improve analytical
capabilities of the military university of technology, Warsaw, to the level comparable to certified
chemical weapon control lab. In this way, the project could distribute the analysis between three
different labs throughout the BSR (FOI, VERIFIN and MUT). Except time saving effects, with three
labs on same level within the BSR samples could be cross-validated by at least two labs resulting
in an improved credibility of CHEMSEA results. Investments within the CHEMsea project also

Analysis of projects in 2007-2013 and setting baselines and targets for the indicators 2014-2020 36
involve technical equipment making it possible to avoid more costly and traditional analysis
methods within the project.
The PURE project made a quite significant investment in plants for chemical phosphorus removal.
The investment of piloting a new technology in Belarus is to be considered as relevant as it,
according to the respondents, are the biggest source of phosphorus in the region. As an effect of
the project, the reduction of phosphorus has taken a step forward not just in the Riga wastewater
treatment plant but also for other plants where the investments made through PURE served as a
relevant benchmark. However, the investment has not been without challenges. The
administrative and legislative differences between the EU and Belarus as well as the relatively low
experience of western companies or BSR funding instruments to operate in the country constitutes
significant barriers. Primarily, problems related to procurement, language barriers and
implementing the investments in Belarus constituted specific challenges that were time consuming
to overcome. The flexibility of the funding instrument however assisted in mitigating some of
these challenges.

Analysis of projects in 2007-2013 and setting baselines and targets for the indicators 2014-2020 37
5. CAPACITY BUILDING OF ACTORS IN THE REGION
The basic assumption about the BSRP is that the most significant impact of the Programme in the
region is its contribution to institutional capacity building. In the following section RMC will
describe the five dimensions of capacity building and exemplify by giving examples from the case
studies.
Given the wide geographical coverage and range of topics covered by the programme, funds that
can be invested in one individual project are limited. Thus, the programme intends to invest in the
institutional capacities of the programme‟s target groups. This enables to create a leverage effect
for regional development and transnational cooperation, thus maximising the effectiveness of
invested resources. In order to practically analyse the potential contribution of the programme on
capacity-building, the concept of institutional capacity has been further specified. Different
dimensions of capacity-building have therefore been explored and, based on the potential
influence of the Cooperation Programme on funded projects as well as on an understanding of
central elements needed to improve institutional capacity, five dimensions have been identified.
These five dimensions are listed in the figure below, including a general understanding of each
dimension.
Figure 3 Understanding of each dimension of capacity building
An initial analysis of the project portfolio shows that all 90 projects from the Programme have
contributed at least to one of the five dimensions of capacity-building. The contributions are
classified as either main or secondary effects, depending on their strengths. The majority of
projects contribute to at least two of these five dimensions and one third of the projects even
contribute to all five dimensions of capacity-building. The analysis also shows that not all five
dimensions are equally relevant regarding the contributions by the 90 projects. As can be seen in
Table 7, the main contribution is achieved in the dimension “Enhanced institutionalised knowledge
and competence”, while the lowest contribution is identified for the dimension “Improved
governance structures and organisational set-up.
Enhanced institution-alised know-ledge and competence
Improved
governance
structures and
organisational
set-up
More efficient
use of human
and technical
resources
Better ability
to attract new
financial
resources
Increased
capability to
work in
transnational
environment
Captures the extent to which knowhow is available and made accessible (e.g. via mechanisms for knowledge transfer) to the target group and other relevant actors and whether that knowhow is absorbed and used in a sufficient way
Captures the extent to which the creation or redesign of organizational structures and committees, or the institution-alisation of regular encounters, such as in meetings or workshops has taken place
Captures the extent to which new time- and/or resource-saving processes, tools, methods, lines of communication, or ways of co-operation have been introduced. These could be databases, software solutions, automatized processes, staff exchanges, etc.
Captures the extent to which the target group in the region is able to attract external private and public sources of finance, whether knowhow exists about funding sources and application processes, and whether formal funding requirements are met.
Captures the extent to which the target group maintains contacts with persons or institutions in other countries in their relevant thematic fields, has the ability to take part in transnational activities and gained experience working in transnational co-operations

Analysis of projects in 2007-2013 and setting baselines and targets for the indicators 2014-2020 38
Table 7 - Main and secondary effects of projects on the five capacity-building dimensions
Number of projects*
Enhanced institutionalised knowledge and competence
Improved governance structures and organisational set-up
More efficient use of human and technical resources
Better ability to attract new financial resources
Increased capability to work in transnational environment
Main effect 90 26 46 47 52
Secondary effect
17 19 25 36 14
Source: Rambøll Management Consulting
In the following sections RMC describes what the case studies of selected cases have shown in
terms of each dimension of capacity building. We exemplify with successful examples of each
dimension in a learning formative perspective for upcoming Programme period.
5.1 Enhanced institutionalised knowledge and competence
The first dimension of capacity building is enhanced institutionalised knowledge and competences.
Institutionalization is here understood as if knowhow is being documented, can be used by people
beyond the partnership, is accessible via channels of communication/platforms commonly used by
the target group/other relevant actors. Knowledge and competence means new or increased
knowhow that has, to some extent, resulted from the project and that is, after the project has
been completed, being used by the target group/ other relevant actors. As described in the figure
above, enhanced institutionalised knowledge and competence captures the extent to which
knowhow is produced within a project, is being documented and made accessible to the target
group and other relevant actors and whether that knowhow is being used after project completion.
Whether the project has led to enhanced institutionalised knowledge and competence is therefore
depended of:
New or increased knowhow produced
Documented accessible knowhow
Knowhow used after project completion
5.1.1 New or increased knowhow produced
All projects in the case study have produced new knowledge or increased the knowhow of the
project‟s core issue to some extent. In many projects the level of knowledge differed from the
various countries that participated in the project at hand. For instance, this was the case in both
the Baltic Biogas Bus project and the REMOWE project. Both of these projects concern the making
of energy or fuel out of waste. Knowledge and techniques were found at different levels and
consequently some project partners therefore gained new knowledge to a very high extent and the
level of knowhow was substantially increased, whereas other partners certainly gained new
knowledge to some extent but their main contribution was instead to spread knowledge to others
increasing their level of knowledge. In other projects the level of knowledge was low for all
partners and every new piece of information collected on the issue at hand was new knowledge
gained. The CHEMsea project is an example of such a project, where no one had really worked
with the core issue before, thus all knowledge about methods, lab results etc. is new to
stakeholders. The BSR InnoShip project has increased the level of knowledge mainly among the
target group (further described below). The Submariner is another example where the level of
knowledge of how effective innovative methods were, was low for all partners and increased
substantially thanks to the project (also described further below).

Analysis of projects in 2007-2013 and setting baselines and targets for the indicators 2014-2020 39
5.1.2 Documented accessible knowhow
The case studies conclude that all of the projects in the study have resulted in reports and other
documentation that are made accessible through at least project websites. Some of the projects
have in addition produced documentation such as guidelines, web portals or manuals that are used
by the project‟s target group or end-users after the project completion. The projects have put a lot
of effort into making these guidelines etc. accessible and useful for the end-users, adapting both
format and content to meet end-users preferences and needs.
5.1.3 Knowhow used after project completion
Institutionalised knowledge and competence is all about new or increased knowhow that has, to
some extent, resulted from the project and that is, after the project has been completed, being
used by the target group. The case studies show that the way the knowledge stemming from a
project is used after the project completion varies to some extent. Some projects have produced
documentation of different kinds, such as guidelines, tools, reports and compendiums that are
Adapting guidelines after user preferences/needs
In the CHEMsea project for instance, guidelines were developed on how to handle chemical
war munition if in contact with such while fishing or doing other activities in the Baltic Sea.
The project put a lot of effort into making the guidelines as accessible as possible for the
end-users, i.e. fishermen or others that may come in contact with chemical war munition
while working at sea. The project did acknowledge the special conditions of a fishing boat
and the work there and adjusted the guidelines to keep them short and illustrative for the
target group. The CHEMsea project also developed methods and techniques that are well
documented in reports as well and that are being used and further developed after the
project‟s completion by researchers in the field, not least in the Centre of Excellence formed
during the project and continuing after the project is completed.
The Best Agers project worked on making their results accessible for the target group at
hand. The interest in the project‟s findings was strong, particularly with regard to older
people‟s situation in labour markets. For this reason a booklet with key messages for political
decision makers and other stakeholders has been compiled and published. The Best Agers
has also developed the web platform www.biiugi.eu, which provides a meeting, matching and
cooperation place for all the professionals, experts and idea owners, who can thus work in a
cross-generational innovation environment to help shape the future of a competitive Baltic
Sea Region.
Increasing knowledge and spreading it
The BSR InnoShip project has contributed to an improved awareness among the target
group (e.g. shipping companies) of the changes of maritime practices on environmental
emissions. For example, shipping companies now have a better picture of what it means to
them economically and to the environment if the speed of ships is reduced by X km/h. (BSR
InnoShip studied these issues.) BSR InnoShip also produced studies on what would happen
(economic and environmental impact) if all the shipping companies in the Baltic Sea reduced
the speed of their ships.
The Submariner project is all about spreading knowledge of new innovative uses of marine
ecosystems. The project has produced a compendium describing current and potential future
marine uses by developing a comprehensive inventory of innovative sustainable uses,
analysing the strengths, weaknesses, threats and opportunities to the Baltic Sea Region,
assessing their environmental and socioeconomic impacts, estimating the market
opportunities, assessing the availability and status of necessary technologies, and describing
the gaps and obstacles in the legal framework.

Analysis of projects in 2007-2013 and setting baselines and targets for the indicators 2014-2020 40
being used after project completion. Forming a network within the project that still exists after
project completion is another way of making knowhow used after project lifetime. Several
examples of this are among the studied cases. Knowhow stemming from the BSR projects is also
often referred to in conferences, seminars etc.
5.2 Improved governance structures and organisational set-up
Another dimension of capacity building is defined as improved governance structures and
organisational set-up. Improved governance structures and organisational set-up mean that
certain activities have been realised during the project in order to improve the work organisation.
Such activities are the forming of committees and positions which are responsible for these topics,
clarification of responsibilities as well as new means of communication such as
meetings/workshops on a regular basis.
This has also been one of the dimensions of capacity building investigated through the case
studies; has the project contributed to better ways of working with the core issues of the project
from an organisational perspective beyond the project lifetime? There are many examples among
the selected cases of improved governance structures as well as organisational set-up. RMC can
see that there are different approaches to this dimension of capacity building among the selected
cases:
1) New and/or closer cooperation between parties related to the issue.
2) Documents stating improved governance structures
3) Actual organisational changes, i.e. new employees, reorganisations etc.
5.2.1 New and/or closer cooperation between parties related to the issue:
There are several examples among the studied cases on how the project has contributed to new or
closer cooperation. This could be about establishing networks/platforms within the project that are
still working together after project completion. The networks/platforms serve as forums for
knowledge sharing and help different parties cooperate on the issue at hand. The partners in these
networks are in some cases at a strategically important position able to influence policy makers.
Closer cooperation could be established without a formalised network, but merely an informal
cooperation, since parties got to know each other during the course of the project. Many examples
of established networks and such cooperation are already mentioned in this report, but some are
worth mentioning in this context as well.
Guidelines, tools and manuals make knowhow used after project completion
As described above the CHEMsea project‟s methods and techniques are well documented in
reports and are being used and further developed after the project‟s completion by
researchers in the field, not least in the Centre of Excellence formed during the project and
continuing after the project is completed.
The EfficienSea project is another example of a project that developed a tool that is being
applied today after project completion. The project was dealing with future navigation, and
has managed to set the global agenda in this area and provided a tool for e-navigation.
The Baltic Biogas Bus project presents strategies and policies on how to introduce biogas in
public transport. The project has generated analyses regarding biogas production,
distribution and bus operations. This has resulted in a manual for strategy, policy and action
plan on "How to introduce biogas buses" in public transport.

Analysis of projects in 2007-2013 and setting baselines and targets for the indicators 2014-2020 41
5.2.2 Documents stating improved governance structures
A few examples of documentation stating improved governance structures are found within the
selected and studied cases. These documents are mainly about project partners agreeing on
strategies formed within the project at hand.
5.2.3 Actual organisational changes, i.e. new employees, reorganisations etc.
The case studies have only presented a few actual organizational changes as an effect of a project
intervention. In the Baltic Biogas Bus project one of the interviewees state that two people were
employed to work on the project within the department of transport in the city of Tartu, and have
been there permanently even after the project was completed. The project has also helped
clarifying roles between public transport company (SL) and executers (Keolis) in Sweden.
Reorganisations have been made in SL, but, as SL is a big organization, reorganisations occur
every now and then and it is hard to tell whether this is an effect of the project or not.
One of the project partners in the BSR InnoShip project (Polish Register of Shipping) has
presented organizational changes through experience and contact with foreign BSR Project
Partners. Their contacts‟ best organizational practices have been implemented. The organization at
hand has sought to present proven and qualitative ways of working and through them approach to
solve project tasks and objectives.
5.3 More efficient use of human and technical resources
Capacity-building is also about more efficient use of human and technical resources, where human
resources is understood as staff in institutions of target group and technical resources means
databases, technical solutions such as software, automatisation of processes, small infrastructures
etc. This captures the extent to which the following have been introduced by the project:
Documented strategies improving governance structures
In the ScienceLink project the various project partners have signed a letter of intent.
Research institutions involved in the project has clearly altered the means to which they
address private firms. This is not likely to have happened without the project or new political
decisions.
In the BGLC project the project partners have presented a new methodology for
maintenance of railway tracks. Main output of the project is that 29 partners in five countries
has agreed on the new BGLC Strategy, aiming to develop the future transport routes along
and in connections with the Bothnian Corridor.
One of the outcomes of the Baltic Biogas Busses project was the new transport plan for
Tartu City. It was a direct effect of the project and provides the guidelines for public
transportation and all related procurements in Tartu. The project has also helped clarifying
roles between public transport company (SL) and executers (Keolis) in Sweden.
Closer cooperation creating improved governance structures and organisations
The EWTC II has formed the EWTC Association, described as a natural platform for
cooperation between public and private stakeholders. Despite a long tradition of cooperation
between the older member states, the EWTC II has further strengthened the cooperation
with for example Danish and Swedish public partners.
The REMOWE project also formed an association and in addition strengthened the
cooperation between universities participating in the project as well as the link between the
university and other parties. An international class of students is set up and universities have
an exchange of knowledge The University is now trusted by partners to do analysis, there is
a new way of cooperating.

Analysis of projects in 2007-2013 and setting baselines and targets for the indicators 2014-2020 42
New time- and/or resource-saving processes
Tools, methods, lines of communication
Ways of cooperation
As stated these could be databases, software solutions, automatized processes, staff exchanges
etc. Efficient use means increased output with same input or same output with less input. This can
be achieved e.g. by development of new processes/tools/methods that enables time saving in the
work routine, establishment of new ways of communication in order to spread relevant
information, new ways of cooperation between relevant actors in order to use available resources,
joint use/ exchange of staff, common use of infrastructure and other resources.
Developing tools and methods for more efficient use of technical resources:
Case studies show that several projects have developed tools and methods with the effect of
more efficient use of mainly technical resources. The CHEMsea project for instance, has
developed new tools and methods of detecting chemical munition now used by researchers,
i.e. the way researchers use vessels and technical equipment to detect chemical munition
has changed through the project.
Another example is the Best Agers project that developed a virtual business incubator and
matching platform, which is an online tool which helps to bring together retired experts with
those who need their help. The project also produced an activation toolbox to identify and
motivate knowledgeable and experienced Best Agers to participate in coaching and tutoring
activities.
Creating new lines of communication making it easier to share information
The BSR InnoShip project has facilitated the sharing of information and research results on
clean shipping. The platform Clean Shipping Currents is a good example of this. People,
companies, governments and other parties interested in clean shipping had common
interests, and BSR InnoShip was able to provide these actors a forum to share their
knowledge, and more importantly, BSR InnoShip contributed to the creation of new research
and knowledge on clean shipping. The different actors in the field are now able to share their
work better now that the network is in place. The cooperation on clean shipping continues
after the ending of the project.
Database creating new time- and/or resource-saving process:
Some of the projects have developed solutions and processes that will save time when
working with the core issue. The database provided by the Longlife project will make it
easier for companies to use new methods of construction in the Eastern parts of BSR. This
shortens the time it takes for the construction companies to learn new ways and methods.
With more usage of the Longlife standard, the energy need lessens throughout the whole
lifetime of the building.

Analysis of projects in 2007-2013 and setting baselines and targets for the indicators 2014-2020 43
5.4 Better ability to attract new financial resources
Whether the project has contributed to a better ability to attract new financial resources by the
target group is another dimension of capacity building. Better ability to attract new financial
resources includes the following elements:
Development of project (ideas) that attract financial resources from outside the organisation
and are of interest for actors outside the target group
Knowhow of application processes (potential sources of funding, formal requirements,
presentation of ideas, visibility in the market, etc.)
Fulfilment of formal requirements for funding (stable financial situation, SME-definition of EU,
owner constellation, etc.)
Network of relevant actors (potential partners, sources of funding, be present in the relevant
networks, receive regular information on funding opportunities, etc.)
5.4.1 Development of project (ideas) that attract financial resources:
Several of the selected cases have developed project ideas that attract financial resources from
outside the organization and are of interest for actors outside the target group. Several projects
have dealt with issues which had not yet been subject to this kind of project before and/or been
projects that in many ways have been developed with excellent timing, meaning it has suited the
current political agenda making policy makers interested in funding be very supportive.
New ways of cooperation saves human resources:
The EWTC II project was oriented towards developing new technical solutions as well as
developing cooperation between stakeholders. The EWTC Association has led to a new way of
cooperating with for instance logistics companies, transport companies, municipalities,
regional partners and governmental institutions. Also, the lead partner states that projects
like EWTC II are responsible for cooperating with projects with the similar goals, rather than
competing. This has the effect that there is no double work effort in targeting the same
target group, which therefore means that human resources are used more efficiently.
One of the main outcomes of the Science link project has been the more efficient use of
research infrastructures within the BSR. This includes mainly the enhanced use of
infrastructures in other BSR-countries for private firms, which otherwise is not probable to
have happened. On the human resource side the project partners, mainly including public
institutions and research organisations, have gained new knowledge and developed new
methods of working towards the private sector with advanced research questions and
disentangling the needs of such firms.

Analysis of projects in 2007-2013 and setting baselines and targets for the indicators 2014-2020 44
5.4.2 Knowhow of application processes
Several of the interviewees, i.e. lead partners and project partners, subject to the case studies
describe how participating in their respective project have increased their knowhow of application
processes. They have gained knowledge of the formal requirements, presentation of ideas,
visibility in the market etc. Moreover they state that their knowledge of what potential sources of
funding there is to turn to with this kind of project ideas has increased.
5.4.3 Fulfilment of formal requirements for funding
Another element of better ability to attract new financial resources is the projects fulfilment of
formal requirements for funding (stable financial situation, SME-definition of EU, owner
constellation, etc.).
5.4.4 Network of relevant actors:
As described before in this report, an outcome of a number of the projects in the case study is a
formalized network between project partners and/or other actors. Projects which have succeeded
in creating networks of relevant actors are likely to have better abilities to attract new financial
Knowledge gained from the project serve as base for further funding
End-users of the Science link project has qualified for seeking funding from mainly national
research programs for further analysis based on the knowledge gained from the project. This
is necessary as the costs of using such RIs are very high and the short term gain highly
limited. For individual firms there are examples of better opportunities to attract funding
from within the firm itself. For such firms, the project served as a trial from which results
were later presented on a higher level within the firm which in turn allocated resources to
further research within the area in another country.
Participation in project has increased knowhow of application process
For example the Science link project has enabled project partners to develop new project
ideas within the project which will serve as the base for future applications. Already
applications for pre-studies have been obtained and specific project outline being developed.
For end-users the involvement in the project has resulted in increased possibilities to
formulate applications for carrying research at research institutions.
Innovative project ideas attracting new financial resources
Such project is the Best Agers project which has led to an increased focus on the core issue
of the project (the project supported the integration of Best Agers (55+ year old experts)
and retention of their knowledge in the labour market, especially in Norway, Sweden and
Germany) resulting in an increased willingness to fund these kind of projects. Project
partners state that they have received funding from ministries and the EU. Others say
companies have been more interested in supporting such projects with their staff and time.
One of the end-users has been able to get funding when referring to the Best Agers project.
It has also led to funding through the direct continuation project Light House. In one
partaking country initiatives targeting elders are appreciated and one end user has been able
to receive funding for a number of projects. As a result of the project, funding is also used
more efficiently.
Another project developing ideas that are attracting financial resources outside the
organisation is EWTC II. One of the project partners in EWTC II states that the reports
produced in the project have provided a base for decisions in each participating country,
which has resulted in financial resources being allocated to infrastructure investments in for
instance Denmark.

Analysis of projects in 2007-2013 and setting baselines and targets for the indicators 2014-2020 45
resources, since the network provides potential partners, sources of funding, enables them to be
present in the relevant networks, receive regular information on funding opportunities, etc.
5.5 Increased capability to work in transnational environment
Whether the respective projects have contributed to an increased capability to work in a
transnational environment is another dimension of capacity building. Since the BSR projects all
work in a transnational environment with project partners in several BSR countries and activities in
the different countries as well, the projects have all provided an increased capability to work in a
transnational environment for the project partners and other actors involved, but this can be done
with different means. Increased capability to work in transnational environment is characterized
by:
Contacts to institutions/persons in other countries in the relevant thematic field
Capability to take part in transnational activities (language, knowhow of institutional landscape
in other countries, own competences are of interest for potential partners in other countries,
mobility, financial resources)
Experiences gained in transnational cooperation (informative networks, joint projects
implemented, exchange of staff, transnational organizational structures)
5.5.1 Contacts with institutions/persons in other countries:
One way of strengthening work in a transnational environment, is through making contact with
institutions/persons in other countries in the relevant thematic field. There are many examples
among the studied projects of partners gaining valuable contacts in other countries through the
project, vital for obtaining project goals. The projects are set in a transnational environment
addressing transnational issues why making contact with your peers, so to speak, is crucial when
addressing the issue at hand.
Networks creating better abilities for new financial resources
The CHEMsea project has been successful in creating a Center of Excellence and through
this, successful in increasing the ability to attract new financial sources for research of the
core issue. Project partners state that the EU now treats the issue of the project (assess and
minimize risks related to sea-bottom activities near CWA dumping sites) as an investment in
security. A proposal for a new project has been developed by several project partners who
continue to cooperate on this issue through the Center of excellence.

Analysis of projects in 2007-2013 and setting baselines and targets for the indicators 2014-2020 46
5.5.2 Capability to take part in transnational activities
Work in a transnational environment requires a number of qualifications of the participating
partners. The participating partners need to have the capability to take part in transnational
activities such as conferences, meetings and seminars. This means that the partners need to be
able to communicate and be able to speak a common language and the partners‟ knowhow of
institutional landscape in other countries is required as well, (own competences are of interest for
potential partners in other countries, mobility, financial resources etc.). The BSR projects have
meant a practice to work in a transnational environment for many project partners. For several
partners this was their first experience in such projects and they state that they have learned a
lot. They have gained knowledge of other partners in other countries and seen their way of
working. Through participating in the projects cooperation across borders has, as an effect, been
made easier.
5.5.3 Experiences gained in transnational cooperation
Experiences gained in transnational cooperation could be informative networks, joint projects
implemented, exchange of staff, transnational organizational structures etc. These experiences all
increase the capability to work in a transnational environment.
Participating in transnational activities has increased knowledge sharing across
borders
The network formed by project partners in the Baltic Biogas Bus project has increased the
capability to work transnationally. The network looks into new techniques and the different
countries are now much more informed and involved in different activities in all participating
countries to help save the environment. The project partners agree that do to the
transnational network and all the activities going on a lot of knowledge now cross the
borders more easily.
The transnational environment has connected people with the same interests in
different countries, now working together with the joint issue
Among project partners in the Best Agers project, the view is that the project wouldn‟t have
been possible without the transnational set-up, enabling knowledge sharing and exchange
and together addressing a problem that is common for all of the partaking countries. It has
also served as an opportunity for regions facing demographic change and an aging
population to meet other regions in the same position, in other countries.
In the BGLC project all project partners and end-users agree that the project have resulted
in an increased capability to work in transnational environment. Partners now have contact
with other partners in countries that they did not before. The project changed the perception
of boundaries in infrastructure planning.
For project end-users in the EfficienSea project, the transnational approach meant that
they could find new partners and organizations, as well as finding new ways of cooperation.
Overall, the contact between the partners and end-users in the Longlife project has resulted
in an increased capability to work in a transnational environment. Also, partners and end-
users representing Universities state that the project has resulted in the Universities
cooperating on different issues.

Analysis of projects in 2007-2013 and setting baselines and targets for the indicators 2014-2020 47
5.6 Differences in type of capacity building based on priority theme
One of the aims of this strategic evaluation has been investigating which are the most relevant
dimensions of capacity-building for each selected thematic area of the projects.
The projects in the BSRP 2007-2013 are all allocated to a specific thematic area due to their
different focus. Since the case studies are of a limited number of selected cases (15) and the
thematic areas are quite many, these thematic areas are clustered into the three relevant (the 4th
Priority is not relevant in this evaluation) priorities of the BSRP 2007-2013.
The priorities are:
Fostering innovations across the BSR; covering innovation, renewable energy and energy
efficiency
Improving internal and external accessibility; covering interoperability of transport
modes/efficient transport corridors
Management of the Baltic Sea as a common resource; covering improvement of the
environmental state of the Baltic Sea, Sustainable use of marine resources and Maritime safety
and environmental shipping
Each of the selected projects in the case study has been divided along these priorities.
Table 8 Projects are divided into the relevant priorities of the BSR Programme 2007-2013
P1. Fostering
innovations
across the BSR
Best Agers Longlife REMOWE SCIENCE LINK StarDust
P2. Improving
internal and
external
accessibility
Baltic Biogas
Bus
BGLC BSR InnoShip EWTC II TransBaltic
Management of
the Baltic Sea
as common
resource
Aquabest CHEMsea EfficienSea PURE SUBMARINER
To some extent the different focus of the projects also provide a difference in what the most
relevant dimensions of capacity-building are. In the following table the different dimensions of
capacity building are exemplified according to priority axis.
Theme 2:
Capacity-building of actors in the
region
2.1 How have current projects contributed to the
institutional capacity-building in the region in selected
thematic areas?
Experiences gained in transnational cooperation help form transnational networks
Again the CHEMsea project is an example of how the transnational way of working have
helped partners gain experience, make significant contacts with partners in different
countries and from this experience form a network, in this case the Center of excellence. The
Center ensures that the work continues after the project is completed. The project partners
state that the project could not have been executed without the transnational cooperation
and the transnational environment. In terms of science and research the project is truly
transnational. Several partners have met and gotten to know each while cooperating in
developing methods and conducting research for instance. The creation of plans and
participation in meetings, have resulted in better contacts transnationally which continues
through the Center of Excellence.

Analysis of projects in 2007-2013 and setting baselines and targets for the indicators 2014-2020 48
Figure 4 Examples of capacity building dimension according to priority axis
Enhanced institutionalized knowledge and competence
Improved governance structures and organizational set-up
More efficient use of human and technical resources
Better ability to attract new financial resources
Increased capability to work in a transnational environment
P1: Fostering innovations
Guidelines on i.e. transnational cooperation and increased network (StarDust),
Retention and transfer of knowledge from older to younger people, and also awareness of the issue (Best Agers)
Scientific publications (StarDust)
Clear offer for research infrastructure for private firms (ScienceLink)
Guidelines on sustainable building and engineering, as well as legal and tendering procedures (Longlife)
New ways of working with private firms, continued formal cooperation (ScienceLink)
New governmental structures, new org. setup for student-company activities (StarDust)
Follow up projects for the projects StarDust and BestAgers
New ways of cooperating with academy, international class of students (REMOWE)
Virtual business incubator and matching platform (web portal) (Best Agers)
Project Management System for transnational projects (StarDust)
New methods of working with private sector, better use of research infrastructure(ScienceLink)
Virtual project room and information web portal (Longlife)
Pilot for decision-support system of regional policy making and investments, Joint platform for supporting innovation processes (REMOWE)
Investment strategy and new financial instrument (StarDust)
New ideas – base for new applications, increased know how for writing applications for private firms (ScienceLink)
Increased knowledge has led to increased willingness to fund similar projects (BestAgers)
Increased knowledge will lead to better ability to attract funding (REMOWE)
Regional plans on transnational cooperation were built based on guidelines produced, consortia’s and strengthened networks. (StarDust)
Formal (transnational) network between academia-industry (ScienceLink)
Knowledge from other countries was crucial for some, since the level of knowledge was very different. The transnational set up helped to adopt methods and models to local conditions. (REMOWE)
P2: Internal and external accessibility
Guidelines, manuals, feasibility studies for investments, manual for green transport corridors, economic analyses for infrastructure investments (all projects)
Reports made available through website, informed politicians (all projects)
More active promotion of EU investments on regional level, increased knowledge and networks (BGLC)
Increased knowledge among decision makers (EWTC II, BSR InnoShip)
New networks (e.g. EWTC Association)
Follow up projects (e.g. TransGovernance)
New regional transport plans, clarified roles between actors (Baltic Biogas Bus)
Report on ITS (Intelligent Transport System)(EWTCII)
Feasibility studies for infrastructure investments that has actually resulted in new infrastructure investments
Knowledge derived useful for determining future infrastructure investments (TransBaltic)
Funding received for follow up projects (Baltic Biogas Bus and EWTC II)
More knowledge of funding available (BGLC)
Network formed for future cooperation (Baltic Biogas Bus)
New perspective on boundaries (regional, national) in infrastructure planning (BGLC)
Transnational setup has been necessary (Transbaltic, BGLC, EWTC II)
P3: The Baltic Sea as common resource
Manuals and guidelines for good practice and mobilization related to wastewater management (PURE)
Inventory of current state and development of the sea, (SubMariner) new knowledge and increased network (SubMariner)
The SUBMARINER Network - umbrella organization and catalyst for a number of initiatives. List of partners working with the issue (SubMariner)
Center of excellence formed (CHEMsea).
Benchmark online database, online training material (PURE)
Information portal (SubMariner)
Better communication, organizational structure and increased knowhow (Aquabest)
Different kind of software for
Issue treated as an investment in security by the EU, center of excellence will look for new funding (CHEMsea)
Cooperation with organization that funds large projects (PURE)
Better contacts, working through the center of excellence (CHEMsea)
Transnational setup enabled local level acting (PURE)
Clarification of roles in transnational cooperation

Analysis of projects in 2007-2013 and setting baselines and targets for the indicators 2014-2020 49
Knowhow used by policy makers (CHEMsea)
Tool for information sharing (EfficienSea)
Improved communication and information sharing on a regional level (Aquabest)
Follow up projects such as, EfficienSea 2 continuing the project EfficienSea
Partners such as Universities and transport sector working together (EffienSea)
maritime transport (EfficienSea)
To some extent better use of human resources through better cooperation (EfficienSea) Better use of infrastructure to some extent.
*difficult to determine what can be ascribed to the different projects in this category
Flagship status attracts funding. Funding via new association (SubMariner)
Funding received for follow up projects (EfficianSea)
(Aquabest)
Developed network concept for knowledge sharing (EfficienSea)
New ways of international cooperation (EfficienSea)

Analysis of projects in 2007-2013 and setting baselines and targets for the indicators 2014-2020 50
Developing guidelines important in all three priorities to enhance institutional
knowledge and competence – target group differs: The table above shows that
developing guidelines is a big part of enhancing institutionalized knowledge and competence
for projects in all three priorities. Apart for the actual content and subject at hand, the
guidelines differ in the sense of who they are directed to. This is dependent of the end-users
of the different projects. Projects in the second priority (P2), Improving internal and external
accessibility, direct their reports, guidelines etc. more to investors than projects within the
other priorities. In the third priority (P3), Management of the Baltic Sea as a common
resource, projects direct their reports and guidelines to policymakers to a higher extent. In
the first priority (P1), Fostering Innovation across the BSR, publications are more of a
scientific nature, directed to researchers and private firms working with innovations.
Activities directed to improve governance structure differ according to the target
group: Activities directed to improve governance structures also differ according to the
target group of the different projects. The projects directed to innovation within P1 have
focused on activities towards strengthening Triple Helix and the cooperation between
students/universities and private firms. Projects within P3 are also directing their efforts to
improve governance structures to the academia, scientists and universities. The networks
formed are of experts in the various fields (i.e. scientists). In P2 the projects seem to direct
their networks, strategic documents etc. directly towards the end-users working with the
issue at hand (policy and decision makers).
Developing technical solutions are more important for projects within P1 and P3
than in P2: Projects in P1 and P3 have developed various technical systems, databases,
technical solutions, etc. for more efficient use of human and technical resources. For projects
in P2 dealing with improving internal and external accessibility this dimension of capacity
building is not as relevant, due to the nature of these projects and their focus. In these
projects knowledge and networking are more crucial for project outcomes.
Investors differ between project priorities; hence activities toward attracting new
finance differ: In terms of the fourth dimension of capacity building, better ability to attract
new financial resources, the projects within the different priorities have somewhat different
experiences since their potential investors differs due to the different focus of the projects.
The projects within P1 are mainly partnered by research institutions or other experts in the
field and have, through increased knowledge about their respective issues and also an
increased knowledge on how to write applications, improved their ability to attract new
financial resources. One of the projects, StarDust, has even developed an investment
strategy and new financial instrument within the project to attract new financial resources.
Due to knowledge derived from projects in P2 (feasibility studies) investments in new
infrastructure has been made or could be made in the future. This approach to financing
differs from the others since they seek financing for tangible investments at a larger extent.
Some follow-up projects have also received funding, further investigating what future
investments in infrastructure may be necessary. Within P3, the projects have strengthened
their ability to attract new funding by joining in and having formed networks and
collaborations of the respective core issues and will look for funding together cross borders.
The collaborations across borders better their ability to find new financial resources, since
their issues are transnational and involve stakeholders and policy makers in different
countries.
The transnational environment has helped form crucial transnational networks: As
far as increased capability to work in a transnational environment is concerned, the projects
within P1 are all about creating strong transnational networks. The transnational environment
with knowledge sharing from other countries has been crucial for the REMOWE project for
instance, where the level of knowledge has varied substantially between the participating

Analysis of projects in 2007-2013 and setting baselines and targets for the indicators 2014-2020 51
countries. This is also the case for most projects within P3, where the capability to work in a
transnational environment has increased mainly through networks and knowledge sharing.
The transnational set up has been crucial for all projects in P2 as well, and necessary for the
projects‟ completion and success. In addition to forming transnational networks this
dimension has for instance given new perspectives on borders (regional, national) in
infrastructure planning.

Analysis of projects in 2007-2013 and setting baselines and targets for the indicators 2014-2020 52
6. CONTRIBUTION OF THE BSRP TO EUROPEAN
STRATEGIES
This section focuses on how the BSRP contributed to the (successful) implementation of the
EUSBSR and EU2020 strategy respectively. The external evaluation of the BSRP in 2010/2011
included an analysis of the BSRP‟s contribution to the EUSBSR.17 The analysis mapped the
projects in each of the Programme‟s four priority areas according to their relation and relative
contribution18 to the overall pillars and 15 priority areas of the EUSBSR – drawing conclusions and
recommendations based on the mapping. The current external evaluation has used a different
approach to assessing the BSRP‟s contribution to European strategies (both the EUSBSR and the
EU2020 strategy). Rather than making an assessment of all of the Programme‟s projects, this
analysis is based on interviews with a sampling of projects and a sampling of Priority Area
Coordinators (PACs) and Horizontal Action Leaders (HALs) working within the EUSBSR19. The
assessment provides an overall perspective on the Programme‟s relation to the Strategies, and
qualitative input on the types of contributions that the Programme makes to the Strategies. The
assessment also provided perspectives on the importance of the BSRP in relation to other funding
instruments, and features of the BSRP that affect its contribution to European Strategies. The
empirical material is based firstly on an assessment of monitoring data of all funded projects,
targeted interviews with special intention to the coherence with the strategies EUSBSR and
Europe 2020 with PAC/HALs as well as results of the 15 case studies.
6.1 Relation and Contribution to the EUBSR and EU2020 Strategy
Projects funded within the BSRP contribute to realizing all three objectives of the EUSBSR
(Saving the Sea, Connecting the Region, and Increasing Prosperity), as well as all three thematic
priorities of the Europe 2020 Strategy (Smart Growth, Sustainable Growth, and Inclusive Growth)
– to different degrees (see figure 5 below). Given the fact that the EUSBSR was adopted after
the BSRP (2007-2013) was launched and projects were developed to address the particular
priorities and objectives of the BSR Programme, they may not always have clear links to the
objectives of the EUSBSR or thematic priorities of the EU2020 Strategy.
Since the adoption of the EUSBSR in 2009, continuous efforts have been made to structure and
prioritize projects and various other activities according to the 17 Priority Areas and 5 Horizontal
Action Areas of the EUSBSR. Prioritized projects have been labelled as “flagships” by Priority Area
Coordinators and Horizontal Action Leaders. Projects (particularly those related to “flagships”)
thus have a clearer picture of how they relate and contribute to the EUSBSR. Based on the
sampling of projects, there seems to be a slightly stronger contribution to the “increasing
prosperity” objective of the EUSBSR (relative to the other two objectives). This could be driven
by the choice of projects in the sample, or by the way the four priorities of the BSRP have been
defined.
On a strategic level, the EUSBSR has been designed to contribute to achieving the EU2020
Strategy. However, there have been no attempts to structure and prioritize projects and other
activities according to particular priorities and objectives of EU2020. Thus, projects (as well as
PACs and HALs) perceive that they make only indirect contributions to fulfilling the EU2020
Strategy. The project sampling seems to indicate that there is a relatively weak contribution to
the thematic priority of inclusive growth, but a quite strong contribution to the thematic priorities
of smart growth and sustainable growth – often in combination. This seems to be driven by the
perspective that project activities address environmental and economic goals at the same time.
In other words, societal challenges are also viewed as business opportunities.
17 Deabaltika (2011). Strategic Evaluation in the Baltic Sea Region Programme 2007-2013. Final Evaluation Report. 18 Based on the total score of all related projects (calculated from various assessment criteria) 19 See description of approach and methodology in section 2.1 above

Analysis of projects in 2007-2013 and setting baselines and targets for the indicators 2014-2020 53
Figure 7: Projects’ Relation to EUSBSR and EU2020 Strategy
Irrespective of how projects related to the objectives of EU Strategies, BSRP-funded projects
seemed to make similar types of contributions. Projects, PACs and HALs highlighted results such
as:
Strengthening linkages/networks between actors in all BSR countries (inclusive of all –
contributing to stronger cohesion)
Sharing knowledge and building capacity among partners
Conducting analyses, testing new methods, producing evidence that lead to the
development of guides, strategies, new investment models (for e.g. waste management),
etc. – which can be used to move policy processes forward
Formation of platforms with the potential for long-term strategic action (on policy and
operational levels)
A view expressed by many interviewees was that
“…projects can only take small steps…make small contributions to the overall objectives of
EU Strategies. It is crucial that the project coordinators, the BSR Programme, and the
PACs/HALs communicate and help facilitate the use of results in policy or operational
processes. However, it is up to national ministries to proactively take recommendations on
board.”
It was suggested that the BSRP Monitoring Committee could help reinforce efforts to
communicate and integrate project results into policy processes and help strengthen commitment
and political backing of national governments.
Although there are efforts (from PACs/HALs) to ensure that there are clear linkages between
flagship projects, the objectives of the PA/HAs, and the (two) EU Strategies, it is difficult to follow
the connection between (relatively small) flagship projects and the ambitious objectives/targets
that currently exist for the PA/HAs.
“The results from the flagship projects contribute micro impacts, but are far away (in terms
of impact logic) from the targeted end results at macro-regional level. In order to fulfil the
targets, more muscle/financing is needed to fuel activities on the BSR level.”
There is a desire to develop more realistic targets and indicators, and “effect logics” for the
PAs/HAs – which can help projects communicate how they contribute to realizing the strategic
objectives of the PA/HAs (and of the EUSBSR more broadly).

Analysis of projects in 2007-2013 and setting baselines and targets for the indicators 2014-2020 54
6.2 Importance of the BSR Programme in Relation to other Funding Instruments
The degree to which the BSRP (and the projects it funds) can contribute to the EUSBSR and
EU2020 Strategy is to some extent driven by the level of resourcing (human and financial) that is
invested in particular activities. As highlighted above, more muscle/financing is needed to fuel
activities on the BSR level. Priority Area Coordinators and Horizontal Action Leaders view the
BSRP as a key financial instrument for implementing the EUSBSR (see Table 9 below).
Table 9: Estimated percent of total funding for projects/activities within the scope of PAs/HAs
BSR Programme Other EU Programmes
BSR/Nordic/National sources
PA INNO 40 10 50
HA Sustainable Development
75 10 15
PA Nutri 80 1 19
PA Transport no estimate no estimate no estimate
PA Energy no estimate no estimate no estimate
PA SME 0 50 50
PA Agri 60-70 10 20-30
PA Education 20 40 40
PA Ship 40-50 40 10-20
PA Hazards 40 20 40
HA Involve 0 34 66
PA Market 40 0 60
Average of respondents
40,5 21,5 38
The BSRP provides funding for projects addressing its identified priority areas, as well as funding
to mobilise partnerships/activities in a broad range of areas (even outside the identified priority
areas) through its seed money facility. Based on rough approximations, PAs/HAs estimated that
funding from the BSRP represented more than 40% of total funding for activities undertaken
within their mandated areas. BSR (e.g. CBSS) Nordic (Nordic Council of Ministers) or national
sources (including national ministries, research councils or innovation agencies, the Swedish
Institute, regional organisations or private foundations) represented an almost equal amount.
Other EU Programmes (including other INTERREG programmes, Horizon 2020, BONUS, TEN-T,
and technical assistance from the EU) represented approximately 20% of total funding.
The BSRP is viewed as a key funding instrument for the EUSBSR for several reasons:
Because it catalyses activities with a “transnational value” – activities which may not be
prioritized by any individual country
Because it is one of the few instruments that targets transnational activities in the BSR and
includes most countries;
Because project budgets are generally more substantial than other transnational funding
instruments (enabling projects with “more muscle”);
Because the seed money facility is viewed as such a good instrument for mobilising
networks/initiating new projects; and
Because there are increasingly stronger links between PACs/HALs and the BSRP – helping
ensure that projects have strategic relevance to the EUSBSR
Analysis of projects in 2007-2013 and setting baselines and targets for the indicators 2014-2020 55
However, projects, PACs and HALs expressed a number of limitations to BSRP funding:
The short (up to 3-year) project timeframe does not match the level of ambition in flagship
projects.
Administrative procedures and requirements (including co-financing levels, time to receive
funding, reporting requirements, changes in project partners and budget allocations) are
burdensome.
There are no possibilities for investments in innovation and development activities (e.g. test
and demo facilities, prototyping, etc.).
There are no possibilities to apply for one single event or activity – something particularly
useful for PACs/HALs.
There are budgetary limitations to involving partners in Iceland, Norway and Russia.
There is an expressed desire to establish mechanisms that would both help legitimize
partnerships (ensuring relevant national authorities/agencies are involved) in the project
development phase, and adjust partnerships in the project implementation phase.
“There should be a more structured exchange between PACs/HALs and the BSR
Programme Secretariat to share information and have a common view on priorities, key
criteria for project relevance, etc. Monitoring Committee members should take more
responsibility in discussing upcoming projects and ensuring relevant partners from their
country are involved.”
There is also an expressed desire to consider funding models that enable longer-term or add-on
investments, and that foster smoother links to different funding sources.
“It is a priority of PACs/HALs to help projects take their results to higher levels –
encouraging the actual use and implementation of relevant results. It would be useful if the
BSR Programme Secretariat would also have this „progression‟ in mind and maintain ties
with other relevant sources of funding.”
Analysis of projects in 2007-2013 and setting baselines and targets for the indicators 2014-2020 56
7. CONCLUSIONS AND RECOMMENDATIONS
7.1 Conclusions
The conclusions of the analysis presented below relates solely to the topic that is in focus of Part
I of this report, i.e. the analysis of projects in the 2007-2013 BSRP with regard to produced
sustainable outcomes and contribution to capacity building and EUBSR and EU2020 strategies.
The conclusions presented therefore do not include reflections connected to setting baselines for
qualitative result indicators (Part II of the strategic evaluation).
The case studies show, in general, that the 15 projects that have been analysed have reached
the main goals set for each project respectively, findings based on interviews and outputs and
results in final project reports. This, however, is not necessarily equivalent to the contribution of
sustainable project outcomes defined as the continuation of the longevity of benefits from project
outcomes after cessation of the project. For this reason, over 100 interviews with project
partnerships, end-users and target group and PACs and HALs have been carried out in order to
provide an answer to the following overarching questions:
In how far are project outcomes used by the project partnership beyond the project lifetime
and which factors have facilitated the identified development?
How have current projects contributed to the institutional capacity-building in the Baltic Sea
region in selected thematic areas?
How did the 2007-2013 BRSP contribute to the (successful) implementation of the EUSBSR
and the EU2020 strategy?
In the following sections a summary of main findings from the analysis relating to each
overarching evaluation themes listed above is presented.
7.1.1 Use of project outcomes beyond project lifetime
The use of project outcomes relates to a number of interconnected themes such as type of
outcomes identified among the projects, the sustainability of such outcomes and hindering or
contributing factors governing those outcomes, the involvement of end-users and target groups
as well as the pertinence of investments made in selected projects. Below, the main and
overarching findings of the analysis are presented. For a more detailed review of each conclusion
we refer to the main report.
Through the in-depth case studies of the 15 projects, sustainable project outcomes were
identified and categorised at an aggregated level. The main (i.e. most frequent) types of
sustainable outcomes in the sense that the prerequisites for the continuation of outcomes are
deemed most probable are presented below.
Formalisation of networks and activities after project completion
Increased strategic importance of project theme within partnership organisations
Development of new concepts and tools applied by project partners
The main types of project outcomes and solutions outside the project partnership (i.e. end-users
and target group) have been identified as:
Utilisation of tools and methods developed within BSRP projects
Input for future legislation, policy and investments
Affecting long-term strategies of private firms
Basis for further project-based initiatives
End-users and target groups obviously varies between projects, ranging from private companies
to regional or national decision-making bodies and authorities, industry associations, higher

Analysis of projects in 2007-2013 and setting baselines and targets for the indicators 2014-2020 57
educational bodies, etc. In general, end-users representing wider target group(s) have not been
involved in the initial planning and formation of the projects analysed. However, projects are
often initiated by actors with in-depth knowledge of such group‟s needs, may it be new tools,
knowledge or networks. The main success factors for securing a constructive involvement of end-
users in the projects are identified as:
Involving end-users early on in the project, engaging them in formulating project goals and
identifying needs
Securing a close cooperation with related strategic projects for distinguishing the project at
hand in a wider context and in so doing involving the most relevant target group(s) in project
activities
Clearly defined incentives for industry participation in the sense of having a clear and
attractive offer towards industry, marketing of the offer on a broad basis using industry
intermediaries and involve competencies in the project with great insight and knowledge on
end-users needs.
Based on the review of sustainable outcomes presented above, a number of factors have been
identified for achieving the utilization of project outcomes and solutions by end-users and target
group(s) after project completion. Firstly, the involvement of end-users could be seen as decisive
for the take-up of project results among end-users in latter stages. However, the involvement of
intermediaries working towards or representing the target group(s) are often regarded as being a
more effective way of obtaining sustainable outcomes of the projects. Furthermore, contextual
factors are often brought relating to the ability to produce sustainable outcomes. These
contextual factors consists of (i) well-balanced and defined project goals and intervention logic is
directly related to the possibilities of creating a clear and attractive offer for the involvement of
primarily private companies and engaging policymakers, (ii) a more detailed analysis on the risks
associated with specific end-user and target group(s) possibilities to absorb project outcome in
the short term, and (iii) the timing of the intervention safeguarding that project activities and its
outline are in line with current external developments.
Finally, the issue of relevance and pertinence of physical investments made within selected
projects has been addressed. A total of four projects among the 15 case studies involved
investments in different forms of physical assets, primarily in the form of technical equipment
deemed necessary for the completion of projects. In general, the investments made within the
four projects have contributed to the realisation of project goals and are regarded as being
necessary for the completion of the projects. It does so in a number of ways. As an example,
investments are viewed necessary for engaging (primarily) private companies acting as test units
for parts of the projects. Discrepancies between member states and the need to provide all
project partners with relevant equipment for safeguarding a higher and uniform level of analysis
is another aspect contributing to the relevance of investments. Furthermore, investments in
selected project are regarded as relevant as they form the basis for testing new and innovative
solutions on which to build further project activities. Successful implementation of such
investments contributes, in turn, to the pertinence of those investments in a longer perspective.
7.1.2 Capacity building of actors in the region
In the following section RMC presents the conclusions regarding how the current projects in the
BSR Programme have contributed to the institutional capacity building in the region in the
selected thematic areas. Please note that the analysis of all 90 projects within the 2007-2013
BSRP related to the five capacity building dimensions is not included.
The case studies clarified three main project outcomes leading to enhanced institutionalised
knowledge and competence:
o Knowledge is made accessible through manuals, guidelines etc. where the information
and format is adapted to the end-users taking part of it, making it useful.

Analysis of projects in 2007-2013 and setting baselines and targets for the indicators 2014-2020 58
o Making guidelines, manuals etc. is also a way of making knowledge obtained within
the project used after project completion.
o The forming of a structured and established network that continues working together
with the core issue after project completion.
Some projects create more new knowledge both for the participating partners and others
related to the project, than others depending on the level of knowledge in the region before
the project started. In some cases the level of knowledge regarding the project‟s core issue
has been very low to begin with and has therefore increased substantially for all involved
partners, whereas other projects have increased knowledge substantially for some partners
more than others depending on the partners‟ different levels of knowledge.
The development of guidelines is a big part of enhancing institutionalized knowledge and
competence for projects in all three priorities. The guidelines do however differ in the sense
of who they are directed at, depending on the end-users of the different projects. Projects in
the second priority (P2), Improving internal and external accessibility, direct their reports,
guidelines etc. to investors to a higher degree than projects within the other priorities. In the
third priority (P3), Management of the Baltic Sea as a common resource, the projects direct
their reports and guidelines to policymakers to a higher extent. In the first priority (P1),
Fostering of innovation across the BSR, publications are more of a scientific nature, directed
to researchers and private firms working with innovations.
Case studies show that projects that have created closer cooperation between partners either
through formal or informal networks and collaborations improve the governance structure
concerning the core issues. The projects directed to innovation within P1 have focused on
activities towards strengthening Triple Helix and the cooperation between
students/universities and private firms. Projects within P3 are also directing their efforts to
improve governance structures to the academia, scientists and universities. In P2 the projects
seem to direct their networks, strategic documents etc. directly towards the end-users
working with the issue at hand (policy and decision makers). There are only a few examples
of actual organisational changes among the projects in the study, showing that this is in most
cases not necessary to create change. A strong way of creating new or improved governance
structures is to put it in writing in strategic documents with strategies, plans etc. committing
parties to change their structures and make changes for the issue at hand.
There are several good examples of technical solutions such as databases, websites, software
etc. created within the projects for more efficient use of technical resources within the BSR.
The case studies also show that new ways of cooperating between project partners and
others can save human resources and avoid double work on an issue. Both technical solutions
and ways of cooperating for more efficient use of technical and human resources, are
developed within projects focusing on innovation, P1 and P3, management of the Baltic Sea
as a common resource. For projects in P2 dealing with improving internal and external
accessibility this dimension of capacity building is not as relevant. In these projects
knowledge and networking are more crucial for project outcomes.
A project which is about, or that will help facilitate, new innovative ideas attracts new
financial resources. Some projects give experience and educate partners in application
processes and in doing so the experience itself betters their ability to attract new financial
resources. Projects which have succeeded in creating networks of relevant actors are likely to
have better abilities to attract new financial resources, since the network provides potential
partners, sources of funding, enables them to be present in the relevant networks, receive
regular information on funding opportunities, etc. The projects within the different priorities
have somewhat different experiences since their potential investors differ due to the different
focus of the projects.

Analysis of projects in 2007-2013 and setting baselines and targets for the indicators 2014-2020 59
One of the conclusions that can be drawn from all participating projects in the BSRP subject
to the case study is that they have all increased the partners‟ capability to work in a
transnational environment. Through making contact with institutions/persons in other
countries in the relevant thematic field work in a transnational environment is strengthened
both during the project time and after its completion as well. Participating in the projects has,
as an effect, made cooperation across borders easier. The projects within P1 are all about
creating strong transnational networks. Projects within P3 have also increased the capability
to work in a transnational environment mainly through networks and knowledge sharing. The
transnational set up has been crucial for all projects in P2 as well, and necessary for the
projects‟ completion and success. In addition to forming transnational networks this
dimension has for instance given new perspectives on borders (regional, national) in
infrastructure planning.
7.1.3 Contribution of the BSRP to European strategies
The question of contribution of the BRSP to European strategies entails how the Programme
contributed to the (successful) implementation of the EUSBSR and EU2020 strategy respectively.
The following conclusions are drawn with respect to the BSRP contribution to EUBSR and EU2020
strategies based primarily on interviews with a sampling of projects and Priority Area
Coordinators (PACs) and Horizontal Action Leaders (HALs) working within the EUSBSR,
complemented by data collected in the 15 case study interviews.
The BSRP has contributed to both the EUSBSR and by gathering and mobilizing stakeholders
from around the Baltic Sea Region, developing and transferring knowledge, providing
analyses and other evidence to guide policy processes, and creating strong platforms for
longer-term action. These activities are viewed as initial contributions or first steps towards
realizing the longer-term, more ambitious goals of the EU Strategies.
The BSRP has clearer, more direct links and contributions to the EUSBSR than the EU2020
Strategy. This is driven by the deliberate structuring and prioritization of projects and other
activities according to the 17 Priority Areas and 5 Horizontal Action Areas of the EUSBSR –
and the BSR Programme‟s recognition of prioritized/strategic projects. BSR Programme-
funded project leaders, PACs and HALs perceive that they contribute to addressing the
priorities of EU2020; however, the contribution is viewed as being more indirect.
Although there are efforts (from PACs/HALs) to ensure that there are clear linkages between
flagship projects, the objectives of the PA/HAs, and the (two) EU Strategies, it is difficult to
follow the connection between (relatively small) flagship projects and the ambitious
objectives/targets that currently exist for the PA/HAs. There is a desire to develop more
realistic targets and indicators, and “effect logics” for the PAs/HAs – which can help projects
communicate how they contribute to realizing the strategic objectives of the PA/HAs (and of
the EUSBSR more broadly).
The BSRP is a key funding instrument to address the objectives of the EUSBSR. Priority Area
Coordinators (PACs) and Horizontal Action Leaders (HALs) estimate that the funding from the
BSR Programme has represented more than 40% of total funding for activities undertaken
within their mandated areas.
The BSRP is viewed as a key funding instrument because of its project and seed money
investments, and because of the strategic links that the BSR Programme Secretariat has
developed with PACs and HALs – helping ensure that investments have strategic relevance to
the EUSBSR.

Analysis of projects in 2007-2013 and setting baselines and targets for the indicators 2014-2020 60
Funds and political backing from (primarily) national sources are of equal importance to
addressing the objectives of the EUSBSR. It is important that national governments are
committed both to supporting/engaging in project activities and integrating project results
into policy processes.
It is critical that funding instruments are used to complement each other and ensure
continuity of prioritized activities. It would be desirable that the BSRP Secretariat maintain
ties with other relevant sources of funding and develop new funding models that enable
longer-term or add-on investments.
Although the BSRP provides important contributions to the EUSBSR (and indirectly to
EU2020) through its strategic-level dialogue with PACs/HALs, project and seed funding, and
project results, there are a number of Programme features that currently hinder its
contribution to EU Strategies. These features include the limited project timeframes, the lack
of possibilities to invest in transnational innovation activities (with more involvement of
business), administrative procedures and requirements, and limitations to involving partners
outside of the 8 EU member countries.
7.2 Recommendations
In the following sub-sections, the main recommendations following from the conclusions drawn
above are presented related to each of the three themes respectively. The recommendations
concerns both the overall Programme level serving as input for the 2014-2020 BRSP as well as
serving as basis for formation of individual future projects within the Programme.
7.2.1 Use of project outcomes beyond project completion
The main overarching recommendations on how to facilitate sustainable outcomes of future
projects is presented below.
Promote efforts safeguarding sustainable outcomes of project: Projects in the 2014-
2020 BSRP should emphasise activities safeguarding the realisation of the main types of
sustainable outcomes identified in the case studies in the form of (i) utilization of tools and
methods outside partnership, (ii) input for future legislation, policy and public investments,
and (iii) affecting long-term strategies of firms. A clear understanding of how the project at
hand, depending on the project outline, can promote such outcomes is to be a pre-requisite
for safeguarding the take-over of project outcomes in the region.
Make the most of utilisation of project outcomes beyond partnership: A number of
contextual factors have been identified as crucial for determining the utilisation of project
outcomes in the region. Firstly, timing of the projects matter and is an aspect that should be
taken into greater account. To safeguard that project activities and its outline are in line with
current policy developments are seen as one of the main positive determinants influencing
the ability to produce sustainable project outcomes. Secondly, some sectors of industry are
more conservative than others and certain type of policies are less likely to be adapted by
decision-making bodies in the shorter term than others. Projects are therefore suggested by
several respondents to be subject to a more detailed analysis on the risks associated with
specific end-user and target group(s) possibilities to absorb project outcome in the short
term. Thirdly, an important lesson from prior projects has been to produce outputs that
clearly points towards a specific action in the form of recommendations where project
partners has the authority to act. In short, the project results must strategically be lifted on
the proper political level, either regional, national or EU-level and this should be emphasised
in the project application phase.
Emphasize the added value of BSRP involvement towards academia: Several
respondents underline the need to recognize that involvement of academia in BRSP projects
to a great extent promotes the careers of individual researchers and other experts. This
Analysis of projects in 2007-2013 and setting baselines and targets for the indicators 2014-2020 61
aspect should be further emphasized in projects where the topic is of high and transnational
importance making it more feasible to attract such experts to the projects.
Create incentives for industry involvement: Projects developed within the 2007-2013
BSRP typically involves highly complex challenges requiring a solid understanding of the
target group/end-user needs. Industrial reference groups are however seldom visible in the
projects. Involvement of end-users early in the project formation is a key determinant for
success in many of the projects studied, although few projects have adopted this approach.
One of the main challenges identified in engaging private companies in the projects of the
2007-2013 BSRP is a lack of clearly formulated incentives for industry participation. The main
success factors involving industry is identified as the ability to (i) have a clear and attractive
offer, (ii) conduct intense marketing of the offer on a broad basis using intermediaries with
industry knowledge, and (iii) involve competencies in the project with great insight and
knowledge on end-users needs. These three success factors can be viewed as generic when
working towards a target group consisting of mainly private firms. Furthermore, the discourse
companies‟ use is different from what traditional partnership representatives or researchers
use, thus resulting in a challenge to the project at hand interesting and useful for companies.
The recommendations following from these insights is the need for future projects to include
industry end-users already in the planning phase of a project to a greater extent (e.g.
through innovation sessions) and clearly formulate the incentives available for securing their
involvement.
Facilitate an effective project organisation: Several respondents emphasises that the
width and scope of the project‟s main topic of focus is directly related to the possibilities of (i)
creating a clear and attractive offer for the involvement of primarily private companies, and
(ii) the possibility to engage policymakers in facilitating needed changes and investments
within the policy area. Well-balanced and defined project goals and visions clearly facilitate
the communication of the project‟s intervention logic, in turn creating a solid ground for the
uptake of project outcomes. The greater the number of project partners, the greater the need
for administrative resources whereas the number of partners should not be excessive.
Furthermore, projects within the BRSP always involve new kinds of international networks
and combinations of expertise. In this sense project partners need to break familiar patterns
and often combine different views and competencies. This sets new challenges for project
administration and it is also challenging when finding the right roles for the partners. A
recommendation following from these observations is to demand a project plan that clearly
defines (i) the intervention logic of the project and (ii) the role and responsibilities among
project partners in securing durable project outcomes.
Secure a close cooperation with strategic projects – A great number of projects is
focused on creating networks with relevant actors on a political level serving as the target
group of the project. Since many projects are working on a high strategic level, project end-
users involve national governments and authorities, regional public actors, private sector, etc.
On this background, we see a need to in a greater extent cooperate with other relevant
projects. This is to be viewed as a success factor for distinguishing the project at hand in a
wider context and in so doing involving the most relevant target group(s) in project activities.
A greater emphasis on cooperation in the form of common project related activities with other
relevant project (within or outside the BSRP) is therefore strongly recommended.
7.2.2 Capacity building of actors in the region
The main recommendations on how projects in the next Programme should work on capacity-
building in the region are presented below.
In order to achieve enhanced institutionalised knowledge and competence through a project
intervention, the projects should not only strive to manifest the knowledge stemming from
the project through manuals, guidelines, booklets etc., but projects should also work on

Analysis of projects in 2007-2013 and setting baselines and targets for the indicators 2014-2020 62
adapting these documentations to the relevant end-users or target group, in order to
make them useful and to spread the knowledge stemming from the project in a useful way.
The projects should work on creating activities to form close cooperation between
relevant parties to ensure improved governance structures. This could result in formal or
informal networks. The projects should also focus on committing parties to work
together for an issue by drawing up strategic documents. These documents could concern
project partners or policymakers and others outside the project; the key is to ensure
documents leading to commitment.
Projects within the next Programme should always look into what technical solutions
could be relevant to save time and technical resources in the BSR. Projects should also
work on connecting relevant partners for cooperating, in order to save human resources
and to avoid double work on the core issues.
In order to improves their ability to attract new financial resources projects should be about,
or help facilitate, new innovative ideas. Projects should work on educating partners in
application processes improving their ability to attract new financial resources in this
way. Projects should also work on facilitating the creation of networks among relevant
partners, and in doing so bettering the ability of these partners to attract new financial
resources, since the network provides potential partners, sources of funding, enables them to
be present in the relevant networks, receive regular information on funding opportunities,
etc.
Participating in the projects automatically increases the project partners‟ capability to work in
a transnational network. To further increase the partners’ capability to work
transnationally projects should facilitate partners’ ability to make contact with
relevant partners at institutions in other BSR countries. This strengthens the
transnational work both during the project time and after its completion as well.
7.2.3 Contribution to European Strategies
Develop a more structured exchange between PACs/HALs (and their Steering
Committees) and the BSRP Secretariat (and its Monitoring Committee) to share
information and have a common view on strategic priorities, key criteria for project
relevance, legitimize project partnerships, etc.
In conjunction with the ongoing process to revise targets and indicators for Priority Areas and
Horizontal Action Areas, support the development of “effect logics” which can help
projects communicate how they contribute to realizing the strategic objectives of
the PA/HAs (and of the EUSBSR more broadly).
Adopt more flexible approaches to allow adjustments in project partnerships and
budget allocations during the project implementation phase. This entails a continuing
focus on lowering administrative burdens and reporting procedures of the programme, as
well as maintaining ties with other relevant sources of funding and develops new funding
models that enable longer-term or add-on investments.
Adopt new regulations to foster increased business involvement and transnational
innovation activities (e.g. investments in test and demonstration activities).
Leverage the BSRP Monitoring Committee to reinforce efforts to communicate and
integrate project results into policy processes and help strengthen commitment and
political backing of national governments.

ANNEX 1 CRITICAL REFLECTION OF THE ANALYSIS
In this section we briefly discuss out assessment of strengths and weaknesses of Part I of the
evaluation report and specific difficulties encountered during the course of the evaluation. Please note
that this section only relates to the analysis of Part I of this report and do not include reflections
connected to setting baselines for qualitative result indicators (Part II of the strategic evaluation).
The data collection phase including primarily the booking and carrying out of a large number of
interviews went above expectations and one of the main strengths of the analysis is the broad
perspectives from the projects obtained through the in-depth discussions with project
partnerships and end-users/target group. Despite the fairly high level of sophistication in the
analytical framework and following interview guidelines (developed separately for primarily
project partnerships, end-users/target groups, PACs/HALs), the ability to engage in fruitful
discussions with each respondent type are regarded as, in general, being of high quality. This is
viewed as one of the main strengths of the analysis taking in a range of different perspectives
and gives rise to a well-balanced analysis of project outcomes and contribution.
The issue of theoretical saturation is an important question to be addressed by future strategic
evaluations. Within the framework of this evaluation more than 100 interviews have been carried
out, often including more than one hour of dense material collected. One again it‟s a balance
between obtaining a sufficient degree of different perspectives from project partners and end-
users/target groups and the challenges related to analyse such vast amounts of data material at a
later stage. The high amount of in-depth interviews carried out within the course of this
evaluation is therefore to be regarded both as one of its main strengths and its main risk
connected to disregarding viable information on produces outcomes and solutions from the
projects.
The identification of relevant end-users and target group(s) by project partnership entails a
probable biased in the selection of these groups. This is a common challenge in evaluations of this
kind, including the balance between effectively identifying respondents willing to participate in
interviews and reaching out to more nuanced critique of the project from other sources. One
suggestion is to impose the project partnership to present a more extensive list of primarily end-
users from which the evaluator in a later stage can make a randomised selection.
The balance between a traditional ex-post evaluation and a strategic evaluation of this kind,
focusing on identifying sustainable solutions to project outcomes bears with it a number of
challenges. A strict focus on the second objective would require a more in-depth analysis of the
intervention logic of both the BSRP and individual projects and the development of a theory of
change to be analysed. This, in turn, is a time consuming effort that would necessitate a
substantial increase in the scope of the evaluation. However, a theory based evaluation of a
limited number of projects would not include such broad reflections ranging over several projects
that have been acquired within the framework of the current analysis.
The interviews have provided a good understanding of the BSRP‟s contribution to the EUSBSR,
but a more limited understanding of the BSRP‟s contribution to EU2020. (This is because all the
PACs and HALs understand that all PAs/HAs of the EUSBSR contribute to EU2020, but do not
know specific linkages or contributions.) The interviews have also provided a number of very
specific suggestions to improve the relation between the BSR Programme and the PACs/HALs
(and thus strengthen the BSR Programme‟s contribution to EU strategies).

64
ANNEX 2 LIST OF INTERVIEWEES
Science Link Lead Partner Uwe Sassenberg, DESY Deutsches Elektronen Synchrotron
Project partner María Fernanda Bocángel, Invest Skåne
Project partner Martin Meedom Nielsen, Technical University of Denmark
End-user Anna Stenstam, Colloidal Resource
End-user Erik Olsson, SOL VOLTAICS AB
End-user Axel Knutsson, Alfa Laval
StarDust Lead Partner Karin Nygård Skalman, VINNOVA
Project partner Kerstin Hindrum, SP
Project partner Carola Wictorsson, Culminatum Helsinki
Project partner Lilita Sparane, Latvian IT Cluster
End-user Mats Hjortberg, Coriolis
End-user Aiga Irmeja, Demola Latvia
Best Agers Lead Partner Hartwig Wagemester, wirtschaftsakademie, Schleswig Holstein
Project partner Arnis Sauka, Stockholm School of Economics in Riga
Project partner Anita Richert-Kazmierska, Gdansk University of Technology
Project partner Ewa Hedkvist Petersen, NOPO - The Nordic Older Peoples Organisation
End-user Ingela Uvberg, Priorum
End-user Michal Bruski, Wicedyrektor Wojewódzkiego Urzędu Pracy w Gdańsku
End-user Gert Lang-Lendorff, mentors for businesses in Schleswig-Holstein
CHEMsea Lead Partner Jacek Beldowski, Institute of Oceanology of Polish Academy of Sciences
(IO PAS)
Project partner Paula Vanninen, Finnish Institute for Verification of the Chemical
Weapons Convention (VERIFIN)
Project partner Bartłomiej Pączek, Polish Naval Academy (PNA)
End-user Minna Pyhälä, HELCOM
End-user Kirsi Kentta, Finnish Ministry of Environment
End-user John Hart, SIPRI
PURE Lead Partner Hannamaria Yliruusi, Union of the Baltic Cities Commission on
Environment Secretariat/City of Turku
Project partner Lotta Ruokanen, Communication Manager
End-user Jaakko Henttonen, NDEP Manager
End-user Jan-Eric Luft, Sewage Management Facilities Lübeck
Project partner City of Gdansk, Dagmara Nagorka-Kmiecik
REMOWE Lead Partner Eva Thorin, Mälardalen University
Project partner Ari Jääskeläinen, The Municipal Federation of Savonia University of
Applied Sciences (SUA)
Project partner Olga Anne, Klaipeda University (KLU)
Project partner Agnieszka Łukaszewska , Marshal Office of Lower Silesia (MLS)
End user Elias Hakalehto, Finnoflag OY
Longlife Lead Partner Maria-Ilona Kiefel, Berlin Institute of Technology
Project partner Habil. Josifas Parasonis, Building planning systematics centre (sps
centras)

65
Project partner Peter Krarup, City of Roskilde Planning and Building department
Project partner Marek Krzaczek, Gdansk University of Technology
End-user Rimantas Didžiokas, Klaipeda University
End-user Ove Morck, Cenergia
CoolBricks Lead Partner Dirk Humfeldt, Free and Hanseatic City of Hamburg, Ministry of Culture
and Media, Department for Heritage Preservation
Aquabest Lead Partner Jouni Vielma, Finnish Game and Fisheries Research Institute
Project partner Erik Olofsson, Torsta AB, Jämtland
End-user Anu Sandelin, The Finnish Fish Farmers‟ Association
End-user Mikkel Detz Jensen, BioMar
End-user Knut-Olof Lerche, Raisioagro
End-user Marco Milardi, HELCOM
Submariner Lead Partner Joanna Przedrzymirska, The Maritime Institute in Gdansk
Project Partner Hilary Lewis Karlson, Green Center
Project Partner Peter Frank, ScanBalt
End user Bjarne Haxgart, EON wind DK
Project partner Angela Schultz-Zehden, s.Pro – sustainable projects GmbH
TransBaltic Lead Partner Mats Petersson, Region Skåne
Project partner Wiktor Szydarowski, TransBaltic
End-user Thomas Erlandson, Swedish Ministry of Enterprise, Energy and
Communications
End-user Jean-Marc Venineaux, European Commission, DG REGIO, Competence
Centre for Macroregions and European Territorial Cooperation
End-user Oddgeir Danielsen, Northern Dimension Partnership on Transport and
Logistics
End-user Susanne Ingo, Swedish Transport Administration
EWTC II Lead Partner Mathias Roos, Region Blekinge
Project Partner Algirdas Sakalys, President East West Transport Corridor Association
Project Partner Mats Petersson, Region Skåne
Project Partner Patrick Schwabe, Port of Sassnitz
Project Partner Niels Selsmark, Swedish Transport Agency
End-user Darius Brekys, Lithuanian Forwarders Association
BGLC Lead Partner Carina Aschan, Region Västerbotten
Project partner Hans Dunder, City of Sundsvall
Project partner Jukka Lindfors, Tampere region
Project partner Leif Petersson, Region Blekinge
End-user Marie Israelsson, Sundsvall Logistikpark AB
End-user Pekka Sundberg, Port of Pori
End-user Torbjörn Witting, Port of Kokkola
BRISK Lead Partner Peter Søberg Poulsen, Admiral Danish Fleet HQ, National Operations,
Maritime Environment
EfficienSea Lead Partner Morten Brix Laursen, Danish Maritime Authority
Project partner Julius Gajevskij, Maritime Institute
Project partner Peter Grundevik, SSPA Sweden AB

66
End-user Christian Kock, Danish Maritime Authority
End-user Kaisu Heikonen; Finnish Transport Agency
End-user Ole Krag, Danish Meterological Institute
End-user Jeffrey Ralph Van Gils, Ministry of Infrastructure and Environment,
Netherlands
BSR
InnoShip
Lead Partner Esa Kokkonen, The Baltic Institute of Finland
Project partner Steen Sabinsky, Maritime Development Center of Europe
Project partner Jukka-Pekka Jalkanen, Finnish Meteorological Institute
Project partner Krzysztof Kolwzan, Polish Register of Shipping (PRS)
End-user Kari Granberg, Viking Line
End-user Anita Mäkinen, Finnish Transport Safety Agency
Baltic Biogas
Bus
Lead Partner Stefan Wallin, Stockholm Public Transport Company
Project partner Jaanus Tamm, Tartu City
Project partner Mr. Stein Bjørlykke, HOG Energy
End-user Mr. Ahto Oja, Estonian Biogas Association
End-user Mr. Jaanus Sahk, Enterprise Estonia
PA Nutri Ministry of the
Environment
Finland
Kristiina Isokallio
Laura Saijonmaa
PA Hazards Swedish
Environmental
Protection Agency
Jenny Hedman
PA Ship Danish Maritime
Authority
Bjarke Wiehe Bøtcher
PA
Innovation
Ministry of
Enterprise,
Energy and
Communications,
Sweden
Stefan Cairén
PA Agri Ministry of
Agriculture and
Forestry, Finland
Leena Anttila
PA
Transport
Ministry of
Transport and
Communications
of Lithuania
Asta Svirinavičiūtė
PA Energy Ministry of
Climate and
Energy, Denmark
Frank Marcher
HA
Sustainable
development
and bio-
economy
Council of the
Baltic Sea States
Secretariat
(CBSS)
Krista Kampus
PA SME Minister of
Business and
Growth,
Danish Business
Henrik Noes Piester

67
Authority
Increase
Prospertiy:
PA
Education
Norden
Association,
Stockholm
Anders Bergström
HA Involve Region
Västerbotten,
Sweden
Fredrik Gunnarsson
Increase
Prosperity:
PA Market
Ministry of
Economic Affairs
and
Communications,
Estonia
Evelin Kuuse

68
ANNEX 3 INTERVIEW GUIDELINES
Project partnership
Project outcomes (project partnership)
The project intended to address the issues [xxx] (see project application form or project overview template).
Would you say you reached the goals set for the project? Were there any success factors or barriers that
influenced your ability to reach the project goals?
In what ways have you applied the outcomes of the project (developed tools/models/methods) in your own
work/organisation? (i.e. are project outcomes used within own organisation)
[IF RELEVANT, i.e. tangible investments were made] Were the investments made within the project relevant
and appropriate given the goals of the project? Did the investments contribute to the project outcome? If yes,
in what way? If no, why not?
How would you assess the strategic importance of the project outcomes for your own organisation in future
work with issues related to the project?
Project outcomes (end-users/target group(s))
What are the most important outcomes of the project for current and future end-users in your opinion?
To your knowledge, are end-users/target groups making use of the outcomes of the project after its
completion? If yes, in what way?
How would you assess the awareness of the project's outcomes (developed tools/methods/models) in the
region among potential end-users?
How were end-users involved in the project planning and implementation? What do you believe are the
success factors when involving end-user in projects?
Capacity-building
In your view, has the project contributed to any knowhow/competencies that are being used after project
completion? Are knowledge stemming from the project documented/easily available for end-users?
Has the project contributed to better ways of working with the core issues of the project from an
organisational perspective beyond the project lifetime? (e.g. clarification of responsibilities, new means of
communications, new organisational structures) If yes, please specify
Has the project contributed to a more efficient use of human or technical resources in the BSR by the target
group? If yes, please specify? (e.g. common use of resources, new ways of cooperation).
Has the project contributed to a better ability to attract new financial resources? (e.g. knowhow of application
processes, network, development of project ideas). If yes, please specify
Has the project contributed to an increased capability to work in a transnational environment? (e.g. new
contacts within thematic field, capability to take part in transnational activities) If yes, please specify
How did the transnational set-up influence the project in you view? Would it be possible to address the main
issues of the project without transnational cooperation? (Added-value)
Contribution to EUBSR/EU2020
Based on the content of the project, how did the project contribute to the overall goals for EU2020 (SMART
GROWTH: improved investment in RDI, stronger and more diverse employment, better educational
attainment; SUSTAINABLE GROWTH: reduced greenhouse gas emissions, increased share of renewable
energy, increased energy efficiency; INCLUSIVE GROWTH: stronger and more diverse employment, better

69
educational attainment, fewer people in or at risk of poverty and social exclusion) and EUSBSR (SAVING THE
SEA; CONNECTING THE REGION; INCREASING PROSPERITY) where relevant ?
End-users and target group(s)
Background questions
How did you come in contact with the project/project activities/project outputs?
Would you have preferred to be more involved in affecting the planning and implementation of the project?
(information, consultation, participation)
Use of project outcomes beyond project lifetime
The project intended to address the issues [xxx]. Would you say that this corresponds with your view on the
project outputs? Should the project have focused on other areas as well from your perspective?
What, if any, are the main impacts on your organisation from the activities carried out by the project?
(developed tools/models/methods/knowledge/decisions)? How have you made use of project outcomes? If
you have not yet used the outcomes, what would be prerequisite for you to apply the outcomes?
Were your expectations behind participating in project activities/making use of project outcomes fulfilled?
(e.g. did the project deliver as expected, etc.) (Note: depending on type of project, not relevant for all type of
respondents)
Were there any success factors in the way the project was set-up or its offer/focus that were of special
importance for your organisation?
Capacity-building
In your view, has the project contributed to any new knowhow/competencies for your organisation in any
way? If yes, how have you made use of this knowhow/knowledge?
Has the project contributed to new ways of working with these issues within your organisation/new priorities?
(e.g. clarification of responsibilities, new means of communications, new organisational structures)
Has (or will) the project contributes to a more efficient use of human or technical resources in any way? (e.g.
new use of available resources, new ways of cooperation, new ways of dealing with the issues at focus by the
project)
Has the project contributed in any ways to a better ability to attract new financial resources? (e.g. knowledge
on new financial resources, knowhow of application processes, network, development of project ideas)
Has the project contributed to an increased capability to work in a transnational environment (e.g. new
contacts within thematic field, capability to take part in transnational activities)?
Have you experienced any added-value of the transnational set-up of the project? In what ways was this
noticable for your organisation? Do you believe it would be possible to address the main issues of the project
without transnational cooperation?
Contribution of the Baltic Sea Region Pro-gramme to the EU Strategy for the Baltic Sea Region and to
the Europe 2020 Strategy
Are you aware of the EUBSR/EU2020 strategies? If no, these strategies has a number of priorities (Smart,
Sustainable, Inclusive Growth / Saving the sea, Connecting the region, Increased prosperity) In what ways
would you say the project relates to the priorities of these strategies? Do you view these priorities as relevant
for your activities? What do you consider as being important (within your topic) to focus on from a prosperous
Balic Sea regional development perspective?
PAC/HAL
PA's/HA's relation to BSR Programme and added value of PA/HA activities for EUSBSR and EU 2020

70
How does your PA/HA contribute to realizing the EUSBSR and EU 2020 strategy (in terms of particular
objectives/goals and activities)?
Which BSR Programme-funded projects have been related to your PA/HA?
In what way have these projects contributed to the objectives of your PA/HA? (i.e. what activities have been
made possible? what results have been achieved?)
What other activities have been undertaken to realise your PA/HA‟s goals?
Contribution of the BSR Programme-funded project outputs to the objectives / thematic priorities of
the EUSBSR/EU2020 (thematic priorities are defined)
How do you assess the actual contribution of BSR Programme-funded projects to the objectives of the
strategy? What were the promotive or hindering factors in contributing to the strategy (e.g. knowledge about
the strategy, institutional, administrative)? What would you need to contribute in a better way?
How do you assess the connection and contribution of the BSR Programme-funded projects to the objectives
of the strategy?
Complementary funding sources
In addition to the BSR Programme, what other funding sources have been leveraged by your PA/HA?
Could you please estimate the % of various funding sources that your PA/HA has used to enable
implementation of its goals?
o BSR Programme
o other EU funding (please give examples)
o national/regional/private (including in-kind) funding
Existing gaps in capacity-building in the region
In which thematic field(s) exist, from your perspective, significant gaps regarding capacity-building in the
region? Please name the field(s) and the region(s) you are referring to. For each field and region you named,
please answer the following question: In which of the following five dimensions do you regard the gaps as
being particularly significant:
o Enhanced institutionalised knowledge and competence;
o Improved governance structures and organisational set-up;
o More efficient use of human and technical resources (databases, technical solutions, small infrastructure
etc.);
o Better ability to attract new financial resources;
o Increased capability to work in transnational environment.

71
ANNEX 4 BIBLIOGRAPHY
Structural Funds Regulations for the period 2007-2013
Community strategic guidelines on economic, social and territorial cohesion, 2007-2013
EC Working Document No 5: “Indicative Guidelines on Evaluation Methods: Evaluation during the
programming periods”. April 2007
Operational Programme of the Baltic Sea Region Programme 2007-2013
The Programme Manual of the Baltic Sea Region Programme 2007-2013
EC Working Document No 5: “Indicative Guidelines on Evaluation Methods: Evaluation during the
programming periods”. April 2007; The Evaluation Plan of the Baltic Sea Region Programme 2007-2013
The Annual Implementation Reports 2011 and 2012 of the Baltic Sea Region Programme 2007-2013
Publications of the Programme on approved projects and their link to the EU Strategy for the Baltic Sea Region
Final and progress reports of selected projects
Outputs/publications and reports of finalised projects
Final evaluation report of external strategic evaluation 2010/2011
Draft Operational Programme of the Baltic Sea Region Programme 2014-2020.
European Commission (2009): European Union Strategy for the Baltic Sea Region
Baltic Sea Region Programme: Fact Sheet (updated 26 feb 2013)
EC (2004). The Programming period 2014-2020. Guidance Document on Monitoring and Evaluation –
European Regional Development Fund and Cohesion Fund – Concepts and Reommendations. March 2014.
Deabaltika (2011). Strategic Evaluation in the Baltic Sea Region Programme 2007-2013. Final Evaluation
Report.
Mayne, J. (1999): "Addressing Attribution through Contribution Analysis: Using Performance Measures
Sensibly" (discussion paper)
Brulin, G., Jansson, S., Sjöberg, K., Svensson, L., (2013) “Capturing effects of projects and programmes”,
Studentlitteratur
Riché, M. (2012) Theory Based Evaluation: A wealth of approaches and an untapped Potential, European
Commission
http://eu.baltic.net/Project_Database.5308.html

72
Intended for
Investitionsbank Schleswig-Holstein, Managing Authority of the Baltic Sea Region
Programme 2007-2013
Reference
Baltic Sea Region Programme: Analysis of projects in 2007-2013 and setting
baselines and targets for the indicators 2014-2020
Date
April 2015
PART II
SETTING BASELINES AND TARGETS
FOR THE INDICATORS 2014-2020

SETTING BASELINES AND TARGETS FOR THE INDICATORS
2014-2020
Ramböll
Krukmakargatan 21
Box 17009
SE-104 62 Stockholm
T +46 (0) 8 568 494 40
F +46 (0) 10 615 20 00
www.ramboll.se

Setting baselines and targets for the indicators 2014-2020 74
EXECUTIVE SUMMARY
The Investitionsbank Schleswig-Holstein, appointed Managing Authority of the Baltic Sea
Region Programme 2007-2013, has assigned Ramböll Management Consulting, hereafter
Ramböll, to carry out a strategic evaluation of projects in the 2007-2013 Baltic Sea Region
Programme (BSRP). The assignment consists of two separate but yet coherent objectives:
Objective I: Analysis of the project portfolio of the 2007-2013 BSRP with regard to
achieved results and produced outputs
Objective II: Setting baselines for the qualitative indicators in the 2014-2020 BSRP
The following part of this report focuses solely on the second of these two objectives. For
the programming period 2014-2020 the EU Commission proposes a stronger result
orientation in the field of Structural Policy. Among others, one requirement in this context
is to define a result indicator for each specific objective of a Cooperation Programme. At
the beginning of the funding period, the EU Commission expects a baseline (usually
referring to 2013 or 2014) and a final target for 2023 to be set for each result indicator.
They should serve as benchmarks for the region‟s development during the funding period.
The changes captured by the result indicators will be evaluated mid-term in 2018 and
2020 and after the funding period in 2023. The indicators should reflect a regions
development in a broader context and could therefore not be captured by a programme‟s
monitoring system.
Given the wide geographical coverage and range of topics covered by the Interreg Baltic
Sea Region Programme it is intended to invest primarily in the institutional capacities of
the programme‟s target groups. Therefore, result indicators that focus on capacity-building
among the programme‟s target groups have been defined by the programming bodies (the
JPC supported by the MA/JTS).
In order to practically analyse the potential contribution of the future Interreg Baltic Sea
Region Programme on capacity-building, the concept of institutional capacity has been
further specified. Five dimensions of capacity-building have been identified by the MA/JTS,
based on the potential influence of the Cooperation Programme and based on an
understanding of central elements needed to improve institutional capacity:
- Enhanced institutionalised knowledge and competence
- Improved governance structures and organizational set-up
- More efficient use of human and technical resources
- Better ability to attract new financial resources
- Increased capability to work in transnational environment
In order to use the result indicators as an effective instrument to monitor changes in the
programme region, the situation on institutional capacity needs to be captured at the
beginning, mid-term and at the end of the funding period. For the purpose of setting a
baseline for 2014 and comparing it with the situation in 2018, 2020 and 2023, the applied
method has to allow for a repeatable and comparable procedure and analysis of the
situations at different points in time. In order to be able to precisely describe the
developments in the region, the result indicators have been underpinned with the
aforementioned five dimensions. Each of the five dimensions has further been
operationalised by Ramböll in cooperation with the MA/ JTS with a different set of
characteristics.

Setting baselines and targets for the indicators 2014-2020 75
In order to define baselines and targets, a wide range of thematic experts of the Baltic Sea
Region have been addressed. The experts represent the thematic fields that are covered
by the specific objectives and represent the eight EU-Member States as well as the three
partner countries Belarus, Norway and (parts of) Russia of the Cooperation Programme
2014-2020. The involvement of thematic experts has been carried out in two steps: an
online-survey and additional interviews with thematic experts with the aim to reflect on
the results of the survey and fill remaining gaps.
Results
The survey conducted resulted in indicated baselines and targets for different
characteristics of the five dimensions of institutional capacity-building. Through the
complimentary interviews with thematic experts, the indicated baselines and targets could
be verified.
The results from the survey and interviews indicate that different dimensions of
institutional capacity prove to be challenging for the different specific objectives, even
within the same priority area. Also, there are regional differences in the institutional
capacity in the Baltic Sea Region and therefore, different measures are needed in different
parts of the region.
For the specific objectives within the Baltic Sea Region Programme the potential for
building institutional capacity differs. For a majority of the specific objectives, the ability to
attract new financial resources or improved governance structures and organizational set-
up seem to constitute the greatest challenge. At the other end of the spectrum, increased
capability to work in a transnational environment and enhanced institutionalised
knowledge and competence seem to be the two dimensions of institutional capacity-
building where the target could be set relatively high.

Setting baselines and targets for the indicators 2014-2020 76
CONTENTS OF PART II
EXECUTIVE SUMMARY 74 1. INTRODUCTION 80 1.1 The context of the strategic evaluation 80 1.2 Structure of final report 81 2. METHODOLOGY 82 2.1 Survey 83 2.2 Interviews 85 3. RESULTS OF THE ONLINE-SURVEY WITH THEMATIC EXPERTS 87 3.1 Specific objective 1.1: Research and innovation infrastructure 87 3.2 Specific objective 1.2: Smart specialisation 91 3.3 Specific objective 1.3: Non-technological innovation 95 3.4 Specific objective 2.1: Clear waters 99 3.5 Specific objective 2.2: Renewable energy 103 3.6 Specific objective 2.3: Energy efficiency 107 3.7 Specific objective 2.4: Resource-efficient blue growth 111 3.8 Specific objective 3.1: Interoperability of transport modes 116 3.9 Specific objective 3.2: Accessibility of remote areas and areas affected by
demographic change 120 3.10 Specific objective 3.3: Maritime safety 124 3.11 Specific objective 3.4: Environmentally friendly shipping 129 3.12 Specific objective 3.5: Environmentally friendly urban mobility 133 APPENDIX 1 SUPPLEMENTARY DATA FROM SURVEY 137 APPENDIX 2 LIST OF INTERVIEWED EXPERTS 156
FIGURES
Figure 1: Characteristics of the five dimensions of capacity building in the Cooperation
Programme 2014-2020 ........................................................................................... 82 Figure 2: Scale to assess characteristics of capacity-building ...................................... 83 Figure 3: Aggregation of results for the characteristics within the five dimensions of
capacity-building ................................................................................................... 84 Figure 4: Baseline and target for specific objective 1.1 ............................................... 90 Figure 5: Baseline and target for specific objective 1.2 ............................................... 94 Figure 6: Baseline and target for specific objective 1.3 ............................................... 98 Figure 7: Baseline and target for specific objective 2.1 .............................................. 102 Figure 8: Baseline and target for specific objective 2.2 .............................................. 106 Figure 9: Baseline and target for specific objective 2.3 .............................................. 109 Figure 10: Baseline and target for specific objective 2.4 ............................................ 114 Figure 11: Baseline and target for specific objective 3.1 ............................................ 119 Figure 12: Baseline and target for specific objective 3.2 ............................................ 123 Figure 13: Baseline and target for specific objective 3.3 ............................................ 127 Figure 14: Baseline and target for specific objective 3.4 ............................................ 131 Figure 15: Baseline and target for specific objective 3.5 ............................................ 136

Setting baselines and targets for the indicators 2014-2020 77
TABLES
Table 1: Number of responses to online-survey by country and specific objective .......... 85 Table 2: Number of conducted interviews per group of specific objectives. .................... 86 Table 3: Summary of results for specific objective 1.1. Research and innovation
infrastructure ........................................................................................................ 87 Table 4: Baseline and target for the result indicator of specific objective 1.1 as presented
in the Cooperation Programme ................................................................................ 90 Table 5: Summary of results for specific objective 1.2. Smart specialisation .................. 91 Table 6: Baseline and target for the result indicator of specific objective 1.2 as presented
in the Cooperation Programme ................................................................................ 94 Table 7: Summary of results for specific objective 1.3. Non-technological innovation ..... 95 Table 8: Baseline and target for the result indicator of specific objective 1.3 as presented
in the Cooperation Programme ................................................................................ 98 Table 9: Summary of results for specific objective 2.1. Clear waters ............................ 99 Table 10: Baseline and target for the result indicator of specific objective 2.1 as presented
in the Cooperation Programme ............................................................................... 102 Table 11: Summary of results for specific objective 2.2. Renewable energy.................. 103 Table 12: Baseline and target for the result indicator of specific objective 2.2 as presented
in the Cooperation Programme ............................................................................... 106 Table 13: Summary of the results for specific objective 2.3. Energy efficiency .............. 107 Table 14: Baseline and target for the result indicator of specific objective 2.3 as presented
in the Cooperation Programme ............................................................................... 110 Table 15: Summary of the results for specific objective 2.4. Resource-efficient blue growth
.......................................................................................................................... 111 Table 16: Baseline and target for the result indicator of specific objective 2.4 as presented
in the Cooperation Programme ............................................................................... 115 Table 17: Summary of the results for specific objective 3.1 Interoperability of transport
modes ................................................................................................................. 116 Table 18: Baseline and target for the result indicator of specific objective 3.1 as presented
in the Cooperation Programme ............................................................................... 119 Table 19: Summary of the results for specific objective 3.2. Accessibility of remote areas
and areas affected by demographic change .............................................................. 120 Table 20: Baseline and target for the result indicator of specific objective 3.2 as presented
in the Cooperation Programme ............................................................................... 123 Table 21: Summary of the results for specific objective 3.3. Maritime safety ................ 124 Table 22: Baseline and target for the result indicator of specific objective 3.3 as presented
in the Cooperation Programme ............................................................................... 128 Table 23: Summary of the results for specific objective 3.4. Environmentally friendly
shipping .............................................................................................................. 129 Table 24: Baseline and target for the result indicator of specific objective 3.4 as presented
in the Cooperation Programme ............................................................................... 132 Table 25: Summary of the results for specific objective 3.5. Environmentally friendly urban
mobility ............................................................................................................... 133 Table 26: Baseline and target for the result indicator of specific objective 3.5 as presented
in the Cooperation Programme ............................................................................... 136 Table 27: Research and innovation infrastructure - Enhanced institutionalised knowledge
and competence ................................................................................................... 137 Table 28: Research and innovation infrastructure - Improved governance structures and
organizational set-up ............................................................................................. 137 Table 29: Research and innovation infrastructure - More efficient use of human and
technical resources ............................................................................................... 137

Setting baselines and targets for the indicators 2014-2020 78
Table 30: Research and innovation infrastructure - Better ability to attract new financial
resources ............................................................................................................. 138 Table 31: Research and innovation infrastructure - Increased capability to work in
transnational environment ..................................................................................... 138 Table 32: Smart specialisation - Enhanced institutionalised knowledge and competence 138 Table 33: Smart specialisation - Improved governance structures and organizational set-up
.......................................................................................................................... 138 Table 34: Smart specialisation - More efficient use of human and technical resources .... 139 Table 35: Smart specialisation - Better ability to attract new financial resources ........... 139 Table 36: Smart specialisation - Increased capability to work in transnational environment
.......................................................................................................................... 139 Table 37: Non-technological innovation - Enhanced institutionalised knowledge and
competence ......................................................................................................... 140 Table 38: Non-technological innovation - Improved governance structures and
organizational set-up ............................................................................................. 140 Table 39: Non-technological innovation - More efficient use of human and technical
resources ............................................................................................................. 140 Table 40: Non-technological innovation - Better ability to attract new financial resources
.......................................................................................................................... 141 Table 41: Non-technological innovation - Increased capability to work in transnational
environment ........................................................................................................ 141 Table 42: Clear waters - Enhanced institutionalised knowledge and competence ........... 141 Table 43: Clear waters - Improved governance structures and organizational set-up ..... 141 Table 44: Clear waters - More efficient use of human and technical resources .............. 142 Table 45: Clear waters - Better ability to attract new financial resources ...................... 142 Table 46: Clear waters - Increased capability to work in transnational environment ...... 142 Table 47: Renewable energy - Enhanced institutionalised knowledge and competence ... 143 Table 48: Renewable energy - Improved governance structures and organizational set-up
.......................................................................................................................... 143 Table 49: Renewable energy - More efficient use of human and technical resources ...... 143 Table 50: Renewable energy - Better ability to attract new financial resources ............. 143 Table 51: Renewable energy - Increased capability to work in transnational environment
.......................................................................................................................... 144 Table 52: Energy efficiency - Enhanced institutionalised knowledge and competence ..... 144 Table 53: Energy efficiency - Improved governance structures and organizational set-up
.......................................................................................................................... 144 Table 54: Energy efficiency - More efficient use of human and technical resources ........ 145 Table 55: Energy efficiency - Better ability to attract new financial resources ............... 145 Table 56: Energy efficiency - Increased capability to work in transnational environment 145 Table 57: Resource-efficient blue growth - Enhanced institutionalised knowledge and
competence ......................................................................................................... 146 Table 58: Resource-efficient blue growth - Improved governance structures and
organizational set-up ............................................................................................. 146 Table 59: Resource-efficient blue growth - More efficient use of human and technical
resources ............................................................................................................. 146 Table 60: Resource-efficient blue growth - Better ability to attract new financial resources
.......................................................................................................................... 146 Table 61: Resource-efficient blue growth - Increased capability to work in transnational
environment ........................................................................................................ 147 Table 62: Interoperability of transport modes - Enhanced institutionalised knowledge and
competence ......................................................................................................... 147 Table 63: Interoperability of transport modes - Improved governance structures and
organizational set-up ............................................................................................. 147

Setting baselines and targets for the indicators 2014-2020 79
Table 64: Interoperability of transport modes - More efficient use of human and technical
resources ............................................................................................................. 148 Table 65: Interoperability of transport modes - Better ability to attract new financial
resources ............................................................................................................. 148 Table 66: Interoperability of transport modes - Increased capability to work in
transnational environment ..................................................................................... 148 Table 67: Accessibility of remote areas and areas affected by demographic change -
Enhanced institutionalised knowledge and competence .............................................. 149 Table 68: Accessibility of remote areas and areas affected by demographic change -
Improved governance structures and organizational set-up ........................................ 149 Table 69: Accessibility of remote areas and areas affected by demographic change - More
efficient use of human and technical resources ......................................................... 149 Table 70: Accessibility of remote areas and areas affected by demographic change – Better
ability to attract new financial resources .................................................................. 150 Table 71: Accessibility of remote areas and areas affected by demographic change -
Increased capability to work in transnational environment ......................................... 150 Table 72: Maritime safety - Enhanced institutionalised knowledge and competence ....... 150 Table 73: Maritime safety - Improved governance structures and organizational set-up . 150 Table 74: Maritime safety - More efficient use of human and technical resources .......... 151 Table 75: Maritime safety – Better ability to attract new financial resources ................. 151 Table 76: Maritime safety - Increased capability to work in transnational environment .. 151 Table 77: Environmentally friendly shipping - Enhanced institutionalised knowledge and
competence ......................................................................................................... 152 Table 78: Environmentally friendly shipping - Improved governance structures and
organizational set-up ............................................................................................. 152 Table 79: Environmentally friendly shipping - More efficient use of human and technical
resources ............................................................................................................. 152 Table 80: Environmentally friendly shipping – Better ability to attract new financial
resources ............................................................................................................. 153 Table 81: Environmentally friendly shipping - Increased capability to work in transnational
environment ........................................................................................................ 153 Table 82: Environmentally friendly urban mobility - Enhanced institutionalised knowledge
and competence ................................................................................................... 153 Table 83: Environmentally friendly urban mobility - Improved governance structures and
organizational set-up ............................................................................................. 153 Table 84: Environmentally friendly urban mobility - More efficient use of human and
technical resources ............................................................................................... 154 Table 85: Environmentally friendly urban mobility – Better ability to attract new financial
resources ............................................................................................................. 154 Table 86: Environmentally friendly urban mobility - Increased capability to work in
transnational environment ..................................................................................... 154
APPENDIX
Appendix 1: Supplementary data for each specific objective
Appendix 2: List of interviewed experts

Setting baselines and targets for the indicators 2014-2020 80
1. INTRODUCTION
The Investitionsbank Schleswig-Holstein, appointed Managing Authority of the Baltic Sea Region
Programme 2007-2013, has assigned Ramböll Management Consulting, hereafter Ramböll, to
carry out a strategic evaluation of projects in the 2007-2013 Baltic Sea Region Programme
(BSRP). The assignment consists of two separate but yet coherent objectives:
Objective I: Analysis of the project portfolio of the 2007-2013 BSRP with regard to achieved
results and produced outputs
Objective II: Setting baselines for the qualitative indicators in the 2014-2020 BSRP
Previously, an interim report concerning mainly the first of the two objectives has been carried
out and finalised in December 2014. The following report constitutes the second part of Ramböll‟s
assignment, and addresses the second of the aforementioned objectives. In this part of the final
report, results from the survey and interviews carried out during February-April 2015 are
presented. The report was presented on the Monitoring Committee of Baltic Sea Region
Programme meeting in Stockholm April 28th 2015 where it was discussed and approved by the
Monitoring Committee.
1.1 The context of the strategic evaluation
For the programming period 2014-2020 the EU Commission proposes a stronger result
orientation in the field of Structural Policy. Among others, one requirement in this context is to
define a result indicator for each specific objective of a Cooperation Programme. The indicator
should show the intended change in the region within a specific area or thematic field (e.g.
research and innovation, SMEs, energy efficiency) and thereby should focus on the intervention‟s
main effects. Compared to output indicators, which solely capture the actual operation supported
with the funding, result indicators should relate to the target group in the programme region as a
whole. It therefore should include all potential beneficiaries of the interventions under one
specific objective. By including all potential beneficiaries as the reference for result indicators,
they would not only capture effects that can be directly linked to the programme intervention but
also effects that are dependent on other factors outside the programme‟s influence. Examples of
such indicators could either be quantitative measures like the CO2-emissions or the share of GDP
spent on research and development in the programme area, or more qualitative indicators, such
as increased capacity within public administration or enhanced transnational cooperation.
At the beginning of the funding period, the EU Commission expects a baseline (usually referring
to 2013 or 2014) and a final target for 2023 to be set for each result indicator. They should serve
as benchmarks for the region‟s development during the funding period. The changes captured by
the result indicators will be evaluated mid-term in 2018, 2020 and after the funding period in
2023. Due to the fact that they display a region‟s development in a broader context and not only
relate to operations funded by the programme, result indicators cannot be captured by a
programme‟s monitoring system. Instead, dependent on the nature of the indicators, either an
evaluation should be carried out or secondary data from external sources should be used in order
to illustrate the region‟s development.
For Transnational Cooperation Programmes, such as the Interreg Baltic Sea Region, the new
guidelines on result indicators imply that the result indicators have to capture effects in diverse
thematic fields of the programme area and illustrate them in a comprehensive way as the
average for the region as a whole. The definition of both baseline and targets is a challenging
task for the programme authorities and requires a thorough understanding of the situation in the
programme region and its future potentials.

Setting baselines and targets for the indicators 2014-2020 81
1.1.1 Approach regarding result indicators
The Cooperation Programme of the Interreg Baltic Sea Region builds upon the requirements and
the purpose of using result indicators in the field of Structural Policy. Hence result indicators have
to be defined in the Programme in order to capture the main changes in the region related to the
intervention. Given the wide geographical coverage and range of topics covered by the
programme, funds that can be invested in one individual project are limited. Therefore, in the
Cooperation Programme it is intended to invest primarily in the institutional capacities of the
programme‟s target groups. This would enable it to create a leverage effect for regional
development and transnational cooperation, thus maximising the effectiveness of invested
resources. Following these considerations, result indicators that focus on capacity-building among
the programme‟s target groups have been defined by the programming bodies (the JPC
supported by the MA/JTS).
As previously stated in this introductory chapter, Ramböll has delivered an interim report
analysing the past period‟s (2007-2013) 90 funded projects‟ contribution to capacity-building.
Through this analysis, the importance and relevance of this approach has been verified. In order
to practically analyse the potential contribution of the future Interreg Baltic Sea Region
Cooperation Programme on capacity-building, the concept of institutional capacity has been
further specified. Five dimensions of capacity-building have been identified by the MA/JTS, based
on the potential influence of the Cooperation Programme and based on an understanding of
central elements needed to improve institutional capacity:
- Enhanced institutionalised knowledge and competence
- Improved governance structures and organizational set-up
- More efficient use of human and technical resources
- Better ability to attract new financial resources
- Increased capability to work in transnational environment
The results from the interim report underscore the relevance of these five dimensions. The
analysis also shows that all five dimensions are important throughout the themes funded in the
Operational Programme. This supports the approach of the Cooperation Programme 2014-2020
to focus on capacity-building, characterized by these five dimensions.
1.2 Structure of final report
Following this introductory chapter, the methodological approach for this assignment is presented
in chapter 2. Chapter 3 present the results from the survey and the interviews for each of the
specific objectives. For each of the specific objectives, baseline and targets indicated for all five
dimensions are presented in subsections. In the end of each subsection, results from the expert
interviews conducted are presented to provide an additional perspective on the survey result. For
each specific objective, these subsections are followed by a concluding summary, analysing the
main challenges and opportunities until 2023. More in depth information about the results for the
baseline and target for the different characteristics of the five dimensions is presented in
Appendix 1, where a compilation of supplementary data is provided.
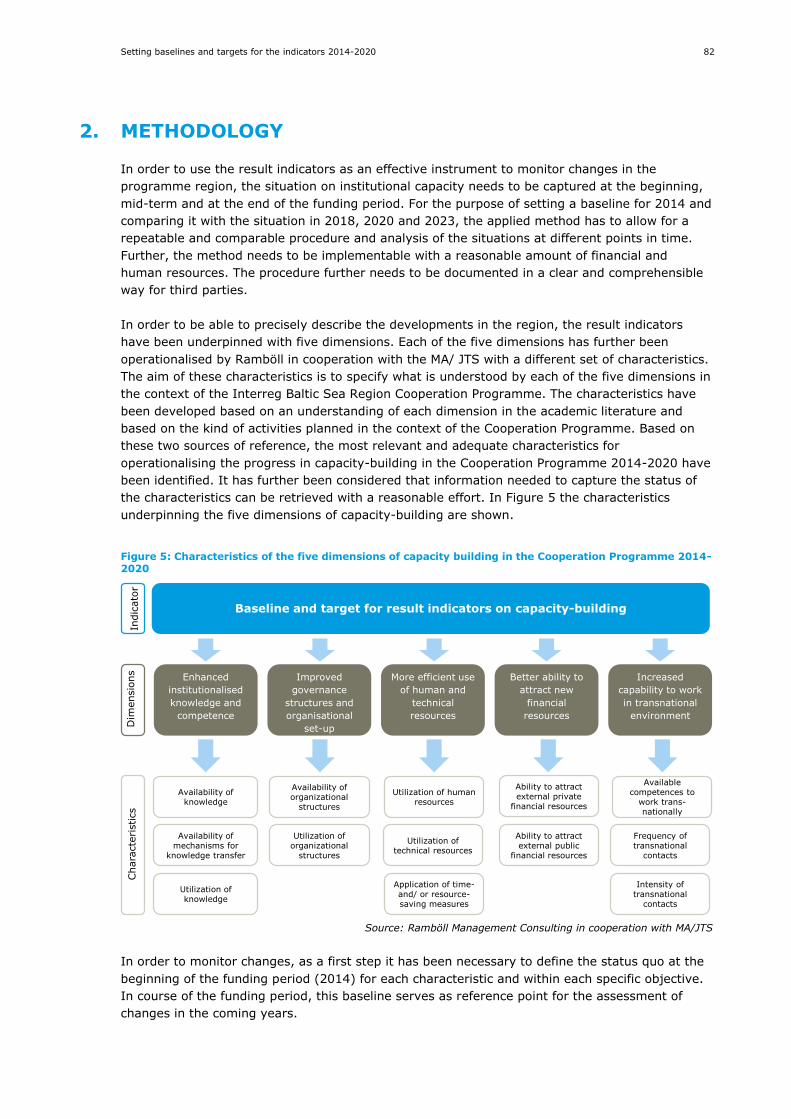
Setting baselines and targets for the indicators 2014-2020 82
2. METHODOLOGY
In order to use the result indicators as an effective instrument to monitor changes in the
programme region, the situation on institutional capacity needs to be captured at the beginning,
mid-term and at the end of the funding period. For the purpose of setting a baseline for 2014 and
comparing it with the situation in 2018, 2020 and 2023, the applied method has to allow for a
repeatable and comparable procedure and analysis of the situations at different points in time.
Further, the method needs to be implementable with a reasonable amount of financial and
human resources. The procedure further needs to be documented in a clear and comprehensible
way for third parties.
In order to be able to precisely describe the developments in the region, the result indicators
have been underpinned with five dimensions. Each of the five dimensions has further been
operationalised by Ramböll in cooperation with the MA/ JTS with a different set of characteristics.
The aim of these characteristics is to specify what is understood by each of the five dimensions in
the context of the Interreg Baltic Sea Region Cooperation Programme. The characteristics have
been developed based on an understanding of each dimension in the academic literature and
based on the kind of activities planned in the context of the Cooperation Programme. Based on
these two sources of reference, the most relevant and adequate characteristics for
operationalising the progress in capacity-building in the Cooperation Programme 2014-2020 have
been identified. It has further been considered that information needed to capture the status of
the characteristics can be retrieved with a reasonable effort. In Figure 5 the characteristics
underpinning the five dimensions of capacity-building are shown.
Figure 5: Characteristics of the five dimensions of capacity building in the Cooperation Programme 2014-2020
Source: Ramböll Management Consulting in cooperation with MA/JTS
In order to monitor changes, as a first step it has been necessary to define the status quo at the
beginning of the funding period (2014) for each characteristic and within each specific objective.
In course of the funding period, this baseline serves as reference point for the assessment of
changes in the coming years.
Enhanced
institutionalised
knowledge and
competence
Improved
governance
structures and
organisational
set-up
More efficient use
of human and
technical
resources
Better ability to
attract new
financial
resources
Increased
capability to work
in transnational
environment
Availability of knowledge
Availability of mechanisms for
knowledge transfer
Utilization of knowledge
Availability of organizational
structures
Utilization of organizational
structures
Utilization of human resources
Utilization of technical resources
Ability to attract external private
financial resources
Ability to attract external public
financial resources
Available competences to
work trans-nationally
Frequency of transnational
contacts
Intensity of transnational
contacts
Application of time-and/ or resource-saving measures
Dim
ensio
ns
Chara
cte
ristics
Baseline and target for result indicators on capacity-building
Indic
ato
r

Setting baselines and targets for the indicators 2014-2020 83
In order to ensure comparability of results over the course of the funding period, a standardised
scale has been developed. It has been used in order to define the baseline and will also be used
in order to define the situation at mid-term (2018 and 2020) and after the end of the funding
period in 2023. For each characteristic, the scale ranges from “no capacity” to the ideal situation
of “full capacity”.
Figure 6: Scale to assess characteristics of capacity-building
Source: Ramböll Management Consulting
By offering a scale from 1 to 5 for each characteristic, a high degree of detail can be established.
It allows for an informative illustration of the changes that occur in the programme region
between the starting, mid-term and ending situation of the Cooperation Programme.
In order to define baselines and targets, a wide range of thematic experts of the Baltic Sea
Region have been addressed. The experts represent the thematic fields that are covered by the
specific objectives and represent the eight EU-Member States as well as the three partner
countries Belarus, Norway and (parts of) Russia of the Cooperation Programme 2014-2020. They
have been identified by the respective national members of the Monitoring Committee and are
familiar with the target group within their country and their thematic field without being directly
involved in funded projects.
The underlying reason for addressing thematic experts for the definition of baselines and targets
lies in the complexity of estimating the current and future status of capacity-building for a variety
of topics and a very heterogeneous region. A sound assessment of the situation requires in-depth
knowledge of the respective actors and framework conditions. Thus, the involvement of experts
is not intended to reflect a representative estimation of the population of the Baltic Sea Region
but of a group of selected experts representing all eleven countries participating in the
Cooperation Programme.
The involvement of thematic experts has been carried out in two steps: an online-survey and
additional interviews with thematic experts with the aim to reflect on the results of the survey
and fill remaining gaps.
2.1 Survey
The first step to define the baseline and the target within each specific objective has been a
design and implementation of an online-survey among thematic experts representing all eleven
partner countries of the Interreg Baltic Sea Region Cooperation Programme. As mentioned
above, the experts have mainly been identified by the national Monitoring Committee members.
In some cases, the survey was distributed and forwarded to suitable experts via multipliers in
national authorities.
The survey was developed along the scaling method for each characteristic and each dimension.
The thematic experts have been asked to estimate the situation and a possible target on each
scale and shortly describe their estimation on the scale.
(1)
No capacity
(3)
Medium capacity
(5)
Full capacity
(2)
Basic capacity
(4)
Good capacity

Setting baselines and targets for the indicators 2014-2020 84
The results of the survey have been aggregated to obtain an average estimation on the baseline
situation and on the target for each specific objective for the entire Baltic Sea Region. The
average estimation has been based on an average of the characteristic within each dimension, as
illustrated in the following figure. When aggregating the average estimations of all dimensions,
particular attention has been paid to those dimensions which show the greatest potential for
improvement until the end of the funding period. Those are explicitly referred to in the short
statements summarising the baseline and the target for each result indicator in the Cooperation
Programme.
Figure 7: Aggregation of results for the characteristics within the five dimensions of capacity-building
Source: Ramböll Management Consulting in cooperation with MA/ JTS
The following table provides an overview of the responses to the online-survey. It shows that the
number of responses per country and, more importantly, per specific objective differ. In
particular, the number of responses on specific objectives 2.3, 3.2, 3.3 and 3.4 indicate that less
than half of the eleven countries have provided their estimation of baselines and targets.
Regarding the countries, Belarus (no response) and Lithuania shows the lowest number of
responses (one response on 2.2 “Renewable energy”). In contrast to that, from Denmark and
Finland estimations on 10 out of 12 specific objectives have been provided via the online-survey.
Average result
for “Enhanced
institutionalised
knowledge and
competence”
Average result
for “Improved
governance
structures and
organisational
set-up”
Average result
for “More
efficient use of
human and
technical
resources”
Average result
for “Better ability
to attract new
financial
resources”
Average result
for “Increased
capability to work
in transnational
environment”
Average result for “Availability of
knowledge”
Average result for “Availability of
mechanisms for knowledge transfer”
Average result for “Utilization of knowledge”
Average result for “Availability of organizational
structures”
Average result for “Utilization of organizational
structures”
Average result for “Utilization of human
resources”
Average result for “Utilization of
technical resources”
Average result for “Ability to attract external private
financial resources”
Average result for “Ability to attract external public
financial resources”
Average result for “Available
competences to work transnationally”
Average result for “Frequency of transnational
contacts”
Average result for “Intensity of transnational
contacts”
Average result for “Application of time-
and/ or resource-saving measures”
Dim
ensio
ns
Chara
cte
ristics
Baseline and target for result indicators on capacity-building
Indic
ato
r

Setting baselines and targets for the indicators 2014-2020 85
Table 10: Number of responses to online-survey by country and specific objective
Source: Rambøll Management Consulting
With the number of responses to the survey, the aim of receiving estimations from thematic
experts representing the whole Baltic Sea Region, has been reached. As stated above, the survey
intends to capture in-depth knowledge of actors deeply involved in the respective thematic fields
in their countries in order to aggregate these national estimations as a baseline and target
situation. In contrast to that, the survey is not to be seen as a representative questionnaire
among the citizens of the Baltic Sea Region. Thus, the 72 responses received are perceived as a
valid basis for defining baselines and targets in the twelve specific objectives of the Baltic Sea
Region and it can be expected that further responses would not change the picture remarkably.
2.2 Interviews
In order to reflect on the results of the survey and to balance the differing numbers of responses
per specific objective, structured interviews with thematic experts have been carried out.
The aim of the structured interviews has been to provide additional content to make a better
judgement of the current situation in the whole region regarding each specific objective in order
to describe the baseline and indicator. The structured interviews have served to clarify open
questions and to fill gaps resulting from answers given in the online survey. The gaps identified
encompass the following main types:
1) Areas where few respondents has completed the online survey with regards to country of
thematic experts
2) Large deviations in given responses within under a single objective
3) A large number of incomplete answers within one specific objective
Interviews were made within all specific objectives. In order to ensure that all objectives and all
gaps identified were covered, some of the specific objectives were grouped together for one
interview. The grouping of specific objective was made in dialogue with the Managing Authority.
For the structured interviews, one or two thematic expert(s) were identified for a specific
objective or group of objectives. The table below shows the number of interviews conducted for
each group of specific objectives, as well as the country or region for the respondent.
Total
BY DE DK EE FI LT LV NO PL RU SE
1.1 Research and innovation
infrastructure
0 1 1 0 1 0 1 0 1 0 1 6
1.2 Smart specialisation 0 0 1 0 1 0 1 1 1 0 1 6
1.3 Non-technological innovation 0 1 0 1 1 0 1 1 0 1 1 7
2.1 Clear waters 0 1 1 1 1 0 0 1 1 1 1 8
2.2 Renewable energy 0 1 1 1 0 1 1 0 0 1 1 7
2.3 Energy efficiency 0 1 1 0 1 0 1 0 0 1 0 5
2.4 Resource-efficient blue growth 0 1 1 1 0 0 0 1 1 1 1 7
3.1 Interoperability of transport models 0 1 1 1 1 0 0 0 1 1 0 6
3.2 Accessibility of remote areas and
areas affected by demographic change
0 0 0 1 1 0 0 0 0 0 1 3
3.3 Maritime safety 0 1 1 1 1 0 0 1 0 0 0 5
3.4 Environmentally friendly shipping 0 1 1 1 1 0 0 0 0 1 0 5
3.5 Environmentally friendly urban
mobility
0 0 1 0 1 0 1 1 1 1 1 7
Total 0 9 10 8 10 1 6 6 6 8 8 72
Specific Objective Country

Setting baselines and targets for the indicators 2014-2020 86
For the structured interviews, other experts than those who had received the survey was asked
to participate. For the identification and selection of experts, Ramböll developed a gross list of
potential experts to interview, based on their current activities. From this list a number of
respondents were selected and asked to participate in an interview. Even though the country
perspective did not constitute the main focus for the interview, the final selection of experts was
also based on the experts‟ country of origin. The final selection of expert consisted of researchers
at academic institutions, public authority and government officials responsible for international
cooperation as well as priority area coordinators for the EUSBSR.
Table 11: Number of conducted interviews per group of specific objectives.
Specific objective Number of
interviews
Country/Region
1.1: Research and innovation infrastructure
1.2: Smart specialization
1.3: Non-technological innovation
2 Lithuania
Sweden
2.1: Clear waters 1 Finland
2.2: Renewable energy, 2.3: Energy efficiency 1 Sweden
2.4: Resource-efficient blue growth 2 Poland
Norway
3.1: Interoperability of transport modes
3.2: Accessibility of remote areas and areas affected by
demographic change
2 Estonia/Germany
Sweden
3.3: Maritime safety
3.4: Environmentally friendly shipping
2 Denmark
Lithuania
3.5: Environmentally friendly urban mobility 1 Eastern Europe
Total 11
As stated in the methodology for the survey, the survey respondents have been asked to provide
an assessment of the baseline and target for different characteristics of the five dimensions of
the institutional capacity building.
For the structured interviews, the aggregated results for each of the five dimensions have been
presented to the interviewee. In cases where there were significant deviations between the
different characteristics within one dimension, the interviewee was provided with this information
in the interview.
In the structured interviews, the identified expert was first provided with results from the survey
where survey respondents had indicated the current situation (baseline) for each dimension,
and was then asked to assess if this could be considered an accurate estimation of the current
situation of the institutional capacity in the Baltic Sea Region, with regards to the specific
objective addressed in the interview. The identified experts were also asked to assess if the
targets indicated in the survey could be considered as a realistic (yet ambitious) target for 2023.
For each of the five dimensions, the interviewed experts were also asked to reflect upon potential
differences between different countries, parts of the region (i.e. core and rural areas, north –
south, east-west etc.). The reason for this question was the opportunity to provide the analysis
with a more nuanced view of the institutional capacity in the Baltic Sea Region. The interviewees
were also asked to reflect upon what constituted the main obstacles in building institutional
capacity for the specific objective(s) addressed in the interview.

Setting baselines and targets for the indicators 2014-2020 87
3. RESULTS OF THE ONLINE-SURVEY WITH THEMATIC
EXPERTS
3.1 Specific objective 1.1: Research and innovation infrastructure
The questions regarding the specific objective 1.1. have been answered by six countries, whereas
one country‟s answer does not provide information and is thus taken out of the assessment.
Furthermore, two countries have not provided justifications to their assessment; however it will
be taken into account as their estimations appear reasonable and differentiated. On average a
response rate of 4,7 countries has been obtained for the specific objective 1.1.
An overview of the average results for the five dimensions estimated on a scale from 1 to 5 for a
baseline and target situation is shown in the following table. The backgrounds of these
estimations are explained for each dimension in the subsequent paragraphs. For more in depth
information about the results for the baseline and target for the different characteristics of this
dimension, a compilation of supplementary data is provided in Appendix 1 in this report.
Table 12: Summary of results for specific objective 1.1. Research and innovation infrastructure
Average of estimations
Average of number of responses20
Average of all dimensions
Baseline 2,7 4,7
Target 3,6 4,7
Dimension 1: Enhanced institutionalised knowledge and competence
Baseline 2,8 5,0
Target 3,6 5,0
Dimension 2: Improved governance structures and organizational set-up
Baseline 2,4 4,5
Target 3,4 4,5
Dimension 3: More efficient use of human and technical resources
Baseline 2,6 4,0
Target 3,7 4,0
Dimension 4: Better ability to attract new financial resources
Baseline 2,5 5,0
Target 3,4 5,0
Dimension 5: Increased capability to work in transnational environment
Baseline 3,1 5,0
Target 3,9 5,0
To provide an additional perspective on the survey results, two thematic experts in the area of
innovation has been interviewed. One expert identified is working at the Lithuanian Agency for
Science, Innovation and Technology (MITA) and is head of the International Programmes
Division. The other expert interviewed work as a programme manager in the Policy and Systems
development department at the Swedish Innovation agency VINNOVA.
By looking at the experts‟ estimations, the biggest difference between the estimation of baseline
and target in this specific objective can be found in dimension 3: More efficient use of human and
technical resources.
20 The average number of responses is calculated based on the number of responses obtained per characteristics. Decimal numbers are
due to the fact that the number of responses per characteristic within one dimension differs in some cases.

Setting baselines and targets for the indicators 2014-2020 88
3.1.1 Dimension 1: Enhanced institutionalised knowledge and competence
The current situation of the Baltic Sea Region regarding the institutionalised knowledge and
competence has been assessed with an average of 2,8 on a scale from 1 to 5. The answers
among the international respondents are fairly aligned. It is described that networks for
knowledge building and transfer exist but that it lacks in cooperation activities and knowledge
offers for the target group. Especially cooperation between SME and research institutions and
knowledge uptake by SME could be improved.
As target for 2023 an average of 3,6 has been set on the scale from 1 to 5. The target situation
is described as showing better knowledge transfer with common databases that allow an efficient
cooperation and finding of partners.
According to one of the interviews conducted with experts in the area of innovation, transfer of
knowledge still constitutes a problem for some countries, where communication between for
instance academia and business is lacking. According to the other expert interviewed, the
availability of knowledge is on a medium level in the Baltic Sea Region. However, the different
countries lack knowledge about each other. Both experts state there are differences between the
Nordic and the Baltic States, where the Baltic States are somewhat lacking in their ability to
identify what needs they have. Baseline and targets set is considered to be realistic for the first
dimension.
3.1.2 Dimension 2: Improved governance structures and organizational set-up
The current situation of the Baltic Sea Region regarding governance structures and
organizational set-up has been assessed with an average of 2,4 on a scale from 1 to 5. It is
described that governance structures and good practices already exist but these show only little
impact.
As target for 2023 an average of 3,4 has been set on the scale from 1 to 5. The target situation
is described as having established new governance structures with a clearer focus. However, it is
not expected that the impact will increase to a great extent.
Result from the interviews suggests that the baseline and target indicated in the survey is
accurate also for the governance structures and organizational set-up in the area of innovation.
One of the interviewed experts think that the ability to act jointly is somewhat lacking. According
to the other expert interviewed, there will probably not be a huge improvement in the availability
and utilization of organizational structures for the specific objectives in the area of innovation as
there oftentimes is a reluctance for change. With this in consideration, the expert considers the
target to be somewhat high. The other expert interviewed does however think that the target
indicated is realistic and that the policy level should have a high and ambitious target. One of the
experts thinks it would be easier for smaller countries to improve their organizational set-up.
3.1.3 Dimension 3: More efficient use of human and technical resources
The current situation of the Baltic Sea Region regarding the efficient use of human and
technical resources has been assessed as with an average of 2,6 on a scale from 1 to 5. It is
described that human resources are used efficiently but capacity is lacking and that technical
resources could be used more efficiently if information on these would be shared better across
institutions and regions.
As target for 2023 an average of 3,7 has been set on the scale from 1 to 5. The target situation
is described as having better information systems in place that allow a better usage of existing
technical resources.
According to the expert interviews conducted, the baseline indicated in the survey is considered
to be accurate. Results from one interview indicate that a lack of human resources constitute a

Setting baselines and targets for the indicators 2014-2020 89
problem for all countries in the Baltic Sea Region, and as population decreases in many parts of
the region, this problem will potentially be even greater in the future. With this in consideration
the expert interviewed consider the target set for 2023 to be somewhat high. The other expert
states that one problem is that research centres are developed in different parts of the region,
rather than gathering all available competencies in one area. With this in mind, the use of
technical and human resources could be more efficient. The expert does however consider the
target indicated to be realistic.
3.1.4 Dimension 4: Better ability to attract new financial resources
The current situation of the Baltic Sea Region regarding the ability to attract new financial
resources has been assessed with an average of 2,5 on a scale from 1 to 5. It is described that
the ability to attract financial resources depends on the region and the target group. In general
investments are lacking and there is little cooperation in joint investments between SME and
research institutions due to risk and influence issues.
As target for 2023 an average of 3,4 has been set on the scale from 1 to 5. The target situation
is described as showing a higher ability to attract financial resources with good practices
exemplifying this ability.
The interview results acknowledge the significance of the assessment from the survey. One of
the experts does however think that while the ability to attract external public financial resources
is at a medium level, the ability to attract private financial resources could only be considered
only to be basic. The expert also adds that the ability to attract financial resources is
concentrated to larger cities in the Baltic Sea Region that are in close proximity to leading
universities. According to the other expert interviewed, the main challenge for attracting financial
resources is not lack of funding, but rather lack of competence to develop good ideas:
“You always hear the statement that there is a lack of money. But in reality, there is enough
money to make good stuff. The problem is that we lack good ideas, not the money. With all the
EU instruments for R&D funding, I think there is enough money to carry on projects. We‟re
maybe lacking venture capital compared to Israel and USA, but public funding is not a huge
problem.”
The result from the interviews indicate that more funding will be allocated for research and
supporting innovation, and that the target indicated in the survey is realistic for 2023.
3.1.5 Dimension 5: Increased capability to work in transnational environment
The current situation of the Baltic Sea Region regarding the capability to work in transnational
environment has been assessed with an average of 3,1 on a scale from 1 to 5. It is described
that a high intensity of cooperation and contacts already exist with professionalized capabilities,
especially within research. Less cooperation is described for administrative organisations.
As target for 2023 an average of 3,9 has been set on the scale from 1 to 5. The target situation
is described as incorporating a more strategic approach to transnational cooperation with a clear
communication of benefits for the partners and widespread strategies for internationalization. A
high level of cooperation is targeted.
In the area of transnational cooperation, the interview results indicate that the baseline and
targets set for the available competences to work transnationally, the frequency of transnational
contacts and intensity of transnational collaboration are significant. One of the experts
interviewed underscores that for promoting innovation, transnational cooperation is key. In the
Baltic Sea Region, the Scandinavian countries could support the Baltic States by involving them
more, for instance in bilateral calls. The other expert interviewed thinks that this dimension is the
area where there is the highest potential.

Setting baselines and targets for the indicators 2014-2020 90
3.1.6 Concluding summary for specific objective 1.1: Research and innovation infrastructure
When analysing the survey results, the main challenge for sustaining the research and innovation
infrastructure seems to be the current ability to improve governance structures and the
organizational set-up. The indication of target for 2023 does however suggest a slight
improvement. This result is also supported by the result from the structured interviews
conducted, stating that it is difficult to establish change in current organizational structures.
When it comes to the other dimensions of institutional capacity, the baselines are fairly aligned,
ranging from 2,5 to 3,05 on a scale from 1 to 5. The ability to attract new financial resources
received a rating of 2,5. The target set for 2023 regarding this dimension indicates that it has
great potential and is also one of the two dimensions with the biggest potential.
By looking at the target set for 2023 regarding the other dimensions, the survey results indicate
that the biggest potential to increase capacities lie in a more efficient use of human and technical
resources, as the target for this dimension is the highest. The survey results also indicate that
the dimensions with the least potential to improve lies in enhancing institutionalized knowledge
and competence as well as increasing capability to work in transnational environment. As the
survey results indicate, these dimensions already have significantly high baselines which in turn
can make it hard to reach even higher ratings.
The following figure illustrates the defined baseline and target for specific objective 1.1.
Figure 8: Baseline and target for specific objective 1.1
In the following, the baseline and target for the specific objective‟s result indicator is described in
short, qualitative terms as required for the Cooperation Programme. Beside a short statement
regarding the overall situation for the indicator, the dimension showing the greatest difference
between the estimation of the baseline and the target is specifically referred to in the target.
Table 13: Baseline and target for the result indicator of specific objective 1.1 as presented in the Cooperation Programme
Result indicator Baseline (2014) Target (2023)
Capacity of research and
innovation infrastructures in
the Programme area to
implement measures to
increase the market uptake of
innovation
Slightly below medium (2,7)
Medium to good (3,6), focus
on more efficient use of
human and technical
resources
(1) (3) (5)(2) (4)
Baseline=2,7 Target=3,6
No
capacityBasic
capacity
Medium
capacity
Good
capacity
Full
capacity

Setting baselines and targets for the indicators 2014-2020 91
3.2 Specific objective 1.2: Smart specialisation
The questions regarding specific objective 1.2. have been answered by six countries, of which
two countries have not provided justifications to their assessment. Since their estimations appear
reasonable and differentiated, the answers will be taken into account. On average a response
rate of 6,0 countries has been obtained for specific objective 1.2.
An overview of the average results for the five dimensions estimated on a scale from 1 to 5 for a
baseline and target situation is shown in the following table. The backgrounds of these
estimations are explained for each dimension in the subsequent paragraphs. For more in depth
information about the results for the baseline and target for the different characteristics of this
dimension, a compilation of supplementary data is provided in Appendix 1 in this report.
Table 14: Summary of results for specific objective 1.2. Smart specialisation
Average of estimations
Average of number of responses21
Average of all dimensions
Baseline 2,9 6,0
Target 3,8 6,0
Dimension 1: Enhanced institutionalised knowledge and competence
Baseline 2,8 6,0
Target 4,0 6,0
Dimension 2: Improved governance structures and organizational set-up
Baseline 3,2 6,0
Target 3,8 6,0
Dimension 3: More efficient use of human and technical resources
Baseline 2,9 6,0
Target 3,9 6,0
Dimension 4: Better ability to attract new financial resources
Baseline 2,7 6,0
Target 3,6 6,0
Dimension 5: Increased capability to work in transnational environment
Baseline 2,8 6,0
Target 3,9 6,0
To provide an additional perspective on the survey results, two thematic experts in the area of
innovation has been interviewed. One expert identified is working at the Lithuanian Agency for
Science, Innovation and Technology (MITA) and is head of the International Programmes
Division. The other expert interviewed work as a programme manager in the Policy and Systems
development department at the Swedish Innovation agency VINNOVA.
By looking at the experts‟ estimations, the biggest difference between the estimation of baseline
and target in this specific objective can be found in dimension 1: Enhanced institutionalised
knowledge and competence.
3.2.1 Dimension 1: Enhanced institutionalised knowledge and competence
The current situation of the Baltic Sea Region regarding the institutionalised knowledge and
competence has been assessed with an average of 2,8 on a scale from 1 to 5. It is described that
institutionalised knowledge on smart specialization exists but it is considered an administrative
approach with lacking knowledge on the market. Mechanisms for knowledge transfer,
21 The average number of responses is calculated based on the number of responses obtained per characteristics. Decimal numbers are
due to the fact that the number of responses per characteristic within one dimension differs in some cases.

Setting baselines and targets for the indicators 2014-2020 92
coordination patterns and routines are established but regional differences are present. The
transfer of knowledge can be improved by establishing a culture of sharing experiences and by
emphasizing cooperation across institutions, sectors and regions.
As target for 2023 an average of 4,0 has been set on the scale from 1 to 5. The target situation
is described as including more cooperation and new ways of working together, slightly improved
mechanisms of knowledge transfer and enhanced utilization of knowledge.
As mentioned in section 3.1.1, the interviewed experts consider that the baselines and targets
indicated for the priority area innovation are accurate. However, knowledge is not shared to the
same extent in the eastern parts of the Baltic Sea Region. Also, the Baltic States are somewhat
lacking in their ability to identify what needs they have.
3.2.2 Dimension 2: Improved governance structures and organizational set-up
The current situation of the Baltic Sea Region regarding governance structures and
organizational set-up has been assessed with an average of 3,2 on a scale from 1 to 5. It is
described that organizational structures are already present to a large extent. Some are well
organized whereas others show improvement potentials. The structures are used occasionally up
to frequently, depending on actors and regions. A challenge exists in multi-level cooperation
between national and regional levels.
As target for 2023 an average of 3,6 has been set on the scale from 1 to 5. The target situation
is described as presenting structures with improved quality. The utilization is increased thanks to
better information and cooperation. Multi-level cooperation between national and regional level is
improved.
As mentioned previously in section 3.1.2, the baseline indicated is considered to be accurate by
the interviewed experts. Improving governance structures and organizational set-up does
however prove to be a challenge in this area and because of that, the target is considered to be
somewhat high by one of the experts. The other expert interviewed does however think that the
target indicated is realistic and that the policy level should have a high and ambitious target.
3.2.3 Dimension 3: More efficient use of human and technical resources
The current situation of the Baltic Sea Region regarding the efficient use of human and
technical resources has been assessed with an average of 2,9 on a scale from 1 to 5. It is
described that human resources are used effectively with exchange and cooperation of staff,
however in some regions coordination mechanisms are lacking and cooperation can be improved.
Technical resources are available and accessible but can improved by utilizing database and
communication technology. Time- and resource-saving measures are applied.
As target for 2023 an average of 3,9 has been set on the scale from 1 to 5. The target situation
is described as showing a stronger interregional use and exchange of human and technical
resources in order to stay competitive. Cross-border, cross-sectorial and multi-level exchanges
and the use of time and resource-saving measures are improved.
As mentioned in section 3.1.3, the baseline indicated in the survey is considered to be accurate
according to the expert interviews. The target set is considered to be somewhat high by one of
the interviewed experts, especially for the countries in the eastern parts of the Baltic Sea Region.
The other expert complies with the target indicated in the survey.
3.2.4 Dimension 4: Better ability to attract new financial resources
The current situation of the Baltic Sea Region regarding the ability to attract new financial
resources has been assessed with an average of 2,7 on a scale from 1 to 5. It is described that
the attraction of private financial resources is a challenge for the actors in the region as the

Setting baselines and targets for the indicators 2014-2020 93
investment profile for research and development is often too risky and information gaps exist
between private investors and entrepreneurs. However, there are differences across sectors and
regions. Regarding public financial resources, there is a medium to high ability to attract funding
but some regions lack information and smaller organizations might face challenges.
As target for 2023 an average of 3,6 has been set on the scale from 1 to 5. The target situation
is not expected to show a large increase in the ability to attract private financial resources as this
is seen as a long-term objective. An improved ability to attract public financial resources, also by
new project partners, is targeted. Better information on public funding, especially for small
organizations, is aimed for.
As mentioned in section 3.1.4, the baseline and targets indicated in the survey is considered to
be accurate according to the expert interviews. According to one expert, the biggest challenge
for attracting external financial resources is a lack of good ideas. The other expert states that the
ability to attract external public financial resources is higher than for external private financial
resources.
3.2.5 Dimension 5: Increased capability to work in transnational environment
The current situation of the Baltic Sea Region regarding the capability to work in transnational
environment has been assessed with an average of 2,8 on a scale from 1 to 5. It is described
that competences to work transnationally show regional differences. Partially lacking language
skills, missing transitions to work internationally, time investments and costs present barriers.
Transnational contacts exist with differences across regions, sectors and governance levels.
Partially high networking activities are present.
As target for 2023 an average of 3,9 has been set on the scale from 1 to 5. The target situation
is described as showing improved competences with younger and more internationally oriented
researchers and more experience. An increased number of international projects and maturing
networks and contacts are expected.
As mentioned in section 3.1.5, the interview results are in line with the survey result, indicating
that the baseline and target set provides an accurate assessment of the current situation and
what could be a realistic target for 2023. One of the experts interviewed thinks that this
dimension is the area where there is the most potential.
3.2.6 Concluding summary for specific objective 1.2: Smart specialisation
When analysing the survey results for the specific objective Smart specialisation, the main
challenge seem the ability to attract new financial resources. The prospects for improving the
situation until 2023 is fairly low and the survey results hence indicate it might not be possible to
reach more than medium level by 2023.
When it comes to the other dimensions of institutional capacity, the baseline is fairly similar
ranging from 2,8 to 3,2 on a scale from 1 to 5.. The second dimension, Improved governance
structures and organisational structures, marks an exception here as the current situation is
already assessed as a 3,2 on the scale.
By looking at the target set for 2023, the survey results indicate that the biggest potential lie in
enhancing institutionalized knowledge and competence as well as in increased capability to work
in transnational environment, as the targets indicated for these two dimensions are the highest.
This is also supported by the result from the expert interviews. The survey results also indicate
that the dimensions with the least potential lies in improved governance structures and
organizational set-up as well as the ability to attract new financial resources. One explanation for
this could be that the baselines for these dimensions are already high. The result from the
interviews does however point out that it is difficult to establish change in this area.

Setting baselines and targets for the indicators 2014-2020 94
The following figure illustrates the defined baseline and target for specific objective 1.2.
Figure 9: Baseline and target for specific objective 1.2
In the following, the baseline and target for the specific objective‟s result indicator is described in
short, qualitative terms as required for the Cooperation Programme. Beside a short statement
regarding the overall situation for the indicator, the dimension showing the greatest difference
between the estimation of the baseline and the target is specifically referred to in the target.
Table 15: Baseline and target for the result indicator of specific objective 1.2 as presented in the Cooperation Programme
Result indicator Baseline (2014) Target (2023)
Capacity of innovation actors
(innovation intermediaries,
authorities, research
institutions, enterprises) in
the Programme area to
implement smart
Slightly below medium (2,9) Slightly below good (3,8),
focus on enhanced
institutionalized knowledge
and competence
(1) (3) (5)(2) (4)
Baseline=2,9 Target=3,8
No
capacityBasic
capacity
Medium
capacity
Good
capacity
Full
capacity

Setting baselines and targets for the indicators 2014-2020 95
3.3 Specific objective 1.3: Non-technological innovation
The questions regarding specific objective 1.3. have been answered by seven countries, of which
three countries have not provided justifications to their assessment. Since their estimations
appear reasonable and differentiated, the answers will be taken into account. On average a
response rate of 6,3 countries has been obtained for specific objective 1.3.
An overview of the average results for the five dimensions estimated on a scale from 1 to 5 for a
baseline and target situation is shown in the following table. The backgrounds of these
estimations are explained for each dimension in the subsequent paragraphs. For more in depth
information about the results for the baseline and target for the different characteristics of this
dimension, a compilation of supplementary data is provided in Appendix 1 in this report.
Table 16: Summary of results for specific objective 1.3. Non-technological innovation
Average of estimations
Average of number of responses22
Average of all dimensions
Baseline 2,9 6,3
Target 3,7 6,1
Dimension 1: Enhanced institutionalised knowledge and competence
Baseline 2,9 6,7
Target 3,9 5,7
Dimension 2: Improved governance structures and organizational set-up
Baseline 3,0 6,0
Target 3,6 6,0
Dimension 3: More efficient use of human and technical resources
Baseline 2,5 6,0
Target 3,3 6,0
Dimension 4: Better ability to attract new financial resources
Baseline 3,0 6,0
Target 3,6 6,0
Dimension 5: Increased capability to work in transnational environment
Baseline 2,9 7,0
Target 3,9 7,0
To provide an additional perspective on the survey results, two thematic experts in the area of
innovation has been interviewed. One expert identified is working at the Lithuanian Agency for
Science, Innovation and Technology (MITA) and is head of the International Programmes
Division. The other expert interviewed work as a programme manager in the Policy and Systems
development department at the Swedish Innovation agency VINNOVA.
By looking at the experts‟ estimations, the biggest difference between the estimation of baseline
and target in this specific objective can be found in dimension 5: Increased capability to work in
transnational environment. For identifying the biggest difference between baseline and target,
the second decimal place of the average of estimations had to be taken into account for this
specific objective. The respective values can be found in Annex 1 to this report.
3.3.1 Dimension 1: Enhanced institutionalised knowledge and competence
The current situation of the Baltic Sea Region regarding the institutionalised knowledge and
competence has been assessed with an average of 2,9 on a scale from 1 to 5. It is described that
22 The average number of responses is calculated based on the number of responses obtained per characteristics. Decimal numbers are
due to the fact that the number of responses per characteristic within one dimension differs in some cases.

Setting baselines and targets for the indicators 2014-2020 96
the level of knowledge available differs between regions. Knowledge transfer between actors is
lacking routines and procedures.
As target for 2023 an average of 3,9 has been set on the scale from 1 to 5. The target situation
is described as having an improved knowledge transfer, especially between research bodies and
companies as well as cross-border. Furthermore, the capacity of administrative bodies is
strengthened and knowledge is used transnationally.
As previously stated, the result from the interviews indicates that the baselines and targets
indicated for the specific objectives within the priority area of innovation are accurate, although
knowledge is not shared to the same extent in the eastern parts of the Baltic Sea Region as in
the western parts. Also, the Baltic States are somewhat lacking in their ability to identify what
needs they have.
3.3.2 Dimension 2: Improved governance structures and organizational set-up
The current situation of the Baltic Sea Region regarding governance structures and
organizational set-up has been assessed with an average of 3,0 on a scale from 1 to 5. It is
described that organizational structures exist but need to be dispersed better and to a wider
target group. Especially practitioners do not use the available structure to the extent possible.
As target for 2023 an average of 3,6 has been set on the scale from 1 to 5. The target situation
is described as having complimentary organizational structures in place with a facilitated
accessibility.
According to the interviews conducted for the specific objectives 1.1-1.3 the baseline indicated
is considered to be accurate. Improving governance structures and organizational set-up does
however prove to be a challenge in this area and because of that, the target is considered to be
somewhat high by one of the experts. The other expert interviewed does however think that the
target indicated is realistic and that the policy level should have a high and ambitious target.
3.3.3 Dimension 3: More efficient use of human and technical resources
The current situation of the Baltic Sea Region regarding the efficient use of human and
technical resources has been assessed with an average of 2,5 on a scale from 1 to 5. It is
described that platforms and structures exist for an efficient use of human and technical
resources; however the matching between demand and supply needs to be improved. Time and
resource-saving measures are used but are not available for all actors, especially SME face
challenges in that respect.
As target for 2023 an average of 3,3 has been set on the scale from 1 to 5. The target situation
is described as having a better matching of human resources in place.
As mentioned in section 3.1.3, the baseline indicated in the survey is considered to be accurate
according to the expert interviews. The target set is considered to be somewhat high by one of
the interviewed experts, especially for the countries in the eastern parts of the Baltic Sea Region.
The other expert complies with the target indicated in the survey.
3.3.4 Dimension 4: Better ability to attract new financial resources
The current situation of the Baltic Sea Region regarding the ability to attract new financial
resources has been assessed with an average of 3,0 on a scale from 1 to 5. It is described that
the attraction of private financial resources is a challenge for some actors, especially for SME.
Regarding public financial resources, there is a medium to high ability to attract funding.
As target for 2023 an average of 3,6 has been set on the scale from 1 to 5. The target situation
is expected to improve with regard to the ability to attract private financial resources but the

Setting baselines and targets for the indicators 2014-2020 97
objective is seen as very challenging. A slightly improved ability to attract public financial
resources is expected.
As mentioned in section 3.1.4, the baseline and targets indicated in the survey is considered to
be accurate according to the expert interviews. According to one expert, the biggest challenge
for attracting external financial resources is a lack of good ideas. The other expert states that the
ability to attract external public financial resources is higher than for external private financial
resources.
3.3.5 Dimension 5: Increased capability to work in transnational environment
The current situation of the Baltic Sea Region regarding the capability to work in transnational
environment has been assessed with an average of 2,9 on a scale from 1 to 5. It is described
that competences to work transnationally exist with differences across actors, especially SME and
public authorities are lacking competences and networks.
As target for 2023 an average of 3,9 has been set on the scale from 1 to 5. The target situation
is described as showing improved competences as actors are willing to engage in transnational
activities. An increased intensity of transnational contacts is expected.
As mentioned in section 3.1.5, the interview results is in line with the survey result, indicating
that the baseline and target set provides an accurate assessment of the current situation and
what could be a realistic target for 2023. One of the experts interviewed thinks that this
dimension is the area where there is the most potential.
3.3.6 Concluding summary for specific objective 1.3: Non-technological innovation
Results from the survey suggest that the main challenge for sustaining the institutional capacity
to promote non-technological innovation is more efficient use of human and technical resources.
The prospects for improving the situation until 2023 is fairly low compared to the other
dimensions. The survey results hence indicate it might not be possible to reach more than slightly
above a medium level by 2023. This is also supported by the two interviews conducted.
As for the other dimensions of institutional capacity, the baseline is notably similar ranging from
2,9 to 3 on a scale from 1 to 5. By looking at the target set for 2023 regarding the other
dimensions, the survey results indicate that the biggest potential for improvement lies in
increased capability to work in transnational environment as well as in enhanced institutionalized
knowledge and competence, as the targets for these two dimensions are the highest. This is also
supported by the interview results.
The survey results also indicate that the dimensions with the least potential of improvement until
2023 is improved governance structures and organizational set-up as well as better ability to
attract new financial resources. It is however worth noting that the baselines for these
dimensions are at a high level, which in turn could make it difficult to reach even higher ratings.
The following figure illustrates the defined baseline and target for specific objective 1.3.

Setting baselines and targets for the indicators 2014-2020 98
Figure 10: Baseline and target for specific objective 1.3
In the following, the baseline and target for the specific objective‟s result indicator is described in
short, qualitative terms as required for the Cooperation Programme. Beside a short statement
regarding the overall situation for the indicator, the dimension showing the greatest difference
between the estimation for the baseline and the target is specifically referred to in the target.
Table 17: Baseline and target for the result indicator of specific objective 1.3 as presented in the Cooperation Programme
Result indicator Baseline (2014) Target (2023)
Capacity of innovation actors
(innovation intermediaries,
authorities, research
institutions, enterprises) in
the Programme area to
implement measures to
increase uptake of non-
technological innovation
Slightly below medium (2,9) Medium to good (3,7), focus
on enhanced institutionalised
knowledge and competence
(1) (3) (5)(2) (4)
Baseline=2,9 Target=3,7
No
capacityBasic
capacity
Medium
capacity
Good
capacity
Full
capacity

Setting baselines and targets for the indicators 2014-2020 99
3.4 Specific objective 2.1: Clear waters
The questions regarding specific objective 2.1. have been answered by eight countries, of which
one country has not provided justifications to their assessment. Since their estimations appear
reasonable and differentiated, the answers will be taken into account. On average a response
rate of 8,0 countries has been obtained for specific objective 2.1.
An overview of the average results for the five dimensions estimated on a scale from 1 to 5 for a
baseline and target situation is shown in the following table. The backgrounds of these
estimations are explained for each dimension in the subsequent paragraphs. For more in depth
information about the results for the baseline and target for the different characteristics of this
dimension, a compilation of supplementary data is provided in Appendix 1 in this report.
Table 18: Summary of results for specific objective 2.1. Clear waters
Average of estimations
Average of number of responses23
Average of all dimensions
Baseline 2,7 8,0
Target 3,6 8,0
Dimension 1: Enhanced institutionalised knowledge and competence
Baseline 3,0 8,0
Target 3,8 8,0
Dimension 2: Improved governance structures and organizational set-up
Baseline 2,6 8,0
Target 3,6 8,0
Dimension 3: More efficient use of human and technical resources
Baseline 2,7 8,0
Target 3,7 8,0
Dimension 4: Better ability to attract new financial resources
Baseline 2,1 8,0
Target 3,1 8,0
Dimension 5: Increased capability to work in transnational environment
Baseline 3,0 8,0
Target 3,9 8,0
For the specific objective 2.1 Clear Waters, one additional interview was conducted to provide an
expert perspective on the survey results. The person interviewed work at the Ministry of the
Environment in Finland and is also appointed as priority action coordinator for PA Nutri.
By looking at the experts‟ estimations, the biggest difference between the estimation of baseline
and target in this specific objective can be found in dimension 4: Better ability to attract new
financial resources. For identifying the biggest difference between baseline and target, the
second decimal place of the average of estimations had to be taken into account for this specific
objective. The respective values can be found in Annex 1 to this report.
3.4.1 Dimension 1: Enhanced institutionalised knowledge and competence
The current situation of the Baltic Sea Region regarding the institutionalised knowledge and
competence has been assessed with an average of 3,0 on a scale from 1 to 5. It is described that
the available knowledge differs across regions with some knowledge gaps regarding hazardous
substances and pharmaceuticals, impacts of climate change, agri-environmental measures,
23 The average number of responses is calculated based on the number of responses obtained per characteristics. Decimal numbers are
due to the fact that the number of responses per characteristic within one dimension differs in some cases.

Setting baselines and targets for the indicators 2014-2020 100
nutrient fluxes, marine litter and underwater noise, solutions to tackle internal nutrient load from
sea bottoms and socio-economic impacts. Knowledge transfer between public and private actors
is lacking.
As target for 2023 an average of 3,8 has been set on the scale from 1 to 5. The target situation
is described as having increased the availability and accessibility of knowledge, even though
regional differences are still expected to exist. New mechanisms of public-private knowledge
transfer are established.
According to the expert interview, the baseline for the different characteristics of the first
dimension of institutional capacity could be higher to some extent. The interview respondent
states that the availability and utilization of knowledge has recently improved, for instance
through strategy development that has been giving direction to the work that is done. The
targets for enhanced institutionalised knowledge and competence are considered to be realistic,
even though more could be done, the respondent says.
3.4.2 Dimension 2: Improved governance structures and organizational set-up
The current situation of the Baltic Sea Region regarding governance structures and
organizational set-up has been assessed with an average of 2,6 on a scale from 1 to 5. It is
described that organizational structures exist only to a limited extent and are mainly available for
public actors.
As target for 2023 an average of 3,6 has been set on the scale from 1 to 5. The target situation
is described as having improved structures in place that are available for a wider range of
stakeholders - including private ones – and regions.
As for the second dimension of institutional capacity building, the interviewed expert considers
that the baseline for the availability and utilization of organizational structures is somewhat
higher than the survey results would suggest. The targets for the second dimension are
considered to be realistic.
3.4.3 Dimension 3: More efficient use of human and technical resources
The current situation of the Baltic Sea Region regarding the efficient use of human and
technical resources has been assessed with an average of 2,7 on a scale from 1 to 5. It is
described that human and technical resources as well as time and resource-saving measures are
partially utilized in an efficient way with improvement potentials existing especially between
sectors and disciplines.
As target for 2023 an average of 3,7 has been set on the scale from 1 to 5. The target situation
is described as having a better and more intensive integration of human and technical resources
across sectors in place.
The result from the expert interview conducted indicates that the assessment of the baseline is
accurate. As for the targets indicated in the survey for the third dimension, the respondent state
that the target is somewhat low and could be set higher.
3.4.4 Dimension 4: Better ability to attract new financial resources
The current situation of the Baltic Sea Region regarding the ability to attract new financial
resources has been assessed with an average of 2,1 on a scale from 1 to 5. It is described that
the ability of attracting private financial resources is rather basic, given also the public nature of
the specific objective. Regarding public financial resources, the ability to attract funding is more
advanced but lacks coordination.

Setting baselines and targets for the indicators 2014-2020 101
As target for 2023 an average of 3,1 has been set on the scale from 1 to 5. The target situation
is expected to slightly improve by including corporate social responsibility issues. Public financial
resources are attracted by using a stronger participatory approach.
Both the baseline and targets indicated from the survey results are considered to be realistic
according to the expert interview conducted.
3.4.5 Dimension 5: Increased capability to work in transnational environment
The current situation of the Baltic Sea Region regarding the capability to work in transnational
environment has been assessed with an average of 3,0 on a scale from 1 to 5. The answers
among the international respondents point out regional differences for the intensity of
transnational collaboration. It is described that competences and networks to work
transnationally exist with differences across regions and actors, especially public authorities are
lacking language competences.
As target for 2023 an average of 3,9 has been set on the scale from 1 to 5. The target situation
is described as showing slightly improved competences, especially with regard to interdisciplinary
competences. An increased intensity of transnational contacts is expected, especially regarding
the involvement of the private sector.
The result from the interview for the specific objective clear waters suggests that the baseline
for the different characteristics of the fifth dimension: Increased capability to work in
transnational environment could be somewhat higher than the survey results suggest. In the
interview, the expert says:
“I would say it could be a bit higher. At least in Finland we see possibilities to work
transnationally, and we do a lot to work towards that, especially in the Baltic Sea Region area.”
The targets for 2023 indicated in the survey are considered to be realistic for the available
competences to work transnationally, the frequency of transnational contacts as well as for the
intensity of transnational collaboration.
3.4.6 Concluding summary for specific objective 2.1: Clear waters
When analysing the survey results, the main challenge today for sustaining clear waters is the
ability to attract new financial resources. The prospects for improving the situation until 2023 is
however significantly higher than the baseline. The survey results hence indicate that it might be
possible to reach more than a medium level by 2023.
The results from the survey for the other dimensions of institutional capacity show that the
baselines are fairly similar and range from 2,6 to 3,0 on a scale from 1 to 5. This indicates that
the situation is at a medium level for all dimensions besides the ability to attract new financial
resources.
When analysing the indicated targets set for 2023 the survey results suggest that the biggest
potential lies in the ability to attract new financial resources as well as more efficient use of
human and technical resources, as the targets for these two dimensions are the highest.
For the dimensions enhanced institutionalised knowledge and competence as well as increased
capability to work in transnational environment, the survey result suggests there won‟t be a
significant improvement compared to the indication of the current situation. One possible
explanation for this is that the current baselines for these dimensions are already high.
The following figure illustrates the defined baseline and target for specific objective 2.1.

Setting baselines and targets for the indicators 2014-2020 102
Figure 11: Baseline and target for specific objective 2.1
In the following, the baseline and target for the specific objective‟s result indicator is described in
short, qualitative terms as required for the Cooperation Programme. Beside a short statement
regarding the overall situation for the indicator, the dimension showing the greatest difference
between the estimation for the baseline and the target is specifically referred to in the target.
Table 19: Baseline and target for the result indicator of specific objective 2.1 as presented in the Cooperation Programme
Result indicator Baseline (2014) Target (2023)
Capacity of public authorities /
practitioners (from water
management, agricultural,
forestry, fisheries etc. sectors)
in the Programme area to
implement measures to
reduce nutrient inflows and
decrease discharges of
hazardous substances
Slightly below medium (2,7) Medium to good (3,6), focus
on better ability to attract new
financial resources
(1) (3) (5)(2) (4)
Baseline=2,7 Target=3,6
No
capacityBasic
capacity
Medium
capacity
Good
capacity
Full
capacity

Setting baselines and targets for the indicators 2014-2020 103
3.5 Specific objective 2.2: Renewable energy
The questions regarding specific objective 2.2. have been answered by seven countries, whereas
one answer does not provide information and is thus taken out of the assessment. One other
country does not provide justifications to their assessment but since their estimations appear
reasonable and differentiated, the answers will be taken into account. On average a response
rate of 6,0 countries has been obtained for specific objective 2.2.
An overview of the average results for the five dimensions estimated on a scale from 1 to 5 for a
baseline and target situation is shown in the following table. The backgrounds of these
estimations are explained for each dimension in the subsequent paragraphs. For more in depth
information about the results for the baseline and target for the different characteristics of this
dimension, a compilation of supplementary data is provided in Appendix 1 in this report.
Table 20: Summary of results for specific objective 2.2. Renewable energy
Average of estimations
Average of number of responses24
Average of all dimensions
Baseline 2,4 6,0
Target 3,5 6,0
Dimension 1: Enhanced institutionalised knowledge and competence
Baseline 2,6 6,0
Target 3,7 6,0
Dimension 2: Improved governance structures and organizational set-up
Baseline 2,2 6,0
Target 3,3 6,0
Dimension 3: More efficient use of human and technical resources
Baseline 2,4 6,0
Target 3,5 6,0
Dimension 4: Better ability to attract new financial resources
Baseline 2,3 6,0
Target 3,2 6,0
Dimension 5: Increased capability to work in transnational environment
Baseline 2,7 6,0
Target 3,8 6,0
For the two specific objectives Renewable energy and Energy efficiency, one complimentary
interview has been conducted to provide expert input on the survey results. For these two areas
an official at the Swedish Energy Agency in charge of the BSR strategy at the agency have been
interviewed.
By looking at the experts‟ estimations, the biggest difference between the estimation of baseline
and target in this specific objective can be found in dimension 5: Increased capability to work in
transnational environment. For identifying the biggest difference between baseline and target,
the second decimal place of the average of estimations had to be taken into account for this
specific objective. The respective values can be found in Annex 1 to this report.
3.5.1 Dimension 1: Enhanced institutionalised knowledge and competence
The current situation of the Baltic Sea Region regarding the institutionalised knowledge and
competence has been assessed with an average of 2,6 on a scale from 1 to 5. It is described that
knowledge is available but needs to be improved in some topics, e.g. offshore wind and in some
24 The average number of responses is calculated based on the number of responses obtained per characteristics. Decimal numbers are
due to the fact that the number of responses per characteristic within one dimension differs in some cases.

Setting baselines and targets for the indicators 2014-2020 104
regions. Mechanisms and tools for knowledge transfer exist with regional differences but more
transparency of structures and more cooperation activities are needed.
As target for 2023 an average of 3,7 has been set on the scale from 1 to 5. The target situation
is described as having increased the availability and accessibility of knowledge, especially
regarding the current knowledge gaps and knowledge transfer.
Looking at the first dimension of institutional capacity building, the interview respondent
considers that the baseline for the current availability and utilization of knowledge as well as
mechanisms for knowledge transfer provides an accurate assessment of the current situation.
The respondent describes the current development as follows:
“The mechanisms for knowledge transfer are acceptable, but there is always potential to do
more. I think we have a lot of knowledge, but there is always a challenge in taking this
knowledge further and implementing new measures. I think this will develop through the BSR
strategy.”
Looking at the target to be set for 2023, the expert interviewed considers the survey result to
provide a realistic picture of what would be a realistic and ambitious target.
3.5.2 Dimension 2: Improved governance structures and organizational set-up
The current situation of the Baltic Sea Region regarding governance structures and
organizational set-up has been assessed with an average of 2,2 on a scale from 1 to 5. It is
described that organizational structures exist but need a better organization and more cross-
institutional cooperation to function more effectively.
As target for 2023 an average of 3,3 has been set on the scale from 1 to 5. The target situation
is described as having improved structures in place that are available across institutions and
regions.
According to the interview conducted, the assessment of the current availability and utilization
of organizational structures is considered to be accurate. It is however evident that the pre-
conditions for the different countries in the Baltic Sea Region varies, where national authorities
have different mandates to work with different issues in the region. As for the targets for 2023,
the interview respondent considers that the target could be more ambitious. At the same time,
the interviewee acknowledges that there is a lack of tools for working with these issues in a more
productive manner.
3.5.3 Dimension 3: More efficient use of human and technical resources
The current situation of the Baltic Sea Region regarding the efficient use of human and
technical resources has been assessed with an average of 2,4 on a scale from 1 to 5. It is
described that human and technical resources as well as time and resource-saving measures are
partially utilized but knowledge on sharing these resources is not transferred sufficiently among
actors and regions.
As target for 2023 an average of 3,5 has been set on the scale from 1 to 5. The target situation
is described as having a stronger cooperation and joint utilization of human and technical
resources in place. Available resources are mapped and knowledge is openly accessible.
The expert interviewed for the specific objectives 2.2 and 2.3 thinks that the baseline indicated
in the survey is accurate, where a structured approach is missing. As a result of this, human and
technical resources are not utilized in an efficient manner. For the target for 2023, the result
from the expert interview indicates that the target for the specific objective energy efficiency
should be aligned with the targets for renewable energy. According to the interview respondent,

Setting baselines and targets for the indicators 2014-2020 105
the conditions for the different countries are very different, where the some countries already
have a high degree of renewable energy.
3.5.4 Dimension 4: Better ability to attract new financial resources
The current situation of the Baltic Sea Region regarding the ability to attract new financial
resources has been assessed with an average of 2,3 on a scale from 1 to 5. It is described that
the ability of attracting of private financial resources is rather basic as public-private partnerships
exist only to a limited extent and knowledge on renewable energy investments is lacking within
the financial sector. Regarding public financial resources, the ability to attract funding is more
advanced but differences exist across actors and regions.
As target for 2023 an average of 3,2 has been set on the scale from 1 to 5. The target situation
is described as slightly improved by communicating demonstration projects as good practices and
strengthening the political willingness for this objective. Public financial resources are attracted
by using professional support.
The interview result indicates that the assessment of baseline and target indicated in the survey
is accurate. One difference detected is that the Baltic States are more capable in applying for
funding than for instance Sweden, where national funding is more readily available.
3.5.5 Dimension 5: Increased capability to work in transnational environment
The current situation of the Baltic Sea Region regarding the capability to work in transnational
environment has been assessed with an average of 2,7 on a scale from 1 to 5. The answers
among the international respondents point out regional differences for the available competences
to work transnationally and the frequency of transnational contacts. It is described that
competences and networks to work transnationally exist based on previous cooperation activities.
The intensity is described as being rather low, although differences across regions and actors can
be observed.
As target for 2023 an average of 3,8 has been set on the scale from 1 to 5. The target situation
is described as showing increased intensity of transnational cooperation activities. More
information on relevant transnational actors is available to facilitate the building of networks.
As for the fifth dimension of institutional capacity building, the interview result indicates that the
assessment of baseline and target in the survey is accurate. The targets set for the capability to
work in a transnational environment are seen as realistic according to the interview. The expert
interview sees there is an untapped potential in the Baltic States as a market for renewable
energy and the collaboration between the Nordic and Baltic States could be increased.
3.5.6 Concluding summary for specific objective 2.2: Renewable energy
When analysing the survey results, the main challenge for sustaining renewable energy seem to
be improved governance structures and organizational set-up. The prospects for improving the
situation until 2023 is however high and the survey results indicate that it might be possible to
reach more than a medium level by 2023.
As for the other dimensions of institutional capacity, the baseline is fairly low suggesting the
current situation being below a medium level. The indication of targets for 2023 does however
suggest that there will be significant improvements, targeting a more than medium level for all
dimensions.
Along with improved governance structures and organizational set-up, the biggest progress is
suggested to be made in the capability to work in a transnational environment. As also stated in
the expert interview, there is an untapped potential in the collaboration between the Nordic and
the Baltic countries.

Setting baselines and targets for the indicators 2014-2020 106
The least progress is anticipated for the ability to attract financial resources. This is also
supported by the result from the interview, where the respondent considers funding being the
main obstacle for the two areas renewable energy and energy efficiency.
The following figure illustrates the defined baseline and target for specific objective 2.2.
Figure 12: Baseline and target for specific objective 2.2
In the following, the baseline and target for the specific objective‟s result indicator is described in
short, qualitative terms as required for the Cooperation Programme. Beside a short statement
regarding the overall situation for the indicator, the dimension showing the greatest difference
between the estimation of the baseline and the target is specifically referred to in the target.
Table 21: Baseline and target for the result indicator of specific objective 2.2 as presented in the Cooperation Programme
Result indicator Baseline (2014) Target (2023)
Capacity of public and private
actors involved in energy
planning and supply (public
authorities, energy agencies,
waste management, forestry,
agricultural advisories,
enterprises, NGOs) in the
Programme area to implement
measures to increase the use
of sustainable renewable
energy
Basic to medium (2,4) Medium to good (3,5), focus
on increased capability to
work in transnational
environment
(1) (3) (5)(2) (4)
Baseline=2,4 Target=3,5
No
capacityBasic
capacity
Medium
capacity
Good
capacity
Full
capacity

Setting baselines and targets for the indicators 2014-2020 107
3.6 Specific objective 2.3: Energy efficiency
The questions regarding the specific objective 2.3 have been answered by five countries, of which
one country has not provided justifications to their assessment. Since their estimations appear
reasonable and differentiated, the answers will be taken into account. On average a response
rate of 4,2 countries has been obtained for specific objective 2.3.
An overview of the average results for the five dimensions estimated on a scale from 1 to 5 for a
baseline and target situation is shown in the following table. The backgrounds of these
estimations are explained for each dimension in the subsequent paragraphs. For more in depth
information about the results for the baseline and target for the different characteristics of this
dimension, a compilation of supplementary data is provided in Appendix 1 in this report.
Table 22: Summary of the results for specific objective 2.3. Energy efficiency
Average of estimations
Average of number of responses25
Average of all dimensions
Baseline 2,6 4,2
Target 3,5 3,9
Dimension 1: Enhanced institutionalised knowledge and competence
Baseline 3,0 5,0
Target 3,3 5,0
Dimension 2: Improved governance structures and organizational set-up
Baseline 2,8 4,5
Target 3,6 4,0
Dimension 3: More efficient use of human and technical resources
Baseline 2,4 3,7
Target 3,3 3,3
Dimension 4: Better ability to attract new financial resources
Baseline 2,3 4,0
Target 3,7 3,0
Dimension 5: Increased capability to work in transnational environment
Baseline 2,7 4,0
Target 3,4 4,0
As mentioned in the previous chapter, one complimentary interview has been conducted for the
two specific objectives Renewable energy and Energy efficiency to provide expert input on the
survey results. For these two areas an official at the Swedish Energy Agency in charge of the BSR
strategy at the agency have been interviewed.
By looking at the experts‟ estimations, the biggest difference between the estimation of baseline
and target in this specific objective can be found in dimension 4: Better ability to attract new
financial resources.
3.6.1 Dimension 1: Enhanced institutionalised knowledge and competence
The current situation of the Baltic Sea Region regarding the institutionalised knowledge and
competence has been assessed with an average of 3,0 on a scale from 1 to 5. It is described that
knowledge is available but can be improved, e.g. by transnational studies. A good basis for
knowledge transfer exists but it is lacking transparency and communication.
25 The average number of responses is calculated based on the number of responses obtained per characteristics. Decimal numbers are
due to the fact that the number of responses per characteristic within one dimension differs in some cases.

Setting baselines and targets for the indicators 2014-2020 108
As target for 2023 an average of 3,3 has been set on the scale from 1 to 5. The target situation
is described as having a good availability and accessibility of knowledge. This process is enforced
by financial, institutional and organisational support.
As previously stated in section 3.5.1, the interview results suggest the indication of baseline and
targets are considered to be accurate and realistic.
3.6.2 Dimension 2: Improved governance structures and organizational set-up
The current situation of the Baltic Sea Region regarding governance structures and
organizational set-up has been assessed with an average of 2,8 on a scale from 1 to 5. It is
described that organizational structures exist in terms of tools and platforms.
As target for 2023 an average of 3,6 has been set on the scale from 1 to 5. The target situation
is described as having improved structures in place, especially IT-structures that allow a larger
involvement of the public.
As mentioned earlier in section 3.5.2, the results from the interview indicate that the baseline
assessment of the current situation is accurate. As for the targets for 2023, the interview
respondent considers that the target could be more ambitious.
3.6.3 Dimension 3: More efficient use of human and technical resources
The current situation of the Baltic Sea Region regarding the efficient use of human and
technical resources has been assessed with an average of 2,4 on a scale from 1 to 5. It is
described that human and technical resources as well as time and resource-saving measures are
partially available and utilized with large regional differences.
As target for 2023 an average of 3,3 has been set on the scale from 1 to 5. The target situation
is described as having a more balanced demand and supply situation thanks to educational
policies, stronger cooperation and exchange and availability of transnational databases.
The interview results suggest that the assessment of the current baseline is credible. For the
target for 2023, the result from the expert interview indicates that the target for the specific
objective energy efficiency should be aligned with the targets for renewable energy. The
respondent thinks that the ability to reach a higher target is more tangible for the area of energy
efficiency even compared to renewable energy:
“Energy efficiency is about managing the resources available in an upright way and does not
have to be that costly. I think it would be easier in the area of energy efficiency, as the
investment in renewable energy is much higher.”
3.6.4 Dimension 4: Better ability to attract new financial resources
The current situation of the Baltic Sea Region regarding the ability to attract new financial
resources has been assessed with an average of 2,3 on a scale from 1 to 5. It is described that
the ability to attract private financial resources differs largely across actors and regions ranging
from having poor to good abilities. Regarding the ability to attract public financial resources, a
similar situation is described. It is stated that knowledge on public funding sources and capacities
to apply for funding are available only to a limited extent.
As target for 2023 an average of 3,7 has been set on the scale from 1 to 5. The target situation
is expected to slightly improve by implementing more public-private partnerships and improving
skills on attracting financial resources.
As previously mentioned in section 3.5.4, the interview result indicates that the assessment of
baseline and target indicated in the survey is accurate.

Setting baselines and targets for the indicators 2014-2020 109
3.6.5 Dimension 5: Increased capability to work in transnational environment
The current situation of the Baltic Sea Region regarding the capability to work in transnational
environment has been assessed with an average of 2,7 on a scale from 1 to 5. It is described
that competences and networks as well as openness to work transnationally exist, especially in
cross-border regions. Language issues and professional competences are seen as barriers.
As target for 2023 an average of 3,4 has been set on the scale from 1 to 5. The target situation
is described as having further developed cooperation activities and improved capacities among
the stakeholders.
As mentioned previously in section 3.5.5, the baselines and targets set for the capability to work
in a transnational environment is considered conceivable by the expert interviewed.
3.6.6 Concluding summary for specific objective 2.3: Energy efficiency
When analysing the survey results, enhanced institutionalized knowledge and competence is the
dimension with the highest average assessment of the current situation. The estimations suggest
a sufficient availability and utilization of knowledge as well as mechanisms for knowledge transfer
for the area of energy efficiency. Despite this, the target for this dimension is lower than all other
dimensions, suggesting there won‟t be any significant improvements until 2023.
The survey results indicate that the main challenge for sustaining energy efficiency is the ability
to attract new financial resources. The prospects for improving the situation until 2023 is
however high and the survey results indicate that it will be possible to reach a medium to good
level by 2023. The result from the survey also suggests there are challenges in sustaining a more
efficient use of human and technical resources. The result from the interview conducted does
however suggest that there is great potential for improvement in this area, even though it might
not show in the survey results.
By looking at the target set for 2023, the survey results indicate that the biggest potential lies in
the ability to attract new financial resources as well as in improved governance structures and
organizational set-up, as the targets for these two dimensions are the highest.
The following figure illustrates the defined baseline and target for specific objective 2.3.
Figure 13: Baseline and target for specific objective 2.3
In the following, the baseline and target for the specific objective‟s result indicator is described in
short, qualitative terms as required for the Cooperation Programme. Beside a short statement
(1) (3) (5)(2) (4)
Baseline=2,6 Target=3,5
No
capacityBasic
capacity
Medium
capacity
Good
capacity
Full
capacity

Setting baselines and targets for the indicators 2014-2020 110
regarding the overall situation for the indicator, the dimension showing the difference between
the estimation of the baseline and the target is specifically referred to in the target.
Table 23: Baseline and target for the result indicator of specific objective 2.3 as presented in the Cooperation Programme
Result indicator Baseline (2014) Target (2023)
Capacity of public and private
actors involved in energy
planning (public authorities,
energy agencies, enterprises,
NGOs) in the Programme area
to implement measures to
increase energy efficiency
Basic to medium (2,6) Medium to good (3,5), focus
on better ability to attract new
financial resources

Setting baselines and targets for the indicators 2014-2020 111
3.7 Specific objective 2.4: Resource-efficient blue growth
The questions regarding the specific objective 2.4 have been answered by seven countries, of
which one country has provided only limited justifications to their assessment. Since their
estimations appear reasonable and differentiated, the answers will be taken into account. On
average a response rate of 6,9 countries has been obtained for specific objective 2.4.
An overview of the average results for the five dimensions estimated on a scale from 1 to 5 for a
baseline and target situation is shown in the following table. The backgrounds of these
estimations are explained for each dimension in the subsequent paragraphs. For more in depth
information about the results for the baseline and target for the different characteristics of this
dimension, a compilation of supplementary data is provided in Appendix 1 in this report.
Table 24: Summary of the results for specific objective 2.4. Resource-efficient blue growth
Average of estimations
Average of number of
responses26
Average of all dimensions
Baseline 2,8 6,9
Target 3,6 6,9
Dimension 1: Enhanced institutionalised knowledge and competence
Baseline 2,9 7,0
Target 3,8 7,0
Dimension 2: Improved governance structures and organizational set-up
Baseline 2,8 7,0
Target 3,7 7,0
Dimension 3: More efficient use of human and technical resources
Baseline 2,6 6,7
Target 3,5 6,7
Dimension 4: Better ability to attract new financial resources
Baseline 2,4 7,0
Target 3,3 7,0
Dimension 5: Increased capability to work in transnational environment
Baseline 3,2 7,0
Target 4,0 7,0
For the specific objective Resource-efficient blue growth, two interviews were conducted with
thematic experts in Norway and in Poland to provide expert input on the survey results. The
expert in Poland is associated with the Maritime Institute in Gdańsk and the expert in Norway is a
professor at University of Stavanger and the International Centre for Trade and Sustainable
Development.
By looking at the experts‟ estimations, the biggest difference between the estimation of baseline
and target in this specific objective can be found in dimension 3: More efficient use of human and
technical resources. For identifying the biggest difference between baseline and target, the
second decimal place of the average of estimations had to be taken into account for this specific
objective. The respective values can be found in Annex 1 to this report.
26 The average number of responses is calculated based on the number of responses obtained per characteristics. Decimal numbers are
due to the fact that the number of responses per characteristic within one dimension differs in some cases.

Setting baselines and targets for the indicators 2014-2020 112
3.7.1 Dimension 1: Enhanced institutionalised knowledge and competence
The current situation of the Baltic Sea Region regarding the institutionalised knowledge and
competence has been assessed with an average of 2,9 on a scale from 1 to 5. Whereas in some
parts of the Baltic Sea Region it is estimated that mechanisms for knowledge transfer and the
utilization of knowledge are already quite advanced, in other parts of the Baltic Sea Region it is
estimated to be still fairly basic. It is described that basic to good knowledge is available but
knowledge gaps exist, e.g. regarding economic impacts. Mechanisms for knowledge transfer are
available but their effective usage and diffusion across a wider target group can be improved.
As target for 2023 an average of 3,8 has been set on the scale from 1 to 5. The target situation
is described as having a good availability and accessibility of knowledge, thanks to wider
networks, improved knowledge transfer and cooperation.
The interview respondents consider that the baseline indicated constitute an accurate
assessment of the current situation. The results from the interviews does however suggest that
there are some differences in the availability and utilization of knowledge as well as mechanisms
for knowledge transfer between different types of actors in the Baltic Sea Region. The interview
result indicates that the knowledge and competence within academia and research institutions
are at a medium level, while the knowledge and competence in public authorities is lower.
“Our University system is in the forefront, research has been undertaken for decades. We have
good enough knowledge that is used in the rest of the world.”
As for the targets for the first dimension, the interview respondents consider the survey result to
be accurate. One respondent clarifies there is a need to improve the mechanisms for knowledge
transfer in the Baltic Sea Region. The other expert interview considers the level of knowledge to
be at a medium level, but there are differences in the utilization of knowledge throughout the
region:
“I think that the availability of knowledge is the same for all countries. The main difference is not
some much in terms of knowledge but more how one relates to that knowledge. Basically, the
Nordic countries are much more concerned about the environment and therefore, the will to
implement measures is large in Nordic countries. This means that if the Baltic Sea Region should
improve, this understanding is needed to be improved also on the southern rim of the Baltic
Sea.”
3.7.2 Dimension 2: Improved governance structures and organizational set-up
The current situation of the Baltic Sea Region regarding governance structures and
organizational set-up has been assessed with an average of 2,8 on a scale from 1 to 5. It is
described that organizational structures exist in terms of platforms or round tables. However
these are often limited to single regions and are not available transnationally. Furthermore, the
utilization is partially limited due to the fact that the target groups do not see clear benefits in
using the structures.
As target for 2023 an average of 3,7 has been set on the scale from 1 to 5. The target situation
is described as having more extensive structures in place, including the wider public and
transnational regions. The benefits of using the joint structures are communicated to the target
groups.
For the second dimension, the interview results indicate there is a difference in the governance
structure and organizational set-up in the different countries in the Baltic Sea Region. The two
interviewed experts indicate the obstacle in establishing change in governance structures in the
public sector. There are also interregional differences within the BSR. With this in mind, the two
interviewed experts consider the target for 2023 indicated in the survey to be too ambitious and

Setting baselines and targets for the indicators 2014-2020 113
that it is difficult to determine what could be realistic target, as the interregional differences are
high.
3.7.3 Dimension 3: More efficient use of human and technical resources
The current situation of the Baltic Sea Region regarding the efficient use of human and
technical resources has been assessed with an average of 2,6 on a scale from 1 to 5 It is
described that human and technical resources as well as time and resource-saving measures are
available to some extent and used rather efficiently. However, some regional differences exist.
Development and information on technical resources need to be improved.
As target for 2023 an average of 3,5 has been set on the scale from 1 to 5. The target situation
is described as using the available resources more efficiently thanks to a stronger transnational
cooperation.
Results from the interviews indicate that significant differences between different parts of the
Baltic Sea Region are also evident in the case of the third dimension of institutional capacity. One
of the expert interviewed states that the great differences between the countries in the Baltic Sea
Region puts a clear limit on the level of efficiency for human and technical resources. For
instance, in order to improve the state of nutrient loading in the Baltic Sea, there is a need for
action from all countries – even those with rivers that channel out in the Baltic Sea. The results
from the survey indicate just a slight improvement for 2023, which the interviewed experts
consider to be realistic having the above-mentioned obstacles in mind.
3.7.4 Dimension 4: Better ability to attract new financial resources
The current situation of the Baltic Sea Region regarding the ability to attract new financial
resources has been assessed with an average of 2,4 on a scale from 1 to 5. It is described that
the ability to attract private financial resources differs depending on the size and topic of the
project in question. Regarding public financial resources, a higher ability to attract funding is
indicated, although regional differences exist.
As target for 2023 an average of 3,3 has been set on the scale from 1 to 5. The target situation
is expected to slightly improve by implementing more public-private partnerships and intensifying
the connections between research, public bodies and the private sector.
The interview result indicates that the survey result constitute an accurate and realistic
assessment of the baseline and target for the Baltic Sea Region. Yet for this dimension,
differences between old and new member states are evident, where the old member states are
more accustomed to cooperation between different member states. One of the respondents
underscore the importance of cooperation, as the lack of actions from some countries put a limit
on the potential profitability on investments made in sustaining a more resource-efficient blue
growth in the Baltic Sea Region. The results from the survey indicate just a slight improvement
for the target for 2023, which the interviewed experts consider to be realistic.
3.7.5 Dimension 5: Increased capability to work in transnational environment
The current situation of the Baltic Sea Region regarding the capability to work in transnational
environment has been assessed with an average of 3,2 on a scale from 1 to 5. It is described
that medium to good competences and networks exist, especially among public bodies and
researchers. Experiences and traditions in transnational cooperation vary among the regions.
Networks are established often based on individual projects.
As target for 2023 an average of 4,0 has been set on the scale from 1 to 5. The target situation
is described as having further developed cooperation activities and wider networks. Connections
and contacts are used more intensively, including relevant personal networks.

Setting baselines and targets for the indicators 2014-2020 114
As for the capability to work in a transnational environment, the experts interviewed indicate
that the assessment of the current available competences to work transnationally, the frequency
of transnational contacts and intensity of transnational collaboration is accurate, but clarifying
that the situation is more satisfying for the academia than for public authorities. Assessing the
target indicated in the survey, both of the interviewed experts consider it to be somewhat
ambitious, as this at large is a question of culture and customs, and the current governance
structures does not support implementation of the result of transnational collaboration.
3.7.6 Concluding summary for objective 2.4: Resource-efficient blue growth
When analysing the survey results for the specific objective 2.4 a more efficient use of human
and technical resources as well as a better ability to attract new financial resources seem to be
the two main challenges. For these dimensions, the results indicate that the current situation is
at a basic to medium level. The targets for these areas are lower than for the other three
dimensions. This result is in line with the result from the structured interviews; where there is a
need to have all countries progressing in order to allow for investments to be profitable. Despite
this, survey respondents are expecting the situation to improve the most for these dimensions.
For the other three dimensions of institutional capacity, the baseline is fairly similar ranging from
2,8 to 3,2 on a scale from 1 to 5. The survey results also indicate ambitious targets for these
dimensions, being close to a value of 4 on a scale of 1 to 5. Results from the interviews do
however suggest that the targets for improved governance structures and organisational set-up
are too ambitious.
The following figure illustrates the defined baseline and target for specific objective 2.4.
Figure 14: Baseline and target for specific objective 2.4
In the following, the baseline and target for the specific objective‟s result indicator is described in
short, qualitative terms as required for the Cooperation Programme. Beside a short statement
regarding the overall situation for the indicator, the dimension showing the greatest difference
between the estimation for the baseline and the target is specifically referred to in the target.
(1) (3) (5)(2) (4)
Baseline=2,8 Target=3,6
No
capacityBasic
capacity
Medium
capacity
Good
capacity
Full
capacity

Setting baselines and targets for the indicators 2014-2020 115
Table 25: Baseline and target for the result indicator of specific objective 2.4 as presented in the Cooperation Programme
Result indicator Baseline (2014) Target (2023)
Capacity of public authorities,
enterprises, and NGOs in the
Programme area to implement
measures to advance
sustainable business
opportunities for blue growth
Slightly below medium (2,8) Medium to good (3,6), focus
on more efficient use of
human and technical
resources

Setting baselines and targets for the indicators 2014-2020 116
3.8 Specific objective 3.1: Interoperability of transport modes
The questions regarding the specific objective 3.1 have been answered by six countries, of which
three countries have not provided justifications to their assessment. Since their estimations
appear reasonable and differentiated, the answers will be taken into account. On average a
response rate of 5,3 countries has been obtained for specific objective 3.1.
An overview of the average results for the five dimensions estimated on a scale from 1 to 5 for a
baseline and target situation is shown in the following table. The backgrounds of these
estimations are explained for each dimension in the subsequent paragraphs. For more in depth
information about the results for the baseline and target for the different characteristics of this
dimension, a compilation of supplementary data is provided in Appendix 1 in this report.
Table 26: Summary of the results for specific objective 3.1 Interoperability of transport modes
Average of estimations
Average of number of responses27
Average of all dimensions
Baseline 2,3 5,3
Target 2,9 5,2
Dimension 1: Enhanced institutionalised knowledge and competence
Baseline 2,6 6,0
Target 3,0 5,7
Dimension 2: Improved governance structures and organizational set-up
Baseline 2,1 6,0
Target 2,9 6,0
Dimension 3: More efficient use of human and technical resources
Baseline 2,4 5,0
Target 3,0 5,0
Dimension 4: Better ability to attract new financial resources
Baseline 1,9 4,5
Target 2,4 4,5
Dimension 5: Increased capability to work in transnational environment
Baseline 2,5 5,0
Target 3,2 5,0
For the two specific objectives 3.1 Interoperability of transport modes and 3.2 Accessibility of
remote areas and areas affected by demographic change, two experts have been consulted
through structured interviews to provide expert input on the survey results. The first respondent
is from Germany, working at Tallinn University of Technology and the other respondent is
appointed Priority Action Coordinator for PA Transport.
By looking at the experts‟ estimations, the biggest difference between the estimation of baseline
and target in this specific objective can be found in dimension 2: Improved governance
structures and organizational set-up.
3.8.1 Dimension 1: Enhanced institutionalised knowledge and competence
The current situation of the Baltic Sea Region regarding the institutionalised knowledge and
competence has been assessed with an average of 2,6 on a scale from 1 to 5. It is described that
knowledge is available and information is partially being exchanged between public bodies,
27 The average number of responses is calculated based on the number of responses obtained per characteristic. Decimal numbers are
due to the fact that the number of responses per characteristic within one dimension differs in some cases.

Setting baselines and targets for the indicators 2014-2020 117
research institutions and companies. However, improvement potential exists with regard to
systematic knowledge transfer and networks.
As target for 2023 an average of 3,0 has been set on the scale from 1 to 5. The target situation
is described as having improved mechanisms for knowledge transfer that allow a confidential
exchange of information in an organized and systematic way.
In the area of interoperability of transport modes and accessibility of remote areas and areas
affected by demographic change, the assessment of the current availability and utilization of
knowledge as well as mechanisms for knowledge transfer is considered to be accurate by the two
experts interviewed.
According to one of the respondents, there is a lack of knowledge at the decision making level,
which is problematic for sustaining a multi modal transport system. Result from the other
interview conducted also indicates that the capacity varies, where countries such as Sweden,
Finland and Germany have greater knowledge and also experience of transnational collaboration.
The targets indicated in the survey are considered to be accurate, but at the same time, there
are some challenges in measuring knowledge transfer says one of the interviewed experts.
3.8.2 Dimension 2: Improved governance structures and organizational set-up
The current situation of the Baltic Sea Region regarding governance structures and
organizational set-up has been assessed with an average of 2,1 on a scale from 1 to 5. It is
described that governance and organizational structures exist but lack continuity beyond
individual project lifetimes.
As target for 2023 an average of 2,9 has been set on the scale from 1 to 5. The target situation
is described as showing a more integrative cross-border approach towards governance and
organisational structures. Systematic and facilitated platforms for cooperation and information
exchange between the existing networks exist.
For the governance structures and organizational set-up for the specific objectives, the baseline
indicated in the survey is considered to be accurate by the experts interviewed, but there is
reason to believe there are differences in different parts of the countries of the Baltic Sea Region.
The target for 2023 as indicated in the survey is considered to be a realistic yet ambitious target
by one of the experts interviewed. The other respondent adds that there is a challenge in
changing the mind-set of the Baltic States towards cooperation rather than competition.
3.8.3 Dimension 3: More efficient use of human and technical resources
The current situation of the Baltic Sea Region regarding the efficient use of human and
technical resources has been assessed with an average of 2,4 on a scale from 1 to 5. It is
described that human and technical resources as well as time and resource-saving measures are
available to some extent and used rather efficiently. However, the willingness to act in open
networks is limited and some technical resources are not compatible.
As target for 2023 an average of 3,0 has been set on the scale from 1 to 5. The target situation
is described as using the available resources more efficiently thanks to a strengthened trust and
financial support. Furthermore, a road map jointly developed by public decision makers, research
institutions and companies is used to increase the efficient use of resources.
The baseline indicated for the use of technical and human resources are considered to provide an
accurate assessment of the current situation according the two interviewed experts. The
results from the interview does however indicate some challenges for the western countries, as

Setting baselines and targets for the indicators 2014-2020 118
these are focusing more on individual needs within the country. As for the target for this
dimension, one of the experts considers that the target indicated in the survey is realistic, while
the other expert is far more pessimistic.
3.8.4 Dimension 4: Better ability to attract new financial resources
The current situation of the Baltic Sea Region regarding the ability to attract new financial
resources has been assessed with an average of 1,9 on a scale from 1 to 5. It is described that
the ability to attract private financial resources is rather basic but depends on the individual
actors‟ capacity and knowledge. Regarding public financial resources, a higher ability to attract
funding is indicated, although some actors avoid public funding due to bureaucratic procedures.
As target for 2023 an average of 2,4 has been set on the scale from 1 to 5. The target situation
is expected to slightly improve by implementing effective public-private partnerships and
simplifying the funding process for public financial resources.
In the area of accessibility and transport, the interviewed experts consider that the baseline
indicated for the ability to attract both external private and external public financial resources is
accurate. As also indicated in the survey, the ability to attract external private financial resources
is low in the transport sector, where infrastructure is often seen as common good that is to be
financed via public means. The use of private-public partnerships (PPP‟s) are complicated in for
instance Germany and Poland. For the target for the ability to attract both external private and
public financial resources, both respondents consider that the target should be on a medium
level, which at large is aligned with the results from the survey.
3.8.5 Dimension 5: Increased capability to work in transnational environment
The current situation of the Baltic Sea Region regarding the capability to work in transnational
environment has been assessed with an average of 2,5 on a scale from 1 to 5. It is described
that competences and networks exist, however contacts are often project-related and difficult to
keep on the long-term.
As target for 2023 an average of 3,2 has been set on the scale from 1 to 5. The target situation
is described as showing a common working culture across countries and further developed
networks which will be strengthened through continuous cooperation activities.
For the fifth dimension: Increased capability to work in transnational environment, the baseline
indicated in the survey is seen as an accurate assessment of the current situation by the experts
interviewed. One of the interviewed experts does however think there is somewhat difficult to
determine what could be a realistic assessment of the current situation. Furthermore, the result
from the interviews indicates that one challenge in establishing transnational cooperation is the
funding:
“The problem is that transnational activities are complicated to finance. [The capability to work in
a transnational environment] is now on a basic level. The weak point is that EU is pushing it, but
the financial means is just 10 percent, so a big part must come from national budgets.”
The targets set for this dimension is considered to be accurate by the interviewed experts, even
though the conditions are different for the eastern and western countries in the Baltic Sea
Region.
3.8.6 Concluding summary for specific objective 3.1 Interoperability of transport modes
When analysing the survey results for the specific objective Interoperability of transport modes,
both baselines and targets set for the different dimension are fairly low. None of the targets
indicated in the survey are above a medium level of capacity.

Setting baselines and targets for the indicators 2014-2020 119
The biggest challenge seems to be the ability to attract financial resources, as the current
situation indicated in the survey is below a basic level. The prospects for improving the situation
until 2023 does not look particularly promising either, as the target for this dimension is set to be
just slightly higher than basic. As mentioned previously in this chapter, this is supported by the
result from the interviews, where one main obstacle is to promote investments in more
peripheral areas rather than core areas, and also to find structures for funding of transnational
projects.
The area where the survey respondents have indicated the highest target is for the capability to
work in a transnational level, where it would be realistic to target a situation where the available
competences to work transnationally, the frequency of transnational contacts and intensity of
transnational collaboration are above a medium level. The highest potential for improvements
can be seen for the dimension improved governance structures and organizational set-up.
The following figure illustrates the defined baseline and target for specific objective 3.1.
Figure 15: Baseline and target for specific objective 3.1
In the following, the baseline and target for the specific objective‟s result indicator is described in
short, qualitative terms as required for the Cooperation Programme. Beside a short statement
regarding the overall situation for the indicator, the dimension showing the greatest difference
between the estimation for the baseline and the target is specifically referred to in the target.
Table 27: Baseline and target for the result indicator of specific objective 3.1 as presented in the Cooperation Programme
Result indicator Baseline (2014) Target (2023)
Capacity of public and private
transport actors (public
authorities, logistic and
transport operators, ports,
intergovernmental and
research org.) in the
Programme area to implement
measures increasing
interoperability between
transport modes and systems
Basic to medium (2,3)
Slightly below medium (2,9),
focus on improved governance
structures and organizational
set-up
(1) (3) (5)(2) (4)
Baseline=2,3 Target=2,9
No
capacity
Basic
capacity
Medium
capacity
Good
capacity
Full
capacity

Setting baselines and targets for the indicators 2014-2020 120
3.9 Specific objective 3.2: Accessibility of remote areas and areas affected by demographic
change
The questions regarding the specific objective 3.2 have been answered only by three countries,
of which one country has provided only limited justifications to their assessment. Since their
estimations appear reasonable and differentiated, the answers will be taken into account. On
average a response rate of 3,0 countries has been obtained for specific objective 3.2.
An overview of the average results for the five dimensions estimated on a scale from 1 to 5 for a
baseline and target situation is shown in the following table. The backgrounds of these
estimations are explained for each dimension in the subsequent paragraphs. For more in depth
information about the results for the baseline and target for the different characteristics of this
dimension, a compilation of supplementary data is provided in Appendix 1 in this report.
Table 28: Summary of the results for specific objective 3.2. Accessibility of remote areas and areas affected by demographic change
Average of estimations
Average of number of responses28
Average of all dimensions
Baseline 2,8 3,0
Target 3,8 3,0
Dimension 1: Enhanced institutionalised knowledge and competence
Baseline 2,9 3,0
Target 4,2 3,0
Dimension 2: Improved governance
structures and organizational set-up
Baseline 2,7 3,0
Target 3,7 3,0
Dimension 3: More efficient use of human and technical resources
Baseline 2,8 3,0
Target 3,7 3,0
Dimension 4: Better ability to attract new financial resources
Baseline 2,7 3,0
Target 3,5 3,0
Dimension 5: Increased capability to work in transnational environment
Baseline 3,2 3,0
Target 4,0 3,0
As also mentioned in the previous chapter, two experts have been consulted through structured
interviews for the two specific objectives 3.1 Interoperability of transport modes and 3.2
Accessibility of remote areas and areas affected by demographic change to provide expert input
on the survey results. The first respondent is from Germany, working at Tallinn University of
Technology and the other respondent is appointed Priority Action Coordinator for PA Transport.
By looking at the experts‟ estimations, the biggest difference between the estimation of baseline
and target in this specific objective can be found in dimension 1: Enhanced institutionalised
knowledge and competence.
3.9.1 Dimension 1: Enhanced institutionalised knowledge and competence
The current situation of the Baltic Sea Region regarding the institutionalised knowledge and
competence has been assessed with an average of 2,9 on a scale from 1 to 5. It is described that
knowledge is available but an effective system to share the knowledge between regions and
28 The average number of responses is calculated based on the number of responses obtained per characteristic. Decimal numbers are
due to the fact that the number of responses per characteristic within one dimension differs in some cases.

Setting baselines and targets for the indicators 2014-2020 121
actors is lacking. Partly, this is due to insufficient institutional and territorial cooperation between
actors and regions.
As target for 2023 an average of 4,2 has been set on the scale from 1 to 5. The target situation
is described as having installed systems/ mechanisms which effectively support the better
utilization of the available knowledge and data. The knowledge is available to a wider group of
actors and between regions.
As previously mentioned in section 3.8.1, the assessment of the current availability and
utilization of knowledge and mechanisms for knowledge transfer is considered to be accurate by
the two experts interviewed.
According to one of the interviewed experts, demographic change and a declining population
constitute a challenge in creating a sufficient infrastructure in some parts of the BSR. The
magnitude of the problem varies throughout the region, and there are also differences in the
level of knowledge available, the respondent says. The targets indicated in the survey are
considered to be accurate.
3.9.2 Dimension 2: Improved governance structures and organizational set-up
The current situation of the Baltic Sea Region regarding governance structures and
organizational set-up has been assessed with an average of 2,7 on a scale from 1 to 5. It is
described that organizational structures are available in most regions. However, the effective use
of the structures differs widely between regions and stakeholders.
As target for 2023 an average of 3,7 has been set on the scale from 1 to 5. The target situation
is described as involving a wider group of stakeholders and thus makes better use of the
organizational structures which are already installed.
As stated previously in section 3.8.2, the baseline indicated in the survey is considered to provide
an accurate assessment of the current situation according to the interview results. As for the
targets indicated, the respondents comply with the target indicated, although they are considered
ambitious.
3.9.3 Dimension 3: More efficient use of human and technical resources
The current situation of the Baltic Sea Region regarding the efficient use of human and
technical resources has been assessed with an average of 2,8 on a scale from 1 to 5. It is
described that the utilization of human and technical resources is widely differs among regions
and organizations. Only in very few cases, time- and resource-saving measures are applied.
As target for 2023 an average of 3,7 has been set on the scale from 1 to 5. The target situation
is described as making all relevant stakeholders aware of the human and technical resources
available for a certain task. Additionally, cooperation has improved in order to use the resources
available more efficiently and thus save time and resources.
According to the interviews, the baseline indicated provides an accurate assessment of the
current situation. As for the target for 2023, the two experts have different point of views on the
accuracy of the indicated targets. One of the experts states that the target indicated in the
survey is realistic, while the other expert is far more pessimistic, stating there are significant
challenges in increasing accessibility, especially by train.
3.9.4 Dimension 4: Better ability to attract new financial resources
The current situation of the Baltic Sea Region regarding the ability to attract new financial
resources has been assessed with an average of 2,7 on a scale from 1 to 5. It is described that
only a few sectors are able to attract private financial resources. With regard to public financial

Setting baselines and targets for the indicators 2014-2020 122
resources, the economic situation has made it more difficult to attract public financial resources
as the state has cut down on funding in many areas.
As target for 2023 an average of 3,5 has been set on the scale from 1 to 5. The target situation
is described as having improved the connection between scientific, public and business
stakeholders in order to facilitate the attraction of financial resources. Additionally, a better and
more effective presentation of the ideas and approaches which need financial resources will
support the attraction of financial means.
As previously mentioned in section 3.8.4 in this report, the baseline and targets indicated in the
survey is considered to be accurate by the two experts interviewed.
3.9.5 Dimension 5: Increased capability to work in transnational environment
The current situation of the Baltic Sea Region regarding the capability to work in transnational
environment has been assessed with an average of 3,2 on a scale from 1 to 5. It is described
that mutual projects in recent years have supported transnational cooperation. However, working
transnationally is often limited to the national or regional level and research institutions. Smaller
municipalities in remote areas often do not cooperate transnationally.
As target for 2023 an average of 4,0 has been set on the scale from 1 to 5. The target situation
is described as having reached a more intense and deepened level of transnational collaboration.
Working transnationally is very common for the majority of stakeholders.
According to the interviews, the baseline and target indicated in the survey are considered to be
accurate, although one expert think there is somewhat difficult to determine what could be a
realistic assessment of the current situation. As for the prospects for 2023, another interviewed
expert adds that there is a risk of conflict of interest as the general interest oftentimes is to
develop the infrastructure in core regions rather than in more remote areas close to country
borders.
3.9.6 Concluding summary for specific objective 3.2 Accessibility of remote areas and areas affected by
demographic change
The baselines indicated for the dimensions under this specific objective are fairly similar,
indicating that the current situation for the institutional capacity is just slightly below a medium
level. The only exception is the capability to work in a transnational environment, for which the
estimation of the current situation is slightly higher than for the other four dimensions. According
to the two experts interviewed, transfer of knowledge between different countries and increased
cooperation is seen as two of the main obstacles for this specific objective.
The targets for 2023 indicated in the survey are fairly high, all indicating a value well above a
medium level. For the two dimensions institutionalised knowledge and competence as well as the
capability to work in a transnational environment, the target is set to slightly above good
capacity. This result suggests that the ambition is high for this specific objective and that much is
anticipated by the work to be done within this specific objective.
The following figure illustrates the defined baseline and target for specific objective 3.2.

Setting baselines and targets for the indicators 2014-2020 123
Figure 16: Baseline and target for specific objective 3.2
In the following, the baseline and target for the specific objective‟s result indicator is described in
short, qualitative terms as required for the Cooperation Programme. Beside a short statement
regarding the overall situation for the indicator, the dimension showing the greatest difference
between the estimation for the baseline and the target is specifically referred to in the target.
Table 29: Baseline and target for the result indicator of specific objective 3.2 as presented in the Cooperation Programme
Result indicator Baseline (2014) Target (2023)
Capacity of public / private
transport actors (public
authorities, logistic and
transport operators) in the
Programme area to implement
economically efficient
solutions to improve the
accessibility of remote
regions/regions affected by
demographic change
Slightly below medium (2,8) Slightly below good (3,8),
focus on enhanced
institutionalized knowledge
and competence
(1) (3) (5)(2) (4)
Baseline=2,8 Target=3,8
No
capacityBasic
capacity
Medium
capacity
Good
capacity
Full
capacity

Setting baselines and targets for the indicators 2014-2020 124
3.10 Specific objective 3.3: Maritime safety
The questions regarding the specific objective 3.3 have been answered by five countries, of which
one country has provided only limited justifications to their assessment. Since their estimations
appear reasonable and differentiated, the answers will be taken into account. On average a
response rate of 5,0 countries has been obtained for specific objective 3.3.
An overview of the average results for the five dimensions estimated on a scale from 1 to 5 for a
baseline and target situation is shown in the following table. The backgrounds of these
estimations are explained for each dimension in the subsequent paragraphs. For more in depth
information about the results for the baseline and target for the different characteristics of this
dimension, a compilation of supplementary data is provided in Appendix 1 in this report.
Table 30: Summary of the results for specific objective 3.3. Maritime safety
Average of estimations
Average of number of responses29
Average of all dimensions
Baseline 2,5 5,0
Target 3,4 5,0
Dimension 1: Enhanced institutionalised knowledge and competence
Baseline 2,5 5,0
Target 3,6 5,0
Dimension 2: Improved governance structures and organizational set-up
Baseline 2,4 5,0
Target 3,5 5,0
Dimension 3: More efficient use of
human and technical resources
Baseline 2,5 5,0
Target 3,8 5,0
Dimension 4: Better ability to attract new financial resources
Baseline 1,9 5,0
Target 2,6 5,0
Dimension 5: Increased capability to
work in transnational environment
Baseline 2,9 5,0
Target 3,6 5,0
For the two specific objectives 3.3 Maritime safety and 3.4 Environmentally friendly shipping, two
experts have been interviewed to provide expert input on the survey results. One of the
respondents works at the Danish Maritime Authority and is also assisting Priority Action
Coordinator for PA Ship. The other respondent is head of the Maritime Safety division at The
Lithuanian Maritime Safety Administration (MSA).
By looking at the experts‟ estimations, the biggest difference between the estimation of baseline
and target in this specific objective can be found in dimension 3: More efficient use of human and
technical resources.
3.10.1 Dimension 1: Enhanced institutionalised knowledge and competence
The current situation of the Baltic Sea Region regarding the institutionalised knowledge and
competence has been assessed with an average of 2,5 on a scale from 1 to 5. It is described that
a lot of knowledge is available in this field in the Baltic Sea Region. However, no sufficient
systems or mechanisms for knowledge sharing are available. Knowledge is often shared only
based on personal contacts between single stakeholders.
29 The average number of responses is calculated based on the number of responses obtained per characteristic. Decimal numbers are
due to the fact that the number of responses per characteristic within one dimension differs in some cases.

Setting baselines and targets for the indicators 2014-2020 125
As target for 2023 an average of 3,6 has been set on the scale from 1 to 5. The target situation
is described as having implemented new or make use of the already existing mechanisms for
knowledge transfer. Also, it should be agreed upon which information should be available for the
whole region and define international standards on how to exchange information and data.
For the specific objectives maritime safety and environmentally friendly shipping, both of the
interviewed experts consider that the baseline and targets for the availability and utilization of
knowledge and mechanisms for knowledge transfer could be set higher. One of the experts thinks
the availability of knowledge is good, especially in comparison to other regions:
“I think there is a long tradition of regional cooperation in the BSR and authorities work together
well. It may not seem so, but compared to many other regions, they do. The maritime authorities
in the region are very competent in the maritime field and the maritime sectors are seen as
important. Even for those who don‟t have much focus on maritime issues, it is still prioritized.”
The expert interview does however indicate that there are differences throughout the region,
where in Denmark, Sweden and Finland are in the forefront, while in the eastern part of the BSR,
it is mainly coastal regions that are involved. The other expert interviewed also thinks that there
are institutions in the Baltic Sea Region that have good knowledge and competencies with
regards to maritime safety.
3.10.2 Dimension 2: Improved governance structures and organizational set-up
The current situation of the Baltic Sea Region regarding governance structures and
organizational set-up has been assessed with an average of 2,4 on a scale from 1 to 5. It is
described that in many cases good organizational structures are available. However, they are
often not used to its full potential. Knowledge exchange of rather takes place in ad-hoc meetings
than by using established structures. There is a need to improve networking and information
dissemination between institutions and regions.
As target for 2023 an average of 3,5 has been set on the scale from 1 to 5. The target situation
is described as having installed efficient methods and tools for networking and information
dissemination. Stakeholders know who to address for spreading information and where to find
what they are looking for.
According to the expert interviews conducted, the baseline and target set for the availability
and utilization of organizational structures is considered to be accurate. Due to more hierarchical
governance structures in the Baltic States, one interviewed expert thinks it could be easier to
establish change in these countries. The other expert interviewed think that progress has been
made during recent years, national agencies for maritime safety have been established and
amendments in governance structures have been made.
3.10.3 Dimension 3: More efficient use of human and technical resources
The current situation of the Baltic Sea Region regarding the efficient use of human and
technical resources has been assessed with an average of 2,5 on a scale from 1 to 5. It is
described that human and technical resources are all in all used in a sufficient way. However,
enhanced cooperation could improve this situation. Time- and resource-saving measures are only
occasionally applied.
As target for 2023 an average of 3,8 has been set on the scale from 1 to 5. The target situation
is described as having enhanced the competences of staff in effectively using the technical
resources available. In order to save time and resources, the use of e-Navigation has increased
remarkably.

Setting baselines and targets for the indicators 2014-2020 126
According to the expert interviews conducted, the baseline and target indicated in the survey is
considered accurate, even though one of the experts think that the indicated baseline could be
considered somewhat optimistic. The main reason for this is that there is a missing link between
policy and implementation. The respondent also adds that the use of technical resources is not
used that efficiently which is explained by a lack of competence. The target is however
considered to be realistic where the expert says:
“We do a lot of work in this field and I think we could make a leap.”
3.10.4 Dimension 4: Better ability to attract new financial resources
The current situation of the Baltic Sea Region regarding the ability to attract new financial
resources has been assessed with an average of 1,9 on a scale from 1 to 5. It is described that
attracting private financial resources is very difficult. Attracting public financial resources is easier
as maritime safety is a topic public authorities need to deal with.
As target for 2023 an average of 2,6 has been set on the scale from 1 to 5. The target situation
is described as making private stakeholders aware of the benefits of increased maritime safety
and thus facilitate the attraction of private financial resources. With regard to public financial
resources, the stakeholders will have to keep on underlining the importance of maritime safety in
order to further attract public financial resources.
According to one of the experts interviewed, the baseline and target indicated in the survey is
accurate, but it is important to note that there are notable differences different countries. The
expert interviewed also adds that the ability to attract external public financial resources is higher
than for external private financial resources, which is also indicated in the survey. The other
expert considers it somewhat difficult to determine the accuracy of the indicated baselines and
targets.
3.10.5 Dimension 5: Increased capability to work in transnational environment
The current situation of the Baltic Sea Region regarding the capability to work in transnational
environment has been assessed with an average of 2,9 on a scale from 1 to 5. It is described
that it is mainly public authorities, practitioners and researchers which work transnationally and
less private stakeholders. The main topics of transnational cooperation are thus in many cases
legislation, regulations and the like. Common projects including private companies are only
irregularly carried out.
As target for 2023 an average of 3,6 has been set on the scale from 1 to 5. The target situation
is described as enabling more people to work transnationally by offering support measures for
this matter. In order to involve private stakeholder in transnational cooperation, they are well
informed about potentials of collaboration with partners from other countries.
The baseline and target indicated in the survey results is considered to be plausible by the
interviewed experts. One of the experts interviewed says:
“I agree, we have quite a lot of institutions on an EU level, regional agreements and projects
where we are engaged with colleagues from other countries. We are working transnationally
already.”
As for the targets indicated in the survey result, one of the interviewed experts does however
wish that they would be higher and more ambitious. Also, there are differences between
countries when it comes to transnational cooperation, where Denmark and Germany could be
considered being most reluctant to cooperate, as they are focusing on other areas than the Baltic
Sea Region in the area of maritime safety and environmentally friendly shipping. The other

Setting baselines and targets for the indicators 2014-2020 127
expert interviewed thinks that the target is realistic which is due to an already high level of
transnational cooperation.
3.10.6 Concluding summary for specific objective 3.3 Maritime Safety
When analysing the baseline and targets set for the specific objective Maritime Safety, the result
suggest the prospects for improving until 2023 are good, as the targets set is notably higher than
the assessment of the current situation.
The survey results suggest that the biggest challenge is the ability to attract financial resources,
where the assessment of the current situation is significantly lower than for the other four
dimensions. For this dimension, the target just barely reaches the current baseline for the other
dimensions of institutional capacity building. This is supported by the result from one of the
interviews where the expert interviewed considers lack of resources in the Baltic countries to
constitute one of the main obstacles for building institutional capacity in the region.
The highest target indicated in the survey is for the third dimension: More efficient use of human
and technical resources.
The following figure illustrates the defined baseline and target for specific objective 3.3.
Figure 17: Baseline and target for specific objective 3.3
In the following, the baseline and target for the specific objective‟s result indicator is described in
short, qualitative terms as required for the Cooperation Programme. Beside a short statement
regarding the overall situation for the indicator, the dimension showing the greatest difference
between the estimation for the baseline and for the target is specifically referred to in the target.
(1) (3) (5)(2) (4)
Baseline=2,5 Target=3,4
No
capacityBasic
capacity
Medium
capacity
Good
capacity
Full
capacity

Setting baselines and targets for the indicators 2014-2020 128
Table 31: Baseline and target for the result indicator of specific objective 3.3 as presented in the Cooperation Programme
Result indicator Baseline (2014) Target (2023)
Capacity of maritime actors
(maritime admin., rescue
services, authorities, ship-ping
operators, ports, research and
inter-governmental org.) in
the Programme area to
implement measures to
increase maritime safety and
security
Basic to medium (2,5) Medium to good (3,4), focus
on more efficient use of
human and technical
resources
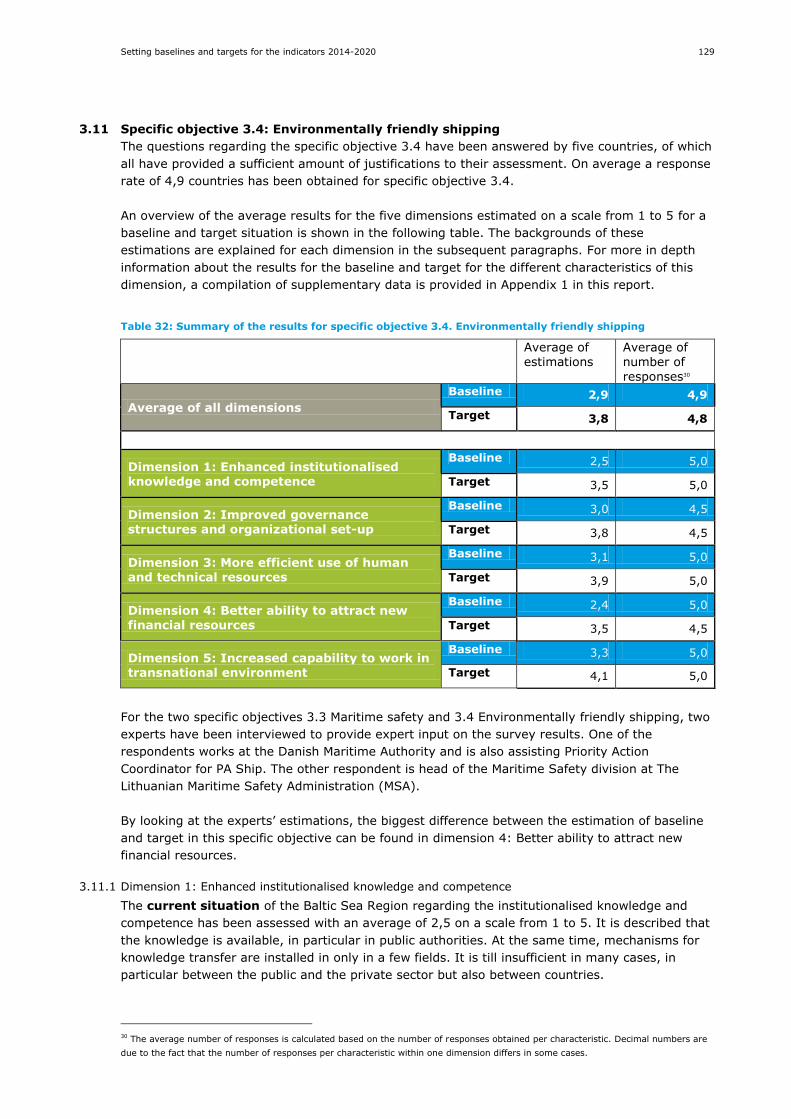
Setting baselines and targets for the indicators 2014-2020 129
3.11 Specific objective 3.4: Environmentally friendly shipping
The questions regarding the specific objective 3.4 have been answered by five countries, of which
all have provided a sufficient amount of justifications to their assessment. On average a response
rate of 4,9 countries has been obtained for specific objective 3.4.
An overview of the average results for the five dimensions estimated on a scale from 1 to 5 for a
baseline and target situation is shown in the following table. The backgrounds of these
estimations are explained for each dimension in the subsequent paragraphs. For more in depth
information about the results for the baseline and target for the different characteristics of this
dimension, a compilation of supplementary data is provided in Appendix 1 in this report.
Table 32: Summary of the results for specific objective 3.4. Environmentally friendly shipping
Average of
estimations
Average of
number of
responses30
Average of all dimensions
Baseline 2,9 4,9
Target 3,8 4,8
Dimension 1: Enhanced institutionalised knowledge and competence
Baseline 2,5 5,0
Target 3,5 5,0
Dimension 2: Improved governance structures and organizational set-up
Baseline 3,0 4,5
Target 3,8 4,5
Dimension 3: More efficient use of human and technical resources
Baseline 3,1 5,0
Target 3,9 5,0
Dimension 4: Better ability to attract new financial resources
Baseline 2,4 5,0
Target 3,5 4,5
Dimension 5: Increased capability to work in transnational environment
Baseline 3,3 5,0
Target 4,1 5,0
For the two specific objectives 3.3 Maritime safety and 3.4 Environmentally friendly shipping, two
experts have been interviewed to provide expert input on the survey results. One of the
respondents works at the Danish Maritime Authority and is also assisting Priority Action
Coordinator for PA Ship. The other respondent is head of the Maritime Safety division at The
Lithuanian Maritime Safety Administration (MSA).
By looking at the experts‟ estimations, the biggest difference between the estimation of baseline
and target in this specific objective can be found in dimension 4: Better ability to attract new
financial resources.
3.11.1 Dimension 1: Enhanced institutionalised knowledge and competence
The current situation of the Baltic Sea Region regarding the institutionalised knowledge and
competence has been assessed with an average of 2,5 on a scale from 1 to 5. It is described that
the knowledge is available, in particular in public authorities. At the same time, mechanisms for
knowledge transfer are installed in only in a few fields. It is till insufficient in many cases, in
particular between the public and the private sector but also between countries.
30 The average number of responses is calculated based on the number of responses obtained per characteristic. Decimal numbers are
due to the fact that the number of responses per characteristic within one dimension differs in some cases.

Setting baselines and targets for the indicators 2014-2020 130
As target for 2023 an average of 3,5 has been set on the scale from 1 to 5. The target situation
is described as making better use of the existing mechanisms and tools for knowledge transfer
and a better involvement of academia and private companies.
For the specific objectives maritime safety and environmentally friendly shipping, one of the
interviewed experts considers that the baseline and targets for the availability and utilization of
knowledge and mechanisms for knowledge transfer could be set higher.
3.11.2 Dimension 2: Improved governance structures and organizational set-up
The current situation of the Baltic Sea Region regarding governance structures and
organizational set-up has been assessed with an average of 3,0 on a scale from 1 to 5. It is
described that the organizational structures are available in general but they are not in all cases
used to their full potential. The coordination between institutions and countries shows room for
improvement.
As target for 2023 an average of 3,8 has been set on the scale from 1 to 5. The target situation
is described as having reached a higher level of coordination between institutions in order to
make better use of the organizational structures.
As also mentioned in the previous chapter, the baseline and target set for the availability and
utilization of organizational structures is considered to be accurate, according to the interview
results.
3.11.3 Dimension 3: More efficient use of human and technical resources
The current situation of the Baltic Sea Region regarding the efficient use of human and
technical resources has been assessed with an average of 3,1 on a scale from 1 to 5. It is
described that the use of human and technical resources is all in all satisfactory as platforms and
business networks exist. Technical developments are strong in this field; the same applies for
time- and resource-saving measures.
As target for 2023 an average of 3,9 has been set on the scale from 1 to 5. The target situation
is described as having improved the use of human and technical resources by creating more
formal structures such as clusters. Also, enhanced use of IT solutions has helped to save time-
and resources.
As also mentioned in section 3.10.3, the result from the interviews indicates that the baseline
and targets for dimension 3 is accurate, although one of the expert consider the indicated
baseline somewhat optimistic.
3.11.4 Dimension 4: Better ability to attract new financial resources
The current situation of the Baltic Sea Region regarding the ability to attract new financial
resources has been assessed with an average of 2,4 on a scale from 1 to 5. It is described that
the ability to attract external financial resources is on a basic level. This applies to both public
and private financial resources.
As target for 2023 an average of 3,5 has been set on the scale from 1 to 5. The target situation
is described as having increased the awareness of available external financial resources and also
the knowledge on how to access these. Additionally, more public private partnerships have been
initiated in order to attract external financial resources.
As mentioned in section 3.10.4, the interview result suggests that the baseline and target
indicated in the survey is accurate, but it is important to note that there are notable differences
different countries.

Setting baselines and targets for the indicators 2014-2020 131
3.11.5 Dimension 5: Increased capability to work in transnational environment
The current situation of the Baltic Sea Region regarding the capability to work in transnational
environment has been assessed with an average of 3,3 on a scale from 1 to 5. It is described
that the capability to work transnationally is all in all good due to the international character of
the shipping business in general.
As target for 2023 an average of 4,1 has been set on the scale from 1 to 5. The target situation
is described as having enhanced the geographic mobility and having increased international
collaboration between companies.
As mentioned previously in section 3.10.5, the baseline and target indicated in the survey results
is considered to be plausible by the interviewed experts, even though one of the respondent
wish for the target to be higher.
3.11.6 Concluding summary for specific objective 3.4 Environmentally friendly shipping
When analysing the survey result for the specific objective environmentally friendly shipping, the
current situation could be considered being at a medium level regarding the governance
structures and organizational set-up, the use of human and technical resources as well as for the
capability to work in a transnational environment.
Today, it seems that the biggest challenge is to enhance the institutional knowledge and
competences as well as having the ability to attract new financial resources, as these dimensions
have the lowest indicated baseline. It seems however that the prospects for improving the
situation in these areas are good, as the target set for these dimension are set high in relation to
the current situation, compared to the other dimensions of institutional capacity. The results from
the two interviews conducted do also suggest that both baseline and targets could be set higher
for this dimension.
Regardless of the comparably high baseline indicated for this dimension, the highest target is set
for the capability to work in transnational environment, indicating high ambitions for this
dimension of institutional capacity. The results from the two interviews suggest that a high
ambition is realistic for this dimension.
The following figure illustrates the defined baseline and target for specific objective 3.4.
Figure 18: Baseline and target for specific objective 3.4
In the following, the baseline and target for the specific objective‟s result indicator is described in
short, qualitative terms as required for the Cooperation Programme. Beside a short statement
regarding the overall situation for the indicator, the dimension showing the greatest difference
between the estimation for the baseline and for the target is specifically referred to in the target.
(1) (3) (5)(2) (4)
Baseline=2,9 Target=3,7
No
capacityBasic
capacity
Medium
capacity
Good
capacity
Full
capacity

Setting baselines and targets for the indicators 2014-2020 132
Table 33: Baseline and target for the result indicator of specific objective 3.4 as presented in the Cooperation Programme
Result indicator Baseline (2014) Target (2023)
Capacity of maritime actors
(maritime admin., rescue
services, authorities, shipping
operators, ports, research and
intergovernmental org.) in the
Programme area to implement
measures to reduce negative
effects of shipping on the
marine environment
Slightly below medium (2,9) Medium to good (3,7), focus
on better ability to attract new
financial resources
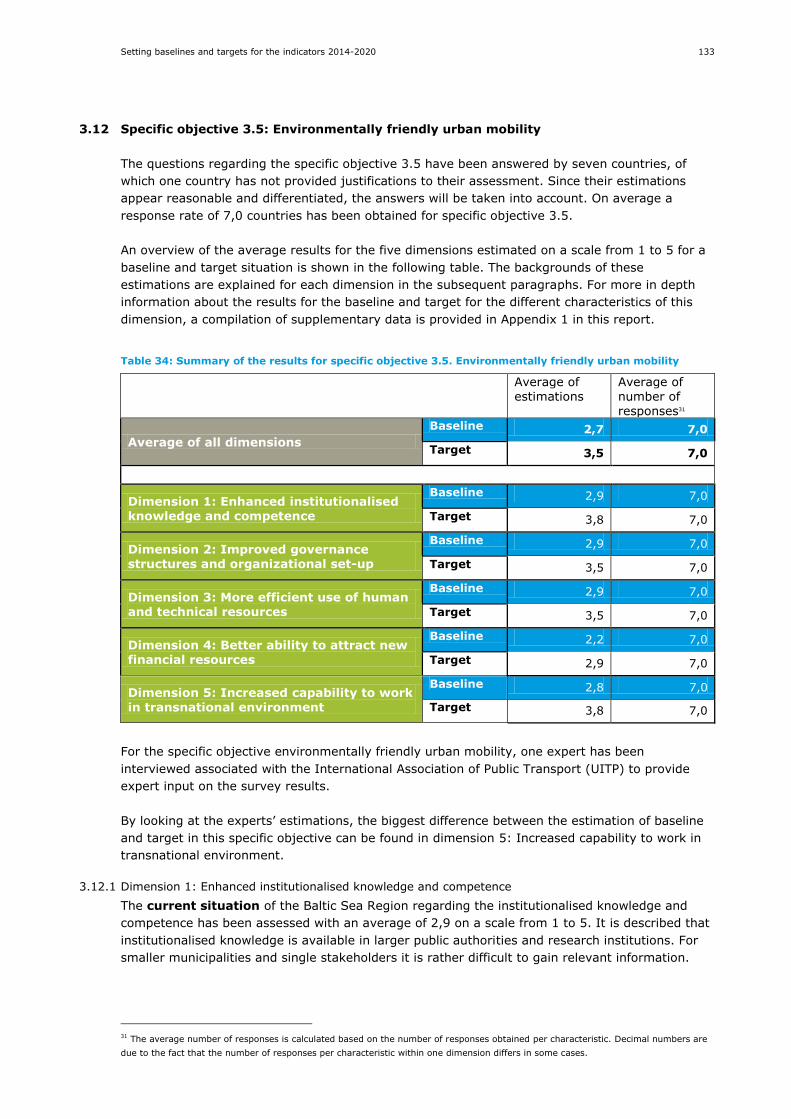
Setting baselines and targets for the indicators 2014-2020 133
3.12 Specific objective 3.5: Environmentally friendly urban mobility
The questions regarding the specific objective 3.5 have been answered by seven countries, of
which one country has not provided justifications to their assessment. Since their estimations
appear reasonable and differentiated, the answers will be taken into account. On average a
response rate of 7,0 countries has been obtained for specific objective 3.5.
An overview of the average results for the five dimensions estimated on a scale from 1 to 5 for a
baseline and target situation is shown in the following table. The backgrounds of these
estimations are explained for each dimension in the subsequent paragraphs. For more in depth
information about the results for the baseline and target for the different characteristics of this
dimension, a compilation of supplementary data is provided in Appendix 1 in this report.
Table 34: Summary of the results for specific objective 3.5. Environmentally friendly urban mobility
Average of estimations
Average of number of responses31
Average of all dimensions
Baseline 2,7 7,0
Target 3,5 7,0
Dimension 1: Enhanced institutionalised knowledge and competence
Baseline 2,9 7,0
Target 3,8 7,0
Dimension 2: Improved governance structures and organizational set-up
Baseline 2,9 7,0
Target 3,5 7,0
Dimension 3: More efficient use of human and technical resources
Baseline 2,9 7,0
Target 3,5 7,0
Dimension 4: Better ability to attract new financial resources
Baseline 2,2 7,0
Target 2,9 7,0
Dimension 5: Increased capability to work in transnational environment
Baseline 2,8 7,0
Target 3,8 7,0
For the specific objective environmentally friendly urban mobility, one expert has been
interviewed associated with the International Association of Public Transport (UITP) to provide
expert input on the survey results.
By looking at the experts‟ estimations, the biggest difference between the estimation of baseline
and target in this specific objective can be found in dimension 5: Increased capability to work in
transnational environment.
3.12.1 Dimension 1: Enhanced institutionalised knowledge and competence
The current situation of the Baltic Sea Region regarding the institutionalised knowledge and
competence has been assessed with an average of 2,9 on a scale from 1 to 5. It is described that
institutionalised knowledge is available in larger public authorities and research institutions. For
smaller municipalities and single stakeholders it is rather difficult to gain relevant information.
31 The average number of responses is calculated based on the number of responses obtained per characteristic. Decimal numbers are
due to the fact that the number of responses per characteristic within one dimension differs in some cases.

Setting baselines and targets for the indicators 2014-2020 134
As target for 2023 an average of 3,8 has been set on the scale from 1 to 5. The target situation
is described as having installed (online-) tools for making knowledge available also for
stakeholders not directly being involved in national and international networks.
The results from the interview suggest that the baseline indicated in the survey results is
accurate. According to the expert interview, there is still a lot to be done in the Baltic States,
while the situation in the Scandinavian countries is somewhat different. In the Baltic States
however, the competence in are increasing. The target set for the availability and utilization of
knowledge as well as mechanisms for knowledge transfer in the survey is also considered to be
plausible.
3.12.2 Dimension 2: Improved governance structures and organizational set-up
The current situation of the Baltic Sea Region regarding governance structures and
organizational set-up has been assessed with an average of 2,9 on a scale from 1 to 5. It is
described that organizational structures exist in many cases. This applies in particular to bigger
cities and larger institutions. The connection between sectors is not in all cases sufficient.
As target for 2023 an average of 3,5 has been set on the scale from 1 to 5. The target situation
is described as having installed more flexible structures which can also be used for cross-sector
initiatives and projects
For the second dimension of institutional capacity, both the survey and the interview indicate
that the availability and utilization of organizational structures are at a medium level. This is
especially true in the area of transport mobility. Result from the expert interview conducted also
indicates that the target set in the survey is a realistic one.
3.12.3 Dimension 3: More efficient use of human and technical resources
The current situation of the Baltic Sea Region regarding the efficient use of human and
technical resources has been assessed with an average of 2,9 on a scale from 1 to 5. There is a
need for an increased use of time- and resource saving measures as the requirements for
reporting, monitoring etc. have remarkably increased in recent years.
As target for 2023 an average of 3,5 has been set on the scale from 1 to 5. The target situation
is described as having improved the use of resources by intensified cooperation and new
technical developments with regard to saving time and resources.
As for the use of human and technical resources, result from the interview indicates that the
survey provides an accurate assessment of the current situation. It is however worth noting that
the situation differs across the Baltic Sea Region, where smaller organizations are facing some
struggles. The target indicated in the survey is also considered to be a credible target for 2023.
3.12.4 Dimension 4: Better ability to attract new financial resources
The current situation of the Baltic Sea Region regarding the ability to attract new financial
resources has been assessed with an average of 2,2 on a scale from 1 to 5. It is described that
the ability to attract external financial resources is rather basic. This applies in particular to
external private resources.
As target for 2023 an average of 2,9 has been set on the scale from 1 to 5. The target situation
is described as having more opportunities to attract external financial resources. This is enabled
by a more stable economic situation and the increased attention on green and eco-friendly
mobility.
For the ability to attract external financial resources, the expert interviewed does not consider
the baseline indicated in the survey to provide an accurate assessment of the current situation.

Setting baselines and targets for the indicators 2014-2020 135
Rather, the ability to attract financial resources has greatly improved in countries such as Poland
and Latvia, which is due to improvements in their project management skills. Therefore, the
interviewed expert considers that the baseline for ability to attract external private financial
resources and external public financial resources should be higher. The expert does however
acknowledge funding to be an obstacle:
“I would say the financial aspect [is the main challenge]. Even though the national government is
funding it‟s still not enough.”
As for the target for 2023, the expert considers that the situation at large will be the same as
today.
3.12.5 Dimension 5: Increased capability to work in transnational environment
The current situation of the Baltic Sea Region regarding the capability to work in transnational
environment has been assessed with an average of 2,8 on a scale from 1 to 5. It is described
that the capability to work transnationally is in many cases limited due to lack of knowledge and
resources to cooperate with stakeholders from another countries. This applies in particular to
smaller municipalities.
As target for 2023 an average of 3,8 has been set on the scale from 1 to 5. The target situation
is described as having gained more experience in transnational cooperation by working in joint
projects. Also, the younger generation of stakeholders is more aware of the opportunities
international collaboration offers and will thus make better use of it.
According to the interview, the indicated baseline in the survey could be set slightly higher, but
the interviewed expert also acknowledges that the situation varies in different cities, where the
available competences to work transnationally, the frequency of transnational contacts and
intensity of transnational collaboration is higher in capital cities. The targets indicated for the
different characteristics of the fifth dimension are considered to be realistic to reach until 2023.
3.12.6 Concluding summary for specific objective 3.5 Environmentally friendly urban mobility
When analysing the survey results, the main challenge for sustaining an environmentally friendly
urban mobility seems to be the ability to attract new financial resources. The prospects for
improving the situation until 2023 is also low, as the survey results indicate that it will not be
possible to reach more than a medium level.
For the other dimensions of institutional capacity, the baseline is fairly similar, ranging from 2,8
and 2,9 on a scale from 1 to 5. Looking at the targets set for 2023, the survey result indicate
that the biggest potential lie in enhancing institutionalized knowledge and competence as well as
increasing the capability to work in a transnational environment, as the targets for these two
dimension are the highest.
The following figure illustrates the defined baseline and target for specific objective 3.5.

Setting baselines and targets for the indicators 2014-2020 136
Figure 19: Baseline and target for specific objective 3.5
In the following, the baseline and target for the specific objective‟s result indicator is described in
short, qualitative terms as required for the Cooperation Programme. Beside a short statement
regarding the overall situation for the indicator, the dimension showing the greatest difference
between the estimation for the baseline and the target is specifically referred to in the target.
Table 35: Baseline and target for the result indicator of specific objective 3.5 as presented in the Cooperation Programme
Result indicator Baseline (2014) Target (2023)
Capacity of urban transport
actors (public authorities,
ports, infrastructure providers
and operators) in the
Programme area to implement
environmentally friendly
transport solutions in urban
areas
Basic to medium (2,7) Medium to good (3,5), focus
on increased capability to
work in transnational
environment
(1) (3) (5)(2) (4)
Baseline=2,7 Target=3,5
No
capacityBasic
capacity
Medium
capacity
Good
capacity
Full
capacity

Setting baselines and targets for the indicators 2014-2020 137
APPENDIX 1 SUPPLEMENTARY DATA FROM SURVEY
Specific objective 1.1: Research and innovation infrastructure
Table 36: Research and innovation infrastructure - Enhanced institutionalised knowledge and competence
Dimension 1: Enhanced institutionalised knowledge and competence
Characteristic 1: Availability of
knowledge
Characteristic 2: Availability of
mechanisms for knowledge transfer
Characteristic 3: Utilization of knowledge
Baseline Target Baseline Target Baseline Target
Estimation on scale
Estimation on scale
Estimation on scale
Estimation on scale
Estimation on scale
Estimation on scale
Average 2,67 3,68 2,91 3,73 2,77 3,33
Deviation32 1,56 1,65 2,15 0,76 4,76 2,89
Number of responses
5,00 5,00 5,00 5,00 5,00 5,00
Table 37: Research and innovation infrastructure - Improved governance structures and organizational set-up
Dimension 2: Improved governance structures and organizational set-up
Characteristic 1: Availability of organizational structures
Characteristic 2: Utilization of organizational structures
Baseline Target Baseline Target
Estimation on scale
Estimation on scale
Estimation on scale
Estimation on scale
Average 2,50 3,37 2,38 3,33
Deviation 4,00 1,02 4,69 0,67
Number of responses
5,00 5,00 4,00 4,00
Table 38: Research and innovation infrastructure - More efficient use of human and technical resources
Dimension 3: More efficient use of human and technical resources
Characteristic 1:
Utilization of human resources
Characteristic 2:
Utilization of technical resources
Characteristic 3:
Application of time- and/ or resource-saving
measures
Baseline Target Baseline Target Baseline Target
Estimation on scale
Estimation on scale
Estimation on scale
Estimation on scale
Estimation on scale
Estimation on scale
Average 2,83 3,83 2,67 3,58 2,38 3,58
Deviation 2,33 0,33 2,67 0,75 0,69 0,75
Number of responses
4,00 4,00 4,00 4,00 4,00 4,00
32 The deviation reflects the dispersion of the answers received for each characteristic. The average of deviations is
determined by calculating the average value of all standard deviations within the answers regarding a characteristic.

Setting baselines and targets for the indicators 2014-2020 138
Table 39: Research and innovation infrastructure - Better ability to attract new financial resources
Dimension 4: Better ability to attract new financial resources
Characteristic 1: Ability to attract external private financial resources
Characteristic 2: Ability to attract external public financial resources
Baseline Target Baseline Target
Estimation on scale
Estimation on scale
Estimation on scale
Estimation on scale
Average 2,17 3,10 2,83 3,73
Deviation 2,56 2,20 2,89 0,76
Number of responses
5,00 5,00 5,00 5,00
Table 40: Research and innovation infrastructure - Increased capability to work in transnational environment
Dimension 5: Increased capability to work in transnational environment
Characteristic 1: Available competences to work transnationally
Characteristic 2: Frequency of
transnational contacts
Characteristic 3: Intensity of
transnational collaboration
Baseline Target Baseline Target Baseline Target
Estimation
on scale
Estimation
on scale
Estimation
on scale
Estimation
on scale
Estimation
on scale
Estimation
on scale
Average 3,57 4,37 3,03 4,00 2,54 3,37
Deviation 1,39 1,33 2,02 - 1,04 1,04
Number of responses
5,00 5,00 5,00 5,00 5,00 5,00
Specific objective 1.2: Smart specialisation
Table 41: Smart specialisation - Enhanced institutionalised knowledge and competence
Dimension 1: Enhanced institutionalised knowledge and competence
Characteristic 1: Availability of
knowledge
Characteristic 2: Availability of
mechanisms for knowledge transfer
Characteristic 3: Utilization of knowledge
Baseline Target Baseline Target Baseline Target
Estimation on scale
Estimation on scale
Estimation on scale
Estimation on scale
Estimation on scale
Estimation on scale
Average 2,83 4,00 3,00 4,00 2,50 4,00
Deviation 4,83 6,00 4,00 4,00 3,50 2,00
Number of responses
6,00 6,00 6,00 6,00 6,00 6,00
Table 42: Smart specialisation - Improved governance structures and organizational set-up
Dimension 2: Improved governance structures and organizational set-up

Setting baselines and targets for the indicators 2014-2020 139
Characteristic 1: Availability of organizational structures
Characteristic 2: Utilization of organizational structures
Baseline Target Baseline Target
Estimation on
scale
Estimation on
scale
Estimation on
scale
Estimation on
scale
Average 3,17 3,67 3,17 3,83
Deviation 6,83 5,33 6,83 2,83
Number of responses
6,00 6,00 6,00 6,00
Table 43: Smart specialisation - More efficient use of human and technical resources
Dimension 3: More efficient use of human and technical resources
Characteristic 1: Utilization of human
resources
Characteristic 2: Utilization of technical
resources
Characteristic 3: Application of time-
and/ or resource-saving measures
Baseline Target Baseline Target Baseline Target
Estimation on scale
Estimation on scale
Estimation on scale
Estimation on scale
Estimation on scale
Estimation on scale
Average 3,17 3,83 2,83 4,00 2,67 3,83
Deviation 2,83 2,83 2,83 2,00 5,33 4,83
Number of responses
6,00 6,00 6,00 6,00 6,00 6,00
Table 44: Smart specialisation - Better ability to attract new financial resources
Dimension 4: Better ability to attract new financial resources
Characteristic 1: Ability to attract external private financial resources
Characteristic 2: Ability to attract external public financial resources
Baseline Target Baseline Target
Estimation on scale
Estimation on scale
Estimation on scale
Estimation on scale
Average 2,17 3,00 3,17 4,17
Deviation 2,83 4,00 0,83 0,83
Number of responses
6,00 6,00 6,00 6,00
Table 45: Smart specialisation - Increased capability to work in transnational environment
Dimension 5: Increased capability to work in transnational environment
Characteristic 1: Available competences to work transnationally
Characteristic 2: Frequency of
transnational contacts
Characteristic 3: Intensity of
transnational collaboration
Baseline Target Baseline Target Baseline Target
Estimation on scale
Estimation on scale
Estimation on scale
Estimation on scale
Estimation on scale
Estimation on scale

Setting baselines and targets for the indicators 2014-2020 140
Average 3,33 4,33 2,67 3,67 2,50 3,67
Deviation 1,33 1,33 3,33 1,33 1,50 1,33
Number of responses
6,00 6,00 6,00 6,00 6,00 6,00
Specific objective 1.3: Non-technological innovation
Table 46: Non-technological innovation - Enhanced institutionalised knowledge and competence
Dimension 1: Enhanced institutionalised knowledge and competence
Characteristic 1: Availability of
knowledge
Characteristic 2: Availability of
mechanisms for knowledge transfer
Characteristic 3: Utilization of knowledge
Baseline Target Baseline Target Baseline Target
Estimation on scale
Estimation on scale
Estimation on scale
Estimation on scale
Estimation on scale
Estimation on scale
Average 3,33 4,40 2,57 3,67 2,86 3,67
Deviation 1,33 1,20 1,71 1,33 6,86 3,33
Number of responses
6,00 5,00 7,00 6,00 7,00 6,00
Table 47: Non-technological innovation - Improved governance structures and organizational set-up
Dimension 2: Improved governance structures and organizational set-up
Characteristic 1: Availability of organizational structures
Characteristic 2: Utilization of organizational structures
Baseline Target Baseline Target
Estimation on scale
Estimation on scale
Estimation on scale
Estimation on scale
Average 3,50 3,83 2,50 3,33
Deviation 3,50 2,83 3,50 1,33
Number of responses
6,00 6,00 6,00 6,00
Table 48: Non-technological innovation - More efficient use of human and technical resources
Dimension 3: More efficient use of human and technical resources
Characteristic 1: Utilization of human
resources
Characteristic 2: Utilization of technical
resources
Characteristic 3: Application of time-
and/ or resource-saving measures
Baseline Target Baseline Target Baseline Target
Estimation
on scale
Estimation
on scale
Estimation
on scale
Estimation
on scale
Estimation
on scale
Estimation
on scale
Average 2,33 3,33 2,67 3,33 2,50 3,33
Deviation 7,33 1,33 5,33 1,33 1,50 1,33
Number of responses
6,00 6,00 6,00 6,00 6,00 6,00

Setting baselines and targets for the indicators 2014-2020 141
Table 49: Non-technological innovation - Better ability to attract new financial resources
Dimension 4: Better ability to attract new financial resources
Characteristic 1: Ability to attract
external private financial resources
Characteristic 2: Ability to attract
external public financial resources
Baseline Target Baseline Target
Estimation on scale
Estimation on scale
Estimation on scale
Estimation on scale
Average 2,83 3,50 3,17 3,67
Deviation 0,83 1,50 2,83 1,33
Number of responses
6,00 6,00 6,00 6,00
Table 50: Non-technological innovation - Increased capability to work in transnational environment
Dimension 5: Increased capability to work in transnational environment
Characteristic 1:
Available competences to work transnationally
Characteristic 2:
Frequency of transnational contacts
Characteristic 3:
Intensity of transnational collaboration
Baseline Target Baseline Target Baseline Target
Estimation on scale
Estimation on scale
Estimation on scale
Estimation on scale
Estimation on scale
Estimation on scale
Average 2,86 3,86 3,14 4,00 2,71 3,86
Deviation 2,86 2,86 4,86 4,00 3,43 0,86
Number of responses
7,00 7,00 7,00 7,00 7,00 7,00
Specific objective 2.1: Maritime safety
Table 51: Clear waters - Enhanced institutionalised knowledge and competence
Dimension 1: Enhanced institutionalised knowledge and competence
Characteristic 1: Availability of
knowledge
Characteristic 2:
Availability of mechanisms for
knowledge transfer
Characteristic 3: Utilization of knowledge
Baseline Target Baseline Target Baseline Target
Estimation on scale
Estimation on scale
Estimation on scale
Estimation on scale
Estimation on scale
Estimation on scale
Average 3,38 3,88 2,88 3,50 2,88 3,88
Deviation 3,88 2,88 8,88 2,00 6,88 4,88
Number of responses
8,00 8,00 8,00 8,00 8,00 8,00
Table 52: Clear waters - Improved governance structures and organizational set-up
Dimension 2: Improved governance structures and organizational set-up
Characteristic 1: Availability of
organizational structures
Characteristic 2: Utilization of
organizational structures
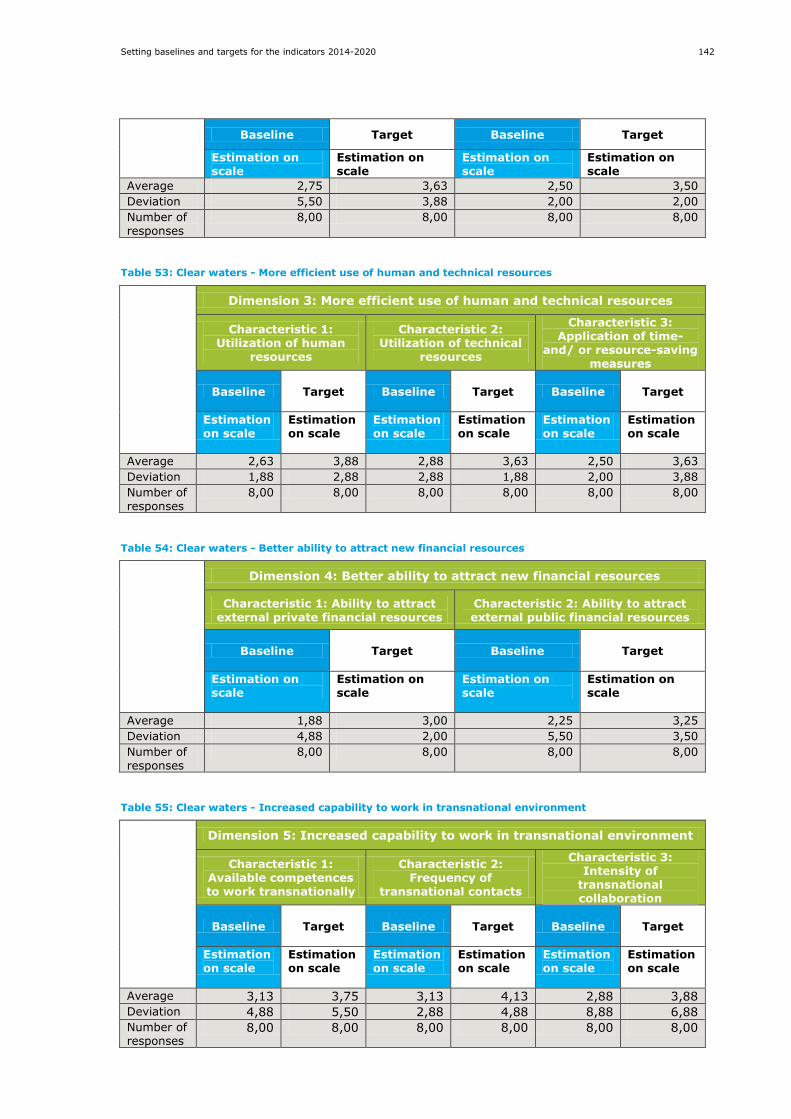
Setting baselines and targets for the indicators 2014-2020 142
Baseline Target Baseline Target
Estimation on scale
Estimation on scale
Estimation on scale
Estimation on scale
Average 2,75 3,63 2,50 3,50
Deviation 5,50 3,88 2,00 2,00
Number of responses
8,00 8,00 8,00 8,00
Table 53: Clear waters - More efficient use of human and technical resources
Dimension 3: More efficient use of human and technical resources
Characteristic 1: Utilization of human
resources
Characteristic 2: Utilization of technical
resources
Characteristic 3: Application of time-
and/ or resource-saving measures
Baseline Target Baseline Target Baseline Target
Estimation on scale
Estimation on scale
Estimation on scale
Estimation on scale
Estimation on scale
Estimation on scale
Average 2,63 3,88 2,88 3,63 2,50 3,63
Deviation 1,88 2,88 2,88 1,88 2,00 3,88
Number of responses
8,00 8,00 8,00 8,00 8,00 8,00
Table 54: Clear waters - Better ability to attract new financial resources
Dimension 4: Better ability to attract new financial resources
Characteristic 1: Ability to attract external private financial resources
Characteristic 2: Ability to attract external public financial resources
Baseline Target Baseline Target
Estimation on scale
Estimation on scale
Estimation on scale
Estimation on scale
Average 1,88 3,00 2,25 3,25
Deviation 4,88 2,00 5,50 3,50
Number of responses
8,00 8,00 8,00 8,00
Table 55: Clear waters - Increased capability to work in transnational environment
Dimension 5: Increased capability to work in transnational environment
Characteristic 1: Available competences to work transnationally
Characteristic 2: Frequency of
transnational contacts
Characteristic 3: Intensity of
transnational collaboration
Baseline Target Baseline Target Baseline Target
Estimation on scale
Estimation on scale
Estimation on scale
Estimation on scale
Estimation on scale
Estimation on scale
Average 3,13 3,75 3,13 4,13 2,88 3,88
Deviation 4,88 5,50 2,88 4,88 8,88 6,88
Number of responses
8,00 8,00 8,00 8,00 8,00 8,00

Setting baselines and targets for the indicators 2014-2020 143
Specific objective 2.2: Renewable energy
Table 56: Renewable energy - Enhanced institutionalised knowledge and competence
Dimension 1: Enhanced institutionalised knowledge and competence
Characteristic 1: Availability of
knowledge
Characteristic 2: Availability of
mechanisms for knowledge transfer
Characteristic 3: Utilization of knowledge
Baseline Target Baseline Target Baseline Target
Estimation on scale
Estimation on scale
Estimation on scale
Estimation on scale
Estimation on scale
Estimation on scale
Average 2,83 3,67 2,67 3,83 2,33 3,50
Deviation 6,83 3,33 5,33 6,83 1,33 5,50
Number of responses
6,00 6,00 6,00 6,00 6,00 6,00
Table 57: Renewable energy - Improved governance structures and organizational set-up
Dimension 2: Improved governance structures and organizational set-up
Characteristic 1: Availability of organizational structures
Characteristic 2: Utilization of organizational structures
Baseline Target Baseline Target
Estimation on scale
Estimation on scale
Estimation on scale
Estimation on scale
Average 2,00 3,33 2,33 3,17
Deviation - 1,33 1,33 0,83
Number of responses
6,00 6,00 6,00 6,00
Table 58: Renewable energy - More efficient use of human and technical resources
Dimension 3: More efficient use of human and technical resources
Characteristic 1: Utilization of human
resources
Characteristic 2: Utilization of technical
resources
Characteristic 3: Application of time-
and/ or resource-saving measures
Baseline Target Baseline Target Baseline Target
Estimation on scale
Estimation on scale
Estimation on scale
Estimation on scale
Estimation on scale
Estimation on scale
Average 2,67 3,50 2,33 3,50 2,33 3,50
Deviation 5,33 3,50 3,33 1,50 1,33 5,50
Number of responses
6,00 6,00 6,00 6,00 6,00 6,00
Table 59: Renewable energy - Better ability to attract new financial resources
Dimension 4: Better ability to attract new financial resources
Characteristic 1: Ability to attract external private financial resources
Characteristic 2: Ability to attract external public financial resources

Setting baselines and targets for the indicators 2014-2020 144
Baseline Target Baseline Target
Estimation on scale
Estimation on scale
Estimation on scale
Estimation on scale
Average 2,00 3,00 2,67 3,33
Deviation 2,00 2,00 7,33 1,33
Number of responses
6,00 6,00 6,00 6,00
Table 60: Renewable energy - Increased capability to work in transnational environment
Dimension 5: Increased capability to work in transnational environment
Characteristic 1: Available competences to work transnationally
Characteristic 2: Frequency of
transnational contacts
Characteristic 3: Intensity of
transnational collaboration
Baseline Target Baseline Target Baseline Target
Estimation on scale
Estimation on scale
Estimation on scale
Estimation on scale
Estimation on scale
Estimation on scale
Average 2,83 4,00 2,83 3,83 2,33 3,67
Deviation 6,83 4,00 8,83 4,83 3,33 3,33
Number of responses
6,00 6,00 6,00 6,00 6,00 6,00
Specific objective 2.3: Energy efficiency
Table 61: Energy efficiency - Enhanced institutionalised knowledge and competence
Dimension 1: Enhanced institutionalised knowledge and competence
Characteristic 1: Availability of
knowledge
Characteristic 2: Availability of
mechanisms for knowledge transfer
Characteristic 3: Utilization of knowledge
Baseline Target Baseline Target Baseline Target
Estimation on scale
Estimation on scale
Estimation on scale
Estimation on scale
Estimation on scale
Estimation on scale
Average 3,80 3,60 2,80 3,20 2,40 3,00
Deviation 4,80 9,20 2,80 2,80 1,20 2,00
Number of responses
5,00 5,00 5,00 5,00 5,00 5,00
Table 62: Energy efficiency - Improved governance structures and organizational set-up
Dimension 2: Improved governance structures and
organizational set-up
Characteristic 1: Availability of organizational structures
Characteristic 2: Utilization of organizational structures
Baseline Target Baseline Target
Estimation on scale
Estimation on scale
Estimation on scale
Estimation on scale
Average 3,00 3,75 2,50 3,50
Deviation 4,00 2,75 3,00 5,00

Setting baselines and targets for the indicators 2014-2020 145
Number of responses
5,00 4,00 4,00 4,00
Table 63: Energy efficiency - More efficient use of human and technical resources
Dimension 3: More efficient use of human and technical resources
Characteristic 1: Utilization of human
resources
Characteristic 2: Utilization of technical
resources
Characteristic 3: Application of time-
and/ or resource-saving
measures
Baseline Target Baseline Target Baseline Target
Estimation on scale
Estimation on scale
Estimation on scale
Estimation on scale
Estimation on scale
Estimation on scale
Average 2,50 3,25 2,33 3,33 2,50 3,33
Deviation 3,00 0,75 0,67 0,67 1,00 0,67
Number of
responses
4,00 4,00 3,00 3,00 4,00 3,00
Table 64: Energy efficiency - Better ability to attract new financial resources
Dimension 4: Better ability to attract new financial resources
Characteristic 1: Ability to attract
external private financial resources
Characteristic 2: Ability to attract
external public financial resources
Baseline Target Baseline Target
Estimation on scale
Estimation on scale
Estimation on scale
Estimation on scale
Average 2,25 3,67 2,25 3,67
Deviation 4,75 2,67 4,75 0,67
Number of responses
4,00 3,00 4,00 3,00
Table 65: Energy efficiency - Increased capability to work in transnational environment
Dimension 5: Increased capability to work in transnational environment
Characteristic 1: Available competences to work transnationally
Characteristic 2: Frequency of
transnational contacts
Characteristic 3:
Intensity of transnational collaboration
Baseline Target Baseline Target Baseline Target
Estimation on scale
Estimation on scale
Estimation on scale
Estimation on scale
Estimation on scale
Estimation on scale
Average 2,75 3,75 3,00 3,25 2,25 3,25
Deviation 2,75 2,75 - 2,75 0,75 0,75
Number of responses
4,00 4,00 4,00 4,00 4,00 4,00
Specific objective 2.4: Resource-efficient blue growth

Setting baselines and targets for the indicators 2014-2020 146
Table 66: Resource-efficient blue growth - Enhanced institutionalised knowledge and competence
Dimension 1: Enhanced institutionalised knowledge and competence
Characteristic 1: Availability of
knowledge
Characteristic 2: Availability of
mechanisms for knowledge transfer
Characteristic 3: Utilization of knowledge
Baseline Target Baseline Target Baseline Target
Estimation on scale
Estimation on scale
Estimation on scale
Estimation on scale
Estimation on scale
Estimation on scale
Average 2,86 3,71 3,00 3,86 2,86 3,71
Deviation 4,86 5,43 10,00 6,86 6,86 3,43
Number of responses
7,00 7,00 7,00 7,00 7,00 7,00
Table 67: Resource-efficient blue growth - Improved governance structures and organizational set-up
Dimension 2: Improved governance structures and organizational set-up
Characteristic 1: Availability of organizational structures
Characteristic 2: Utilization of organizational structures
Baseline Target Baseline Target
Estimation on scale
Estimation on scale
Estimation on scale
Estimation on scale
Average 2,71 3,71 2,86 3,71
Deviation 3,43 5,43 2,86 3,43
Number of responses
7,00 7,00 7,00 7,00
Table 68: Resource-efficient blue growth - More efficient use of human and technical resources
Dimension 3: More efficient use of human and technical resources
Characteristic 1: Utilization of human
resources
Characteristic 2: Utilization of technical
resources
Characteristic 3: Application of time-
and/ or resource-saving measures
Baseline Target Baseline Target Baseline Target
Estimation on scale
Estimation on scale
Estimation on scale
Estimation on scale
Estimation on scale
Estimation on scale
Average 2,86 3,71 2,50 3,50 2,29 3,29
Deviation 2,86 3,43 3,50 1,50 3,43 1,43
Number of responses
7,00 7,00 6,00 6,00 7,00 7,00
Table 69: Resource-efficient blue growth - Better ability to attract new financial resources
Dimension 4: Better ability to attract new financial resources
Characteristic 1: Ability to attract external private financial resources
Characteristic 2: Ability to attract external public financial resources
Baseline Target Baseline Target
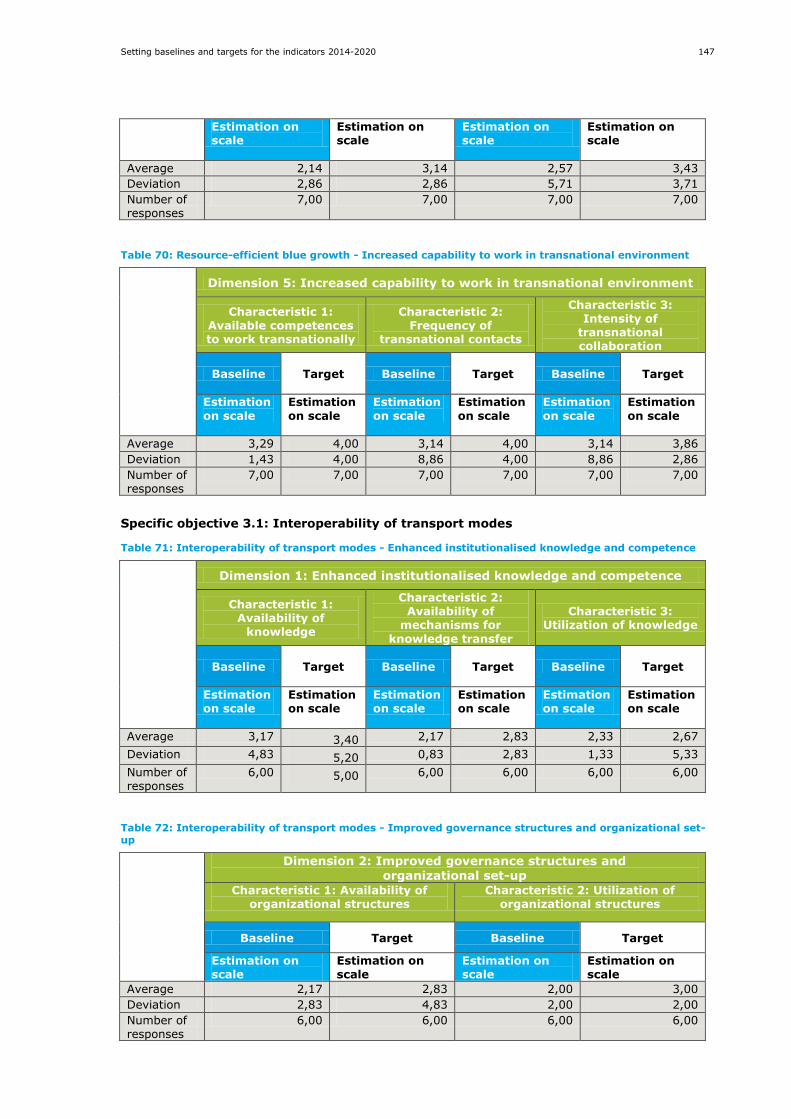
Setting baselines and targets for the indicators 2014-2020 147
Estimation on scale
Estimation on scale
Estimation on scale
Estimation on scale
Average 2,14 3,14 2,57 3,43
Deviation 2,86 2,86 5,71 3,71
Number of responses
7,00 7,00 7,00 7,00
Table 70: Resource-efficient blue growth - Increased capability to work in transnational environment
Dimension 5: Increased capability to work in transnational environment
Characteristic 1: Available competences to work transnationally
Characteristic 2: Frequency of
transnational contacts
Characteristic 3: Intensity of
transnational collaboration
Baseline Target Baseline Target Baseline Target
Estimation
on scale
Estimation
on scale
Estimation
on scale
Estimation
on scale
Estimation
on scale
Estimation
on scale
Average 3,29 4,00 3,14 4,00 3,14 3,86
Deviation 1,43 4,00 8,86 4,00 8,86 2,86
Number of responses
7,00 7,00 7,00 7,00 7,00 7,00
Specific objective 3.1: Interoperability of transport modes
Table 71: Interoperability of transport modes - Enhanced institutionalised knowledge and competence
Dimension 1: Enhanced institutionalised knowledge and competence
Characteristic 1: Availability of
knowledge
Characteristic 2: Availability of
mechanisms for
knowledge transfer
Characteristic 3: Utilization of knowledge
Baseline Target Baseline Target Baseline Target
Estimation on scale
Estimation on scale
Estimation on scale
Estimation on scale
Estimation on scale
Estimation on scale
Average 3,17 3,40 2,17 2,83 2,33 2,67
Deviation 4,83 5,20 0,83 2,83 1,33 5,33
Number of responses
6,00 5,00 6,00 6,00 6,00 6,00
Table 72: Interoperability of transport modes - Improved governance structures and organizational set-up
Dimension 2: Improved governance structures and organizational set-up
Characteristic 1: Availability of organizational structures
Characteristic 2: Utilization of organizational structures
Baseline Target Baseline Target
Estimation on scale
Estimation on scale
Estimation on scale
Estimation on scale
Average 2,17 2,83 2,00 3,00
Deviation 2,83 4,83 2,00 2,00
Number of responses
6,00 6,00 6,00 6,00

Setting baselines and targets for the indicators 2014-2020 148
Table 73: Interoperability of transport modes - More efficient use of human and technical resources
Dimension 3: More efficient use of human and technical resources
Characteristic 1: Utilization of human
resources
Characteristic 2: Utilization of technical
resources
Characteristic 3: Application of time-
and/ or resource-saving measures
Baseline Target Baseline Target Baseline Target
Estimation on scale
Estimation on scale
Estimation on scale
Estimation on scale
Estimation on scale
Estimation on scale
Average 2,33 3,33 2,60 3,20 2,25 2,50
Deviation 5,33 5,33 3,20 2,80 2,75 5,00
Number of responses
6,00 6,00 5,00 5,00 4,00 4,00
Table 74: Interoperability of transport modes - Better ability to attract new financial resources
Dimension 4: Better ability to attract new financial resources
Characteristic 1: Ability to attract external private financial resources
Characteristic 2: Ability to attract external public financial resources
Baseline Target Baseline Target
Estimation on scale
Estimation on scale
Estimation on scale
Estimation on scale
Average 1,60 2,00 2,25 2,75
Deviation 1,20 4,00 2,75 6,75
Number of responses
5,00 5,00 4,00 4,00
Table 75: Interoperability of transport modes - Increased capability to work in transnational environment
Dimension 5: Increased capability to work in transnational environment
Characteristic 1: Available competences to work transnationally
Characteristic 2: Frequency of
transnational contacts
Characteristic 3: Intensity of
transnational collaboration
Baseline Target Baseline Target Baseline Target
Estimation on scale
Estimation on scale
Estimation on scale
Estimation on scale
Estimation on scale
Estimation on scale
Average 2,60 3,40 2,20 3,00 2,60 3,20
Deviation 3,20 3,20 0,80 2,00 1,20 2,80
Number of responses
5,00 5,00 5,00 5,00 5,00 5,00

Setting baselines and targets for the indicators 2014-2020 149
Specific objective 3.2 Accessibility of remote areas and areas affected by demographic
change
Table 76: Accessibility of remote areas and areas affected by demographic change - Enhanced institutionalised knowledge and competence
Dimension 1: Enhanced institutionalised knowledge and competence
Characteristic 1:
Availability of knowledge
Characteristic 2:
Availability of mechanisms for
knowledge transfer
Characteristic 3: Utilization of knowledge
Baseline Target Baseline Target Baseline Target
Estimation on scale
Estimation on scale
Estimation on scale
Estimation on scale
Estimation on scale
Estimation on scale
Average 3,33 4,33 2,67 4,33 2,67 4,00
Deviation 0,67 0,67 2,67 0,67 2,67 -
Number of responses
3,00 3,00 3,00 3,00 3,00 3,00
Table 77: Accessibility of remote areas and areas affected by demographic change - Improved governance structures and organizational set-up
Dimension 2: Improved governance structures and organizational set-up
Characteristic 1: Availability of organizational structures
Characteristic 2: Utilization of organizational structures
Baseline Target Baseline Target
Estimation on scale
Estimation on scale
Estimation on scale
Estimation on scale
Average 2,67 3,67 2,67 3,67
Deviation 0,67 0,67 0,67 0,67
Number of responses
3,00 3,00 3,00 3,00
Table 78: Accessibility of remote areas and areas affected by demographic change - More efficient use of human and technical resources
Dimension 3: More efficient use of human and technical resources
Characteristic 1: Utilization of human
resources
Characteristic 2: Utilization of technical
resources
Characteristic 3: Application of time-
and/ or resource-saving measures
Baseline Target Baseline Target Baseline Target
Estimation on scale
Estimation on scale
Estimation on scale
Estimation on scale
Estimation on scale
Estimation on scale
Average 3,00 3,67 2,33 3,33 3,00 4,00
Deviation 2,00 0,67 0,67 0,67 6,00 2,00
Number of responses
3,00 3,00 3,00 3,00 3,00 3,00

Setting baselines and targets for the indicators 2014-2020 150
Table 79: Accessibility of remote areas and areas affected by demographic change – Better ability to attract new financial resources
Dimension 4: Better ability to attract new financial resources
Characteristic 1: Ability to attract external private financial resources
Characteristic 2: Ability to attract external public financial resources
Baseline Target Baseline Target
Estimation on scale
Estimation on scale
Estimation on scale
Estimation on scale
Average 2,33 3,33 3,00 3,67
Deviation 0,67 0,67 2,00 2,67
Number of responses
3,00 3,00 3,00 3,00
Table 80: Accessibility of remote areas and areas affected by demographic change - Increased capability to work in transnational environment
Dimension 5: Increased capability to work in transnational environment
Characteristic 1: Available competences
to work transnationally
Characteristic 2: Frequency of
transnational contacts
Characteristic 3: Intensity of
transnational collaboration
Baseline Target Baseline Target Baseline Target
Estimation on scale
Estimation on scale
Estimation on scale
Estimation on scale
Estimation on scale
Estimation on scale
Average 3,33 4,00 3,00 4,00 3,33 4,00
Deviation 0,67 - 2,00 2,00 0,67 2,00
Number of responses
3,00 3,00 3,00 3,00 3,00 3,00
Specific objective 3.3: Maritime safety
Table 81: Maritime safety - Enhanced institutionalised knowledge and competence
Dimension 1: Enhanced institutionalised knowledge and competence
Characteristic 1:
Availability of knowledge
Characteristic 2: Availability of
mechanisms for knowledge transfer
Characteristic 3:
Utilization of knowledge
Baseline Target Baseline Target Baseline Target
Estimation on scale
Estimation on scale
Estimation on scale
Estimation on scale
Estimation on scale
Estimation on scale
Average 2,40 3,80 2,20 3,20 2,80 3,80
Deviation 1,20 2,80 0,80 0,80 0,80 2,80
Number of responses
5,00 5,00 5,00 5,00 5,00 5,00
Table 82: Maritime safety - Improved governance structures and organizational set-up
Dimension 2: Improved governance structures and organizational set-up

Setting baselines and targets for the indicators 2014-2020 151
Characteristic 1: Availability of organizational structures
Characteristic 2: Utilization of organizational structures
Baseline Target Baseline Target
Estimation on scale
Estimation on scale
Estimation on scale
Estimation on scale
Average 2,60 3,60 2,20 3,40
Deviation 1,20 1,20 0,80 1,20
Number of responses
5,00 5,00 5,00 5,00
Table 83: Maritime safety - More efficient use of human and technical resources
Dimension 3: More efficient use of human and technical resources
Characteristic 1: Utilization of human
resources
Characteristic 2: Utilization of technical
resources
Characteristic 3: Application of time-
and/ or resource-saving measures
Baseline Target Baseline Target Baseline Target
Estimation on scale
Estimation on scale
Estimation on scale
Estimation on scale
Estimation on scale
Estimation on scale
Average 2,40 3,80 2,80 4,00 2,40 3,60
Deviation 3,20 2,80 2,80 2,00 1,20 1,20
Number of responses
5,00 5,00 5,00 5,00 5,00 5,00
Table 84: Maritime safety – Better ability to attract new financial resources
Dimension 4: Better ability to attract new financial resources
Characteristic 1: Ability to attract external private financial resources
Characteristic 2: Ability to attract external public financial resources
Baseline Target Baseline Target
Estimation on scale
Estimation on scale
Estimation on scale
Estimation on scale
Average 1,80 2,60 2,00 2,60
Deviation 2,80 1,20 4,00 5,20
Number of responses
5,00 5,00 5,00 5,00
Table 85: Maritime safety - Increased capability to work in transnational environment
Dimension 5: Increased capability to work in transnational environment
Characteristic 1: Available competences to work transnationally
Characteristic 2: Frequency of
transnational contacts
Characteristic 3: Intensity of
transnational collaboration
Baseline Target Baseline Target Baseline Target
Estimation on scale
Estimation on scale
Estimation on scale
Estimation on scale
Estimation on scale
Estimation on scale
Average 2,80 3,80 3,40 3,80 2,60 3,20

Setting baselines and targets for the indicators 2014-2020 152
Deviation 4,80 2,80 5,20 2,80 3,20 0,80
Number of responses
5,00 5,00 5,00 5,00 5,00 5,00
Specific objective 3.4: Environmentally friendly shipping
Table 86: Environmentally friendly shipping - Enhanced institutionalised knowledge and competence
Dimension 1: Enhanced institutionalised knowledge and competence
Characteristic 1: Availability of
knowledge
Characteristic 2: Availability of
mechanisms for knowledge transfer
Characteristic 3: Utilization of knowledge
Baseline Target Baseline Target Baseline Target
Estimation
on scale
Estimation
on scale
Estimation
on scale
Estimation
on scale
Estimation
on scale
Estimation
on scale
Average 2,60 3,80 2,40 3,40 2,40 3,20
Deviation 1,20 0,80 1,20 1,20 1,20 2,80
Number of responses
5,00 5,00 5,00 5,00 5,00 5,00
Table 87: Environmentally friendly shipping - Improved governance structures and organizational set-up
Dimension 2: Improved governance structures and organizational set-up
Characteristic 1: Availability of
organizational structures
Characteristic 2: Utilization of
organizational structures
Baseline Target Baseline Target
Estimation on scale
Estimation on scale
Estimation on scale
Estimation on scale
Average 3,25 4,00 2,80 3,60
Deviation 0,75 2,00 0,80 3,20
Number of responses
4,00 4,00 5,00 5,00
Table 88: Environmentally friendly shipping - More efficient use of human and technical resources
Dimension 3: More efficient use of human and technical resources
Characteristic 1: Utilization of human
resources
Characteristic 2: Utilization of technical
resources
Characteristic 3: Application of time-
and/ or resource-saving
measures
Baseline Target Baseline Target Baseline Target
Estimation on scale
Estimation on scale
Estimation on scale
Estimation on scale
Estimation on scale
Estimation on scale
Average 3,20 4,00 3,20 4,00 3,00 3,80
Deviation 2,80 4,00 2,80 2,00 2,00 2,80
Number of
responses
5,00 5,00 5,00 5,00 5,00 5,00

Setting baselines and targets for the indicators 2014-2020 153
Table 89: Environmentally friendly shipping – Better ability to attract new financial resources
Dimension 4: Better ability to attract new financial resources
Characteristic 1: Ability to attract
external private financial resources
Characteristic 2: Ability to attract
external public financial resources
Baseline Target Baseline Target
Estimation on scale
Estimation on scale
Estimation on scale
Estimation on scale
Average 2,40 3,40 2,40 3,50
Deviation 1,20 3,20 3,20 5,00
Number of responses
5,00 5,00 5,00 4,00
Table 90: Environmentally friendly shipping - Increased capability to work in transnational environment
Dimension 5: Increased capability to work in transnational environment
Characteristic 1:
Available competences to work transnationally
Characteristic 2:
Frequency of transnational contacts
Characteristic 3:
Intensity of transnational collaboration
Baseline Target Baseline Target Baseline Target
Estimation on scale
Estimation on scale
Estimation on scale
Estimation on scale
Estimation on scale
Estimation on scale
Average 3,40 4,20 3,40 4,20 3,20 3,80
Deviation 3,20 2,80 1,20 2,80 2,80 2,80
Number of responses
5,00 5,00 5,00 5,00 5,00 5,00
Specific objective 3.5: Environmentally friendly urban mobility
Table 91: Environmentally friendly urban mobility - Enhanced institutionalised knowledge and competence
Dimension 1: Enhanced institutionalised knowledge and competence
Characteristic 1: Availability of
knowledge
Characteristic 2: Availability of
mechanisms for knowledge transfer
Characteristic 3: Utilization of knowledge
Baseline Target Baseline Target Baseline Target
Estimation on scale
Estimation on scale
Estimation on scale
Estimation on scale
Estimation on scale
Estimation on scale
Average 3,29 4,00 2,86 3,86 2,57 3,43
Deviation 1,43 - 2,86 0,86 1,71 1,71
Number of responses
7,00 7,00 7,00 7,00 7,00 7,00
Table 92: Environmentally friendly urban mobility - Improved governance structures and organizational set-up
Dimension 2: Improved governance structures and organizational set-up

Setting baselines and targets for the indicators 2014-2020 154
Characteristic 1: Availability of organizational structures
Characteristic 2: Utilization of organizational structures
Baseline Target Baseline Target
Estimation on scale
Estimation on scale
Estimation on scale
Estimation on scale
Average 2,86 3,57 2,86 3,43
Deviation 0,86 3,71 2,86 1,71
Number of responses
7,00 7,00 7,00 7,00
Table 93: Environmentally friendly urban mobility - More efficient use of human and technical resources
Dimension 3: More efficient use of human and technical resources
Characteristic 1: Utilization of human
resources
Characteristic 2: Utilization of technical
resources
Characteristic 3: Application of time-
and/ or resource-saving measures
Baseline Target Baseline Target Baseline Target
Estimation on scale
Estimation on scale
Estimation on scale
Estimation on scale
Estimation on scale
Estimation on scale
Average 3,00 3,57 2,86 3,57 2,71 3,43
Deviation 2,00 3,71 4,86 1,71 1,43 1,71
Number of responses
7,00 7,00 7,00 7,00 7,00 7,00
Table 94: Environmentally friendly urban mobility – Better ability to attract new financial resources
Dimension 4: Better ability to attract new financial resources
Characteristic 1: Ability to attract external private financial resources
Characteristic 2: Ability to attract external public financial resources
Baseline Target Baseline Target
Estimation on scale
Estimation on scale
Estimation on scale
Estimation on scale
Average 1,86 2,57 2,57 3,14
Deviation 2,86 1,71 1,71 0,86
Number of responses
7,00 7,00 7,00 7,00
Table 95: Environmentally friendly urban mobility - Increased capability to work in transnational environment
Dimension 5: Increased capability to work in transnational environment
Characteristic 1: Available competences to work transnationally
Characteristic 2: Frequency of
transnational contacts
Characteristic 3: Intensity of
transnational collaboration
Baseline Target Baseline Target Baseline Target
Estimation on scale
Estimation on scale
Estimation on scale
Estimation on scale
Estimation on scale
Estimation on scale
Average 3,14 4,00 2,71 3,71 2,57 3,57

Setting baselines and targets for the indicators 2014-2020 155
Deviation 2,86 2,00 3,43 1,43 3,71 1,71
Number of responses
7,00 7,00 7,00 7,00 7,00 7,00

Setting baselines and targets for the indicators 2014-2020 156
APPENDIX 2 LIST OF INTERVIEWED EXPERTS
Specific objective Respondent Organization
1.1: Research and innovation infrastructure 1.2: Smart specialization 1.3: Non-technological innovation
Karin Nygård Skalman VINNOVA, Sweden
Arūnas Beržinskas MITA, Lithuania
2.1: Clear waters Sanni Turunen Ministry of the Environment/PA Nutri, Finland
2.2: Renewable energy 2.3: Energy efficiency
Pia Norrman Swedish Energy Agency, Sweden
2.4: Resource-efficient blue growth
Joanna Przedrzymirska The Maritime Institute in Gdańsk, Poland
Frank Asche University of Stavanger / International Centre for Trade and Sustainable Development, Norway
3.1: Interoperability of transport modes 3.2: Accessibility of remote areas and areas affected by demographic change
Gunnar Prause Tallinn University of Technology, Estonia
Thomas Erlandsson PA Transport, Sweden
3.3: Maritime safety 3.4: Environmentally friendly shipping
Ditte Folke Kikkert Henriksen
Danish Maritime Authority/PA Ship, Denmark
Linas Kasparavičius MSA - The Lithuanian Maritime Safety Administration, Lithuania
3.5: Environmentally friendly urban mobility
Artur Perchel UITP - International Association of Public Transport, Eastern Europe
Total 11