FINAL REMEDIAL ACTION REPORT BUILDING 165 AND … · final remedial action report building 165 and...
87
FINAL REMEDIAL ACTION REPORT BUILDING 165 AND AREA 18C GROUNDWATER TREATMENT PILOT SYSTEMS Former Raritan Arsenal Project Edison, New Jersey Prepared for: U.S. Army Corp of Engineers Omaha District Building 525 Castle Hall Offutt AFB, NE 68113 Prepared by: Shaw Environmental, Inc. 2790 Mosside Boulevard Monroeville, Pennsylvania 15146 Project Number 108797 Contract No. DACA45-03-D-0022, Task Order No. 0018 November 2010
Transcript of FINAL REMEDIAL ACTION REPORT BUILDING 165 AND … · final remedial action report building 165 and...
FFIINNAALL RREEMMEEDDIIAALL AACCTTIIOONN RREEPPOORRTT BBUUIILLDDIINNGG 116655 AANNDD AARREEAA 1188CC GGRROOUUNNDDWWAATTEERR TTRREEAATTMMEENNTT PPIILLOOTT SSYYSSTTEEMMSS FFoorrmmeerr RRaarriittaann AArrsseennaall PPrroojjeecctt EEddiissoonn,, NNeeww JJeerrsseeyy PPrreeppaarreedd ffoorr:: UU..SS.. AArrmmyy CCoorrpp ooff EEnnggiinneeeerrss OOmmaahhaa DDiissttrriicctt BBuuiillddiinngg 552255 CCaassttllee HHaallll OOffffuutttt AAFFBB,, NNEE 6688111133 PPrreeppaarreedd bbyy:: SShhaaww EEnnvviirroonnmmeennttaall,, IInncc.. 22779900 MMoossssiiddee BBoouulleevvaarrdd MMoonnrrooeevviillllee,, PPeennnnssyyllvvaanniiaa 1155114466 PPrroojjeecctt NNuummbbeerr 110088779977 CCoonnttrraacctt NNoo.. DDAACCAA4455--0033--DD--00002222,, TTaasskk OOrrddeerr NNoo.. 00001188 NNoovveemmbbeerr 22001100
Final Remedial Action Report i Project No. 108797 Building 165 and Area 18 C Groundwater Treatment Pilot Systems November 2010
Table of Contents ________________________________________________
Table of Contents ........................................................................................................................................... i List of Tables ................................................................................................................................................. iii List of Figures ................................................................................................................................................ iv List of Appendices ......................................................................................................................................... vi Acronyms and Abbreviations ........................................................................................................................ vii Executive Summary .................................................................................................................................... E-1 1.0 Introduction ..................................................................................................................................... 1-1 2.0 Preliminary Activities ....................................................................................................................... 2-1
2.1 Previous Investigations ......................................................................................................... 2-1 2.2 Laboratory Treatability Studies ............................................................................................. 2-2 2.3 Technology Selection ........................................................................................................... 2-3
3.0 Remedial Action Work Plan ............................................................................................................ 3-1 3.1 Work Plan Amendment ......................................................................................................... 3-1 3.2 Permit-by-Rule Application ................................................................................................... 3-2 3.3 Permit-by-Rule Application Amendments ............................................................................. 3-2
4.0 165 Fieldcrest Avenue Pre-Design Activities .................................................................................. 4-1 4.1 Geoprobe® Sampling ............................................................................................................ 4-1 4.2 Topographic Survey ............................................................................................................. 4-1 4.3 Geophysical Survey .............................................................................................................. 4-2 4.4 Monitoring Well Installation ................................................................................................... 4-2 4.5 Aquifer Testing ..................................................................................................................... 4-2
4.5.1 Pumping Test .......................................................................................................... 4-2 4.5.2 Slug Tests ............................................................................................................... 4-2 4.5.3 Groundwater Elevations and Saturated Thickness .................................................. 4-3
4.6 Computer Modeling .............................................................................................................. 4-3 4.7 Baseline Groundwater Sampling .......................................................................................... 4-3
5.0 165 Fieldcrest Avenue Pilot System Installation and Operation ...................................................... 5-1 5.1 Installation of Injection Wells and Piezometers..................................................................... 5-1
5.1.1 Utility and Subsurface Geophysical Survey ............................................................. 5-1 5.1.2 Horizontal Injection Well Installation ........................................................................ 5-1 5.1.3 Vertical Injection Well and Piezometer Installation .................................................. 5-3 5.1.4 Well Survey Activities .............................................................................................. 5-4
5.2 Pilot Test System Construction ............................................................................................ 5-4 5.2.1 Electrical System Construction ................................................................................ 5-5 5.2.2 Permanganate Mixing System Construction ............................................................ 5-5 5.2.3 Permanganate Injection System Construction ......................................................... 5-6
5.3 Pilot Test System Functional Testing ................................................................................... 5-6 5.3.1 Initial Water Injection Testing .................................................................................. 5-6 5.3.2 Stormwater System Video Inspection ...................................................................... 5-7 5.3.3 Pilot Test System Operational Design Modifications ............................................... 5-8 5.3.4 System Operational Redesign Functional Testing ................................................... 5-9
Table of Contents (continued) _____________________________________
Final Remedial Action Report ii Project No. 108797 Building 165 and Area 18 C Groundwater Treatment Pilot Systems November 2010
5.4 Pilot Test Operation .............................................................................................................. 5-9 5.4.1 Permanganate Batch Mixing ................................................................................. 5-10 5.4.2 Permanganate Batch Injection .............................................................................. 5-10 5.4.3 System Teardown and Equipment Demobilization ................................................ 5-12
6.0 165 Fieldcrest Avenue Post-Injection Monitoring ............................................................................ 6-1 6.1 Methodology ......................................................................................................................... 6-1 6.2 Permanganate Distribution ................................................................................................... 6-1 6.3 Chlorinated Ethene Concentrations ...................................................................................... 6-2 6.4 Treatment Effectiveness ....................................................................................................... 6-2
7.0 Area 18C – Building 256 Ramp Area Pre-Design Activities ............................................................ 7-1 7.1 Monitoring Well Installation ................................................................................................... 7-1 7.2 Site Topographic Survey ...................................................................................................... 7-2 7.3 Hydrogeologic Testing .......................................................................................................... 7-2
7.3.1 Slug Testing ............................................................................................................ 7-2 7.3.2 Pumping Tests ........................................................................................................ 7-3
7.4 Direct-Push Investigation ...................................................................................................... 7-5 7.5 Laboratory Buffer Testing ..................................................................................................... 7-5 7.6 Injection Radius of Influence Testing .................................................................................... 7-6 7.7 Baseline Groundwater Sampling .......................................................................................... 7-7
8.0 Area 18C – Building 256 Ramp Area Pilot Study Design and Installation ....................................... 8-1 8.1 Conceptual Site Model ......................................................................................................... 8-1 8.2 Technology Description ........................................................................................................ 8-2 8.3 Lower Sand .......................................................................................................................... 8-3
8.3.1 Groundwater Modeling ............................................................................................ 8-3 8.3.2 Systems Design ...................................................................................................... 8-4
8.4 Injection/Extraction Well Installation ..................................................................................... 8-4 8.4.1 Systems Construction .............................................................................................. 8-5
8.4.1.1 Groundwater Recirculation System ........................................................... 8-6 8.4.1.2 Amendment Delivery Systems .................................................................. 8-6
8.4.2 Systems Testing ...................................................................................................... 8-7 8.5 Upper Sand .......................................................................................................................... 8-8
8.5.1 Injection Program Design and Construction ............................................................ 8-8 9.0 Area 18C Pilot System Operation and Monitoring ........................................................................... 9-1
9.1 Lower Sand .......................................................................................................................... 9-1 9.1.1 pH Adjustment ......................................................................................................... 9-1 9.1.2 Lactate and Nutrient Injections ................................................................................ 9-2 9.1.3 Bioaugmentation ..................................................................................................... 9-2 9.1.4 LACTOIL and Nutrient Injections ............................................................................. 9-3 9.1.5 Systems Operation and Monitoring ......................................................................... 9-3 9.1.6 Groundwater Monitoring .......................................................................................... 9-4
9.2 Upper Sand .......................................................................................................................... 9-5 9.2.1 pH Adjustment and Amendment Injections .............................................................. 9-5 9.2.2 Bioaugmentation Injections ..................................................................................... 9-6 9.2.3 Groundwater Monitoring .......................................................................................... 9-6

Table of Contents (continued) _____________________________________
Final Remedial Action Report iii Project No. 108797 Building 165 and Area 18 C Groundwater Treatment Pilot Systems November 2010
10.0 Area 18C Results .......................................................................................................................... 10-1 10.1 Lower Sand ........................................................................................................................ 10-1
10.1.1 pH Adjustment and Field Parameters .................................................................... 10-1 10.1.2 Geochemical Parameters ...................................................................................... 10-1 10.1.3 Electron Donor Distribution .................................................................................... 10-1 10.1.4 Chlorinated Ethenes and Reduced Gases ............................................................ 10-1 10.1.5 Systems Performance ........................................................................................... 10-2
10.2 Shallow Zone ...................................................................................................................... 10-2 10.2.1 pH Adjustment and Field Parameters .................................................................... 10-2 10.2.2 Geochemical Parameters ...................................................................................... 10-3 10.2.3 Electron Donor Distribution .................................................................................... 10-3 10.2.4 Chlorinated Ethenes and Reduced Gases ............................................................ 10-3
11.0 Conclusions and Recommendations ............................................................................................. 11-1 11.1 165 Fieldcrest Avenue ........................................................................................................ 11-1 11.2 Area 18C ............................................................................................................................ 11-1
12.0 Lessons Learned .......................................................................................................................... 12-1 13.0 References ................................................................................................................................... 13-1 Tables Figures Appendices List of Tables ___________________________________________________
4.1 Raritan AOC 2 - Groundwater Pilot Testing Baseline Sampling 4.2 165 Fieldcrest Avenue Area – Field-Measured Geochemical Parameters, June 2008 Baseline
Sampling 5.1 165 Fieldcrest Avenue – Summary of Monitoring, Injection and Horizontal Well and Piezometer
Construction Details 5.2 Potassium Permanganate Injection Data Summary Table 6.1 165 Fieldcrest Avenue Monitoring Events 7.1 Area 18C Building 256 Ramp Area - Summary of Monitoring, Injection and Extraction Well and
Piezometer Construction Details 7.2 Slug Test Results – Area 18C 7.3 MW 114 Pump Test Results 7.4 MW 303S Pump Test Results 7.5 Summary of Demonstration Sampling Locations and Parameters: Lower Sand Unit Wells 7.6 Summary of Demonstration Sampling Locations and Parameters: Extraction Wells 7.7 Summary of Demonstration Sampling Locations and Parameters: Upper Sand Unit Wells 7.8 Analytical Data Summary Tables 7.9 Field Parameter Results Summary
Table of Contents (continued) _____________________________________
Final Remedial Action Report iv Project No. 108797 Building 165 and Area 18 C Groundwater Treatment Pilot Systems November 2010
List of Figures __________________________________________________
1.1 Pilot Test Areas – Area 18C – Building 256 Ramp Area and 165 Fieldcrest Avenue Area 4.1 165 Fieldcrest Avenue Area – Geoprobe® Sampling Results 4.2 Location of Monitoring Wells and TCE Concentrations 5.1 Well Location Map – 165 Fieldcrest Avenue Area 5.2 Pilot Test System Layout – 165 Fieldcrest Avenue 5.3 Pilot Test Process Flow Diagram – 165 Fieldcrest Avenue Area 5.4 Storm Water System Layout – 165 Fieldcrest Avenue Area 5.5 Permanganate Storage Location Map 6.1 Permanganate Extent / ORP (Feb. 2009) – 165 Fieldcrest Avenue Area 6.2 Permanganate Extent / ORP (Mar. 2009) – 165 Fieldcrest Avenue Area 6.3 Permanganate Extent / ORP (May 2009) – 165 Fieldcrest Avenue Area 6.4 Permanganate Extent / ORP (July 2009) – 165 Fieldcrest Avenue Area 6.5 Permanganate Extent / ORP (Sept. 2009) – 165 Fieldcrest Avenue Area 6.6 Permanganate Extent / ORP (Dec. 2009) – 165 Fieldcrest Avenue Area 6.7 Permanganate Extent / ORP (April 2010) – 165 Fieldcrest Avenue Area 7.1 Site Map Area 18C 7.2 Direct-Push Groundwater Sampling Results 7.3 Baseline VOC Groundwater Sampling Results 7.4 Baseline PCE Isoconcentration Map – Lower Sand 7.5 Baseline TCE Isoconcentration Map – Lower Sand 7.6 Baseline cDCE Isoconcentration Map – Lower Sand 7.7 Baseline Vinyl Chloride Isoconcentration Map – Lower Sand 7.8 Baseline PCE Isoconcentration Map – Upper Sand 7.9 Baseline TCE Isoconcentration Map – Upper Sand 7.10 Baseline cDCE Isoconcentration Map – Upper Sand 7.11 Baseline Vinyl Chloride Isoconcentration Map – Upper Sand 7.12 Baseline pH Distribution Map – Lower Sand 8.1 Generalized Hydrogeologic Cross Section – Area 18C 8.2 Upper and Lower Treatment Zones – Area 18 C 8.3 Groundwater Modeling Results – Particle Tracking 8.4 Groundwater Modeling Results – Electron Donor Concentrations 8.5 Site Map – Area 18C Building 256 Ramp Area 8.6 Generalized Groundwater Recirculation and amendment Injection Process Schematic 8.7 Piping Racks 8.8 Control Panel 8.9 Metering Pumps
Table of Contents (continued) _____________________________________
Final Remedial Action Report v Project No. 108797 Building 165 and Area 18 C Groundwater Treatment Pilot Systems November 2010
List of Figures (continued) 8.10 Tanks 8.11 Dosatron Pumps 8.12 Baseline Potentiometric Surface Map – Upper Sand 8.13 Baseline Potentiometric Surface Map – Lower Sand 8.14 Potentiometric Surface During System Operation Lower Sand 8.15 Eductor 8.16 Water Pillow 8.17 Manifold 9.1 Direct-Push Injection Locations 10.1 Lower Sand Monitoring Wells – pH Trend Graph 10.2 pH Distribution Map – Lower Sand Unit December 2009 10.3 Lower Sand Monitoring Wells – ORP Trend Graph 10.4 Total Volatile Fatty Acids Isoconcentration Map – Lower Sand August 2009 10.5 PCE Isoconcentration Map – Lower Sand April 2010 10.6 TCE Isoconcentration Map – Lower Sand April 2010 10.7 cDCE Isoconcentration Map – Lower Sand April 2010 10.8 Vinyl Chloride Isoconcentration Map – Lower Sand April 2010 10.9 MW-114 CVOC & Reduced Gases Trend Graph 10.10 MW-114A CVOC & Reduced Gases Trend Graph 10.11 MW-301D CVOC & Reduced Gases Trend Graph 10.12 MW-304D CVOC & Reduced Gases Trend Graph 10.13 MW-305D CVOC & Reduced Gases Trend Graph 10.14 MW-306D CVOC & Reduced Gases Trend Graph 10.15 Upper Sand Monitoring Wells pH Trend Graph 10.16 Upper Sand Monitoring Wells ORP Trend Graph 10.17 Total Volatile Fatty Acids Isoconcentration Map Upper Sand August 2009 10.18 PCE Concentration Map Upper Sand April 2010 10.19 TCE Concentration Map Upper Sand April 2010 10.20 cDCE Concentration Map Upper Sand April 2010 10.21 Vinyl Chloride Concentration Map Upper Sand April 2010 10.22 MW-301s CVOC & Reduced Gases Trend Graph 10.23 MW-302s CVOC & Reduced Gases Trend Graph 10.24 MW-303s CVOC & Reduced Gases Trend Graph 10.25 MW-305s CVOC & Reduced Gases Trend Graph

Table of Contents (continued) _____________________________________
Final Remedial Action Report vi Project No. 108797 Building 165 and Area 18 C Groundwater Treatment Pilot Systems November 2010
List of Appendices _______________________________________________
Appendix A Technology Selection Report (CD) Appendix B Permit by Rule Documentation Appendix C Geoprobe® Boring Logs – 165 Fieldcrest Avenue Appendix D Geophysical Survey – 165 Fieldcrest Avenue Appendix E 165 Fieldcrest Avenue Monitoring Well Boring Logs/Completion Diagrams Appendix F Permanganate Injection Simulation Model Appendix G Horizontal Well Installation Documentation Appendix H Injection Well and Piezometer Boring Logs/Completion Diagrams – 165 Fieldcrest Avenue Appendix I Storm Sewer Inspection Report Appendix J 165 Fieldcrest Avenue Monitoring Results Appendix K Area 18C Monitoring Well Boring Logs/Completion Diagrams Appendix L Area 18C Injection/Extraction Well Boring Logs/Completion Diagrams Appendix M Slug Test Data
Final Remedial Action Report vii Project No. 108797 Building 165 and Area 18 C Groundwater Treatment Pilot Systems November 2010
Acronyms and Abbreviations ______________________________________
µg/L micrograms per liter µm micrometer µS/cm microSiemens per centimeter AOC Area of Concern bgs below ground surface cDCE cis-1,2-dichlorethene COC contaminants of concern CVOC chlorinated volatile organic compounds DAP diammonium phosphate DHC Dehalococcoides sp. DHS Department of Homeland Security DO dissolved oxygen DTD Directed Technologies Drilling, Inc. EOS emulsified vegetable oil EW Extraction Well gpm gallons per minute GWQC Groundwater Quality Criteria HSA hollow stem auger IAQ Indoor Air Quality ID inside diameter IDW investigative derived waste ISCO in situ chemical oxidation IW Injection Well LACTOIL emulsified oil substrate lbs pounds mg/L milligrams per liter mV milliVolt MW Monitoring Well NJDEP New Jersey Department of Environmental Protection O&M operation and maintenance OD outside diameter ORP oxidation-reduction potential PBR Permit-by-Rules PCE tetrachloroethene PID photo-ionization detector PQL practical quantitation limit PSEG Public Service Electric & Gas
Acronyms and Abbreviations (continued) ____________________________
Final Remedial Action Report viii Project No. 108797 Building 165 and Area 18 C Groundwater Treatment Pilot Systems November 2010
psi pounds per square inch PVC polyvinyl chloride PZ piezometer qPCR quantitative polymerase chain-reaction RAR Remedial Action Report RAWP Remedial Action Work Plan SAP Sampling and Analysis Plan SDC-9™ dechlorinating bacterial culture SGS SGS Environmental Services, Inc. Shaw Shaw Environmental, Inc. SOD soil oxygen demand TCE trichloroethene USACE United States Army Corps of Engineers USEPA United States Environmental Protection Agency UXO unexploded ordinance VC vinyl chloride VFA volatile fatty acids VOC volatile organic compounds

Final Remedial Action Report ES-1 Project No. 108797 Building 165 and Area 18 C Groundwater Treatment Pilot Systems November 2010
Executive Summary
This summary report details the Groundwater pilot study activities performed at the former Raritan Arsenal site in Edison, New Jersey under the Rapid Response Contract No. DACA45-03-D-0022, Task Order No 0018. The pilot studies were conducted within Area of Concern 2 (AOC 2), at locations known as Area 18C - Ramp Area and 165 Fieldcrest Ave. The work was conducted during the period from March 2007 through April 2010.
Previous investigations confirmed that the main source of contamination for Groundwater AOC 2 was located in the Area 18C - Building 256 Ramp Area. Excavations of contaminated soil in this area were performed in 1998 and 2002. Post-excavation sampling indicated limited presence of residual contaminated soil within the vadose zone, and TCE concentrations in groundwater at monitoring well MW-114 (the well immediately downgradient of the former source area) have decreased over an order of magnitude, from 2,900 µg/L in July 1998 to 94.9 µg/L in March 2007. Based on the downward trend in groundwater contaminant concentrations at this monitoring well, it appears that the soil remediation was largely successful.
Additional groundwater investigation activities and evaluations of potential vapor intrusion pathways were conducted in association with Groundwater AOC 2. With the continuing concerns of residual contamination within AOC 2, the USACE requested that groundwater pilot studies be performed to determine viable options for treating the residual contaminants in the AOC.
The following tasks were performed by Shaw as part of the pre-design phase to gather additional site information to aid in the design of the pilot systems:
• Collection of soil and groundwater samples (June 2007) for bench-scale testing from two areas identified as potential pilot study areas within the AOC 2 groundwater plume.
− Area 18C - Building 256 Ramp Area: located in the former source area, and adjacent to monitoring well MW-114
− 165 Fieldcrest Avenue Area: located adjacent to MW165-1
• Installation of monitoring well MW-114A in the Area 18C - Building 256 Ramp Area (June 2007), to further delineate horizontal and vertical groundwater contamination, provide an additional monitoring point, and act as potential monitoring well for future pilot study activities.
Final Remedial Action Report ES-2 Project No. 108797 Building 165 and Area 18 C Groundwater Treatment Pilot Systems November 2010
• Performance of in situ chemical oxidation (ISCO) and biostimulation/bioaugmentation treatability testing at Shaw’s Knoxville, Tennessee laboratories on soil and groundwater from each of the two areas.
• Collection of groundwater samples from 15 existing wells (March 2007) to determine current VOC concentrations, and also to obtain natural attenuation parameters in seven of these wells.
The data collectively indicate that dissolved contaminants in groundwater should be the primary target medium for remediation. A reduction in dissolved phase contaminants within the former source area (Area 18C – Building 256 Ramp Area) and within the downgradient portion of the plume exhibiting the highest VOC concentrations (165 Fieldcrest Avenue) is expected to lead to additional reductions in soil VOC concentrations and to MNA as a viable remedial approach for the overall Groundwater AOC 2 area. As a result, two field pilot studies were designed and implemented to address groundwater contamination within these two areas. The proposed locations of the pilot studies are provided in Figure 1.1.
Bench-scale treatability studies were performed at Shaw’s Knoxville laboratories to determine the most effective treatment for the AOC 2 groundwater. Treatability testing was conducted for ISCO, anaerobic biostimulation, anaerobic bioaugmentation, and co-metabolic (aerobic) biostimulation. Complete treatability study reports containing details of experimental design, procedures, and results are provided in the Technology Selection Report (Shaw 2008), attached as Appendix A.
Based on the results of laboratory treatability studies, anaerobic bioaugmentation with pH adjustment was selected for pilot testing in Area 18C, and ISCO with potassium permanganate was selected for pilot testing in the 165 Fieldcrest Avenue Area. Treatability study results indicated that, of the technologies tested, bioaugmentation with pH adjustment was the only viable option for treating target groundwater contaminants within Area 18C. ISCO was not an option for Area 18C, due to an extremely high soil oxidant demand (SOD) calculated in samples collected from this area. However, due to a much lower calculated SOD in samples collected from the 165 Fieldcrest Avenue Area, ISCO with permanganate was shown to be a viable option for treating groundwater within this area. In addition, ISCO with permanganate is a remedial technology which has been shown to effectively and efficiently degrade chlorinated ethenes in groundwater where sufficient distribution can be achieved.
165 Fieldcrest Ave. Pilot Study - ISCO
Prior to the performance of the pilot study, several additional pre-design activities were performed which included the installation of monitoring wells, sampling groundwater and soils,
Final Remedial Action Report ES-3 Project No. 108797 Building 165 and Area 18 C Groundwater Treatment Pilot Systems November 2010
completing topographic and geophysical surveys, aquifer testing and computer modeling. The information gathered from these activities were utilized to complete the design and proposed operation of the pilot system. Horizontal injection wells were incorporated into the design due to the need to treat contaminants under the building and to distribute the permanganate in the relatively shallow aquifer.
The installation of the pilot system was performed from July to September 2008. During the initial system functional testing, it was discovered that the proposed injection flow rates caused a rapid rise in the water table levels across the site with some areas coming close to the ground surface. It was also discovered during the initial testing that the storm water collection system was compromised and may cause the injected permanganate to be conveyed off-site during the system operation. Based on these unforeseen site conditions, modifications to the proposed system operation were required. Subsequent groundwater modeling indicated that a combination of groundwater extraction and a modified injection process could prevent the permanganate from infiltrating the storm water system or reaching the ground surface.
Utilizing the revised operational procedures, the permanganate was injected from September to November 2008. A total of 83,162 pounds of permanganate was injected during this pilot study.
At the conclusion of the permanganate injection, a six month period of groundwater monitoring was to be conducted to evaluate the effectiveness of the program. Due to the persistence of permanganate in several of the wells, the number of wells where a sample could be collected was limited. Sampling events were spaced out to allow for the further dissipation of the permanganate, with the final sampling event being performed in April 2010.
While the levels of TCE were significantly reduced due to the injection of the permanganate, the final evaluation of the effectiveness of the pilot system may not be known for some time. Eight of the eleven wells in the groundwater monitoring program exhibited significant reduction (57 to 99 percent) in April of 2010 when compared to baseline. In addition, MW 308 was not able to be sampled due to the continued presence of permanganate, while MW 151-Front was considered an upgradient well where no reduction was expected. Due to the lack of access, the areas beneath the building could also not be monitored. Once the permanganate has dissipated to the extent where a complete sampling event can be conducted, the results of the study can be further evaluated and conclusions derived.
Area 18C/Ramp Area – Bioaugmentation
Prior to the performance of the pilot study, several pre-design activities were performed which included the installation of monitoring wells, hydrogeologic testing, completing a topographic survey, laboratory buffer testing, groundwater sampling and injection radius of influence testing.
Final Remedial Action Report ES-4 Project No. 108797 Building 165 and Area 18 C Groundwater Treatment Pilot Systems November 2010
The information gathered from these activities was utilized to complete the design and finalize the proposed operation of the bioaugmentation pilot system.
Results of the Pre-design activities indicated that two separate contaminated hydrostratigraphic units exist in this area, and that these Upper Sand and Lower Sand units were two distinct aquifer units that would require separate treatment approaches. Hydrogeologic testing indicated that groundwater recirculation could be effective for the Lower Sand unit, but not as effective for the Upper Sand unit (because of the low hydraulic conductivity of this unit). A wide range in pH values for the Lower Sand also made groundwater recirculation a more reasonable approach, because it would allow for pH control at individual injection wells, thus providing operational flexibility that would allow for the increase and leveling of groundwater pH across the treatment area. The groundwater recirculation approach was also optimal for effective distribution of Shaw’s SDC-9™ culture.
Radius of influence injection testing performed in the Upper Sand Unit indicated that direct-push injections could be effective at delivering amendments for pH adjustment, as well as a carbon source and nutrients. Additionally, applications in similar geologies have shown that the SDC-9 culture can be delivered to the subsurface successfully using direct-push injection techniques. Therefore, it was determined that the remedial approach for the Upper Sand unit would involve injection of buffer and amendments via direct-push points.
The recirculation and amendment delivery system for the Lower Sand Unit was installed from July to October 2008. The operation of the system occurred between March and December 2009. The Upper Sand injections were performed from June to July 2009. Six groundwater monitoring events were conducted from August 2009 through April 2010.
The results from both the Upper and Lower Sand unit treatments indicate that significant reduction of target contaminants can be quickly accomplished through pH adjustment and bioaugmentation. Since the majority of the remaining contaminated portions of the AOC2 plume reside within the shallow aquifer (similar to that of the Upper Sand Unit), application of the direct-push injection approach has the potential to be cost effective for additional mass removal, if required. Although initial pilot test results are extremely positive, additional groundwater sampling is recommended to verify that significant contaminant rebound does not occur.

Final Remedial Action Report Project No. 108797 Building 165 and Area 18 C Groundwater Treatment Pilot Systems November 2010
1-1
1.0 Introduction
The following Remedial Action Report (RAR) has been prepared by Shaw Environmental, Inc. (Shaw) for the United States Army Corps of Engineers (USACE)-Omaha District, in compliance with the Rapid Response Contract No. DACA45-03-D-0022, Task Order No. 0018.
This RAR describes the activities associated with two pilot-scale groundwater treatment programs conducted at two locations within Area of Concern (AOC) 2 of the former Raritan Arsenal located in Edison, New Jersey. These locations both have shallow groundwater contaminated with chlorinated ethenes (primarily trichloroethene [TCE] and cis-1,2-dichloroethene [cDCE]) and are referred to as the 165 Fieldcrest Avenue Area and the Area 18C-Building 256 Ramp Area. This work was performed under the direction of the USACE with the objective to conduct two pilot studies to determine a viable treatment technology for the TCE contamination present in these areas. All work was performed in accordance with the New Jersey Department of Environmental Protection (NJDEP) Technical Requirements for Site Remediation, N.J.A.C. 7:26E (NJDEP, July 2005). Figure 1.1 depicts the two site locations.
Shaw prepared a Groundwater Remedial Action Work Plan (RAWP) for Pilot Testing in AOC 2 that was submitted to the NJDEP in May 2008. NJDEP provided approval of the proposed plan via a letter dated June 11, 2008 to the USACE New York District. An amendment to the RAWP was submitted to the NJDEP on July 17, 2008 and that document was approved by the NJDEP on August 5, 2008.
In addition to the RAWP, Shaw prepared and submitted to the NJDEP Applications for Permit-by-Rules (PBR) for the two pilot systems. NJDEP reviewed these documents and provided approval in letters dated August 5 and 14, 2008 to the USACE New York District. A request for extension to the permit-by-rules were submitted to the NJDEP on June 5, 2009 and approved by NJDEP on August 14, 2009. A request for an additional extension to the PBRs was submitted to the NJDEP on March 3, 2010. Appendix B includes copies of the PBR applications and correspondence.
Final Remedial Action Report Project No. 108797 Building 165 and Area 18 C Groundwater Treatment Pilot Systems November 2010
2-1
2.0 Preliminary Activities
2.1 Previous Investigations AOC 2 is located within the north central portion of the former Arsenal, beginning near Building 256 in Area 18C (Figure 1.1). The AOC 2 footprint extends southeast, underlying the physical boundaries of Buildings 150, 151, and 160, Areas 2 and 3, and a portion of Building 165 in the Raritan Center Industrial Park. The predominant constituents of concern for this groundwater AOC are TCE and associated breakdown products cis-1,2-dichlorethene (cDCE) and vinyl chloride (VC). Tetrachloroethene (PCE) is also present, but generally at lower concentrations than the other chlorinated ethenes.
The source of contamination in AOC 2, located in the vicinity of Area 18C – Building 256 Ramp Area, was largely removed during soil excavations performed in 1998 and 2002.
Post-excavation sampling indicated the presence of residual contaminated soil. However, TCE concentrations in groundwater at monitoring well MW-114 (the well immediately downgradient of the former source area) have decreased over an order of magnitude, from 2,900 µg/L in July 1998 to 94.9 µg/L in March 2007. Based on the recent downward trend in groundwater contaminant concentrations at this monitoring well, it appears that the soil remediation was largely successful. These results are corroborated by the sample results from the AOC 2 treatability study and delineation field efforts conducted from October 2004 through March 2005 by USACE, which indicate minimal residual TCE concentrations (non detect to a maximum of 35 mg/kg) of volatile organic compounds (VOCs) in soil near the Ramp Area (Weston 2008).
In July 2002, Weston submitted a Draft Final Natural Attenuation Report (NAR) for the former Arsenal to the NJDEP. This report provided evidence that monitored natural attenuation (MNA) of groundwater VOCs (primarily TCE and tetrachloroethene [PCE]) and explosives contamination is a feasible groundwater remedial alternative at the former Arsenal. The NJDEP submitted review comments on the Draft Final NAR on 12 March 2003, conditionally approving the document pending incorporation of the NJDEP comments.
Following the NJDEP March 2003 comment letter, additional groundwater investigation activities and evaluations of potential vapor intrusion pathways were conducted in association with Groundwater AOC 2. The activities included:
• Performing an initial assessment of 14 buildings associated with groundwater AOC 2. Collection of indoor air and subslab soil gas sampling.
• Installing a pilot test subslab vapor depressurization/vapor extraction system at Building 165 (August 2003).

Final Remedial Action Report Project No. 108797 Building 165 and Area 18 C Groundwater Treatment Pilot Systems November 2010
2-2
• Collecting additional groundwater data as described in the Final Groundwater AOC Delineation Work Plan and Site-Specific Sampling and Analysis Plan and the Draft Groundwater AOC 2 Treatability Study and Delineation Work Plan Addendum (Work Plan Addendum), both dated October 2004, and the Groundwater AOC 2 Treatability Testing - Vertical Profiling Scope of Work (Vertical Profiling SOW) dated March 2005.
• Conducting a field screening investigation utilizing a membrane interface probe (MIP) in the vicinity of the former identified source area (Area 18C - Building 256 Ramp Area) as described in the Work Plan Addendum.
• Collecting soil and groundwater samples associated with groundwater AOC for preliminary bench-scale treatability testing performed by Shaw in March 2007.
Through these subsequent investigations, residual contamination has been found to be present in the groundwater within and downgradient of the former source area, including the 165 Fieldcrest Avenue Area. Elevated concentrations of sub-slab vapors under Building 165 and other buildings (currently being captured by sub-slab vapor mitigation systems) have necessitated the need to treat the groundwater in AOC 2.
A complete summary of the background and history of the investigations performed at AOC 2 is included in the Phase 1 Groundwater RAWP, Groundwater AOC 2 Treatability Study (Weston, 2006).
2.2 Laboratory Treatability Studies Treatability testing was performed on soils and groundwater collected from the two pilot test locations. For the first set of studies, soil core was collected using 2-inch split spoons while performing hollow stem auger drilling within the former source area. The sampling location was approximately 50 feet northwest of monitoring well MW-114 (the borehole was used for the installation of monitoring well MW-114A). Groundwater for the first set of studies was collected from monitoring well MW-114. For the second set of studies, soil cores were collected using direct-push drilling techniques from within the core of the plume, near the northeast corner of Building 165 (immediately adjacent to MW-165), and groundwater was collected from monitoring well MW-165.
The following treatability testing was performed at Shaw’s Knoxville, Tennessee laboratories on soils and groundwater collected from both areas:
• In situ chemical oxidation (ISCO) using permanganate,
• ISCO using Persulfate (with chelated iron catalyst),
Final Remedial Action Report Project No. 108797 Building 165 and Area 18 C Groundwater Treatment Pilot Systems November 2010
2-3
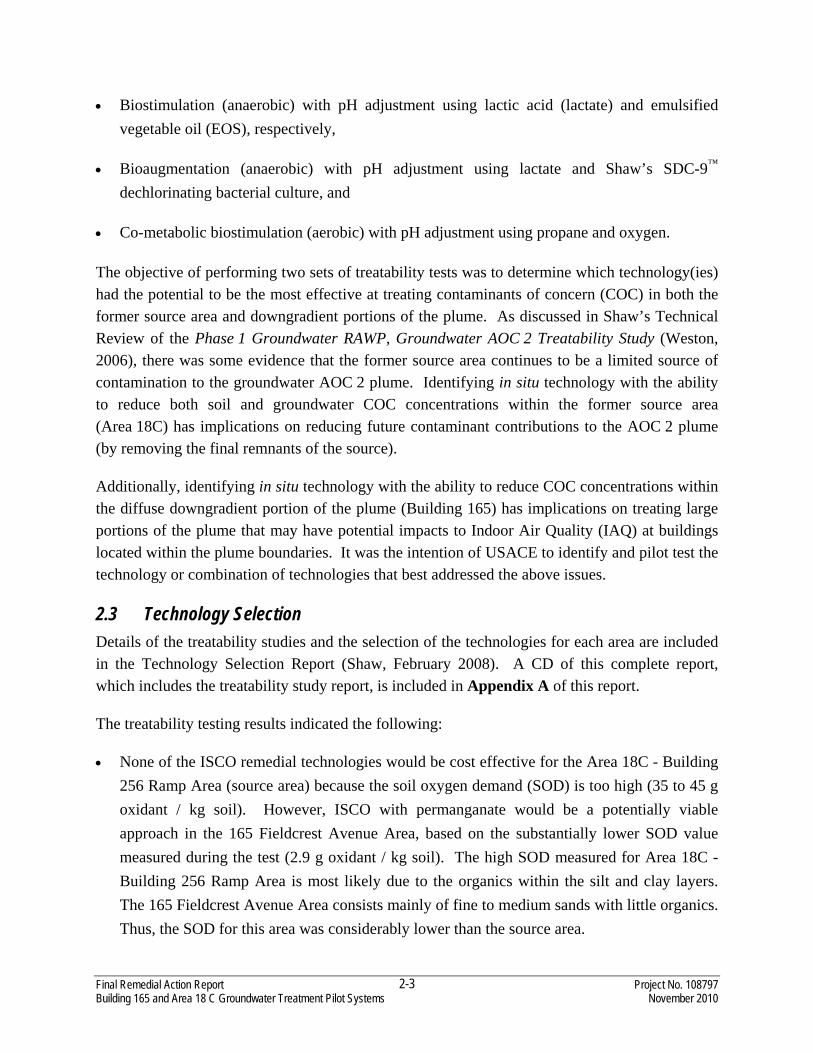
• Biostimulation (anaerobic) with pH adjustment using lactic acid (lactate) and emulsified vegetable oil (EOS), respectively,
• Bioaugmentation (anaerobic) with pH adjustment using lactate and Shaw’s SDC-9™ dechlorinating bacterial culture, and
• Co-metabolic biostimulation (aerobic) with pH adjustment using propane and oxygen.
The objective of performing two sets of treatability tests was to determine which technology(ies) had the potential to be the most effective at treating contaminants of concern (COC) in both the former source area and downgradient portions of the plume. As discussed in Shaw’s Technical Review of the Phase 1 Groundwater RAWP, Groundwater AOC 2 Treatability Study (Weston, 2006), there was some evidence that the former source area continues to be a limited source of contamination to the groundwater AOC 2 plume. Identifying in situ technology with the ability to reduce both soil and groundwater COC concentrations within the former source area (Area 18C) has implications on reducing future contaminant contributions to the AOC 2 plume (by removing the final remnants of the source).
Additionally, identifying in situ technology with the ability to reduce COC concentrations within the diffuse downgradient portion of the plume (Building 165) has implications on treating large portions of the plume that may have potential impacts to Indoor Air Quality (IAQ) at buildings located within the plume boundaries. It was the intention of USACE to identify and pilot test the technology or combination of technologies that best addressed the above issues.
2.3 Technology Selection Details of the treatability studies and the selection of the technologies for each area are included in the Technology Selection Report (Shaw, February 2008). A CD of this complete report, which includes the treatability study report, is included in Appendix A of this report.
The treatability testing results indicated the following:
• None of the ISCO remedial technologies would be cost effective for the Area 18C - Building 256 Ramp Area (source area) because the soil oxygen demand (SOD) is too high (35 to 45 g oxidant / kg soil). However, ISCO with permanganate would be a potentially viable approach in the 165 Fieldcrest Avenue Area, based on the substantially lower SOD value measured during the test (2.9 g oxidant / kg soil). The high SOD measured for Area 18C - Building 256 Ramp Area is most likely due to the organics within the silt and clay layers. The 165 Fieldcrest Avenue Area consists mainly of fine to medium sands with little organics. Thus, the SOD for this area was considerably lower than the source area.

Final Remedial Action Report Project No. 108797 Building 165 and Area 18 C Groundwater Treatment Pilot Systems November 2010
2-4
• Anaerobic biostimulation with pH adjustment was determined not to be an effective in situ groundwater treatment technology for either area.
• Anaerobic bioaugmentation with pH adjustment was determined to be a viable in situ groundwater treatment technology for both Areas.
• Co-metabolic (aerobic) biostimulation with pH adjustment was determined not to be a potentially viable in situ groundwater treatment technology for either area.
Based on the results of the treatability studies and other considerations, two separate pilot studies were selected to be performed for the AOC 2 groundwater plume. These pilot studies include anaerobic bioaugmentation with Shaw’s SDC-9 culture and pH adjustment in Area 18C and ISCO with potassium permanganate at the 165 Fieldcrest Avenue Area.
Final Remedial Action Report Project No. 108797 Building 165 and Area 18 C Groundwater Treatment Pilot Systems November 2010
3-1
3.0 Remedial Action Work Plan
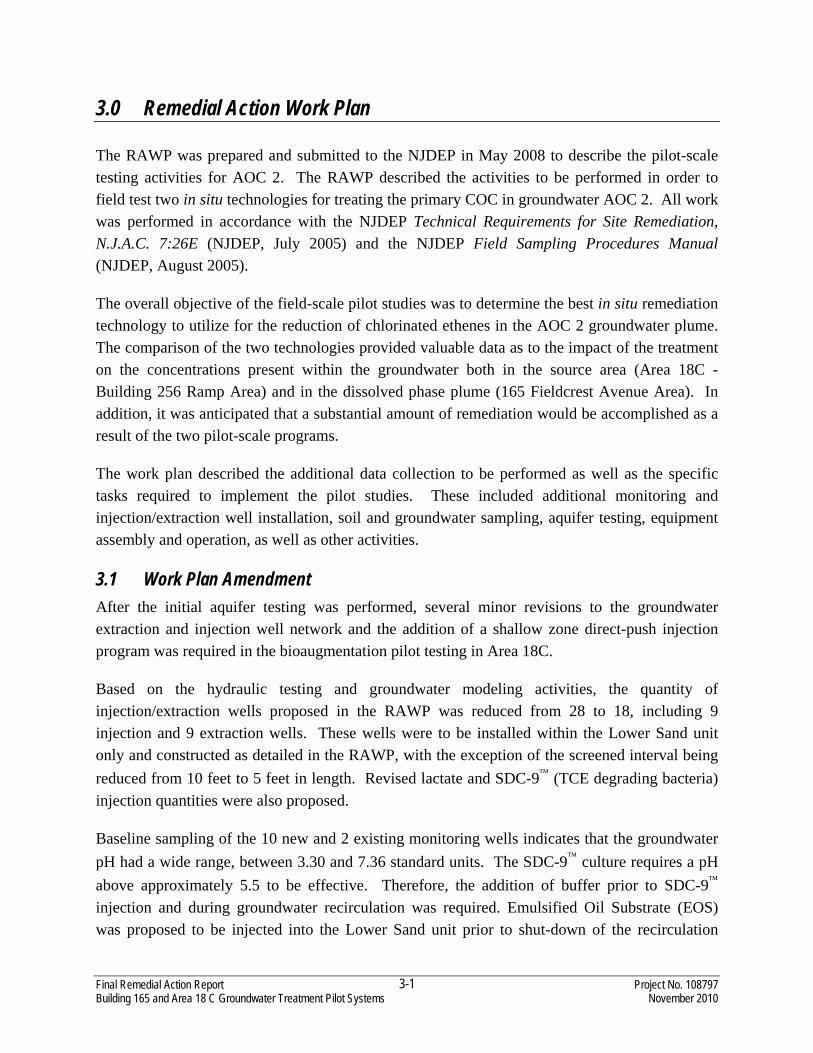
The RAWP was prepared and submitted to the NJDEP in May 2008 to describe the pilot-scale testing activities for AOC 2. The RAWP described the activities to be performed in order to field test two in situ technologies for treating the primary COC in groundwater AOC 2. All work was performed in accordance with the NJDEP Technical Requirements for Site Remediation, N.J.A.C. 7:26E (NJDEP, July 2005) and the NJDEP Field Sampling Procedures Manual (NJDEP, August 2005).
The overall objective of the field-scale pilot studies was to determine the best in situ remediation technology to utilize for the reduction of chlorinated ethenes in the AOC 2 groundwater plume. The comparison of the two technologies provided valuable data as to the impact of the treatment on the concentrations present within the groundwater both in the source area (Area 18C - Building 256 Ramp Area) and in the dissolved phase plume (165 Fieldcrest Avenue Area). In addition, it was anticipated that a substantial amount of remediation would be accomplished as a result of the two pilot-scale programs.
The work plan described the additional data collection to be performed as well as the specific tasks required to implement the pilot studies. These included additional monitoring and injection/extraction well installation, soil and groundwater sampling, aquifer testing, equipment assembly and operation, as well as other activities.
3.1 Work Plan Amendment After the initial aquifer testing was performed, several minor revisions to the groundwater extraction and injection well network and the addition of a shallow zone direct-push injection program was required in the bioaugmentation pilot testing in Area 18C.
Based on the hydraulic testing and groundwater modeling activities, the quantity of injection/extraction wells proposed in the RAWP was reduced from 28 to 18, including 9 injection and 9 extraction wells. These wells were to be installed within the Lower Sand unit only and constructed as detailed in the RAWP, with the exception of the screened interval being reduced from 10 feet to 5 feet in length. Revised lactate and SDC-9 (TCE degrading bacteria) injection quantities were also proposed.
Baseline sampling of the 10 new and 2 existing monitoring wells indicates that the groundwater pH had a wide range, between 3.30 and 7.36 standard units. The SDC-9 culture requires a pH above approximately 5.5 to be effective. Therefore, the addition of buffer prior to SDC-9 injection and during groundwater recirculation was required. Emulsified Oil Substrate (EOS) was proposed to be injected into the Lower Sand unit prior to shut-down of the recirculation
Final Remedial Action Report Project No. 108797 Building 165 and Area 18 C Groundwater Treatment Pilot Systems November 2010
3-2
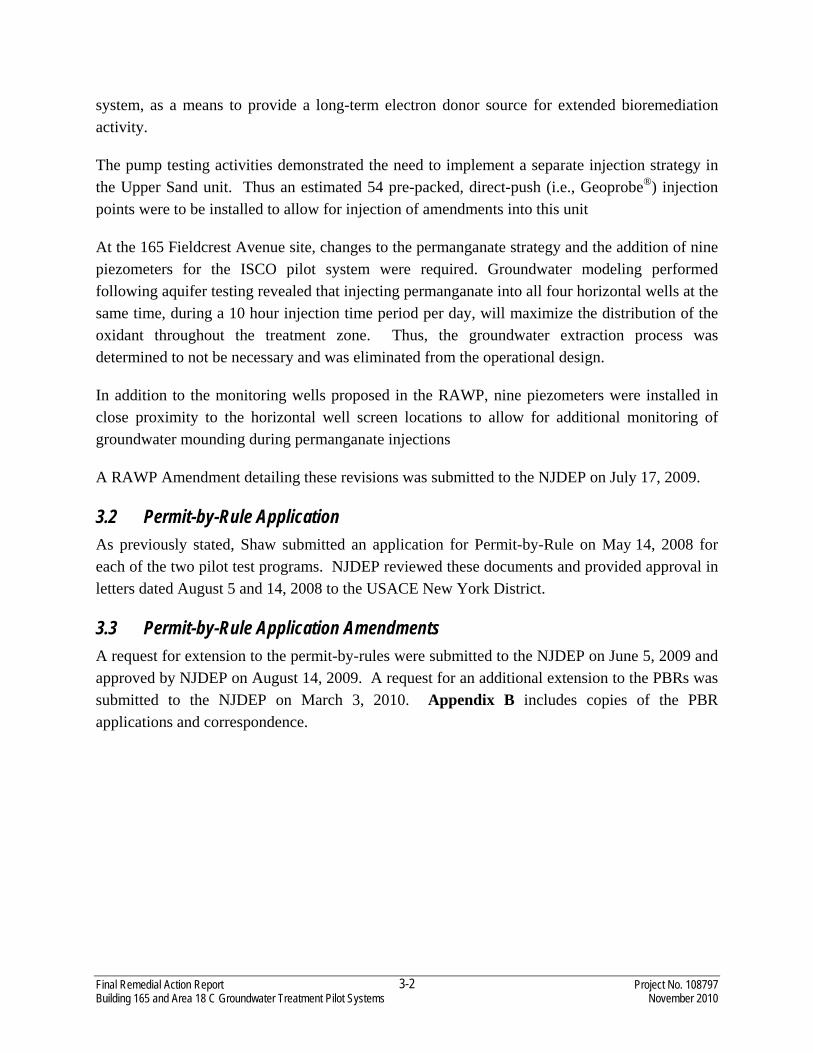
system, as a means to provide a long-term electron donor source for extended bioremediation activity.
The pump testing activities demonstrated the need to implement a separate injection strategy in the Upper Sand unit. Thus an estimated 54 pre-packed, direct-push (i.e., Geoprobe®) injection points were to be installed to allow for injection of amendments into this unit
At the 165 Fieldcrest Avenue site, changes to the permanganate strategy and the addition of nine piezometers for the ISCO pilot system were required. Groundwater modeling performed following aquifer testing revealed that injecting permanganate into all four horizontal wells at the same time, during a 10 hour injection time period per day, will maximize the distribution of the oxidant throughout the treatment zone. Thus, the groundwater extraction process was determined to not be necessary and was eliminated from the operational design.
In addition to the monitoring wells proposed in the RAWP, nine piezometers were installed in close proximity to the horizontal well screen locations to allow for additional monitoring of groundwater mounding during permanganate injections
A RAWP Amendment detailing these revisions was submitted to the NJDEP on July 17, 2009.
3.2 Permit-by-Rule Application As previously stated, Shaw submitted an application for Permit-by-Rule on May 14, 2008 for each of the two pilot test programs. NJDEP reviewed these documents and provided approval in letters dated August 5 and 14, 2008 to the USACE New York District.
3.3 Permit-by-Rule Application Amendments A request for extension to the permit-by-rules were submitted to the NJDEP on June 5, 2009 and approved by NJDEP on August 14, 2009. A request for an additional extension to the PBRs was submitted to the NJDEP on March 3, 2010. Appendix B includes copies of the PBR applications and correspondence.
Final Remedial Action Report Project No. 108797 Building 165 and Area 18 C Groundwater Treatment Pilot Systems November 2010
4-1
4.0 165 Fieldcrest Avenue Pre-Design Activities
Pilot testing pre-design activities included installing monitoring wells, sampling groundwater and soils, completing topographic and geophysical surveys, aquifer testing, and computer modeling. These activities are described below.
4.1 Geoprobe® Sampling A Geoprobe® (direct-push) investigation was conducted during the first two weeks of April 2008. The purpose of this investigation was to improve delineation of the stratigraphy, and to further evaluate the vertical and lateral contaminant distribution in the proposed pilot test area. The Geoprobe® investigation data were used to improve the conceptual site hydrogeologic model, and verify the selected treatment interval. Information obtained from this investigation was used to optimize/verify well screen intervals for the injection/extraction and monitoring wells, and confirm that injection/extraction wells were placed in the core of the TCE plume.
Soil samples were collected from five locations (165-GP-S1 through 165-GP-S5). Continuous soil core samples for lithologic evaluation were collected from each boring to a depth of approximately 12 to 16 feet below ground surface (bgs) using a Geoprobe® MacroCore closed-piston sampler lined with acetate sleeves. Soil cores were screened for volatile organic compounds (VOC) using a photo-ionization detector (PID) and logged by a qualified Shaw geologist. The boring logs are contained in Appendix C.
Fifty-one groundwater samples were collected from 28 locations (165-GP-GW1 through 165-GP-MW-28), located throughout the proposed pilot test area. With the exception of location 165-GP-GW7, two discrete groundwater samples were collected at each location using a Geoprobe® groundwater sampler. The first sample was collected within the approximate top 3 feet of the water table (approximately 4 to 7 feet bgs), and the second sample was collected within the approximate three feet of saturated overburden directly overlying the confining clay unit (approximately 8 to 11 feet bgs) known as the “Fire Clay”. Sampling depths were based on the lithology observed during the continuous soil coring. Samples were analyzed for VOC. Figure 4.1 shows the location of the Geoprobe® sample points and analytical results.
4.2 Topographic Survey A topographic survey was completed by Zenith Nadir Professional Land Surveyors, Inc. on May 15, 2008 and a partial site topographic map transmitted to Shaw on May 16, 2008. Included in the survey were elevations and coordinates of the Geoprobe® sampling points and existing monitoring wells.

Final Remedial Action Report Project No. 108797 Building 165 and Area 18 C Groundwater Treatment Pilot Systems November 2010
4-2
4.3 Geophysical Survey A subsurface geophysical survey was completed by EnviroPhysics, Inc. and a Subsurface Delineation Report prepared for Shaw on May 2, 2008. The survey was conducted to locate underground utilities and included electromagnetic conductivity, ground-penetrating radar, magnetometer, and utility line tracing. The report is presented in Appendix D.
4.4 Monitoring Well Installation Monitoring wells MW-307 through MW-315 were installed during the period from May 7 through May 9, 2008. Two inch polyvinyl chloride (PVC) casing and screen were used to complete the monitoring wells. All wells were completed with flush mount well vaults and 10 feet of 10-slot screen. The wells were surveyed for location and elevation and boring logs and well completion diagrams prepared. The boring logs and completions diagrams are presented in Appendix E. The locations of the monitoring wells are shown on Figure 4.2.
4.5 Aquifer Testing Aquifer testing was conducted, and groundwater elevations and saturated thickness were determined for the treatment zone. These tests were then input into a computer model to determine the injection system design parameters.
4.5.1 Pumping Test An aquifer pumping test was conducted on May 15, 2008. Monitoring well MW-310 was used as the pumping well and MW-165-1 and MW-307 through MW-315 were monitored during the pumping test. The pumping rate averaged approximately 1.7 gallons per minute (gpm) and the test period was approximately 6 hours with one hour of recovery monitoring. The test results were analyzed using the computer software AQTESOLVE to determine aquifer hydraulic conductivity and other parameters. The pumping test results (radius of influence, extraction rate, hydraulic conductivity, anisotropy ratio) were then used as initial input to the groundwater flow model.
4.5.2 Slug Tests Rising and falling head slug tests were performed in monitoring well MW-165-1 on June 3, 2008. The results of the slug tests were then analyzed using the computer software AQTESOLVE to determine aquifer hydraulic conductivity values. The aquifer hydraulic conductivity values were then used as initial input for the site groundwater flow model.
Final Remedial Action Report Project No. 108797 Building 165 and Area 18 C Groundwater Treatment Pilot Systems November 2010
4-3
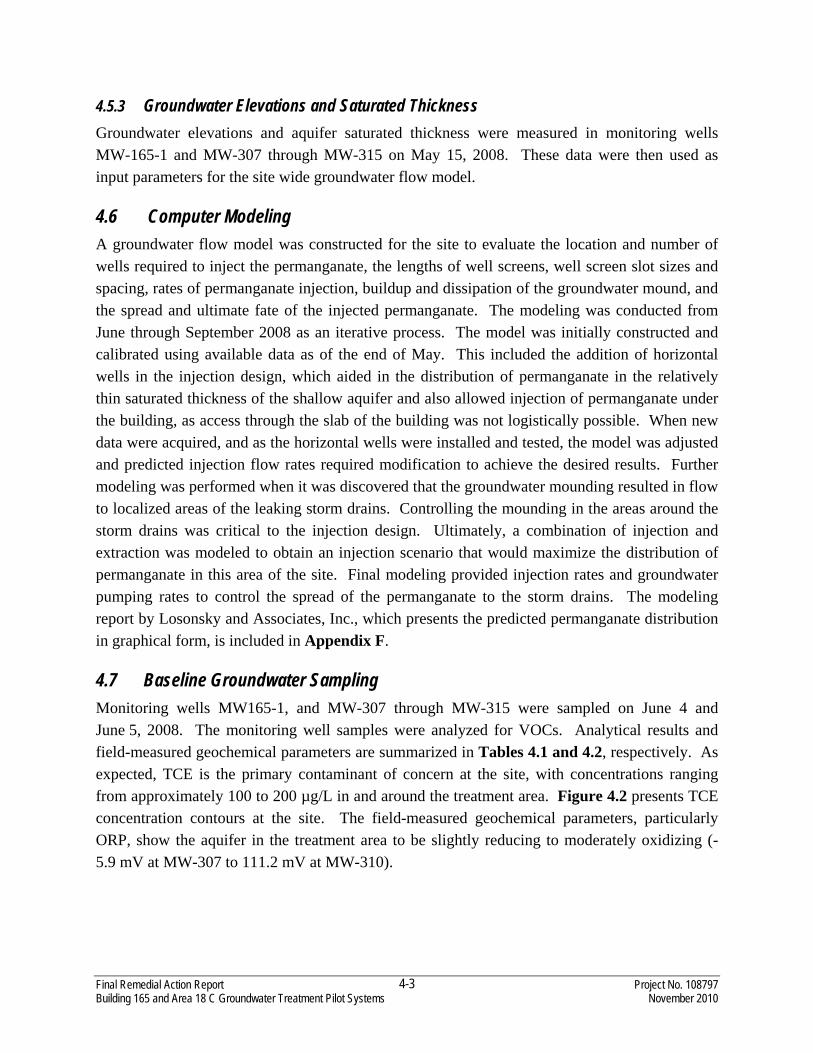
4.5.3 Groundwater Elevations and Saturated Thickness Groundwater elevations and aquifer saturated thickness were measured in monitoring wells MW-165-1 and MW-307 through MW-315 on May 15, 2008. These data were then used as input parameters for the site wide groundwater flow model.
4.6 Computer Modeling A groundwater flow model was constructed for the site to evaluate the location and number of wells required to inject the permanganate, the lengths of well screens, well screen slot sizes and spacing, rates of permanganate injection, buildup and dissipation of the groundwater mound, and the spread and ultimate fate of the injected permanganate. The modeling was conducted from June through September 2008 as an iterative process. The model was initially constructed and calibrated using available data as of the end of May. This included the addition of horizontal wells in the injection design, which aided in the distribution of permanganate in the relatively thin saturated thickness of the shallow aquifer and also allowed injection of permanganate under the building, as access through the slab of the building was not logistically possible. When new data were acquired, and as the horizontal wells were installed and tested, the model was adjusted and predicted injection flow rates required modification to achieve the desired results. Further modeling was performed when it was discovered that the groundwater mounding resulted in flow to localized areas of the leaking storm drains. Controlling the mounding in the areas around the storm drains was critical to the injection design. Ultimately, a combination of injection and extraction was modeled to obtain an injection scenario that would maximize the distribution of permanganate in this area of the site. Final modeling provided injection rates and groundwater pumping rates to control the spread of the permanganate to the storm drains. The modeling report by Losonsky and Associates, Inc., which presents the predicted permanganate distribution in graphical form, is included in Appendix F.
4.7 Baseline Groundwater Sampling Monitoring wells MW165-1, and MW-307 through MW-315 were sampled on June 4 and June 5, 2008. The monitoring well samples were analyzed for VOCs. Analytical results and field-measured geochemical parameters are summarized in Tables 4.1 and 4.2, respectively. As expected, TCE is the primary contaminant of concern at the site, with concentrations ranging from approximately 100 to 200 µg/L in and around the treatment area. Figure 4.2 presents TCE concentration contours at the site. The field-measured geochemical parameters, particularly ORP, show the aquifer in the treatment area to be slightly reducing to moderately oxidizing (-5.9 mV at MW-307 to 111.2 mV at MW-310).
Final Remedial Action Report Project No. 108797 Building 165 and Area 18 C Groundwater Treatment Pilot Systems November 2010
5-1
5.0 165 Fieldcrest Avenue Pilot System Installation and Operation
The major activities associated with the installation and operation of the ISCO pilot test at the 165 Fieldcrest Avenue Area included the following:
Installation of Injection Wells and Piezometers Pilot Test System Construction Pilot Test System Functional Testing and Design Modification Pilot Test System Operation Post Injection Groundwater Monitoring
Each of these activities is discussed in detail within the following sections.
5.1 Installation of Injection Wells and Piezometers The pilot test system design called for the installation of four horizontal and six vertical injection wells, along with nine small diameter piezometers for water level monitoring and permanganate distribution during and after injection activities. Well permits for the construction and/or use of injection wells and piezometers were obtained by the driller responsible for installing the points from the NJDEP’s Bureau of Water Allocation prior to installation activities, as required. Two drilling contractors were subcontracted to Shaw to install the wells/piezometers. A subcontractor specializing in horizontal drilling was subcontracted to install the four horizontal injection wells, while a second drilling subcontractor was procured to install the vertical injection wells and piezometers. Table 5.1 summarizes the well construction details for all the wells and piezometers installed at 165 Fieldcrest Avenue. Appendix G includes the horizontal well documentation. Appendix H includes the well permit and Form A/B for each well and piezometer installed.
5.1.1 Utility and Subsurface Geophysical Survey Prior to drilling activities, the locations of the injection wells and piezometers were identified and marked in the field and a utility and subsurface geophysical survey was conducted to identify underground service lines within or near the installation sites. Although this survey was completed, both a utility and unexploded ordinance (UXO) clearance at each proposed location was performed prior to installation. An air knife rig was used to clear 1-foot intervals down to 5 feet bgs, with a magnetometer being utilized to scan for UXO at each of the 1-foot intervals.
5.1.2 Horizontal Injection Well Installation Four horizontal injection wells were installed to a depth of approximately 11 to 13 feet bgs (1 to 2 feet above the clay) to sufficiently distribute oxidant to the core of the treatment zone and under the building. Directed Technologies Drilling, Inc. (DTD) of Julian, Pennsylvania was
Final Remedial Action Report Project No. 108797 Building 165 and Area 18 C Groundwater Treatment Pilot Systems November 2010
5-2
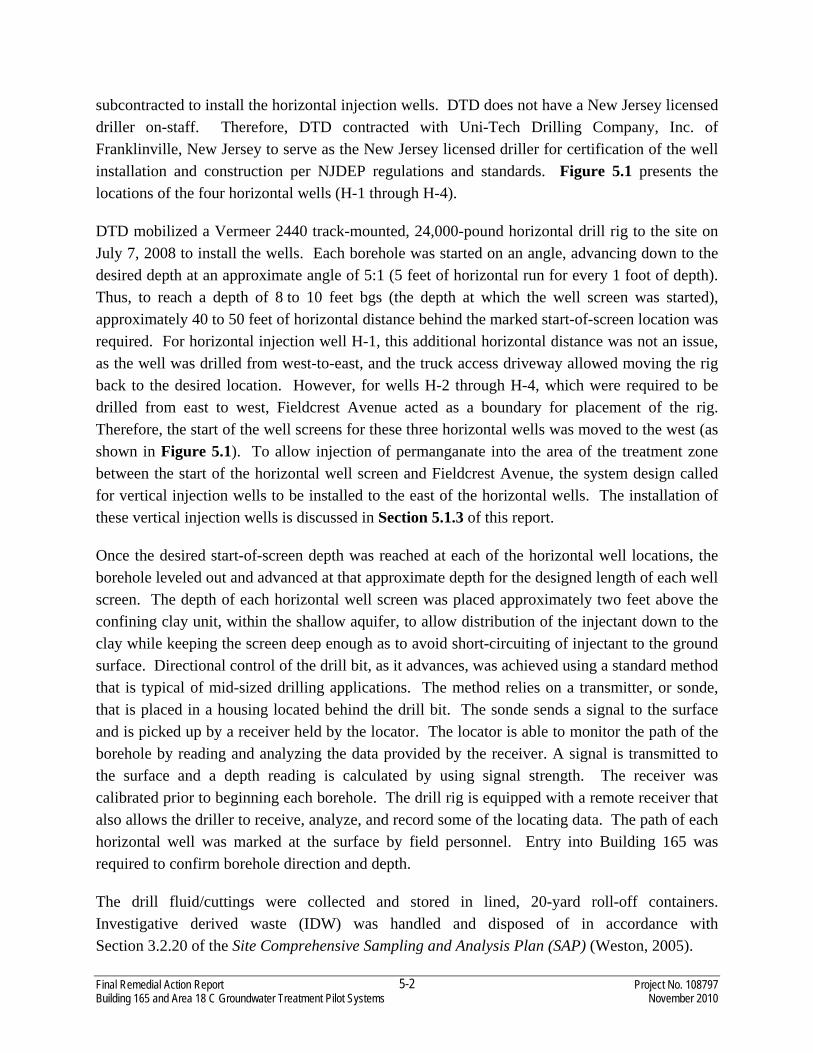
subcontracted to install the horizontal injection wells. DTD does not have a New Jersey licensed driller on-staff. Therefore, DTD contracted with Uni-Tech Drilling Company, Inc. of Franklinville, New Jersey to serve as the New Jersey licensed driller for certification of the well installation and construction per NJDEP regulations and standards. Figure 5.1 presents the locations of the four horizontal wells (H-1 through H-4).
DTD mobilized a Vermeer 2440 track-mounted, 24,000-pound horizontal drill rig to the site on July 7, 2008 to install the wells. Each borehole was started on an angle, advancing down to the desired depth at an approximate angle of 5:1 (5 feet of horizontal run for every 1 foot of depth). Thus, to reach a depth of 8 to 10 feet bgs (the depth at which the well screen was started), approximately 40 to 50 feet of horizontal distance behind the marked start-of-screen location was required. For horizontal injection well H-1, this additional horizontal distance was not an issue, as the well was drilled from west-to-east, and the truck access driveway allowed moving the rig back to the desired location. However, for wells H-2 through H-4, which were required to be drilled from east to west, Fieldcrest Avenue acted as a boundary for placement of the rig. Therefore, the start of the well screens for these three horizontal wells was moved to the west (as shown in Figure 5.1). To allow injection of permanganate into the area of the treatment zone between the start of the horizontal well screen and Fieldcrest Avenue, the system design called for vertical injection wells to be installed to the east of the horizontal wells. The installation of these vertical injection wells is discussed in Section 5.1.3 of this report.
Once the desired start-of-screen depth was reached at each of the horizontal well locations, the borehole leveled out and advanced at that approximate depth for the designed length of each well screen. The depth of each horizontal well screen was placed approximately two feet above the confining clay unit, within the shallow aquifer, to allow distribution of the injectant down to the clay while keeping the screen deep enough as to avoid short-circuiting of injectant to the ground surface. Directional control of the drill bit, as it advances, was achieved using a standard method that is typical of mid-sized drilling applications. The method relies on a transmitter, or sonde, that is placed in a housing located behind the drill bit. The sonde sends a signal to the surface and is picked up by a receiver held by the locator. The locator is able to monitor the path of the borehole by reading and analyzing the data provided by the receiver. A signal is transmitted to the surface and a depth reading is calculated by using signal strength. The receiver was calibrated prior to beginning each borehole. The drill rig is equipped with a remote receiver that also allows the driller to receive, analyze, and record some of the locating data. The path of each horizontal well was marked at the surface by field personnel. Entry into Building 165 was required to confirm borehole direction and depth.
The drill fluid/cuttings were collected and stored in lined, 20-yard roll-off containers. Investigative derived waste (IDW) was handled and disposed of in accordance with Section 3.2.20 of the Site Comprehensive Sampling and Analysis Plan (SAP) (Weston, 2005).

Final Remedial Action Report Project No. 108797 Building 165 and Area 18 C Groundwater Treatment Pilot Systems November 2010
5-3
Once the borehole was drilled to the designed length, the drill rods were retracted and construction of the well began. The drilling fluid is specially designed to keep the borehole open as the drill rods are extracted. Each well was constructed of 2-inch diameter fiberglass reinforced epoxy pipe. The screened interval contained three slots per foot for H-1, H-2, and H-3 and four slots per foot for H-4, each cut 90 degrees from the previous slot along the length. Each 10-foot length of pipe/screen was threaded to the previous and pushed (by hand) into the open borehole. The final total length of each well, along with the screen lengths, depths, and construction details, are contained in DTD’s final well installation report, dated August 12, 2008 (presented in Appendix G).
The well development process at each location began immediately upon well installation. For these single-ended well installations, the procedure began by pumping water directly into the installed well. This forced both drilling fluid and fresh water up and out the annulus of the borehole. This fluid/water mix was pumped to the lined roll-offs for disposal. Once the drilling fluid had been displaced along the annulus, the well screen was jet washed using a jetting assembly attached to a 1-inch coil of high density polyethylene pipe and a solution of Aqua-Clear® (a polymer dispersant for removing drilling fluid and sediment from the producing formation). The well was then flushed again using fresh water, forcing any remaining fluid up the annulus. The annulus of each borehole was then tremie-grouted to establish a competent seal. The tremie was inserted as far into the annulus as possible (prior to reaching the start of the screen). The borehole annulus was filled with a cement-bentonite grout until the grout flowed from the borehole at the ground surface.
Upon completion of well development activities, a flush-mount concrete-fiberglass composite road box measuring approximately 2-feet by 3-feet by 2-feet deep was installed at each well location. For well H-1, a heavy traffic rated vault was installed on a 6-inch reinforced concrete footing, due to the truck traffic in that portion of the driveway. Fill was placed and compacted from the footing up to within 6 inches of the ground surface. A reinforced concrete apron was then poured around the vault.
Horizontal well installation activities were completed and DTD demobilized all equipment from the site on July 15, 2008.
5.1.3 Vertical Injection Well and Piezometer Installation Six vertical injection wells were installed to a depth of approximately 15 feet bgs (just above the clay) to sufficiently distribute oxidant to the core of the treatment zone to the east of the horizontal well screens at locations H-2 through H-4 (as briefly discussed in the previous section). In addition, nine piezometers were installed along the horizontal well screens to gauge water table mounding and permanganate distribution during injection activities. SGS Environmental Services, Inc. (SGS) of West Creek, New Jersey, a New Jersey licensed well

Final Remedial Action Report Project No. 108797 Building 165 and Area 18 C Groundwater Treatment Pilot Systems November 2010
5-4
driller, was subcontracted to install the vertical injection wells and piezometers. Figure 5.1 presents the locations of the six vertical injection wells (165-IW-1 through 165-IW-6) and the nine piezometers (PZ-300 through PZ-308).
SGS mobilized a Geoprobe® 6620 DT track-mounted drill rig to the site on July 22, 2008 to install the wells. The vertical injection wells and piezometers were installed using hollow stem auger drilling methods. The injection well casings were constructed using flush-threaded, 4-inch diameter, Schedule 40, PVC. Each well was installed using 5 feet of 0.020-inch slotted PVC screen. The filter pack for each injection well extends to 1 foot above the top of screen. A bentonite seal was placed to 2.5 feet above the filter pack, followed by a cement-bentonite grout to just below ground surface, where each well was completed with a flush-mount road box embedded in a 2-foot by 2-foot concrete pad. Each well was developed until the purge water ran clear.
A majority of the piezometers are located in the asphalt parking lot/driveway of the site. Therefore, SGS was required to core an 8-inch hole at these locations. Upon completion of coring, a 4.25-inch hollow stem auger was used to advance the borehole at each location. The casing of each piezometer was constructed using flush-threaded, 1-inch diameter, Schedule 40, PVC. Each piezometer was installed using 5 feet of 0.010-inch slotted PVC screen. The filter pack for each piezometer extends to 1 foot above the top of screen. A bentonite seal was placed from the top of the filter pack to just below ground surface, where each well was completed with a flush-mount road box embedded in concrete. Each piezometer was developed until the purge water ran clear.
IDW was handled and disposed of in accordance with Section 3.2.20 of the Site Comprehensive SAP (Weston, 2005). Vertical injection well and piezometer installation activities were completed and SGS demobilized all equipment from the site on July 25, 2008. Boring Logs and well construction diagrams are included in Appendix H.
5.1.4 Well Survey Activities After the installation of all injection wells and piezometers, the existing topographic map of the Site was field verified and updated to include the new wells. Zenith Nadir Surveying, a New Jersey licensed surveyor, mobilized to the site on September 10, 2008 to survey each injection well and piezometer installed at the site.
5.2 Pilot Test System Construction Upon completion of well installation activities, equipment and materials for construction of the pilot test system were mobilized to the site. Figure 5.2 presents the layout of each system component at the site, while Figure 5.3 presents a generalized process flow diagram of the system. The major components of the injection system were two, 20,000-gallon mix tanks

Final Remedial Action Report Project No. 108797 Building 165 and Area 18 C Groundwater Treatment Pilot Systems November 2010
5-5
(supplied by Baker Tanks), the permanganate mixing skid (supplied by Carus Corporation), the permanganate filter/injection skid (supplied by Carus Corporation), the flow control manifold and meters, and the electrical generator and associated electrical control panel.
5.2.1 Electrical System Construction A WhisperWatt 220 kVA portable diesel generator was mobilized to the site to supply electrical power to all the components of the injection system. System power requirements included 480 volt, 3-phase power to the Carus mixing skid, the Carus filter/injection skid, and the two Baker mix tanks. The power of 120-volts was required to operate the flow meters at the injection manifold, as well as skid controls miscellaneous power tools and pumps.
An-Mar Electric of Hamilton, New Jersey was subcontracted to construct the electrical control panel and install all associated breakers and controls for the system equipment. This included four 480-volt breaker boxes, for the two Carus skids and the two Baker mix tanks, as well as a 120-volt breaker panel and a transformer to step-down to 120 volts from the 480-volt supply. An-Mar was also responsible for connecting the generator to the main breaker panel and wiring the six Badger flow meters to the system.
5.2.2 Permanganate Mixing System Construction The permanganate mixing portion of the pilot test system, as presented on Figure 5.3, consists of a water supply hose, the Carus mixing skid, and a Baker mix tank. To supply water for mixing, as well as emergency needs, approximately 700 feet of 3-inch, high pressure fire hose was run from a fire hydrant located at the northeast corner of the 20 Northfield Ave. building to the Carus mixing skid. The hydrant was used under permission from Federal Business Centers, who owns and operates the hydrant, as well as the building at 165 Fieldcrest Avenue. Several 50-foot sections of the fire hose were run along the ground from the hydrant, under the two sets of railway lines to the south of 165 Fieldcrest Avenue, across the southern driveway entrance to the 165 Fieldcrest Avenue parking lot using truck/traffic rated road crossings that allowed the water to flow though, and along the grassy area adjacent to Fieldcrest Avenue (see Figure 5.2). The hose terminated into a 3-inch Schedule 80 PVC pipe that ran around the Baker mix tanks and through a flow meter/totalizer prior to entering the Carus mixing skid.
The Carus mixing skid and the mix tanks were placed within a secondary containment berm to allow capture of any permanganate that might leak out during mixing activities. The skid allows one cycle bin, holding approximately 3,307 pounds of solid potassium permanganate, to be mixed at a time. Once the conical shaped cycle bin is placed on the skid, a gate valve is opened at the bottom of the bin, releasing the solid permanganate into a hopper on the skid. A screw-auger then transfers the solid to another hopper which feeds the solid into the process water line through a venturi-type induction process. The water in the process line moves due to a

Final Remedial Action Report Project No. 108797 Building 165 and Area 18 C Groundwater Treatment Pilot Systems November 2010
5-6
combination of the pressure supplied by the fire hydrant and centrifugal pump that is located on the skid. Once the permanganate has entered the process water line, the solution is directed to the mix tank through 2-inch, Schedule 40 PVC pipe. The mixers within the tank operate continuously during the mixing process to keep the solution in suspension, particularly during periods of cooler ambient temperatures.
5.2.3 Permanganate Injection System Construction The permanganate injection portion of the pilot test system, as presented on Figure 5.3, consists of the mix tank, the Carus filter/injection skid, a flow control manifold with digital flow meters, and the injection wells. The outlet port on the mix tank containing the permanganate solution is connected to the Carus filter/injection skid by 4-inch, Schedule 80 PVC pipe. The skid contains two centrifugal pumps (in parallel, one operating at a time) that pump solution water through four cartridge filter housings prior to discharge to the injection wells. The filter housings each contain fourteen, 7-inch long; 100 µm filters that filter out solids in the process stream prior to discharge. The flow from each of the housings then recombines and is directed to the flow control manifold through 3-inch, Schedule 80 PVC pipe. The manifold redirects the flow to the injection wells through six, 1-inch ports, each of which contain a flow control gate valve and a digital flow meter, and vinyl tubing. The vinyl tubing is run to the injection well head, which is fitted with a pressure gauge. The length of tubing that fed horizontal well H-1 was required to cross the northern truck driveway that leads to the loading dock areas of 165 Fieldcrest Avenue. Therefore, the tubing was placed within a 2-inch steel pipe that was long enough to span the driveway. An asphalt speed-bump was then constructed over the steel pipe to allow truck traffic to pass safely over the line without causing damage.
5.3 Pilot Test System Functional Testing 5.3.1 Initial Water Injection Testing Upon completion of system construction, functional testing of the system began. On August 3, 2008, fire hydrant water was pumped directly into Baker Tank No. 1 for the purposes of pressure testing all the injection lines and assessing the effects of injecting water at the design injection flows and pressures on the water table. Pressure Test No. 1 was begun by injecting clean hydrant water into the following injection wells at the design flow rates:
Pressure Test No. 1
H-1 H-2 H-3 H-4 165-IW-5 165-IW-6
11 gpm 8 gpm 8 gpm 10 gpm 1.8 gpm 1.8 gpm
These flow rates caused a quick rise in water table levels across the site, with the levels in the northwestern portion of the treatment zone (near PZ-300 through 302 and MW-308) coming

Final Remedial Action Report Project No. 108797 Building 165 and Area 18 C Groundwater Treatment Pilot Systems November 2010
5-7
close to the ground surface; and overflowing the casing at PZ-300. The low ground surface elevation in this portion of the site, compared to the remainder of the treatment area, coincides with shallow water table levels. Thus, it was evident that the injection flow rates to this area needed adjustment.
Subsequent tests were completed between August 8, 2008 and August 12, 2008, assessing the effects of different flow rates on the water table levels, mainly focusing on the northwest portion of the treatment area and the injection flow rates into H-1 and H-2. Through this testing, injection flow rates were achieved that would not cause the water table to rise significantly in this area. It was determined that a flow rate of 2.5 gpm into H-1 and H-2 was sufficient for water table rise control (with respect to not overflowing the top of the piezometer casings in this area).
However, it was also discovered during this testing that the stormwater catch basin near MW-308 was being affected by the injections. The increase in water table elevation caused an increase in the water flow through the catch basin. Therefore, it was suspected that the stormwater piping and catch basins in this area were compromised and in poor condition, allowing groundwater to infiltrate the system. Shaw and the USACE decided to conduct a video pipe survey of the stormwater system at the site, to assess the system’s condition and its potential to cause conveyance of injected water off-site.
5.3.2 Stormwater System Video Inspection Shaw mobilized a stormwater video inspection subcontractor, Video Pipe Services of Newfield, New Jersey, to the site on August 18, 2008 to video log the stormwater piping at the site. Figure 5.4 presents the stormwater system layout at the site, along with the catch basin numbering that corresponds to the video logging field assessment report (see Appendix I).
The stormwater flow in the northwestern portion of the treatment area runs from Catch Basin #1 to Catch Basin #3 through 12-inch reinforced concrete pipe. In the video log, observations of groundwater entering the pipe at the joints were observed, along with deposits along the joints indicative that water had been leaking in for a significant period of time. There was also observed groundwater infiltration at Catch Basin #2 and Catch Basin #3 through the side walls and poorly constructed patches within the basins. The stormwater from Catch Basin #3 is directed under the building through 18-inch cast iron pipe. This cast iron pipe seemed to be in excellent condition, with no visible groundwater infiltration along the entire run under the building to Catch Basin #4. The stormwater piping from the eastern parking lot at the site connects into catch Basin #4 as well, with the water then running to the west along the southern portion of the parking area and eventually to the south into the stormwater system on the property of 20 Northfield Avenue. The system piping in the eastern parking lot from Catch Basin #5 through to Catch Basin #4 was also video logged. The catch basins in this portion of

Final Remedial Action Report Project No. 108797 Building 165 and Area 18 C Groundwater Treatment Pilot Systems November 2010
5-8
the site were observed to again be compromised, though not seemingly to the extent that those in the northwestern portion of the treatment zone were.
The results of the video inspection resulted in an objective to keep permanganate in groundwater from entering stormwater system in the northwestern portion of the treatment area. Thus, additional groundwater modeling would be required to assess pumping (and potentially extraction) configurations that could achieve this goal.
5.3.3 Pilot Test System Operational Design Modifications Subsequent groundwater modeling indicated that a combination of groundwater extraction in the northwestern portion of the treatment area and a modified injection interval at H-1 could potentially keep the permanganate laden groundwater from reaching the stormwater piping and catch basins in the area. The modeling culminated in an operational redesign of the system, which included extracting groundwater from MW-308 and horizontal well H-2, and placing a well packer in H-1 and injecting permanganate to the eastern portion of the well only. This operational configuration was shown in the model to delay permanganate from reaching the area of the stormwater system, while the extraction from H-2 could enhance the distribution of permanganate between the eastern extent of H-1 and H-2.
To achieve this operational configuration, an inflatable packer was installed into H-1, approximately 100 feet from the western extent of the well (60 feet into the screened interval). The injection hose was piped directly to the packer, which contained a through pipe to allow injection of permanganate on the far side of the packer. A nitrogen gas cylinder was used to keep the packer inflated at all times. The cylinder was held to the concrete retaining wall adjacent to the H-1 well vault with concrete screws and metal strapping. The packer required approximately 40 to 50 pounds per square inch (psi) to inflate. Therefore, the design called for the packer to be inflated with 60 psi at all times. The design injection flow rate at this location was to be approximately 4.5 gpm.
For the groundwater extraction portion of the redesign, water was to be extracted from MW-308 and H-2. To accommodate the extracted groundwater from these locations, one of the two mix tanks was to be used as an extracted water collection tank. The water collected in this tank would be used to mix subsequent batches of permanganate. A 2-inch submersible pump was installed in the tank and piped into the water feed line to the Carus mixing skid. This would allow system operators to use either hydrant water or extracted groundwater to make up a batch of permanganate.
A 2-inch Grundfos pump was utilized to pump water from the MW-308 back to the groundwater extraction mix tank. A length of half-inch polyethylene tubing was run from the well to the mix
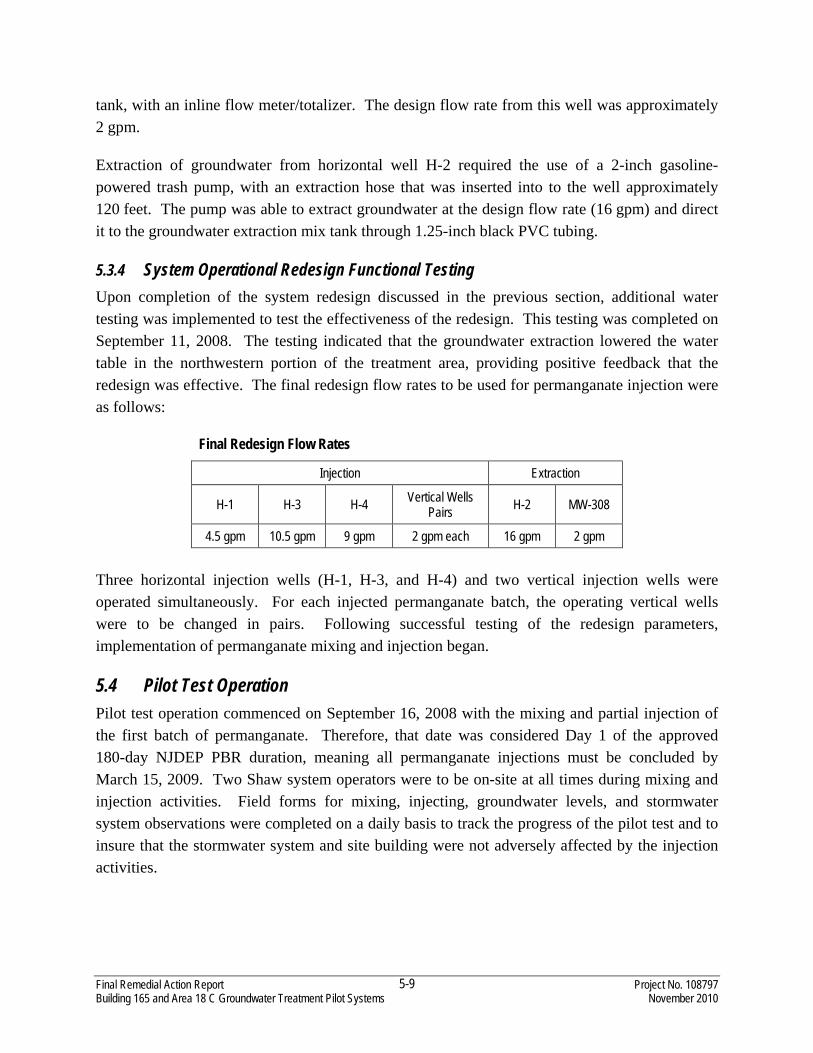
Final Remedial Action Report Project No. 108797 Building 165 and Area 18 C Groundwater Treatment Pilot Systems November 2010
5-9
tank, with an inline flow meter/totalizer. The design flow rate from this well was approximately 2 gpm.
Extraction of groundwater from horizontal well H-2 required the use of a 2-inch gasoline-powered trash pump, with an extraction hose that was inserted into to the well approximately 120 feet. The pump was able to extract groundwater at the design flow rate (16 gpm) and direct it to the groundwater extraction mix tank through 1.25-inch black PVC tubing.
5.3.4 System Operational Redesign Functional Testing Upon completion of the system redesign discussed in the previous section, additional water testing was implemented to test the effectiveness of the redesign. This testing was completed on September 11, 2008. The testing indicated that the groundwater extraction lowered the water table in the northwestern portion of the treatment area, providing positive feedback that the redesign was effective. The final redesign flow rates to be used for permanganate injection were as follows:
Final Redesign Flow Rates
Injection Extraction
H-1 H-3 H-4 Vertical Wells Pairs H-2 MW-308
4.5 gpm 10.5 gpm 9 gpm 2 gpm each 16 gpm 2 gpm Three horizontal injection wells (H-1, H-3, and H-4) and two vertical injection wells were operated simultaneously. For each injected permanganate batch, the operating vertical wells were to be changed in pairs. Following successful testing of the redesign parameters, implementation of permanganate mixing and injection began.
5.4 Pilot Test Operation Pilot test operation commenced on September 16, 2008 with the mixing and partial injection of the first batch of permanganate. Therefore, that date was considered Day 1 of the approved 180-day NJDEP PBR duration, meaning all permanganate injections must be concluded by March 15, 2009. Two Shaw system operators were to be on-site at all times during mixing and injection activities. Field forms for mixing, injecting, groundwater levels, and stormwater system observations were completed on a daily basis to track the progress of the pilot test and to insure that the stormwater system and site building were not adversely affected by the injection activities.

Final Remedial Action Report Project No. 108797 Building 165 and Area 18 C Groundwater Treatment Pilot Systems November 2010
5-10
5.4.1 Permanganate Batch Mixing The pilot test design called for the injection of 30 cycle bins of permanganate (approximately 99,210 pounds). According to the U.S. Department of Homeland Security (DHS), solid potassium permanganate is considered a regulated material if stored in quantities over 400 pounds. Therefore, Shaw and the USACE notified the DHS of our intent to store the 30 cycle bins on United States Environmental Protection Agency (USEPA) property, a secure facility, through notification ID No. 3055875. A map identifying the storage location is presented as Figure 5.5. This map also identifies the route Shaw operators were required to travel with a Rough Terrain – Boom Reach type forklift when transporting full bins to the site or empty bins back to the storage area.
The mixing process could be started once a full cycle bin was placed on top of the Carus mixing skid. Preliminary information on the bin was transferred to the Batch Mixing Form, including the Bin No., total weight (measured by a built-in scale on the mixing skid), and the tare weight (which gives an estimate of when the bin would be empty). The pilot test design calls for a 2.9 percent solution of permanganate to be injected into the subsurface, based mainly on the SOD value measured during the treatability testing (as discussed in the Technology Selection Report contained in Appendix A). Therefore, assuming that the weight of permanganate in each bin was 3,307 pounds, 13,250 gallons of water was required to mix each batch of solution. Water volume was measured at the flow totalizer in-line prior to the mixing skid. The calculated treatment zone oxidant demand, based on SOD value measured in the treatability study and the volume of the treatment zone, was 96,802 pounds of potassium permanganate. At the design injection concentration of 2.9 percent, approximately 388,000 gallons of water was to be mixed into solution and injected throughout the treatment area. This volume is approximately 40 percent of the calculated pore volume of the treatment zone.
Upon collection of the initial batch information, the butterfly valve at the base of the bin was opened, the skid feed water (either from the fire hydrant or the groundwater extraction tank) was turned on, and the skid motor controls were initiated. The screw-auger fed solid potassium permanganate into the process water line (as discussed in Section 5.2.2), which was pumped to the permanganate mix tank. Once the cycle bin was emptied, water was diverted around the mixing skid directly to the mix tank, as a higher flow rate could be achieved by by-passing the skid. Once the calculated volume of water was added to the mix tank, the injection process could begin.
5.4.2 Permanganate Batch Injection The permanganate batch injection process began by collecting flow totalizer readings from the flow meters leading to each injection and extraction wells. These values were written on the Injection Form along with other injection specific information. The pumps within the two

Final Remedial Action Report Project No. 108797 Building 165 and Area 18 C Groundwater Treatment Pilot Systems November 2010
5-11
extraction wells (MW-308 and H-2) were initiated and adjusted to the design flow rate (2 and 16 gpm, respectively). To start injecting, the butterfly valve on the mix tank outlet port was opened, the power to the injection skid pump was initiated, and the flow rate was adjusted to approximately 28 gpm (total design injection flow rate). Each control valve at the injection manifold was then adjusted to apply the appropriate flow to each injection well. Injection flows and pressures were monitored by Shaw operators on a routine basis. In addition, groundwater level measurements were collected on an hourly basis from all piezometers and select site monitoring wells. The Shaw operators also walked to all the stormwater system catch basins at the site several times per day to observe any potential changes in flow due to the injection activities. Once the entire batch was injected, the Injection Form was completed and preparations were made to begin mixing a new batch. A different pair of vertical injection wells would be used for injection on the next batch by disconnecting the hoses at the previously used wells and moving them to the next pair.
Injection activities continued as designed through September 30, 2008 (Batch No. 8). During injection activities for Batch No. 9, injection capacity for vertical injection wells 165-IW-1 and 165-IW-2 was diminished to the point where permanganate breached the ground surface. The operators had an earlier indication of this decrease in capacity as they observed an increase in injection pressure at these two wells. The short-term solution for the problem was to change the hoses to a new pair of wells and continue pumping. However, the surface seal and well vault/concrete pad for each of these two wells was dug out and replaced, to insure that short-circuiting of solution up the annulus of the well was not the cause of the surface break-through. Subsequent attempts to inject 2 gpm at these two wells failed with the same results, breaching of the surface. By Batch No. 13 (October 8, 2008) two additional vertical wells (165-IW-5 and 165-IW-6) failed in the same manner. Thus, a design change was made to run all the vertical injection wells at 1 to 1.5 gpm, to avoid surfacing of permanganate at these locations.
On October 13, 2008 (Batch No. 16) permanganate laden water was observed being pumped from extraction well MW-308. Extraction capacity diminished to less than 2 gpm at that time as well. Extraction flow at H-2 was increased by approximately 2 gpm to attempt to make up for capacity loss at MW-308. By October 23, 2008 (Batch 21) extraction capacity started to diminish in H-2 and permanganate laden water was observed discharging from the pump. Extraction flow significantly declined by October 31, 2008 (Batch No. 24), and permanganate laden water was observed in Catch Basin #2 shortly after injection activities were completed and the extraction well pumps were turned off for the day. Permanganate was not observed in Catch Basin #4, signifying that it was being consumed in the stormwater line prior to reaching this basin, and well before leaving the site.
On November 5, 2008, a conference call was held between representatives of the USACE and Shaw to discuss if/how injection activities were to continue. It was decided that additional

Final Remedial Action Report Project No. 108797 Building 165 and Area 18 C Groundwater Treatment Pilot Systems November 2010
5-12
injection would occur following a reconfiguration of the injection/extraction scenario. Injection of permanganate would occur at five of the vertical wells (165-IW-1 and 165-IW-3 through 165-IW-6), H-1, and H-2. MW-308 would continue to extract groundwater, in an attempt to protect the stormwater line. Over 17,000 gallons of permanganate were injected as Batch No. 25 (the additional volume is accounted for by the extracted volume from MW-308), with approximately 4,700 gallons of permanganate injected into H-2. Shortly after shut-down of the system, permanganate was again observed flowing in Catch Basin #2. A decision was made to discontinue injection activities and return the five unused cycle bins of permanganate to Carus for a refund.
Overall, 83,162 pounds of permanganate (336,294 gallons of solution) were injected into the subsurface. No issues affecting the injection rates/volumes into H-1, H-3, and H-4 were observed during the study. Table 5.2 presents a summary table of all operational mixing, injection and extraction data, along with injection totals.
5.4.3 System Teardown and Equipment Demobilization System teardown began immediately following the injection activities. The first step in the process was to clean the two mix tanks and the two Carus skids, removing any residual permanganate that was left in the units and the piping connecting the units. Hydrant water was used to clean the mix tanks and flush the skids and piping. This water was injected into the subsurface through H-3 and H-4, as it did contain trace amounts of permanganate. Once all equipment was clean, system teardown was initiated.
All hose connections to the injection/extraction wells were disconnected, and the well vaults were closed and bolted shut. The nitrogen gas cylinder that was purchased from AirGas was returned. The asphalt speed-bump was removed and the material was loaded in a roll-off container and disposed of appropriately. All system piping, valves, and flow meters that came in contact with permanganate were rinsed and thrown away as trash.
All equipment from the permanganate injection pilot test was demobilized from the site by November 25, 2008.

Final Remedial Action Report Project No. 108797 Building 165 and Area 18 C Groundwater Treatment Pilot Systems November 2010
6-1
6.0 165 Fieldcrest Avenue Post-Injection Monitoring
As presented in the NJDEP-approved RAWP, six monthly rounds of groundwater monitoring were to be implemented at the site upon completion of the pilot test injection activities. The first round of post-injection monitoring was conducted in December 2008, approximately one month after completion of injection activities.
6.1 Methodology The approved RAWP requires the following wells to be sampled as part of this monitoring program:
• 165 Fieldcrest Avenue: MW165-1 and MW-307 through MW-315 • 151 Fieldcrest Avenue: MW151-FRONT and MW151-3
Access to the 151 Fieldcrest Avenue property was not granted to the USACE and Shaw until early February 2009. Therefore, the February 2009 sampling event was the first post-injection round to include these wells. However, MW151-3 was unable to be located and was not sampled. It appears that relatively recent site improvements at that facility may have damaged or covered the well.
In addition to monitoring well sampling, purging of the piezometers and vertical injections wells at the site to look for permanganate laden water has also been implemented, to help understand the permanganate distribution following the injection activities. If a location is purged and pink/purple water is not observed, a multi-parameter meter was used to measure in situ geochemical parameters, most importantly, oxidation-reduction potential (ORP). Nine post-injection monitoring events were completed, six of which included groundwater samples analyzed in the laboratory (December 2008, January 2009, February 2009, March 2009, May 2009, and April 2010). In addition, three additional monitoring events were conducted to only observe the extent of permanganate (July 2009, September 2009, and December 2009). The decision to only look for permanganate extent and not collect laboratory samples was made for two reasons: 1) For budgetary purposes, as the project budget only allowed for six post-injection sampling events, and 2) the extent of permanganate over the first four to five post-injection observation events did not vary significantly, and the sixth and final sampling event was delayed until the permanganate extent somewhat subsided and more useful analytical data could be analyzed. Table 6.1 summarizes the monitoring events and their associated activities.
6.2 Permanganate Distribution Figures 6.1 through 6.7 present the observed extent of permanganate laden water during monitoring events from February 2009 through April 2010. As shown on the figures,

Final Remedial Action Report Project No. 108797 Building 165 and Area 18 C Groundwater Treatment Pilot Systems November 2010
6-2
distributing permanganate to the northern and northeastern portion of the treatment zone was problematic, due to the presence of utility lines in the area and the need to amend the injection scheme accordingly (as discussed in Section 5.4.2). The extent of permanganate through the December 2009 event did not vary significantly, thus limiting the usefulness of collecting samples for laboratory analysis from only a limited number of locations and delaying the final groundwater sampling event until April 2010. The extent of permanganate in April 2010 had reduced in size from previous observations, though a significant aerial extent of permanganate persists based on the monitoring points, particularly under the building (note that the permanganate distribution under the building is inferred, not measured, due to logistical/access limitations).
6.3 Chlorinated Ethene Concentrations Appendix J presents a tabulated and graphical groundwater analytical results summary, through the April 2010 monitoring event. The data shows that in most cases, with the exception of upgradient well MW-151-FRONT and MW-311, the concentrations of TCE and related compounds (PCE, 1,2-DCE, and VC) decreased when compared to the June 2008 baseline. However, all wells that were sampled during the April 2010 event displayed at least one compound that remains above its associated NJDEP GWQC. The highest observed TCE concentrations during the April 2010 sampling event were at MW-311 and MW-312 (100 and 99 micrograms per liter [µg/L], respectively). A number of locations (MW-165-1, MW-307, MW-309, MW-310, MW-313, and MW-315) showed significant reductions in TCE concentration compared to baseline. However, concentrations of other chlorinated ethenes, such as cis-1,2,-DCE did not decrease accordingly. MW-308 has not been sampled since baseline, as permanganate has been observed at this location since the injections began (this well was used as a permanganate injection well).
6.4 Treatment Effectiveness The permanganate treatment could be deemed effective purely based on the significant TCE concentration reduction compared to baseline at numerous locations (as discussed above). However, the lack of significant reduction of other chlorinated ethenes at these locations suggests that the permanganate was not fully effective. The problems encountered distributing permanganate to the northern and northeastern portion of the treatment zone hindered the effectiveness of the treatment, as the presence of utility lines in the area and heterogeneous fill material near the road made controlling the permanganate during injection difficult. Due to these inefficiencies in distributing the permanganate and the concentrations of other chlorinated compounds remaining in the treatment zone monitoring wells, the overall effectiveness of the treatment could be described as marginal, as of the date of this report. However, future monitoring of the wells may prove to show that significant reductions of contaminants in areas where permanganate still resides can be achieved, proving that if permanganate distribution can

Final Remedial Action Report Project No. 108797 Building 165 and Area 18 C Groundwater Treatment Pilot Systems November 2010
6-3
be controlled, the remedial technology may have application advantages at other portions of the AOC2 plume.

Final Remedial Action Report Project No. 108797 Building 165 and Area 18 C Groundwater Treatment Pilot Systems November 2010
7-1
7.0 Area 18C – Building 256 Ramp Area Pre-Design Activities
Pilot testing pre-design activities in Area 18C included monitoring well installations, a topographic survey, hydrogeologic testing, laboratory buffer testing, groundwater sampling, and injection radius of influence testing. Figure 7.1 provides a map of the Area 18C Site. These activities are described in the following subsections.
7.1 Monitoring Well Installation Prior to pre-design activities, only one monitoring well (MW-114) existed within the Area 18C-Building 256 Ramp Area (Figure 7.1). Monitoring well MW-114A was installed by Shaw on June 7, 2007, during the collection of soil cores for the treatability studies (Section 2.2). Both of these wells are screened within what is referred to as the Lower Sand Unit underlying this area. An additional five “deep” monitoring wells (MW-300D, MW-301D, MW-304D, MW-305D and MW-306D) were installed within the Lower Sand Unit during the period from April 28 through May 6, 2008. Five “shallow” monitoring wells (MW-300S, MW-301S, MW-302S, MW-303S and MW-305S) were installed within what is referred to as the Upper Sand Unit during the same time period (Figure 7.1). Appendix K includes the boring logs and well completion diagrams for the Area 18C monitoring wells. Site hydrogeology and contaminant distribution are discussed in more detail in Section 8.1 of this document.
Subsurface soil samples were collected from various depth intervals in the borings for MW-301D, MW-304D, and MW-305D for laboratory grain size analysis, and from MW-301D and MW-304D for permeability testing of the silty-clay layer located between the Upper and Lower Sand Units. The results were used in groundwater flow and transport modeling (Section 8.2.1) and well screen design.
Construction details for all of the Area 18C wells are summarized in Table 7.1, and boring logs and well completion diagrams are provided in Appendix L. All monitoring well installations were performed by a New Jersey licensed driller (SGS Environmental Services, Inc.) and supervised by a Shaw geologist. The wells were installed within a nominal 6-inch diameter borehole using hollow stem auger (HSA) drilling methods. Wells were constructed using flush-threaded, 2-inch diameter, Schedule 40, PVC, with between 5 and 10 feet of 0.010-inch slotted screen (Table 7.1).
The filter pack for each monitoring well consists of #1 Morie sand extending approximately 1 to 2 feet above the top of screen. A 1-foot transition sand of #00 Morie sand was placed above the #1 sand. A bentonite seal of 1 to 2 feet was placed above the transition pack, and cement-bentonite grout was emplaced to within 1 foot of the surface via Tremie pipe. Each well was
Final Remedial Action Report Project No. 108797 Building 165 and Area 18 C Groundwater Treatment Pilot Systems November 2010
7-2
completed with a locking steel well casing protector or a flushmount protector installed in a 24-inch by 24-inch concrete pad at the ground surface.
Development of all the monitoring wells was accomplished by surging the well with a surge block and pumping the groundwater until the water was clear and the well was sediment free to the fullest extent practical. Wells were developed using a submersible pump and water was not added to the well to aid in development.
Well installation and development activities (including equipment decontamination), and management of IDW were conducted as detailed in the RAWP. Field activities were conducted in Level D Protection. Underground utility clearances were obtained for all intrusive site activities. Clearance of all underground utilities was arranged with appropriate facility personnel and local utility companies.
7.2 Site Topographic Survey A topographic survey was completed by Zenith Nadir Professional Land Surveyors, Inc. on May 14, 2008 and a site topographic map transmitted to Shaw on May 16, 2008. Included in the survey were elevations and coordinates of the new and existing monitoring wells. Wells were surveyed for their horizontal location to within ±1 foot, and their elevation of the top of the inner PVC well casing to a ±0.01-foot precision. The site map for Area 18C is included as Figure 7.1.
7.3 Hydrogeologic Testing Aquifer testing was conducted to determine hydrogeologic characteristics of the unconsolidated sediments within Area 18C. Results of the testing were used to develop a site hydrogeologic conceptual model, and in constructing a three-dimensional groundwater hydrogeologic fate and transport model.
7.3.1 Slug Testing Rising and falling head slug tests were performed on March 30, 2008 at monitoring wells MW-114 and MW-114A, and on May 7-8, 2008 at nine of the ten remaining monitoring wells within Area 18C. Slug tests were performed to verify and/or estimate the hydraulic conductivity in the various stratigraphic layers within this area. This information was ultimately used to select the most appropriate screen intervals for the pilot test injection and extraction wells in the Lower Sand Unit and for determining injection intervals and rates for the Upper Sand Unit.
Slug test data were analyzed using AQTESOLV Pro software. Results of the slug testing are summarized in Table 7.2, and the analyses are included in Appendix M. Hydraulic conductivities ranged from 4.0 ft/day to 13.1 ft/day in the Upper Sand Unit and from 1.4 ft/day to 20.3 ft/day in the Lower Sand Unit.
Final Remedial Action Report Project No. 108797 Building 165 and Area 18 C Groundwater Treatment Pilot Systems November 2010
7-3
7.3.2 Pumping Tests Short-term aquifer pump tests were performed to evaluate hydrogeologic properties (i.e., horizontal and vertical hydraulic conductivity, transmissivity, storativity, etc.) within the Upper Sand and Lower Sand Units in Area 18C. These tests were also used to determine if there was any significant hydraulic connection between these two units. Information obtained during these pump tests was ultimately used to determine well spacing and groundwater extraction and injection rates for the Lower Sand Unit pilot system, and injection point spacing and injection rates for the Upper Sand Unit pilot study.
Step drawdown tests were performed on May 12, 2008 at monitoring wells MW-114 (Lower Sand Unit) and MW-303S (Upper Sand Unit) (Figure 7.1) to estimate well performance, and determine a sustainable optimum pumping rate for the pump test well. Three pumping steps, each lasting approximately 30 minutes, were conducted at each well. The corresponding water level drawdown in the pumping well and nearby observation wells were measured as a function of time. Data from the step tests were analyzed to determine the optimum pumping rate for the constant rate test at each well. Based on these data, the pumping rate selected for the constant rate pump test was 5.0 gpm for MW-114 and 0.70 gpm for MW-303S.
Lower Sand Unit
A constant rate pump test was conducted on May 13, 2008 at monitoring well MW-114. Groundwater was extracted from MW-114 at a constant rate of 5 gpm for six hours. Measurements of drawdown versus time were collected in the pumping well and eleven nearby monitoring wells during testing. Data loggers were used in the pumping well and the nine closest monitoring wells to record groundwater elevation data during the testing. These included Lower Sand monitoring wells MW-114A, MW-301D, MW-304D, MW-305D and MW-306D and Upper Sand monitoring wells MW-301S, MW-302S, MW-303S, and MW-305S (Figure 7.1). A data logger was also placed in monitoring well MW-165-1 (located at the 165 Fieldcrest Avenue Area) to record background groundwater elevation data at a location outside the influence of the pump test. Manual water level measurements were collected periodically at two additional nearby monitoring wells (MW-300S and MW-300D; Figure 7.1). The recovery of water levels in the pumping well and observation wells were also monitored after pumping was terminated (recovery phase).
Although water levels in the Upper Sand Unit may have been slightly influenced by pumping in the Lower Sand Unit at MW-114, drawdowns were too small to be distinguished from barometric response of the upper sands. Therefore, only drawdowns from pumping well and five Lower sand wells equipped with dataloggers were analyzed. Data analysis was performed using AQTESOLV V4.5. The Hantush-Jacob (1955) method and Neuman-Witherspoon (1969) method for leaky aquifers were used. Results of the analysis are presented Table 7.3 and

Final Remedial Action Report Project No. 108797 Building 165 and Area 18 C Groundwater Treatment Pilot Systems November 2010
7-4
Appendix M. The average hydraulic conductivity, transmissivity and storativity were 50.1 ft/day, 385 ft2/day and 1.3 x 10⁻⁴, respectively. This value of the aquifer storativity is within the range of typical values for confined or leaky-confined aquifers (Fetter, 1994).
Upper Sand Unit
A constant rate pump test was conducted on May 14, 2008 at monitoring well MW-303S. Groundwater was extracted from MW-303s at a rate ranging from 0.6 to 0.7 gpm for six hours. As with the previous constant rate pump test, measurements of drawdown versus time were collected in the pumping well and eleven nearby monitoring wells during testing. Data loggers were used in the pumping well and the nine closest monitoring wells to record groundwater elevation data during the testing. These included Lower Sand monitoring wells MW-114, MW-114A, MW-301D, MW-304D, MW-305D and MW-306D and Upper Sand monitoring wells MW-301S, MW-302S, and MW-305S (Figure 7.1). A data logger was also placed in monitoring well MW-165-1 (located at the 165 Fieldcrest Avenue Area) to record background groundwater elevation data. Manual water level measurements were collected periodically at two additional nearby monitoring wells (MW-300S and MW-300D; Figure 7.1). The recovery of water levels in the pumping well and observation wells were also monitored after pumping was terminated (recovery phase).
Except for the pumping well MW-303S, drawdown values at both Upper Sand and Lower Sand monitoring wells were too small to be distinguished from barometric response or natural variations. Therefore, only drawdown data from the pumping well were analyzed. Data analysis was performed using AQTESOLV V4.5. The Moench (1997) method and Tartakovsky-Neuman (2007) method for unconfined aquifers were used. Results of the analysis are presented Table 7.4 and Appendix M. The average hydraulic conductivity, transmissivity and storativity were 2.27 ft/day, 14.37 ft2/day and .036, respectively. This value of the aquifer storativity is within the range of typical values for unconfined aquifers (Fetter, 1994).
A hydraulic conductivity of 0.027 ft/day was calculated for the silty-clay unit separating the Upper and Lower sand units (Fetter, 1994). This value is consistent with low permeability silts and clays, and suggests that this unit acts as a confining layer between the Upper and Lower sand units in Area 18C.
Results
Pump testing results indicate the following:
• The Upper Sand and Lower Sand Units are not hydraulically connected,
Final Remedial Action Report Project No. 108797 Building 165 and Area 18 C Groundwater Treatment Pilot Systems November 2010
7-5
• The Upper Sand Unit is an unconfined aquifer, while the Lower Sand Unit is a confined, or leaky-confined aquifer,
• The calculated hydraulic conductivity of the Upper Sand Unit is approximately 20 times higher than that of the Lower Sand Unit, and
• The lack of hydraulic connection and large variation in hydraulic conductivities indicate that the Upper Sand and Lower Sand Units would require different treatment approaches.
Approximately 2,700 gallons of groundwater was extracted during the pump tests. This groundwater was collected and stored in a temporary storage tank, pumped into a vacuum truck and disposed of off-site, in accordance with the RAWP (Shaw, May 2008).
7.4 Direct-Push Investigation A direct-push (Geoprobe®) investigation was conducted in Area 18C on May 20, 2009 (Figure 7.2). The purpose of the investigation was to improve delineation of the contaminants and water table elevation within the Upper Sand unit. Information obtained from the investigation was used to optimize/verify injection locations and intervals for the direct-push injection program.
A Geoprobe® Screen Point Sampler was advanced at 18 locations within Area 18C (Figure 7.2). Groundwater samples were collected from 13 of the 18 locations. Groundwater samples could not be obtained at the remaining 5 locations due to inadequate groundwater flow into the sampler. All samples were collected across a 3.5-foot interval at the top of the silty clay unit (i.e., refusal of direct-push tools). Samples were analyzed for VOCs at Shaw’s Lawrenceville, New Jersey laboratory. Groundwater sampling analytical results are summarized on Figure 7.2.
TCE concentrations ranging from non-detect (<5 µg/L) to 690 µg/L, and cDCE concentrations ranging from non-detect (<5 µg/L) to 430 µg/L were observed. Low concentrations of PCE and VC were also observed (Figure 7.2).
Investigation activities (including sample collection techniques and equipment decontamination) were performed in accordance with NJDEPs field sampling procedures (NJDEP, August 2005). Management of IDW was conducted as detailed in the RAWP (Shaw, May 2008). Field activities were conducted in Level D Protection. Underground utility clearances were obtained for all intrusive site activities.
7.5 Laboratory Buffer Testing Subsurface soil and groundwater samples were collected at locations IW-4, IW-6, and EW-6 for laboratory pH adjustment and buffer testing to determine which chemical(s) and concentration(s)

Final Remedial Action Report Project No. 108797 Building 165 and Area 18 C Groundwater Treatment Pilot Systems November 2010
7-6
were most suitable for use at the site. Combined subsurface soil and groundwater samples were individually titrated with potassium carbonate, potassium bicarbonate, and sodium hydroxide, and the results evaluated. The laboratory testing was performed at Shaw’s Lawrenceville, New Jersey treatability laboratory, and was completed on July 30, 2008.
Based on the results of the laboratory testing, sodium hydroxide was selected for pH adjustment in the Lower Sand. Sodium hydroxide is a strong base that is extremely effective at raising pH. The primary reason for choosing sodium hydroxide was that laboratory testing results indicated that an unreasonably large quantity of either potassium carbonate or potassium bicarbonate would have been required to raise the pH in the Lower Sand. It was also anticipated that either of these buffers would lead to significant fouling of the injections wells, as well as other operation and maintenance (O&M) issues. Because the selected treatment for the Lower Sand involved the recirculation of groundwater during pH adjustment, using a strong base was more likely to provide fast and effective pH adjustment. As discussed in Section 9.1.1, sodium hydroxide was replaced with potassium hydroxide in the pilot study after the first two months of system operation. The switch from sodium hydroxide to potassium hydroxide was intended to minimize the amount of sodium added to the aquifer, when it was determined that pH adjustment in the field would require more chemicals than calculated in the laboratory studies.
Potassium bicarbonate was selected as the primary agent for pH adjustment in the Upper Sand unit, because less pH adjustment was required in this zone. Bicarbonates are weak bases that are effective at raising pH to neutral levels, as well as providing buffering capacity to maintain neural pH. Because the selected treatment for the Upper Sand involved a one-time direct push injection of buffer and other amendments, potassium bicarbonate was more likely to provide long term buffering of the aquifer. As discussed in Section 9.2.1, a small volume of potassium hydroxide was also used with the potassium bicarbonate during injections to provide additional pH adjustment.
7.6 Injection Radius of Influence Testing Results of the hydrogeologic testing, laboratory buffer testing, and direct-push investigation indicated that the Upper Sand unit and Lower Sand unit would require separate treatment approaches. This was due to the fact that these units were not hydraulically connected, exhibited significantly different hydraulic conductivities (greater than an order of magnitude difference) and pH ranges, and had different contaminant distribution patterns and extents (treatment approaches are discussed in detail in Section 8.1).
These data indicated that the treatment approach for the Upper Sand unit would involve injection of buffer and amendments via direct-push wells and/or points. In order to determine the effective radius of influence for both the buffer (potassium bicarbonate) and soluble amendments (lactate and nutrients) a small-scale injection test was performed within the Upper Sand unit.
Final Remedial Action Report Project No. 108797 Building 165 and Area 18 C Groundwater Treatment Pilot Systems November 2010
7-7
One injection point (IP-300) and three monitoring points (PZ-309 through PZ-311) were installed via direct push methods on July 28, 2008. The wells were installed in a straight line, and spaced 5 feet apart, with IP-300 located on the southwest end of the row of wells (Figure 7.1). IP-300 was constructed with 5 feet of 0.010-inch slotted pre-packed screen (1-inch ID x 2.5-inch OD) and 1-inch PVC riser. The three monitoring points were constructed with 5-feet of 0.010-inch slotted pre-packed screen (3/4-inch ID x 1.4-inch OD) and 3/4-inch PVC riser. Well installation logs are provided in Appendix L.
Baseline field parameter readings (pH, ORP, dissolved oxygen (DO) and specific conductivity) were collected from all four wells, plus nearby Upper Sand monitoring wells MW-301S and MW-302S, prior to testing. These data were used to determine baseline geochemical conditions (pH, ORP, DO and conductivity) prior to amendment injections. Five hundred and fifty gallons of solution containing 100 lbs of potassium bicarbonate and 25 gallons of 60 percent sodium lactate solution were injected into IP-300 using a double diaphragm pump on April 8 and April 9, 2009. Injection rates ranged from 0.5 to 3.0 gpm. Groundwater samples and field parameter readings were collected on all four wells on April 27, 2009. The samples were analyzed for volatile fatty acids (VFA) at Shaw’s NJDEP certified Lawrenceville, New Jersey Laboratory.
Results from the VFA samples indicated an effective injection radius of influence of at least 15 feet from IP-300. Results from the field parameter measurements indicated an increase in pH and a reduction in ORP at 3 of the 4 direct push wells and MW-301S. These data were used to determine the optimal spacing of injection locations within the treatment zone, as well as the estimated mass of buffer and lactate required to create optimal conditions for reductive dechlorination within the Shallow Sand unit.
7.7 Baseline Groundwater Sampling Baseline groundwater sampling events were conducted on June 2 through 4, 2008 and March 12 through 13, 2009. Groundwater samples were collected from all twelve Area 18C monitoring wells during these two events (Figure 7.2). These samples, in addition to samples collected from extraction/injection wells and during the direct-push investigation were used to establish the baseline conditions of groundwater quality and biogeochemistry prior to Pilot testing activities. Tables 7.5 through 7.7 summarize the groundwater sampling schedule, the wells sampled, and the analyses that were performed during baseline sampling.
Sampling was performed by Shaw personnel, in accordance with the procedures described in the RAWP (Shaw, May 2008). Groundwater samples were collected utilizing low-flow purging in accordance with NJDEP Low Flow Purging and Sampling Guidance. Samples were obtained using a dedicated submersible bladder pump and Teflon tubing. A YSI field meter with a flow-through cell was used to collect measurement of field geochemical parameters (pH, ORP,

Final Remedial Action Report Project No. 108797 Building 165 and Area 18 C Groundwater Treatment Pilot Systems November 2010
7-8
temperature, specific conductivity, and DO). Groundwater samples were submitted to Test America Laboratories, Inc. in Edison, New Jersey.
Samples collected during the first baseline event were analyzed for VOCs, reduced gases, anions (including nitrate and sulfate), VFA, and dissolved iron and manganese (Tables 7.5 through 7.7). Samples collected during the second baseline event were sampled for VOCs only. Laboratory analytical and field parameter results are summarized in Tables 7.8 and 7.9, respectively. The following summarizes results for the Lower Sand unit during the June 2008 baseline sampling event, as well as “screening level” data collected from all eighteen extraction/injection wells in July 2008 (these samples were collected at the end of well development, and were not collected using Low Flow methods). Results for the Upper Sand unit during the March 2009 baseline sampling event, as well as the May 2009 direct-push investigation, are also summarized below.
Chlorinated Ethenes Figure 7.3 summarizes baseline VOCs detected in all twelve monitoring wells, extraction wells and injection wells in June and July 2008. Figures 7.4 through 7.7 provide baseline isoconcentration maps for the Lower Sand unit for PCE, TCE, cDCE and VC, respectively. PCE concentrations ranged from non-detect (<0.2 µg/L) to 35 µg/L, TCE concentrations ranged from non-detect (<0.4 µg/L) to 490 µg/L, cDCE concentrations ranged from non-detect (<0.3 µg/L) to 1,500 µg/L, and VC concentrations ranged from non-detect (<0.2 µg/L) to 170 µg/L. The highest PCE and TCE concentrations were centered around wells MW-114 and EW-5 (Figures 7.4 and 7.5), while the highest cDCE and VC concentrations were centered around wells MW-114A and EW-7, located slightly upgradient (Figures 7.6 and 7.7). The presence of higher concentrations of cDCE and VC (degradation products of TCE and PCE), along with the presence of ethene (the innocuous end-product of reductive dechlorination) in this portion of the site is most likely due to that fact that the pH is above 5 standard units, thus supporting reductive dechlorination of TCE and PCE.
Figures 7.8 through 7.11 provide baseline isoconcentration maps for PCE, TCE, cDCE and VC in the Upper Sand unit in March and May of 2009. PCE concentrations ranged non-detect (<0.4 µg/L) to 60 µg/L, TCE concentrations ranged from non-detect (<0.4 µg/L) to 690 µg/L, cDCE concentrations ranged from non-detect (<0.3 µg/L) to 170 µg/L, and VC concentrations ranged from non-detect (<0.2 µg/L) to 150 µg/L. The highest PCE and TCE concentrations were located around monitoring wells MW-303S and MW-305s, and direct-push sampling location GP-18 (Figures 7.8 and 7.9), while the highest cDCE and VC concentrations were located in areas that had pH values above 5 standard units that support reductive dechlorination of TCE and PCE (Figures 7.10 and 7.11).
The presence of cDCE and lack of VC (and ethene) in areas of the site where pH was below 5 standard units indicated that the indigenous microbial population within the aquifer were
Final Remedial Action Report Project No. 108797 Building 165 and Area 18 C Groundwater Treatment Pilot Systems November 2010
7-9
incapable of dechlorination of TCE beyond cDCE at those low pH values, thus leading to what is referred to as “DCE stall”.
Reduced Gases Reduced gases (methane, ethene and ethane) samples were collected from all twelve monitoring wells during the June 2008 Baseline sampling event. Results for reduced gases are provided in Table 7.8. Methane concentrations ranged from non-detect (<5 µg/L) to 2,200 µg/L, with half of the wells being below the practical quantitation limit (PQL) of 5 µg/L. Methane was observed in both the Upper and Lower Sand units. Ethene was only detected in one of the twelve monitoring wells (MW-114, at a concentration of 10 µg/L), and ethane was not detected in any of the wells. The absence of measurable ethene and ethane concentrations across most of the site indicated that complete dechlorination of TCE was not occurring in the pilot test area.
Anions Anion data collected from the twelve monitoring wells during June 2008 Baseline sampling included nitrate, sulfate, chloride and ortho-phosphate (Table 7.8). Nitrate was detected in two of the twelve wells; MW-303S and MW-305S at concentrations of 0.2 milligrams per liter (mg/L) and 0.4 mg/L, respectively. The remaining wells were below the detection limit of 0.05 mg/L. Sulfate concentrations ranged from 18.1 mg/L (MW-302S) to 81.8 mg/L (MW-301S). Chloride concentrations ranged from 3.3 mg/L (MW-301S) to 247 mg/L (MW-301D). Ortho-phosphate was not detected above the PQL of 0.5 mg/L at any of the wells.
The lack of nitrate and presence of sulfate at these concentrations (in addition to field ORP and DO measurements, discussed below) indicated that mildly reducing conditions existed in the demonstration area.
Volatile Fatty Acids VFA data collected from the twelve monitoring wells during June 2008 Baseline sampling included the following fatty acids: lactate, acetate, propionate, butyrate, and pyruvate. There were no detectable concentrations (PQL of 2 to 10 mg/L, depending on the VFA) of any of these acids in any of the wells sampled during the June 2008 Baseline event (Table 7.8). These data indicate a lack of organic carbon required for effective reductive dechlorination of chlorinated ethenes.
Metals Groundwater samples were collected for dissolved iron and manganese from the twelve monitoring wells during the June 2008 Baseline sampling event (Table 7.8). Dissolved iron concentrations ranged from non-detect (39.7 µg/L) to 42,200 µg/L (MW-302S). The presence of dissolved iron concentrations in this range further indicates that mildly reducing condition existed in the demonstration area (Dragun, 1998).
Final Remedial Action Report Project No. 108797 Building 165 and Area 18 C Groundwater Treatment Pilot Systems November 2010
7-10
Dissolved manganese concentrations ranged from 79.5 µg/L (MW-303S) to 1,090 µg/L (MW-302S).
Biological Groundwater samples were collected and the microbial communities in the samples were screened for the presence and quantification of Dehalococcoides species via qualitative polymerase chain reaction (qPCR). However, laboratory testing indicated that an unknown inhibitor of qPCR in the groundwater at Area 18C was skewing the qPCR results, making it impossible to quantify the number of Dehalococcoides present with any degree of certainty. Therefore, these data are not reported.
Field Parameters The key field parameters collected from the twelve monitoring wells during Baseline sampling included pH, specific conductivity, ORP, and DO. Groundwater temperature and turbidity were also collected. Field parameter data collected are summarized in Table 7.9. The following summarizes the key field parameter data collected:
• pH ranged from 3.30 (MW-304D) to 5.73 (MW-114) standard units in the Lower Sand unit, and from 4.44 (MW-303S) to 7.36 (MW-301S) standard units in the Upper Sand unit indicating that the groundwater was generally acidic. A baseline pH distribution map for the Lower Sand unit is provided in Figure 7.12.
• Specific conductivity ranged from 230 microSiemens per centimeter (µS/cm) (MW-306D) to 841 µS /cm (MW-302S).
• ORP ranged from -90.7 milliVolts (mV) (MW-302S) to +448.2 mV (MW-305S). With the exception of MW-302S, all ORP values were positive.
• Dissolved Oxygen concentrations ranged from 0.0 mg/L (MW-305D and MW-306D) to 6.67 mg/L (MW-305S). Dissolved oxygen concentrations were generally higher in the Upper Sand unit.
These baseline field parameter data indicate that groundwater pH, ORP and dissolved oxygen levels are incompatible with anaerobic reductive dechlorination of chlorinated ethenes, and that pH modification and establishing reducing conditions would be required for biological treatment to be effective.
Final Remedial Action Report Project No. 108797 Building 165 and Area 18 C Groundwater Treatment Pilot Systems November 2010
8-1
8.0 Area 18C – Building 256 Ramp Area Pilot Study Design and Installation
Pilot testing activities in Area 18C included the design and installation of a groundwater recirculation and amendment delivery system for the Lower Sand unit and the design of a direct-push injection program for the Upper Sand unit. These activities, as well as the conceptual site model, are described in the following subsections.
8.1 Conceptual Site Model A generalized hydrogeologic cross section of Area 18C is presented in Figure 8.1. This cross section shows four distinct hydrogeologic units:
1. Upper Sand: Consisting of fine sands and silty sands. This unit is approximately 15 to 20 feet thick and comprises the vadose zone and the uppermost portion of the unconfined aquifer.
2. Silty-Clay Layer: A relatively continuous unit, consisting of silty clays and clayey silts. This unit is up to 5 feet thick, and acts as an aquitard between than the Upper and Lower Sand units.
3. Lower Sand: Consisting of fine to coarse sands and silty sands. This unit is approximately 9 feet thick and fully saturated.
4. Fire Clay: Consisting of clay and silty clay. This unit is several feet thick and exhibits extremely low permeability, thus acting as a aquitard between the units above and below.
Results of the Pre-design activities indicated that the Upper Sand unit and Lower Sand unit were two distinct aquifers that would require separate treatment approaches. These activities indicated that the Upper and Lower Sand units:
• Are separated by an aquitard (the silty clay layer) and are not hydraulically connected (Figure 8.1),
• Exhibit significantly different hydraulic conductivities (greater than an order of magnitude difference),
• Exhibit significantly different pH ranges (Table 7.9), and
• Have different contaminant distribution patterns and extents (Figures 7.4 through 7.11).
The pump test data indicated that groundwater recirculation could be effective for the Lower Sand unit, but not as effective for the Upper Sand unit (because of the low hydraulic conductivity of this unit). The wide range in pH values for the Lower Sand also made groundwater recirculation a more reasonable approach, because it would allow for pH control at individual

Final Remedial Action Report Project No. 108797 Building 165 and Area 18 C Groundwater Treatment Pilot Systems November 2010
8-2
injection wells, thus providing operational flexibility that would allow for the increase and leveling of groundwater pH across the treatment area.
The radius of influence testing indicated that direct-push injections could be effective at delivering amendments for pH adjustment, as well as a carbon source and nutrients. Additionally, applications in similar geologies have shown that the SDC-9 culture can be delivered to the subsurface successfully using direct-push injection techniques. Therefore, it was determined that the remedial approach for the Upper Sand unit would involve injection of buffer and amendments via direct-push points.
As previously discussed, chlorinated ethenes (including PCE, TCE, cDCE and VC) are the primary contaminants of concern in the Upper and Lower Sand units within Area 18C. TCE concentrations are generally higher and the contaminant distribution more wide spread than the other COCs. Therefore, for the purposes of the pilot tests, the extent of the proposed treatment areas are based on TCE concentrations.
The approximate treatment zones for the Upper Sand and Lower Sand pilot tests are shown on Figure 8.2. The lateral extents of the Lower Sand pilot test generally include the area where the former excavations were performed (the contamination within the Lower Sand unit is below the bottom of the excavations) and the immediate surrounding and downgradient areas. The estimated treatment area is approximately 160 feet wide by 320 feet long, and includes TCE groundwater concentrations generally exceeding 10 µg/L. Treatment zone thickness (i.e., the thickness of the Lower Sand unit) ranges from approximately 5 to 10 feet.
The lateral extents of the Upper Sand pilot test generally include the area surrounding where the former excavations were performed, and areas downgradient. The estimated treatment area varies from approximately 60 to 180 feet wide by approximately 240 feet long, and includes TCE groundwater concentrations generally exceeding 10 µg/L (Figure 8.2). Treatment zone thickness (i.e., the thickness of the saturated portion of the Upper Sand unit) ranges from approximately 3 to 10 feet.
8.2 Technology Description Shaw’s SDC-9 bacterial consortia was developed specifically to treat chlorinated solvent contamination in aquifers. The culture contains Dehalococcoides sp. (DHC) bacteria that degrade a wide range of chlorinated contaminants via dehalorespiration. In addition to degrading highly chlorinated ethenes like PCE and TCE, the culture dechlorinates cDCE and VC to non-toxic ethene, making it well suited for treating sites where remediation of PCE and TCE has stalled at these intermediates. The culture works effectively with any electron donor known to support reductive dehalogenation (e.g., lactate, ethanol, vegetable oil, molasses, whey, etc.).
Final Remedial Action Report Project No. 108797 Building 165 and Area 18 C Groundwater Treatment Pilot Systems November 2010
8-3
However, the culture requires a neutral groundwater pH (between approximately 5.5 and 8.0 standard units) to effectively degrade chlorinated ethenes. Therefore, groundwater pH adjustment was required in both the Upper Sand and Lower Sand Units during the pilot test.
8.3 Lower Sand Design and installation activities for the Lower Sand pilot study included groundwater modeling, installation of extraction and injection wells, design and installation of the groundwater recirculation and amendment delivery systems, as well as testing of these systems. These activities are described in the following subsections.
8.3.1 Groundwater Modeling MODFLOW (USGS, 1996), a three-dimensional groundwater flow model, was used to construct a geologic and hydraulic model of Area 18C. RT3D (Clement et al., 1997), a solute fate and transport model used within the MODFLOW groundwater flow model, was used to simulate the migration and mixing of lactate within the Lower Sand Unit. Both the MODFLOW and RT3D models were developed using the site-specific hydraulic and geologic data obtained during the pre-design characterization described in Section 7.0.
The model was used to facilitate the design of the in situ bioaugmentation system (i.e., determine injection/extraction well locations, pumping rates, and the lactate injection concentrations) within the Lower Sand Unit in order to achieve decreases in groundwater chlorinated ethene concentrations. The model simulated transport of the lactate in the groundwater flow field induced by operation of the treatment system.
The overall goal of the model was to facilitate the conceptual design of the in situ bioaugmentation system. Specifically, the model was used to verify and evaluate mixing of injected lactate with groundwater. Simulated amendment concentrations in the treatment zone were evaluated as a function of depth and distance from the injection wells to determine the well flow rates, spacing, and screen interval needed to ensure proper mixing.
The final model simulations consisted of nine injection wells (IW-1 through IW-9) and nine extraction wells (EW-1 through EW-9) screened within the Lower Sand unit. The wells were placed in six alternating rows oriented perpendicular to groundwater flow. The first, third and fifth rows consisted of injection wells, while the second, fourth and sixth rows consist of extraction wells. The layout includes approximately 40 feet of separation between wells within each row, and 60 feet of separation between rows. Groundwater extraction and reinjection rates were simulated at 10 gpm per pair (however, as discussed in Section 9.1.5, actual flow rates were lower during the pilot test).
Final Remedial Action Report Project No. 108797 Building 165 and Area 18 C Groundwater Treatment Pilot Systems November 2010
8-4
Particle tracking analysis was performed using the model to estimate the travel time between the injection and extraction wells, and to estimate the spacing between wells to provide adequate mixing of amendments throughout the treatment zone. Results of the particle tracking analysis are shown in Figure 8.3. Results showed that 40-foot separation spacing between injection/extraction well pairs is sufficient for effective mixing, and that the particle travel time from the injection to the extraction wells is approximately three to five days. Figure 8.4 shows lactate concentration distribution after two days of injection and seven days of continuous recirculation. The simulation indicates that lactate concentrations above 200 mg/L (the target concentration) exist across most of the treatment area. It should be noted that the groundwater model is a tool based on generalized site data (i.e. hydraulic conductivity, storativity, etc.), and may not be fully representative of site conditions.
8.3.2 Systems Design The layout, screen intervals, and pumping rates of the nine extraction and nine injection wells in the groundwater model were used in the final system design. Data from the model was also used to determine lactate injection concentrations and rates. A plan view drawing showing the location of the extraction and injection wells and the Conex box location is provided in Figure 8.5.
Desktop designs for the groundwater recirculation system and amendment delivery systems were completed by Shaw for the Lower Sand unit pilot test. Both systems were designed to be housed within a 40-foot Conex box. Design of the Conex box included insulation, lighting, and a heating/air conditioning unit, and called for the Conex box to be placed in a central location at the site. Design of the groundwater recirculation system included submersible, variable-speed pumps, filter housings, flow meters, and a control panel. Design of the amendment delivery systems included peristaltic pumps to deliver pH amendment solution and biocide, and Dosatron pumps to deliver electron donor and nutrients to the injection wells. A diagram showing the general process design of the systems, including extraction and injection wells and the associated equipment, is provided in Figure 8.6.
8.4 Injection/Extraction Well Installation Installation and development of the nine extraction and nine injection wells was performed between July 2 and July 29, 2008. The final well locations are provided in Figure 8.5. The wells were installed in six alternating rows oriented perpendicular to groundwater flow. The first, third and fifth rows consist of injection wells, while the second, fourth and sixth rows consist of extraction wells. The layout includes approximately 40 feet of separation between wells within each row, and 60 feet of separation between rows. Well construction details are summarized in Table 7.1, and boring logs and well completion diagrams are provided in Appendix L.
Final Remedial Action Report Project No. 108797 Building 165 and Area 18 C Groundwater Treatment Pilot Systems November 2010
8-5
All well installations were performed by a New Jersey licensed driller (SGS Environmental Services, Inc.) and supervised by a Shaw geologist. The injection and extraction wells were installed within a nominal 10-inch diameter borehole using HSA drilling methods. Injection and extraction wells were constructed using flush-threaded, 4-inch diameter, Schedule 40, PVC, with 5 feet of 0.020-inch slotted continuously-wrapped stainless steel screen (Table 7.1).
The filter pack for each injection and extraction well consists of #2 Morie sand extending to between 6 inches and 4 feet above the top of screen. A 6-inch to 1-foot transition pack of #0 Morie sand was placed above the #2 sand. A 1- to 3-foot bentonite seal was installed above the filter pack, and cement-bentonite grout was emplaced to within 3 feet of the surface via Tremie pipe (grout was not installed above 3-feet bgs to allow for the below-ground installation of pitless adapters through the well casing). Each well was completed with an approximate 2-foot PVC stick-up.
Development of all the injection and extraction wells was accomplished by surging the well with a surge block and pumping the groundwater until the water was clear and the well was sediment free to the fullest extent practical. Wells were developed using a submersible pump and water was not added to the well to aid in development. The pump, hose, and cable were decontaminated between wells.
Well installation and development activities (including equipment decontamination), and management of IDW were conducted as detailed in the RAWP (Shaw, May 2008). Field activities were conducted in Level D Protection. Underground utility clearances were obtained for all intrusive site activities. After the wells were completed, each well was surveyed by a licensed surveyor to determine its horizontal location to within ±1 foot, and the elevation of the top of the inner PVC well casing to a ±0.01-foot precision.
8.4.1 Systems Construction The groundwater recirculation system and amendment delivery systems were constructed by Shaw between July 23 and October 10, 2008. Both systems were housed within a 40-foot Conex box that was insulated and included lighting and a heating/air conditioning unit. The Conex box was placed in a central location at the site (Figure 8.5).
Temporary electrical service was extended approximately 500 feet from the nearest road (Seneca Drive) to the Conex box to provide power for the pilot test systems. PSE&G, the local electrical service provider, installed one utility pole and extended the service to the USEPA property line. A local electrical subcontractor installed temporary poles and extended the service to the location of the Conex box.

Final Remedial Action Report Project No. 108797 Building 165 and Area 18 C Groundwater Treatment Pilot Systems November 2010
8-6
The following subsections summarize the construction of the groundwater recirculation and amendment delivery systems.
8.4.1.1 Groundwater Recirculation System Three-foot deep trenches were excavated from each of the extraction and injection wells to the Conex box (Figure 8.5). Pitless adapters were installed three feet below grade at each of the extraction and injection wells. Piping was connected to the pitless adapters, installed within the trenches, and passed through the bottom of the Conex box. The trenches to the extraction wells were then backfilled with 18 inches of soil, and the trenches to the injection wells were completely backfilled. Two separate conduits were connected to each extraction well well-head assembly, installed within the 18-inch deep trenches, and passed through the side of the Conex box. The remaining 18 inches of these trenches was then backfilled.
Submersible variable-speed pumps were installed in each of the extraction wells, and tubing from the pump was connected to the pitless adapter. Pump power wires were run from each of the submersible pumps, through the first conduit, and into the Conex box where they were connected to pump controllers and the control panel. Low level and high control probes and a reference probe were installed in each of the extraction wells. The probe wires were passed through the second conduit, and into the Conex box, where they were connected to the control panel.
Piping runs were installed inside the Conex box that connected an extraction well to an injection well (nine loops in total). Within the piping run for each loop were ports for the injection of pH amendment solution and biocide solution, pressure switches, filter housings, and flow meter/totalizers (Figure 8.7). Valves, gauges, and fittings were installed, as necessary, to complete the piping runs and connections.
Shaw coordinated installation of single-phase, 240 Volt, 150 Amp electrical service to the 20-foot Conex box. The controls system consisted of a Control panel (Figure 8.8) that allowed manual adjustments of various operational parameters, including flow rates and sequences and amendment delivery periods and sequences. The panel was connected to flow meters/totalizers and level control probes within the extraction wells, and the pH adjustment and biocide dosing systems.
8.4.1.2 Amendment Delivery Systems Amendment metering pumps (peristaltic pumps) were installed within the 40-foot Conex box for delivery of the pH adjustment solution and biocide solution (Figure 8.9). Each of the nine loops had one metering pump for pH adjustment and one metering pump for biocide. Two 2,500 gallon poly tanks containing pH adjustment solution (site groundwater and either sodium
Final Remedial Action Report Project No. 108797 Building 165 and Area 18 C Groundwater Treatment Pilot Systems November 2010
8-7
or potassium hydroxide) were placed adjacent to the Conex box (Figure 8.10). Piping runs were installed to connect the tanks and the nine pH adjustment metering pumps.
Based on Shaw’s past experience, biofouling prevention for the injection wells included Tetrakis (hydroxymethyl) phosphonium sulfate (THPS), a biodegradable anti-fouling agent (Redux™ Technology, Newfane, Vermont). THPS acts by interfering with bacterial metabolism causing damage to the cell membrane of the bacteria responsible for fouling. THPS-based biocides are effective at preventing and controlling the growth of aerobic and anaerobic bacteria on well screens and other systems equipment. Two 55-gallon drums of biocide were located within the Conex box, and tubing was run to each of the nine biocide metering pumps. Metering pumps were plugged into dedicated 120 Volt outlets that were controlled by timers within the control panel. This system allowed for constant or intermittent operation of the pH adjustment and biocide dosing systems.
An electron donor and nutrient delivery system was installed within the Conex box that included two 165-gallon poly tanks with mixers and three Dosatron metering pumps. Valves installed within the groundwater recirculation piping run allowed for water from three loops at a time to be redirected through tubing to the dosatron pumps. Water flowing through the Dosatron pumps would create a venturi affect that would pull solution (i.e., electron donor or nutrients) from the two poly tanks. The pumps could be manually set to meter the solutions from the tanks at rates between 5 and 20 percent of the total flow through the system. Tubing was then run from the Dosatron, back to the groundwater recirculation piping run, to allow the recirculated groundwater and amendments to be re-injected at the individual injection wells. A photograph of this system is provided in Figure 8.11.
8.4.2 Systems Testing The groundwater recirculation system was successfully tested between October 8 and 9, 2008, to insure proper operation of pumps and controls. During this process, various operating and alarm conditions were simulated, and all equipment and sensors were checked for proper calibration. The communication between the control panel and the various pieces of equipment and sensors was monitored to insure all data was being communicated accurately. Additionally, brief testing of the pH adjustment, biocide, and electron donor/nutrient dosing systems was performed using potable water to check for leaks and allow for selection of proper flow rates and pressures.
Water levels were measured manually in pilot test area monitoring wells, extraction wells, and injection wells prior to and during system operation to determine the impacts of groundwater extraction and injection on local water table elevations. Baseline potentiometric data for the Upper and Lower Sand aquifers are presented in Figures 8.12 and 8.13. Potentiometric surface data collected during system operation are presented in Figure 8.14. Observed groundwater
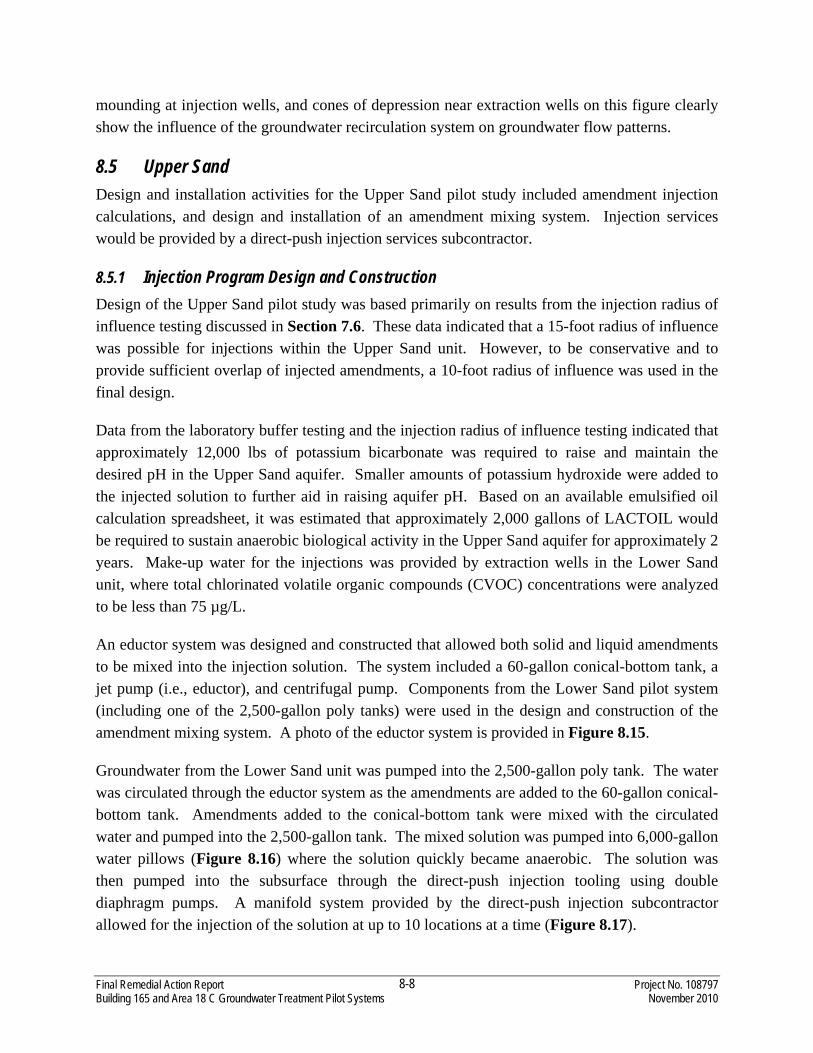
Final Remedial Action Report Project No. 108797 Building 165 and Area 18 C Groundwater Treatment Pilot Systems November 2010
8-8
mounding at injection wells, and cones of depression near extraction wells on this figure clearly show the influence of the groundwater recirculation system on groundwater flow patterns.
8.5 Upper Sand Design and installation activities for the Upper Sand pilot study included amendment injection calculations, and design and installation of an amendment mixing system. Injection services would be provided by a direct-push injection services subcontractor.
8.5.1 Injection Program Design and Construction Design of the Upper Sand pilot study was based primarily on results from the injection radius of influence testing discussed in Section 7.6. These data indicated that a 15-foot radius of influence was possible for injections within the Upper Sand unit. However, to be conservative and to provide sufficient overlap of injected amendments, a 10-foot radius of influence was used in the final design.
Data from the laboratory buffer testing and the injection radius of influence testing indicated that approximately 12,000 lbs of potassium bicarbonate was required to raise and maintain the desired pH in the Upper Sand aquifer. Smaller amounts of potassium hydroxide were added to the injected solution to further aid in raising aquifer pH. Based on an available emulsified oil calculation spreadsheet, it was estimated that approximately 2,000 gallons of LACTOIL would be required to sustain anaerobic biological activity in the Upper Sand aquifer for approximately 2 years. Make-up water for the injections was provided by extraction wells in the Lower Sand unit, where total chlorinated volatile organic compounds (CVOC) concentrations were analyzed to be less than 75 µg/L.
An eductor system was designed and constructed that allowed both solid and liquid amendments to be mixed into the injection solution. The system included a 60-gallon conical-bottom tank, a jet pump (i.e., eductor), and centrifugal pump. Components from the Lower Sand pilot system (including one of the 2,500-gallon poly tanks) were used in the design and construction of the amendment mixing system. A photo of the eductor system is provided in Figure 8.15.
Groundwater from the Lower Sand unit was pumped into the 2,500-gallon poly tank. The water was circulated through the eductor system as the amendments are added to the 60-gallon conical-bottom tank. Amendments added to the conical-bottom tank were mixed with the circulated water and pumped into the 2,500-gallon tank. The mixed solution was pumped into 6,000-gallon water pillows (Figure 8.16) where the solution quickly became anaerobic. The solution was then pumped into the subsurface through the direct-push injection tooling using double diaphragm pumps. A manifold system provided by the direct-push injection subcontractor allowed for the injection of the solution at up to 10 locations at a time (Figure 8.17).
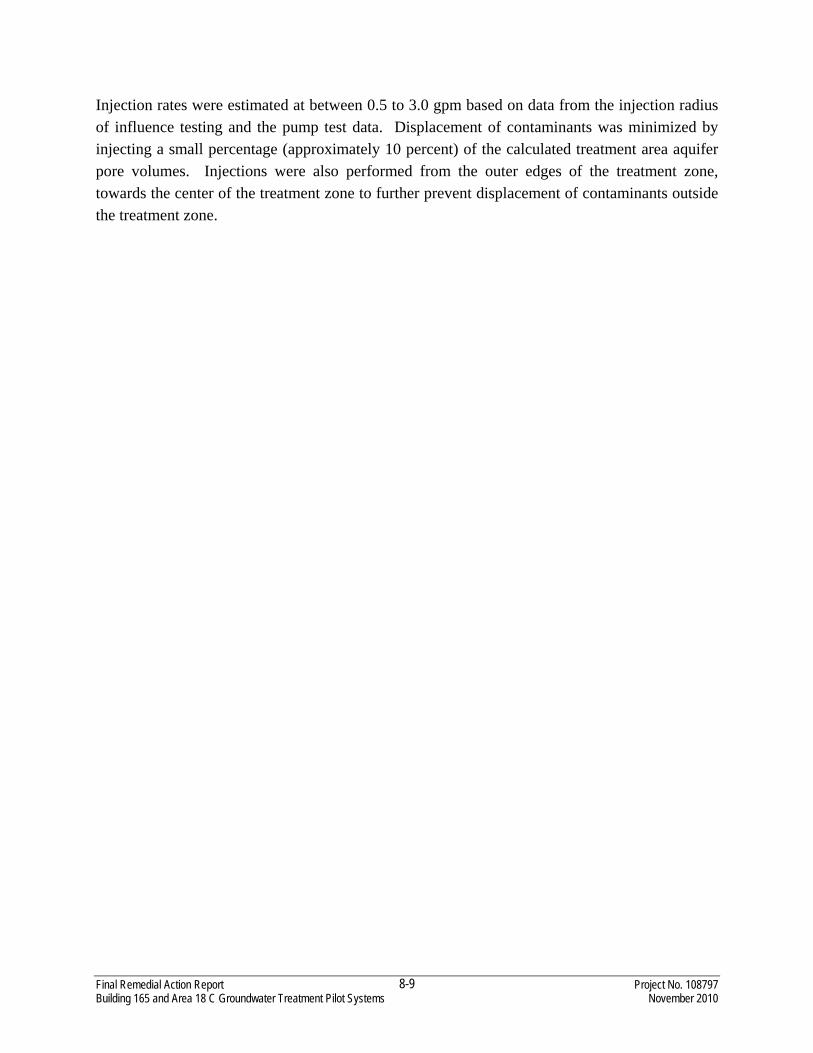
Final Remedial Action Report Project No. 108797 Building 165 and Area 18 C Groundwater Treatment Pilot Systems November 2010
8-9
Injection rates were estimated at between 0.5 to 3.0 gpm based on data from the injection radius of influence testing and the pump test data. Displacement of contaminants was minimized by injecting a small percentage (approximately 10 percent) of the calculated treatment area aquifer pore volumes. Injections were also performed from the outer edges of the treatment zone, towards the center of the treatment zone to further prevent displacement of contaminants outside the treatment zone.
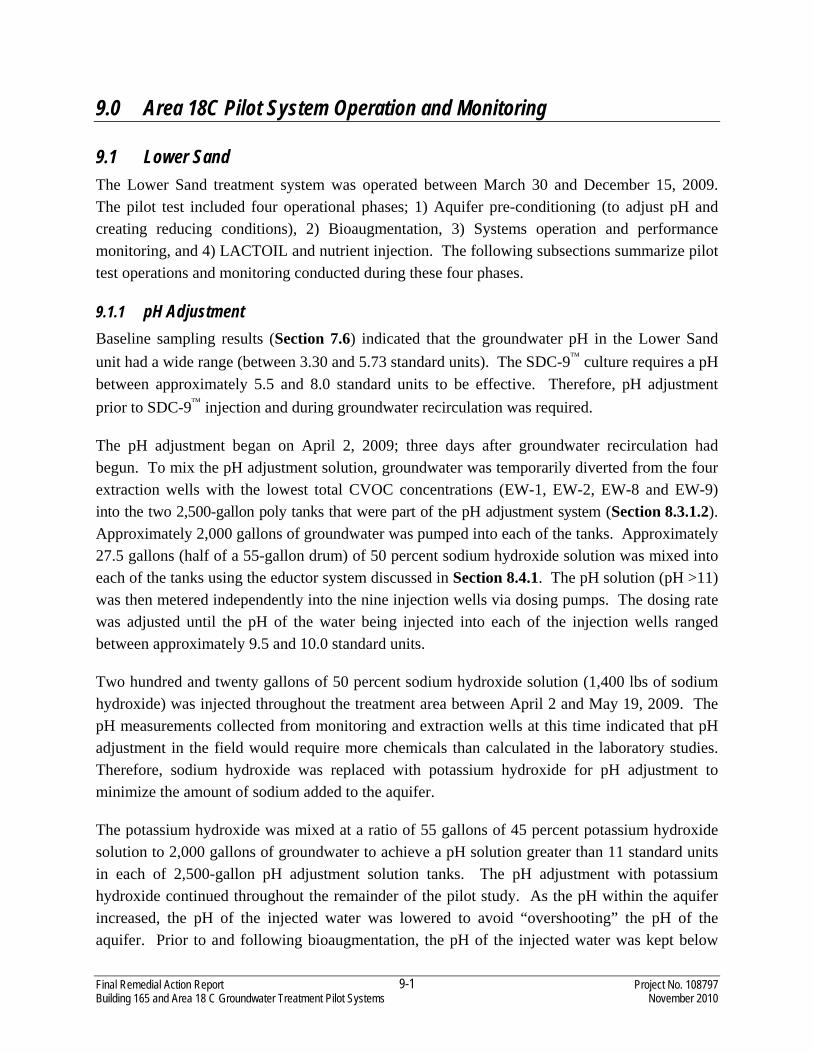
Final Remedial Action Report Project No. 108797 Building 165 and Area 18 C Groundwater Treatment Pilot Systems November 2010
9-1
9.0 Area 18C Pilot System Operation and Monitoring
9.1 Lower Sand The Lower Sand treatment system was operated between March 30 and December 15, 2009. The pilot test included four operational phases; 1) Aquifer pre-conditioning (to adjust pH and creating reducing conditions), 2) Bioaugmentation, 3) Systems operation and performance monitoring, and 4) LACTOIL and nutrient injection. The following subsections summarize pilot test operations and monitoring conducted during these four phases.
9.1.1 pH Adjustment Baseline sampling results (Section 7.6) indicated that the groundwater pH in the Lower Sand unit had a wide range (between 3.30 and 5.73 standard units). The SDC-9 culture requires a pH between approximately 5.5 and 8.0 standard units to be effective. Therefore, pH adjustment prior to SDC-9 injection and during groundwater recirculation was required.
The pH adjustment began on April 2, 2009; three days after groundwater recirculation had begun. To mix the pH adjustment solution, groundwater was temporarily diverted from the four extraction wells with the lowest total CVOC concentrations (EW-1, EW-2, EW-8 and EW-9) into the two 2,500-gallon poly tanks that were part of the pH adjustment system (Section 8.3.1.2). Approximately 2,000 gallons of groundwater was pumped into each of the tanks. Approximately 27.5 gallons (half of a 55-gallon drum) of 50 percent sodium hydroxide solution was mixed into each of the tanks using the eductor system discussed in Section 8.4.1. The pH solution (pH >11) was then metered independently into the nine injection wells via dosing pumps. The dosing rate was adjusted until the pH of the water being injected into each of the injection wells ranged between approximately 9.5 and 10.0 standard units.
Two hundred and twenty gallons of 50 percent sodium hydroxide solution (1,400 lbs of sodium hydroxide) was injected throughout the treatment area between April 2 and May 19, 2009. The pH measurements collected from monitoring and extraction wells at this time indicated that pH adjustment in the field would require more chemicals than calculated in the laboratory studies. Therefore, sodium hydroxide was replaced with potassium hydroxide for pH adjustment to minimize the amount of sodium added to the aquifer.
The potassium hydroxide was mixed at a ratio of 55 gallons of 45 percent potassium hydroxide solution to 2,000 gallons of groundwater to achieve a pH solution greater than 11 standard units in each of 2,500-gallon pH adjustment solution tanks. The pH adjustment with potassium hydroxide continued throughout the remainder of the pilot study. As the pH within the aquifer increased, the pH of the injected water was lowered to avoid “overshooting” the pH of the aquifer. Prior to and following bioaugmentation, the pH of the injected water was kept below

Final Remedial Action Report Project No. 108797 Building 165 and Area 18 C Groundwater Treatment Pilot Systems November 2010
9-2
8.0 standard units. A total of 1,210 gallons of 45 percent potassium hydroxide solution (approximately 6,500 lbs of potassium hydroxide) was injected between May 19 and December 15, 2009.
9.1.2 Lactate and Nutrient Injections Regular lactate and nutrient injections began on May 26, 2009. During the first injection, between 80 and 100 gallons of 60 percent sodium lactate solution were injected over a 4-day period into each of the nine injections wells using the Dosatron injection system discussed in Section 8.3.1.2. Nutrients, including 10 lbs. of solid Accelerite (a mixture of water soluble bioremediation metabolites including B-vitamins, yeast factors, and other products of fermentation generated by the metabolism of a sugar source. manufactured by JRW Bioremediation, LLC) and 12.5 lbs. of solid (crystalline) diammonium phosphate (DAP) were mixed into solution and injected into each of the injection wells during this period. After the first injection, the solid Accelerite was replaced with liquid Accelerite, due to low solubility observed with the solid product. Eight additional injections of lactate and nutrients were performed between June 30 and October 20, 2009 (approximately every two to four weeks). Lactate injections ranged between 45 and 90 gallons per event. Three gallons of liquid Accelerite and 12.5 lbs of DAP were also injected into each injection well per event. Yeast extract was added to this mix to further enhance biological activity.
A total of 1,940 gallons of 60 percent sodium lactate solution, 100 lbs. of solid Accelerite, 50 gallons of liquid Accelerite, 312.5 lbs. of DAP, and 40 lbs. of yeast extract were injected in the Lower Sand treatment zone between May 26 and October 20, 2009.
9.1.3 Bioaugmentation To ensure that bioaugmentation was successful during the pilot test, criteria for optimal aquifer conditions (including pH, ORP and DO) needed to be achieved in the Lower Sand aquifer (as detailed in Section 2.5.7 of the RAWP). Monitoring wells and extraction wells were monitored on a regular basis until these criteria were attained in early July, and bioaugmentation was performed on July, 8, 2009.
Prior to the bioaugmentation injections, approximately 2,250 gallons of groundwater were pumped from extraction wells EW-1, EW-2, EW-8 and EW-9 (the extraction wells with the lowest total CVOCs) into one of the 2,500 gallon poly tanks. Ten gallons of lactate, 50 lbs. of yeast extract and 200 lbs. of potassium bicarbonate were mixed with the groundwater and pumped into a water pillow (Figure 8.16).
Four hundred liters of SDC-9™ culture was grown at Shaw’s fermentation facility in Lawrenceville, New Jersey immediately prior to injection. The culture was concentrated approximately 10 fold and delivered to the Site under nitrogen pressure in two 19 liter soda kegs.
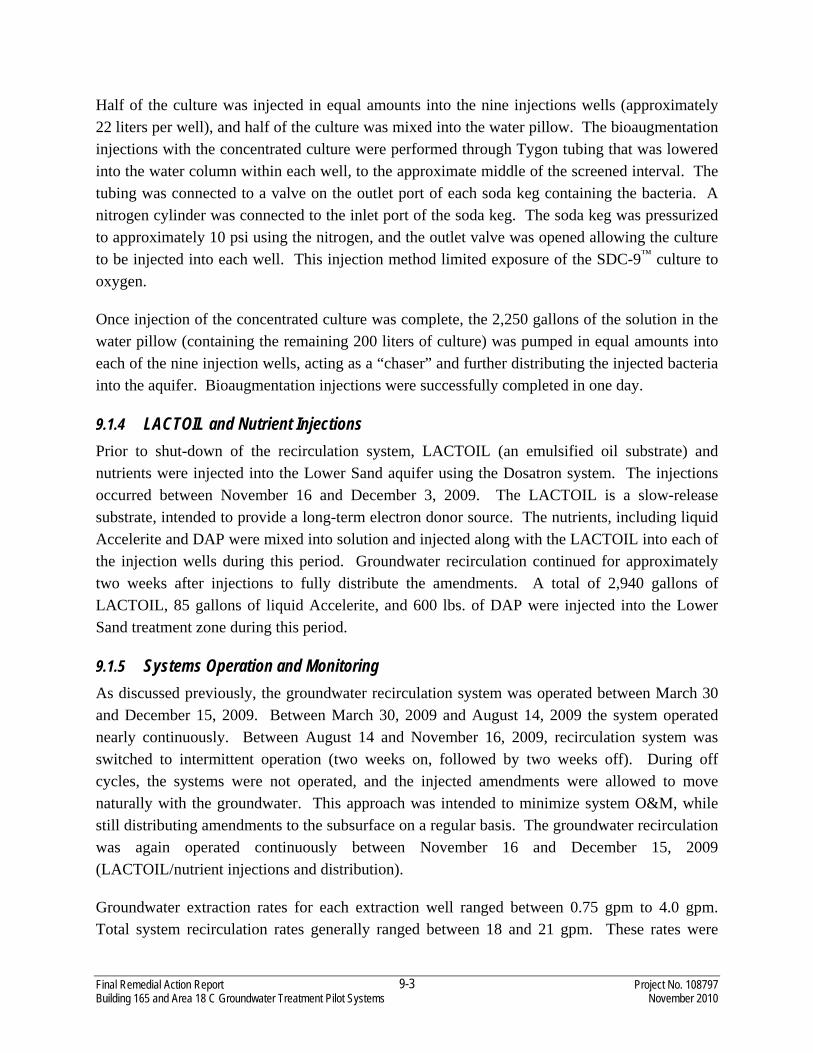
Final Remedial Action Report Project No. 108797 Building 165 and Area 18 C Groundwater Treatment Pilot Systems November 2010
9-3
Half of the culture was injected in equal amounts into the nine injections wells (approximately 22 liters per well), and half of the culture was mixed into the water pillow. The bioaugmentation injections with the concentrated culture were performed through Tygon tubing that was lowered into the water column within each well, to the approximate middle of the screened interval. The tubing was connected to a valve on the outlet port of each soda keg containing the bacteria. A nitrogen cylinder was connected to the inlet port of the soda keg. The soda keg was pressurized to approximately 10 psi using the nitrogen, and the outlet valve was opened allowing the culture to be injected into each well. This injection method limited exposure of the SDC-9™ culture to oxygen.
Once injection of the concentrated culture was complete, the 2,250 gallons of the solution in the water pillow (containing the remaining 200 liters of culture) was pumped in equal amounts into each of the nine injection wells, acting as a “chaser” and further distributing the injected bacteria into the aquifer. Bioaugmentation injections were successfully completed in one day.
9.1.4 LACTOIL and Nutrient Injections Prior to shut-down of the recirculation system, LACTOIL (an emulsified oil substrate) and nutrients were injected into the Lower Sand aquifer using the Dosatron system. The injections occurred between November 16 and December 3, 2009. The LACTOIL is a slow-release substrate, intended to provide a long-term electron donor source. The nutrients, including liquid Accelerite and DAP were mixed into solution and injected along with the LACTOIL into each of the injection wells during this period. Groundwater recirculation continued for approximately two weeks after injections to fully distribute the amendments. A total of 2,940 gallons of LACTOIL, 85 gallons of liquid Accelerite, and 600 lbs. of DAP were injected into the Lower Sand treatment zone during this period.
9.1.5 Systems Operation and Monitoring As discussed previously, the groundwater recirculation system was operated between March 30 and December 15, 2009. Between March 30, 2009 and August 14, 2009 the system operated nearly continuously. Between August 14 and November 16, 2009, recirculation system was switched to intermittent operation (two weeks on, followed by two weeks off). During off cycles, the systems were not operated, and the injected amendments were allowed to move naturally with the groundwater. This approach was intended to minimize system O&M, while still distributing amendments to the subsurface on a regular basis. The groundwater recirculation was again operated continuously between November 16 and December 15, 2009 (LACTOIL/nutrient injections and distribution).
Groundwater extraction rates for each extraction well ranged between 0.75 gpm to 4.0 gpm. Total system recirculation rates generally ranged between 18 and 21 gpm. These rates were
Final Remedial Action Report Project No. 108797 Building 165 and Area 18 C Groundwater Treatment Pilot Systems November 2010
9-4
approximately one third of that predicted by the groundwater model. The reduced rates were due to both poor yield of some extraction wells, and pressure buildup at some injection wells that limited injection/extraction rates.
The system control panel allowed for manual monitoring and adjustments of groundwater extraction and injection rates, as well as amendment injection frequency and duration. System operating parameters were adjusted as necessary to optimize performance. Additionally, Shaw personnel performed regular site checks and maintenance of the groundwater recirculation and amendment delivery systems during operational period. Site checks included measurements of system pressures (manual gauges), water levels, extraction and injection flow rates and totals, mixing of amendment solutions, as well as leak checks and filter changes. The mixing of amendment solutions (primarily pH adjustment solution) and filter changes were the most time-intensive O&M component.
The biocide injection system was intended to dose injection wells with biocide automatically for short periods of time (approximately 30 minutes) daily. However, a vacuum imposed by the recirculation of groundwater caused biocide solution to be drawn from the 55-gallon drum during normal systems operation. Attempts to alleviate this problem were unsuccessful. Therefore, manual injections of biocide in the injection and extraction wells were performed during regular visits to the site. Water levels in the extraction wells and water levels and/or injection pressures in the injection wells were monitored for signs of fouling.
9.1.6 Groundwater Monitoring Groundwater monitoring was performed to evaluate changes in biogeochemical conditions, chlorinated ethene concentrations, and electron donor concentrations and consumption rates. In addition to the two Baseline sampling events, a total of seven groundwater sampling events were conducted during the Lower Sand pilot test. These include one aquifer pre-conditioning event, four performance monitoring events, and two post-operation sampling events. Groundwater samples were collected from the seven Lower Sand monitoring wells (MW-114, MW-114A, MW-300D, MW-301D, MW-304D, MW-305D and MW-306D) and the nine extraction wells (EW-1 through EW-9). Tables 7.5 and 7.6 summarize the groundwater sampling schedule, the wells sampled, and the analyses that were performed during these events.
Sampling was performed by Shaw personnel, as described in Section 7.7. Groundwater samples were submitted to Test America Laboratories, Inc. in Edison, New Jersey. Analyses of groundwater collected during the performance monitoring sampling events included VOCs, reduced gases, anions (including nitrate and sulfate), VFAs, and dissolved iron and manganese (Table 7.8).
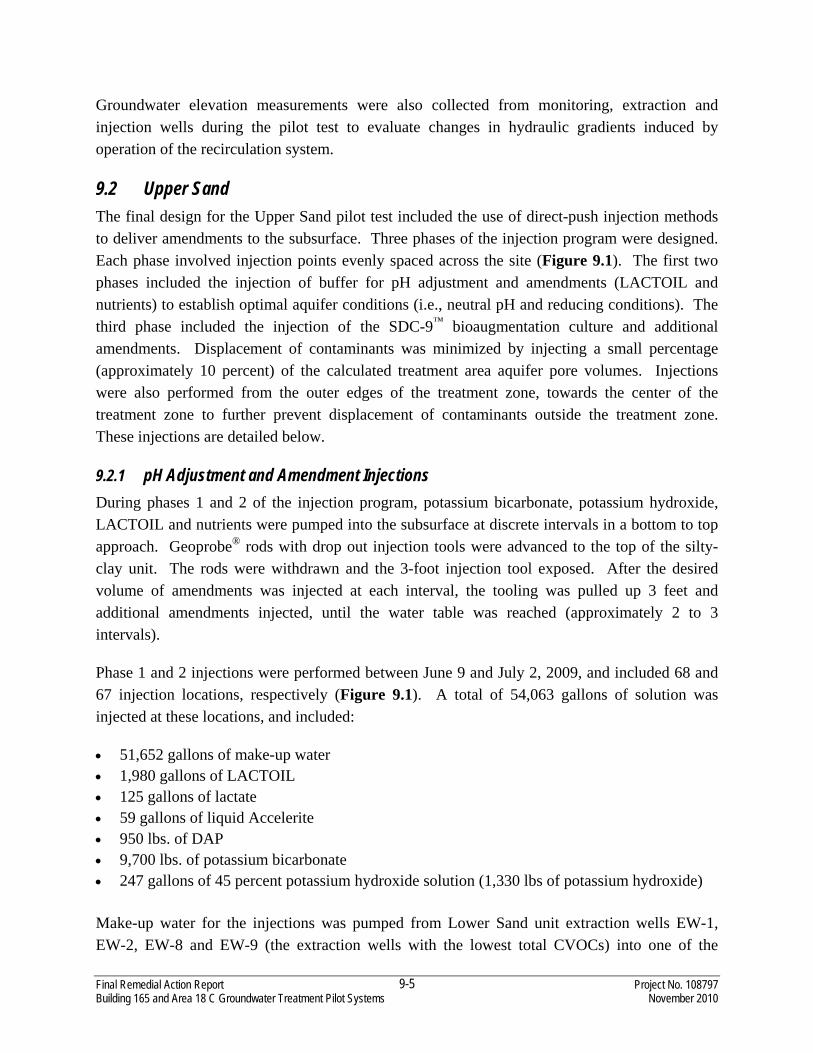
Final Remedial Action Report Project No. 108797 Building 165 and Area 18 C Groundwater Treatment Pilot Systems November 2010
9-5
Groundwater elevation measurements were also collected from monitoring, extraction and injection wells during the pilot test to evaluate changes in hydraulic gradients induced by operation of the recirculation system.
9.2 Upper Sand The final design for the Upper Sand pilot test included the use of direct-push injection methods to deliver amendments to the subsurface. Three phases of the injection program were designed. Each phase involved injection points evenly spaced across the site (Figure 9.1). The first two phases included the injection of buffer for pH adjustment and amendments (LACTOIL and nutrients) to establish optimal aquifer conditions (i.e., neutral pH and reducing conditions). The third phase included the injection of the SDC-9™ bioaugmentation culture and additional amendments. Displacement of contaminants was minimized by injecting a small percentage (approximately 10 percent) of the calculated treatment area aquifer pore volumes. Injections were also performed from the outer edges of the treatment zone, towards the center of the treatment zone to further prevent displacement of contaminants outside the treatment zone. These injections are detailed below.
9.2.1 pH Adjustment and Amendment Injections During phases 1 and 2 of the injection program, potassium bicarbonate, potassium hydroxide, LACTOIL and nutrients were pumped into the subsurface at discrete intervals in a bottom to top approach. Geoprobe® rods with drop out injection tools were advanced to the top of the silty-clay unit. The rods were withdrawn and the 3-foot injection tool exposed. After the desired volume of amendments was injected at each interval, the tooling was pulled up 3 feet and additional amendments injected, until the water table was reached (approximately 2 to 3 intervals).
Phase 1 and 2 injections were performed between June 9 and July 2, 2009, and included 68 and 67 injection locations, respectively (Figure 9.1). A total of 54,063 gallons of solution was injected at these locations, and included:
• 51,652 gallons of make-up water • 1,980 gallons of LACTOIL • 125 gallons of lactate • 59 gallons of liquid Accelerite • 950 lbs. of DAP • 9,700 lbs. of potassium bicarbonate • 247 gallons of 45 percent potassium hydroxide solution (1,330 lbs of potassium hydroxide)
Make-up water for the injections was pumped from Lower Sand unit extraction wells EW-1, EW-2, EW-8 and EW-9 (the extraction wells with the lowest total CVOCs) into one of the

Final Remedial Action Report Project No. 108797 Building 165 and Area 18 C Groundwater Treatment Pilot Systems November 2010
9-6
2,500 gallon poly tanks (Figure 8.10). The eductor system (Figure 8.15) discussed in Section 8.4.1 was used to mix the various amendments into one of the tanks. The water from the tank was circulated through the eductor system as the amendments were added to the 60-gallon conical-bottom tank. The mixed solution was then pumped into 6,000 gallon water pillows (Figure 8.16) where the solution quickly became anaerobic. The solution was then pumped into the subsurface through the direct-push injection tooling using double diaphragm pumps. A manifold system provided by the direct-push injection subcontractor allowed for the injection of the solution at up to 10 locations at a time (Figure 8.17). Injection rates ranged between 0.5 to 3.0 gpm, based on location and depth.
9.2.2 Bioaugmentation Injections During phases 3 of the injection program, SDC-9™ culture, potassium bicarbonate, lactate and nutrients were pumped into the subsurface at discrete intervals in a bottom to top approach. Injection methods were the same as for phases 1 and 2. Phase 3 injections were performed between June 9 and July 2, 2009, and included 67 injection locations (Figure 9.1). A total of 5,282 gallons of solution was injected at these locations, and included:
• 200 liters of SDC-9™ culture • 20 gallons of lactate • 50 lbs. of yeast extract • 12.5 lbs. of DAP • 450 lbs. of potassium bicarbonate
Mixing procedures for the amendments were the same as for phases 1 and 2. When reducing conditions had been achieved in the water pillow (as determined by field measurements using a field meter), the SDC-9 culture was added immediately prior to injection. Injection rates ranged between 0.5 to 3.0 gpm, based on location and depth.
9.2.3 Groundwater Monitoring Groundwater monitoring was performed to evaluate changes in biogeochemical conditions, chlorinated ethene concentrations, and electron donor concentrations and consumption rates. In addition to the two Baseline sampling events, six performance monitoring sampling events were conducted during the Upper Sand pilot test. Groundwater samples were collected from the seven Upper Sand monitoring wells (MW-300S, MW-301S, MW-302S, MW-303S and MW-305S). Table 7.7 summarizes the groundwater sampling schedule, the wells sampled, and the analyses that were performed during these events.
Sampling was performed by Shaw personnel, as described in Section 7.7. Groundwater samples were submitted to Test America Laboratories, Inc. in Edison, New Jersey. Analyses of groundwater collected during the performance monitoring sampling events included VOCs,

Final Remedial Action Report Project No. 108797 Building 165 and Area 18 C Groundwater Treatment Pilot Systems November 2010
9-7
reduced gases, anions (including nitrate and sulfate), VFAs, and dissolved iron and manganese (Table 7.8). Groundwater elevation measurements were also collected from monitoring wells during the pilot test to evaluate seasonal water table fluctuations.
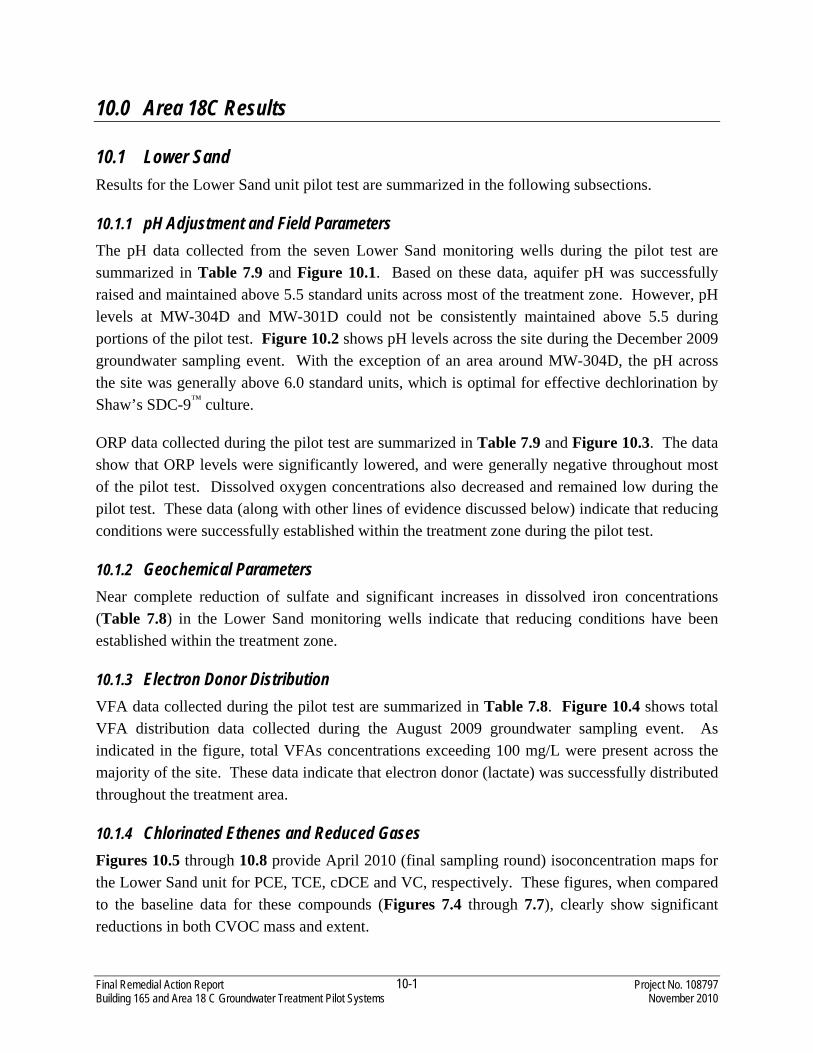
Final Remedial Action Report Project No. 108797 Building 165 and Area 18 C Groundwater Treatment Pilot Systems November 2010
10-1
10.0 Area 18C Results
10.1 Lower Sand Results for the Lower Sand unit pilot test are summarized in the following subsections.
10.1.1 pH Adjustment and Field Parameters The pH data collected from the seven Lower Sand monitoring wells during the pilot test are summarized in Table 7.9 and Figure 10.1. Based on these data, aquifer pH was successfully raised and maintained above 5.5 standard units across most of the treatment zone. However, pH levels at MW-304D and MW-301D could not be consistently maintained above 5.5 during portions of the pilot test. Figure 10.2 shows pH levels across the site during the December 2009 groundwater sampling event. With the exception of an area around MW-304D, the pH across the site was generally above 6.0 standard units, which is optimal for effective dechlorination by Shaw’s SDC-9™ culture.
ORP data collected during the pilot test are summarized in Table 7.9 and Figure 10.3. The data show that ORP levels were significantly lowered, and were generally negative throughout most of the pilot test. Dissolved oxygen concentrations also decreased and remained low during the pilot test. These data (along with other lines of evidence discussed below) indicate that reducing conditions were successfully established within the treatment zone during the pilot test.
10.1.2 Geochemical Parameters Near complete reduction of sulfate and significant increases in dissolved iron concentrations (Table 7.8) in the Lower Sand monitoring wells indicate that reducing conditions have been established within the treatment zone.
10.1.3 Electron Donor Distribution VFA data collected during the pilot test are summarized in Table 7.8. Figure 10.4 shows total VFA distribution data collected during the August 2009 groundwater sampling event. As indicated in the figure, total VFAs concentrations exceeding 100 mg/L were present across the majority of the site. These data indicate that electron donor (lactate) was successfully distributed throughout the treatment area.
10.1.4 Chlorinated Ethenes and Reduced Gases Figures 10.5 through 10.8 provide April 2010 (final sampling round) isoconcentration maps for the Lower Sand unit for PCE, TCE, cDCE and VC, respectively. These figures, when compared to the baseline data for these compounds (Figures 7.4 through 7.7), clearly show significant reductions in both CVOC mass and extent.
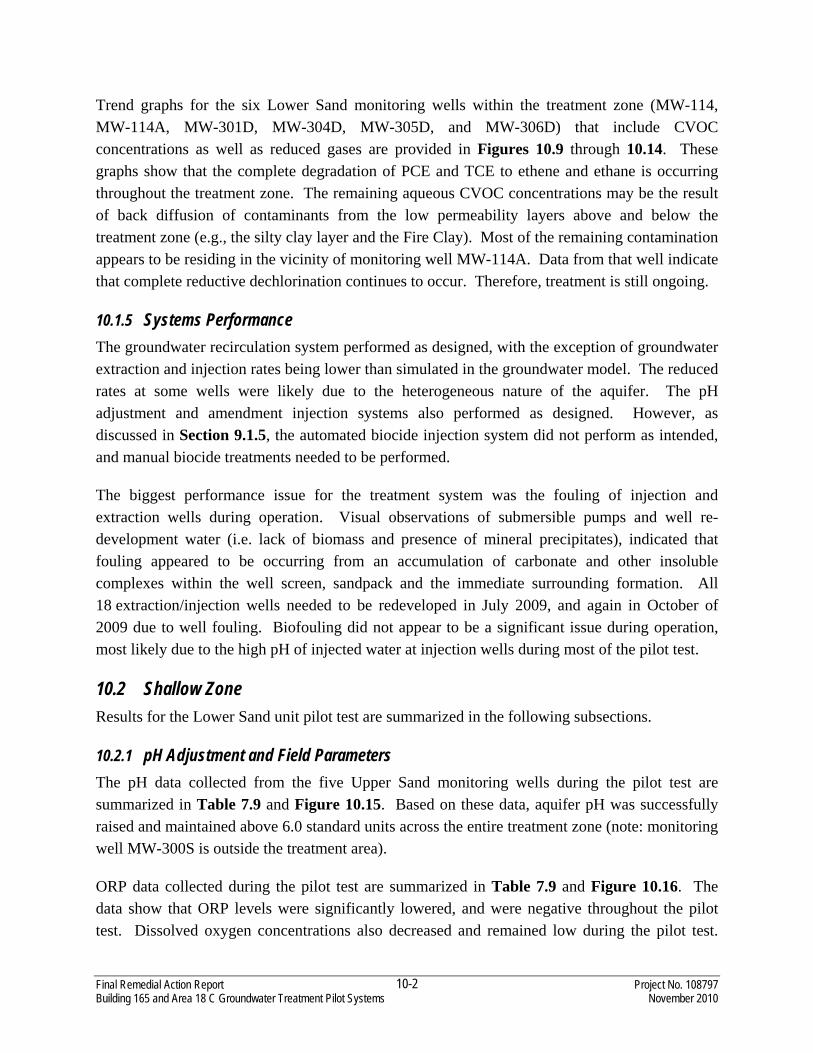
Final Remedial Action Report Project No. 108797 Building 165 and Area 18 C Groundwater Treatment Pilot Systems November 2010
10-2
Trend graphs for the six Lower Sand monitoring wells within the treatment zone (MW-114, MW-114A, MW-301D, MW-304D, MW-305D, and MW-306D) that include CVOC concentrations as well as reduced gases are provided in Figures 10.9 through 10.14. These graphs show that the complete degradation of PCE and TCE to ethene and ethane is occurring throughout the treatment zone. The remaining aqueous CVOC concentrations may be the result of back diffusion of contaminants from the low permeability layers above and below the treatment zone (e.g., the silty clay layer and the Fire Clay). Most of the remaining contamination appears to be residing in the vicinity of monitoring well MW-114A. Data from that well indicate that complete reductive dechlorination continues to occur. Therefore, treatment is still ongoing.
10.1.5 Systems Performance The groundwater recirculation system performed as designed, with the exception of groundwater extraction and injection rates being lower than simulated in the groundwater model. The reduced rates at some wells were likely due to the heterogeneous nature of the aquifer. The pH adjustment and amendment injection systems also performed as designed. However, as discussed in Section 9.1.5, the automated biocide injection system did not perform as intended, and manual biocide treatments needed to be performed.
The biggest performance issue for the treatment system was the fouling of injection and extraction wells during operation. Visual observations of submersible pumps and well re-development water (i.e. lack of biomass and presence of mineral precipitates), indicated that fouling appeared to be occurring from an accumulation of carbonate and other insoluble complexes within the well screen, sandpack and the immediate surrounding formation. All 18 extraction/injection wells needed to be redeveloped in July 2009, and again in October of 2009 due to well fouling. Biofouling did not appear to be a significant issue during operation, most likely due to the high pH of injected water at injection wells during most of the pilot test.
10.2 Shallow Zone Results for the Lower Sand unit pilot test are summarized in the following subsections.
10.2.1 pH Adjustment and Field Parameters The pH data collected from the five Upper Sand monitoring wells during the pilot test are summarized in Table 7.9 and Figure 10.15. Based on these data, aquifer pH was successfully raised and maintained above 6.0 standard units across the entire treatment zone (note: monitoring well MW-300S is outside the treatment area).
ORP data collected during the pilot test are summarized in Table 7.9 and Figure 10.16. The data show that ORP levels were significantly lowered, and were negative throughout the pilot test. Dissolved oxygen concentrations also decreased and remained low during the pilot test.
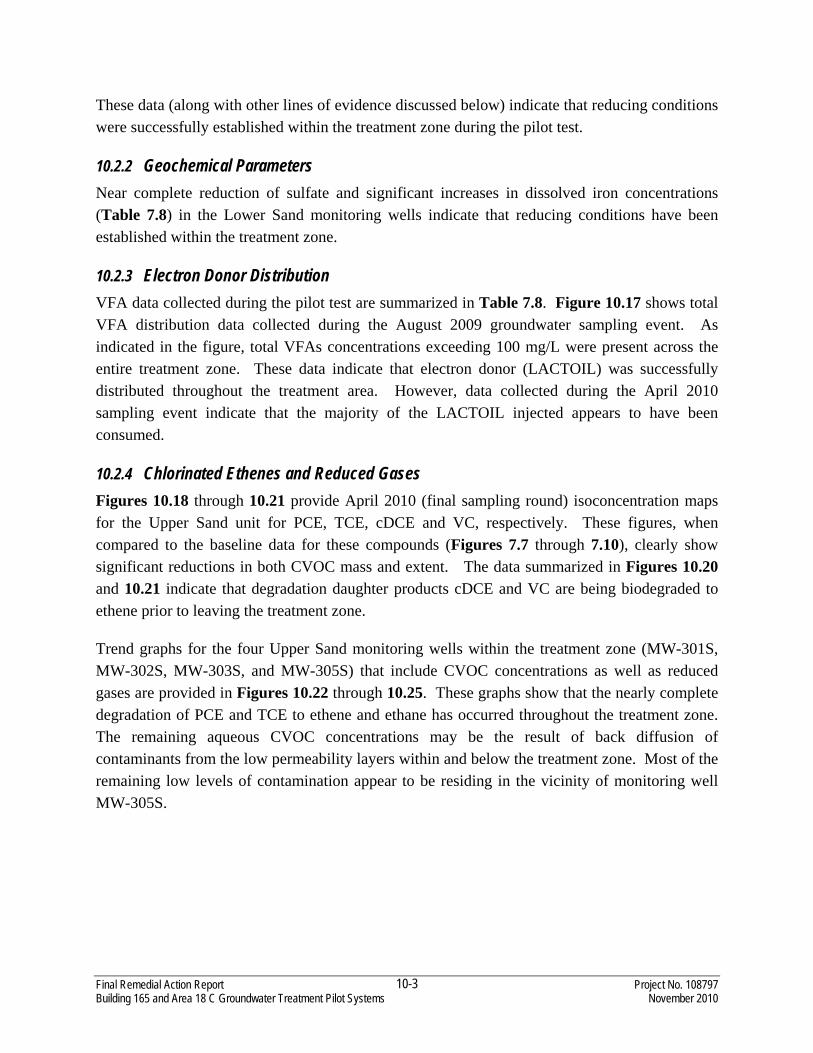
Final Remedial Action Report Project No. 108797 Building 165 and Area 18 C Groundwater Treatment Pilot Systems November 2010
10-3
These data (along with other lines of evidence discussed below) indicate that reducing conditions were successfully established within the treatment zone during the pilot test.
10.2.2 Geochemical Parameters Near complete reduction of sulfate and significant increases in dissolved iron concentrations (Table 7.8) in the Lower Sand monitoring wells indicate that reducing conditions have been established within the treatment zone.
10.2.3 Electron Donor Distribution VFA data collected during the pilot test are summarized in Table 7.8. Figure 10.17 shows total VFA distribution data collected during the August 2009 groundwater sampling event. As indicated in the figure, total VFAs concentrations exceeding 100 mg/L were present across the entire treatment zone. These data indicate that electron donor (LACTOIL) was successfully distributed throughout the treatment area. However, data collected during the April 2010 sampling event indicate that the majority of the LACTOIL injected appears to have been consumed.
10.2.4 Chlorinated Ethenes and Reduced Gases Figures 10.18 through 10.21 provide April 2010 (final sampling round) isoconcentration maps for the Upper Sand unit for PCE, TCE, cDCE and VC, respectively. These figures, when compared to the baseline data for these compounds (Figures 7.7 through 7.10), clearly show significant reductions in both CVOC mass and extent. The data summarized in Figures 10.20 and 10.21 indicate that degradation daughter products cDCE and VC are being biodegraded to ethene prior to leaving the treatment zone.
Trend graphs for the four Upper Sand monitoring wells within the treatment zone (MW-301S, MW-302S, MW-303S, and MW-305S) that include CVOC concentrations as well as reduced gases are provided in Figures 10.22 through 10.25. These graphs show that the nearly complete degradation of PCE and TCE to ethene and ethane has occurred throughout the treatment zone. The remaining aqueous CVOC concentrations may be the result of back diffusion of contaminants from the low permeability layers within and below the treatment zone. Most of the remaining low levels of contamination appear to be residing in the vicinity of monitoring well MW-305S.
Final Remedial Action Report Project No. 108797 Building 165 and Area 18 C Groundwater Treatment Pilot Systems November 2010
11-1
11.0 Conclusions and Recommendations
11.1 165 Fieldcrest Avenue The problems encountered distributing permanganate to the northern and northeastern portion of the treatment zone hindered the effectiveness of the treatment, as the presence of utility lines in the area and heterogeneous fill material near the road made controlling the permanganate during injection difficult. Due to these inefficiencies in distributing the permanganate and the concentrations of TCE and other chlorinated compounds remaining in the treatment zone monitoring wells, the effectiveness of the treatment could be described as marginal, as of the date of this report. However, future monitoring of the wells may prove to show that significant reductions of contaminants in areas where permanganate still resides can be achieved, indicating that if permanganate distribution can be controlled, the remedial technology may have application advantages at other portions of the AOC2 plume.
Additional monitoring of wells at the site will be conducted as part of the base-wide long-term monitoring program, to assess concentrations at wells that currently contain permanganate and those that have not been sampled since baseline. If permanganate persists at these locations for an extended period of time and sampling becomes required, potential methods could be employed to remove the permanganate from the samples prior to laboratory analysis, including adding a reductant. This monitoring can ultimately be used to assess the overall effectiveness of permanganate ISCO in the areas where distribution was achieved; and thus assess the applicability of the technology at other portions of the AOC2 plume.
11.2 Area 18C The results from both the Upper and Lower Sand unit pilot tests indicate that significant reduction of target contaminants can be quickly accomplished through pH adjustment and bioaugmentation. Since the majority of the remaining contaminated portions of the AOC2 plume reside within the shallow aquifer, application of the direct-push injection approach has the potential to be cost effective for mass removal.
It is recommended that additional monitoring of select wells at the site be conducted to assess continued performance of the two pilot tests. This monitoring can ultimately be used to assess the overall effectiveness of bioremediation and assess the applicability of the technology for other portions of the AOC2 plume.
Final Remedial Action Report Project No. 108797 Building 165 and Area 18 C Groundwater Treatment Pilot Systems November 2010
12-1
12.0 Lessons Learned
Throughout the planning, design and execution of the pilot studies at 165 Fieldcrest Avenue and Area 18C, many issues were encountered and were required to be taken into consideration to obtain favorable results. These issues are highlighted below.
165 Fieldcrest Ave.
• Excessive underground utility lines, particularly the compromised storm sewer, hindered the control of injectant, ultimately causing a change in the injection program design. An extraction portion of the system was included, in an attempt to better control the distribution of injectant. Careful attention to the underground utility lines located throughout the AOC 2 plume will be an important design step in implementing the technology in other areas of the dissolved-phase plume. A monitoring program for the stormwater system will be required at other potential implementation areas.
• The shallow groundwater table, combined with the shallow depth to the surface aquifer’s confining layer, made sufficiently distributing injectant without breaching the ground surface a challenge. Horizontal wells were chosen to be implemented to combat this problem, while allowing injection under the building without access to the slab. If vertical injection points were to be used in other areas of the plume with similar water and confining layer depths, the wells would need to be closely spaced, most likely resulting in drilling costs similar to those for horizontal well installation.
• While horizontal wells allowed for distribution of injectant under the inaccessible building, the presence of plume under the structure and the inability to install monitoring points made for monitoring data gaps under the building.
• The operating commercial building required several steps be taken during the installation and operation of the system to minimize disruption to the tenants and visitors. Avoiding interaction with employees and visitors of the building was sometimes difficult, with equipment damage occurring on more than one occasion. A more rigorous barrier or fence system should be considered for additional areas of the plume, based on the logistics of the area.
• Potassium permanganate is a chemical that is monitored by the Dept. of Homeland Security and requires significant regulatory steps in order to handle and store the chemical. The remote storage area for the bins of chemical (USEPA property) posed a challenge (both

Final Remedial Action Report Project No. 108797 Building 165 and Area 18 C Groundwater Treatment Pilot Systems November 2010
12-2
logistically and from a safety perspective), as a fork-lift was required to move each bin along a main road within the commercial business park. Therefore, the location of any other treatment areas within AOC 2, and its ease of accessing the USEPA property, must be considered in choosing the oxidant for implementation. If the area is not easily accessed from the USEPA property, sodium permanganate, which is not regulated by the Dept. of Homeland Security but will give similar remedial results, should be considered as an alternative. The area would have to have enough space to store the bins/drums of product during the injection time-frame.
Area 18 C/Ramp Area
• Results of the Pre-design activities indicated that the Upper Sand unit and Lower Sand unit were two distinct aquifers that would require separate treatment approaches. The data indicated that groundwater recirculation could be effective for the Lower Sand unit, but not as effective for the Upper Sand unit (because of the low hydraulic conductivity of this unit). The wide range in pH values for the Lower Sand also made groundwater recirculation a more reasonable approach, because it would allow for pH control at individual injection wells, thus providing operational flexibility that would allow for the increase and leveling of groundwater pH across the treatment area. Testing results indicated that direct-push injections could be effective at delivering amendments for pH adjustment, as well as a carbon source and nutrients. Additionally, applications in similar geologies have shown that the SDC-9 culture can be delivered to the subsurface successfully using direct-push injection techniques. Therefore, it was determined that the remedial approach for the Upper Sand unit would involve injection of buffer and amendments via direct-push points.
• The groundwater pH in the Upper Sand aquifer was successfully raised and maintained above 5.5 standard units across the entire treatment zone using potassium bicarbonate (and lesser amounts of potassium hydroxide). Achieving and maintaining a neutral groundwater pH was key to bioaugmentation effectiveness.
• The groundwater pH in the Lower Sand aquifer was successfully raised and maintained above 5.5 standard units across most of the treatment zone using sodium and potassium hydroxide. However, pH levels in the vicinity of monitoring wells MW-304D and MW-301D could not be consistently maintained above 5.5 during portions of the pilot test. The addition of a buffering agent (like the potassium bicarbonate used in the Upper Sand Unit) during the demonstration may have improved pH stabilization (i.e., maintained a neutral pH) within the treatment zone. The amount of LACTOIL added to the Upper Sand unit appears to
Final Remedial Action Report Project No. 108797 Building 165 and Area 18 C Groundwater Treatment Pilot Systems November 2010
12-3
have been sufficient for effective treatment of target contaminants. However, the absence of organic carbon at the end of the pilot test indicates that the electron donor was consumed faster than was estimated. An additional safety factor should be applied when calculating electron donor requirements for future applications.
• The use of lactate as the electron donor in the Lower Sand Unit during active groundwater recirculation provided a consistent, easy to distribute carbon source, while the addition of LACTOIL at the end of the pilot testing period appears to be providing a more long-term carbon source for continued biological treatment of target contaminants.
• The use of groundwater filtration and a chelating agent appears to have limited the amount of mineral precipitation and well fouling during pH adjustment and groundwater recirculation in the Lower Sand Unit pilot test.
• The phased approach that included groundwater recirculation and pH adjustment, followed by establishing reducing conditions (i.e., electron donor addition), and bioaugmentation was extremely successful in treating the Lower Sand Unit.
• The phased approach that included direct-push injections for pH adjustment and establishing reducing conditions, followed by bioaugmentation was extremely successful in treating the Upper Sand Unit.
For any future pilot studies or full-scale implementation of these types of systems within AOC 2 or other areas of the former Raritan Arsenal, the above issues should be fully considered.

Final Remedial Action Report Project No. 108797 Building 165 and Area 18 C Groundwater Treatment Pilot Systems November 2010
13-1
13.0 References
Clement, T.P. 1997. A Modular Computer code for Simulating Reactive Multi-Species Transport in 3-Dimensional Groundwater Aquifers. Pacific Northwest National Laboratory, Richland WA, USA. PNNL-11720. Found online at: http://bioprocess.pnl.gov/rt3d.htm.
Dragun J., 1998. The Soil Chemistry of Hazardous Materials. Second Edition. Amherst, MA: Amherst Scientific Press. 830 pgs.
Fetter, C.W., 1994. Applied Hydrogeology.
Hantush, M.S. and C.E.-Jacob, 1955. Non-steady radial flow in an infinite leaky aquifer, AM. Geophys. Union Trans., Vol. 35, pp. 95-100.
Moench, A.F., 1997. Flow to a well of finite diameter in a homogeneous, anisotropic water table aquifer, Water Resources Research, Vol. 33, No. 6, pp. 1397-1407.
Neuman, S.P. and P.A. Witherspoon, 1969. Theory of flow in a confined two aquifer system, Water Resources Research, Vol. 5, No. 4, pp. 803-816.
New Jersey Department of Environmental Protection (NJDEP), 2005. Technical Requirements for Site Remediation, N.J.A.C. 7:26E. July.
NJDEP, 2005. Field Sampling Procedures Manual. August.
Shaw Environmental, Inc. (Shaw), 2008. Technology Selection Report. February.
Shaw, 2008. Remedial Action Work Plan (RAWP). May.
Tartakovsky, G.D. and S.P. Neuman, 2007. Three-dimensional saturated-unsaturated flow with axial symmetry to a partially penetrating well in a compressible unconfined aquifer, Water Resources Research, W01410, doi:1029/2006WR005153.
USGS, 1996.
Weston, 2005. Site Comprehensive Sampling and Analysis Plan (SAP).
Weston, 2006. Phase 1 Groundwater RAWP, Groundwater AOC 2 Treatability Study.

Tables

Figures

Appendix A
Technology Selection Report (CD)

Appendix B
Permit by Rule Documentation

Appendix C
Geoprobe® Boring Logs – 165 Fieldcrest Avenue
Appendix D
Geophysical Survey – 165 Fieldcrest Avenue
Appendix E
165 Fieldcrest Avenue Monitoring Well Boring Logs/ Completion Diagrams
Appendix F
Permanganate Injection Simulation Model
Appendix G
Horizontal Well Installation Documentation
Appendix H
Injection Well and Piezometer Boring Logs/ Completion Diagrams – 165 Fieldcrest Avenue
Appendix I
Storm Sewer Inspection Report

Appendix J
165 Fieldcrest Avenue Monitoring Results
Appendix K
Area 18C Monitoring Well Boring Logs/ Completion Diagrams

Appendix L
Area 18C Injection/Extraction Well Boring Logs/ Completion Diagrams

Appendix M
Slug Test Data