Final Remedial Action Completion Report - navydocs.nuqu.org... · PMO Program Management Office ppm...
77
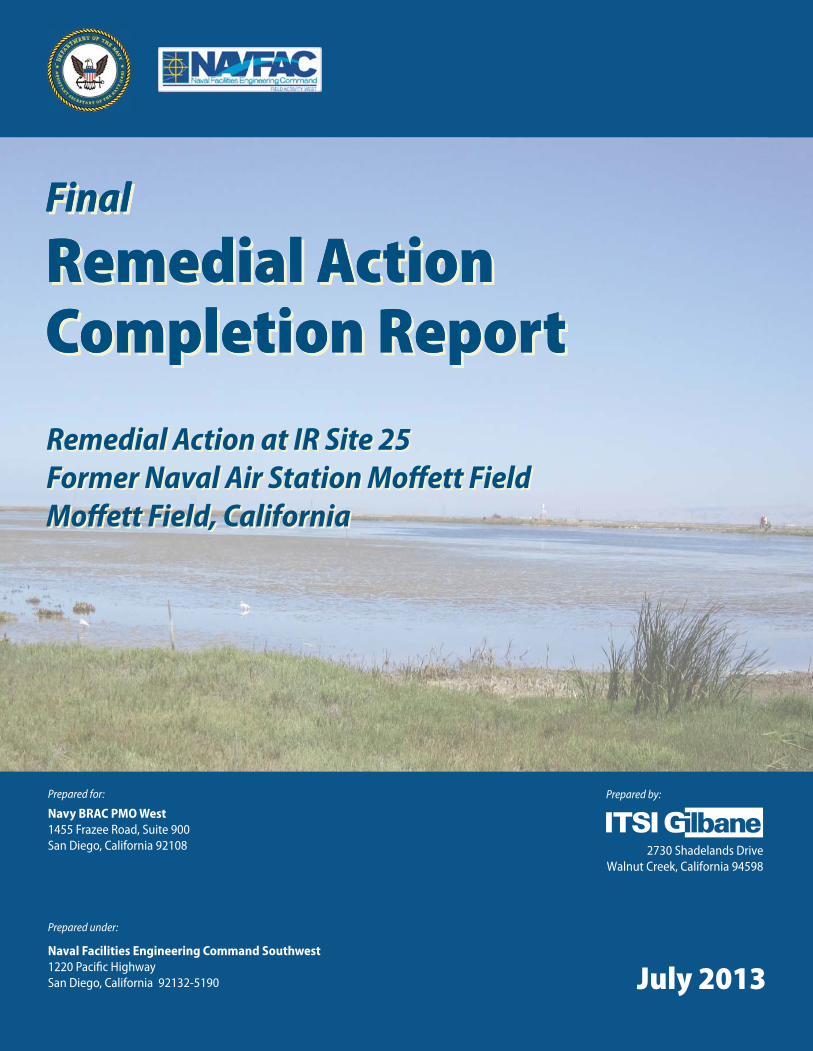
2730 Shadelands Drive Walnut Creek, California 94598 Prepared by: Prepared under: Naval Facilities Engineering Command Southwest 1220 Pacific Highway San Diego, California 92132-5190 Prepared for: Navy BRAC PMO West 1455 Frazee Road, Suite 900 San Diego, California 92108 Final Remedial Action Completion Report Final Remedial Action Completion Report Final Remedial Action Completion Report Final Remedial Action Completion Report Remedial Action at IR Site 25 Former Naval Air Station Moffett Field Moffett Field, California Remedial Action at IR Site 25 Former Naval Air Station Moffett Field Moffett Field, California July 2013
Transcript of Final Remedial Action Completion Report - navydocs.nuqu.org... · PMO Program Management Office ppm...
Remedial Action at IR Site 25
Former N
aval Air Station Moffett Field
Moffett Field, California
Final - RA
CR
2730 Shadelands DriveWalnut Creek, California 94598
Prepared by:
Prepared under:
Naval Facilities Engineering Command Southwest1220 Pacific HighwaySan Diego, California 92132-5190
Prepared for:
Navy BRAC PMO West1455 Frazee Road, Suite 900San Diego, California 92108
Final
Remedial ActionCompletion Report
Final
Remedial ActionCompletion Report
Final
Remedial ActionCompletion Report
Final
Remedial ActionCompletion Report
Remedial Action at IR Site 25Former Naval Air Station Moffett FieldMoffett Field, California
Remedial Action at IR Site 25Former Naval Air Station Moffett FieldMoffett Field, California
July 2013July 2013

Final Remedial Action Completion Report
Remedial Action at IR Site 25
Former NAS Moffett Field
Moffett Field, California
i
TABLE OF CONTENTS
1.0 Overview ................................................................................................................................ 1 1.1 Site Description and Background ................................................................................. 1
1.2 Site Characteristics........................................................................................................ 4
2.0 Remedial Action Objectives .................................................................................................. 5 2.1 Regulatory Framework ................................................................................................. 5
2.2 Project Objectives ......................................................................................................... 6
3.0 Remedial Action Activities .................................................................................................... 7 3.1 Permits and Notifications .............................................................................................. 7 3.2 Waste Characterization ................................................................................................. 7
3.3 Mobilization .................................................................................................................. 8 3.4 Water Diversion ............................................................................................................ 8
3.5 Utility Locating ........................................................................................................... 10 3.6 Biological Surveys and Monitoring ............................................................................ 11 3.7 Clearing and Grubbing ................................................................................................ 12
3.8 Excavation of Contaminated Sediment ....................................................................... 12
3.9 Air Monitoring During Excavation ............................................................................. 13 3.10 Confirmation Sampling ............................................................................................... 14 3.11 Transportation and Disposal of Excavated Sediment ................................................. 15
3.12 Backfill ........................................................................................................................ 16 3.13 Site Cleanup ................................................................................................................ 16
3.14 Hydroseeding .............................................................................................................. 17 3.15 Refinements to Remedial Action Activities ............................................................... 18
4.0 Demonstration of Completion.............................................................................................. 20
5.0 Ongoing Activities ............................................................................................................... 21
6.0 Community Relations .......................................................................................................... 22
7.0 Certification Statement ........................................................................................................ 23
8.0 References ............................................................................................................................ 24

Final Remedial Action Completion Report
Remedial Action at IR Site 25
Former NAS Moffett Field
Moffett Field, California
ii
LIST OF TABLES
1 Remediation Goals
2 Major Subcontractors and Suppliers
3 Project Timeline
4 Excavation Summary – Storm Water Retention Pond
5 Excavation Summary – Eastern Diked Marsh
6 Summary of Analytical Results – Confirmation Samples
7 Waste Disposal Summary
8 Revegetation Palettes
9 Summary of Attainment of Remediation Goals
LIST OF FIGURES
1 Site Location Maps
2 IR Site 25 Site Plan
3 Key Plan
4 Detailed Site Plan (1)
5 Detailed Site Plan (2)
6 Detailed Site Plan (3)
7 Detailed Site Plan (4)
8 Detailed Site Plan (5)
9 Detailed Site Plan (6)
10 Detailed Site Plan (7)
11 Detailed Site Plan (8)
12 Detailed Site Plan (9)
13 Detailed Site Plan (10)
14 Diversion of WATS Effluent
15 Hydroseed Progress Through December 2012
LIST OF APPENDICES
A Historical Correspondence
B Project Photographs
C Permits
D Results of Water and Air Sampling
E 2012 Rail Survey Report and Biological Monitoring Reports
F Data Quality Assessment Report (Confirmation Samples)
G Analytical Data – Overexcavated Polygons
H Waste Profiles and Shipment Logs
I Certificates of Disposal for Cal-Haz and TSCA Wastes
J Imported Backfill Material Information
K Final Topographic Map
L Requests for Information
M Post-RA Calculations of Site-Wide Average Concentrations of COECs
N Records of Final Inspections
O Revegetation Photo-Points

Final Remedial Action Completion Report
Remedial Action at IR Site 25
Former NAS Moffett Field
Moffett Field, California
iii
LIST OF ATTACHMENTS
1 Responses to Comments on Draft and Draft Final RACR

Final Remedial Action Completion Report
Remedial Action at IR Site 25
Former NAS Moffett Field
Moffett Field, California
iv
ACRONYMS AND ABBREVIATIONS
ACGIH American Conference of Governmental Industrial Hygienists
AOI Area of Investigation
AR administrative record
ARC Ames Research Center
BCT BRAC Closure Team
BCY bank cubic yards
BEC BRAC Environmental Coordinator
BRAC Base Realignment and Closure
Cal-haz California-hazardous
CBR California black rail
CCR California clapper rail
CDFG California Department of Fish and Game
CDFW California Department of Fish and Wildlife
CERCLA Comprehensive Environmental Response, Compensation, and Liability Act
COEC chemical of ecological concern
CSO Caretaker Site Office
CTO Contract Task Order
CY cubic yards
DART Disaster Assistance and Rescue Team
DoD Department of Defense
DQAR Data Quality Assessment Report
EDM Eastern Diked Marsh
EMAC Environmental Multiple Award Contract
ESA Endangered Species Act
FFA Federal Facility Agreement
FS Feasibility Study
FSFA Former Soil Fill Area
ft feet, foot
GAC granular activated carbon
gpm gallons per minute
GPS global positioning system
GS galvanized steel
IR Installation Restoration
ISSI Integrated Science Solutions, Inc.
ITSI Innovative Technical Solutions, Inc.
ITSI Gilbane ITSI Gilbane Company
MDL method detection limit
mg/kg milligrams per kilogram
mg/m3 milligrams per cubic meter
MROSD Midpeninsula Regional Open Space District
MOU Memorandum of Understanding
mph miles per hour
NAS Naval Air Station
NASA National Aeronautics and Space Administration
Final Remedial Action Completion Report
Remedial Action at IR Site 25
Former NAS Moffett Field
Moffett Field, California
v
NAVFAC SW Naval Facilities Engineering Command Southwest
Navy United States Department of the Navy
NCP National Oil and Hazardous Substances Pollution Contingency Plan
NIOSH National Institute for Occupational Safety and Health
non-haz non-hazardous
NPDES National Pollutant Discharge Elimination System
NPL National Priorities List
OARF Outfall Aeronautical Research Facility
OU-6 Operable Unit 6
PCBs polychlorinated biphenyls
PG&E Pacific Gas and Electric Company
PMO Program Management Office
ppm parts per million
RA remedial action
RAB Restoration Advisory Board
RACR Remedial Action Completion Report
RAO remedial action objective
RCRA Resource Conservation and Recovery Act
RD remedial design
RD/RAWP Remedial Design/Remedial Action Work Plan
RFI Request for Information
RG remediation goal
RI Remedial Investigation
RL reporting limit
ROD Record of Decision
ROICC Resident Officer in Charge of Construction
SAP Sampling and Analysis Plan
SMHM salt marsh harvest mouse
SVOCs semi-volatile organic compounds
SWPPP Storm Water Pollution Prevention Plan
SWRP Storm Water Retention Pond
SWSB Storm Water Settling Basin
TLV threshold limit value
TPH total petroleum hydrocarbons
TPH-d total petroleum hydrocarbons quantified as diesel
TSCA Toxic Substances Control Act
USA North Underground Service Alert of Northern California and Nevada
USEPA United States Environmental Protection Agency
USFWS United States Fish and Wildlife Service
VOA volatile organic analysis
VOCs volatile organic compounds
Water Board California Regional Water Quality Control Board - San Francisco Bay Region
WATS West-Side Aquifers Treatment System
WPT Western pond turtle
Final Remedial Action Completion Report
Remedial Action at IR Site 25
Former NAS Moffett Field
Moffett Field, California
1
1.0 OVERVIEW
ITSI Gilbane Company (ITSI Gilbane), formerly Innovative Technical Solutions, Inc. (ITSI), has
prepared this Remedial Action Completion Report (RACR) to document the Remedial Action
(RA) activities recently completed at Installation Restoration (IR) Site 25, former Naval Air
Station (NAS) Moffett Field, Moffett Field, California. The RACR was developed using
guidance from the Department of Defense (DoD) and the United States Environmental
Protection Agency (USEPA; DoD/USEPA, 2006). The RA activities were intended to comply
with the remedy selected in the Record of Decision (ROD) for the site and to attain site-specific
remediation goals (RGs; United States Department of the Navy [Navy], 2010).
This project was conducted on behalf of the Naval Facilities Engineering Command Program
Management Office (PMO) West of the Base Realignment and Closure (BRAC) program
implemented by the Navy. ITSI Gilbane was contracted to perform this work through Naval
Facilities Engineering Command Southwest (NAVFAC SW) Environmental Multiple Award
Contract (EMAC) N62473-10-D-0808, Contract Task Order (CTO) 0003.
ITSI Gilbane worked closely with representatives from Navy BRAC PMO-West and Navy
Resident Officers in Charge of Construction (ROICC) offices. The USEPA and the State of
California Water Board (Water Board) provided regulatory oversight.
1.1 SITE DESCRIPTION AND BACKGROUND
Moffett Field is located along the southwestern end of San Francisco Bay, adjacent to the cities
of Mountain View and Sunnyvale, California (Figure 1). The Navy operated Moffett Field as
Naval Air Station (NAS) Sunnyvale from 1933 to 1935. The United States Army Air Corps
operated the facility from 1935 to 1942, when the Navy resumed control and renamed the facility
NAS Moffett Field. In 1994, the Navy closed the facility as an active military base and
transferred the property to the National Aeronautics and Space Administration (NASA). The
NASA Ames Research Center (ARC) now manages the Moffett Field facility, including the
flight line (now known as the Moffett Federal Airfield).

Final Remedial Action Completion Report
Remedial Action at IR Site 25
Former NAS Moffett Field
Moffett Field, California
2
IR Site 25 is a broad, flat expanse of undeveloped land approximately 230 acres in size, located
in the northwestern portion of Moffett Field between the flight line and San Francisco Bay
(Figure 2). The area is mostly below sea level, and was a wetland marsh until diking and
drainage activities were conducted in the late 19th
century.
IR Site 25 is bounded on the north and northeast by former solar salt ponds that now are part of
the Don Edwards San Francisco Bay National Wildlife Refuge, administered by the United
States Fish and Wildlife Service (USFWS); on the east by IR Site 1, a former Moffett Field
landfill; on the southeast by the Moffett Federal Airfield flight line; on the south by undeveloped
portions of the NASA ARC; and on the west by Stevens Creek and also the Stevens Creek Trail,
maintained by the City of Mountain View. The San Francisco Bay Trail, a public access trail for
hikers and bicyclists administered in part by USFWS, rings the northern portion of IR Site 25.
San Francisco Bay proper is approximately 1 mile to the north of IR Site 25.
IR Site 25 has two distinct components: the Eastern Diked Marsh (EDM) on the southern end,
approximately 20 acres in size, and the Storm Water Retention Pond (SWRP) to the north,
approximately 210 acres in size. The SWRP is further demarcated into a western portion (owned
by Midpeninsula Regional Open Space District [MROSD]) and the Central Basin and
Northeastern (NE) Basin, both managed by NASA ARC (Figure 2).
The EDM and SWRP have been part of the stormwater management system for the western
portion of Moffett Field since 1953. From that time until about 1992, stormwater from a large
portion of the west side of Moffett Field, including the Hangar 1 area, flowed to a ditch along the
eastern side of Lindbergh Avenue. The ditch directed runoff into culverts that channeled the
flow to the EDM and SWRP.
In 1991, NASA redesigned the stormwater collection system for the western portion of Moffett
Field to direct runoff into an underground pipe network. This network directs the water to the
Storm Water Settling Basin (SWSB) located at the southern edge of the EDM. The SWSB has a
series of weirs that allow suspended solids to settle by gravity. The SWSB also receives treated
groundwater from the West-Side Aquifers Treatment System (WATS), a groundwater treatment
system near Hangar 1 which is currently operated by the Navy.

Final Remedial Action Completion Report
Remedial Action at IR Site 25
Former NAS Moffett Field
Moffett Field, California
3
The SWSB outfall discharges effluent into the EDM. This discharge is described in NASA
ARC’s Storm Water Pollution Prevention Plan (SWPPP; NASA ARC, 2010). The SWSB also
has an overflow spillway that allows influent water to bypass the settling weirs and flow directly
into the EDM.
Solids that settle at the SWSB are characterized and removed by NASA annually, typically
around August or September. In August-September 2005, NASA excavated 450 cubic yards
(CY) of shallow soil from the EDM in areas immediately to the north of the SWSB; and in
September 2006, NASA excavated another 500 CY of shallow soil from adjacent areas farther
north and west of the previously excavated areas. Analyses of this material indicated the
presence of polychlorinated biphenyls (PCBs), lead, and zinc, but not DDT (Integrated Science
Solutions, Inc. [ISSI], 2007). The Navy has expressed concern over the ability of the SWSB to
control and contain sediments upon the completion of this RA. Historical correspondence from
the Navy, NASA, and regulatory agencies regarding this matter is included in Appendix A.
From the EDM, water flows northward through three 48-inch culverts under North Perimeter
Road to the central basin of the SWRP. The central basin in turn connects to the western and
northeastern portions of the SWRP through breaches in levees. Typically, portions of the SWRP
are flooded with 1 to 5 feet (ft) of standing water during wet months, but are partially dry during
summer and fall.
Water enters the SWRP also through a small culvert located at the northern end of the Lindbergh
Avenue ditch (Figure 2). The ditch, designated as Area of Investigation (AOI) 6, was remediated
by NASA in 2000. Contaminants at AOI 6 were PCBs (Aroclors 1254, 1260, 1262, and 1268).
The NASA action level for Total PCBs at AOI 6 is 0.47 milligrams per kilogram (mg/kg; Uribe
& Associates, 2004). The Navy has expressed concern that the action level for PCBs at AOI 6 is
less stringent than the corresponding remediation goal (RG) for IR Site 25 (the site-wide average
RG for Total PCBs at IR Site 25 is 0.200 mg/kg). NASA has indicated that the culvert outfall
will be sampled annually as part of the SWPPP to ensure protectiveness of IR Site 25.
Several “upland” peninsulas located along North Perimeter Road that extend into the SWRP
comprise NASA’s AOI 14. The westernmost peninsula, referred to as the “Former Soil Fill

Final Remedial Action Completion Report
Remedial Action at IR Site 25
Former NAS Moffett Field
Moffett Field, California
4
Area” (FSFA), is approximately 8 acres in size and contains soil characterized as being impacted
with PCBs (NASA, 2006). Response actions at AOI 14 are being administered by NASA and
are not a direct part of the Navy’s RA at IR Site 25.
The Navy has expressed concern regarding completing the IR Site 25 RA before NASA
completes the cleanup and/or erosion control activities at the FSFA, because of possible
recontamination from this upland source area. NASA attempted to take precautions to minimize
sloughing from the FSFA by proposing erosion control measures around the perimeter.
However, weather and rising surface water at SWRP in the fall of 2012 prevented NASA from
proceeding with erosion control. At NASA’s request, the Navy left biological mitigation fencing
in place along portions of the FSFA perimeter (see Section 3.13 and Figures 2 and 7), but the
Navy does not recognize this as protective. As of January 2013, portions of the fence were
partially to wholly inundated.
Copies of historical correspondence between the Navy, NASA, and regulatory agencies
regarding PCBs at AOI 14 are included in Appendix A. Photographs of the inundated biological
mitigation fencing are included in Appendix B.
1.2 SITE CHARACTERISTICS
The Navy has conducted environmental investigations at IR Site 25 that indicated that DDTs,
PCBs, lead, and zinc were present in sediment at concentrations that presented potential risk to
ecological receptors. The highest concentrations of chemicals of ecological concern (COECs)
were found near the former discharge point of the Lindbergh Avenue ditch in the EDM; in
general, concentrations decreased with distance from that location. This pattern was confirmed
by the results of the Navy’s pre-design investigation of IR Site 25 sediment, which was
completed in 2010 and presented in the Final Data Summary Report for Pre-Design
Investigation of Sediment at IR Site 25 (KCH, 2011). The findings in this report were consistent
with the ROD and indicated the areas of the site where sediment should be removed to attain
site-specific RGs (ITSI, 2012). Those areas are indicated on Figure 2.

Final Remedial Action Completion Report
Remedial Action at IR Site 25
Former NAS Moffett Field
Moffett Field, California
5
2.0 REMEDIAL ACTION OBJECTIVES
The objective of this project was to conduct an RA allowing IR Site 25 to be available for
unlimited use and unrestricted exposure, in conformance with the ROD (Navy, 2010). The
Remedial Design and Remedial Action Work Plan (RD/RAWP; ITSI, 2012) outlined these RA
activities. Potential future uses of the site include a tidal marsh to support a wide variety of
habitat, and a managed pond that provides stormwater retention and open-water habitat.
2.1 REGULATORY FRAMEWORK
In the 1980s, USEPA added NAS Moffett Field to the National Priorities List (NPL); the date of
final listing was 22 July 1987. The USEPA identification number for Moffett Field is
CA2170090078. The Navy’s response actions at IR Site 25 were administered under Section
117(a) of the Comprehensive Environmental Response, Compensation, and Liability Act
(CERCLA), and Section 300.430(f)(2) of the National Oil and Hazardous Substances Pollution
Contingency Plan (NCP).
A Federal Facility Agreement (FFA) was developed for Moffett Field and was signed in 1990 by
the Navy and the regulatory agencies including USEPA and the Water Board (USEPA et al.,
1990). Updates to the FFA project schedules are provided on an annual basis.
IR Site 25 is a part of Operable Unit 6 (OU-6) at Moffett Field as identified in the Station-Wide
Remedial Investigation Report (PRC Environmental Management, Inc., 1996); other components
of OU-6 are being addressed separately. For IR Site 25, the Navy developed a ROD in
November 2009, identifying the remedial action objectives (RAOs) and RGs for the project. The
ROD incorporated public comments and was signed by the Navy and the regulatory agencies in
January 2010 (Navy, 2010). The agency signatories included USEPA and the Water Board. The
Remedial Investigation (RI)/Feasibility Study (FS) reports, Proposed Plan, ROD, and other
related documents for IR Site 25 are contained in the administrative record (AR) file maintained
by the Navy for Moffett Field.
For this specific project, the USEPA, Water Board, and California Department of Fish and
Wildlife (CDFW), formerly the California Department of Fish and Game (CDFG), provided
document reviews, participated in on-board project status updates (teleconferences), and assisted

Final Remedial Action Completion Report
Remedial Action at IR Site 25
Former NAS Moffett Field
Moffett Field, California
6
the Navy effort by providing technical guidance. Attachment 1 includes tables that present
agency comments on the draft and draft final versions of the RACR, along with Navy responses
to the comments.
2.2 PROJECT OBJECTIVES
The objective of this RA was to implement the selected remedy as described in the IR Site 25
ROD. The ROD stipulated that no CERCLA action was necessary at IR Site 25 to protect
human health. For protection of the environment at IR Site 25, the ROD identified an RAO of
reducing exposure to COEC concentrations in sediment to levels that are protective of ecological
receptors. The COECs for IR Site 25 are lead, zinc, Total DDT, and Total PCBs. The selected
remedy for attaining the RAO consisted of: excavation, treatment, and off-site disposal of
contaminated sediment; focused restoration of wetland excavations; and ecological monitoring.
Table 1 presents the specific RGs for the COECs, consisting of upper-bound and lower-bound
concentrations, as promulgated in the ROD. The ROD specified that by meeting the upper-
bound RG at each polygon designated for excavation, the lower-bound RG, i.e., the site-wide
average (weighted by polygon), would be attained. To confirm completion of this RA, an
updated site-wide average concentration for each of the four COECs was calculated (see
Section 4.0).

Final Remedial Action Completion Report
Remedial Action at IR Site 25
Former NAS Moffett Field
Moffett Field, California
7
3.0 REMEDIAL ACTION ACTIVITIES
Field activities were conducted in accordance with the ROD (Navy, 2010) and the RD/RAWP
(ITSI, 2012). The following sections provide a description of the RA field activities that were
conducted from May through December 2012. Major subcontractors and suppliers are listed in
Table 2. A project timeline is provided in Table 3. Figures 3 through 13 present a key plan and
detailed site plans depicting the RA polygons where excavation took place, indicating final
excavation depths.
Photographs were collected during the project and are included in Appendix B. They are
organized into three project phases, as follows: (1) a botanical survey, conducted before earth-
disturbing activities (each photo in Appendix B.1 indicates the corresponding RA polygon
name); (2) RA photos, depicting excavation and earth-moving activities (Appendix B.2); and
(3) post-excavation photos that depict site conditions during the confirmation sampling (each
photo in Appendix B.3 indicates the corresponding RA polygon name).
3.1 PERMITS AND NOTIFICATIONS
The following work and entry permits were obtained (copies are included in Appendix C):
A NASA Construction Permit was obtained and approved on 01 July 2011. The permit
was revised due to project delays, and was re-approved on 17 April 2012.
A Permit to Enter from MROSD to conduct remediation activities on the western area of
the SWRP was approved on 23 February 2012.
An Environmental Health Permit was obtained from the County of Santa Clara for the
storage of fuel for the field trailer generator. It was approved on 14 May 2012 and
renewed on 16 October 2012.
3.2 WASTE CHARACTERIZATION
In conformance with the RD/RAWP (ITSI, 2012), ITSI Gilbane coordinated with licensed waste
facilities to characterize the sediment for proper disposal before excavation activities began.
During the period from February through April 2012, sediment samples were collected from 23
discrete locations at the EDM and 106 discrete locations at the SWRP. A fan boat was used to
reach locations in the SWRP that were inaccessible by foot due to surface water or soft mud.

Final Remedial Action Completion Report
Remedial Action at IR Site 25
Former NAS Moffett Field
Moffett Field, California
8
Samples were sent to Accutest Laboratories, San Jose, California, where they were analyzed as
follows:
One four-point sample composite per 1,000 CY of sediment was generated and analyzed
for Title 22 metals (“total metals”) including lead and zinc by USEPA method 6010B;
PCBs by USEPA method 8082; and pesticides including DDT by USEPA method
8081A.
One four-point sample composite per 5,000 CY of sediment was generated and analyzed
for diesel- and motor oil-range total petroleum hydrocarbons (TPH) by USEPA method
8015; and semi-volatile organic compounds (SVOCs) by USEPA method 8270.
Ten random, discrete samples were tested for gasoline-range TPH by USEPA method
8015 and for volatile organic compounds (VOCs) by USEPA method 8260.
Based on sample results, waste profiles were developed for acceptance of sediment at disposal
facilities licensed to accept non-hazardous (non-haz) and California-hazardous (Cal-haz) wastes.
The Environmental Compliance Manager at the Navy BRAC PMO-West Caretaker Site Office
(CSO) reviewed, approved, and signed the profiles. Disposal facilities selected for this project
operated under licenses granted by appropriate government entities; these facilities also had
received approval to accept CERCLA waste from the respective USEPA regional offices.
Transportation and disposal of sediment waste are further discussed in Section 3.11.
3.3 MOBILIZATION
A field trailer was installed at NASA ARC’s Outfall Aeronautical Research Facility (OARF), a
fenced-in area near the SWSB. A diesel-fueled generator was set up to provide electricity to the
trailer. Telephone service also was installed. Temporary sanitation facilities were mobilized and
placed near the trailer and at additional locations near excavation area work sites. A temporary
secured storage container was placed near the field trailer to store materials, small tools, and
equipment. Traffic control devices such as barricades, cones, and signage were used as
necessary to manage pedestrian and vehicular traffic.
3.4 WATER DIVERSION
Managing surface water and keeping excavation areas from being submerged was crucial for
project completion. A temporary water diversion system was installed to convey water away
from excavation areas. As previously described, sources of SWSB influent are: (1) seasonal

Final Remedial Action Completion Report
Remedial Action at IR Site 25
Former NAS Moffett Field
Moffett Field, California
9
stormwater runoff from the west side of Moffett Field; and (2) treated groundwater from the
WATS, which is continuous except for periods of maintenance downtime. In 2011, the average
discharge from WATS was 43 gallons per minute (gpm; ERS Joint Venture, 2012).
Groundwater at the WATS is treated to remove solids using filtration and to remove VOCs using
a combination of oxidation (hydrogen peroxide and ozone addition) and liquid-phase granular
activated carbon (GAC).
To divert water from excavation areas, two submersible pumps were installed at the eastern
portion of the SWSB. A temporary above-ground, 4-inch-diameter, galvanized steel (GS)
pipeline was installed to convey water from the SWSB to an existing catch basin located near
Zook Road on the west side of the airfield flight line. The catch basin is part of the flight-line
drainage system that collects and directs runoff to Building 191 and the Northern Channel on the
east side of Moffett Field. The submersible pumps were driven by diesel-powered generators.
Figure 14 is a plan view showing locations of the components of the temporary water diversion
system. Water diversion operations commenced on 21 May 2012.
The NASA Construction Permit (Appendix C) required three rounds of sampling and analysis of
water in the SWSB during the water diversion operation. For each sampling round, grab samples
of water were collected by lowering a certified-clean sample container (glass jar) into the SWSB
approximately 6” below water surface until full (Figure 14 shows the sampling location). From the
large sample container, smaller containers specific to the planned chemical analysis were carefully
filled. The sample containers included: 1-L amber glass containers (for oil & grease by USEPA
method 1664, PCBs by USEPA method 8082, SVOCs by USEPA method 8270, and TPH-d by
USEPA method 8015M; 40-ml VOAs acidified with HCl (for VOCs by USEPA method 8260);
and 500-ml polyethylene containers acidified with HNO3 (for metals by USEPA method 6010).
The containers were then capped, labeled, and sent to an analytical laboratory under chain-of-
custody protocol.
Appendix D.1 includes the laboratory reports for the three rounds of samples collected during the
RA activities. Detections of cis-1,2-dichloroethene and trichloroethene were reported (see
summary table in Appendix D.1). Detections of motor oil, antimony, and thallium were estimated
Final Remedial Action Completion Report
Remedial Action at IR Site 25
Former NAS Moffett Field
Moffett Field, California
10
and not consistently found in all three samples. It should be noted that the SWSB collects water
from nearly the entire west-side drainage area of Moffett Field. WATS effluent has been in
compliance with the National Pollutant Discharge Elimination System (NPDES) permit for all
constituents throughout (and beyond) the water diversion effort.
The temporary water diversion operations were shutdown in mid-November 2012 after excavation
activities were completed and prior to significant rainfall events. All temporary equipment was
dismantled and removed from the site.
3.5 UTILITY LOCATING
Underground Service Alert of Northern California and Nevada (USA North) was notified of the
excavation activities. Buried utilities at the site including natural gas transmission lines owned
and operated by the Pacific Gas and Electric Company (PG&E) were located by an underground
utility locating subcontractor. Potholing was conducted to further verify the locations and burial
depths of the PG&E lines. Estimated burial depths, i.e., from ground surface to top of pipe, were
generally 3 ft or greater and ranged from 1’-8” (in swale cuts) to more than 8 ft in mounded
areas. Northing and easting coordinates of the PG&E line running along the north side of North
Perimeter Road were forwarded to NASA ARC. The field-verified locations of the PG&E lines
are indicated on Figures 10 through 13.
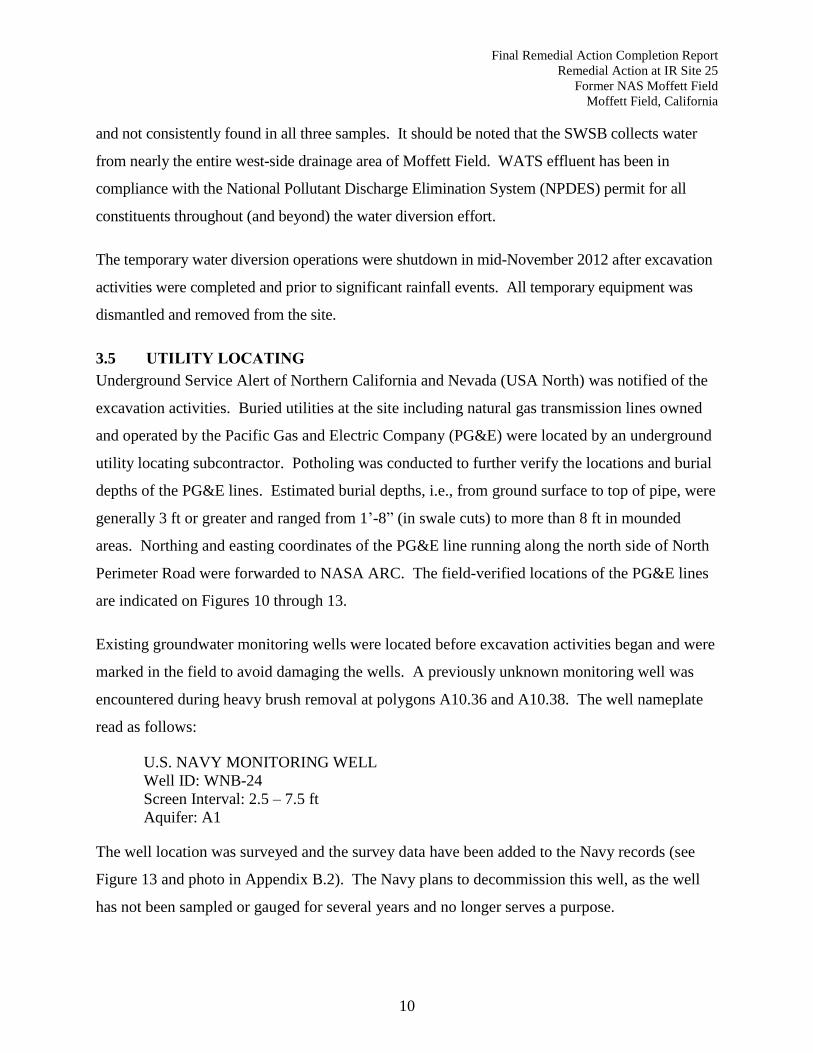
Existing groundwater monitoring wells were located before excavation activities began and were
marked in the field to avoid damaging the wells. A previously unknown monitoring well was
encountered during heavy brush removal at polygons A10.36 and A10.38. The well nameplate
read as follows:
U.S. NAVY MONITORING WELL
Well ID: WNB-24
Screen Interval: 2.5 – 7.5 ft
Aquifer: A1
The well location was surveyed and the survey data have been added to the Navy records (see
Figure 13 and photo in Appendix B.2). The Navy plans to decommission this well, as the well
has not been sampled or gauged for several years and no longer serves a purpose.

Final Remedial Action Completion Report
Remedial Action at IR Site 25
Former NAS Moffett Field
Moffett Field, California
11
3.6 BIOLOGICAL SURVEYS AND MONITORING
In addition to the biological assessment conducted in fall 2010 (ITSI, 2012), biological surveys
were conducted at the project site just prior to excavation. The following biological studies were
conducted:
A botanical survey to record the type and density of plants present before excavation and
to identify areas of dense pickleweed, a preferred habitat for the salt marsh harvest mouse
(SMHM – see photos in Appendix B.1);
An inspection of wetland areas to record SMHM habitats;
Surveys for the California black rail (CBR) and California clapper rail (CCR; see
Appendix E.1). During the five survey visits, CBR vocalizations were heard on two
occasions in the EDM; no CCRs were heard or seen; and
Trapping for potential Western pond turtles (WPTs) in the EDM (no WPTs were found).
A Biological Resource Education Program briefing was conducted by a CDFW-approved
biologist for all contractor and subcontractor personnel prior to any site entry. A biologist was
assigned to each work crew on site during all work activities. Biologists were given authority to
halt work if a listed species was identified.
Other activities conducted by biologists included demarcating bird nesting buffers; checking
work areas for SMHM or other species prior to clearing and grubbing; and checking
“exclusionary” silt fencing intended to prevent SMHM entry into excavation areas. The
biologists filed biological monitoring reports, included in Appendix E.2.
Special status species that were encountered during the project are described below.
Gray foxes - one of which was captured, tagged, and released by a NASA biologist. Two
other gray foxes were found and released from live traps in the EDM. To prevent
impacts to other individuals, a vehicle speed limit of 5 miles per hour (mph) was enforced
on roadways.
Birds, bird nests, or bird eggs of the following species were encountered: northern harrier
(the sighting of fledglings resulted in posting “no stopping” signs near the nests);
Alameda song sparrow; white-tailed kites; red-tailed hawk; and a golden eagle (observed
in flight only).
No SMHM were positively identified during this project. However, many mice and nests
belonging to different species were seen in and around work areas. One decomposed,
dead juvenile mouse (too young to be unidentified) was found in pickleweed while
Final Remedial Action Completion Report
Remedial Action at IR Site 25
Former NAS Moffett Field
Moffett Field, California
12
“flushing” the area prior to vegetation removal. As a result of this incident, the flushing
technique (i.e., walking a directed line of personnel for clearing an area of mice prior to
vegetation removal) was abandoned. Instead, to avoid harming mice, a biologist was
assigned to closely and continually observe the workers performing clearing and
grubbing.
Observances of a variety of unidentified species were also recorded.
3.7 CLEARING AND GRUBBING
Clearing and grubbing activities were performed in the RA polygons (and on access routes to RA
polygons) that were covered by vegetative growth. Pickleweed was removed manually using
non-mechanical means, e.g., hand tools. Double-walled silt fence was installed around areas
where pickleweed was removed to prevent SMHM from entering. In non-pickleweed areas,
mechanical methods were used to remove vegetation.
While clearing polygons A4.1, A4.3, and A4.4, clay pigeon (skeet) fragments were discovered.
Markings on the clay pigeons bore the name “Eclipse” (see Photograph 50 in Appendix B). As
clay pigeons are known to contain polyaromatic hydrocarbons (PAHs), the manufacturer of
Eclipse skeet targets, Reagent Chemical and Research, Inc., Ringoes, N.J., was contacted and
stated that this particular type of skeet did not contain PAHs (T. Skeuse, 2012). No testing of the
skeet material was conducted and the skeet fragments were turned over to NASA for disposal.
3.8 EXCAVATION OF CONTAMINATED SEDIMENT
Prior to excavation, a state-licensed surveyor demarcated each RA polygon with construction
stakes using the coordinates for each polygon corner derived from digital site maps as presented
in the RD (ITSI, 2012). Existing critical infrastructure including levees, roadways, and supporting
embankments made up of gravelly materials did not conform to the conceptual site model of where
contaminated sediment would be present. Therefore, the areal extents of excavations in several
contaminated polygons were adjusted in the field to leave vital infrastructure intact. The detailed
site plans (Figures 4-13) depict the portions of polygons where boundaries were adjusted.
To reach the bottom of contamination, polygons were excavated to the depths presented in the
RD/RAWP (ITSI, 2012). A grade checker was assigned to each piece of digging equipment to
monitor the excavation depth continuously, thereby controlling the vertical extent of the
excavations in the field.

Final Remedial Action Completion Report
Remedial Action at IR Site 25
Former NAS Moffett Field
Moffett Field, California
13
Excavated sediment was stockpiled within the boundaries of the polygon that was being
excavated, or at nearby contaminated areas. Excavated areas were not used for stockpiling
contaminated sediment.
After reaching the planned excavation depth, confirmation samples were collected. Where
sample results indicated that upper-bound RGs had not been achieved, overexcavation was
conducted until confirmation sampling indicated that the upper-bound RGs were attained. This
process is discussed further in Section 3.10.
At the northern portion of the EDM, sediment with concentrations of Total PCBs exceeding 50
parts per million (ppm) was encountered, warranting the use of an off-site Toxic Substances
Control Act (TSCA)-permitted waste disposal facility (see Section 3.11). In the eastern portion
of the EDM, an open pipe emanating from underneath Lindbergh Avenue was encountered. The
pipe was a corrugated steel pipe with an approximate diameter of 10 inches. A shallow drainage
swale (V ditch) was aligned with the open pipe end and appeared to slope northward to the main
culverts at North Perimeter Road. NASA was notified and visited the site to assess the pipe. It
was verified that the pipe was an outfall of the storm drain system connecting the AOI 6 ditch on
the east side of Lindbergh Avenue to the EDM. The pipe appeared to be clogged with dirt and
debris. A 12-inch hole in the pipe was discovered at the AOI 6 ditch amid heavy vegetation. A
NASA ARC facility maintenance crew plugged the pipe with concrete in October 2012 (see
Figure 2 and photos in Appendix B.2). The pipe is no longer operational.
Approximately 36,048 bank cubic yards (BCY) of sediment were excavated from the RA
polygons at IR Site 25. Fifteen polygons in the EDM and seven polygons in the SWRP required
overexcavation. Information about the excavations at each polygon, including area, final depth,
and volume excavated, is provided in Tables 4 and 5.
3.9 AIR MONITORING DURING EXCAVATION
During excavation activities, air monitoring was conducted to assess possible personnel exposure
and impacts to air quality from site activities. Ambient particulate monitoring was conducted
using Thermo MIE pDR-1000 DataRam real-time air monitors positioned at locations downwind
of active excavations to ensure all work was done without exceeding the project threshold action

Final Remedial Action Completion Report
Remedial Action at IR Site 25
Former NAS Moffett Field
Moffett Field, California
14
level (locations are indicated on Figure 2). For this project, the action level applied was
5 milligrams per cubic meter (mg/m3), i.e., one-half of the threshold limit value (TLV) for
inhalable particulates recommended by the American Conference of Governmental Industrial
Hygienists (ACGIH). At no time did the air monitors indicate an action level exceedence.
In addition, air samples were collected from the personal breathing zones of field personnel
including grade checkers, equipment operators, and truck drivers. Five samples were collected
during 08-09 August 2012 and two samples were collected on 13 September 2012. Air samples
were analyzed for lead and zinc in accordance with National Institute for Occupational Safety
and Health (NIOSH) Method 7300. No lead or zinc was detected. Appendix D.2 presents the
results of personal air monitoring.
3.10 CONFIRMATION SAMPLING
After initial excavation was completed at each polygon, confirmation samples of sediment were
collected from the excavation floor. Sampling activities were conducted in accordance with the
Sampling and Analysis Plan (SAP) that was developed as part of the RD/RAWP (ITSI, 2012).
Sample locations were established during the RD/RAWP and were located in the field by
entering previously determined sample location coordinates into a Trimble GeoXH 2005 Series
hand-held global positioning system (GPS) unit. The GPS unit was capable of horizontal
accuracy within 1 ft.
Samples were sent to Calscience Environmental Laboratories, Inc., Garden Grove, California,
where they were analyzed for COECs. When data from the laboratory indicated that the upper-
bound RGs were attained for all COECs, the polygon excavation was marked complete.
If the analytical result for any COEC was above the upper-bound RG, the polygon was
overexcavated, typically in 6-inch depth intervals, and samples were taken from the new
excavation depth at the same areal location as the previous sample. This process continued until
the upper-bound RG was attained for each COEC.
It became necessary to maximize project efficiency with the goal of completing the field effort
before the rainy season began. To that end, samples in several locations were collected at
Final Remedial Action Completion Report
Remedial Action at IR Site 25
Former NAS Moffett Field
Moffett Field, California
15
multiple 6-inch-depth intervals consecutively and submitted for concurrent laboratory analysis.
The intent of this approach was to avoid multiple cycles of sample collection and laboratory
analysis, thereby finding a zone of sediment with samples having COEC concentrations lower
than the upper-bound RGs more rapidly. Also, to save precious time before the rainy season,
vertical sampling intervals were increased to 1 ft (as opposed to 6 inches) at locations where
contamination appeared severe.
For confirmation sampling, the testing laboratory reported each analytical result to the method
detection limit (MDL). For metals, the laboratory reported results to three significant figures.
For DDTs and PCBs, the laboratory reported results to two significant figures.
In calculating Total DDT and Total PCBs, the individual analytes were summed using the
conventions described below.
Where the result for an individual analyte was reported by the laboratory with a “J”
(estimated) qualifier, i.e., a result equal to or greater than the MDL but less than the
reporting limit (RL), a value equal to the estimated value was used.
Where the result for an individual analyte was reported as non-detected, a value of one-
half the MDL was used.
Table 6 presents a summary of the analytical results of the final confirmation sampling at each
polygon.
Appendix F includes a Data Quality Assessment Report (DQAR) that describes the completeness
and usability of the confirmation sampling data. The DQAR includes summary tables presenting
the final validated confirmation sample results for every excavated polygon; the data validation
reports; and the analytical reports from the testing laboratory. Appendix G includes a summary
table for all analytical data from polygons that were overexcavated.
3.11 TRANSPORTATION AND DISPOSAL OF EXCAVATED SEDIMENT
Sediment planned for off-site disposal was loaded into appropriate trucks and transported to pre-
designated disposal facilities. Table 7 lists the amount of each type of waste transported and the
names and locations of disposal facilities. Waste profiles and load summaries are provided in

Final Remedial Action Completion Report
Remedial Action at IR Site 25
Former NAS Moffett Field
Moffett Field, California
16
Appendix H. Certificates of disposal from the facilities handling Cal-haz and TSCA wastes are
provided in Appendix I.
3.12 BACKFILL
Material used for backfill was imported from the Carmel Lofts development in Sunnyvale,
California. This material was analyzed by several off-site laboratories for chemical parameters,
in accordance with the SAP (ITSI, 2012). Parameters included metals including lead and zinc;
organochlorine pesticides including DDTs; PCBs; petroleum hydrocarbons including gasoline,
diesel, and motor oil; SVOCs; and VOCs. Average concentrations of COECs calculated using
sample results from multiple locations within the Carmel Lofts development were below lower-
bound RGs (see Appendix J). Before the material was imported to Moffett Field, analytical
results were forwarded to the regulatory agencies for concurrence that the material was
acceptable as backfill for IR Site 25.
In conformance with the salt marsh habitat restoration plan for the project (ITSI Gilbane, 2012),
backfill material was placed in areas at the EDM that were deemed critical to maintaining
existing drainage patterns, thereby allowing NASA ARC to continue its use of the site as a
stormwater retention/evapotranspiration facility. With the goal of facilitating the flow of water
away from the SWSB towards the culverts leading to the SWRP, a drainage swale was cut at the
EDM (see photos in Appendix B.2). Appendix K includes a final topographic map of the entire
IR Site 25.
3.13 SITE CLEANUP
Cleanup activities were conducted after major earthmoving activities were complete. Cleanup
included: removal of silt fences; removal of temporary best management practices (BMPs) used
for controlling erosion and tracking of sediment; offhauling of miscellaneous debris encountered
during excavation; and removal of temporary access roads. Along the perimeter of the FSFA (a
part of NASA’s AOI 14), portions of the silt fence were left in place at the request of NASA (see
photos in Appendix B.2).
Final Remedial Action Completion Report
Remedial Action at IR Site 25
Former NAS Moffett Field
Moffett Field, California
17
3.14 HYDROSEEDING
In November and December 2012, hydroseed was applied to areas that were designated in the
revised salt marsh habitat restoration plan (ITSI Gilbane, 2012). In accordance with the
RD/RAWP (ITSI, 2012), and in coordination with NASA, no hydroseed or other revegetation
efforts were used in the EDM, as the plants in that area include tules and cattails, which typically
reestablish rapidly.
As described in the restoration plan, two seed mixes were used at IR Site 25, a “high salt marsh
palette” and a “transition palette”. Table 8 lists the plant species used in the two seed mixtures.
The salt marsh palette is composed of five plant species native to salt marshes in the South San
Francisco Bay area. This mix includes a high percentage of Sarcocornia pacifica (pickleweed),
a source of food preferred by the SMHM during the cool winter months, and Distichlis spicata
(saltgrass), a source of nesting materials and an alternate source of food during the warm season.
The transition palette includes five native cool-season grasses that will provide forage for
SMHM in seasons when pickleweed and saltgrass have gone dormant: Bromus maritimus
(coastal California brome); Hordeum depressum (alkali brome); Leymus triticoides (creeping
wildrye); Nasella pulchra (purple needle-grass); and Vulpia microstachys (annual fescue). This
palette also includes many other plant species native to upland, relatively dry areas adjacent to
South San Francisco Bay tidelands; predominant species include Amsinckia menziesii (common
fiddleneck); Centromadia pungens (common spikeweed); Distichlis spicata (saltgrass);
Frankenia salina (alkali heath); Iva axillaris (poverty weed); Lasthenia californica (California
goldfields); and Lupinus succulentus (arroyo lupine).
Due to significant rain events in the Bay Area in fall 2012, several areas planned for seeding
contained standing water, making hydroseed operations infeasible. Those areas will be seeded as
conditions allow. Figure 15 indicates areas that have been hydroseeded as of December 2012.
Recognizing the upcoming response actions being planned by NASA for the FSFA portion of
AOI 14, the Navy, NASA, and regulatory agencies agreed during the Moffett Field BRAC
Closure Team (BCT) meeting held 09 May 2013, that NASA will assume responsibility for
vegetating the areas surrounding the FSFA (see Figure 15).

Final Remedial Action Completion Report
Remedial Action at IR Site 25
Former NAS Moffett Field
Moffett Field, California
18
3.15 REFINEMENTS TO REMEDIAL ACTION ACTIVITIES
Site conditions allowed a refinement of the remedy as described in the ROD, in that on-site
treatment of sediment, originally planned to stabilize lead and zinc, was not required. Instead,
based on results of waste characterization sampling, the material was profiled as Cal-haz waste,
i.e., non-Resource Conservation and Recovery Act (RCRA) hazardous waste, and was shipped
off site to a licensed waste facility fully permitted to accept Cal-haz material.
Significant changes from the RD/RAWP were as follows:
Water was not diverted from the SWRP, as the dry winter of 2011-2012 resulted in less
surface water present at the site.
Because the mudflat material initially planned for use as backfill proved to be difficult to
handle, material for backfilling excavations was brought in from an off-site source.
Habitat at the site was restored by hydroseeding. This change was documented in a
revised habitat restoration plan and distributed to the public in early December 2012. On
17 October 2012, the regulatory agencies concurred with revisions to the plan.
These changes were discussed with the regulatory agencies during the monthly project update
calls; these calls were generally held on the third Monday of each month while RA activities
were being conducted.
Minor field changes to the RD/RAWP were presented to the Navy and documented in Requests
for Information (RFIs). The Navy reviewed and approved the RFIs, with one exception, as
summarized in the list below. Copies of the RFIs are provided in Appendix L.
RFI 1: Under CERCLA authority, the SWPPP for the RA was submitted directly to the
project case worker at the Water Board. Typical administrative requirements of the
California general NPDES permit for construction did not apply.
RFI 2: A request to spread pickleweed cuttings on surrounding areas was not approved.
Cuttings were disposed of off site as green waste.
RFI 3: Clay pigeon (target skeet) debris was found in the SWRP. ITSI Gilbane removed
the debris, containerized it, and transferred it to NASA for appropriate disposal. The
volume of debris was less than 0.5 cubic feet. No testing was conducted because the
manufacturer, Eclipse, identified that these debris do not contain any PAHs.
RFI 4: The AOI 14 FSFA peninsula was accessed for loading trucks. Use of the FSFA
facilitated project progress and avoided removal of pickleweed (SMHM habitat) from
other proposed access routes.

Final Remedial Action Completion Report
Remedial Action at IR Site 25
Former NAS Moffett Field
Moffett Field, California
19
RFI 5: Truck scales were utilized to record the weights of trucks containing waste
governed by TSCA; trucks with non-haz and Cal-haz material were not weighed on site.
Final Remedial Action Completion Report
Remedial Action at IR Site 25
Former NAS Moffett Field
Moffett Field, California
20
4.0 DEMONSTRATION OF COMPLETION
As previously described, excavation of contaminated sediment was conducted at each RA
polygon until upper-bound RGs were achieved and verified through validated confirmation
sampling data. As described previously, Table 6 indicates the upper-bound RGs and the final
concentrations of COECs for each RA polygon.
By combining the RA data with the historical data for IR Site 25, an updated site-wide average
concentration for the each of the four COECs was computed. The conventions used in the
computations are described below.
For polygons where more than one final confirmation sample was collected, the total area
of the polygon was divided by the number of sample locations within it, resulting in
multiple equal areas within the polygon. Each area was assigned the concentration of the
sample within it; this approach was also used in polygons that were subdivided and
excavated to different depths.
A final site-wide average concentration was then calculated for each COEC. The
computational approach was as follows: (1) for each polygon (or polygon subdivision),
the representative area was multiplied by the representative concentration; (2) these
“area-concentration” values were summed; and (3) the resulting cumulative value was
divided by the overall area to achieve the site-wide average concentration.
Appendix M presents a copy of the computation spreadsheet. Table 9 summarizes the updated
COEC concentrations against the respective lower-bound RGs. As indicated, upper-bound RGs
for each COEC were attained at each individual RA polygon, resulting in the area-weighted,
lower-bound RGs being achieved. In attaining these milestones, the RA achieved the objectives
set forth in the ROD.
Due to this remedy in place, IR Site 25 presents no hazard to human health or the environment,
and is available for unrestricted use. As such, no Five-Year Reviews will be conducted for IR
Site 25, in conformance to the ROD.

Final Remedial Action Completion Report
Remedial Action at IR Site 25
Former NAS Moffett Field
Moffett Field, California
21
5.0 ONGOING ACTIVITIES
Inspections have been arranged with the caretakers of the IR Site 25 footprint and its surrounding
areas, including representatives from MROSD, NASA ARC, and USFWS. MROSD and
USFWS have reviewed the condition of their respective facilities and have indicated that their
concerns have been met. The Navy conducted a pre-final inspection with NASA ARC on 17
January 2013. Final inspections by the Navy and NASA ARC were conducted in February 2013
after road repairs were made; these repairs had been delayed due to cold and wet weather.
Appendix N includes records of the MROSD and USFWS approvals and the pre-final inspection
form, and a copy of an e-mail acceptance from NASA ARC of the road repair.
Ongoing activities being conducted by the Navy at IR Site 25 include maintenance and
monitoring of habitat restoration, as described in the salt marsh habitat restoration plan (ITSI
Gilbane, 2012). This effort is summarized below.
The Navy performed weekly walk-throughs at the site during the 90-day recruitment
phase to assess the effectiveness of the seeding and whether adequate moisture was
present or if irrigation was needed. Visits commenced on 20 December 2012 and were
completed on 27 March 2013.
Establishment-phase monitoring including quantitative sampling events will be
conducted on an annual basis during the height of summer (when peak biomass occurs),
i.e., July of each year. The planned duration of these events is 1 week, during which
estimates of plant percent cover and plant height at revegetated areas and adjacent
reference sites will be recorded. Data will be summarized and compared to assess
restoration progress. If restoration of vegetation is not showing signs of satisfactory
progress throughout this phase of monitoring, the Navy will consider options to bolster the
revegetation effort; these options include additional hydroseeding, plantings, irrigation, and
monitoring.
A photographic record of the progress of revegetation will be maintained. Appendix O
includes a series of maps showing an initial grid of photo-point locations; the desired
camera directions for the photos to be recorded at each site also are indicated. Specific
issues noted during surveys will be photo-documented as well. At this time it is
anticipated that photo-documentation will be gathered on a quarterly basis.
An annual report, including photo-documentation, will be submitted to document the
establishment and recruitment phases.
Final Remedial Action Completion Report
Remedial Action at IR Site 25
Former NAS Moffett Field
Moffett Field, California
22
6.0 COMMUNITY RELATIONS
The Navy recognizes the importance of stakeholder participation at former NAS Moffett Field.
A Restoration Advisory Board (RAB) has been established, with the goal of improving public
participation in cleanup activities at the facility by involving the community in the Navy’s
environmental restoration decision-making process. RAB meetings are open to the general
public.
The RAB includes community volunteer members who reflect the diverse interests of the local
community. RAB members serve as a liaison with the community and are available to meet with
community members and groups. RAB members have an opportunity to provide input on the
Navy’s IR activities at Moffett Field.
The RAB meets regularly for review and comment of plans and activities relating to the ongoing
environmental studies and restoration activities at former NAS Moffett Field. RAB meetings
currently are held quarterly at the City of Mountain View Senior Center, 266 Escuela Avenue,
Mountain View, California 94040 (tel. 650-903-6330).
For the RA at IR Site 25, Navy representatives have presented technical information and project
updates to the RAB on several occasions. At future RAB meetings, the Navy will present the
results of the IR Site 25 RA construction (including the attainment of RAOs) and the progress of
revegetation at the site.
23

Final Remedial Action Completion Report
Remedial Action at IR Site 25
Former NAS Moffett Field
Moffett Field, California
24
8.0 REFERENCES
Department of Defense (DoD)/United States Environmental Protection Agency (USEPA), 2006.
Joint Guidance on Streamlined Site Closeout and NPL Deletion Process for DoD
Facilities. 19 January.
ERS Joint Venture, 2012. 2011 Annual Groundwater Report for Installation Restoration Sites 26
and 28, Moffett Field, California. April.
Innovative Technical Solutions, Inc. (ITSI), 2012. Remedial Design and Remedial Action Work
Plan, Remedial Action at IR Site 25, Former NAS Moffett Field, Moffett Field,
California. March.
Integrated Science Solutions, Inc., (ISSI), 2007. Implementation Report, Storm Water Settling
Basin Outfall Area, Additional Soil Removal, NASA Ames Research Center, Moffett
Field, California. February.
ITSI Gilbane, 2012. Revised Salt Marsh Habitat Restoration Plan. November.
KCH, 2011. Final Data Summary Report for Pre-Design Investigation of Sediment at
Installation Restoration Site 25, Former Naval Air Station Moffett Field, Santa Clara
County, California. March.
National Aeronautical and Space Administration (NASA), 2006. AOI 14 Phase II Investigation
Factsheet: PCBs in Surface Soils. March.
NASA Ames Research Center (ARC), 2010. NASA Ames Research Center Storm Water
Pollution Prevention Plan. January.
PRC Environmental Management, Inc., 1996. Final Station-Wide Remedial Investigation
Report, Moffett Federal Airfield, California. 21 May.
Tom Skeuse, 2012. E-mail to Dennis Rich, ITSI Gilbane. 10 July.
United States Department of the Navy (Navy), 2010. Final Record of Decision, Site 25, Former
Naval Air Station, Moffett Field, California. January.
Uribe & Associates, 2004. Report of PCB Source Identification Study, NASA Ames Research
Center, Moffett Field, California. June.
USEPA Region 9, the Navy, and the State of California (represented by the California
Department of Health Services and the California Regional Water Quality Control Board,
San Francisco Bay Region), 1990. Federal Facility Agreement under CERCLA Section
120 (Docket #89-27). August.

TABLES

Table 1 - Remediation GoalsRemedial Action at IR Site 25Former NAS Moffett FieldMoffett Field, California
Lead Zinc Total DDT Total PCBs
Site-wide average RG (lower bound) 33 180 0.016 0.200
Do-not-exceed RG (upper bound) 93.8 314 0.109 0.210
AbbreviationsCOECs - Chemicals of ecological concernPCBs - Polychlorinated biphenylsRG - Remediation Goal
Notes1. Total DDT is the summation of the p,p - isomers of DDD, DDE, and DDT.2. Total PCBs is the summation of Aroclors 1254, 1260, and 1268.3. RG units are milligrams per kilogram (parts per million).
Parameter
COECs
Page 1 of 1

Table 2 - Major Subcontractors and SuppliersRemedial Action at IR Site 25Former NAS Moffett FieldMoffett Field, California
Entity Office Location Function
Accutest Laboratories San Jose, CA Analysis of waste characterization samples
Calscience Environmental Laboratories, Inc. Garden Grove, CA Analysis of sediment confirmation samples
California Environmental Services, LLC San Ramon, CA Biological survey activities
Freedlun Hydroseeding Vacaville, CA Hydroseeding
Kinnetic Laboratories, Inc. Santa Cruz, CACollection of waste characterization samples (air boat)
Pacific Coast Seed Livermore, CA Hydroseed mixtures
Pacific States Environmental Contractors, Inc. Dublin, CAClearing and grubbing, excavation, backfilling, transportation and disposal
Subdynamic Locating Services San Jose, CA Utility survey
David Thomson San Jose, CA Ecological consultant
Page 1 of 1

Table 3 - Project TimelineRemedial Action at IR Site 25Former NAS Moffett FieldMoffett Field, California
Activity Start Date Finish Date
Biological assessment and monitoring May 2011 December 2012
Waste characterization February 2012 March 2012
Utility clearance February 2012 March 2012
Botanical survey April 2012 April 2012
Mobilization for major field activities May 2012 June 2012
Pumping for water diversion May 2012 November 2012
Clearing and grubbing June 2012 September 2012
Excavation of contaminated sediment July 2012 November 2012
Confirmation sampling July 2012 October 2012
T&D of excavated sediment Aug 2012 November 2012
Backfill October 2012 November 2012
Site restoration (see Note 1) November 2012 December 2012
Final inspections December 2012 February 2013
Abbreviations
T&D - Transportation & disposal
Notes1. Hydroseed operations will be completed when surface water recedes from IR Site 25.
Page 1 of 1

Table 4 - Excavation Summary - Storm Water Retention Pond
Remedial Action at IR Site 25
Former NAS Moffett Field
Moffett Field, California
Polygon Depth
(ft)Area ( sf)
Bank Volume (CY)
Polygon Depth
(ft)Area ( sf)
Bank Volume (CY)
A1.1 0.5 41,273 764 A9.1 0.5 34,249 634
A2.1 1.0 23,556 872 A9.2 1.0 5,323 197
A3.1 0.5 18,408 341 A9.3* 0.5 / 1 15,439 429
A4.1 0.5 90,968 1,685 A9.4 1.0 13,911 515
A4.2 0.5 28,493 528 A9.5 0.5 17,639 327
A4.3 0.5 13,076 242 A9.6 1.0 23,063 854
A4.4 0.5 13,903 257 A9.7 0.5 7,899 146
A4.5 0.5 22,252 412 A9.8 0.5 23,715 439
A5.1 0.5 35,697 661 A9.9 0.5 7,474 138
A5.2 0.5 59,690 1,105 A9.10 1.0 7,222 267
A6.1* 1 / 1.5 39,614 1,836 A9.11 1.0 9,294 344
A6.2 1.0 31,893 1,181 A9.12 0.5 19,041 353
A6.3 0.5 18,590 344 A10.1* 0.5 / 1 23,379 487
A6.4 0.5 788 15 A10.2 0.5 15,206 282
A6.5 0.5 625 12 A10.3 1.0 11,704 433
A8.1* 0.5 / 1 40,245 911 A10.4 0.5 8,689 161
A8.2 0.5 26,944 499 A10.5 1.0 7,675 284
A8.3 1.5 38,671 2,148 A10.6 0.5 8,312 154
A8.4 1.5 23,924 1,329 A10.7 0.5 9,279 172
A8.5 0.5 20,557 381 Totals - 1,086,155 28,363
A8.6 0.5 21,969 407
A8.7 1.5 13,739 763
A8.8 0.5 13,518 250
A8.9 1.5 16,232 902
A8.10 0.5 11,230 208
A8.11 1.0 12,805 474
A8.12 0.5 27,480 509
A8.13 0.5 14,959 277
A8.14 0.5 9,139 169
A8.15* 0.5 / 1 19,488 537
A8.16 0.5 8,151 151
A8.17 1.0 6,676 247
A8.18 0.5 5,975 111
A8.19 0.5 4,305 80
A8.20 1.5 2,591 144
A8.21 1.0 2,993 111
A8.22 0.5 3,978 74
A8.23 0.5 6,011 111
A8.24 1.0 10,349 383
A8.25 0.5 16,887 313
Abbreviationsft - feetsf - square feetcy - cubic yards
Notes
A6.1 - Figures 8 and 9 A8.1 - Figures 10 and 11 A8.15 - Figure 11 A9.3 - Figure 12 A10.1 - Figure 11 and 13
- polygon was overexcavated to a depth greater than was planned in the remedial design.
*Area and bank volume shown in this table are totals for each polygon. The following polygons were subdivided and excavated to two depths as indicated in the corresponding figures:
Page 1 of 1
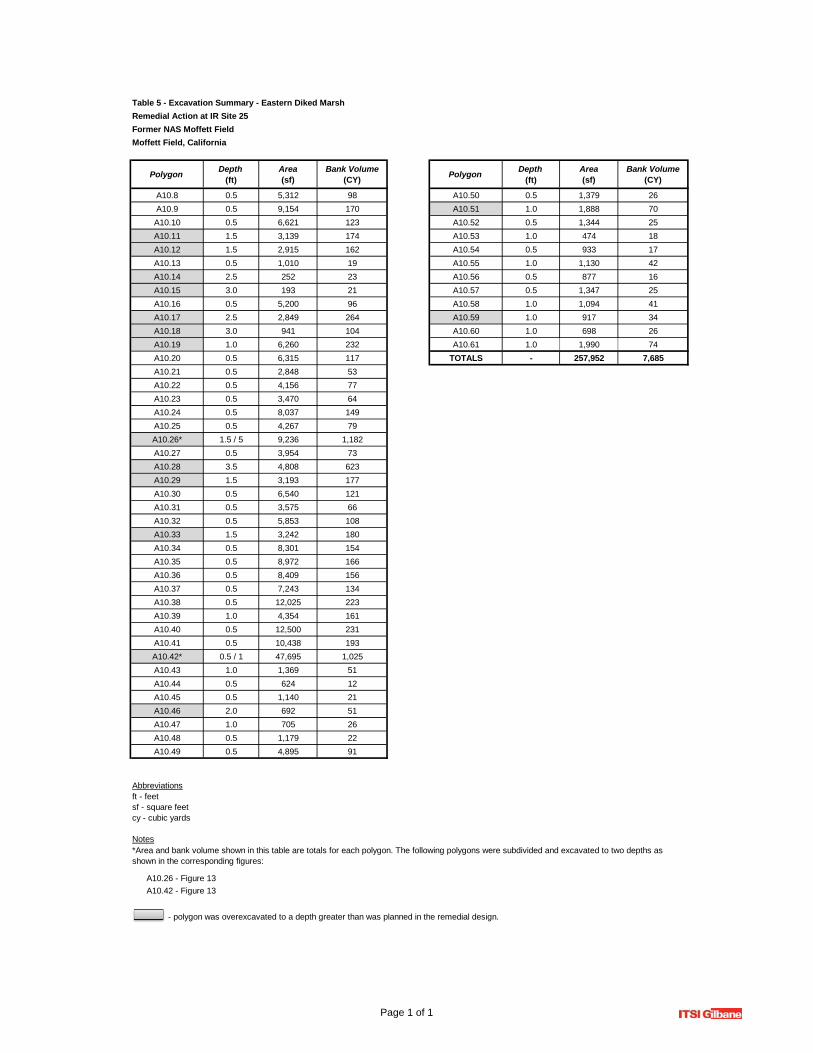
Table 5 - Excavation Summary - Eastern Diked Marsh
Remedial Action at IR Site 25
Former NAS Moffett Field
Moffett Field, California
PolygonDepth
(ft)Area (sf)
Bank Volume (CY)
PolygonDepth
(ft)Area (sf)
Bank Volume (CY)
A10.8 0.5 5,312 98 A10.50 0.5 1,379 26
A10.9 0.5 9,154 170 A10.51 1.0 1,888 70
A10.10 0.5 6,621 123 A10.52 0.5 1,344 25
A10.11 1.5 3,139 174 A10.53 1.0 474 18
A10.12 1.5 2,915 162 A10.54 0.5 933 17
A10.13 0.5 1,010 19 A10.55 1.0 1,130 42
A10.14 2.5 252 23 A10.56 0.5 877 16
A10.15 3.0 193 21 A10.57 0.5 1,347 25
A10.16 0.5 5,200 96 A10.58 1.0 1,094 41
A10.17 2.5 2,849 264 A10.59 1.0 917 34
A10.18 3.0 941 104 A10.60 1.0 698 26
A10.19 1.0 6,260 232 A10.61 1.0 1,990 74
A10.20 0.5 6,315 117 TOTALS - 257,952 7,685
A10.21 0.5 2,848 53
A10.22 0.5 4,156 77
A10.23 0.5 3,470 64
A10.24 0.5 8,037 149
A10.25 0.5 4,267 79
A10.26* 1.5 / 5 9,236 1,182
A10.27 0.5 3,954 73
A10.28 3.5 4,808 623
A10.29 1.5 3,193 177
A10.30 0.5 6,540 121
A10.31 0.5 3,575 66
A10.32 0.5 5,853 108
A10.33 1.5 3,242 180
A10.34 0.5 8,301 154
A10.35 0.5 8,972 166
A10.36 0.5 8,409 156
A10.37 0.5 7,243 134
A10.38 0.5 12,025 223
A10.39 1.0 4,354 161
A10.40 0.5 12,500 231
A10.41 0.5 10,438 193
A10.42* 0.5 / 1 47,695 1,025
A10.43 1.0 1,369 51
A10.44 0.5 624 12
A10.45 0.5 1,140 21
A10.46 2.0 692 51
A10.47 1.0 705 26
A10.48 0.5 1,179 22
A10.49 0.5 4,895 91
Abbreviationsft - feetsf - square feetcy - cubic yards
Notes
A10.26 - Figure 13
A10.42 - Figure 13
- polygon was overexcavated to a depth greater than was planned in the remedial design.
*Area and bank volume shown in this table are totals for each polygon. The following polygons were subdivided and excavated to two depths as shown in the corresponding figures:
Page 1 of 1
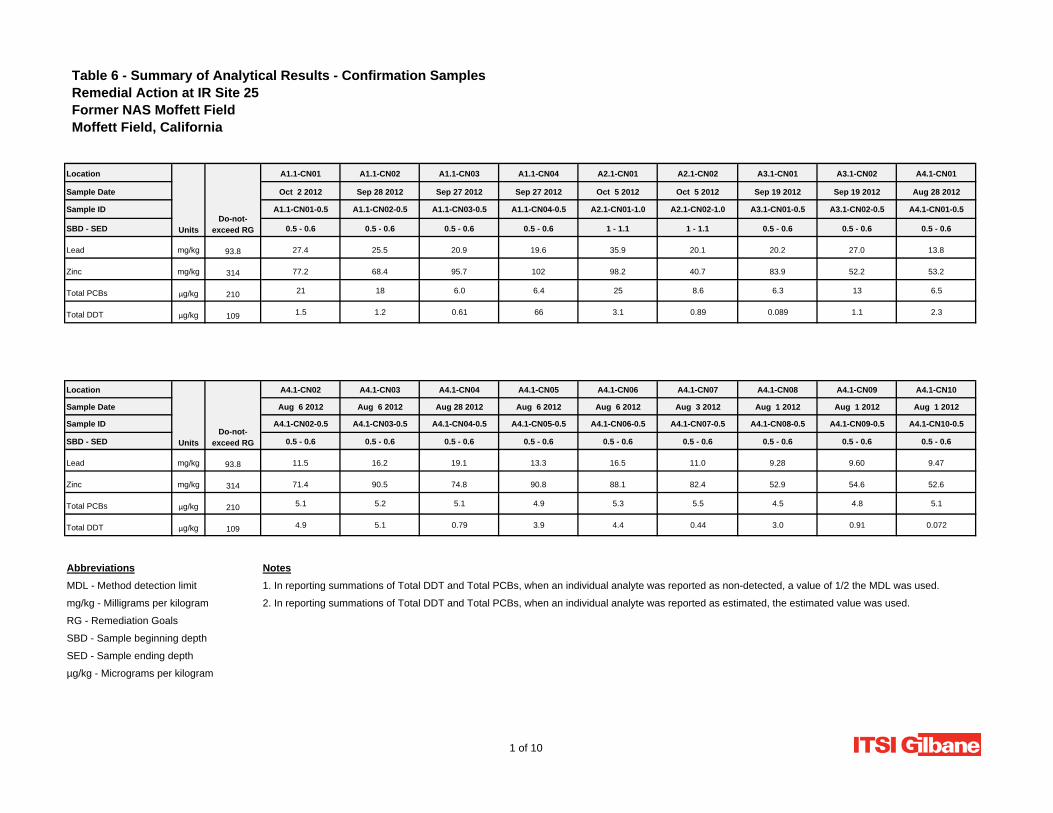
Table 6 - Summary of Analytical Results - Confirmation SamplesRemedial Action at IR Site 25Former NAS Moffett FieldMoffett Field, California
Location A1.1-CN01 A1.1-CN02 A1.1-CN03 A1.1-CN04 A2.1-CN01 A2.1-CN02 A3.1-CN01 A3.1-CN02 A4.1-CN01
Sample Date Oct 2 2012 Sep 28 2012 Sep 27 2012 Sep 27 2012 Oct 5 2012 Oct 5 2012 Sep 19 2012 Sep 19 2012 Aug 28 2012
Sample ID A1.1-CN01-0.5 A1.1-CN02-0.5 A1.1-CN03-0.5 A1.1-CN04-0.5 A2.1-CN01-1.0 A2.1-CN02-1.0 A3.1-CN01-0.5 A3.1-CN02-0.5 A4.1-CN01-0.5
SBD - SED 0.5 - 0.6 0.5 - 0.6 0.5 - 0.6 0.5 - 0.6 1 - 1.1 1 - 1.1 0.5 - 0.6 0.5 - 0.6 0.5 - 0.6
Lead mg/kg 27.4 25.5 20.9 19.6 35.9 20.1 20.2 27.0 13.8
Zinc mg/kg 77.2 68.4 95.7 102 98.2 40.7 83.9 52.2 53.2
Total PCBs µg/kg 21 18 6.0 6.4 25 8.6 6.3 13 6.5
Total DDT µg/kg 1.5 1.2 0.61 66 3.1 0.89 0.089 1.1 2.3
Location A4.1-CN02 A4.1-CN03 A4.1-CN04 A4.1-CN05 A4.1-CN06 A4.1-CN07 A4.1-CN08 A4.1-CN09 A4.1-CN10
Sample Date Aug 6 2012 Aug 6 2012 Aug 28 2012 Aug 6 2012 Aug 6 2012 Aug 3 2012 Aug 1 2012 Aug 1 2012 Aug 1 2012
Sample ID A4.1-CN02-0.5 A4.1-CN03-0.5 A4.1-CN04-0.5 A4.1-CN05-0.5 A4.1-CN06-0.5 A4.1-CN07-0.5 A4.1-CN08-0.5 A4.1-CN09-0.5 A4.1-CN10-0.5
SBD - SED 0.5 - 0.6 0.5 - 0.6 0.5 - 0.6 0.5 - 0.6 0.5 - 0.6 0.5 - 0.6 0.5 - 0.6 0.5 - 0.6 0.5 - 0.6
Lead mg/kg 11.5 16.2 19.1 13.3 16.5 11.0 9.28 9.60 9.47
Zinc mg/kg 71.4 90.5 74.8 90.8 88.1 82.4 52.9 54.6 52.6
Total PCBs µg/kg 5.1 5.2 5.1 4.9 5.3 5.5 4.5 4.8 5.1
Total DDT µg/kg 4.9 5.1 0.79 3.9 4.4 0.44 3.0 0.91 0.072
Abbreviations Notes
MDL - Method detection limit 1. In reporting summations of Total DDT and Total PCBs, when an individual analyte was reported as non-detected, a value of 1/2 the MDL was used.
mg/kg - Milligrams per kilogram 2. In reporting summations of Total DDT and Total PCBs, when an individual analyte was reported as estimated, the estimated value was used.
RG - Remediation Goals
SBD - Sample beginning depth
SED - Sample ending depth
µg/kg - Micrograms per kilogram
93.8
314
Units
210
109
Do-not-exceed RG
UnitsDo-not-
exceed RG
93.8
314
210
109
1 of 10

Table 6 - Summary of Analytical Results - Confirmation SamplesRemedial Action at IR Site 25Former NAS Moffett FieldMoffett Field, California
Location
Sample Date
Sample ID
SBD - SED
Lead mg/kg
Zinc mg/kg
Total PCBs µg/kg
Total DDT µg/kg
Location
Sample Date
Sample ID
SBD - SED
Lead mg/kg
Zinc mg/kg
Total PCBs µg/kg
Total DDT µg/kg
Abbreviations
MDL - Method detection limit
mg/kg - Milligrams per kilogram
RG - Remediation Goals
SBD - Sample beginning depth
SED - Sample ending depth
µg/kg - Micrograms per kilogram
93.8
314
Units
210
109
Do-not-exceed RG
UnitsDo-not-
exceed RG
93.8
314
210
109
A4.2-CN01 A4.2-CN02 A4.3-CN01 A4.3-CN02 A4.4-CN01 A4.5-CN01 A4.5-CN02 A5.1-CN01 A5.1-CN02
Aug 8 2012 Aug 8 2012 Aug 3 2012 Aug 3 2012 Aug 3 2012 Aug 17 2012 Aug 17 2012 Aug 10 2012 Aug 10 2012
A4.2-CN01-0.5 A4.2-CN02-0.5 A4.3-CN01-0.5 A4.3-CN02-0.5 A4.4-CN01-0.5 A4.5-CN01-0.5 A4.5-CN02-0.5 A5.1-CN01-0.5 A5.1-CN02-0.5
0.5 - 0.6 0.5 - 0.6 0.5 - 0.6 0.5 - 0.6 0.5 - 0.6 0.5 - 0.6 0.5 - 0.6 0.5 - 0.6 0.5 - 0.6
19.5 14.4 9.41 14.2 7.30 14.2 14.1 19.9 12.5
132 94.5 70.6 72.6 54.4 96.1 85.9 100 83.8
5.3 5.3 5.1 4.7 4.8 16 5.4 6.4 5.9
2.1 4.0 0.34 0.87 0.29 2.1 11 4.9 0.82
A5.1-CN03 A5.1-CN04 A5.2-CN01 A5.2-CN02 A5.2-CN03 A5.2-CN04 A5.2-CN05 A5.2-CN06 A6.1-CN01
Aug 10 2012 Aug 10 2012 Sep 7 2012 Sep 7 2012 Sep 7 2012 Sep 11 2012 Sep 11 2012 Sep 7 2012 Sep 11 2012
A5.1-CN03-0.5 A5.1-CN04-0.5 A5.2-CN01-0.5 A5.2-CN02-0.5 A5.2-CN03-0.5 A5.2-CN04-0.5 A5.2-CN05-0.5 A5.2-CN06-0.5 A6.1-CN01-1.0
0.5 - 0.6 0.5 - 0.6 0.5 - 0.6 0.5 - 0.6 0.5 - 0.6 0.5 - 0.6 0.5 - 0.6 0.5 - 0.6 1 - 1.1
17.4 14.9 11.1 32.1 15.1 23.8 12.5 12.5 10.8
87.7 72.1 92.9 104 75.6 114 105 97.1 101
14 7.2 8.5 5.6 20 6.2 5.6 5.6 6.8
3.2 1.1 4.1 14 8.0 6.3 0.75 1.1 2.6
Notes
1. In reporting summations of Total DDT and Total PCBs, when an individual analyte was reported as non-detected, a value of 1/2 the MDL was used.
2. In reporting summations of Total DDT and Total PCBs, when an individual analyte was reported as estimated, the estimated value was used.
2 of 10

Table 6 - Summary of Analytical Results - Confirmation SamplesRemedial Action at IR Site 25Former NAS Moffett FieldMoffett Field, California
Location
Sample Date
Sample ID
SBD - SED
Lead mg/kg
Zinc mg/kg
Total PCBs µg/kg
Total DDT µg/kg
Location
Sample Date
Sample ID
SBD - SED
Lead mg/kg
Zinc mg/kg
Total PCBs µg/kg
Total DDT µg/kg
Abbreviations
MDL - Method detection limit
mg/kg - Milligrams per kilogram
RG - Remediation Goals
SBD - Sample beginning depth
SED - Sample ending depth
µg/kg - Micrograms per kilogram
93.8
314
Units
210
109
Do-not-exceed RG
UnitsDo-not-
exceed RG
93.8
314
210
109
A6.1-CN02 A6.1-CN03 A6.1-CN04 A6.2-CN01 A6.2-CN02 A6.2-CN03 A6.2-CN04 A6.3-CN01 A6.3-CN02
Sep 24 2012 Sep 13 2012 Sep 20 2012 Sep 20 2012 Sep 20 2012 Sep 20 2012 Sep 20 2012 Sep 24 2012 Sep 24 2012
A6.1-CN02-1.5 A6.1-CN03-1.0 A6.1-CN04-1.5 A6.2-CN01-1.0 A6.2-CN02-1.0 A6.2-CN03-1.0 A6.2-CN04-1.0 A6.3-CN01-0.5 A6.3-CN02-0.5
1.5 - 1.6 1 - 1.1 1.5 - 1.6 1 - 1.1 1 - 1.1 1 - 1.1 1 - 1.1 0.5 - 0.6 0.5 - 0.6
13.2 11.8 24.4 8.60 17.5 9.31 9.88 7.60 7.88
71.5 81.6 115 78.6 100 95.6 78.6 44.2 55.6
8.3 6.8 6.5 8.1 6.6 8.3 8.1 11 27
0.43 0.29 11 0.33 4.9 0.69 0.79 0.16 8.0
A6.4-CN01 A6.5-CN01 A8.1-CN01 A8.1-CN02 A8.1-CN03 A8.1-CN04 A8.2-CN01 A8.2-CN02 A8.3-CN01
Sep 24 2012 Sep 24 2012 Aug 17 2012 Aug 17 2012 Aug 30 2012 Aug 17 2012 Aug 22 2012 Aug 22 2012 Aug 24 2012
A6.4-CN01-0.5 A6.5-CN01-0.5 A8.1-CN01-0.5 A8.1-CN02-0.5 A8.1-CN03-1.0 A8.1-CN04-0.5 A8.2-CN01-0.5 A8.2-CN02-0.5 A8.3-CN01-1.5
0.5 - 0.6 0.5 - 0.6 0.5 - 0.6 0.5 - 0.6 1 - 1.1 0.5 - 0.6 0.5 - 0.6 0.5 - 0.6 1.5 - 1.6
20.8 26.1 8.25 7.38 6.38 12.0 12.4 13.4 15.0
77.9 112 69.5 55.0 49.0 93.8 93.9 102 85.7
8.6 7.3 6.1 6.7 35 5.0 14 19 81
0.12 0.46 2.3 2.1 1.1 1.6 0.74 4.3 0.12
Notes
1. In reporting summations of Total DDT and Total PCBs, when an individual analyte was reported as non-detected, a value of 1/2 the MDL was used.
2. In reporting summations of Total DDT and Total PCBs, when an individual analyte was reported as estimated, the estimated value was used.
3 of 10

Table 6 - Summary of Analytical Results - Confirmation SamplesRemedial Action at IR Site 25Former NAS Moffett FieldMoffett Field, California
Location
Sample Date
Sample ID
SBD - SED
Lead mg/kg
Zinc mg/kg
Total PCBs µg/kg
Total DDT µg/kg
Location
Sample Date
Sample ID
SBD - SED
Lead mg/kg
Zinc mg/kg
Total PCBs µg/kg
Total DDT µg/kg
Abbreviations
MDL - Method detection limit
mg/kg - Milligrams per kilogram
RG - Remediation Goals
SBD - Sample beginning depth
SED - Sample ending depth
µg/kg - Micrograms per kilogram
93.8
314
Units
210
109
Do-not-exceed RG
UnitsDo-not-
exceed RG
93.8
314
210
109
A8.3-CN02 A8.3-CN03 A8.3-CN04 A8.4-CN01 A8.4-CN02 A8.5-CN01 A8.5-CN02 A8.6-CN01 A8.6-CN02
Aug 24 2012 Aug 24 2012 Aug 24 2012 Aug 29 2012 Aug 29 2012 Sep 14 2012 Sep 14 2012 Sep 4 2012 Sep 4 2012
A8.3-CN02-1.5 A8.3-CN03-1.5 A8.3-CN04-1.5 A8.4-CN01-1.5 A8.4-CN02-1.5 A8.5-CN01-0.5 A8.5-CN02-0.5 A8.6-CN01-0.5 A8.6-CN02-0.5
1.5 - 1.6 1.5 - 1.6 1.5 - 1.6 1.5 - 1.6 1.5 - 1.6 0.5 - 0.6 0.5 - 0.6 0.5 - 0.6 0.5 - 0.6
6.54 6.95 7.20 6.39 13.7 7.70 63.8 9.97 18.4
67.7 68.2 78.3 42.5 63.0 71.4 203 67.1 101
36 12 48 5.8 90 8.9 180 9.3 7.7
3.3 0.88 0.15 0.13 2.4 2.3 69 1.1 4.8
A8.7-CN01 A8.8-CN01 A8.8-CN02 A8.9-CN01 A8.9-CN02 A8.10-CN01 A8.11-CN01 A8.12-CN01 A8.12-CN02
Aug 23 2012 Aug 8 2012 Aug 8 2012 Aug 23 2012 Aug 23 2012 Aug 8 2012 Aug 23 2012 Aug 9 2012 Aug 9 2012
A8.7-CN01-1.5 A8.8-CN01-0.5 A8.8-CN02-0.5 A8.9-CN01-1.5 A8.9-CN02-1.5 A8.10-CN01-0.5 A8.11-CN01-1.0 A8.12-CN01-0.5 A8.12-CN02-0.5
1.5 - 1.6 0.5 - 0.6 0.5 - 0.6 1.5 - 1.6 1.5 - 1.6 0.5 - 0.6 1 - 1.1 0.5 - 0.6 0.5 - 0.6
7.65 18.1 17.8 7.16 6.75 15.6 7.59 15.9 10.9
46.6 101 135 52.4 50.0 120 54.3 98.7 62.7
5.5 18 27 5.6 5.4 38 5.5 27 5.8
0.46 11 18 1.8 0.55 0.082 1.6 2.3 1.7
Notes
1. In reporting summations of Total DDT and Total PCBs, when an individual analyte was reported as non-detected, a value of 1/2 the MDL was used.
2. In reporting summations of Total DDT and Total PCBs, when an individual analyte was reported as estimated, the estimated value was used.
4 of 10

Table 6 - Summary of Analytical Results - Confirmation SamplesRemedial Action at IR Site 25Former NAS Moffett FieldMoffett Field, California
Location
Sample Date
Sample ID
SBD - SED
Lead mg/kg
Zinc mg/kg
Total PCBs µg/kg
Total DDT µg/kg
Location
Sample Date
Sample ID
SBD - SED
Lead mg/kg
Zinc mg/kg
Total PCBs µg/kg
Total DDT µg/kg
Abbreviations
MDL - Method detection limit
mg/kg - Milligrams per kilogram
RG - Remediation Goals
SBD - Sample beginning depth
SED - Sample ending depth
µg/kg - Micrograms per kilogram
93.8
314
Units
210
109
Do-not-exceed RG
UnitsDo-not-
exceed RG
93.8
314
210
109
A8.13-CN01 A8.14-CN01 A8.15-CN01 A8.15-CN02 A8.16-CN01 A8.17-CN01 A8.18-CN01 A8.19-CN01 A8.20-CN01
Aug 22 2012 Aug 28 2012 Sep 12 2012 Aug 24 2012 Aug 29 2012 Aug 28 2012 Oct 15 2012 Sep 27 2012 Oct 3 2012
A8.13-CN01-0.5 A8.14-CN01-0.5 A8.15-CN01-1.0 A8.15-CN02-0.5 A8.16-CN01-0.5 A8.17-CN01-1.0 A8.18-CN01-0.5 A8.19-CN01-0.5 A8.20-CN01-1.5
0.5 - 0.6 0.5 - 0.6 1 - 1.1 0.5 - 0.6 0.5 - 0.6 1 - 1.1 0.5 - 0.6 0.5 - 0.6 1.5 - 1.6
6.41 7.55 5.69 32.6 9.86 6.34 8.68 8.76 8.29
56.5 53.2 46.7 105 54.7 52.6 63.5 52.8 61.1
10 5.3 15 69 40 5.2 7.1 5.3 7.4
2.6 44 0.39 10 2.9 0.76 0.22 1.1 0.072
A8.21-CN01 A8.22-CN01 A8.23-CN01 A8.24-CN01 A8.25-CN01 A8.25-CN02 A9.1-CN01 A9.1-CN02 A9.1-CN03
Oct 2 2012 Sep 28 2012 Sep 4 2012 Sep 4 2012 Aug 22 2012 Aug 22 2012 Sep 17 2012 Sep 18 2012 Sep 17 2012
A8.21-CN01-1.0 A8.22-CN01-0.5 A8.23-CN01-0.5 A8.24-CN01-1.0 A8.25-CN01-0.5 A8.25-CN02-0.5 A9.1-CN01-0.5 A9.1-CN02-0.5 A9.1-CN03-0.5
1 - 1.1 0.5 - 0.6 0.5 - 0.6 1 - 1.1 0.5 - 0.6 0.5 - 0.6 0.5 - 0.6 0.5 - 0.6 0.5 - 0.6
10.7 14.0 8.78 12.5 13.5 6.17 66.4 11.3 31.8
69.3 76.8 70.8 66.1 90.7 55.9 296 90.6 109
27 33 4.3 22 5.5 5.7 16 7.1 47
0.78 2.7 0.54 0.67 4.9 1.5 53 0.75 27
Notes
1. In reporting summations of Total DDT and Total PCBs, when an individual analyte was reported as non-detected, a value of 1/2 the MDL was used.
2. In reporting summations of Total DDT and Total PCBs, when an individual analyte was reported as estimated, the estimated value was used.
5 of 10

Table 6 - Summary of Analytical Results - Confirmation SamplesRemedial Action at IR Site 25Former NAS Moffett FieldMoffett Field, California
Location
Sample Date
Sample ID
SBD - SED
Lead mg/kg
Zinc mg/kg
Total PCBs µg/kg
Total DDT µg/kg
Location
Sample Date
Sample ID
SBD - SED
Lead mg/kg
Zinc mg/kg
Total PCBs µg/kg
Total DDT µg/kg
Abbreviations
MDL - Method detection limit
mg/kg - Milligrams per kilogram
RG - Remediation Goals
SBD - Sample beginning depth
SED - Sample ending depth
µg/kg - Micrograms per kilogram
93.8
314
Units
210
109
Do-not-exceed RG
UnitsDo-not-
exceed RG
93.8
314
210
109
A9.1-CN04 A9.2-CN01 A9.3-CN01 A9.3-CN02 A9.4-CN01 A9.5-CN01 A9.5-CN02 A9.6-CN01 A9.6-CN02
Sep 17 2012 Sep 24 2012 Sep 26 2012 Sep 14 2012 Sep 18 2012 Sep 11 2012 Sep 11 2012 Sep 18 2012 Sep 18 2012
A9.1-CN04-0.5 A9.2-CN01-1.0 A9.3-CN01-1.0 A9.3-CN02-0.5 A9.4-CN01-1.0 A9.5-CN01-0.5 A9.5-CN02-0.5 A9.6-CN01-1.0 A9.6-CN02-1.0
0.5 - 0.6 1 - 1.1 1 - 1.1 0.5 - 0.6 1 - 1.1 0.5 - 0.6 0.5 - 0.6 1 - 1.1 1 - 1.1
20.1 9.32 6.47 28.3 6.57 12.5 18.3 19.1 14.1
83.7 69.2 75.0 117 80.8 104 104 93.5 68.6
8.0 8.5 7.4 6.3 8.6 7.0 6.2 6.3 12
3.5 12 1.9 6.2 1.5 0.67 2.7 3.6 0.74
A9.7-CN01 A9.8-CN01 A9.8-CN02 A9.9-CN01 A9.10-CN01 A9.11-CN01 A9.12-CN01 A9.12-CN02 A10.1-CN01
Sep 7 2012 Sep 7 2012 Sep 7 2012 Sep 7 2012 Sep 5 2012 Sep 5 2012 Sep 19 2012 Sep 19 2012 Oct 15 2012
A9.7-CN01-0.5 A9.8-CN01-0.5 A9.8-CN02-0.5 A9.9-CN01-0.5 A9.10-CN01-1.0 A9.11-CN01-1.0 A9.12-CN01-0.5 A9.12-CN02-0.5 A10.1-CN01-0.5
0.5 - 0.6 0.5 - 0.6 0.5 - 0.6 0.5 - 0.6 1 - 1.1 1 - 1.1 0.5 - 0.6 0.5 - 0.6 0.5 - 0.6
14.5 14.0 16.7 24.4 7.95 8.30 20.3 7.33 10.5
90.6 97.8 106 119 56.9 67.3 91.2 54.0 77.2
6.2 7.4 6.3 48 4.6 4.5 13 4.3 8.6
0.27 1.8 0.93 7.2 0.74 0.99 4.3 0.11 2.6
Notes
1. In reporting summations of Total DDT and Total PCBs, when an individual analyte was reported as non-detected, a value of 1/2 the MDL was used.
2. In reporting summations of Total DDT and Total PCBs, when an individual analyte was reported as estimated, the estimated value was used.
6 of 10
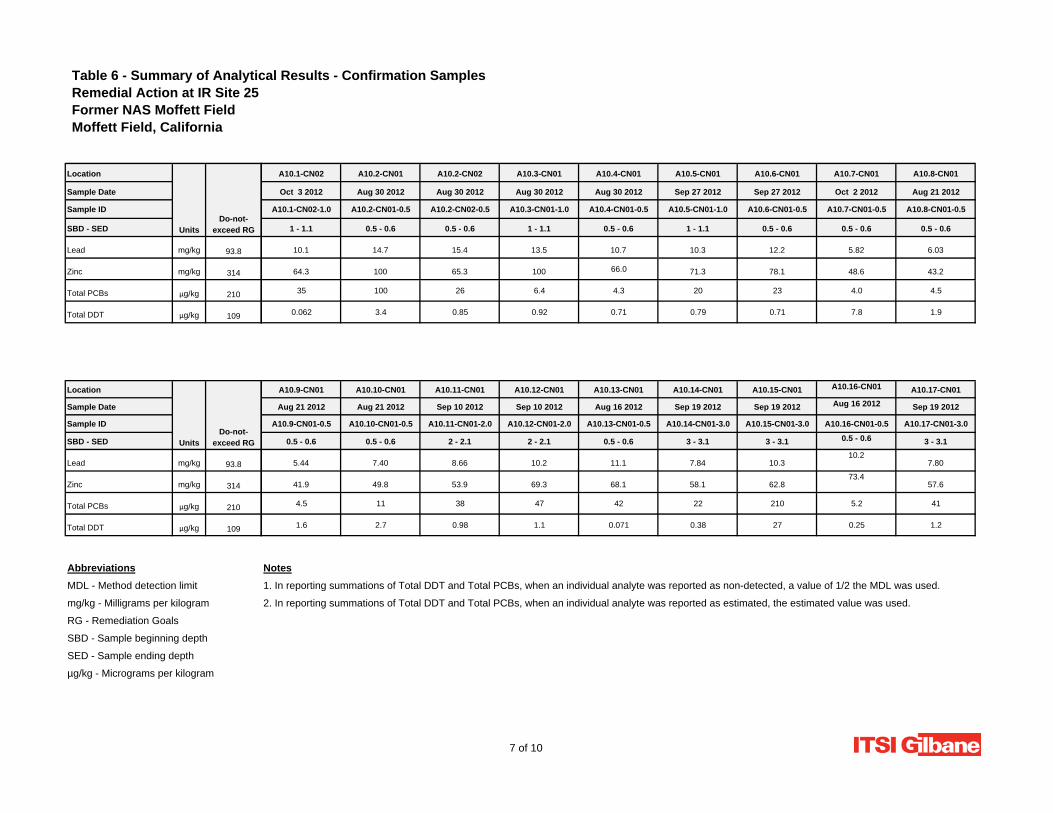
Table 6 - Summary of Analytical Results - Confirmation SamplesRemedial Action at IR Site 25Former NAS Moffett FieldMoffett Field, California
Location
Sample Date
Sample ID
SBD - SED
Lead mg/kg
Zinc mg/kg
Total PCBs µg/kg
Total DDT µg/kg
Location
Sample Date
Sample ID
SBD - SED
Lead mg/kg
Zinc mg/kg
Total PCBs µg/kg
Total DDT µg/kg
Abbreviations
MDL - Method detection limit
mg/kg - Milligrams per kilogram
RG - Remediation Goals
SBD - Sample beginning depth
SED - Sample ending depth
µg/kg - Micrograms per kilogram
93.8
314
Units
210
109
Do-not-exceed RG
UnitsDo-not-
exceed RG
93.8
314
210
109
A10.1-CN02 A10.2-CN01 A10.2-CN02 A10.3-CN01 A10.4-CN01 A10.5-CN01 A10.6-CN01 A10.7-CN01 A10.8-CN01
Oct 3 2012 Aug 30 2012 Aug 30 2012 Aug 30 2012 Aug 30 2012 Sep 27 2012 Sep 27 2012 Oct 2 2012 Aug 21 2012
A10.1-CN02-1.0 A10.2-CN01-0.5 A10.2-CN02-0.5 A10.3-CN01-1.0 A10.4-CN01-0.5 A10.5-CN01-1.0 A10.6-CN01-0.5 A10.7-CN01-0.5 A10.8-CN01-0.5
1 - 1.1 0.5 - 0.6 0.5 - 0.6 1 - 1.1 0.5 - 0.6 1 - 1.1 0.5 - 0.6 0.5 - 0.6 0.5 - 0.6
10.1 14.7 15.4 13.5 10.7 10.3 12.2 5.82 6.03
64.3 100 65.3 100 66.0 71.3 78.1 48.6 43.2
35 100 26 6.4 4.3 20 23 4.0 4.5
0.062 3.4 0.85 0.92 0.71 0.79 0.71 7.8 1.9
A10.9-CN01 A10.10-CN01 A10.11-CN01 A10.12-CN01 A10.13-CN01 A10.14-CN01 A10.15-CN01 A10.16-CN01 A10.17-CN01
Aug 21 2012 Aug 21 2012 Sep 10 2012 Sep 10 2012 Aug 16 2012 Sep 19 2012 Sep 19 2012 Aug 16 2012 Sep 19 2012
A10.9-CN01-0.5 A10.10-CN01-0.5 A10.11-CN01-2.0 A10.12-CN01-2.0 A10.13-CN01-0.5 A10.14-CN01-3.0 A10.15-CN01-3.0 A10.16-CN01-0.5 A10.17-CN01-3.0
0.5 - 0.6 0.5 - 0.6 2 - 2.1 2 - 2.1 0.5 - 0.6 3 - 3.1 3 - 3.1 0.5 - 0.6 3 - 3.1
5.44 7.40 8.66 10.2 11.1 7.84 10.310.2
7.80
41.9 49.8 53.9 69.3 68.1 58.1 62.873.4
57.6
4.5 11 38 47 42 22 210 5.2 41
1.6 2.7 0.98 1.1 0.071 0.38 27 0.25 1.2
Notes
1. In reporting summations of Total DDT and Total PCBs, when an individual analyte was reported as non-detected, a value of 1/2 the MDL was used.
2. In reporting summations of Total DDT and Total PCBs, when an individual analyte was reported as estimated, the estimated value was used.
7 of 10

Table 6 - Summary of Analytical Results - Confirmation SamplesRemedial Action at IR Site 25Former NAS Moffett FieldMoffett Field, California
Location
Sample Date
Sample ID
SBD - SED
Lead mg/kg
Zinc mg/kg
Total PCBs µg/kg
Total DDT µg/kg
Location
Sample Date
Sample ID
SBD - SED
Lead mg/kg
Zinc mg/kg
Total PCBs µg/kg
Total DDT µg/kg
Abbreviations
MDL - Method detection limit
mg/kg - Milligrams per kilogram
RG - Remediation Goals
SBD - Sample beginning depth
SED - Sample ending depth
µg/kg - Micrograms per kilogram
93.8
314
Units
210
109
Do-not-exceed RG
UnitsDo-not-
exceed RG
93.8
314
210
109
A10.18-CN01 A10.19-CN01 A10.20-CN01 A10.21-CN01 A10.22-CN01 A10.23-CN01 A10.24-CN01 A10.25-CN01 A10.26-CN01
Sep 19 2012 Aug 29 2012 Aug 16 2012 Aug 16 2012 Aug 21 2012 Aug 21 2012 Aug 16 2012 Sep 13 2012 Oct 15 2012
A10.18-CN01-3.0 A10.19-CN01-1.0 A10.20-CN01-0.5 A10.21-CN01-0.5 A10.22-CN01-0.5 A10.23-CN01-0.5 A10.24-CN01-0.5 A10.25-CN01-0.5 A10.26-CN01-5.5
3 - 3.1 1 - 1.1 0.5 - 0.6 0.5 - 0.6 0.5 - 0.6 0.5 - 0.6 0.5 - 0.6 0.5 - 0.6 5.5 - 5.6
8.79 7.90 10.2 10.5 8.92 12.7 10.3 8.89 20.7
56.9 52.4 70.2 68.4 64.4 71.5 75.5 63.2 126
110 52 18 65 5.0 17 13 9.8 43
2.6 1.7 0.070 0.068 1.5 4.2 0.073 0.66 4.1
A10.26-CN02 A10.27-CN01 A10.28-CN01 A10.29-CN01 A10.30-CN01 A10.31-CN01 A10.32-CN01 A10.33-CN01 A10.34-CN01
Oct 17 2012 Sep 13 2012 Oct 3 2012 Sep 26 2012 Sep 18 2012 Sep 18 2012 Sep 19 2012 Sep 28 2012 Aug 21 2012
A10.26-CN02-1.5 A10.27-CN01-0.5 A10.28-CN01-3.5 A10.29-CN01-2.5 A10.30-CN01-0.5 A10.31-CN01-0.5 A10.32-CN01-0.5 A10.33-CN01-2.5 A10.34-CN01-0.5
1.5 - 1.6 0.5 - 0.6 3.5 - 3.6 2.5 - 2.6 0.5 - 0.6 0.5 - 0.6 0.5 - 0.6 2.5 - 2.6 0.5 - 0.6
12.1 11.0 8.03 8.99 10.7 11.1 10.5 10.7 6.64
69.1 73.7 57.5 69.1 72.3 74.1 67.9 71.4 49.4
4.6 11 130 60 4.7 4.6 13 22 4.6
0.066 0.78 0.068 3.0 0.54 0.83 0.88 1.0 1.1
Notes
1. In reporting summations of Total DDT and Total PCBs, when an individual analyte was reported as non-detected, a value of 1/2 the MDL was used.
2. In reporting summations of Total DDT and Total PCBs, when an individual analyte was reported as estimated, the estimated value was used.
8 of 10

Table 6 - Summary of Analytical Results - Confirmation SamplesRemedial Action at IR Site 25Former NAS Moffett FieldMoffett Field, California
Location
Sample Date
Sample ID
SBD - SED
Lead mg/kg
Zinc mg/kg
Total PCBs µg/kg
Total DDT µg/kg
Location
Sample Date
Sample ID
SBD - SED
Lead mg/kg
Zinc mg/kg
Total PCBs µg/kg
Total DDT µg/kg
Abbreviations
MDL - Method detection limit
mg/kg - Milligrams per kilogram
RG - Remediation Goals
SBD - Sample beginning depth
SED - Sample ending depth
µg/kg - Micrograms per kilogram
93.8
314
Units
210
109
Do-not-exceed RG
UnitsDo-not-
exceed RG
93.8
314
210
109
A10.35-CN01 A10.36-CN01 A10.37-CN01 A10.38-CN01 A10.39-CN01 A10.40-CN01 A10.41-CN01 A10.42-CN01 A10.42-CN02
Aug 21 2012 Sep 19 2012 Sep 7 2012 Sep 7 2012 Sep 19 2012 Sep 4 2012 Sep 4 2012 Aug 9 2012 Aug 29 2012
A10.35-CN01-0.5 A10.36-CN01-0.5 A10.37-CN01-0.5 A10.38-CN01-0.5 A10.39-CN01-1.0 A10.40-CN01-0.5 A10.41-CN01-0.5 A10.42-CN01-0.5 A10.42-CN02-0.5
0.5 - 0.6 0.5 - 0.6 0.5 - 0.6 0.5 - 0.6 1 - 1.1 0.5 - 0.6 0.5 - 0.6 0.5 - 0.6 0.5 - 0.6
7.60 10.1 11.2 11.6 11.4 7.33 7.02 25.0 12.8
57.1 69.2 57.0 70.4 66.1 53.8 57.0 91.6 66.2
4.6 13 4.6 10 31 4.5 4.7 23 4.5
0.42 1.0 1.8 1.6 1.9 0.52 1.0 31 13
A10.42-CN03 A10.42-CN04 A10.42-CN05 A10.43-CN01 A10.44-CN01 A10.45-CN01 A10.46-CN01 A10.47-CN01 A10.48-CN01
Sep 12 2012 Aug 29 2012 Aug 29 2012 Aug 30 2012 Aug 30 2012 Aug 30 2012 Sep 24 2012 Aug 30 2012 Aug 31 2012
A10.42-CN03-1.0 A10.42-CN04-0.5 A10.42-CN05-0.5 A10.43-CN01-1.0 A10.44-CN01-0.5 A10.45-CN01-0.5 A10.46-CN01-2.5 A10.47-CN01-1.0 A10.48-CN01-0.5
1 - 1.1 0.5 - 0.6 0.5 - 0.6 1 - 1.1 0.5 - 0.6 0.5 - 0.6 2.5 - 2.6 1 - 1.1 0.5 - 0.6
8.40 12.9 6.23 12.1 9.13 10.3 7.70 7.47 11.8
62.4 60.7 45.9 51.2 41.2 40.8 57.0 47.7 41.4
4.7 30 4.6 120 110 54 4.8 13 30
5.3 35 1.8 2.7 89 1.1 0.32 3.0 1.7
Notes
1. In reporting summations of Total DDT and Total PCBs, when an individual analyte was reported as non-detected, a value of 1/2 the MDL was used.
2. In reporting summations of Total DDT and Total PCBs, when an individual analyte was reported as estimated, the estimated value was used.
9 of 10

Table 6 - Summary of Analytical Results - Confirmation SamplesRemedial Action at IR Site 25Former NAS Moffett FieldMoffett Field, California
Location
Sample Date
Sample ID
SBD - SED
Lead mg/kg
Zinc mg/kg
Total PCBs µg/kg
Total DDT µg/kg
Location
Sample Date
Sample ID
SBD - SED
Lead mg/kg
Zinc mg/kg
Total PCBs µg/kg
Total DDT µg/kg
Abbreviations
MDL - Method detection limit
mg/kg - Milligrams per kilogram
RG - Remediation Goals
SBD - Sample beginning depth
SED - Sample ending depth
µg/kg - Micrograms per kilogram
93.8
314
Units
210
109
Do-not-exceed RG
UnitsDo-not-
exceed RG
93.8
314
210
109
A10.49-CN01 A10.50-CN01 A10.51-CN01 A10.52-CN01 A10.53-CN01 A10.54-CN01 A10.55-CN01 A10.56-CN01 A10.57-CN01
Aug 28 2012 Aug 31 2012 Sep 12 2012 Sep 5 2012 Sep 5 2012 Sep 6 2012 Sep 6 2012 Sep 5 2012 Sep 5 2012
A10.49-CN01-0.5 A10.50-CN01-0.5 A10.51-CN01-1.0 A10.52-CN01-0.5 A10.53-CN01-1.0 A10.54-CN01-0.5 A10.55-CN01-1.0 A10.56-CN01-0.5 A10.57-CN01-0.5
0.5 - 0.6 0.5 - 0.6 1 - 1.1 0.5 - 0.6 1 - 1.1 0.5 - 0.6 1 - 1.1 0.5 - 0.6 0.5 - 0.6
8.92 6.86 9.55 7.84 14.3 7.89 7.70 7.97 9.73
59.8 37.9 65.4 42.5 77.9 55.5 53.0 54.9 39.8
8.9 61 85 14 4.5 4.6 4.6 11 6.4
1.5 1.3 3.7 0.74 4.7 0.63 0.63 1.4 0.32
A10.58-CN01 A10.59-CN01 A10.60-CN01 A10.61-CN01
Sep 6 2012 Sep 14 2012 Sep 7 2012 Sep 7 2012
A10.58-CN01-1.0 A10.59-CN01-1.0 A10.60-CN01-1.0 A10.61-CN01-1.0
1 - 1.1 1 - 1.1 1 - 1.1 1 - 1.1
10.8 10.9 13.1 6.91
44.0 50.4 46.4 49.9
4.5 92 6.3 4.5
0.70 4.1 1.7 0.41
Notes
1. In reporting summations of Total DDT and Total PCBs, when an individual analyte was reported as non-detected, a value of 1/2 the MDL was used.
2. In reporting summations of Total DDT and Total PCBs, when an individual analyte was reported as estimated, the estimated value was used.
10 of 10

Table 7 - Waste Disposal SummaryRemedial Action at IR Site 25Former NAS Moffett FieldMoffett Field, California
Type of WasteApproximate Quantity
Generated (tons)Number of Shipments Disposal Facility Address
Non-haz sediment 42,992 2,075 Altamont Landfill (Waste Management)
10840 Altamont Pass Road, Livermore, California 94550
Cal-haz sediment 2,401 102 Clean Harbors Environmental 2500 West Lokern Road, Buttonwillow, California 93206
TSCA sediment 79 4 US Ecology Idaho, Inc. Highway 78, Lemley Road, Grand View, Idaho 83624
AbbreviationsCal-haz - California hazardousNon-haz - Non-hazardousTSCA - Toxic Substances Control Act
Page 1 of 1
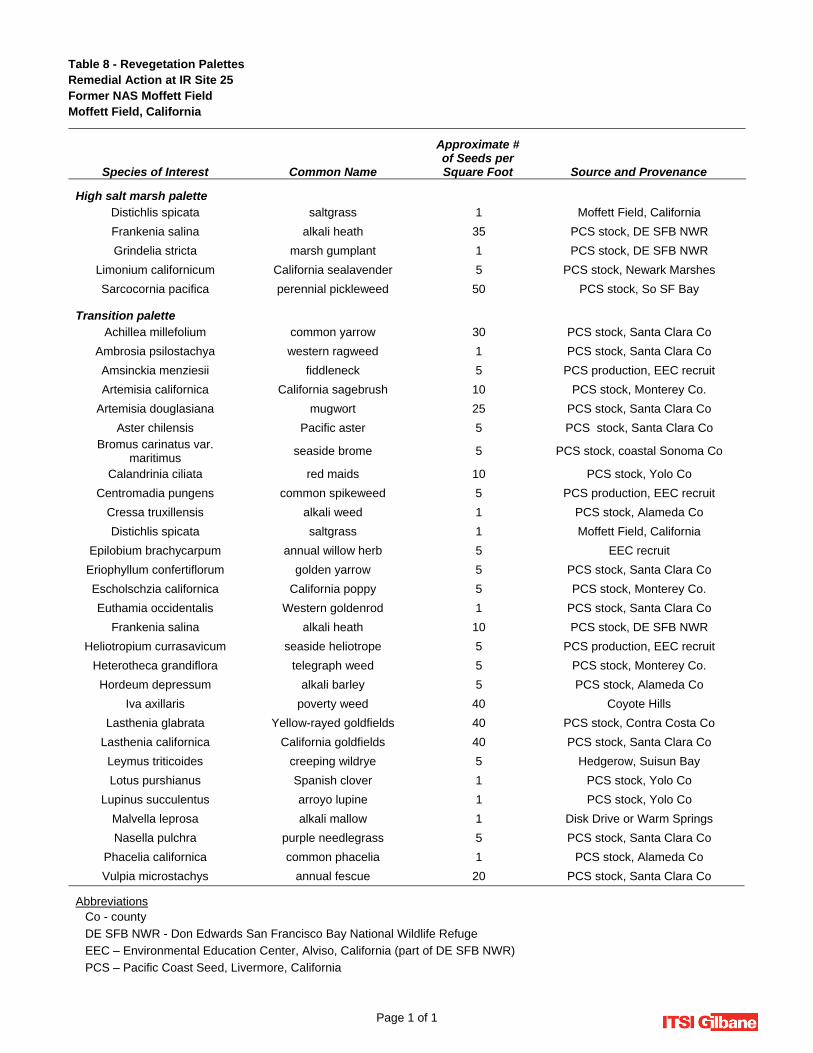
Page 1 of 1
Table 8 - Revegetation Palettes Remedial Action at IR Site 25 Former NAS Moffett Field Moffett Field, California
Species of Interest Common Name
Approximate # of Seeds per Square Foot Source and Provenance
High salt marsh palette Distichlis spicata saltgrass 1 Moffett Field, California
Frankenia salina alkali heath 35 PCS stock, DE SFB NWR
Grindelia stricta marsh gumplant 1 PCS stock, DE SFB NWR
Limonium californicum California sealavender 5 PCS stock, Newark Marshes
Sarcocornia pacifica perennial pickleweed 50 PCS stock, So SF Bay
Transition palette
Achillea millefolium common yarrow 30 PCS stock, Santa Clara Co
Ambrosia psilostachya western ragweed 1 PCS stock, Santa Clara Co
Amsinckia menziesii fiddleneck 5 PCS production, EEC recruit
Artemisia californica California sagebrush 10 PCS stock, Monterey Co.
Artemisia douglasiana mugwort 25 PCS stock, Santa Clara Co
Aster chilensis Pacific aster 5 PCS stock, Santa Clara Co Bromus carinatus var.
maritimus seaside brome 5 PCS stock, coastal Sonoma Co
Calandrinia ciliata red maids 10 PCS stock, Yolo Co
Centromadia pungens common spikeweed 5 PCS production, EEC recruit
Cressa truxillensis alkali weed 1 PCS stock, Alameda Co
Distichlis spicata saltgrass 1 Moffett Field, California
Epilobium brachycarpum annual willow herb 5 EEC recruit
Eriophyllum confertiflorum golden yarrow 5 PCS stock, Santa Clara Co
Escholschzia californica California poppy 5 PCS stock, Monterey Co.
Euthamia occidentalis Western goldenrod 1 PCS stock, Santa Clara Co
Frankenia salina alkali heath 10 PCS stock, DE SFB NWR
Heliotropium currasavicum seaside heliotrope 5 PCS production, EEC recruit
Heterotheca grandiflora telegraph weed 5 PCS stock, Monterey Co.
Hordeum depressum alkali barley 5 PCS stock, Alameda Co
Iva axillaris poverty weed 40 Coyote Hills
Lasthenia glabrata Yellow-rayed goldfields 40 PCS stock, Contra Costa Co
Lasthenia californica California goldfields 40 PCS stock, Santa Clara Co
Leymus triticoides creeping wildrye 5 Hedgerow, Suisun Bay
Lotus purshianus Spanish clover 1 PCS stock, Yolo Co
Lupinus succulentus arroyo lupine 1 PCS stock, Yolo Co
Malvella leprosa alkali mallow 1 Disk Drive or Warm Springs
Nasella pulchra purple needlegrass 5 PCS stock, Santa Clara Co
Phacelia californica common phacelia 1 PCS stock, Alameda Co
Vulpia microstachys annual fescue 20 PCS stock, Santa Clara Co
Abbreviations Co - county
DE SFB NWR - Don Edwards San Francisco Bay National Wildlife Refuge
EEC – Environmental Education Center, Alviso, California (part of DE SFB NWR)
PCS – Pacific Coast Seed, Livermore, California

Table 9 - Summary of Attainment of Remediation GoalsRemedial Action at IR Site 25Former NAS Moffett FieldMoffett Field, California
Lead Zinc Total DDT Total PCBs
Site-wide average RG 33 180 0.016 0.200
Calculated site-wide average concentration (post-RA) 26.6 97.6 0.015 0.038
Abbreviations
COECs - Chemicals of ecological concern
PCBs - Polychlorinated biphenyls
RA - Remedial ActionRG - Remediation Goal
Notes1. Total DDT is the summation of the p,p - isomers of DDD, DDE, and DDT.2. Total PCBs is the summation of Aroclors 1254, 1260, and 1268.3. RGs units are milligrams per kilogram (parts per million).4. Calculation of site-wide average concentrations is presented in Appendix M.
Parameter
COECs
Page 1 of 1

FIGURES
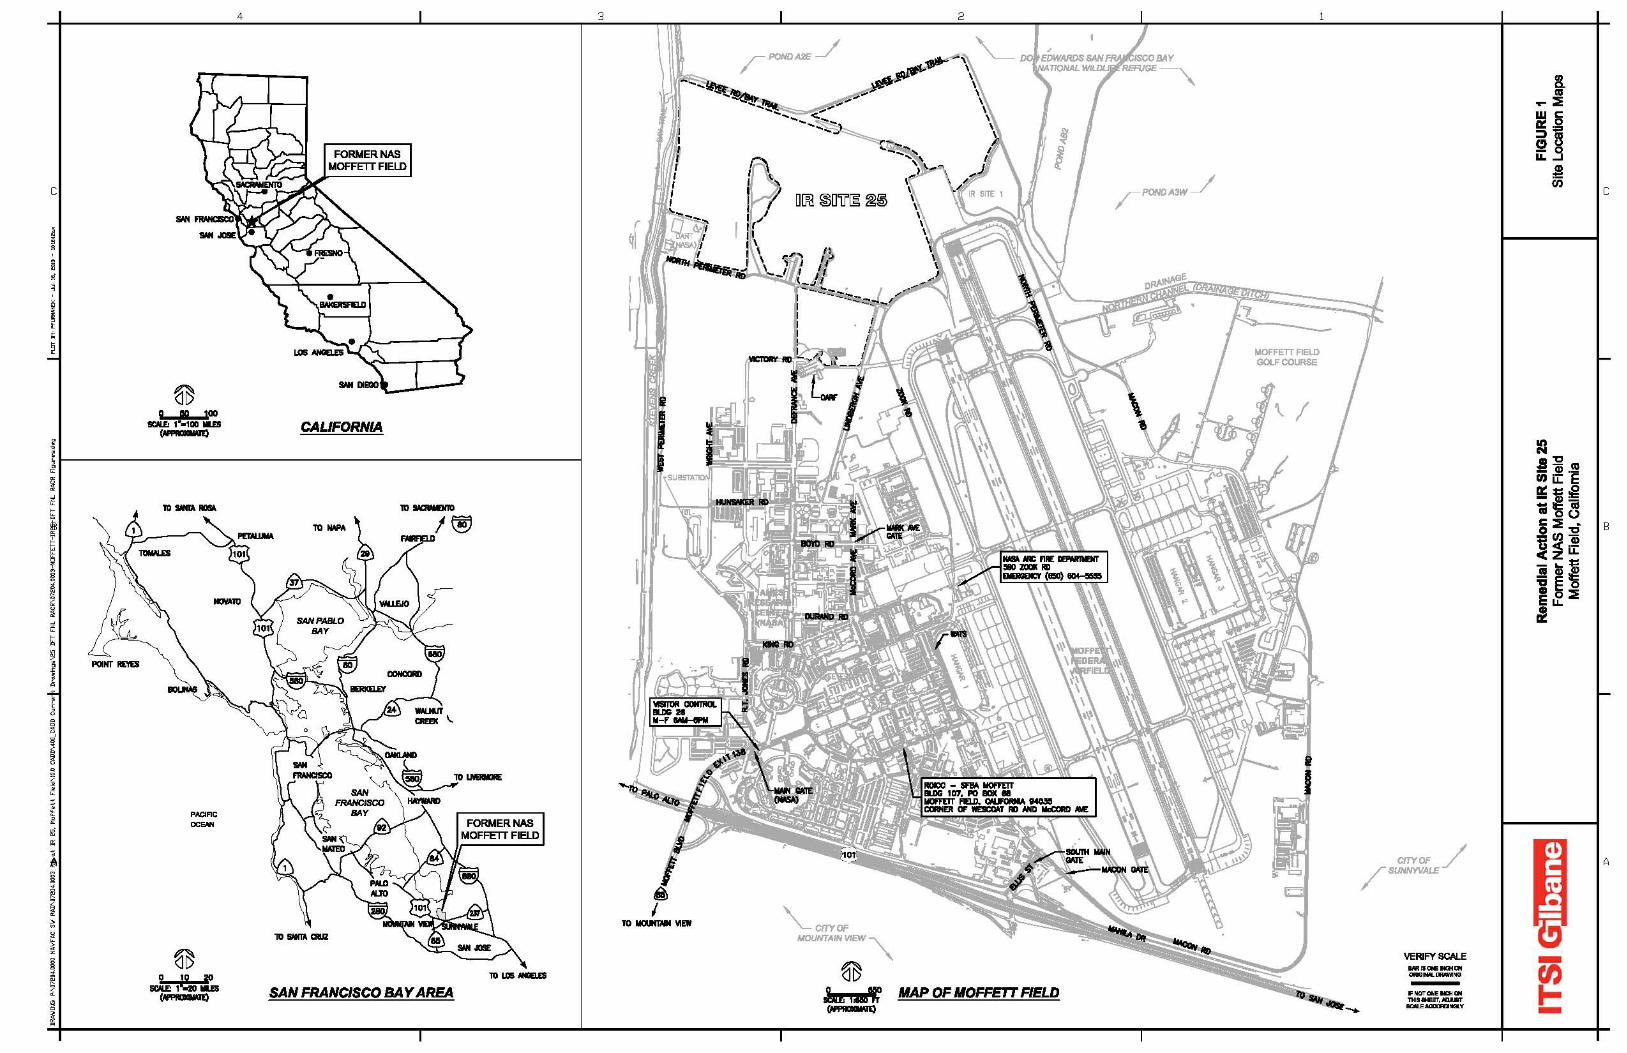
i ; ,
I , !
4
FORNERNAS MOFFETT FIELD
CALIFORNIA
!r-------------------------------------~ i
"''' """
, •
9 ~ 20 1CfII..I:11&D - SAN FRANCISCO BAY AREA
3
... "'--CrTYOF MOUNTAIN VIEW '"
$
2
_ ,A MAP OF MOFFETT FIELD -
MOFFETT FIELD GOLF COURSE
\ I
CJTYOF / /SUNNYVAlE
VERIFY SCALE
c
B
A
-~ -

n
'--WESTERN DIKED
MARSH~
'" LOCKED GoIITE
VERIFY SCALE _ ... IGlDN ---
ITSI G11.§!,14
NOTES
'-- ALViSOPONDA2E
(INUNDATED) ~
LEGEND
1. EIICIMJ\1II) .... 1M SHMJm. 8 III!. IIICfrITCIIIG 5TA1ION
Remedial Action at IR Site 25 Former NAB Moffett Field Moffett Field, california
PUT 11'\ ""u_ -.... ", .. -.... ,"'" n
IRSIlE 1 (FORMER LANDFILL)
FIGURE 2 IR Site 25 Site Plan
n
w

c
i ; ,
I , !
i
l
, • ~
I
4
\
3 2
---- ---- ---1- --- ---- ---1- --~- -~ --I
I Fig.1? _________ _
"
LEGEND
D """""" ,.,.
N
@ VERIFY SCALE IMI.""""",OII -..""""' ..
c
B
A
-~ -

~\l7el4
,"'OO
''''W
AC
s'W
F
WN
7,"
",IO
" ll
Io.t
'"
"", ""
".tt '
101<
1\10
,0
• ~ ! I I '<
0
, . qn
lip
s I i
~ .
qm ~
I
--------
-----
=
BIB
II-
©z~ B
0 B
B
B B
B
ITS
I G11
'tlit4
D
Or •
• _'Z
:l In
n •.
,>
<-RA
e, ""
","u
o.,
Rem
edia
l A
ctio
n a
t IR
Sit
e 2
5
Fonn
er N
AS
Mof
fett
Fiel
d M
offe
tt Fi
eld.
Cal
iforn
ia
ro
"'"
n,
"'''''''''
'fl< -
.... 10
, «
to -
""~_
('
~i
~a ~~
/M
®G
~ ! ;
I a
I"
~ g
~ .
I
2i !Ii o
FIG
UR
E 4
D
etai
led
Site
Pla
n (1
)
n
~
w
~

_~nh ~\l7e
l4,"''''
''''W
AC
S~
FW
N7
,"",
IO"
IlI>
.t '
" ""
, ""
".tt '
101<
1\10
,0
CI\
IJ"4
"_
C'"
" C
urr
-1'
Or •
• _'Z
:l In
n •
. ""
"""Z
04,O
Ol3
--H
Orr
ET
T-I
Rgl
Zt-
Jrr
,"-
RAe,
""","
uo
.,
, , , , , • ! , ~ ~ , . llh Iq liB
, , ~
I'
-"
, , , , , , ,
,
" , ~. (
/ .~
, ~~
/ ~'
, , , , , ,
, , , , , , ,
©z~ B
ITS
I G11
'tlit4
D
B B
B
0 B
H • 1-\
B B
B
Rem
edia
l A
ctio
n a
t IR
Sit
e 2
5
Fonn
er N
AS
Mof
fett
Fiel
d M
offe
tt Fi
eld.
Cal
iforn
ia
ro
"'"
n,
"'''''''''
'fl< -
.... 10
, «
to -
""~"'"
( 1~ ~~
/M
n ®~G
~ I !
~ ! ~
~ I
~ . .
I
2i !Ii o
FIG
UR
E 5
D
etai
led
Site
Pla
n (2
)
n
~
w
~

_~nh ~\l7e
l4,"''''
''''W
AC
S~
FW
N7
,"",
IO"
IlI>
.t '
" ""
, ""
".tt '
101<
1\10
,0 C
I\IJ"
4"_C
'"" C
urr"
'i' O
r •• _'Z
:l In
n •
. ""
""""
",O
Ol3
--H
01
'rE
TT
-IR
glZ
t-Jrr
,"-
RAe,
""",
"no.
,
• ! i ~ ~ . ' :;! iii
<
I
'IB ~
I p ~
q~ ~
I
BIB
I B
©z~ B
0 B
B
B B
.
ITS
I G11
'tlit4
D
i~
Rem
edia
l A
ctio
n a
t IR
Sit
e 2
5
Fonn
er N
AS
Mof
fett
Fiel
d M
offe
tt Fi
eld.
Cal
iforn
ia
ro
....
10
, «
to -
"' .
....
...
~(
1~1
d~
)~'
n
~
Ii ~I /'
/'/'~
®G
~ ! ;
I a
I"
~ g
~ .
I
2i !Ii o
FIG
UR
E 6
D
etai
led
Site
Pla
n (3
)
n
~
w
~

4 , , ,
IU D
j ,
! c ~
~ ,
! , ,
•
U i ; , ! , , , !
I I , !
, , ,
l
! [TI [TI [TI
, , [TI [TI , i oo:::J Di:J Di:J , • Di:J ~
I , , I , ~
..,." .. N
© ~~ ~ ~
Ql/f'HI: ICM.E II fE[f
VERIFY SCALE • ~ I
3
If
...... "'" --='------..' WHIJiIE: SKID _ -
""""""'
2
, '---", ,
, , i ~ , ,
. "" " ... ""'"
~ " LEGEND
P / d
®
S
"-' """ ElICofMIiTED '10 D.5 "
-:!. c
... .!!! wo. .. $ :::> --CI'" u::l! ~ " c
B
A
-~ -

4 3 2
-!!l. c
.. .!!! wo. .. $ :::> --CI'" u::l! ~ " c
! • i ; , ! , , , !
1 .. N ,!:Bcg
i ;; ~"E , g;~~ 'ti ~ c::!; • B o " 'il~:li cZ'" H~ 'liE::!;
, IF , !
o:::J o:::J o:::J
, CD II oJ o:::J , [io:::J [i'J [io:::J
[io:::J
, i
LEGEND
, ----- 11'1 SITE 211 IKJUNDM'I'
• P / d ~1tI 0"' FT A
I V'U"d DCoIfM1EI) TO 1.a FT
10'& ~1tI'" FT
, b<XX)Sj ............. ,
N
© I ® CONFlrtrM11ON aDIENT SIII'LE , -~ S (I) car IIIDtIft)MrjQ E.L
• VERIFY 8CALE
F..".,.. ..... ONTHI • .....-,AIWIT."... __ V ~ -

4
!~ , ,
I , !
\ "
\ "
\ "
i
I
. '\
\
\ o \
\ \ o
\ \ \ o
\ o
\ \ \ \ o
\ \ \ \ o \ \
\
\
\ \ o
\
3
/"""~~AREA/ \ o
\ \ \ \ o
\ \
\ o
\
\ \ o
\ \ \ \
\ \ \ \
"
2
IRSlTE1 / / (FORMER LANDFILL)
LEGEND
P / d PC'/)
R><'X>1
®
S
EXCiJMII1ED TO OJ! FT
ElICIMQED 10 1.0 IT
(E) .. IIIOMIOItMQ WELL
-e c
.. .!!! wo. .. $ :::> --CI'" --g IL_
~ " C
B
CD CD CD
[TI CD
[ii] Ci'J [ii]
[ii] A
"'"', ... N
© -_d ~ 190
~ --= SCII..EIN FEEr
VERIFY SCALE -

4
---- -----------------------------=-
c
i
--1--_
I
i
s --~ --I- Ss ---.rs
~ ! -...,,-,,----1
~ "'~-<-'-..., ... ~$
l ---..::: r ---.:: T
---":::T--"'::r
---
o I
I I
I I
I I , , ,
, , I I
I I
I I
I I
I I
I I
I I I I I
, , , , ,
I "",. \/~NDMI' , "----------
I I I
I
----- -------
3
-----------------------"'''''' G~ ~QJSUNE
-------=~
2
-------------- ,
I I I I I I I I I I I I I I I I I I I I I I , , , ,
I I I I I I I
i I I I I I I I I I I I I I I I
'--MIl 14
''"''',
, , , , , I I I I I I I I I I I I I I I I It SITE 25 \ / IIlUNIWtl' , , , , , ,
,
LEGEND
V / d ®
It !ITE 211 IIOUNIIMY
EXC#IINED TO OJ! IT
~
"
....... '""'-' --
"
........ -7 __
7 -'-G_____ T --7
' -----, -----, -N
© "- MI: tcN..E II 1m
VERIFY SCALE
! ..... ' 'f
I ,
-t:. " co.!!!
~a.
::!,!! :::>U)
!2a!
'"I
-~ -
c
B
A
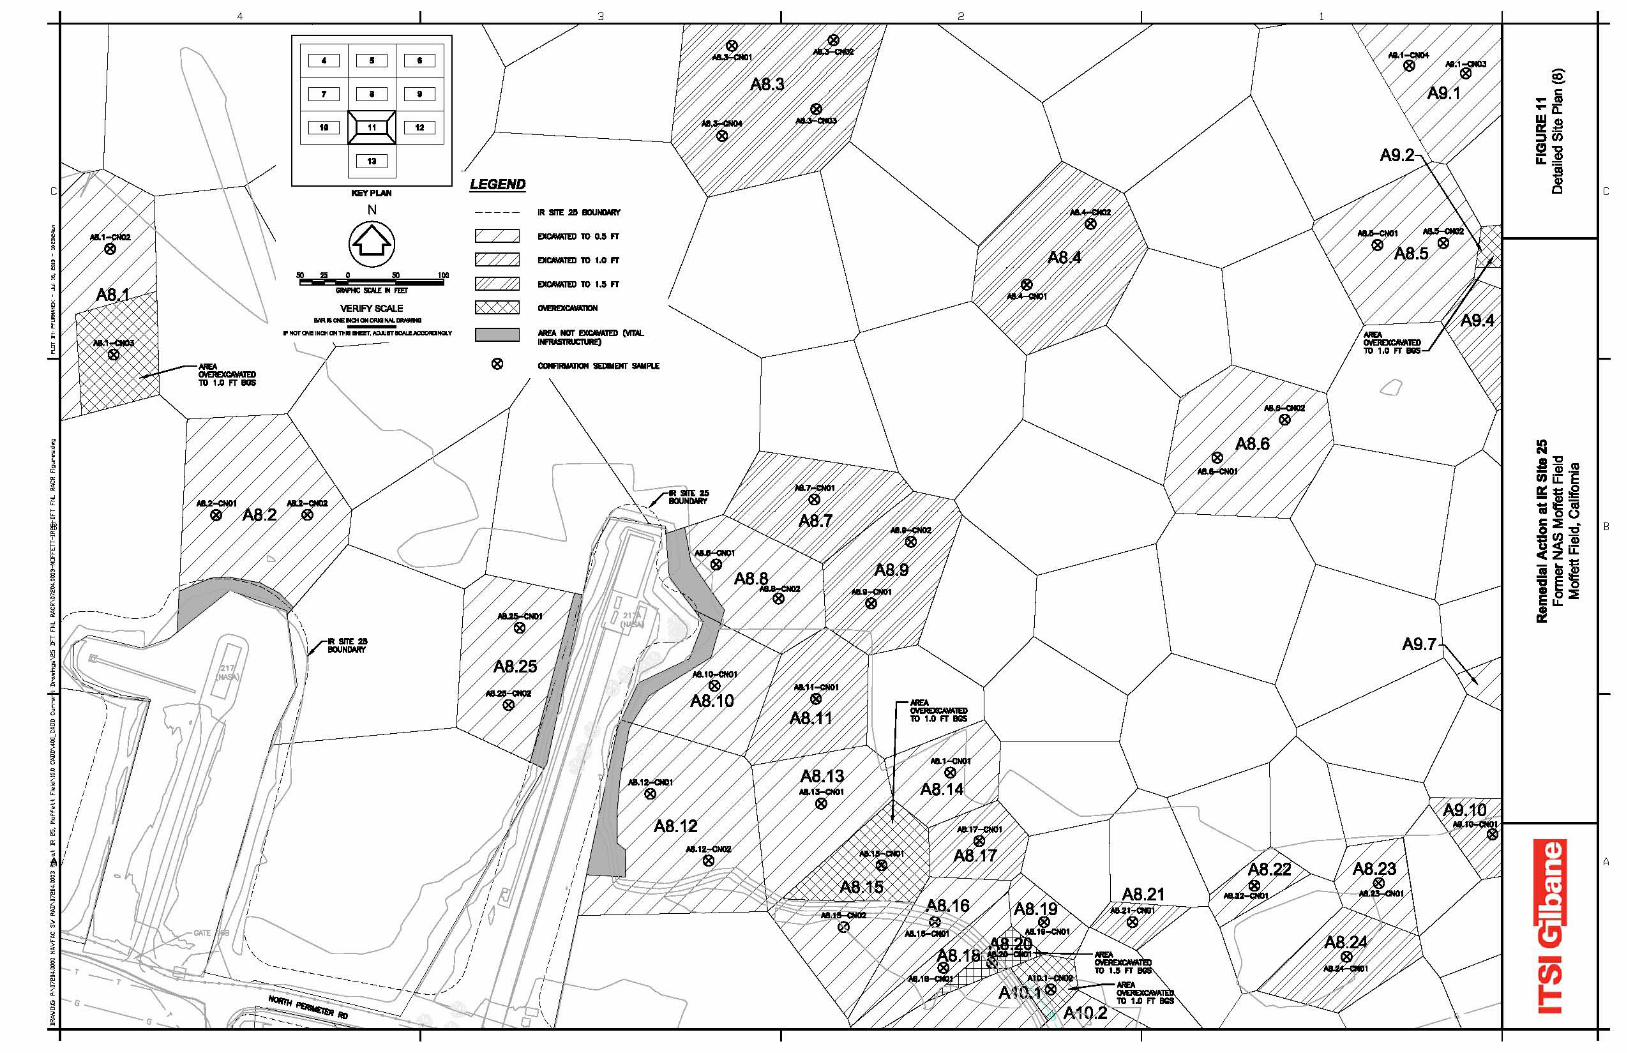
4 3 2
CD CD CD -e CD CD CD c -.. -0: Qo:::J " Qo:::J ::!~
:::>(1)
Qo:::J !2-g IL=
LEGEND ~ ..." ... " c
N 1111 SITE 211 IllUNIWtl'
i @ P / d DCIIIIKIUl 10 0.5 fT
i VV'/j ElICMTED '10 toO " ; ~ • • ~ ,.
WaJ , GIW'HC !II:IU III REI"
DCIIIIKIUl 10 1.5 fT
! VERIFY SCALE k<XX)Sj --, , , III/EA Mal' EXCIMI.1!D (\I1I'Al
! '-® 0CltI'I1IiMfIOfiI 1EDIIIBIT MrIIPLE
B
A
-~ -

c
i
-.. """"""'"' 10 UI FT IIiIS
-. 0' ••• ".,," 10 1.0 " IIGS
\ \ \ \ •
\ \ \ \ •
\ \ \ \ •
\
o
/ o
/
\ \ \ •
\ \ \ \ •
\ \ \ \
, , , , , , , P'(:I:E IlUIIED \
"" ' , , , , ,
3
I I I I
" I I I I
" I I I I
" /
I I
o
\ \
, , , , , , , , , , , ,
--, --, --,
c
.. N ,!:Bcg ;; ~"E
LEGEND g;~~ 11 .. c::!;U
B o .,; '" SfTE 211 IICt.HIM'I' 'il~:li
r / ;] rxt:IMJIIED TO Q.!I FT CZ"-
PC'/) EXC#IINiD TO 1.0 FT H~ 'liE::!;
k<>66<l EO
""""""'" .I!"-181 COHFIIIMlIDN SEDlIIIENI" SMI'I.E
S (E) "" fIIOIiITOMC WELL
[TI [TI [TI
CD [TI [TI
Di:J Di:J " Di:J
A .... ,"" N
© ,., ¥- 0 m lYO -eIW'tIC ICM.t: II fE[I"
~ VERIFY 8CW.E -

; ,
I , !
i
, •
I ~
I
I ~
I
I ~
I
I ~
I
I ~
I
I ~
I
~ I--__________ ~~O/ .. ,"'.,," I I--------------~
4 3
, , leA _____
G
S WNB-22
LEGEND I" lITE 15 IOUNIM'I'
P / d ElICoIMIiT!D '10 0.5 "
V // d ElICoIMIiT!D '10 1.0 "
txXXXJ ~
AID~I B"~H.56 "" ...... , A10.53 AID.!lI-CMD1 A 10.51 AID.IIO-CMDI A 10.50 ",.--, A10.48 "" ...... , A10.45
A10.43
1OJC2A
S
2
s --
c
A10,60 " • ....." " A10,59 " .... "" GIRA~)Sf<i A
..., .... N
@ '" U,,,", Alo.57-cND1
AIo.5&-OI01
-~ -

4
/
c
j i , ,
I , !
i
l
, i ,
I • o
..., .....
, , , ,
•
• . . ~ .-"'.1I..(~}
..:l - • ~ .. " '., ...,
3
-
2
"""' ........ """"'""" """"" .... 1r Nl snw:
......... --
c
B
UHE
N A
@
-~ - "

G:\Ar
cGIS
\Nav
y\PER
MAC\
Moffe
tt\PRO
JECT
S\Moff
ett_L
ayou
t_Rev
5.mxd
7
/30/20
13 [
15:06
PM]
E
ANDE
RSON
, ITSI
FIGURE 15Hydroseed Progress Through
December 2012Remedial Action at IR Site 25
Former NAS Moffett FieldMoffett Field, California
Legend
RA polygonTransition paletteHigh salt marsh paletteAreas to be seededAreas to be seeded by NASA
"!O500 0 500
Feet
Notes1. Areas remaining to be hydroseeded by the Navy will receive high salt marsh palette. All areas planned for transition palette have been seeded.2. Basemap aerial image from ESRI, 2013.

ATTACHMENT 1 RESPONSES TO COMMENTS ON DRAFT AND DRAFT FINAL RACR

RESPONSES TO REGULATORY COMMENTS
DRAFT REMEDIAL ACTION COMPLETION REPORT REMEDIAL ACTION AT IR SITE 25
FORMER NAS MOFFETT FIELD MOFFETT FIELD, CALIFORNIA
FEBRUARY 2013
Rev 01 1 of 6
No. Page Section Para- graph Comment Navy Response
Comments from Yvonne Fong, USEPA Region IX, dated 26 April 2013
Specific Comments 1 9 3.4 2 The second to last paragraph of this section describes a 4-inch-
diameter, galvanized steel pipeline and a catch basin that directs runoff to Building 191. Please show the locations of the steel pipeline and catch basin in a figure.
The locations of the steel pipeline and catch basin are indicated on new RACR Figure 14. (Hydroseed figure is now Figure 15).
2 10 3.5 2 This section identifies a monitoring well that was discovered during the grubbing process at polygons A10.36 and A10.38. Please indicate if the Navy plans to keep this well as part of its active monitoring program or if the well will be abandoned.
Well WNB-24 was previously thought to be abandoned. However, the field photograph and surveying results provided in the RACR clearly indicate that a historical error was made and that WNB-24 exists. There does not appear to be a cost benefit to including this well as part of “Black Thursday” gauging and/or annual groundwater monitoring for IR Site 28.
The Navy will make a note of this discrepancy and consider decommissioning this well when funding becomes available. Text has been edited to reflect this approach.
3 11 3.8 1 The first paragraph states that the boundaries of several polygons were adjusted slightly to avoid impacts to existing infrastructure at the site. Please provide additional information and/or a figure to explain which polygons were impacted and which boundaries were moved. Please show the original polygon boundary from the RD and the final polygon boundary.
The detailed site plan figures have been adjusted to show boundaries to comply with the comment. The text has been edited in the first paragraph of Section 3.8 to further explain the type of infrastructure, as follows.
Existing critical infrastructure including levees, roadways, and supporting embankments made up of gravelly materials did not conform to the conceptual site model of where contaminated sediment would be present. Therefore, the areal extents of excavations in several contaminated polygons were adjusted to leave intact the vital infrastructure. The detailed site plans (Figures 4-13) depict the portions of polygons where boundaries were adjusted.

RESPONSES TO REGULATORY COMMENTS
DRAFT REMEDIAL ACTION COMPLETION REPORT REMEDIAL ACTION AT IR SITE 25
FORMER NAS MOFFETT FIELD MOFFETT FIELD, CALIFORNIA
FEBRUARY 2013
Rev 01 2 of 6
No. Page Section Para- graph Comment Navy Response
4 11 3.8 4 The fourth paragraph of this section describes the discovery of a 12-inch hole in a corrugated steel pipe emanating from underneath Lindbergh Avenue. The RACR indicates that the hole was “plugged;” however, Figure 2 and Photograph No. 34 of Appendix B.2 state that the hole was “repaired.” Please clarify if the pipe was plugged and is no longer operational (no stormwater flow is conveyed) or repaired and remains a component of NASA’s stormwater management system.
The hole discovered in the pipe that runs underneath Lindbergh avenue was plugged and is no longer operational. The description in Figure 2 and the caption for Photograph No. 34 in Appendix B.2 have been changed from “repaired” to “plugged” and the text in Section 3.8 has been revised.
5 13 3.10 3 The second paragraph on the page states that “samples in some locations were collected at multiple 6-inch intervals in advance of the overexcavation so that the overexcavation interval could be bracketed.” The language in this sentence is not very clear. Please revise this sentence or provide an example to better explain the process.
Text has been revised to reflect the following approach: samples in several locations were collected at multiple 6-inch intervals consecutively so that a zone of sediment with samples having COEC concentrations lower than the upper-bound RGs might be found more rapidly (by avoiding multiple cycles of sample collection and laboratory analysis).
6 13 3.12 1 Backfill material was analyzed to ensure that COECs were below lower-bound RGs. The RACR indicates that “average” concentrations were below the lower-bound RGs. Please clarify whether averages were, in fact, calculated from multiple samples at each sample location, composite samples were analyzed or a single sample generated the reported (non-averaged) COEC concentrations for backfill samples.
COEC averages in backfill material were calculated from multiple samples from several sample locations in the Carmel Lofts development. The sentence in this paragraph has been revised as follows: “Average concentrations of COECs calculated using sample results from multiple locations within the Carmel Lofts development were below lower-bound RGs (see Appendix J)”.
7 15 3.15 2 The last bullet on the page notes the revision to the habitat restoration plan. Please include the date the revision was approved by the regulatory agencies.
Regulatory agencies concurred on revisions to the habitat restoration plan via e-mail dated 17 October 2012 between the Navy and EPA. Text has been added to indicate this.

RESPONSES TO REGULATORY COMMENTS
DRAFT REMEDIAL ACTION COMPLETION REPORT REMEDIAL ACTION AT IR SITE 25
FORMER NAS MOFFETT FIELD MOFFETT FIELD, CALIFORNIA
FEBRUARY 2013
Rev 01 3 of 6
No. Page Section Para- graph Comment Navy Response
8 17 4.0 2 The fourth bullet on this page states that results for each sample from polygons with multiple confirmations samples were applied to equal portions (areas) of the total polygon. It is not clear from the description whether the locations of all confirmation samples in these polygons were selected to be representative of the overall polygon or if any of the locations were biased, in which case, the individual samples within a particular polygon should also be weighted based on the area it represents. It is also unclear if this was the process used for calculating the concentrations of COECs in polygons which were subdivided because only a portion of the original polygon required overexcavation. Please revise the RACR to clarify how the calculations were performed for these situations.
To address this comment, the text has been revised as follows: “For polygons where more than one final confirmation sample was collected, the total area of the polygon was divided by the number of samples locations within it resulting in multiple equal areas within the polygon. Each area was assigned the concentration of the sample within it; this process was also used in polygons which were subdivided and excavated to different depths.”
9 18 5.0 3 The second and third bullets describe the ongoing activities related to habitat restoration during the recruitment and establishment phases of habitat restoration. Please provide calendar dates for these phases.
Inspection visits for the recruitment phases commenced on 20 December 2012 and were conducted through 27 March 2013.
Text has been edited to provide these dates and also the planned time periods for the inspections related to the establishment phase.
10 Tables 4 & 5
These tables provide information about the excavations at each polygon. Please revise the tables to note which polygons were overexcavated.
Tables 4 and 5 have been revised to show which polygons were overexcavated. These polygons have been highlighted and a note has been added stating that highlighted polygons were overexcavated to a depth greater than was planned in the remedial design.
11 Table 6
The table includes abbreviations for “UJ” and “R” which do not appear to be used in the table. Please clarify if any of the data are “estimated non-detect” or “rejected.”
“UJ” and “R” have been deleted from the abbreviations list.

RESPONSES TO REGULATORY COMMENTS
DRAFT REMEDIAL ACTION COMPLETION REPORT REMEDIAL ACTION AT IR SITE 25
FORMER NAS MOFFETT FIELD MOFFETT FIELD, CALIFORNIA
FEBRUARY 2013
Rev 01 4 of 6
No. Page Section Para- graph Comment Navy Response
12 Appendix L
RFI 3 This RFI describes the discovery of clay pigeon fragments at Polygons A4.1, A4.3, and A4.4 during pre-excavation clearing and grubbing, as well as subsequent analysis of PAHs. Please provide the analytical data and a figure showing the locations where clay pigeon fragments were encountered and/or samples taken. Also, clarify whether the samples were taken from the clay pigeons themselves or from sediment as it is unclear based on language in the RFI that states “ITSI proposes to characterize the debris.”
Markings on the clay pigeons (skeet) indicated the manufacturer, Eclipse. The manufacturer (now Reagent Chemical and Research, Inc., Ringoes, New Jersey), was contacted and stated that this particular type of skeet did not contain PAHs (e-mail dated 10 July 2012 from T. Skeuse of Reagent to D. Rich, ITSI Gilbane). No testing of the material was conducted. Text has been added to Section 3.7 to reflect this circumstance. A photo of the skeet (from July 2012) has been added to Appendix B.2, Project Photographs. Detailed site plan #4 (Figure 7) has been edited to show approximate locations where skeet was recovered.
Minor Comments 1 13 3.10 2 The last sentence of the first paragraph on the page states that
the overexcavation process was continued until “a ‘clean’ depth was reached.” Please revise the sentence to “contaminant concentrations were below the upper bound RG.”
This sentence has been revised to comply with comment.
2 15 3.15 2 Before the bulleted list in this section add the word “Significant” before “Changes from the RD/RAWP were.” This will differentiate these changes from the minor field changes described on Page 16.
The suggested revision has been made.
Comments from Tami Nakahara, CDFW, dated 30 April 2013
General Comments 1 - - - The report is missing some important documentation regarding
the incident involving the potential take of a juvenile salt marsh harvest mouse (SMHM); change in avoidance measures due to SMHM incident; documentation of occurrence of California Black Rail during surveys, observation of State special status
Section 3.6 has been edited to add bulleted items describing the special status species encountered during the project. Please note that there were zero positive identifications of SMHM during the project. The text has been edited to reflect that fact.
The text has been edited to reflect the surveys conducted in 2012

RESPONSES TO REGULATORY COMMENTS
DRAFT REMEDIAL ACTION COMPLETION REPORT REMEDIAL ACTION AT IR SITE 25
FORMER NAS MOFFETT FIELD MOFFETT FIELD, CALIFORNIA
FEBRUARY 2013
Rev 01 5 of 6
No. Page Section Para- graph Comment Navy Response
species during remedial activities (i.e., White-tailed Kite, Golden Eagle, potential SMHM, Northern Harrier), and changes to the salt marsh restoration plan and monitoring schedule due to flooding (i.e., monitoring for less than 2 years).
for California Black Rails and California Clapper Rails. A copy of the report of the bird surveys has been included as Appendix E.1. Black Rails were heard on two occasions in the Eastern Diked Marsh. No Clapper Rails were heard or seen.
Please see Section 3.14 for a description of changes in the restoration plan and schedule due to flooding.
Comments from Elizabeth Wells, San Francisco Bay Regional Water Quality Control Board, dated 30 April 2013
Specific Comments 1 3 1.1 5 Show NASA Area of Investigation (AOI) 6 on a figure. Clarify if
AOI 6 is solely the culvert leading from Lindberg ditch to the storm water retention pond or Lindberg ditch itself.
NASA AOI 6 is the Lindbergh Avenue ditch, as specified in Figure 2. To clarify this in the text, the second sentence of the last complete paragraph on Page 3 has been revised to read: “The ditch, designated as Area of Investigation (AOI) 6, was remediated by NASA in 2000.”
2 9 3.4 2 & 3 a. Show the location of water diversion equipment and discharge points on a figure.
b. Describe the sampling method for collecting the water samples from the storm water settling basin. Discuss the analytical results and the source of the contaminants detected in the samples. Volatile organic chemicals, including trichloroethene and cis-1,2-dicloroethene, were detected in all of the water samples collected.
a. The location of water diversion equipment and discharge points are indicated on newly added Figure 14.
b. The sampling method and chemical detections are now described in a new 3rd paragraph of Section 3.4 with the following text: “The NASA Construction Permit required three rounds of sampling and analysis of water in the SWSB during the water diversion operation. Grab samples of SWSB surface water were collected in laboratory-approved containers from approximately 6 inches below water surface and sent to a laboratory for analysis of metals, PCBs, SVOCs, total oil and grease, TPH, and VOCs. Appendix D.1 presents the laboratory results for the three rounds of samples collected during RA activities. Detections of cis-1,2-dichloroethene and trichloroethene were reported (see summary table in Appendix D.1). Detections of motor oil,

RESPONSES TO REGULATORY COMMENTS
DRAFT REMEDIAL ACTION COMPLETION REPORT REMEDIAL ACTION AT IR SITE 25
FORMER NAS MOFFETT FIELD MOFFETT FIELD, CALIFORNIA
FEBRUARY 2013
Rev 01 6 of 6
No. Page Section Para- graph Comment Navy Response
antimony, and thallium were estimated and not consistently found in all three samples. It should be noted that the SWSB collects water from nearly the entire west-side drainage area of Moffett Field. WATS effluent has been in compliance with the National Pollutant Discharge Elimination System permit for all constituents throughout (and beyond) the water diversion effort.”
A summary table of detections in SWSB water samples has been added to Appendix D.1.
12 3.9 1 Show the locations of the downwind air monitoring points on a figure.
Air monitoring locations have been added to Figure 2. A reference to Figure 2 has been added to the text in Section 3.9.
4 18 5.0 3 Include a statement regarding the Navy’s contingency for additional action and monitoring should the restoration progress be insufficient at the at the two-year monitoring point.
The following statement has been added to Section 5.0:
If restoration of vegetation is not showing signs of satisfactory progress throughout this phase of monitoring, the Navy will consider options to bolster the revegetation effort; these options include additional hydroseeding, plantings, irrigation, and monitoring.
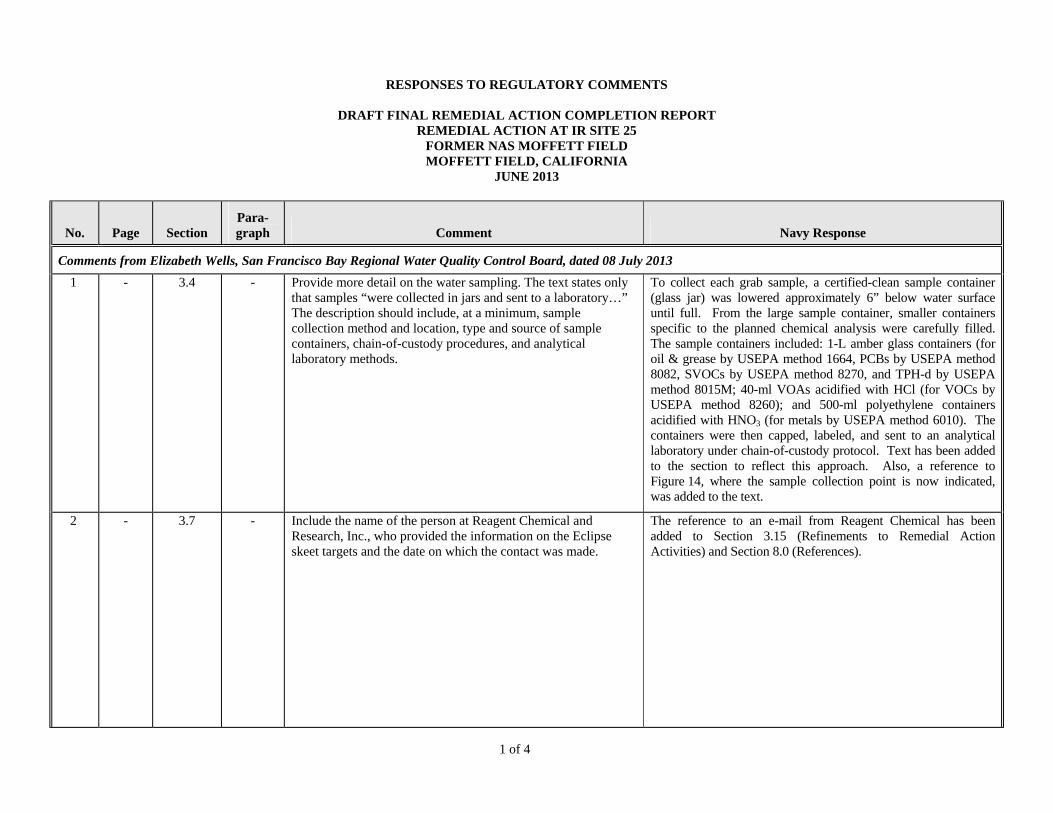
RESPONSES TO REGULATORY COMMENTS
DRAFT FINAL REMEDIAL ACTION COMPLETION REPORT REMEDIAL ACTION AT IR SITE 25
FORMER NAS MOFFETT FIELD MOFFETT FIELD, CALIFORNIA
JUNE 2013
1 of 4
No. Page Section Para- graph Comment Navy Response
Comments from Elizabeth Wells, San Francisco Bay Regional Water Quality Control Board, dated 08 July 2013 1 - 3.4 - Provide more detail on the water sampling. The text states only
that samples “were collected in jars and sent to a laboratory…” The description should include, at a minimum, sample collection method and location, type and source of sample containers, chain-of-custody procedures, and analytical laboratory methods.
To collect each grab sample, a certified-clean sample container (glass jar) was lowered approximately 6” below water surface until full. From the large sample container, smaller containers specific to the planned chemical analysis were carefully filled. The sample containers included: 1-L amber glass containers (for oil & grease by USEPA method 1664, PCBs by USEPA method 8082, SVOCs by USEPA method 8270, and TPH-d by USEPA method 8015M; 40-ml VOAs acidified with HCl (for VOCs by USEPA method 8260); and 500-ml polyethylene containers acidified with HNO3 (for metals by USEPA method 6010). The containers were then capped, labeled, and sent to an analytical laboratory under chain-of-custody protocol. Text has been added to the section to reflect this approach. Also, a reference to Figure 14, where the sample collection point is now indicated, was added to the text.
2 - 3.7 - Include the name of the person at Reagent Chemical and Research, Inc., who provided the information on the Eclipse skeet targets and the date on which the contact was made.
The reference to an e-mail from Reagent Chemical has been added to Section 3.15 (Refinements to Remedial Action Activities) and Section 8.0 (References).

RESPONSES TO REGULATORY COMMENTS
DRAFT FINAL REMEDIAL ACTION COMPLETION REPORT REMEDIAL ACTION AT IR SITE 25
FORMER NAS MOFFETT FIELD MOFFETT FIELD, CALIFORNIA
JUNE 2013
2 of 4
No. Page Section Para- graph Comment Navy Response
Comments from Tami Nakahara, CDFW, dated 08 July 2013 1 - - - CDFW-OSPR commented that the report is missing some
important documentation regarding the incident involving the potential take of a juvenile salt marsh harvest mouse (SMHM), change in avoidance measures due to SMHM incident, documentation of occurrence of California Black Rail during surveys, observation of State special status species during remedial activities (i.e., Whitetailed Kite, Golden Eagle, potential SMHM, Northern Harrier), and changes to the salt marsh restoration plan and monitoring schedule due to flooding (i.e., monitoring for less than 2 years).
The Navy provided the following responses:
"Section 3.6 has been edited to add bulleted items describing the special status species encountered during the project. Please note that there were zero positive identifications of SMHM during the project. The text has been edited to reflect that fact."
"Also, no California Black Rails were encountered during the survey (California Clapper Rails were heard, however)."
"See the 4th paragraph of Section 3. 14 for a description of changes in the restoration plan and schedule due to flooding."
a. The Navy responded that there were zero positive identifications of SMHM during the project. However, the text on page 11 states, "No SMHM were encountered during this project." This statement is not
a. The text has been edited to state that no SMHMs were positively identified during the RA field activities. The biologist report for the period of 02 – 06 July 2012 indicates that the found dead mouse was “decomposing”. The sentence regarding the

RESPONSES TO REGULATORY COMMENTS
DRAFT FINAL REMEDIAL ACTION COMPLETION REPORT REMEDIAL ACTION AT IR SITE 25
FORMER NAS MOFFETT FIELD MOFFETT FIELD, CALIFORNIA
JUNE 2013
3 of 4
No. Page Section Para- graph Comment Navy Response
accurate. Although no SMHM were positively identified during the project, this does not mean no SMHM were encountered during the project. Several of the Site 25 Weekly Status Reports for biological monitoring document an unidentified Harvest Mouse or unidentified mice exiting the construction area (e.g., weeks of July 2-6, July 9-13, July 16-20, August 6-10,2012). These unidentified mice could potentially have been SMHM even though the biologist was unable to positively identify them. Please revise the text accordingly to reflect this uncertainty.
In addition, the text states, "One decomposed dead juvenile mouse (too young to be unidentified) was found in pickleweed while 'flushing' the area prior to vegetation removal. As a result of this incident, the flushing technique (i.e., walking a directed line of personnel for clearing an area of mice prior to vegetation removal) was abandoned." The information regarding the dead mouse is incorrect. According to an email from Bryce Bartelma dated June 20, 2012, the biologist who observed the mouse thought the mouse had died relatively recently and the deceased mouse was not dried out or decomposing (Bartelma, 2012). For this reason, there was concern that the mouse may have been trampled during the flushing process. As a result, a decision was made by CDFW-OSPR, the U.S. Fish and Wildlife Service, and the Navy to discontinue the flushing technique to avoid the potential to trample more mice. Please revise the text accordingly.
b. The Navy stated no California Black Rails were
juvenile mouse has been edited as shown below.
One dead, decomposing juvenile mouse (too young for species identification) was found in pickleweed while 'flushing' the area prior to vegetation removal. As a result of this incident, the flushing technique (i.e., walking a directed line of personnel for clearing an area of mice prior to vegetation removal) was abandoned. Instead, to avoid harming mice, a biologist was assigned to closely and continually observe the workers performing clearing and grubbing.
b. The text has been revised to reflect the findings of rail
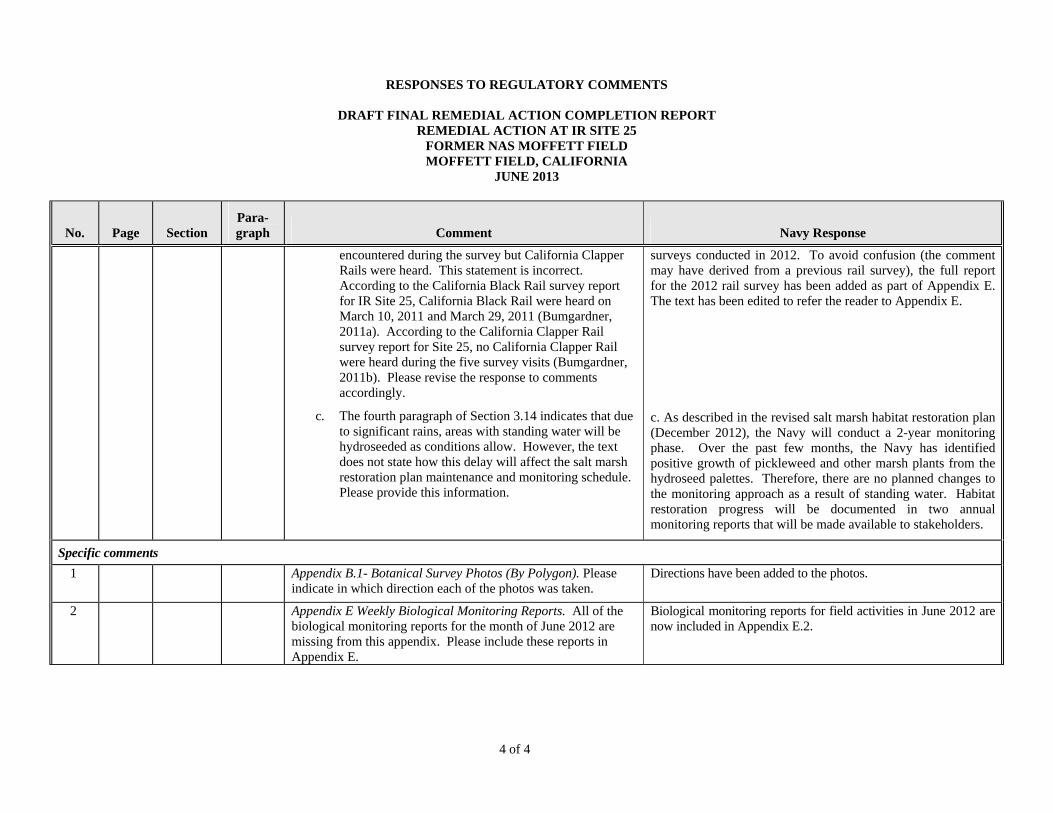
RESPONSES TO REGULATORY COMMENTS
DRAFT FINAL REMEDIAL ACTION COMPLETION REPORT REMEDIAL ACTION AT IR SITE 25
FORMER NAS MOFFETT FIELD MOFFETT FIELD, CALIFORNIA
JUNE 2013
4 of 4
No. Page Section Para- graph Comment Navy Response
encountered during the survey but California Clapper Rails were heard. This statement is incorrect. According to the California Black Rail survey report for IR Site 25, California Black Rail were heard on March 10, 2011 and March 29, 2011 (Bumgardner, 2011a). According to the California Clapper Rail survey report for Site 25, no California Clapper Rail were heard during the five survey visits (Bumgardner, 2011b). Please revise the response to comments accordingly.
c. The fourth paragraph of Section 3.14 indicates that due to significant rains, areas with standing water will be hydroseeded as conditions allow. However, the text does not state how this delay will affect the salt marsh restoration plan maintenance and monitoring schedule. Please provide this information.
surveys conducted in 2012. To avoid confusion (the comment may have derived from a previous rail survey), the full report for the 2012 rail survey has been added as part of Appendix E. The text has been edited to refer the reader to Appendix E.
c. As described in the revised salt marsh habitat restoration plan (December 2012), the Navy will conduct a 2-year monitoring phase. Over the past few months, the Navy has identified positive growth of pickleweed and other marsh plants from the hydroseed palettes. Therefore, there are no planned changes to the monitoring approach as a result of standing water. Habitat restoration progress will be documented in two annual monitoring reports that will be made available to stakeholders.
Specific comments 1 Appendix B.1- Botanical Survey Photos (By Polygon). Please
indicate in which direction each of the photos was taken. Directions have been added to the photos.
2 Appendix E Weekly Biological Monitoring Reports. All of the biological monitoring reports for the month of June 2012 are missing from this appendix. Please include these reports in Appendix E.
Biological monitoring reports for field activities in June 2012 are now included in Appendix E.2.