Final Project Report October 2012 - Alliance for Water … · Project Team Project Executive Mary...
28
November 2012 Final Report Assessing the Economic & Environmental Benefits of Industrial Water Use Efficiency Within the Great Lakes Region
Transcript of Final Project Report October 2012 - Alliance for Water … · Project Team Project Executive Mary...

November 2012 Final Report
Assessing the Economic & Environmental Benefits of Industrial Water Use Efficiency
Within the Great Lakes Region
Project Team Project Executive Mary Ann Dickinson Alliance for Water Efficiency
Project Manager Thomas Pape Best Management Partners
Project Engineer Bill Hoffman H.W. (Bill) Hoffman and Associates
Communications Manager Kenneth Mirvis The Writing Company
Environmental Assessment Jeff Edstrom Environmental Consulting & Technology Jodi McCarthy Environmental Consulting & Technology
Financing Consultant Townsend Albright Walloon Financial Advisors
Research Management Bill Christiansen Alliance for Water Efficiency
Project Administration Jeffrey Hughes Alliance for Water Efficiency
Finance Administration Molly Garcia Alliance for Water Efficiency
Advisory Committee Lynn Broaddus Johnson Foundation at Wingspread Claus Dunkelberg Milwaukee Water Council Ed Glatfelter Alliance for the Great Lakes J.B. Hoyt Whirlpool Corporation George Kuper Council of Great Lakes Industries Tim Loftus Chicago Metropolitan Agency for Planning Jeffrey Ripp Wisconsin Public Service Commission Karen Sands Milwaukee Metropolitan Sewerage District
AcknowledgementsThe Alliance for Water Efficiency wishes to extend appreciation to a number of individuals whose work and contributions made this project possible.
Most importantly, we would like to thank Dave Rankin and Shannon Donley of the Great Lakes Protection Fund for funding this project and offering valuable guidance, direction, and oversight throughout the process. Likewise, our Advisory Committee provided endless guidance, reviews, and contact information. Managers and technical staff from industries we surveyed were all gracious and generous with their time and knowledge. Lastly, we would like to thank Tom Chesnutt, Ph.D. from A&N Technical Services, Inc. for assistance in developing the utility survey.

CONTENTS OF REPORT Overview and Summary ......................................................................................................................................... 2
Methodology ............................................................................................................................................................. 3
Primary Water Uses and Conservation Opportunities ................................................................................. 4 ‐ Plastics Compounder .............................................................................................................................................. 4
‐ Manufacturer .......................................................................................................................................................... 6
‐ Metal Plater ............................................................................................................................................................ 8
‐ Leather Tannery .................................................................................................................................................... 10
‐ Beer Brewery ........................................................................................................................................................ 12
Environmental Impacts of Saved Water ......................................................................................................... 13 ‐ Water Sources and Receiving Waters ................................................................................................................... 13
‐ Impacts Identified Among the Five Representative Industries ............................................................................. 14
‐ Receiving Waters .................................................................................................................................................. 15
‐ Storm Water Management ................................................................................................................................... 15
‐ Scaled Environmental Impacts Across the Watershed ......................................................................................... 15
Impacts on Water Utilities as a Result of Increased Industrial Water Conservation ......................... 18 ‐ Utility Revenue Loss .............................................................................................................................................. 18
‐ Summary Utility Interviews ................................................................................................................................... 18
‐ Survey Results: The Impacts of Industrial Water Conservation on Regional Water Utilities ............................... 20
Funding Mechanism to Support Industrial Water Conservation ............................................................. 21 ‐ Findings of the Survey ........................................................................................................................................... 21
‐ Funding Details ..................................................................................................................................................... 22
Conclusions and Recommendations ................................................................................................................ 24
Appendix 1: Cumulative Water Savings Over a 20‐Year Life ................................................................... 25
Appendix 2: Marketing Flyer ............................................................................................................................. 26
Alliance for Water Efficiency October 2012
-2-
OVERVIEW AND SUMMARY
The Alliance for Water Efficiency, with funding from the Great Lakes Protection Fund, assessed five representative
industries within the Great Lakes watershed that use treated drinking water and municipal wastewater disposal for
the full range of their process, HVAC, and domestic water needs. Specifically excluded was the consideration of
industries that withdraw their water directly through a groundwater well, or from Great Lakes surface water, as
those industries were the subject of another study funded by the Great Lakes Protection Fund. The assessments
that the Alliance for Water Efficiency conducted focused on three factors:
1) Potential water conservation opportunities;
2) The environmental benefits of undertaking those conservation opportunities; and
3) A strategy for providing funding assistance to industries if funding proved to be a significant obstacle to
implementation.
The effort found significant opportunities for water savings in each of the industrial sites assessed. In these five
sites alone, 66 million gallons per year could be saved, most of which would also reduce wastewater flows in a
roughly equal amount. The payback time for these improvements ranged from 0.2 years to 5.8 years, averaging
1.2 years. The average annual return on investment across the full project was 84%.
While the effects of the saved water from these five audits on levels of the Great Lakes themselves would be
insignificant, the regional environmental benefits of these water savings proved to be meaningful. The benefits
include improved stream flows and aquifer levels, healthier aquatic ecosystems, and air quality improvements
through reduced energy requirements for pumping.
To ascertain the impacts of large-scale conservation efforts on the affected water utilities and to ascertain the
value of funding for implementing conservation projects, this effort included two surveys: one for utilities, and
one for businesses. The results of both surveys show wide variability, indicating that some utilities believe they
may be harmed by significant declines in demand, while others believe they will benefit. Some businesses will only
implement conservation measures if external funding is available, while others need not rely on external funding
to conduct the improvements.
Throughout this project, the team remained mindful of the small sample size: one sample each from five different
industries within an area as vast and economically diverse as the Great Lakes basin is not a large sample.
Furthermore, the project was restricted to only considering industries that took public water supplies.
Nevertheless, the team undertook an effort to understand the findings in the context of the entire Great Lakes
watershed by scaling up the information. While the team carries no illusion that these projections are precise,
they do provide a meaningful sense of the immense potential water savings and the accompanying environmental
benefits. Even if the level of accuracy is only within one order of magnitude, these findings are eye opening,
demonstrating the need for implementation, additional support, and additional research.
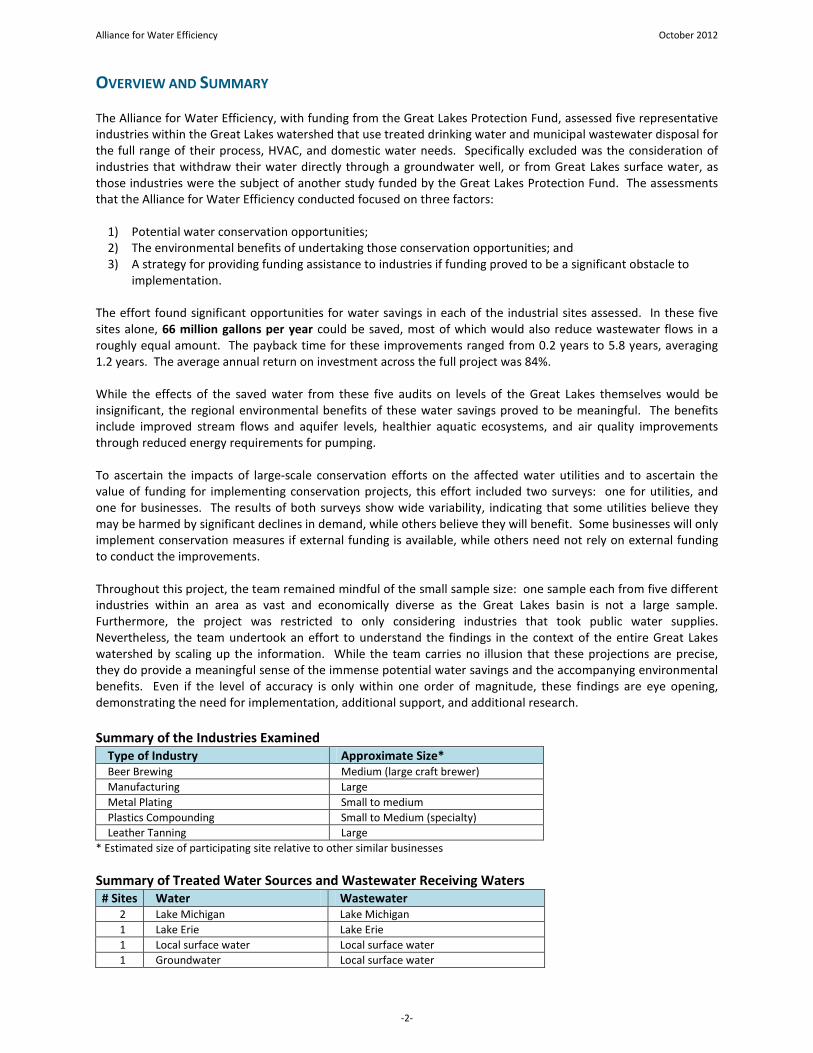
Summary of the Industries Examined
Type of Industry Approximate Size*
Beer Brewing Medium (large craft brewer)
Manufacturing Large
Metal Plating Small to medium
Plastics Compounding Small to Medium (specialty)
Leather Tanning Large
* Estimated size of participating site relative to other similar businesses
Summary of Treated Water Sources and Wastewater Receiving Waters
# Sites Water Wastewater
2 Lake Michigan Lake Michigan
1 Lake Erie Lake Erie
1 Local surface water Local surface water
1 Groundwater Local surface water

Alliance for Water Efficiency October 2012
-3-
METHODOLOGY
This project began with the explicit goal of identifying five diverse representative industries within the Great Lakes
watershed that did not directly withdraw or discharge water used by the site, instead using only treated drinking
water and discharging to a wastewater treatment service provider. (Industries drawing directly from groundwater
or from surface water supplies were the subject of another study funded by the Great Lakes Protection Fund.)
With help from local and state governments and water and wastewater utilities, we secured lists of several
hundred industries meeting our criteria. The team narrowed those lists by focusing on geographical, industrial,
and water source diversity. With a brief program description and page of explanation (Appendix 2), the team
scheduled and conducted site visits and selected the five representative industrial sites: a large leather tannery
and a medium-sized metal plater that both use public supplier water drawn from and released to Lake Michigan, a
plastics compounder that uses public supplier water drawn from and released to Lake Erie, a brewery that obtains
water from a public water supplier that draws it from a shallow aquifer and releases it to a river, and a large
manufacturer that uses public water supplier water drawn from and released to surface streams.
Following the selection of industrial partners, the project engineer and project manager conducted in-depth
assessments of each site and prepared comprehensive reports, which were provided to the facility managers at
each of the five surveyed sites. These reports detailed the industries’ water use and water conservation
opportunities. The team also made recommendations regarding which measures would be the most cost
effective.
Since much of the information contained in these reports was proprietary, the surveyed industries agreed to
participate under the condition of anonymity. As a result, this report addresses the site descriptions generically
rather than by company name and precise location within the watershed.
While this effort met all of these goals, the limited sample size did not allow for examinations of the full range of
potential industrial sectors. The industries toured but not selected included other major manufacturing facilities,
commercial linen services, and concrete processing. Each of the industries not selected for assessments would
probably have revealed additional water savings opportunities and would have increased the overall impact of the
effort and improved the accuracy of the projections.
Likewise, food processing and pharmaceuticals are not represented in the mix, though both are large industry
sectors. The one pharmaceutical industry contacted was preparing to move its operation from the watershed, and
before another could be located, the time schedule forced the team to complete its selection of partners. Food
processing is closely related to leather tanning (meat processing) and beer brewing (beverage manufacturing) with
one significant exception: the food processors contacted were so concerned about regulatory sanitation
requirements that they were reluctant to investigate any strategy that might be perceived to compromise food
safety, even if it conserved significant amounts of water.
As a matter of note, this report uses simple payback and simple return on investment (ROI) as a comparative
metric. Simple payback is the length of time required for a conservation measure to pay for itself out of savings at
today’s water rates. Simple return on investment is one divided by the years of payback (1/payback). It provides a
rough indicator of the value of the conservation investment compared to other potential business investments.
The financial impacts of net present value and rate escalation were deemed unnecessary for the type of
preliminary forecasts needed for this project.

Alliance for Water Efficiency October 2012
-4-
PRIMARY WATER USES AND CONSERVATION OPPORTUNITIES OF PARTICIPATING SITES
Plastics Compounder
The assessed plastics compounder receives treated public supply water drawn from Lake Erie, and the wastewater
treatment provider releases effluent back to Lake Erie. The business has three primary water uses: 1) process flow
and cooling; 2) cooling towers; and 3) domestic sanitation.
Process Flow (transporting plastic pellets) and Cooling
Use: A “surge tank water feed” uses two 300-gallon tanks that hold water for cooling
warm plastic and for transporting plastic pellets through the production process.
Approximately 200 – 1,000 gallons per day drain from the water chamber and piping.
Operator practice has been to refill the surge tanks while the surge water is in the
extruder and transport lines. When the extrusion operation is complete, the water
gets sent back to the already-full surge tank, causing the water to overflow into the
sanitary sewer. In addition, the tanks are dumped once or twice each month to
prevent stagnation.
Surge Tank

Alliance for Water Efficiency October 2012
-5-
Conservation Flow restrictors on each of the surge tank fill lines could reduce flow from 2.34
Opportunities: gallons per minute to 0.5 gallons per minute, and the process could be metered to
identify additional potential savings. This improvement could reduce water use by
78%.
Annual Water
Savings (Gals)
Cost of
Measure
$ Savings per
year
Payback in
Years
Annual
ROI
1,934,500 $2,500 $16,250 0.2 666.7%
Cooling Towers
Use: When assessed, the plant used approximately 2,170 gallons per day (800,000 gallons
per year) operating at 2.5 to 3.0 cycles of concentration.
Conservation Changing the cycles of concentration in the cooling towers from 2.5 – 3.0 to 3.5 – 4.0
Opportunities: would decrease cooling tower water use by about 11%. This change would require
assistance from a cooling tower chemical service provider, but it would result in
minimal or no adjustment to the current water treatment regimen.
Annual Water
Savings (Gals)
Cost of
Measure
$ Savings per
year
Payback in
Years
Annual
ROI
87,166 $500 $732 0.7 153.8%
Sanitation
Use: 39 employees use about 815 gallons per day (300,000 gallons per year).
Conservation Retrofitting fixtures with WaterSense fixtures would reduce sanitary water uses by
Opportunities: about 40%.
Annual Water
Savings (Gals)
Cost of
Measure
$ Savings per
year
Payback in
Years
Annual
ROI
125,560 $2,250 $1,055 2.1 47.6%
Total
Total Possible
Savings
Cost of
Measures
$ Savings per
year
Payback in
Years
Annual
ROI
2,147,226 $5,250 $18,037 0.29 344.8%
Work Completed: As of this writing, the company has developed plans for replacing flow restrictors,
and the work will be completed within the year. Toilets and sanitary fixtures are
being replaced gradually as part of a normal upgrade program. The company is
satisfied with its current cooling water regimen of 3 cycles of concentration.
Obstacles to completion: As part of a large corporation, this business does not feel at all hindered by lack of
available funding. It does, however, feel hindered by the additional personnel
capacity needed to implement some of the changes.

Alliance for Water Efficiency October 2012
-6-
Manufacturer
The manufacturer receives treated water withdrawn by the public water supplier from shallow aquifers, and its
local wastewater provider releases its effluent to a surface stream. It has six primary water uses: 1) product
testing lab; 2) cooling tower makeup; 3) boiler makeup; 4) sanitation and cafeteria; 5) reverse osmosis system;
and 6) miscellaneous process water.
This facility has already undertaken a number of conservation measures, including converting to dry electrostatic
powder coat painting, redesigning the process to eliminate the need for welder tip cooling on spot welding,
converting from zinc phosphate metal cleaning to a zirconium process that requires less rinse water, converting
enameling lines to electrostatic powder coating thus eliminating slurry water use, and increasing the use of
stainless steel thus decreasing the need for enameling. These measures cut the plant’s water use by 33%, from
450,000 gallons per day (135,900,000 gallons per year based on a 302 work-day year) to 300,000 gallons per day
(90,600,000 gallons per year).
Despite these improvements, additional improvements are possible, resulting in potential water savings of almost
48,000,000 gallons per year.
Product Testing Lab, Machine Testing, and Reverse Osmosis System
Use: To test the quality of its product, this facility uses 120,000 gallons of potable water
per day (43,800,000 gallons per year). The plant’s RO system produces 72,000
gallons of product water per day and 30,000 gallons of wastewater, for a total water
feed of 102,000 gallons per day (30,804,000 gallons per year based on a 302 day
year).
Conservation Most of the testing water contains detergents, dirt, and other chemicals, making the
Opportunities: water unsuitable for reuse. Some tests for durability use the water only once before
dumping, using a total of about 20,000 gallons per day (7,300,000 gallons per year).
The durability tests do not add any significant contaminants that would prevent
reuse. Retaining the water from the durability tests for reuse in subsequent tests
would require only a storage tank and pumps. In addition, the 30,000 gallons of RO
discharge water could be reused in the testing lab.
Annual Water
Savings (Gals)
Cost of
Measure
$ Savings per
year
Payback in
Years
Annual
ROI
43,800,000 $60,000 $110,000 0.55 181.8%
Alliance for Water Efficiency October 2012
-7-
Cooling Tower Makeup and Boiler
Use: The plant uses 5,000 tons of cooling capacity for process cooling and air conditioning.
The cooling towers use approximately 70,350 gallons per day, with the wastewater
discharge estimated to be approximately 13,000 gallons per day. Evaporation
accounts for approximately 57,350 gallons per day. The boiler makeup accounts for
about 7,500 gallons per day, and the blowdown is about 1,000 gallons per day.
Conservation The plant’s cooling apparatus and boiler are using water efficiently , so the
Opportunities: project team made no additional conservation recommendations.
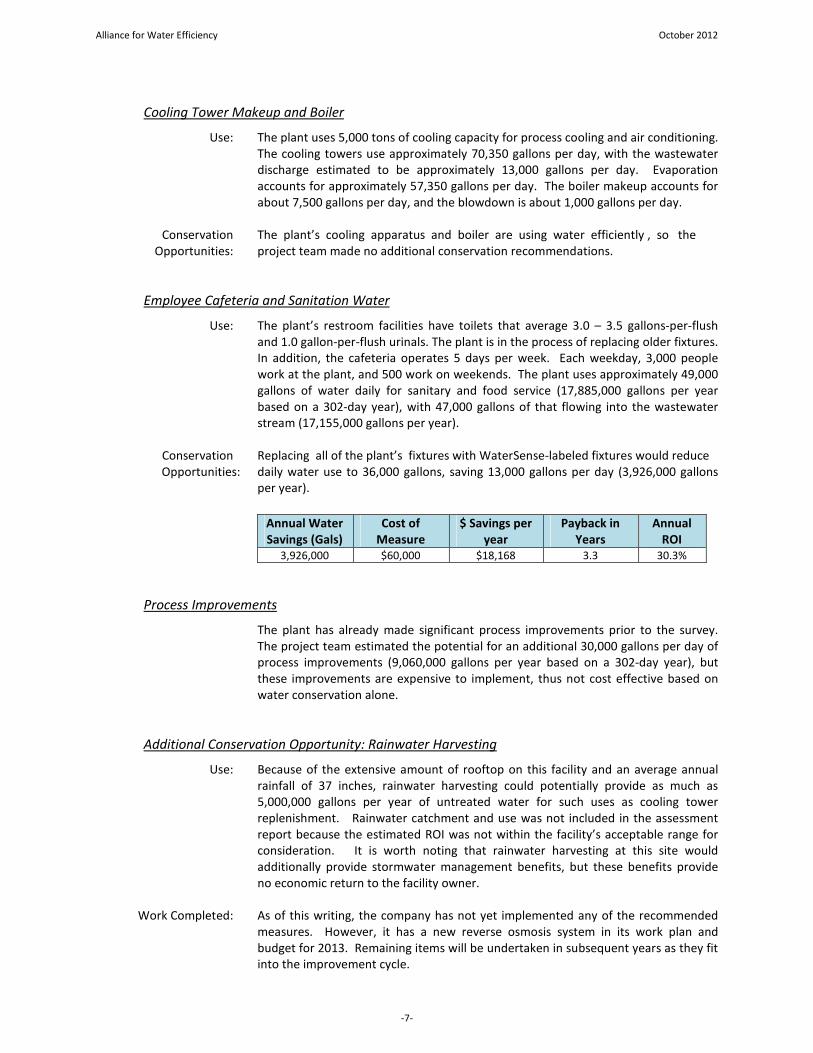
Employee Cafeteria and Sanitation Water
Use: The plant’s restroom facilities have toilets that average 3.0 – 3.5 gallons-per-flush
and 1.0 gallon-per-flush urinals. The plant is in the process of replacing older fixtures.
In addition, the cafeteria operates 5 days per week. Each weekday, 3,000 people
work at the plant, and 500 work on weekends. The plant uses approximately 49,000
gallons of water daily for sanitary and food service (17,885,000 gallons per year
based on a 302-day year), with 47,000 gallons of that flowing into the wastewater
stream (17,155,000 gallons per year).
Conservation Replacing all of the plant’s fixtures with WaterSense-labeled fixtures would reduce
Opportunities: daily water use to 36,000 gallons, saving 13,000 gallons per day (3,926,000 gallons
per year).
Annual Water
Savings (Gals)
Cost of
Measure
$ Savings per
year
Payback in
Years
Annual
ROI
3,926,000 $60,000 $18,168 3.3 30.3%
Process Improvements
The plant has already made significant process improvements prior to the survey.
The project team estimated the potential for an additional 30,000 gallons per day of
process improvements (9,060,000 gallons per year based on a 302-day year), but
these improvements are expensive to implement, thus not cost effective based on
water conservation alone.
Additional Conservation Opportunity: Rainwater Harvesting
Use: Because of the extensive amount of rooftop on this facility and an average annual
rainfall of 37 inches, rainwater harvesting could potentially provide as much as
5,000,000 gallons per year of untreated water for such uses as cooling tower
replenishment. Rainwater catchment and use was not included in the assessment
report because the estimated ROI was not within the facility’s acceptable range for
consideration. It is worth noting that rainwater harvesting at this site would
additionally provide stormwater management benefits, but these benefits provide
no economic return to the facility owner.
Work Completed: As of this writing, the company has not yet implemented any of the recommended
measures. However, it has a new reverse osmosis system in its work plan and
budget for 2013. Remaining items will be undertaken in subsequent years as they fit
into the improvement cycle.

Alliance for Water Efficiency October 2012
-8-
Obstacles to Completion: The most significant obstacles this company faces are time and money. As part of a
large corporation, it must plan and budget well ahead of time and make a business
case for all decisions. The staff involved with this effort do not know if access to
third-party funding would affect the decision making process at all.
Metal Plater
The metal plater receives treated public supply water drawn from Lake Michigan, and its wastewater treatment
provider releases effluent back to Lake Michigan. It has six primary water uses: 1) rectifier cooling; 2) boiler
makeup; 3) scrubber water makeup; 4) employee sanitation; 5) evaporation from plating tanks; and 6) the
plating process itself.
This facility is an industry leader in best practices and resource conservation. Nevertheless, significant
opportunities for improvement still exist, some constrained by regulatory requirements, and others constrained by
access to funds. It has installed conductivity controllers to limit rinse water waste, countercurrent rinsing, level
sensor controls, and other measures. With the exception of a small amount of office waste, it releases zero landfill
waste. All of its waste metals go to vendors for recovery. Environmentally, it has also installed air scrubbers to
remove fumes, a reverse osmosis system needed for a plating operation, water-cooled rectifiers for delivering
direct current to the plating line, and two efficient 150-horsepower boilers.
Filter Press for Metals Recovery
This plater highlighted potential unintended consequences of some regulations. As reported by the business
owner, the company installed a complete recycle system in the 1980s consisting of pretreatment of plating wastes
followed by reverse osmosis and ion exchange. These improvements enabled it to become a zero-discharge
facility. It received a state award for hazardous waste reduction. These improvements, however, proved to be
financially unsustainable as a result of regulatory requirements. Since the facility no longer discharged any waste,
Alliance for Water Efficiency October 2012
-9-
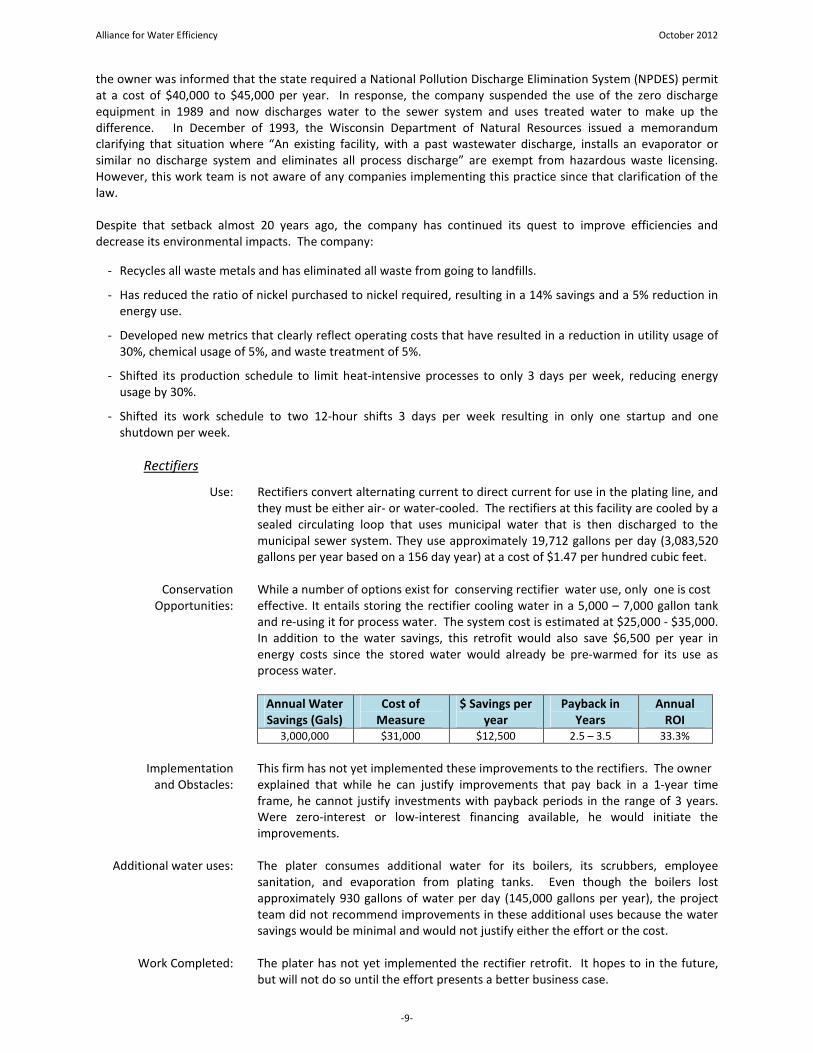
the owner was informed that the state required a National Pollution Discharge Elimination System (NPDES) permit
at a cost of $40,000 to $45,000 per year. In response, the company suspended the use of the zero discharge
equipment in 1989 and now discharges water to the sewer system and uses treated water to make up the
difference. In December of 1993, the Wisconsin Department of Natural Resources issued a memorandum
clarifying that situation where “An existing facility, with a past wastewater discharge, installs an evaporator or
similar no discharge system and eliminates all process discharge” are exempt from hazardous waste licensing.
However, this work team is not aware of any companies implementing this practice since that clarification of the
law.
Despite that setback almost 20 years ago, the company has continued its quest to improve efficiencies and
decrease its environmental impacts. The company:
- Recycles all waste metals and has eliminated all waste from going to landfills.
- Has reduced the ratio of nickel purchased to nickel required, resulting in a 14% savings and a 5% reduction in
energy use.
- Developed new metrics that clearly reflect operating costs that have resulted in a reduction in utility usage of
30%, chemical usage of 5%, and waste treatment of 5%.
- Shifted its production schedule to limit heat-intensive processes to only 3 days per week, reducing energy
usage by 30%.
- Shifted its work schedule to two 12-hour shifts 3 days per week resulting in only one startup and one
shutdown per week.
Rectifiers
Use: Rectifiers convert alternating current to direct current for use in the plating line, and
they must be either air- or water-cooled. The rectifiers at this facility are cooled by a
sealed circulating loop that uses municipal water that is then discharged to the
municipal sewer system. They use approximately 19,712 gallons per day (3,083,520
gallons per year based on a 156 day year) at a cost of $1.47 per hundred cubic feet.
Conservation While a number of options exist for conserving rectifier water use, only one is cost
Opportunities: effective. It entails storing the rectifier cooling water in a 5,000 – 7,000 gallon tank
and re-using it for process water. The system cost is estimated at $25,000 - $35,000.
In addition to the water savings, this retrofit would also save $6,500 per year in
energy costs since the stored water would already be pre-warmed for its use as
process water.
Annual Water
Savings (Gals)
Cost of
Measure
$ Savings per
year
Payback in
Years
Annual
ROI
3,000,000 $31,000 $12,500 2.5 – 3.5 33.3%
Implementation This firm has not yet implemented these improvements to the rectifiers. The owner
and Obstacles: explained that while he can justify improvements that pay back in a 1-year time
frame, he cannot justify investments with payback periods in the range of 3 years.
Were zero-interest or low-interest financing available, he would initiate the
improvements.
Additional water uses: The plater consumes additional water for its boilers, its scrubbers, employee
sanitation, and evaporation from plating tanks. Even though the boilers lost
approximately 930 gallons of water per day (145,000 gallons per year), the project
team did not recommend improvements in these additional uses because the water
savings would be minimal and would not justify either the effort or the cost.
Work Completed: The plater has not yet implemented the rectifier retrofit. It hopes to in the future,
but will not do so until the effort presents a better business case.

Alliance for Water Efficiency October 2012
-10-
Obstacles to completion: Available funding is the company’s sole obstacle. With access to no-interest or low-
interest funds, the company would move forward.
Leather Tannery
The assessed tannery receives treated public supplier water drawn from Lake Michigan, and its wastewater
provider releases effluent back to Lake Michigan. It is in an urban environment on a limited footprint of real
estate. It is a large-scale tanning operation that completes initial tanning processes on about 2,000 hides per day.
It produces both “wet white” and “wet blue” hides that are then shipped to other tanneries for finished tanning
ready to be made into leather products. The initial steps of its process entail de-hairing and some de-fleshing and
de-boning, so its process results in a large amount of solid organic materials. It operates three shifts per day
throughout the year and employees 120 full-time workers.
The tannery spends approximately $1 million per year on water and wastewater, including additional fees for
discarding a large volume of solid organic waste through the municipal wastewater system. Roughly $65,000 of
that $1 million annual expense is the result of additional fees for the loadings of total suspended solids (TSS) and
biological oxygen demand (BOD) in the wastewater stream. It discharges approximately 433,000 gallons per day to
the wastewater system, and it is the second-largest wastewater customer in the region.
In addition, it has a 15,000,000 BTU per hour water heater, and it uses large amounts of chemical, including
sodium hydroxide, lime, and tanning chemicals.

Alliance for Water Efficiency October 2012
-11-
Raw Hides in the Initial Wash Bath
Use: The vast majority of the tannery’s water use is in the processing of hides and
constantly rinsing debris from the floors.
Conservation The opportunity exists to treat, filter, and reuse more than 50% of the water
Opportunities: currently used at the facility. In some cases, the water treatment needs would be
minimal for the water to be reused. This strategy would reduce water use and would
reduce wastewater costs by both volume and content charges. Reusing process
water for floor rinsing alone would save more than 80 million gallons of water per
year.
Despite the significance of these water savings, the project team only recommended
reusing water used in a hydraulic cooling process, which would save 11,000,000
gallons of water per year. Realizing additional water savings at that site would
require significant engineering and construction for an adequately large holding tank
needed for reuse. Since the footprint of the property is small and tightly
constrained, such an improvement is not readily feasible. A similar operation on a
larger footprint would have considerably more water saving opportunities.
Annual Water
Savings (Gals)
Cost of
Measure
$ Savings per
year
Payback in
Years
Annual
ROI
11,000,000 $50,000 $21,800 2.3 43.4%
Work Completed: The tannery has started recycling its cooling water, and is currently recycling 90%.
With somewhat more storage capacity, it should be able to recycle 100%.
The company has not been able to limit its discharges to the sewer district, and it is
not sure if it will be able to do so in the future.
Obstacles to completion: The primary obstacle faced by the tannery is one of space. Sitting on a small
footprint, it does not have readily available space to build the necessary tanks and
separation equipment. With available funds, it would immediately undertake an
engineering study to examine the feasibility of the improvement. The owners fully
understand that the result would be significant cost savings and regional protection
against combined sewer overflows. They estimate that by filtering hair and other
solids for water reuse, they would prevent approximately four truckloads of solid
waste from entering the effluent stream each day, saving significant amounts on
water and wastewater charges. They also are mindful of the financial impact the
improvement would have on the wastewater utility.

Alliance for Water Efficiency October 2012
-12-
Beer Brewery
The assessed brewery receives its treated public supply water drawn from a shallow aquifer, and its local
wastewater provider releases effluent to a surface stream. The brewery uses approximately 5.6 gallons of water
per gallon of beer (5.6 : 1 ratio), which is in line with industry averages but still can be improved. Some brewers
claim to have achieved water efficiency ratios in the range of 3.5 : 1, but there are no industry standards of
measurement to provide reliable comparisons.
The brewery uses about 24,000,000 gallons of water per year and releases 18,000,000 – 19,000,000 gallons of
wastewater per year at a combined cost of $180,000. The brewery has three operational areas: the brew house
and the cellar each account for 40% of the water use; and the bottling, kegging, and packaging area accounts for
the remaining 20%.
The primary water uses that are not related to the beer itself include bottle warming and the cleaning of vessels,
floors, bottles, and transfer lines.
Efficiency Measure Annual Water
Savings (Gals)
Cost of
Measure
$ Savings per
year
Payback in
Years
Annual
ROI
Reduce manual CIP on vessels* 30,000 $0 $130 0.0 NA
Fermentation foam release* 1,800,000 $500 $7,722 0.1 1000%
Water broom floor clean* 100,000 $500 $429 1.2 83.3%
Capture/use steam condensate* 300,000 $0 $1,287 0.0 NA
Reuse wash and lube water in
bottling*
300,000 $7,500 $1,287 5.8 17.2%
Wort line purge reuse 5,000 $100 $21 4.8 20.8%
* Measure has been implemented or implementation is in-progress.
Work Completed: 1. Reduce manual clean-in-place (CIP) on the brew house vessels.
This operation has moved to a new brew house that has installed state-of-the-
art spray nozzles to scour the vessels. The brewery will continue to educate
employees at the old site about efficient practices and use of the new nozzles.
2. Redesign foam control for strong ale production.

Alliance for Water Efficiency October 2012
-13-
The brewery has redesigned its process to prevent the release of foam, thus
eliminating the need for continuous floor washing.
3. Water broom floor cleaning.
The company has ordered a new efficient water broom and plans to adopt it
following testing.
4. Capture and reuse the steam condensate in the bottle warming area.
This recommendation has been completed.
5. Capturing lubricating and bottle washer water currently draining to the floor.
This improvement is in process. The brewery hired university engineering
interns to design the system. The design phase is complete, and another group
of interns will implement it. The total cost for design and implementation will
only be in the range of $1,000.
Work not completed: Adding a clean-in-place system to transfer lines from the boil tun to the fermentation
tanks: This recommendation has not yet been implemented because it requires
additional engineering. Specifically, there must be a system in place that detects
where the flow of beer ends and the flow of water begins.
Obstacles to completion: Additional engineering requirements that have not yet been budgeted.
CUMULATIVE WATER SAVINGS OVER A 20-YEAR LIFECYCLE
The recommended water conservation improvements all have lifespans of approximately 15 – 25 years. This
analysis, therefore, assumed a 20-year effective life to show the total water and dollar savings over the life of the
project.
ENVIRONMENTAL IMPACTS OF THE SAVED WATER
The environmental impacts of the conserved water depend on the origins of the water, the type of sewer system
receiving the discharges, the location of the wastewater system discharges, and the air quality impacts related to
embedded energy. The effects may be seen in the levels, flows, and quality of source water; the health and
viability of water-dependent natural resources; groundwater levels; water levels, flows, and quality of receiving
waters; and improved air quality resulting from reduced energy use. The results manifest themselves as improved
water supply reliability; ecosystem health; greater infrastructure capacity, reliability, and maintenance; and of
course, increased competitiveness of businesses. In addition, decreased pumping helps to protect aquatic life
through each life stage: larval, juvenile, and adult.
Water Sources and Receiving Waters
Great Lakes
• The volume of water contained in the Great Lakes is so immense – 6 quadrillion or 6x10¹⁵
gallons – that
the volume of the lakes itself cannot be significantly affected by conservation measures. The water
quality, however, will be affected, as will the embedded effects of the pumping and treatment of both
potable water and wastewater.
• To a small extent, increased conservation efforts would reduce pumping from the lakes, which could
reduce potential impacts on fish that live and lay eggs near intake pipes. The portion of the lakes most
affected by conservation efforts is the littoral zone, that part of the lakes closest to the shorelines that
could be more affected by such factors as contaminants and thermal variations (Lane et al (1996b). In
fact, all but two of the Great Lakes’ 139 fish species use waters less than 10 meters deep as nursery
habitat. The species most affected include alewife, gizzard shad, yellow perch, rainbow smelt, and lake
Alliance for Water Efficiency October 2012
-14-
trout (Section 316b EA Chapter 11 for New Facilities, p. 11-9). The only two exceptions are deepwater
ciscoes (Coregonus spp.) and deepwater sculpin (Myxocephalus thompsoni).
Aquifers
• As in other geographic areas, aquifer levels will be substantially more reliable with concerted
conservation efforts across the basin. The levels can also be protected by ensuring that local stormwater
flows in a manner that recharges the aquifer.
Other Surface Waters
• Surface water supplies remain more reliable with concerted conservation efforts, thus making more water
available for economic growth and ecosystem services. Surface receiving waters, however, might
experience decreased flow as a result of lower effluent flows.
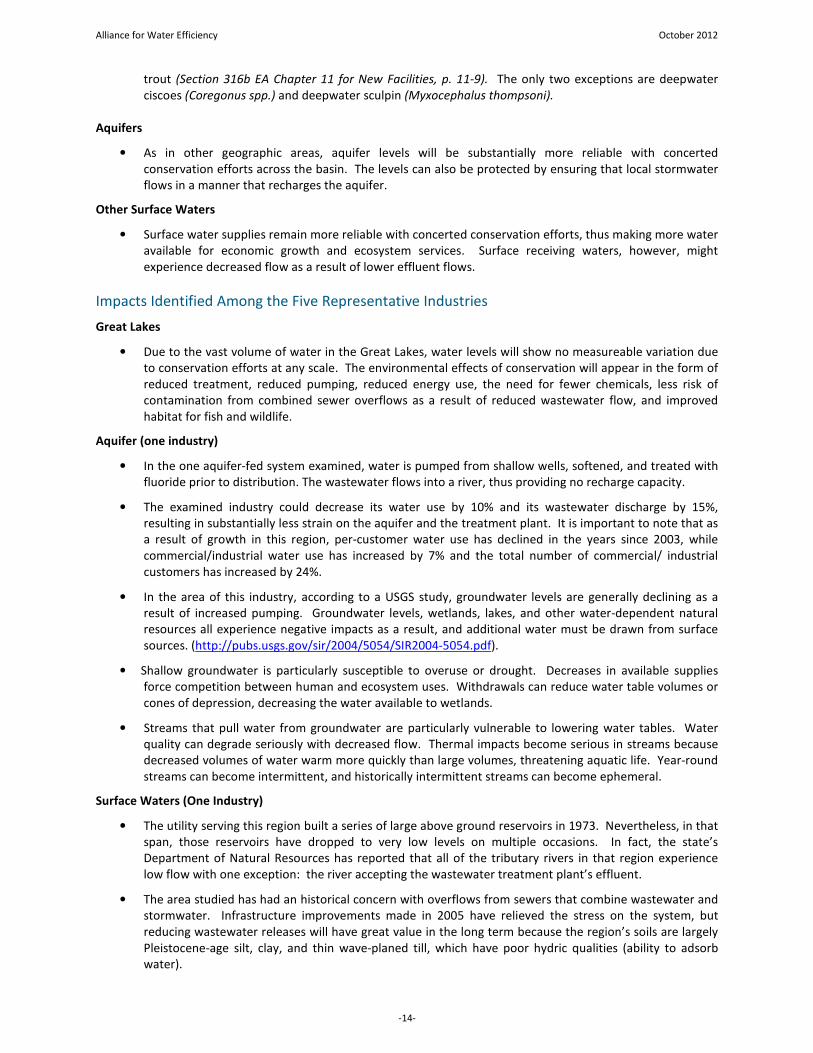
Impacts Identified Among the Five Representative Industries
Great Lakes
• Due to the vast volume of water in the Great Lakes, water levels will show no measureable variation due
to conservation efforts at any scale. The environmental effects of conservation will appear in the form of
reduced treatment, reduced pumping, reduced energy use, the need for fewer chemicals, less risk of
contamination from combined sewer overflows as a result of reduced wastewater flow, and improved
habitat for fish and wildlife.
Aquifer (one industry)
• In the one aquifer-fed system examined, water is pumped from shallow wells, softened, and treated with
fluoride prior to distribution. The wastewater flows into a river, thus providing no recharge capacity.
• The examined industry could decrease its water use by 10% and its wastewater discharge by 15%,
resulting in substantially less strain on the aquifer and the treatment plant. It is important to note that as
a result of growth in this region, per-customer water use has declined in the years since 2003, while
commercial/industrial water use has increased by 7% and the total number of commercial/ industrial
customers has increased by 24%.
• In the area of this industry, according to a USGS study, groundwater levels are generally declining as a
result of increased pumping. Groundwater levels, wetlands, lakes, and other water-dependent natural
resources all experience negative impacts as a result, and additional water must be drawn from surface
sources. (http://pubs.usgs.gov/sir/2004/5054/SIR2004-5054.pdf).
• Shallow groundwater is particularly susceptible to overuse or drought. Decreases in available supplies
force competition between human and ecosystem uses. Withdrawals can reduce water table volumes or
cones of depression, decreasing the water available to wetlands.
• Streams that pull water from groundwater are particularly vulnerable to lowering water tables. Water
quality can degrade seriously with decreased flow. Thermal impacts become serious in streams because
decreased volumes of water warm more quickly than large volumes, threatening aquatic life. Year-round
streams can become intermittent, and historically intermittent streams can become ephemeral.
Surface Waters (One Industry)
• The utility serving this region built a series of large above ground reservoirs in 1973. Nevertheless, in that
span, those reservoirs have dropped to very low levels on multiple occasions. In fact, the state’s
Department of Natural Resources has reported that all of the tributary rivers in that region experience
low flow with one exception: the river accepting the wastewater treatment plant’s effluent.
• The area studied has had an historical concern with overflows from sewers that combine wastewater and
stormwater. Infrastructure improvements made in 2005 have relieved the stress on the system, but
reducing wastewater releases will have great value in the long term because the region’s soils are largely
Pleistocene-age silt, clay, and thin wave-planed till, which have poor hydric qualities (ability to adsorb
water).

Alliance for Water Efficiency October 2012
-15-
• The industry examined in this region could reduce treated water withdrawals and wastewater flows by
approximately 10%, thus enhancing flow on the source water river, especially during periods of drought.
• Interestingly, the soils found throughout much of the basin drain slowly, so farmers build drain tile
systems to prevent crop damage caused by flooding. Water that would otherwise slowly percolate into
aquifers is instead channeled into ditches and creeks and from there to a lake. Those aquifers do not
provide adequate emergency supplies during the periods of drought, in part because rainwater no longer
has ample opportunity to replenish the aquifer.
• Increased water conservation efforts would allow groundwater-supplied wetlands to receive water and
drain more naturally, thus more effectively supporting a healthy ecosystem. Likewise, reduced water
consumption would increase the flow reliability of streams, further protecting the ecosystem.
Receiving Waters
Great Lakes
• In 2010, the tannery paid more than $1 million in sewer charges, with additional fees levied because of
the volume of total suspended solids (TSS) and biological oxygen demand (BOD). While the revenue is
attractive to the wastewater utility, the contaminants stress the system and have the potential to add
significant contamination to the lakes during combined sewer overflow events. Removing the solids and
treating and re-using the water – up to 80,000,000 gallons per year in this one case – would decrease the
potential for stormwater contamination, decrease energy and other treatment costs, and extend the life
of the wastewater infrastructure. (This improvement is not financially viable for this tannery at this time
because of severe urban space constraints. Nevertheless, from a basin-wide perspective, such water
reuse strategies would have a strong positive impact on the overall environment. See additional
discussion in the section on the tannery.)
Groundwater (one industry)
• In areas where water is drawn from one source and wastewater released to another, water flow could
decrease in one watershed while increasing in another, and the hydrology of both regions would change,
affecting plants, wetlands, and aquatic life.
Surface Waters (one industry)
• The stream receiving the discharge waters from the wastewater treatment plant has a generally higher
flow rate than surrounding streams. Reducing the flow of effluent could have a negative impact on the
aquatic habitats associated with this one stream, particularly during periods of drought or low flow.
Stormwater Management
Water harvesting systems from rooftops and paved areas allow the on-site retention of stormwater, thus reducing
flows to storm sewers and treatment plants. These systems can also improve the overall water quality of
wastewater flows by capturing the pollutants and debris carried by stormwater runoff. As an added benefit,
harvested water can supplement a facility’s water supplies through appropriate use, thus further reducing the
need for treated municipal water.
Scaled Environmental Impacts Across the Watershed
Methodology
To estimate the impacts of industrial water conservation efforts scaled across the watershed, the project team
examined statewide data, especially SIC codes, for related industry types within the basin itself. Several factors
erode the reliability of this approach, such as a lack of knowledge of relative size and scale of each business, as well
as broad representations of business type, such as “manufacturing.” Whereas this specific effort focused only on
industries using water provided by municipal suppliers, this scaling up exercise examines all industries, regardless
of water source. Widespread efficiency measures may be adopted from the full population of similar industries,
and we are interested in understanding the potential total environmental benefits of cost effective water
efficiency measures.

Alliance for Water Efficiency October 2012
-16-
Indeed, impacts are influenced by a range of factors, such as storm water management, domestic water use
reduction, direct withdrawals, wastewater treatment, green infrastructure, and many other changes in practice.
Examining water uses throughout the water cycle more clearly reveals the cumulative impacts of changing multiple
practices. Damage to the environment has occurred bit by bit over time; bending that curve back also requires
time, patience, and incremental steps. While the impacts of individual changes may be so small as to seem
immeasurable, accumulated changes over time become significant.
We believe that these data provide adequate approximations that should drive future efforts, and we have every
reason to believe that the impressive conservation opportunities found in the project’s small sample size and small
cross-section of industries will be available almost universally.
Summary of Findings on Water Savings
This project examined five industries of varying size and with a variety of water sources and wastewater receiving
waters. These five industries alone revealed potential water savings of approximately 66.5 million gallons per
year. The Great Lakes region is home to approximately 1,000 comparable facilities in electroplating and electro-
finishing, tanneries and leather manufacturers, food production and breweries, and metal products manufacturing.
In rough numbers, therefore, the water savings revealed amount to roughly .2% of the potential water savings and
related environmental impacts throughout the basin.
Energy Use and Air Quality
Water and wastewater treatment processes are both energy intensive, as is the necessary pumping. Lower
demand for water directly reduces this energy use, as well as the use of additional chemicals. Likewise, reduced
water use reduces the need for pumping and treatment at the site of the user, regardless of the industrial sector.
The impact on air emissions is significant, with an overall possible reduction in carbon dioxide emissions from
these industries sectors alone across the basin of approximately 1 billion pounds of CO2 over 20 years, the
equivalent of 100,000 car-years.
Estimated Potential Water Savings, Wastewater Savings and Air Quality Impacts
Across the Great Lakes Basin Related to Water Conservation Activities
Single Year 20-Lear Lifespan
Total number of related industries 989 989
Potential annual surface water and wastewater savings 23,000,000,000 460,000,000,000
Potential annual ground water and wastewater savings 5,000,000,000 100,000,000,000
Kilowatt hours saved related to surface water and wastewater pumping
and treatment (adjusted down by approximately 25%) 25,000,000 500,000,000
Kilowatt hours saved related to ground water and wastewater pumping
and treatment (adjusted down by approximately 25%) 6,000,000 120,000,000
Total emissions impacts related to surface water and wastewater
pumping (pounds)
Annual CO2 40,000,000 800,000,000
Annual SO2 170,000 3,400,000
Annual NOx 55,000 1,100,000
Ozone season NOx 40,000 800,000
Annual HG 0.70 14
Annual CH4 700 14,000
Annual N2O 600 12,000
Total emissions impacts related to ground water and wastewater
pumping (pounds)
Annual CO2 11,000,000 220,000,000
Annual SO2 48,000 960,000
Annual NOx 15,000 300,000
Ozone season NOx 11,000 220,000
Annual HG 0.25 5
Annual CH4 200 4,000
Annual N2O 180 3,600

Alliance for Water Efficiency October 2012
-17-
To arrive at these numbers, we calculated the number of gallons saved at each assessed industrial site and
multiplied that amount of water by the total number of related industry facilities in the Great Lakes watershed.
We identified those areas served by both Great Lakes surface water and Great Lakes groundwater and identified
the number of facilities in municipalities served by the different water source types. We then estimated the
number of kilowatt-hours that could be reduced based on reduced pumping needs at different water intakes and
wells using figures calculated by the Electric Power Research Institute (EPRI). EPRI estimated that it takes, on
average, 1,406 kilowatt hours per million gallons to pump, treat, and distribute surface water and 1,824 kilowatt
hours per million gallons to pump, treat, and distribute groundwater to customers. EPRI also calculates that it
takes 1,541 kWh per million gallons to treat and discharge wastewater. We determined that the number of kWh
should be reduced by approximately 25% to provide a more conservative high-end estimate. These savings were
then used to calculate the potential reduced emissions using estimated figures for the State of Michigan power
mix using USEPA’s Emissions & Generation Resource Integrated Database (eGRID). Michigan was selected because
of the large number of facilities located in Michigan.
Brewing: The Great Lakes watershed is home to approximately 80 regional and large breweries,
and countless small breweries. The production levels of the regional and large breweries
range from 15,000 to 6,000,000 barrels per year. Together, they could save
approximately 37.5 million gallons per year of water and cut air emissions by 260,000
pounds of carbon, 1,900 pounds of sulfur, and 450 pounds of nitrogen.
Tanneries: Tanneries are spread throughout the region. Wisconsin is one of the top three states in
the nation for leather industry employment. Environmental benefits from conservation
in the tanning industry would result from significantly lower energy consumption and
related air quality impacts. In addition, on-site treatment and re-use could lower BOD
and TSS loadings going to the wastewater treatment plant and decrease the risk of
contamination for a combined sewer overflow event. Tanneries are often found close to
meat packing plants, where the benefits of conservation would be similar.
Metal Finishing: The Great Lakes states are home to more than 1,700 metal platers and related businesses
– 20% of the nation’s total. About 40% of these are in the Great Lakes basin itself. As
opportunities evolve, platers are implementing zero-discharge technologies, which keep
solvents, metals, cyanide, acids, alkalis, and other toxic chemicals completely out of
water sources. These technologies include non-electrolytic coatings and non-hexavalent
chromium. The result of this action would be a significant reduction in the need for
wastewater treatment for the industry as well as improved effluent quality.
Plastics: Like metal finishers, 20% of the nation’s plastics manufacturers (SIC Code 3089) are
located in the Great Lakes states. This sector is part of a broader sector – chemical and
allied products manufacturing – that has a strong presence in the region. More than
2,500 of these types of facilities may be found in the Great Lakes states. Many of them
require significant water resources in facility processes.
Manufacturing: The broader manufacturing sector is very large in the Great Lakes region. The major
manufacturing industries in the Great Lakes basin produce steel, paper, chemicals,
automobiles, and a wide array of manufactured goods. Urbanization, accompanied by
industrial growth, brought an increase in the number of municipal water and sewage
treatment facilities and industrial plants that discharge their effluents into the Lakes. In
six Great Lakes states (not including Pennsylvania and Illinois), there are close to 10,000
fabricated metal products facilities, encompassing metal platers and metal finishers, as
well as facilities that bend metal. This sector, which is critical to the economic health of
the region, shows the significant opportunities that are available for water conservation.
There are thousands of manufacturers with attendant suppliers and facilities that support
them, and many of the facilities receive water from public water supplies.
Assuming that similar water conservation opportunities exist in industrial facilities nationwide, this table
presents a simple concluding snapshot of the water conservation potentials:

Alliance for Water Efficiency October 2012
-18-
Food and
Related
Products
Fabricated
Metal
Products
Chemical and
Allied Products
Manufacturing
Malt Beverages
and Soft Drink
Bottlers
Number of related industries in
six Great Lakes States: Indiana,
Michigan, Minnesota, New York,
Ohio, and Wisconsin
5,175 9,778 2,690 549
Number of related industries
across the United States 27,646 41,690 13,833 3,342
IMPACTS ON WATER UTILITIES AS A RESULT OF INCREASED INDUSTRIAL WATER CONSERVATION
To ascertain the impacts of increased industrial water conservation on water utilities in the basin, the project team
undertook three informational efforts. The first entailed an analysis of lost revenue based on potential
conservation opportunities; the second entailed brief interviews with each of the utilities serving the selected
industries; the third entailed an electronic survey that went out to utilities throughout the watershed.
Utility Revenue Loss
Lost revenue from decreased water sales is of significant concern to some utilities and less concern to others.
Revenue loss can represent a significant challenge for utilities with a shrinking customer base and utilities with a
large debt service on an infrastructure system with unused capacity. For other utilities, however, lower sales can
provide financial benefit for a number of reasons. With reduced water sales, variable costs can decline, such as
energy and treatment chemicals. For utilities facing capacity concerns, decreased sales can defer the high costs of
developing new supplies. Likewise, utilities with infrastructure needs can often defer construction or maintenance
with decreased flow volumes.
This study assessed potential revenue loss based on published rates and potential water savings, finding the
following impacts:
Utility Revenue Loss
Water Wastewater Combined Water & Wastewater
Manufacturer* $128,888
Brewery $35,700 $71,500 $107,200
Leather tannery $15,400 $54,100 $69,500
Plastics compounder $9,700 $6,500 $16,200
Metal plater $5,900 $4,600 $10,500
*The manufacturer draws from a single water and wastewater utility, so water and wastewater charges could not be separated.
Summary of Utility Interviews
Utility #1: This utility serves a mid-sized city and the surrounding townships. Its water source is 100%
groundwater, and its wastewater flows into a surface water stream. Its population and demand are
both in slow decline, with industrial water use declining faster than residential water use.
Its primary concern relates to infrastructure: It is selling the same amount of water as it did 25 years
ago, but it now supports and maintains 50% more pipe. Its director did not express a concern about
water rates, noting that water rates are not a factor in whether or not industries stay in the area or
relocate; the relative cost of water within their total operational budget is just too low to make a
difference.
The director estimates that it would experience serious financial instability if sales dropped another
10% or more. In response to that concern, it recently reduced its workforce from 222 to 180
through early retirement and attrition. In the short-term, however, that reduction will provide little
additional stability because of the need to pay early retirement benefits.

Alliance for Water Efficiency October 2012
-19-
The director did note that a significant drop in industrial water sales could result in an equally
significant financial problem for the utility.
Utility #2: This utility serves a mostly rural area that is home to several large industries. Its plant has a capacity
of 2.4 million gallons per day. Leaks account for 9 – 12% of its production, even though 75% of its
distribution system is less than 20 years old.
Its plant supervisor estimated that the utility could handle a reduction in demand of as much as 20%
without cause for alarm. A larger drop would require a change in its rate structure.
Unlike Utility #1, this utility expressed the belief that water costs definitely have an effect on
businesses locating in the area. He even noted that he is frequently contacted by prospective high-
water-use businesses inquiring about water costs before making decisions about where to relocate.
He also noted the role of water quality in addition to cost and quantity. An industry served by this
utility had to decide whether to expand a plant in Mexico or in the utility’s service territory. Despite
the lower labor costs in Mexico, the plant expanded in the Great Lakes basin because of the superior
water quality; lower total dissolved solids (TDS) in the raw water. Indeed, high quality, reliable
water is of great value to many businesses.
While the plant operator believes that some in the community might not fully understand the need
for aggressive water conservation, he believes that they would come to understand over time. He
attributes business retention and infrastructure longevity to this shift in attitude.
Utility #3: This utility serves a mostly rural population with a moderate industrial presence. It draws water
from and releases treated wastewater to Lake Erie. Its population rose steadily until about ten years
ago, and now it is stable. In addition, three industries left the area in the past decade, a rubber
company and two chemical companies. Since it planned the system for continued growth, its
demand is only about 80% of its capacity. Industrial use accounts for 10% - 15% of its total sales.
In light of this ratio of industrial to residential customers, it estimates that a decline in industrial
water use of about 20% would not have a meaningful effect on its finances. However, most of its
costs are fixed, in the form of debt service and infrastructure maintenance, so the savings related to
reduced consumption would be small.
The utility does not encourage water conservation and does not experience problems meeting peak
demands, even during dry summer months. It does not envision a scenario that would motivate it to
provide tangible support to water conservation efforts. In short, it has plenty of water, and it sees
no reason to sell less.
Utility #4: This large urban utility draws directly from the Great Lakes. It serves two of the assessed industries,
the leather tannery and the metal plater. Despite undertaking no water conservation initiatives, its
demand is declining dramatically. From 1976 to 2011, water use among its customers fell from 58
billion gallons per year to 32 billion gallons per year. Because of a declining local economy, its
industrial water use has fallen from 22 billion gallons per year to 4 billion gallons per year in that
same span.
Its capacity is 380 million gallons per day, but its daily average is only 100 mgd, and its summertime
peak is only 165 million gallons per day. Its rates are regulated by the state, so it is not concerned
about declining sales. Even an additional 20% decline in industrial sales would not result in a
revenue crisis. It encourages customers to water their lawns throughout the summer, and it
encourages responsible water use instead of less water use.
Interestingly a new EPA regulation will encourage water conservation among many of this utility’s
industrial customers. Phosphorous prevents the leaching of lead and other heavy metals from
cooling pipes. In single-pass cooling systems, this practice results in high phosphorous volumes in
the wastewater. As EPA limits phosphorous discharge, the affected industries will be forced to

Alliance for Water Efficiency October 2012
-20-
switch from single-pass cooling to the use of cooling towers, thus increasing the amount of cooling
water that gets recycled and reducing water demand.
As a final note, its assessment of local industries is that price of water is very low on the list of
economic concerns.
Survey Results: The Impacts of Industrial Water Conservation on Regional Water Utilities
The project team surveyed just over 100 water utilities, 87% of which are in the Great Lakes watershed itself. Of
those, 49% draw their water from the Great Lakes, and the rest draw their water from a combination of
groundwater or surface water sources, with those using groundwater outnumbering those using surface water by
four to one. Approximately 55% of the responders are in areas with stable populations. Of the remaining utilities,
half are in areas experiencing population growth, and half are experiencing population decline. Likewise, 42% of
the utilities are experiencing stable sales, and of the remainder, half are seeing sales increases, and half are seeing
sales declines. Only 9% of the responders have stressed supply sources, and 20% sometimes experience periods of
demand exceeding supply, especially during mid-summer.
The overall impact of water conservation on water suppliers entails complex and sometimes non-intuitive factors.
A simple intuitive analysis would lead to the conclusion that reduced water sales lead to reduced revenues.
Reduced revenues would then either lead to budget shortfalls or elevated rates. While this scenario often plays
out in just this way, it is not always the case. Other factors shift the equation. These factors may include the
reliable availability of water especially during peak-use periods or in areas with stressed water supplies, reduced
variable costs such as energy and treatment chemicals, deferred or reduced infrastructure costs for maintenance
or construction, and, in some cases of on-site treatment and reuse, reduced loadings on wastewater treatment
facilities.
Clearly, some water suppliers experience negative impacts from reduced water sales, while others experience
benefits. The utilities most likely to experience negative impacts are those in areas of declining population or
economic activity with excess capacity. Those most likely to experience benefits are those with stressed supplies,
those that can benefit from deferred or avoided maintenance or infrastructure costs, and those that can prove
themselves to be attractive to new industrial customers.
The results of the survey confirm the breadth of possible responses. While 81% think that reduced water sales
would negatively affect their revenue stream and balance sheet, 84% believe that their customers would receive
conservation efforts positively and supportively. In addition, 75% believe that conservation efforts would reduce
their energy costs; 45% believe such efforts would reduce the need for infrastructure repair, replacement, or
expansion; and 62% believe their chemical costs would decline.
Interestingly, while 84% of the responders thought that local industries would receive conservation efforts
positively, they were rather evenly divided on questions that addressed the relationship between conservation and
the long-term economic health of their territory. When asked if water conservation efforts might provide a tipping
point to attract business or force business to leave, 25% said yes, 39% said no, and 36% were unsure. When asked
if reduced water sales would be offset by retaining industries in the territory, 13% said yes, 40% said no, and 47%
were unsure. In response to a question of whether or not declines in demand might be offset by sustainability
improvements that could enhance the reliability and quality of water supplies into the foreseeable future, 29%
said yes, 41% said no, and 30% were unsure.
In their comments, a number of utilities expressed deep concerns about decreased water sales, as represented
below:
- “Conservation by industry will save money when we can reduce infrastructure costs, but we have not yet
been able to reduce our infrastructure costs such as pumps and pipe replacement.”
- “Water infrastructure still needs to be repaired regardless of the current water usage. As conservation
increases, the ability for utilities to address their infrastructure problems becomes increasingly more
difficult.”
Alliance for Water Efficiency October 2012
-21-
Simultaneously, other utility comments show a sense of offsetting costs, even if not totally so, as indicated by
these:
- “The biggest savings to us would be delaying a plant expansion.”
- “Energy, infrastructure, and chemical costs would decrease if water use decreased.”
- “Cost reduction should be a positive outcome of reduced use. We would not expect the reduction to equal
the loss in revenue, however. Less demand would not equate to a reduction in the greatest expense:
labor.”
- “The past few months have pushed our pumping capabilities to the maximum. If companies could decrease
their water use by a few percent, that would be helpful.”
The deep challenge of these concerns related to water conservation and the impact on utilities was summed up
well in these comments that addressed a not-unheard-of reality: As demand declines because of conservation,
rates go up, so customers wind up paying the same while using less water.
- “We have tried to make the point to our customers that conservation will not significantly reduce costs, but
it will save resources. Most of our costs as a water/sewer utility are fixed costs and only a few are variable
so reduced consumption has ended up increasing the unit cost of water.”
- “Any sizeable reduction in water sales will undoubtedly require a rate increase to everyone to keep our
utility operational.”
In summary, the survey showed a lack of consensus among water utilities about the need for and impacts of water
conservation efforts. The information appears to indicate that utilities experiencing declining load will be most
adversely affected by large-scale conservation efforts, mostly due to their fixed costs, while utilities that are
experiencing demand growth would be affected most positively, largely because of deferred investments and
lower variable costs. The breadth of responses shows a substantial window of opportunity for large-scale
industrial water conservation efforts simply because of the vast scale of the basin.
FUNDING MECHANISM TO SUPPORT INDUSTRIAL WATER CONSERVATION
This project addressed funding needs in two ways. First, we surveyed industries to ascertain the need for external
or third party funding as a motivator for water conservation efforts. Second, we designed the framework of a
third-party funding program so it would be in place if the effort can be brought to scale across the region.
Findings of the Survey
The project team surveyed 37 industries to determine the importance of available funding on the decision to
implement water conservation measures. The surveyed industries spanned the five sectors addressed in this
analysis – brewing, plastics, tanning, metal finishing, and manufacturing – as well as responders from government,
a homeowner’s association, water efficiency vendors, and water districts. Of the responders, 47% were from the
tanning industry, and 67% were from the five examined industry sectors. In addition, 40% of the responders were
in the Great Lakes watershed, and 60% were not; however, we do not expect that presence in the watershed has a
meaningful effect on whether or not an industry would benefit from access to conservation funding.
The survey affirmed the value of and need for available funding as a tool to help overcome a significant obstacle to
implementation. Of the responders, 66% said that available funding would “likely” or “very likely” affect their
company’s decision to implement water efficiency measures. Further, 36% currently have water efficiency
improvements planned but not implemented because of a lack of available funding. (25% of the responders were
unsure.)
These survey findings align well with the anecdotal responses we received from the target industries. A significant
number of projects need only access to funds to be implemented, including rectifiers at the metal plater, and an
engineering study for the tannery to determine the potential location of storage tanks for removing animal by-

Alliance for Water Efficiency October 2012
-22-
products from water before re-use or disposal. The appliance manufacturer and the plastics extruder, which are
both part of large multinational corporations, did not express any concern for available funds. Rather, the
obstacles they confront entail budgeting, scheduling, personnel capacity, and process flow. The brewer, which has
implemented some of the more significant recommended measures did so not through funding, but by moving
part of its operation to a new, more state-of-the-art facility. The remaining measures entail behavioral changes, so
it practices continuous employee education.
Not surprisingly, 60% of the responders believe that interest rates of 5% or lower would encourage decisions on
facility improvements, and 45% of the responders need to be able to document payback times of two years or less.
A surprising 26% of the responders will undertake water efficiency projects with payback times of five years or
more.
Industries will readily invest in water and energy conservation opportunities that have very short – less than one
year – payback times, but as the time needed to recoup an investment grows, the investment decision becomes
more and more complex. To provide a financial incentive to these companies, this project has developed a
framework for a low-interest or no-interest revolving loan program that should help facilitate and incentivize these
investment decisions. It considers such business issues as return on investment, financial health of the applicant,
business future of the applicant, and default-bankruptcy remedies.
Funding Details
Background
Many states have loan opportunities in place for renewable energy programs, but few if any loans/grants
specifically target industrial users of public water supply systems. Since this project is charting new ground, the
team has worked to craft a loan program with terms that are liberal enough to attract interest but that protect the
lender in case of default.
Framework for third party funding
In putting together the framework, the project team considered the following factors:
• Identification of common eligibility criteria
• Level of technical assistance needed
• Loan terms needed to attract a viable number of industries, including interest rates
• Percentage of a project to be financed
• Loan securitization, types of collateral, percentage of appraised value
• Loan default responsibilities and policies
• Estimated scale of the program
• Funding sources
• Loan administrators / loan servicers
Eligibility Criteria
• Eligible applicants will be industries that use treated water from a public water supply in their industrial
process.
• Funding cannot exceed 75% of the total project costs.
Ineligible Activities
• Refinancing existing debt or repaying existing owners’ loans to the business.
• Financing a non-business purpose.
• Repaying delinquent state or federal withholding taxes or other funds that should be held in trust or
escrow.
• Investing in interest bearing accounts, CDs or other investments.
• Paying project costs incurred prior to the approval of this loan.
• Enabling a borrower to acquire an equity interest in another business.

Alliance for Water Efficiency October 2012
-23-
Review Criteria
• Financial stability and creditworthiness of the qualified company.
• Credit history of the primary owners, if not a publically held company.
• Three (3) years of the borrower’s audited, reviewed, or compiled financial statements.
• Personal financial statements of the corporation’s owners, if needed.
• Owner’s financial investment in the project beyond the loan amount.
Applicable Sector
Industrial users of public water systems.
Minimum Loan Amount: $25,000
Maximum Loan Amount: $300,000 (pilot)
Application Fee: $250
Proposed Rate: 0.0% up to $250,000; 1.0% $250,000 and higher
(The Prime Rate is currently 3.25%; smaller credit-worthy borrowers can borrow at banks at 2.0% - 4.0% over
prime for business loans.)
Amortization: Maximum loan repayment term not to exceed the calculated payback period
(determined by total project costs divided by annual reduction in water and
wastewater costs) plus one year, or 7 years, which ever is less.
Legal Fees: The applicant will be responsible for associated legal fees.
Collateralization: Machinery and fixtures will be collateralized at cost less straight-line
depreciation. The lender will hold a first lien to protect against loan default or
bankruptcy.
Possible Funding Sources: GLPF endowment, CERES, foundations, state programs, Federal grants.
Pilot Budget: $6,000,000 funded as needed (assuming 5 applicant users). As a revolving
fund, as existing loan balances get paid down, the funds get reinvested along
with additional available funds in an endowment using the “Prudent Man”
rule of investing.
Fund Administration: The fund will be administered by a lending agent with trust powers. It will
service the loan, maintain records of payments and balances, remit payments
to the revolving fund, and provide mediation and conflict resolution services
to bring delinquent loans back into compliance. For pilot purposes the loan
administrator/servicer could be a regional bank with trust powers, but it will
need the capacity to provide service on a national scale if the program is
implemented and expanded to include the entire United States.

Alliance for Water Efficiency October 2012
-24-
CONCLUSIONS AND RECOMMENDATIONS
1. Significance of Benefits. Even in a region as water rich as the Great Lakes basin, the benefits of water
conservation appear to be meaningful across a range of areas, including supply reliability, reduced pumping,
and reduced treatment. Large-scale industrial water conservation efforts should be pursued across the
nation, regardless of regional water scarcity, but care must be taken to ensure the viability of the affected
water utilities.
2. Untapped Opportunities. This project assessed only five industries using public water supply and wastewater
services. Other high-water-use industries, such as food processing, dairies, cheese making, meatpacking,
concrete batching, and pharmaceuticals, should be explored and assessed as well.
3. Protected Wastewater Stream. Filtering, treating, and re-using water on site not only reduces water
consumption; in some instances, it can also remove dissolved and suspended solids and BOD from the
wastewater stream.
4. Explore Areas with the Potential to Have the Greatest Impact. While the benefits of conservation are
apparent everywhere, they are most profound in areas with stressed supplies, especially where utilities draw
water from and release water to streams or aquifers. The red hash marks on this map show the three most-
stressed watersheds in each of the Great Lakes States.
Source: Great Lakes Commission’s “Value of Great Lakes Water Initiative”
5. Explore Utility Territories with the Greatest Potential Benefit from Conservation. Since some utilities will
realize greater benefits from large-scale industrial water conservation efforts than others, those are the
utilities that should be targeted in subsequent efforts. Specifically, these are utilities in either water-stressed
areas or those experiencing rapid growth. The environmental benefits will have value to all regions, but not
equally.
6. Storm water Capture. Capturing and using rainwater on site requires minimal treatment and may be used for
cooling towers, irrigation, or floor washing. This practice not only reduces the need for treated water, it also
provides additional protection from storm surges and combined sewer overflow events. This practice is now a
recognized Best Management Practice in the new EPA storm water programs.
7. Funding Details. In addition to securing a source of dollars for the revolving fund, work also needs to be
done to determine how to assess and fund those measures that balance financial return with benefits to the
environment.

Alliance for Water Efficiency October 2012
-25-
APPENDIX 1: CUMULATIVE WATER SAVINGS OVER A 20-YEAR LIFE
Plastics CompounderTotal Possible Savings Gallons
Cost of
Measures
$ Savings
per year
Payback
in Years
Annual
ROILife-span
Lifecycle Savings
gallonsLifecycle $ Savings
2,147,226 $5,250 $18,037 0.29 344.80% 20 42,944,520 $360,740
ManufactureTotal Possible Savings Gallons
Cost of
Measures
$ Savings
per year
Payback
in Years
Annual
ROILife-span
Lifecycle Savings
gallonsLifecycle $ Savings
Test Lab 43,800,000 $60,000 $110,000 0.55 181.80% 20 876,000,000 $2,200,000
Fixtures and Cafeteria 3,926,000 $60,000 $18,168 3.3 30.30% 20 78,520,000 $363,360
TOTAL 954,520,000 $2,563,360
Metal PlaterRectifier Total Possible Savings Gallons
Cost of
Measures
$ Savings
per year
Payback
in Years
Annual
ROILife-span
Lifecycle Savings
gallonsLifecycle $ Savings
3,000,000 $31,000 $12,500 2.5 – 3.5 33.30% 20 60,000,000 $250,000
Leather Tannery
Total Possible Savings Gallons Cost of
Measures
$ Savings
per year
Payback
in Years
Annual
ROI
Life-span Lifecycle Savings
gallons
Lifecycle $ Savings
11,000,000 $50,000 $21,800 2.3 43.40% 20 220,000,000 $436,000
Brewer
` Annual Water Savings (Gals)Cost of
Measure
$ Savings
per year
Payback
in Years
Annual
ROILife-span
Lifecycle Savings
gallonsLifecycle $ Savings
Reduce manual CIP on
vessels*30,000 $0 $130 0 NA 20 600,000 $2,600
Fermentation foam
release*1,800,000 $500 $7,722 0.1 1000% 20 36,000,000 $154,440
Water broom floor clean* 100,000 $500 $429 1.2 83.30% 20 2,000,000 $8,580
Capture/use steam
condensate*300,000 $0 $1,287 0 NA 20 6,000,000 $25,740
Reuse wash and lube
water in bottling*300,000 $7,500 $1,287 5.8 17.20% 20 6,000,000 $25,740
Wort line purge reuse 5,000 $100 $21 4.8 20.80% 20 100,000 $320
TOTAL 66,408,226 50,700,000 $217,420
Total for 5 Industrial Sites 1,328,164,520 $3,827,520
Total number of related
industries 989
Potential annual surface
water and wastewater
savings 23,000,000,000Potential annual ground
water and wastewater
savings 5,000,000,000
Annual Impact
Life-span
Impact
Kilowatt hours saved
related to surface water
and wastewater pumping
and treatment (adjusted
down by approximately
25%)25,000,000 500,000,000
Kilowatt hours saved
related to ground water
and wastewater pumping
and treatment (adjusted
down by approximately
25%)6,000,000 120,000,000
Total emissions impacts
related to surface water
and wastewater pumping
CO2 40,000,000 800,000,000
SO2 170,000 3,400,000
Annual NOx 55,000 1,100,000
Ozone season NOx 40,000 800,000
HG 0.7 14
CH4 700 14,000
N2O 600 12,000
Total emissions impacts
related to ground water
and wastewater pumping
CO2 11,000,000 220,000,000
SO2 48,000 960,000
NOx 15,000 300,000
Ozone season NOx 11,000 220,000
HG 0.25 5
CH4 200 4,000
N2O 180 3,600
Alliance for Water Efficiency October 2012
-26-
APPENDIX 2: MARKETING FLYER