Final Project Report -...
9
Recycling Engineered Timber from Office Strip-Out Final Project Report July – December 2016 Centre for Sustainable Materials Research and Technology, UNSW Australia Edge Environment Funded by: City of Sydney Council
Transcript of Final Project Report -...

Recycling Engineered Timber
from Office Strip-Out
Final Project Report
July – December 2016
Centre for Sustainable Materials Research and Technology, UNSW Australia
Edge Environment
Funded by: City of Sydney Council

1 | P a g e
Executive Summary The main goal of this project is transferring waste materials (wood waste from office furniture) into resources for the developing of a new generation of high performance engineered wood-plastic composite for building, furniture and architectural applications. By demonstrating cost-effective, innovative solution, this project has developed new manufacturing process that absorb waste furniture from refurbishing offices to deliver immediate economic and environmental benefits, in Australia and beyond. The uptakes of waste as an input for manufacturing reduces costs for industries, improving Australia’s competitiveness, and reduce pressures on landfills, alleviating risks such as toxic leaching, and on virgin raw materials, with associated savings in emissions and costs associated. In this study three different wood waste from demolished offices’ furniture which sources locally by Edge Environment has been examined for producing new generation of high performance engineered wood-plastic composite. Two set of panels with 70/30 and 60/40wt% ratio has been produced by hot compression technique. The obtained panels were cut to required dimensions for 3-point bending tests which were performed using Intron Bucks Instrument. Also 24h water absorption test has been performed on the samples. The mechanical performance and moisture absorbency as function of waste wood type and its ratio has been reported. Results indicating these novel engineered wood-plastic composites efficiently achieved an overall performance according to ISO 16893:2016 International Standards. These wood-plastic composite has the potential for tailoring their different parameters which can be improved further for development of high mechanical performance prototypes (load bearing). All the calculations were performed under the reference of ASTM D1037-12 and ISO 16893.

2 | P a g e
1. Wood Waste samples: Three main waste furniture panels have been provided by Edge Environment as following:
a) Particle board 1
Fig 1. Wood waste which was provided by Edge Environment as the first batch of source
b) Particle board 2
Fig 2. Wood waste which was provided by Edge Environment as the first batch of source
c) MDF
Fig 2. Wood waste which was provided by Edge Environment as the first batch of source

3 | P a g e
1.1. Chemical composition of wood sources Table 1 shows the percentage of different elements in each wood source and table 2 represent the water extraction for each samples and their chemical composition. All the chemical composition are in the standard range and are ok according to Australian standard to use as production for panels. Table 1. Chemical composition for each sample
Element Particle board 1 (mg/kg)
Particle board 2 (mg/kg)
MDF (mg/kg)
MDL* Limit Australia/Europe
(mg/kg)
Limit Germany (mg/kg)
Uncontaminated (mg/kg)
Al 53 61.0 250.4 5.0 - - - As 0.03 0.003 0.041 0.2 25 2 0.1-1 B 3.17 1.70 4.55 5.0 - - - Ba 17.73 0.61 2.31 5.0 - - - Ca 832 762 582 5.0 - - - Cl 83.8 63.79 36.1 10.0 1000 600 - Co n.a. 2.7 7.2 5.0 - - - Cr 0.96 0.3 1.4 5.0 25 30 1-10 Cu 1.38 0.7 1.7 5.0 40 20 0.1-1 Fe 87.2 25.4 199 5.0 - - - K 337 740 547 5.0 - - - Mg 176 227 189 5.0 - - - Mn 24.97 31 35.8 5.0 - - - Na 230 166 264 5.0 - - - P 33.9 77 47.8 5.0 - - - Pb 6.86 0.04 0.28 0.5 90 30 - Rb n.a. 1.65 0.84 0.5 - - - S 121.7 357.5 105.2 5.0 - - - Si 23.4 31.5 240.7 5.0 - - - Sr 5.85 4.2 3.7 5.0 - - - Se n.a. 0.092 0.072 0.2 - - - V 0.32 0.039 0.106 0.5 - - - W 1.71 2.4 5.53 5.0 - - - Zn 22.38 3.891 6.68 5.0 - - - Hg 0.03 0.025 0.05 0.2 - - - Ti 6.51 n.a. n.a 0.5 - - -
* MDL-Method detection limit is the lowest concentration at which an element can be detected in a sample
with 99% certainty. n.a: not detected, less than MDL
Table 2. Ion chromatograph results (water extract)
Sample
Fluoride F
Chloride Cl
Nitrite NO2
Bromide Br
Nitrate NO3
Phosphate PO4
Sulfate SO4
mg/kg mg/kg mg/kg mg/kg mg/kg mg/kg mg/kg Particle board 1
n.a 83.8 n.a n.a 161 n.a 74.9
Particle board 2
n.a 63.79 n.a n.a n.a n.a 880.0
MDF n.a 36.1 n.a n.a n.a 155.6 132.65 MDL* 10.0 10.0 10.0 10.0 10.0 10.0 10.0
* MDL-Method detection limit is the lowest concentration at which an element can be detected in a sample
with 99% certainty. n.a: not detected, less than MDL
4 | P a g e
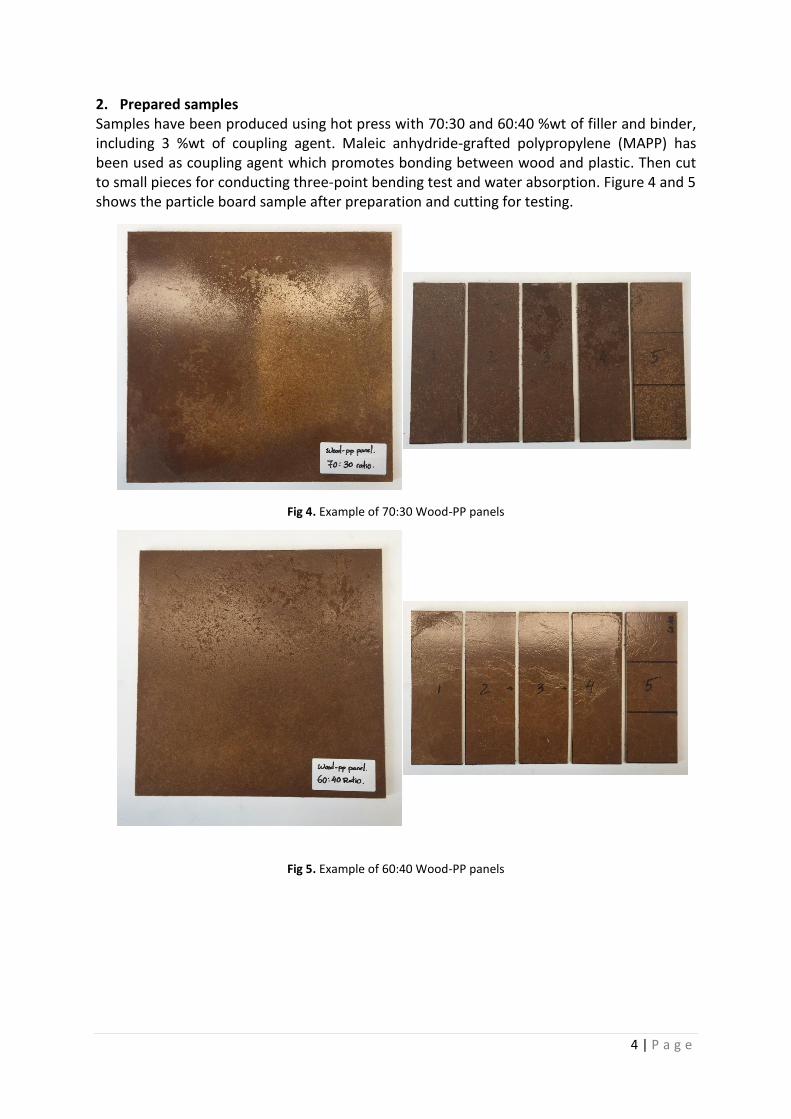
2. Prepared samples Samples have been produced using hot press with 70:30 and 60:40 %wt of filler and binder, including 3 %wt of coupling agent. Maleic anhydride-grafted polypropylene (MAPP) has been used as coupling agent which promotes bonding between wood and plastic. Then cut to small pieces for conducting three-point bending test and water absorption. Figure 4 and 5 shows the particle board sample after preparation and cutting for testing.
Fig 4. Example of 70:30 Wood-PP panels
Fig 5. Example of 60:40 Wood-PP panels

5 | P a g e
3. Testing 3.1. Three point bending test using Instron
Figure 6 shows the three point bending set-up and tests which was done according to ASTM D1037-12 for calculating the mechanical strength. Figure 7 shows the samples after test.
Fig 6. (a) Specimen before subjected to load (b) Specimen calibrated to balanced gauge length and
zero load (c) Specimen at load during the 3-point bending test using Instron
Fig 7. Samples after three point bending test
(a)
(b) (c)

6 | P a g e
3.2. Water absorption test
Water absorption test was conducted for 24h according to ISO 16893 test. Figure 8 shows the test set-up for this experiment.
Fig 8. Samples of 70/30 and 60/40 panels were immersed in water container for studies
4. Results
On table 3 the values of the test results for particleboard 1 and 2, MDF and a mix blend (50
%wt from particleboard 2 and 50 %wt of MDF) are summarized.
Table 3. Summary of mechanical and water tests results
Panel MOR (MPa) MOE (GPa) WA(%) TS(%)
60/40 70/30 60/40 70/30 60/40 70/30 60/40 70/30
PB1 13.1 12.1 1.95 1.91 17.5 20.1 1.2 1.4
PB2 13.1 - 1.93 - 17.73 - 1.1 -
MDF 14.8 - 1.93 - 19.01 - 1.7 -
Mix 17.3 14.5 2.02 1.8 17.23 18.8 0.9 1.6
*(MOR) Modulus of Rupture; (MOE) Modulus of Elasticity; (WA) Water Absorption; (TS) Thickness swelling
From these results the mix board samples with 60/40 %wt achieved the highest values for mechanical performance as well as for thickness swelling; 17.3 MPa, 2.02 GPa and 0.9 % respectively. This preliminary information indicates the combination of wood particles with different geometry and micro structure improved the overall performance of the final panel. Please see the standard value according to ISO 16893:2016 in the next page. 5. Conclusions
The recovery of waste wood panels into new wood polymer mixed blends it is a viable route
for a potential low-cost, high-value end-product. The formulation of these blends can be
optimized further for specific applications and industry requirements.

7 | P a g e
Standard tables according to ISO16893:2016

8 | P a g e