Final Progress Report of a 12 month Long-Term Bat ... · - For the proposed Inyanda Roodeplaat Wind...
79
1 Final Progress Report of a 12 month Long-Term Bat Monitoring Study - For the proposed Inyanda Roodeplaat Wind Energy Facility near Uitenhage, Eastern Cape Province Compiled by: Carel Malouf & Werner Marais Reviewed by: Monika Moir & Werner Marais February 2016 (Revised March 2016)
Transcript of Final Progress Report of a 12 month Long-Term Bat ... · - For the proposed Inyanda Roodeplaat Wind...

1
Final Progress Report of a 12 month Long-Term Bat Monitoring Study
- For the proposed Inyanda Roodeplaat Wind Energy Facility near
Uitenhage, Eastern Cape Province
Compiled by: Carel Malouf &
Werner Marais
Reviewed by: Monika Moir &
Werner Marais
February 2016
(Revised March 2016)
2
PREPARED FOR:
Vulisango Holdings
by
CK 2009/057469/23
P.O. Box 6892 Weltevredenpark
Gauteng 1715
+27 78 190 3316
www.animalia-consult.co.za
Ref: R-1503-10

3
Appointment of Specialist
Specialist Company: Animalia Zoological & Ecological Consultation CC
Fieldwork conducted
by:
Werner Marais & Chantal Kruger & Carel Malouf
Report done by: Carel Malouf
Overseen/reviewed
by:
Werner Marais
Appointed by: Vulisango Holdings
For: 12 Month pre-construction bat activity monitoring
Independence:
Animalia Zoological & Ecological Consultation CC has no connection with the developer.
Animalia Zoological & Ecological Consultation CC is not a legal or financial subsidiary of the
developer; remuneration for services by the developer in relation to this proposal is not
linked to approval by decision-making authorities responsible for permitting this proposal
and the consultancy has no interest in secondary or downstream developments as a result
of the authorization of this project.
Applicable Legislation:
Legislation dealing with biodiversity applies to bats and includes the following:
NATIONAL ENVIRONMENTAL MANAGEMENT: BIODIVERSITY ACT, 2004 (ACT 10 OF 2004;
Especially sections 2, 56 & 97)
The act calls for the management and conservation of all biological diversity within South
Africa. Bats constitute an important component of South African biodiversity and therefore
all species receive additional attention to those listed as Threatened or Protected.

4
TABLE OF CONTENTS
1 OBJECTIVES AND TERMS OF REFERENCE FOR PRECONSTRUCTION STUDY ................... 8
2 INTRODUCTION ......................................................................................................... 8
2.1 The Bats of South Africa ...................................................................................... 9
2.2 Bats and Wind Turbines .................................................................................... 10
3 METHODOLOGY ....................................................................................................... 12
3.1 Site Visits .......................................................................................................... 13
3.2 Assumptions and Limitations ............................................................................ 15
4 RESULTS AND DISCUSSION ....................................................................................... 16
4.1 Land Use, Vegetation, Climate and Topography................................................. 16
4.2 Literature Based Species Probability of Occurrence ........................................... 20
4.3 Ecology of bat species that may be largely impacted by the Roodeplaat WEF .... 27
4.4 Transects .......................................................................................................... 29
4.4.1 Second Site Transects ................................................................................. 29
4.4.2 Third Site Transects .................................................................................... 31
4.4.3 Fourth Site Transects .................................................................................. 32
4.4.4 Fifth Site Transects ..................................................................................... 34
4.5 Sensitivity Map ................................................................................................. 36
4.6 Passive Data ..................................................................................................... 41
4.6.1 Abundances and Composition of Bat Assemblages ..................................... 41
4.6.2 Temporal Distribution ................................................................................ 48
4.6.3 Relation between Bat Activity and Weather Conditions .............................. 64
5 PROPOSED MITIGATION MEASURE DETAILS ............................................................. 65
6 MITIGATION SCHEDULE ........................................................................................... 67

5
7 IMPACT ASSESSMENT OF PROPOSED WEF ON BAT FAUNA ....................................... 70
7.1 Construction phase ........................................................................................... 70
7.2 Operational phase ............................................................................................ 71
8 OPERATIONAL MONITORING PRELIMINARY METHODOLOGY OUTLINE ..................... 72
8.1 Introduction ..................................................................................................... 72
8.2 Methodology .................................................................................................... 72
8.2.1 Acoustic monitoring ................................................................................... 72
8.2.2 Carcass searches ........................................................................................ 73
8.3 Wind turbine mitigation .................................................................................... 73
8.4 Deliverables ...................................................................................................... 73
9 CONCLUSION ........................................................................................................... 75
10 REFERENCES ......................................................................................................... 76

6
Figure 1: Map overview of the proposed Roodeplaat WEF turbine layout.

7
Figure 2: Overview of the passive monitoring systems on the Roodeplaat WEF.

1 OBJECTIVES AND TERMS OF REFERENCE FOR PRECONSTRUCTION STUDY
Study bat species assemblage and abundance on the site.
Study temporal distribution of bat activity across the night as well as the four
seasons of the year in order to detect peaks and troughs in activity.
Determine the weather range in which bats are mostly active.
Develop long-term baseline data for use during operational monitoring.
Identify which turbines need to have special attention with regards to bat
monitoring during the operational phase and identify if any turbines occur in
sensitive areas and need to be shifted into less sensitive areas or removed from the
layout.
Detail the types of mitigation measures that are possible if bat mortality rates are
found to be unacceptable, including the potential times/circumstances which may
result in high mortality rates.
2 INTRODUCTION
This is the final progress report for a twelve-month bat monitoring study at the proposed
Roodeplaat Wind Energy Facility near Uitenhage, Eastern Cape.
Three factors need to be present for most South African bats to be prevalent in an area:
availability of roosting space, food (insects/arthropods or fruit), and accessible open water
sources. The importance of these factors can vary greatly between bat species, their
respective behaviour and ecology. Nevertheless, bat activity, abundance and diversity are
likely to be higher in areas supporting all three above-mentioned factors.
The site is evaluated in terms of the amount of surface rock (possible roosting space),
topography (influencing surface rock in most cases), vegetation (possible roosting spaces
and foraging sites), climate (can influence insect numbers and availability of fruit), and
presence of surface water (influences insects and acts as a source of drinking water) to
identify bat species that may be impacted by wind turbines. This evaluation is done chiefly
by studying the geographic literature of each site, available satellite imagery and
observations during site visits. Species probability of occurrence, based on the above-
mentioned factors, is estimated for the site and the surrounding larger area (see Section
4.2).
General bat diversity, abundance and activity are determined by the use of bat detectors. A
bat detector is a device capable of detecting and recording the ultrasonic echolocation calls
of bats which may then be analysed with the use of computer software. A real time
expansion type bat detector records bat echolocation in its true ultrasonic state which is
then effectively slowed down 10 times during data analysis. Thus the bat calls become

9
audible to the human ear, but still retain all of the harmonics and characteristics of the call
from which bat species with characteristic echolocation calls can be identified. Although this
type of bat detection equipment is advanced technology, it is not necessarily possible to
identify all bat species by just their echolocation calls. Recordings may be affected by the
weather conditions (i.e. humidity) and openness of the terrain (bats may adjust call
frequencies). The range of detecting a bat is also dependent on the volume of the bat call.
Nevertheless it is a very accurate method of recording bat activity.
2.1 The Bats of South Africa
Bats form the Order Chiroptera and are the second largest group of mammals after rodents
(Rodentia). They are the only mammals to have developed true powered flight and have
undergone various skeletal changes to accommodate this. The forelimbs are elongated,
whereas the hind limbs are compact and light, thereby reducing the total body weight. This
unique wing profile allows for the manipulation of wing camber and shape, facilitating
functions such as agility and manoeuvrability. This adaptation surpasses the static design of
the bird wings in function and enables bats to utilize a wide variety of food sources,
including, but not limited to, a large diversity of insects (Neuweiler 2000). Species-based
facial features may differ considerably as a result of differing life histories – particularly as a
result of the various foraging and echolocation strategies evident among bats. Most South
African bats are insectivorous and are capable of consuming vast quantities of insects on a
nightly basis (Taylor 2000, Tuttle and Hensley 2001) however, they have also been found to
feed on amphibians, fruit, nectar and other invertebrates (e.g. spiders and scorpions). As a
result, insectivorous bats are the predominant predators of nocturnal flying insects in South
Africa and contribute greatly to the suppression of these numbers. Their prey also includes
agricultural pests such as moths and vectors for diseases such as mosquitoes (Rautenbach
1982, Taylor 2000).
Urban development and agricultural practices have contributed to the deterioration of bat
populations on a global scale. Public participation and funding of bat conservation are often
hindered by negative public perceptions and unawareness of the ecological and economic
value of bats. Some species choose to roost in domestic residences, causing disturbance and
thereby decreasing any esteem that bats may have established. Other species may occur in
large communities in buildings, posing as a potential health hazard to residents in addition
to their nuisance value. Unfortunately, the negative association with bats obscures their
importance as an essential component of ecological systems and their value as natural pest
control agents, which actually serves as an advantage to humans.
Many bat species roost in large communities and congregate in small areas. Therefore, any
major disturbances within and around the roosting areas may adversely impact individuals
of different communities within the same population (Hester and Grenier 2005). Secondly,

10
nativity rates of bats are much lower than those of most other small mammals. This is
because, for the most part, only one or two pups are born per female per annum.
Moreover, according to O’Shea et al. (2003), bats may live for up to 30 years thereby
limiting the number of pups born due to this increased life expectancy. Under natural
circumstances, a population’s numbers may accumulate over long periods of time. This is
due to the longevity and the relatively low predation of bats when compared to other small
mammals. However, in contrast the relatively low reproduction rates of bats results in
populations having a low recovery rate from mass mortalities and major roost disturbances.
2.2 Bats and Wind Turbines
Although most bats are highly capable of advanced navigation through the use of
echolocation and excellent sight, they are still at risk of physical impact with the blades of
wind turbines. The corpses of bats have been found in close proximity to wind turbines and,
in a case study conducted by Johnson et al. (2003), were found to be directly related to
collisions. The incident of bat fatalities for migrating species has been found to be directly
related to turbine height, increasing exponentially with altitude, as this disrupts the
migratory flight paths (Howe et al. 2002; Barclay et al. 2007). Although the number of
fatalities of migrating species increased with turbine height, this correlation was not found
for increased rotor sweep (Howe et al. 2002; Barclay et al. 2007). In the USA it was
hypothesized that migrating bats may navigate without the use of echolocation, rather using
vision as their main sense for long distance orientation (Johnson et al. 2003, Barclay et al.
2007). Bat mortalities due to turbines have been attributed to be caused by direct impact
with the blades and by barotrauma (Baerwald et al. 2008). Barotrauma is a condition where
low air pressure found around the moving blades of wind turbines, causes the lungs of a bat
to collapse, resulting in fatal internal haemorrhaging (Kunz et al. 2007). Rollins et al. (2012)
carried out a histopathological study to assess whether direct collision or barotrauma was
the major cause of mortality. They found an increased incidence of fractures, external
lacerations and features of traumatic injury (diaphragmatic hernia, subcutaneous
hemorrhage, and bone marrow emboli) in bats killed at wind farms. 73% of bats had lesions
consistent with traumatic injury whereas there was a 20% incidence of ruptured tympana, a
sensitive marker of barotrauma in humans. Thus the data of this study strongly suggests
that traumatic injury from direct collision with turbine blades was the major cause of bat
mortality at wind farms and barotrauma is a minor etiology.
Additionally, it has been hypothesized that barotrauma causes mortality only if the bat is
within a very short distance of the turbine blade tip such that collision with the blades is a
much more likely cause of death.

11
A study conducted by Arnett (2005) recorded a total of 398 and 262 bat fatalities in two
surveys at the Mountaineer Wind Energy Centre in Tucker County, West Virginia and at the
Meyersdale Wind Energy Centre in Somerset County, Pennsylvania, respectively. These
surveys took place during a 6 week study period from 31 July 2004 to 13 September 2004. In
some studies, such as that taken in Kewaunee County (Howe et al. 2002), bat fatalities were
found to exceed bird fatalities by up to three-fold.
Although bats are predominately found roosting and foraging in areas near trees, rocky
outcrops, human dwellings and water, in conditions where valleys are foggy, warmer air is
drawn to hilltops through thermal inversion which may result in increased concentrations of
insects and consequently bats at hilltops, where wind turbines are often placed (Kunz et al.
2007). Some studies (Horn et al. 2008) suggest that bats may be attracted to the large
turbine structure as roosting spaces or that swarms of insects may get trapped in low
pressure air pockets around the turbine, also encouraging the presence of bats. The
presence of lights on wind turbines have also been identified as possible causes for
increased bat fatalities for non-cave roosting species. This is thought to be due to increased
insect densities that are attracted to the lights and subsequently encourage foraging activity
of bats (Johnson et al. 2003). Clearings around wind turbines, in previously forested areas,
may also improve conditions for insects, thereby attracting bats to the area and the
swishing sound of the turbine blades has been proposed as possible sources for disorienting
bats (Kunz et al. 2007). Electromagnetic fields generated by the turbine may also affect bats
which are sensitive to magnetic fields (Kunz et al. 2007). It could also be hypothesized, from
personal observations that the echolocation capabilities of bats are designed to locate
smaller insect prey or avoid stationary objects, and may not be primarily focused on the
detection of unnatural objects moving sideways across the flight path.
Whatever the reason for bat fatalities in relation to wind turbines, it is clear that this is a
grave ecological problem which requires attention. During a study by Arnett et al. (2009), 10
turbines monitored over a period of 3 months showed 124 bat fatalities in South-central
Pennsylvania (America), which can cumulatively have a catastrophic long term effect on bat
populations if this rate of fatality continues. Most bat species only reproduce once a year,
bearing one young per female, therefore their numbers are slow to recover from mass
mortalities. It is very difficult to assess the true number of bat deaths in relation to wind
turbines, due to carcasses being removed from sites through predation, the rate of which
differs from site to site as a result of habitat type, species of predator and their numbers
(Howe et al. 2002; Johnson et al. 2003). Mitigation measures are being researched and
experimented with globally, but are still only effective on a small scale. An exception is the
implementation of curtailment processes, where the turbine cut-in speed is raised to a
higher wind speed. This relies on the principle that the prey of bats will not be found in
areas of strong winds and more energy is required for the bats to fly under these conditions.
It is thought, that by the implementation of such a measure, that bats in the area are not

12
likely to experience as great an impact as when the turbine blades move slowly in low wind
speeds. However, this measure is currently not effective enough to translate the impact of
wind turbines on bats to a category of low concern.
3 METHODOLOGY
Bat activity has been monitored using active and passive bat monitoring techniques. Active
monitoring has been done through site visits with transects made throughout the site with a
vehicle-mounted bat detector. Passive detection has been performed with the mounting of
passive bat monitoring systems placed on three monitoring masts on site. Specifically, one
short 10m mast and two meteorological masts (Figure 2).
The monitoring systems consisted of SM2BAT time expansion bat detectors that were
powered by 12V, 18Ah, sealed lead acid batteries and 20W solar panels that provided
recharging power to the batteries. Each system also had an 8 amp low voltage protection
regulator and SM2PWR step down transformer. Four SD memory cards, class 10 speed, with
a capacity of 32GB each were utilized within each SM2BAT detector; this was to ensure
substantial memory space with high quality recordings even under conditions of multiple
false wind triggers.
One weatherproof ultrasound microphone was mounted at a height of 10 meters on the
short mast, while two microphones were mounted at 10m and 50m on each of the
meteorological masts. These microphones were then connected to the SM2BAT bat
detectors.
Each detector was set to operate in continuous trigger mode from dusk each evening until
dawn (times were correlated with latitude and longitude). Trigger mode was the setting for
a bat detector in which any frequency which exceeds 16 kHz and -18dB will trigger the
detector to record for the duration of the sound and 500ms after the sound has ceased, this
latter period is known as a trigger window. All signals were recorded in WAC0 lossless
compression format. The table below summarizes the above-mentioned equipment setup.

13
3.1 Site Visits
Site visit dates First Visit 3 – 5 & 18 July 2013
Second Visit 6 – 10 October 2013
Third Visit 6 - 10 February 2014
Fourth Visit 27 – 31 May 2014
Fifth Visit 14 – 18 July 2014
Met mast passive bat detection systems
Quantity on site 2
Microphone heights
10m; 50m
Short mast passive bat detection systems
Quantity on site 1
Microphone height
10m
Replacements/ Repairs/ Comments
First site visit The microphones were mounted such that they pointed approximately 30 degrees downward to avoid excessive water damage. Crows have been found to peck at microphones and subsequently destroying them. Hence, measures were taken for protection against birds, without noticeably compromising effectiveness.
The bat detectors were installed within their weatherproof containers and all peripherals attached.
Monitoring at 50m height will provide an assessment of the bat activity occurring within rotor-sweep height.
Second site visit All the systems were fully operational apart from the short mast that had a microphone failure and as such the microphone had to be replaced. Also the battery on Met mast 2 was replaced with a stronger battery.
Third site visit All systems were fully operational.
Fourth site visit All systems were fully operational.
Fifth site visit All systems were fully operational.
Type of bat detector SM2BAT, Real Time Expansion (RTE) type
Recording schedule Each detector was set to operate in continuous trigger mode from dusk each evening until dawn (times were automatically adjusted in relation to latitude, longitude and season).
Trigger threshold >16KHz, -18dB
Trigger window (time of recording after trigger
500ms

14
ceased)
Microphone gain setting 36dB
Compression WAC0
Single memory card size (each systems uses 4 cards)
32GB
Battery size 18Ah; 12V
Solar panel output 20 Watts
Solar charge regulator 6 - 8 Amp with low voltage/deep discharge protection
Other methods Terrain was investigated during the day for roosting and foraging habitat.
Figure 3: SM2BAT+ detector with four 32 GB SDHC memory cards.

15
3.2 Assumptions and Limitations
Distribution maps of South African bat species still require further refinement such
that the bat species proposed to occur on the site (that were not detected) are
assumed accurate. If a species has a distribution marginal to the site it was assumed
to occur in the area. The literature based table of species probability of occurrence
may include a higher number of bat species than actually present.
The migratory paths of bats are largely unknown, thus limiting the ability to
determine if the wind farm will have a large scale effect on migratory species.
Attempts to overcome this limitation, however, will be made during this long-term
sensitivity assessment.
The satellite imagery partly used to develop the sensitivity map may be slightly
imprecise due to land changes occurring since the imagery was taken.
Species identification with the use of bat detection and echolocation is less accurate
when compared to morphological identification, nevertheless it is a very certain and
accurate indication of bat activity and their presence with no harmful effects on bats
being surveyed.
It is not possible to determine actual individual bat numbers from acoustic bat
activity data, whether gathered with transects or the passive monitoring systems.
However, bat passes per night are internationally used and recognized as a
comparative unit for indicating levels of bat activity in an area as well as a measure
of relative abundance.
Spatial distribution of bats over the study area cannot be accurately determined by
means of transects, although the passive systems can provide comparative data for
different areas of the site. Transects may still possibly uncover high activity in areas
where it is not necessarily expected and thereby increase insight into the site.
Exact foraging distances from bat roosts or exact commuting pathways cannot be
determined by the current methodology. Radio telemetry tracking of tagged bats is
required to provide such information if needed.
Costly radar technology is required to provide more quantitative data on actual bat
numbers as well as spatial distribution of multiple bats.

16
4 RESULTS AND DISCUSSION
4.1 Land Use, Vegetation, Climate and Topography
The existing impacts on the study area are very low with activity limited to wild game
farming and extremely sparse dispersion of buildings and residences. The roads in the area
are gravel.
The site occupies five vegetation units, namely Albany alluvial vegetation, Groot thicket,
Sundays thicket, Kouga sandstone fynbos and Kouga grassy sandstone fynbos (Figure 7). The
mean maximum and minimum temperatures are 37.7°C in January and -3.1°C in July.
The northern area of the site occupies a large area of Groot Thicket which forms part of the
Albany Thicket Biome (Figure 7). This biome is characterised by dense, woody, semi-
succulent and thorny vegetation with Portulacaria afra (Spekboom) abundant under
favourable conditions. Grass species are usually poorly developed with dominant stem and
leaf succulents. The soils on steeper slopes are derived from arenites and shales and range
from red, clayey soils to rocky soils. This unit is found between altitudes of 200m and
1100m. The vegetation unit is subjected to non-seasonal rainfall with a mean annual
precipitation of 290 mm. The Groot Thicket is considered Least threatened with about 11 %
conserved mainly in the Greater Addo Elephant National Park, Guerna Wilderness Area and
Baviaanskloof conservation area (Mucina & Rutherford, 2006).
A small band of Sundays Thicket separates the Groot Thicket from the Kouga Grassy
Sandstone Fynbos (Figure 7). Part of the Albany thicket biome, this unit is found at an
altitude of 0-800m. This unit is characterised by tall, dense thicket with many spinescent
species and trees, shrubs and succulents. Considered of Least concern, 19 % is protected in
National parks and private conservation areas as well as private game farms. When
degraded it resembles secondary thornveld or grassland (Mucina& Rutherford, 2006).
The lower southern area of the site occupies a vegetation unit of Kouga Grassy Sandstone
Fynbos that surrounds bands of Kouga Sandstone Fynbos. Both these units fall within the
Fynbos biome (Mucina & Rutherford, 2006). The substrate ranges between acidic lithosol
soils derived from sandstone of the Table mountain group and quartzitic sandstone of the
Witteberg group. Kouga Grassy Sandstone Fynbos is found at altitudes from 220m to 1220m
with a southerly aspect and is characterised by long, rounded mountain chains that range
from moderately steep to gently sloping. The high altitude slopes are dominated by low
fynbos with the intermediate slopes forming tall shrub stratum dominated by Proteaceae

17
shrubs (Mucina & Rutherford, 2006). The Kouga Sandstone Fynbos is found on the northern,
lower slopes and is characterised by low shrubland and grassland where soil leaching is less
severe. Both units are considered least threatened with 20% of Kouga Grassy Sandstone
Fynbos and 40% of Kouga Sandstone Fynbos conserved in wilderness areas and private
game farms. Annual precipitation ranges between 270-800mm with a mean of 567 mm and
shows a peak in March and October.
Albany Alluvial Vegetation occupies a small region in the northern area of the site (Figure 7).
This unit forms part of the Azonal Inland Vegetation and is part of the Albany Thicket biome,
with an altitude ranging from 20-1000m. There are two main types of vegetation patterns
observed in these zones, namely, riverine thicket and thornveld (Acacia natalitia). The
thornveld generally occurs inland on wide floodplains while riverine thicket occurs in narrow
floodplain zones. Soils usually have high clay content and alluvial deposits and can become
flooded during local storms. The temperatures experienced in the river valleys are often
higher than those experienced in the surrounding areas due to the exposed steep slopes.
This zone is considered endangered with only 6% conserved in National parks and private
conservation areas and more than half of the area has been transformed for cultivation,
urban development, road building and plantations.
Table 1: Potential of the vegetation to serve as suitable roosting and foraging spaces for bats.
Vegetation Unit Roosting
Potential
Foraging Potential Comments
Albany Alluvial
Vegetation
Moderate –
High
High The presence of trees and crevices
can provide roosting potential
while the watercourses can provide
water access and foraging area.
Sundays Thicket Moderate-
High
Moderate - High The trees and animal burrows have
roosting potential while the
vegetation provides foraging
potential for insectivorous bats.
Groot Thicket Moderate -
High
Moderate -High Trees and vegetation present in
kloof areas can provide good
roosting and foraging areas while
the flatter areas can provide

18
foraging areas for clutter foragers.
Kouga Grassy
Sandstone Fynbos
Low-Moderate Low on the high lying areas
Moderate on the low lying area
The vegetation and riparian areas
can provide foraging and roosting
habitat while the higher lying
regions can provide roosting
habitat.
Kouga Sandstone
Fynbos
Moderate –
high
Moderate to high Outcroppings and crevices found
on the slopes can provide roosting
potential while the shrubland can
provide foraging areas.

Page 19 of 79
Site boundary Albany Alluvial Vegetation
Sundays Thicket Groot Thicket
Kouga Grassy Sandstone Fynbos Kouga Sandstone Fynbos
Figure 4: Vegetation units present on the site (Mucina and Rutherford, 2006).

Page 20 of 79
4.2 Literature Based Species Probability of Occurrence
“Probability of Occurrence” is assigned based on consideration of the presence of roosting
sites and foraging habitats on the site, compared to literature described preferences. The
probability of occurrence is described by a percentage indicative of the expected numbers
of individuals present on site and the frequency with which the site will be visited by the
species (in other words the likelihood of encountering the bat species).
The column of “Likely risk of impact” describes the likelihood of risk of fatality from direct
collision or barotrauma with wind turbine blades for each bat species. The risk was assigned
by Sowler and Stoffberg (2014) based on species distributions, altitudes at which they fly
and distances they travel; and assumes a 100% probability of occurrence. The ecology of
most applicable bat species recorded in the vicinity of the site is discussed below.

Page 21 of 79
Table 2: Table of species that may be roosting or foraging on the study area, the possible site specific roosts, and their probability of
occurrence based on literature (Monadjem et al. 2010).
Species name Common
name
Probability of
Occurrence (%)
Conservation
Status
Possible roosting sites
occupied on site
Foraging habits
(indicative of possible
foraging areas on site)
Likely Risk of
Impact (Sowler
& Stoffberg,
2014)
Rousettus
aegyptiacus
Egyptian
rousette
bat
50 - 60 Least
concern
Presence of caves in the
larger mountainous area is
possible, however no
caves were found on the
site.
Feed mostly on. fruiting
trees in riparian areas,
highly unlikely to cross
over mountain tops.
Medium - High
Rhinolophus
capensis
Cape
horseshoe
bat
20 - 30 Near
threatened
Presence of caves in the
larger mountainous area is
possible, however no
caves were found on the
site.
Clutter forager feeding
predominantly on
Coleoptera and
Lepidoptera. Most
probable in valley areas.
Low
Rhinolophus
clivosus
Geoffroy’s
horseshoe
bat
40 - 50 Least
concern
Roosts gregariously in
caves and mine adits, no
known caves close to the
study site, but possible.
Establish feeding stations
during the night under
trees or the verandas of
houses. Clutter forager
Low

Page 22 of 79
But may also utilise any
other cavities in rock
formations as found on the
site, absent from low lying
areas, often found in
mountainous areas.
with a diet comprised
mainly of Lepidoptera
and Coleoptera. More
probable in cluttered
valley areas.
Taphozous
mauritianus
Mauritian
tomb bat
10 - 20 Least
concern
Roosts on rock faces, tree
trunks, walls favouring
sides in the shade. Males
and females roost
separately from one
another. Preferring open
habitats and avoiding
closed forest interior and
is dependent upon surface
water.
Open air forager feeding
on Lepidoptera,
Isopterans and
Coleoptera.
High
Nycteris
thebaica
Egyptian
slit-faced
bat
10 - 20 Least
Concern
Roosts during the day in
caves, burrows, culverts
and trunks of large trees.
Presence of caves in the
larger mountainous area is
possible, however no
Clutter forager. Diet
varies according to the
season between
Orthoptera,
Coleopteraand
Lepidoptera as well as a
Low

Page 23 of 79
caves were found on the
site. May prefer cluttered
habitats more. On edge of
distribution.
number of other insects
and arachnids.
Rhinolophus
swinnyi
Swinny’s
horseshoe
bat
10-20 Near
Threatened
Roosts in caves. Presence of caves in the larger mountainous area is possible, however no caves were found on the site. But also cavities, culverts.
Clutter forager that feeds
mainly on Lepidoptera
Low
Tadarida
aegyptiaca
Egyptian
free-tailed
bat
90 - 100 Least
concern
Roosts in caves, crevices,
hollow trees, buildings,
and any other suitable
crevices. Presence of caves
in the larger mountainous
area is possible, however
no caves were found on
the site.
Open-air forager with a
diet consisting mainly of
Diptera, Hemiptera,
Coleoptera and to some
extent Lepidoptera.
Strong flier that can
forage on the mountain
top.
High
Miniopterus
fraterculus
Lesser
long-
fingered
40 - 60 Least
concern Its distribution is
dependent upon the
availability of caves and is
Clutter edge forager,
feeding on Lepidoptera,
Diptera, Hemiptera and
Medium - High

Page 24 of 79
bat found in temperate areas.
Separate caves are used as
summer roosts and winter
hibernacula. Presence of
caves in the larger
mountainous area is
possible, however no
caves were found on the
site.
Coleoptera. May forage
on mountain top.
Miniopterus
natalensis
Natal long-
fingered
bat
90 - 100 Near
Threatened
Cave-dependent. Presence
of caves in the larger
mountainous area is
possible, however no
caves were found on the
site. But also utilises other
smaller hollows found on
site, where they from
small colonies or roost
individually.
Clutter-edge forager.
Feeds on a variety of
aerial prey including
Diptera, Hemiptera,
Coleoptera, Lepidoptera
and Isoptera. On edge of
distribution. May forage
on mountain top.
Medium - High
Neoromicia
capensis
Cape
serotine
90 - 100 Least
Concern
Roosts in bark of trees, at
the base of aloe leaves,
inside roofs, and other
Clutter-edge forager
feeding mainly on
Coleoptera, Hemiptera,
Medium - High

Page 25 of 79
suitable hollows/crevices. Lepidoptera and
Neuroptera. May be
found on mountain top.
Kerivoula
lanosa
Lesser
Woolly bat
10- 20 Least
Concern
Little is known of this
species but is thought to
roost in riparian areas
It is a clutter forager. No
information is available
on its diet
Low
Epomophorus
wahlbergi
Wahlberg’s
Epauletted
Fruit bat
10-20 Least
Concern
Feeds on fruit, nectar,
pollen and flowers. Prefers
riparian areas, highly
unlikely to cross over
mountain tops.
They feed while hovering
or land on a branch next
to a fruit or flower
Medium-High
Scotophilus
dinganii
Yellow-
bellied
House Bat
10-20 Least
Concern
Roosts mainly in holes in
trees and roofs of houses.
It avoids open habitats
such as grasslands and
karoo
A clutter forager that
feeds mainly on medium-
sized Coleoptera as well
as Hemiptera,
Hymenoptera, Isoptera
and Diptera
Medium- High
Pipistrellus
hesperidus
Dusky
Pipistrelle
20-30 Least
Concern
Roosting areas are
associated with riparian
vegetation and forest
patches as well as crevices
It feeds on Coleoptera,
Hemiptera, Diptera, and
Lepidoptera
Medium

Page 26 of 79
formed from exfoliating
rock
Eptesicus
hottentotus
Long-tailed
serotine
90 - 100 Least
Concern
It is a crevice dweller
roosting in rock crevices,
and any other suitable
crevices found on site.
It seems to prefer
woodland habitats, and
has been caught in
granitic hills and near
rocky outcrops
Medium

Page 27 of 79
4.3 Ecology of bat species that may be largely impacted by the Roodeplaat WEF
There are three bat species recorded on site that commonly occur in the area due to their
probability of occurrence and widespread distribution. These species are of importance
based on their likelihood of being impacted by the proposed WEF, which is a combination of
abundance and behaviour. The relevant species are discussed below.
Miniopterus natalensis
Miniopterus natalensis, also commonly referred to as the Natal long-fingered bat, occurs
widely across the country but mostly within the southern and eastern regions and is listed
as Near Threatened (Monadjem et al. 2010).
This bat is a cave-dependent species and identification of suitable roosting sites may be
more important in determining its presence in an area than the presence of surrounding
vegetation. It occurs in large numbers when roosting in caves with approximately 260 000
bats observed making seasonal use of the De Hoop Guano Cave in the Western Cape, South
Africa. Culverts and mines have also been observed as roosting sites for either single bats or
small colonies. Separate roosting sites are used for winter hibernation activities and summer
maternity behaviour, with the winter hibernacula generally occurring at higher altitudes in
more temperate areas and the summer hibernacula occurring at lower altitudes in warmer
areas of the country (Monadjem et al. 2010).
Mating and fertilisation usually occur during March and April and is followed by a period of
delayed implantation until July/August. Birth of a single pup usually occurs between October
and December as the females congregate at maternity roosts (Monadjem et al. 2010 & Van
Der Merwe 1979).
The Natal long-fingered bat undertakes short migratory journeys between hibernaculum
and maternity roosts. Due to this migratory behaviour, they are considered to be at high
risk of fatality from wind turbines if a wind farm is placed within a migratory path (Sowler
and Stoffberg 2014). The mass movement of bats during migratory periods could result in
mass casualties if wind turbines are positioned over a mass migratory route and such
turbines are not effectively mitigated. Very little is known about the migratory behaviour
and paths of M. natalensis in South Africa with migration distances exceeding 150
kilometres. If the site is located within a migratory path the bat detection systems should
detect high numbers and activity of the Natal long-fingered bat.
A study by Vincent et al. (2011) on the activity and foraging habitats of Miniopteridae found
that the individual home ranges of lactating females were significantly larger than that of
pregnant females. It was also found that the bats predominately made use of urban areas
(54%) followed by open areas (19.8%), woodlands (15.5%) orchards and parks (9.1%) and

Page 28 of 79
water bodies (1.5%) when selecting habitats. Foraging areas were also investigated with the
majority again occurring in urban areas (46%); however a lot of foraging also occurred in
woodland areas (22%), crop and vineyard areas (8%), pastures, meadows and scrubland
(4%) and water bodies (4%).
Sowler and Stoffberg (2014) advise that M. natalensis faces a medium to high risk of fatality
due to wind turbines. This evaluation was based on broad ecological features and excluded
migratory information.
Neoromicia capensis
Neoromicia capensis is commonly called the Cape serotine and has a conservation status of
Least Concern as it is found in high numbers and is widespread over much of Sub-Saharan
Africa.
High mortality rates of this species due to wind turbines would be a cause of concern as N.
capensis is abundant and widespread and as such has a more significant role to play within
the local ecosystem than the rarer bat species. They do not undertake migrations and thus
are considered residents of the site.
It roosts individually or in small groups of two to three bats in a variety of shelters, such as
under the bark of trees, at the base of aloe leaves, and under the roofs of houses. They will
use most man-made structures as day roosts which can be found throughout the site and
surrounding areas (Monadjem et al. 2010).
They are tolerant of a wide range of environmental conditions as they survive and prosper
within arid semi-desert areas to montane grasslands, forests, and savannas; indicating that
they may occupy several habitat types across the site, and are amenable towards habitat
changes. They are however clutter-edge foragers, meaning they prefer to hunt on the edge
of vegetation clutter mostly, but can occasionally forage in open spaces. They are thought to
have a Medium-High likelihood of risk of fatality due to wind turbines (Sowler and Stoffberg
2014).
Mating takes place from the end of March until the beginning of April. Spermatozoa are
stored in the uterine horns of the female from April until August, when ovulation and
fertilisation occurs. They give birth to twins during late October and November but single
pups, triplets and quadruplets have also been recorded (van der Merwe 1994 & Lynch
1989).
Tadarida aegyptiaca
The Egyptian Free-tailed bat, Tadarida aegyptiaca, is a Least Concern species as it has a wide
distribution and high abundance throughout South Africa. It occurs from the Western Cape
of South Africa, north through to Namibia and southern Angola; and through Zimbabwe to

Page 29 of 79
central and northern Mozambique (Monadjem et al. 2010). This species is protected by
national legislation in South Africa (ACR 2010).
They roost communally in small (dozens) to medium-sized (hundreds) groups in rock
crevices, under exfoliating rocks, caves, hollow trees and behind the bark of dead trees. T.
aegyptiaca has also adapted to roosting in buildings, in particular roofs of houses
(Monadjem et al. 2010).
The Egyptian Free-tailed bat forages over a wide range of habitats, flying above the
vegetation canopy. It appears that the vegetation has little influence on foraging behaviour
as the species forages over desert, semi-arid scrub, savannah, grassland and agricultural
lands. Its presence is strongly associated with permanent water bodies due to concentrated
densities of insect prey (Monadjem et al. 2010).
The Egyptian Free-tailed bat is considered to have a High likelihood of risk of fatality by wind
turbines (Sowler and Stoffberg 2014). Due to the high abundance and widespread
distribution of this species, high mortality rates by wind turbines would be a cause of
concern as these species have more significant ecological roles than the rarer bat species.
The sensitivity maps are strongly informed by the areas that may be used by this species.
After a gestation of four months, a single pup is born, usually in November or December,
when females give birth once a year. In males, spermatogenesis occurs from February to
July and mating occurs in August (Bernard and Tsita 1995). Maternity colonies are
apparently established by females in November (Herselman 1980).
Several North American studies indicate the impact of wind turbines to be highest on
migratory bats, however there is evidence to the impact on resident species. Fatalities from
turbines increase during natural changes in the behaviour of bats leading to increased
activity in the vicinity of turbines. Increases in non-migrating bat mortalities around wind
turbines in North America corresponded with when bats engage in mating activity (Cryan
and Barclay 2009). This long term assessment also indicated if seasonal peaks occur in
species activity and bat presence.
4.4 Transects
Transects were not carried out over the first site visit.
4.4.1 Second Site Transects
The driven transect was done using a Wildlife Acoustics SM2BAT+ detector. The routes were
chosen randomly based on the condition of the roads and location at time of sunset.

Page 30 of 79
Table 3: Average weather conditions experienced during the driven transects.
Date Temperature Rain Wind Humidity
7 October 2013 16°C 0.0mm 14 km/h 77%
8 October 2013 20°C 0.0mm 11 km/h 80%
(Weather information taken from www.worldweatheronline.com for Uitenhage, EC)
Table 4: Distance and time frames of driven transect
Date Distance Duration Start End
7 October 2013 23.15 3 hrs 16 min 19:54 23:10
8 October 2013 24.14 3 hrs 51 min 18:20 22:11
Track traversed Tadarida aegyptiaca Neoromicia capensis Site boundary Miniopterus natalensis Turbines
Figure 5: Bat species detected during transects carried out over October 2013

Page 31 of 79
Three bat species were detected during transects, namely Neoromicia capensis, Miniopterus
natalensis and Tadarida aegyptiaca.
4.4.2 Third Site Transects
The driven transect was done using a Wildlife Acoustics EM3 detector. No data was
recorded as there was a problem with the audio jack of the EM3.
Track traversed Turbines Site boundary
Figure 6: Track driven during transects carried out over February 2014
Page 32 of 79
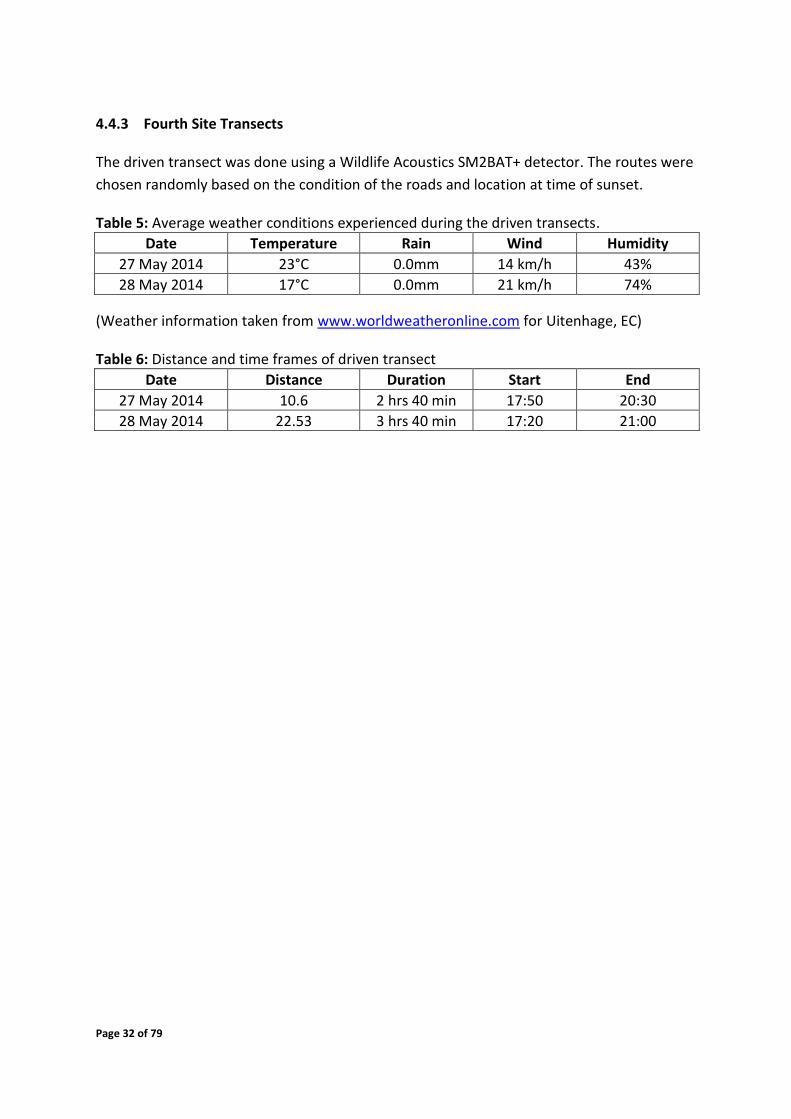
4.4.3 Fourth Site Transects
The driven transect was done using a Wildlife Acoustics SM2BAT+ detector. The routes were
chosen randomly based on the condition of the roads and location at time of sunset.
Table 5: Average weather conditions experienced during the driven transects.
Date Temperature Rain Wind Humidity
27 May 2014 23°C 0.0mm 14 km/h 43%
28 May 2014 17°C 0.0mm 21 km/h 74%
(Weather information taken from www.worldweatheronline.com for Uitenhage, EC)
Table 6: Distance and time frames of driven transect
Date Distance Duration Start End
27 May 2014 10.6 2 hrs 40 min 17:50 20:30
28 May 2014 22.53 3 hrs 40 min 17:20 21:00

Page 33 of 79
Track traversed Tadarida aegyptiaca Neoromicia capensis Site boundary Miniopterus natalensis Turbines
Figure 7: Bat species detected during transects carried out over May 2014

Page 34 of 79
4.4.4 Fifth Site Transects
The driven transect was done using a Wildlife Acoustics SM2BAT+ detector. The routes were
chosen randomly based on the condition of the roads and location at time of sunset.
Table 7: Average weather conditions experienced during the driven transects.
Date Temperature Rain Wind Humidity
16 July 2014 18°C 0.0mm 23 km/h 34%
(Weather information taken from www.worldweatheronline.com for Uitenhage, EC)
Table 8: Distance and time frames of driven transect
Date Distance Duration Start End
16 July 2014 43.2 3 hrs 40 min 17:50 20:30

Page 35 of 79
Track traversed Tadarida aegyptiaca Neoromicia capensis Site boundary Miniopterus natalensis Turbines
Figure 8: Transect routes wherein no bat activity was detected over July 2014.

Page 36 of 79
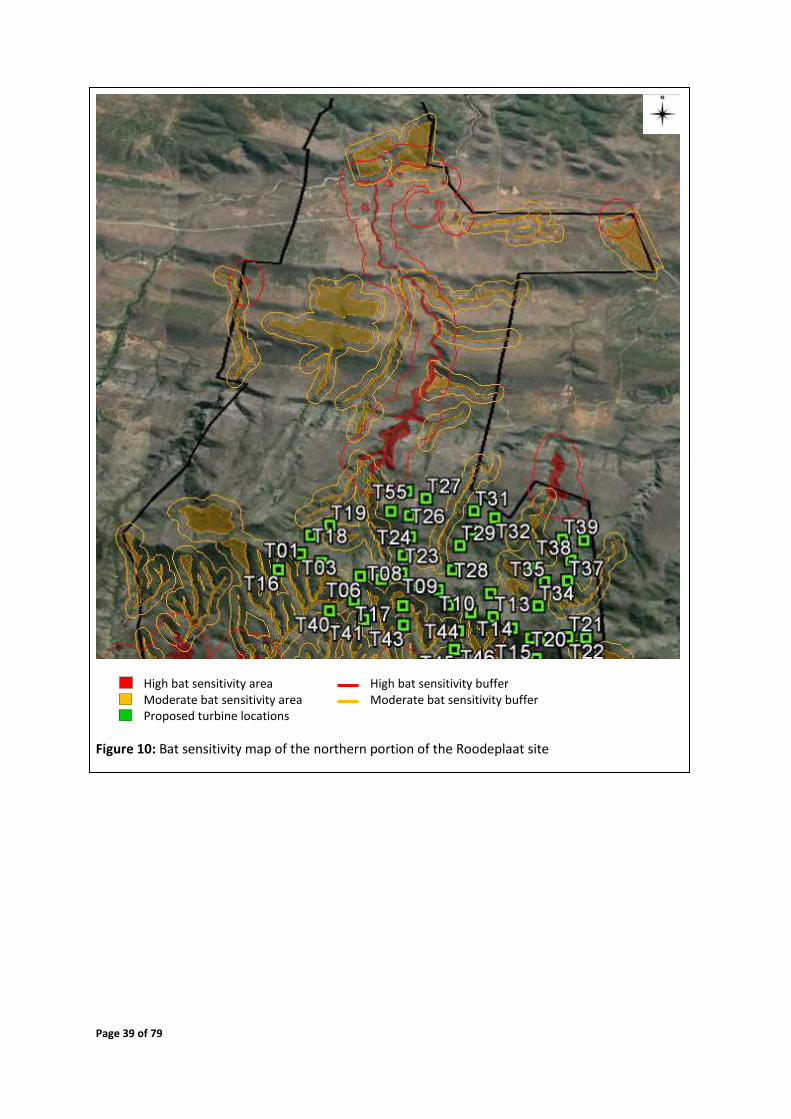
4.5 Sensitivity Map
Figures 9 - 11 depict the sensitive areas of the site, based on features identified to be
important for foraging and roosting of the species that are confirmed and most probable to
occur on site. Thus the sensitivity map is based on species ecology and habitat preferences.
This map can be used as a pre-construction mitigation in terms of improving turbine
placement with regards to bat preferred habitats on site.
Last iteration February 2016
High sensitivity buffer
350m
Moderate sensitivity buffer
150m
Features used to develop the sensitivity map
Manmade structures, such as farm houses, barns, sheds, road culverts, these type of structures provide easily accessible roosting sites.
The presence rock faces and clumps of larger woody plants. These features provide natural roosting spaces and tend to attract insect prey.
The different vegetation types and presence of riparian/water drainage habitat is used as indicators of probable foraging areas.
Open water sources, be it man-made farm dams or natural streams and wetlands, are important sources of drinking water and provide habitat that host insect prey.
The areas designated as having a High Bat Sensitivity (Table 9) implicates that no turbines
should be placed in these areas and their respective buffer zones, due to the elevated
impacts it can have on bat mortalities. If turbines are located within the Moderate Bat
Sensitivity zone or its buffer zone, they must receive special attention and preference for
post-construction monitoring and implementation of mitigations during the operational
phase outlined in Section 6.

Page 37 of 79
Table 9: Description of sensitivity categories utilized in the sensitivity map
Sensitivity Description
Moderate Sensitivity
Areas of foraging habitat or roosting sites considered to have
significant roles for bat ecology. Turbines within or close to
these areas and their buffers must acquire priority (not
excluding all other turbines) during pre/post-construction
studies and mitigation measures, if any is needed.
High Sensitivity
Areas that are deemed critical for resident bat populations,
capable of elevated levels of bat activity and support greater
bat diversity than the rest of the site. These areas are ‘no-go’
areas and turbines must not be placed in these areas AND their
buffer zones.
Table 10: Turbines located within bat sensitive areas and buffers
Bat sensitive area Proposed turbine layout
High bat sensitivity area None
High bat sensitivity buffer Turbine 15, 47, 48, 52, 53
Moderate bat sensitivity area None
Moderate bat sensitivity buffer Turbine 4, 12, 16, 17, 19, 36, 37, 40, 41, 42, 44, 46, 51

Page 38 of 79
High bat sensitivity area High bat sensitivity buffer Moderate bat sensitivity area Moderate bat sensitivity buffer Proposed turbine locations
Figure 9: Bat sensitivity map of the Roodeplaat site.
Page 39 of 79
High bat sensitivity area High bat sensitivity buffer Moderate bat sensitivity area Moderate bat sensitivity buffer Proposed turbine locations
Figure 10: Bat sensitivity map of the northern portion of the Roodeplaat site

Page 40 of 79
High bat sensitivity area High bat sensitivity buffer Moderate bat sensitivity area Moderate bat sensitivity buffer Proposed turbine locations
Figure 11: Bat sensitivity map of the southern portion of the Roodeplaat site

Page 41 of 79
4.6 Passive Data
4.6.1 Abundances and Composition of Bat Assemblages
Average bat passes detected per bat detector night and total number of bat passes detected
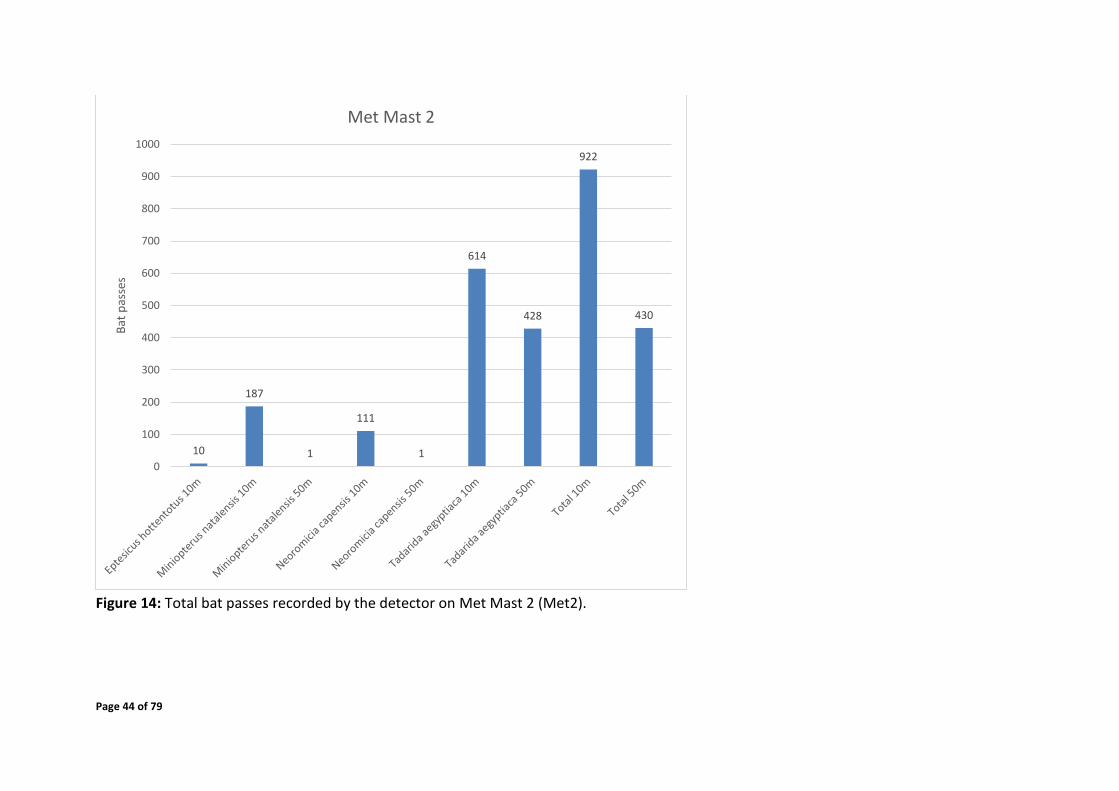
over the monitoring period by all systems are displayed in Figures 12 - 14. Four bat species
were detected by the passive monitoring systems, namely, Eptesicus hottentotus,
Miniopterus natalensis, Neoromicia capensis and Tadarida aegyptiaca.
Met mast 1 recorded a significantly higher number of bat passes compared to the other two
systems (Figure 13). As expected, in general higher bat activity was detected at 10m height
than 50m height by the met mast monitoring systems (Figures 13-14).
Tadarida aegyptiaca are the most abundant bat species recorded by all systems. Common
and abundant species, such as Neoromicia capensis, Tadarida aegyptiaca and Miniopterus
natalensis, are of a larger value to the local ecosystems as they provide a greater
contribution to most ecological services than the rarer species due to their higher numbers.
Miniopterus natalensis is the only migratory species detected on site. The results of the full
12 months have been analysed for the presence of a migratory event and no migratory
event was detected by the four passive monitoring systems. Thus the results are indicative
of the site not being within a migratory route.
The average number of passes per night per month for the Masts were low over the winter
months with a gradual increase over spring and summer. Average passes per night peaked
over January, February and March 2014 with a general decline from April 2014 to the end of
the July 2014 (Figures 15-17). Activity remained elevated from October 2013 to March 2014,
with a general decline into winter 2014.

Page 42 of 79
Figure 12: Total bat passes recorded by the detector on Short Mast (SM).
94
794
561
2283
3732
0
500
1000
1500
2000
2500
3000
3500
4000
Eptesicushottentotus
Miniopterusnatalensis
Neoromicia capensis Tadarida aegyptiaca Total
Bat
pas
ses
Short Mast

Page 43 of 79
Figure 133: Total bat passes recorded by the detector on Met Mast 1 (Met1).
190
2
450
10
1510
512
2150
524
0
500
1000
1500
2000
2500
Miniopterusnatalensis 10m
Miniopterusnatalensis 50m
Neoromiciacapensis 10m
Neoromiciacapensis 50m
Tadaridaaegyptiaca 10m
Tadaridaaegyptiaca 50m
Total 10m Total 50m
Bat
pas
ses
Met Mast 1
Page 44 of 79
Figure 14: Total bat passes recorded by the detector on Met Mast 2 (Met2).
10
187
1
111
1
614
428
922
430
0
100
200
300
400
500
600
700
800
900
1000
Bat
pas
ses
Met Mast 2

Page 45 of 79
Figure 15: Average bat passes recorded by the detector on Short Mast (SM).
0 0 0.4 0.1 1.1 1.1
0.5 0.0 0 0 0 0 0 0
3.2
0.5
2 2.3
7.9
4.5
0
2
6.7
3.1
0 0 0
1.8 1.1
3.1 2.5
4.6
6.2
0 0 0.4 0 0 0
22.5
12.4
8.9 8.0
14.3 13.4
0
6.5
0.9
0
5
10
15
20
25
30
Jul-13 Aug-13 Sep-13 Oct-13 Nov-13 Dec-13 Jan-14 Feb-14 Mar-14 Apr-14 May-14 Jun-14 Jul-14
Ave
rage
bat
pas
ses/
nig
ht
Short Mast
Eptesicus hottenotus Miniopterus natalensis Neoromicia capensis Tadarida aegyptiaca

Page 46 of 79
Figure 16: Average bat passes recorded by the detector on Met Mast 1 (Met1).
0 0.2 0.5 0.5 1.6 1.7
1.1 1.5
0 0.4 0.4 0.1 0.3 0.0
2.1
0.7
3.0
4.6
3.4
7.5
0 0 0 0.1 0 0 0 0.1 0 0 0.3 0 0 0 0 0 0.3
1.9 1.1
7
5.7 5.1
13.1 12.7
18
0 0.4 0.8 0 0 0
1.6 1.1
3.5
7.3
0.75 0 0
1 0.5
0
5
10
15
20
25
30
Jul-13 Aug-13 Sep-13 Oct-13 Nov-13 Dec-13 Jan-14 Feb-14 Mar-14 Apr-14 May-14 Jun-14 Jul-14
Ave
rage
bat
pas
ses/
nig
ht
Met Mast 1
Miniopterus natalensis 10m Miniopterus natalensis 50m Neoromicia capensis 10m Neoromicia capensis 50m Tadarida aegyptiaca 10m Tadarida aegyptiaca 50m

Page 47 of 79
Figure 17: Average bat passes recorded by the detector on Met Mast 2 (Met2).
0.1 0 0.2
0.4 0.4 0.7
0.4 0 0
3.2
1.0
4.7
0 0.2
0 0.2
0.1
0.6
1.3 0.9
0 0 0 0
0.9
0.2
1.7
0.4
2.7
1.3
3.3 3.1
6.75
0 0 0 0.2
0.4
2.9
0.3
2.2
0.9 1.2
2.9
0.7
0 0 0
0.4
0
1
2
3
4
5
6
7
8
9
10
Jul-13 Aug-13 Sep-13 Oct-13 Nov-13 Dec-13 Jan-14 Feb-14 Mar-14 Apr-14 May-14 Jun-14 Jul-14
Ave
rage
pas
ses/
nig
ht
Met Mast 2
Eptesicus hottentotus 10m Miniopterus natalensis 10m Miniopterus natalensis 50m Neoromicia capensis 10m
Neoromicia capensis 50m Tadarida aegyptiaca 10m Tadarida aegyptiaca 50m

Page 48 of 79
4.6.2 Temporal Distribution
The sum of all bat passes recorded by the detection systems of the particular species are
displayed per night over the entire monitoring period (Figures 18-20). The bat passes across
the times of night have been displayed in Figures 21 - 32. These figures give an indication of
the specific date periods and time periods where high activity was detected and by each
system. Periods of elevated bat activity as depicted in Figures 18 - 32 are as follows:
Short mast
Start of October – end of November 2013 (spring) over the time of sunset – 04:00
Met mast 1
Mid-October 2013 – late February 2014 (spring and summer) over the time of sunset –
04:00
Met mast 2
Mid-August – end August 2013, and start of Jan – end of February 2014 (part of winter
and summer) over the times of sunset - 00:00

Page 49 of 79
Figure 18: Temporal distribution of bat passes detected by Short Mast (SM).
0
50
100
150
7/5
/20
13
7/1
1/2
01
37
/17
/20
13
7/2
3/2
01
37
/29
/20
13
8/4
/20
13
8/1
0/2
01
38
/16
/20
13
8/2
2/2
01
38
/28
/20
13
9/3
/20
13
9/9
/20
13
9/1
5/2
01
39
/21
/20
13
9/2
7/2
01
31
0/3
/20
13
10
/9/2
01
31
0/1
5/2
0…
10
/21
/20
…1
0/2
7/2
0…
11
/2/2
01
31
1/8
/20
13
11
/14
/20
…1
1/2
0/2
0…
11
/26
/20
…1
2/2
/20
13
12
/8/2
01
31
2/1
4/2
0…
12
/20
/20
…1
2/2
6/2
0…
1/1
/20
14
1/7
/20
14
1/1
3/2
01
41
/19
/20
14
1/2
5/2
01
41
/31
/20
14
2/6
/20
14
2/1
2/2
01
42
/18
/20
14
2/2
4/2
01
43
/2/2
01
43
/8/2
01
43
/14
/20
14
3/2
0/2
01
43
/26
/20
14
4/1
/20
14
4/7
/20
14
4/1
3/2
01
44
/19
/20
14
4/2
5/2
01
45
/1/2
01
45
/7/2
01
45
/13
/20
14
5/1
9/2
01
45
/25
/20
14
5/3
1/2
01
46
/6/2
01
46
/12
/20
14
6/1
8/2
01
46
/24
/20
14
6/3
0/2
01
47
/6/2
01
47
/12
/20
14
Bat
pas
ses
Short Mast
Eptesicus hottentotus Miniopterus natalensis Neoromicia capensis Tadarida aegyptiaca

Page 50 of 79
Figure 19: Temporal distribution of bat passes detected by Met Mast 1 (Met1).
0
20
40
60
80
100
120
7/8
/20
13
7/1
4/2
01
37
/20
/20
13
7/2
6/2
01
38
/1/2
01
38
/7/2
01
38
/13
/20
13
8/1
9/2
01
38
/25
/20
13
8/3
1/2
01
39
/6/2
01
39
/12
/20
13
9/1
8/2
01
39
/24
/20
13
9/3
0/2
01
31
0/6
/20
13
10
/12
/20
13
10
/18
/20
13
10
/24
/20
13
10
/30
/20
13
11
/5/2
01
31
1/1
1/2
01
31
1/1
7/2
01
31
1/2
3/2
01
31
1/2
9/2
01
31
2/5
/20
13
12
/11
/20
13
12
/17
/20
13
12
/23
/20
13
12
/29
/20
13
1/4
/20
14
1/1
0/2
01
41
/16
/20
14
1/2
2/2
01
41
/28
/20
14
2/3
/20
14
2/9
/20
14
2/1
5/2
01
42
/21
/20
14
2/2
7/2
01
43
/5/2
01
43
/11
/20
14
3/1
7/2
01
43
/23
/20
14
3/2
9/2
01
44
/4/2
01
44
/10
/20
14
4/1
6/2
01
44
/22
/20
14
4/2
8/2
01
45
/4/2
01
45
/10
/20
14
5/1
6/2
01
45
/22
/20
14
5/2
8/2
01
46
/3/2
01
46
/9/2
01
46
/15
/20
14
6/2
1/2
01
46
/27
/20
14
7/3
/20
14
7/9
/20
14
Bat
pas
ses
Met Mast 1
Miniopterus natalensis 10m Miniopterus natalensis 50m Neoromicia capensis 10m
Neoromicia capensis 50m Tadarida aegyptiaca 10m Tadarida aegyptiaca 50m

Page 51 of 79
Figure 20: Temporal distribution of bat passes detected by Met Mast 2 (Met2).
0
10
20
30
40
50
60
70
7/5
/20
13
7/1
1/2
01
37
/17
/20
13
7/2
3/2
01
37
/29
/20
13
8/4
/20
13
8/1
0/2
01
38
/16
/20
13
8/2
2/2
01
38
/28
/20
13
9/3
/20
13
9/9
/20
13
9/1
5/2
01
39
/21
/20
13
9/2
7/2
01
31
0/3
/20
13
10
/9/2
01
31
0/1
5/2
01
31
0/2
1/2
01
31
0/2
7/2
01
31
1/2
/20
13
11
/8/2
01
31
1/1
4/2
01
31
1/2
0/2
01
31
1/2
6/2
01
31
2/2
/20
13
12
/8/2
01
31
2/1
4/2
01
31
2/2
0/2
01
31
2/2
6/2
01
31
/1/2
01
41
/7/2
01
41
/13
/20
14
1/1
9/2
01
41
/25
/20
14
1/3
1/2
01
42
/6/2
01
42
/12
/20
14
2/1
8/2
01
42
/24
/20
14
3/2
/20
14
3/8
/20
14
3/1
4/2
01
43
/20
/20
14
3/2
6/2
01
44
/1/2
01
44
/7/2
01
44
/13
/20
14
4/1
9/2
01
44
/25
/20
14
5/1
/20
14
5/7
/20
14
5/1
3/2
01
45
/19
/20
14
5/2
5/2
01
45
/31
/20
14
6/6
/20
14
6/1
2/2
01
46
/18
/20
14
6/2
4/2
01
46
/30
/20
14
7/6
/20
14
7/1
2/2
01
4
Bat
pas
ses
Met Mast 2
Eptesicus hottentotus 10m Miniopterus natalensis 10m Miniopterus natalensis 50m Neoromicia capensis 10m
Neoromicia capensis 50m Tadarida aegyptiaca 10m Tadarida aegyptiaca 50m

Page 52 of 79
Figure 21: Time of night activity over the winter monitoring period recorded at Short Mast (SM).
0
2
4
6
8
10
12
14
16
18
:00
18
:20
18
:40
19
:00
19
:20
19
:40
20
:00
20
:20
20
:40
21
:00
21
:20
21
:40
22
:00
22
:20
22
:40
23
:00
23
:20
23
:40
0:0
0
0:2
0
0:4
0
1:0
0
1:2
0
1:4
0
2:0
0
2:2
0
2:4
0
3:0
0
3:2
0
3:4
0
4:0
0
4:2
0
4:4
0
5:0
0
5:2
0
5:4
0
6:0
0
Bat
pas
ses
Short Mast Winter
Eptesicus hottentotus Neoromicia capensis Tadarida aegyptiaca Miniopterus natalensis

Page 53 of 79
Figure 22: Time of night activity over the spring monitoring period recorded at Short Mast (SM).
0
5
10
15
20
25
30
35
18
:00
18
:20
18
:40
19
:00
19
:20
19
:40
20
:00
20
:20
20
:40
21
:00
21
:20
21
:40
22
:00
22
:20
22
:40
23
:00
23
:20
23
:40
0:0
0
0:2
0
0:4
0
1:0
0
1:2
0
1:4
0
2:0
0
2:2
0
2:4
0
3:0
0
3:2
0
3:4
0
4:0
0
4:2
0
4:4
0
5:0
0
5:2
0
5:4
0
6:0
0
Bat
pas
ses
Short Mast Spring
Eptesicus hottentotus Miniopterus natalensis Neoromicia capensis Tadarida aegyptiaca

Page 54 of 79
Figure 23: Time of night activity over the summer monitoring period recorded at Short Mast (SM).
0
5
10
15
20
25
30
35
40
45
18
:00
18
:20
18
:40
19
:00
19
:20
19
:40
20
:00
20
:20
20
:40
21
:00
21
:20
21
:40
22
:00
22
:20
22
:40
23
:00
23
:20
23
:40
0:0
0
0:2
0
0:4
0
1:0
0
1:2
0
1:4
0
2:0
0
2:2
0
2:4
0
3:0
0
3:2
0
3:4
0
4:0
0
4:2
0
4:4
0
5:0
0
5:2
0
5:4
0
6:0
0
Bat
pas
ses
Short Mast Summer
Eptesicus hottentotus Neoromicia capensis Miniopterus natalensis Tadarida aegyptiaca

Page 55 of 79
Figure 24: Time of night activity over the autumn monitoring period recorded at Short Mast (SM).
0
5
10
15
20
25
18
:00
18
:20
18
:40
19
:00
19
:20
19
:40
20
:00
20
:20
20
:40
21
:00
21
:20
21
:40
22
:00
22
:20
22
:40
23
:00
23
:20
23
:40
0:0
0
0:2
0
0:4
0
1:0
0
1:2
0
1:4
0
2:0
0
2:2
0
2:4
0
3:0
0
3:2
0
3:4
0
4:0
0
4:2
0
4:4
0
5:0
0
5:2
0
5:4
0
6:0
0
Bat
pas
ses
Short Mast Autumn
Eptesicus hottentotus Miniopterus natalensis Neoromicia capensis Tadarida aegyptiaca

Page 56 of 79
Figure 25: Time of night activity over the winter monitoring period recorded at Met Mast 1 (Met1).
0
2
4
6
8
10
12
14
16
18
18
:00
18
:10
18
:20
18
:30
18
:40
18
:50
19
:00
19
:10
19
:20
19
:30
19
:40
19
:50
20
:00
20
:10
20
:20
20
:30
20
:40
20
:50
21
:00
21
:10
21
:20
21
:30
21
:40
21
:50
22
:00
22
:10
22
:20
22
:30
22
:40
22
:50
23
:00
23
:10
23
:20
23
:30
23
:40
23
:50
0:0
00
:10
0:2
00
:30
0:4
00
:50
1:0
01
:10
1:2
01
:30
1:4
01
:50
2:0
02
:10
2:2
02
:30
2:4
02
:50
3:0
03
:10
3:2
03
:30
3:4
03
:50
4:0
04
:10
4:2
04
:30
4:4
04
:50
5:0
05
:10
5:2
05
:30
5:4
05
:50
Bat
pas
ses
Met Mast 1 Winter
Miniopterus natalensis 10m Miniopterus natalensis 50m Neoromicia capensis 10m
Neoromicia capensis 50m Tadarida aegyptiaca 50m Tadarida aegyptiaca 10m

Page 57 of 79
Figure 26: Time of night activity over the spring monitoring period recorded at Met Mast 1 (Met1).
0
5
10
15
20
25
30
18
:00
18
:10
18
:20
18
:30
18
:40
18
:50
19
:00
19
:10
19
:20
19
:30
19
:40
19
:50
20
:00
20
:10
20
:20
20
:30
20
:40
20
:50
21
:00
21
:10
21
:20
21
:30
21
:40
21
:50
22
:00
22
:10
22
:20
22
:30
22
:40
22
:50
23
:00
23
:10
23
:20
23
:30
23
:40
23
:50
0:0
00
:10
0:2
00
:30
0:4
00
:50
1:0
01
:10
1:2
01
:30
1:4
01
:50
2:0
02
:10
2:2
02
:30
2:4
02
:50
3:0
03
:10
3:2
03
:30
3:4
03
:50
4:0
04
:10
4:2
04
:30
4:4
04
:50
5:0
05
:10
5:2
05
:30
5:4
05
:50
6:0
0
Bat
pas
ses
Met Mast 1 Spring
Miniopterus natalensis 10m Miniopterus natalensis 50m Neoromicia capensis 10m
Neoromicia capensis 50m Tadarida aegyptiaca 10m Tadarida aegyptiaca 50m

Page 58 of 79
Figure 27: Time of night activity over the summer monitoring period recorded at Met Mast 1 (Met1).
0
5
10
15
20
25
30
35
40
45
18
:00
18
:10
18
:20
18
:30
18
:40
18
:50
19
:00
19
:10
19
:20
19
:30
19
:40
19
:50
20
:00
20
:10
20
:20
20
:30
20
:40
20
:50
21
:00
21
:10
21
:20
21
:30
21
:40
21
:50
22
:00
22
:10
22
:20
22
:30
22
:40
22
:50
23
:00
23
:10
23
:20
23
:30
23
:40
23
:50
0:0
00
:10
0:2
00
:30
0:4
00
:50
1:0
01
:10
1:2
01
:30
1:4
01
:50
2:0
02
:10
2:2
02
:30
2:4
02
:50
3:0
03
:10
3:2
03
:30
3:4
03
:50
4:0
04
:10
4:2
04
:30
4:4
04
:50
5:0
05
:10
5:2
05
:30
5:4
05
:50
6:0
0
Bat
pas
ses
Met Mast 1 Summer
Miniopterus natalensis 10m Miniopterus natalensis 50m Neoromicia capensis 10m
Neoromicia capensis 50m Tadarida aegyptiaca 10m Tadarida aegyptiaca 50m

Page 59 of 79
Figure 28: Time of night activity over the autumn monitoring period recorded at Met Mast 1 (Met1).
0
2
4
6
8
10
18
:00
18
:10
18
:20
18
:30
18
:40
18
:50
19
:00
19
:10
19
:20
19
:30
19
:40
19
:50
20
:00
20
:10
20
:20
20
:30
20
:40
20
:50
21
:00
21
:10
21
:20
21
:30
21
:40
21
:50
22
:00
22
:10
22
:20
22
:30
22
:40
22
:50
23
:00
23
:10
23
:20
23
:30
23
:40
23
:50
0:0
00
:10
0:2
00
:30
0:4
00
:50
1:0
01
:10
1:2
01
:30
1:4
01
:50
2:0
02
:10
2:2
02
:30
2:4
02
:50
3:0
03
:10
3:2
03
:30
3:4
03
:50
4:0
04
:10
4:2
04
:30
4:4
04
:50
5:0
05
:10
5:2
05
:30
5:4
05
:50
6:0
0
Bat
pas
ses
Met Mast 1 Autumn
Miniopterus natalensis 10m Miniopterus natalensis 50m Neoromicia capensis 10m
Neoromicia capensis 50m Tadarida aegyptiaca 10m Tadarida aegyptiaca 50m

Page 60 of 79
Figure 29: Time of night activity over the winter monitoring period recorded at Met Mast 2 (Met2).
0
2
4
6
8
10
12
14
16
18
17
:40
18
:00
18
:20
18
:40
19
:00
19
:20
19
:40
20
:00
20
:20
20
:40
21
:00
21
:20
21
:40
22
:00
22
:20
22
:40
23
:00
23
:20
23
:40
0:0
0
0:2
0
0:4
0
1:0
0
1:2
0
1:4
0
2:0
0
2:2
0
2:4
0
3:0
0
3:2
0
3:4
0
4:0
0
4:2
0
4:4
0
5:0
0
5:2
0
5:4
0
6:0
0
Bat
pas
ses
Met Mast 2 Winter
Eptesicus hottentotus 10m Miniopterus natalensis 10m Miniopterus natalensis 50m Neoromicia capensis 10m
Neoromicia capensis 50m Tadarida aegyptiaca 10m Tadarida aegyptiaca 50m

Page 61 of 79
Figure 30: Time of night activity over the spring monitoring period recorded at Met Mast 2 (Met2).
0
2
4
6
8
10
12
14
18
:00
18
:20
18
:40
19
:00
19
:20
19
:40
20
:00
20
:20
20
:40
21
:00
21
:20
21
:40
22
:00
22
:20
22
:40
23
:00
23
:20
23
:40
0:0
0
0:2
0
0:4
0
1:0
0
1:2
0
1:4
0
2:0
0
2:2
0
2:4
0
3:0
0
3:2
0
3:4
0
4:0
0
4:2
0
4:4
0
5:0
0
5:2
0
5:4
0
6:0
0
Bat
pas
ses
Met Mast 2 Spring
Eptesicus hottentotus 10m Miniopterus natalensis 10m Miniopterus natalensis 50m Neoromicia capensis 10m
Neoromicia capensis 50m Tadarida aegyptiaca 10m Tadarida aegyptiaca 50m

Page 62 of 79
Figure 31: Time of night activity over the summer monitoring period recorded at Met Mast 2 (Met2).
0
5
10
15
20
25
30
18
:00
18
:20
18
:40
19
:00
19
:20
19
:40
20
:00
20
:20
20
:40
21
:00
21
:20
21
:40
22
:00
22
:20
22
:40
23
:00
23
:20
23
:40
0:0
0
0:2
0
0:4
0
1:0
0
1:2
0
1:4
0
2:0
0
2:2
0
2:4
0
3:0
0
3:2
0
3:4
0
4:0
0
4:2
0
4:4
0
5:0
0
5:2
0
5:4
0
6:0
0
Bat
pas
ses
Met Mast 2 Summer
Eptesicus hottentotus 10m Miniopterus natalensis 10m Miniopterus natalensis 50m Neoromicia capensis 10m
Neoromicia capensis 50m Tadarida aegyptiaca 10m Tadarida aegyptiaca 50m

Page 63 of 79
Figure 32: Time of night activity over the autumn monitoring period recorded at Met Mast 2 (Met2).
0
0.5
1
1.5
2
2.5
3
3.5
4
4.5
5
18
:00
18
:20
18
:40
19
:00
19
:20
19
:40
20
:00
20
:20
20
:40
21
:00
21
:20
21
:40
22
:00
22
:20
22
:40
23
:00
23
:20
23
:40
0:0
0
0:2
0
0:4
0
1:0
0
1:2
0
1:4
0
2:0
0
2:2
0
2:4
0
3:0
0
3:2
0
3:4
0
4:0
0
4:2
0
4:4
0
5:0
0
5:2
0
5:4
0
6:0
0
Bat
pas
ses
Met Mast 2 Autumn
Eptesicus hottentotus 10m Miniopterus natalensis 10m Miniopterus natalensis 50m Neoromicia capensis 10m
Neoromicia capensis 50m Tadarida aegyptiaca 10m Tadarida aegyptiaca 50m
Page 64 of 79
4.6.3 Relation between Bat Activity and Weather Conditions
Several sources of literature describe how numerous bat species are influenced by weather
conditions. Weather may influence bats in terms of lowering activity, changing time of
emergence and flight time. It is also important to note the environmental factors are never
isolated and therefore a combination of the environmental factors can have synergistic or
otherwise contradictory influences on bat activity. For instance a combination of high
temperatures and low wind speeds will be more favourable to bat activity than low
temperatures and low wind speed, whereas low temperature and high wind speed will be
the least favourable for bats. Below are short descriptions of how wind speed, temperature
and barometric pressure influences bat activity.
Wind speed
Some bat species show reduced activity in windy conditions. Strong winds have been found
to suppress flight activity in bats by making flight difficult (O’Farrell et al. 1967). Several
studies at proposed and operating wind facilities in the United States have documented
discernibly lower bat activity during ‘high’ wind speeds (Arnett et al. 2009).
Wind speed and direction also affects availability of insect prey as insects on the wing often
accumulate on the lee side of wind breaks such as tree lines (Peng et al. 1992). So at edges
exposed to wind, flight activity of insects, and thus bats may be suppressed and at edges to
the lee side of wind, bat activity may be greater. This relationship is used in the sensitivity
map whereby the larger vegetation and man-made structures provide shelter from the
wind. However the turbine localities are situated on the ridges of the site such that they will
be in areas exposed to the wind and not protected by vegetation or structure.
Temperature
Flight activity of bats generally increases with temperature. Flights are of shorter duration
on cooler nights and extended on warmer nights.
Rachwald (1992) noted that distinct peaks of activity disappeared in warm weather such
that activity was mostly continuous through the night. During nights of low temperatures
bats intensified foraging shortly after sunset (Corbet and Harris 1991).
Peng (1991) found that many families of aerial dipteran (flies) insects preferred warm
conditions for flight. A preference among insects for warm conditions has been reported by
many authors suggesting that temperature is an important regulator of bat activity, through
its effects on insect prey availability.

Page 65 of 79
5 PROPOSED MITIGATION MEASURE DETAILS
The correct placement of wind farms and of individual turbines can significantly lessen the
impacts on bat fauna in an area, and should be considered as the preferred option for
mitigation.
Where mitigation by location is not possible, other options that may be utilized if required
include curtailment, blade feathering, blade lock, acoustic deterrents or light lures. The
following terminology applies:
Curtailment:
Curtailment is the act of limiting the supply of electricity to the grid during conditions when
it would normally be supplied. This is usually accomplished by locking or feathering the
turbine blades.
Cut-in speed:
Cut-in speed is defined as the wind speed at which the generator is connected to the grid
and producing electricity..
Feathering or Feathered:
Adjusting the angle/pitch of the rotor blade parallel to the wind, or turning the whole unit
out of the wind, to slow or stop blade rotation. Normally operating turbine blades are
angled almost perpendicular to the wind at all times.
Free-wheeling:
Free-wheeling occurs when the blades are allowed to rotate below the cut-in speed or even
when fully feathered and parallel to the wind. In contrast, blades can be “locked” and
cannot rotate, which is a mandatory situation when turbines are being accessed by
operations personnel.
Increasing cut-in speed:
The turbine’s computer system (referred to as the Supervisory Control and Data Acquisitions
or SCADA system) is programmed to a cut-in speed higher than the manufacturer’s set
speed, and turbines are programmed to stay locked or feathered at 90° until the increased
cut-in speed is reached over some average number of minutes (usually 5 – 10 min), thus
triggering the turbine blades to pitch back “into the wind” and begin to spin normally and
producing power.
Blade locking or full feathering below the manufacturers cut in speed, that locks or
significantly reduces the speed the blades turn, is more desirable for the conservation of
bats than allowing free rotation with no feathering below the manufacturers cut in speed.

Page 66 of 79
Acoustic deterrents are a developing technology and will need investigation as a possible
option for mitigation if during operation mitigation is found to be required
Light lures refer to the concept where strong lights are placed on the periphery (or only a
few sides) of the wind farm to lure insects and therefore bats away from the turbines. The
long term effects on bat populations and local ecology of this method is unknown.
Habitat modification, with the aim of augmenting bat habitat around the wind farm in an
effort to lure bats away from turbines, is not recommended. Such a method can be
adversely intrusive on other fauna and flora and the ecology of the areas being modified.
Additionally it is unknown whether such a method may actually increase the bat numbers of
the broader area, causing them to move into the wind farm site due to resource pressure.
Power modes for turbines are the various operational modes linked to cut in and cut out
and tip speeds for turbines that the turbines are designed to be able to operate at without
overstraining the turbines. Different modes are used to reduce the noise output of the
turbines (which also reduces the energy output) and the greater the reduction in noise the
slightly slower the tip speeds are. Thus using lower noise modes will reduce the tip speed of
the turbines
Currently the most effective method of mitigation, after correct turbine placement, is
alteration of blade speeds and cut-in speeds under environmental conditions favourable to
bats.
A basic "6 levels of mitigation" (by blade manipulation or curtailment), from light to
aggressive mitigation is presented below:
1. No curtailment (free-wheeling is unhindered below manufacturers cut in speed so all
momentum is retained, thus normal operation).
2. Feathering blades below manufacturers cut-in speed to as close to 70 degrees as
possible or more so as to reduce the free-wheeling blade rotation
3. Feathering of blades below manufacturers cut-in speed to as close to 90 degrees as
possible so as to minimise free-wheeling blade rotation as much as possible without
locking the blades.
4. 90 Degree feathering of blades below manufacturers cut in speed, with reduced
power mode settings between manufacturers’ cut-in speed and mitigation cut-in
conditions.
5. 90 Degree feathering of blades below mitigation cut in conditions.
6. 90 Degree feathering throughout the entire night.

Page 67 of 79
A preliminary recommendation would be that curtailment mitigation initiates at Level 4 for
the months, times and weather conditions determined from the data obtained to be the
times most likely for increased bat activity and therefore increased likelihood of impact.
These times and weather conditions are outlined in Section 6 below. If such mitigation is
undertaken, then depending on the results of the post construction mortality monitoring
the mitigation can be either relaxed or intensified (moving down or up in the levels) up to a
maximum intensity of Level 5. This is an adaptive mitigation management approach that will
require changes in the mitigation plan to be implemented immediately and in real time
during the post construction monitoring.
6 MITIGATION SCHEDULE
The correct placement of wind farms and of individual turbines can significantly lessen the
impacts on bat fauna in an area, and should be considered as the preferred option for
mitigation. However the monitoring systems detected significant peaks in activity over the
12 month monitoring period. Bat species active over these time frames need to be
protected from the impacts of wind turbines. Thus preliminary mitigations are advised for
all potential risk turbines according to the parameters listed in the tables below.
The tables infer mitigation be applied during the peak activity periods and times, and when
the indicated wind speed and temperature ranges are prevailing simultaneously. These
wind speed and temperature values are the averages as measured by the met masts over
the peak bat activity dates and time of the night.
This schedule is intended to be used initially at the start of the operational phase, however
the exact mitigation parameters will be adjusted and adapted as determined by the
operational monitoring data. These changes may be applied within a few weeks after
operation commenced.
The times of implementation of mitigation measures is preliminarily recommended as
follows:

Page 68 of 79
Table 11: According to bat activity measured at the short mast.
Terms of mitigation implementation to be applied to
turbines 16, 36, 40, 41, 42, 51
Period of peak activity (times to
implement curtailment/ mitigation)
Start of October – end of November
Sunset – 4:00
Environmental conditions in which
turbines must be mitigated
Below 8 m/s (measured at 61m); Above 13.0°C
(measured at 5m)
Table 12: According to bat activity measured at Met mast 1.
Terms of mitigation implementation to be applied to
turbines 4, 12
Period of peak activity (times to
implement curtailment/ mitigation)
Mid October – end of February
Sunset – 22:00 and 00:00 – 04:00 (Oct, Nov)
Sunset – sunrise (Dec, Jan, Feb)
Environmental conditions in which
turbines must be mitigated
Oct, Nov: Below 9 m/s (measured at 61m); Above
14.0°C (measured at 5m)
Dec, Jan, Feb: Below 9 m/s (measured at 61m); Above
14.0°C (measured at 5m)

Page 69 of 79
Table 13: According to bat activity measured at Met mast 2.
Terms of mitigation implementation to be applied to
turbines 19, 37
Period of peak activity (times to
implement curtailment/ mitigation)
Mid-August – end August 2013; Sunset – 21:00
1 January – end of February; Sunset – 00:00
Environmental conditions in which
turbines must be mitigated
Aug: Below 8 m/s (measured at 61m); Above 15.0°C
(measured at 5m)
Jan, Feb: Below 9 m/s (measured at 61m); Above
18.0°C (measured at 5m)

Page 70 of 79
7 IMPACT ASSESSMENT OF PROPOSED WEF ON BAT FAUNA
7.1 Construction phase
Impact: During construction, the earthworks can damage bat roosts in rock crevices.
Spatial Extent
Intensity Duration Consequence Probability Significance +- Confidence
Before Management
Local Medium Long term
Medium Possible Low - High
Management Measures
Adhere to the sensitivity map during turbine placement
After Management
Local Low Long term
Low Possible Very Low
- High
No-go Option
N/A
Impact: Some foraging habitat will be permanently lost by construction of turbines,
access roads and associated infrastructure.
Spatial Extent
Intensity Duration Consequence Probability Significance +- Confidence
Before Management
Local Medium Long term
Medium Possible Low - High
Management Measures
Adhere to the sensitivity map (for practical reasons only applicable to turbine
locations). Keep to designated areas when storing building materials, resources,
turbine components and/or construction vehicles and keep to designated roads with
all construction vehicles. Damaged areas not required after construction should be
rehabilitated by an experienced vegetation succession specialist.
After Management
Local Low Long term
Low Possible Very Low
- High
No-go Option
N/A

Page 71 of 79
7.2 Operational phase
Impact: Bat mortalities due to operational turbine blades. The concerns of foraging bats
in relation to wind turbines is discussed in Section 2.2.
Spatial Extent
Intensity Duration
Consequence
Probability Significance
+-
Confidence
Before Management
Regional
Medium
Long term
High Probable
High - High
Management Measures
Adhere to the sensitivity map (for practical reasons only applicable to turbine locations).
Apply outlined mitigations to any further layout revisions, no turbines should be placed in
areas of High bat sensitivity and their buffers as well as preferably avoid areas of
Moderate bat sensitivity and their buffers for turbine layout. Also see Sections 5 and 6 on
mitigation options and recommendations for minimising risk of mortalities.
After Management
Regional
Low Long term
Medium Possible Low - Medium
No-go Option
N/A
Impact: During operation if strong artificial lights are used at the facility (for example at
turbine bases), it will attract insects and thereby also bats. This increases the likelihood
of impacts on bats by the wind turbines. Additionally, only certain species of bats will
readily forage around strong lights, whereas others avoid such lights even if there is
insect prey available. This can draw insect prey away from other natural areas and
thereby artificially favour certain species, affecting bat diversity in the area.
Spatial Extent
Intensity Duration Consequence Probability Significance +- Confidence
Before Management
Local Medium Long term
Medium Definite Medium - High
Management Measures
Utilise lights with wavelengths that attract less insects (low thermal/infrared signature).
Any lights at turbine bases must be equipped with passive motion sensors as to only
switch on when a person is nearby. If not required for safety or security purposes, lights
should be switched off when not in use.
After Management
Local Low Long term
Low Possible Very Low
- High
No-go Option
N/A

Page 72 of 79
8 OPERATIONAL MONITORING PRELIMINARY METHODOLOGY OUTLINE
8.1 Introduction
Operational phase monitoring and research programs across North America and Europe
have identified bats to be vulnerable to mortality due to wind turbines in the long term.
Bats are particularly vulnerable to non-natural causes of mortality as they are long-lived
animals with low reproductive fecundity. Additionally, there is relatively little scientific
knowledge about bat populations and migration routes. It is recommended that a minimum
of two year operational monitoring be undertaken as soon as turbines are functional, with
auditing continuing throughout the lifespan of the Roodeplaat WEF.
The primary objectives of the operational phase monitoring programme would be to:
Determine the bat fatality rates for the Roodeplaat WEF
Determine the fatality rates for species of concern
Determine the fatality rates for migratory and resident bat species
Study the relation of bat fatalities within all habitats, geology and vegetation types
found in turbine areas
Compare the bat fatality rates with those from wind farms in similar habitat types
where possible
Determine the relationship between bat activity and bat fatality
Understand the relationship between bat fatality and weather conditions
Study the temporal distribution of bat fatalities across the night and seasons
Determine whether mitigation measures are necessary to reduce bat fatality rates,
and if necessary recommend detailed mitigation measures
8.2 Methodology
Operational monitoring methodology is divided into two components, namely acoustic
monitoring and carcass searches. On conclusion of the first year an adapted methodology
will be outlined for the second year of monitoring.
8.2.1 Acoustic monitoring
Acoustics detectors and ultrasonic microphones will be used to monitor bat activity. They
will be installed on the meteorological mast and/or a sub-sample of turbine nacelles to
monitor activity in the rotor-swept path of high risk and select turbines.

Page 73 of 79
8.2.2 Carcass searches
Carcass searches will be undertaken to determine bat fatality rates. This component of the
methodology will be combined with that of the carcass searches for the bird monitoring
programme.
Locals will be trained in proper search techniques to carry out the carcass searches and to
record and collect all carcasses located. Searches will begin as early in the morning as
possible to reduce carcass removal by scavengers. The order in which turbines are searched
will ideally be randomly selected for each day to reduce carcass removal by predators from
specific turbines before they can be searched. Search intervals will be a maximum of one
week.
All necessary information will be recorded when a carcass is found. The carcass will then be
bagged and labelled and kept refrigerated for species identification and to determine the
cause of death by the specialist. Fatality monitoring will be carried out over all seasons of
the year.
The necessary searcher efficiency and scavenger removal trials will be carried out at least
once per season to calculate field bias and error estimation.
8.3 Wind turbine mitigation
Data collected throughout the monitoring programme will be used to inform and direct
mitigation if the Roodeplaat WEF or specific turbines is found to be causing significant bat
mortality. If mitigations are implemented, monitoring the effectiveness of the applied
techniques will be necessary to evaluate and refine the success and economic efficiency of
the mitigation.
8.4 Deliverables
Four monitoring reports will be submitted for the first year, on conclusion of the first
year an adapted reporting and methodology schedule will be outlined for the second
year of monitoring. Reports will include descriptions of the field protocols and
sampling methods. Raw data will be included in the reports as appendices, and
methods for data analysis shall be transparent.
A contingency plan will be compiled which informs immediate actions to be taken in
the case of a significant mortality event, or if mitigation measures fail. A contingency

Page 74 of 79
plan will consist of additional mitigation measures to be implemented in the event
that significant negative impacts are observed from a single mortality survey.
An adaptive management approach to the operational monitoring programme.
The methodology of the assessment will comply with requirements pertaining to the South
African Good Practice Guidelines for Operational Monitoring for Bats at Wind Energy
Facilities (the latest version available at the time of commencement), which will be a
mandatory requirement for all specialists.

Page 75 of 79
9 CONCLUSION
The site was visited over the period of 14 – 18 July 2014 wherein the three passive
monitoring systems were decommissioned and all data was downloaded. The monitoring
systems served the purpose of recording bat activity every night for the 12 month pre-
construction study period. This data has been used to outline mitigation measures to be
implemented upon operation of the wind farm.
The valley and kloof areas can offer adequate roosting sites, high insect abundance and
surface water while the mountain slopes may provide roosting sites in the form of rock
crevices and caverns. The alluvial vegetation zone may lead to increased quantities of
insects during favourable climatic conditions. This may lead to an increase in bat numbers
during these times.
The time periods of data loss due to system faults were short and intermittent such that the
loss is an insignificant influencer to the monitoring campaign results.
A sensitivity map was drawn up indicating bat sensitive roosting and foraging areas (Figures
9 - 11). The Moderate bat sensitivity areas and associated buffer zones must be prioritised
during operational monitoring, and these turbines will require initial mitigation measures
listed in Sections 5 and 6. The High Bat Sensitivity areas are expected to have elevated levels
of bat activity and support greater bat diversity. High Bat Sensitivity areas and their
respective buffers are ‘no – go’ areas due to the expected elevated rates of bat fatalities due
to wind turbines, and no turbines should be placed within these areas.
No turbines are currently located within a moderate bat sensitivity area. Turbines 4, 12, 16,
17, 19, 36, 37, 40, 41, 42, 44, 46 and 51 are located within the moderate sensitivity buffers.
Turbines 15, 47, 48, 52 and 53 are located within the high bat sensitivity buffers. No
turbines are located in high sensitivity areas.
Should the facility be authorised, a minimum of two-year operational monitoring must be
undertaken as soon as turbines are functional, with auditing continuing throughout the
lifespan of the Inyanda Roodeplaat WEF.

Page 76 of 79
10 REFERENCES
ACR. 2010. African Chiroptera Report, 2010. African Bats, Pretoria. Arnett, E. B., Huso, M. M. P., Schirmacher, M. R and Hayes, J. P. 2009.Patterns of bat fatality at the Casselman Wind Project in south-central Pennsylvania. An annual report of the Bats and Wind Energy Cooperative and the Pennsylvania Game Commission. Bat Conservation International. Austin, Texas, USA.
Arnett, E. B., technical editor. 2005. Relationships between bats and wind turbines in Pennsylvania and West Virginia: an assessment of bat fatality search protocols, patterns of fatality, and behavioral interactions with wind turbines. A final report submitted to the Bats and Wind Energy Cooperative. Bat Conservation International. Austin, Texas, USA.
Baerwald, E. F., D’Amours, G. H., Klug, B.J. and Barclay, R. M. R. 2008. Barotrauma is a significant cause of bat fatalities at wind turbines. Current Biology 18: 695-695.
Barclay, R. M. R., Baerwald, E. F., and Gruver, J. C. 2007. Variation in bat and bird fatalities at wind energy facilities: assessing the effects of rotor size and tower height. Canadian Journal of Zoology 85: 381-387.
Bernard, R. T. F. and Tsita, J. N. 1995.Seasonally monoestrous reproduction in the molossid bat, Tadarida aegyptiaca, from low temperature latitudes (35⁰S) in South Africa. South African Journal of Zoology 30: 18-22. Cryan, P. M. and Barclay, R. M. R. 2009. Causes of bat fatalities at wind turbines: Hypotheses and predictions. Journal of Mammalogy 90: 1330-1340.
Herselman, J. C. 1980. The distribution and status of bats in the Cape Province. International Report. Cape Department of Nature and Environmental Conservation.
Hester, S. G. and Grenier, M.B. 2005.A conservation plan for bats in Wyoming. Lander, WY: Wyoming Game and Fish Department, Nongame Program.
Horn, J. W., Arnett, E. B. and Kunz, T.H. 2008. Behavioural responses of bats to operating wind turbines. Journal of Wildlife Management 72: 123-132.
Howe, R. H., Evans, W. and Wolf, A. T. 2002. Effects of wind turbines on Birds and Bats on Northeastern Wisconsin. Report submitted to Wisconsin Public Service Corporation and Madison Gas and Electric Company.
Johnson, G. D., Erickson, W. P., Stickland, M. D., Shepherd, M. F., Shepherd, D. A. and Sarappo, S. A. 2003. Mortality of bats at a large-scale wind power development at Buffalo Ridge, Minnesota. The American Midland Naturalist Journal 150: 332-342.
Kunz, T. H., Arnett, E. B., Erickson, W. P., Hoar, A. R., Johnson, G. D., Larkin, R. P., Strickland, M. D., Thresher, R. W., Tuttle, M. D. 2007. Ecological impacts of wind energy development

Page 77 of 79
on bats: questions, research needs, and hypothesis. Frontiers in Ecology and the Environment 5: 315-324.
Lynch, C. D. 1989. The mammals of the north-eastern Cape Province Mem. Nas. Mus. Bloemfontein 25: 1-116.
Monadjem, A., Taylor, P.J., Cotterill, F.P.D. & Schoeman, M.C. 2010. Bats of southern and central Africa – A biogeographic and taxonomic synthesis, Ultra Litho (Pty) Ltd, Johannesburg.
Mucina, L. and Rutherford, M. C. 2006. The Vegetation of South Africa, Lesotho and Swaziland-Strelitzia 19, South African National Biodiversity Institute, Pretoria.
Neuweiler, G. 2000. The Biology of Bats. Oxford University Press.
O’Shea, T. J., Bogan, M. A. and Ellison, L. E. 2003. Monitoring trends in bat populations of the United States and territories: Status of the science and recommendations for the future. Wildlife Society Bulletin, 31: 16-29.
Rautenbach, I.L. 1982. Mammals of the Transvaal. Pretoria: Ecoplan.
Rollins, K. E., Meyerholz, D. K., Johnson, G. D., Capparella, A. P. and Loew, S. S. 2012. A forensic investigation into the etiology of bat mortality at a wind farm: barotrauma or traumatic injury? Veterinary Pathology, 49(2): 362 - 371.
Sowler, S. and Stoffberg, S. 2014. South African good practice guidelines for surveying bats in wind farm developments. Endangered Wildlife Trust.
Taylor, P. J. 2000. Bats of southern Africa, University of Natal Press, Pietermaritzburg.
Tuttle, M. D. and Hensley, D. L. 2001. The Bat House Builder’s Handbook. (BCI) Bat Conservation International.
van der Merwe, M. 1979. Growth of ovarian follicles in the Natal clinging bat. South African Journal of Zoology 14: 111-117.
van der Merwe, M. 1994. Reproductive biology of the Cape serotine bat, Eptesicus capensis, in the Transvaal, South Africa. South African Journal of Zoology 29: 36-39.
Vincent, S., Nemoz, M. and Aulagnier, S. 2011. Activity and foraging habitats of Miniopterus schreibersii (Chiroptera: Miniopteridae) in southern France: implications for its conservation. The Italian Journal of Mammalogy 22: 57-72.

Page 78 of 79
Reviewed and signed off by:
Werner Marais
Zoologist and Ecologist
MSc (Biodiversity & Conservation, UJ)
Pr.Sci.Nat. – SACNASP
(Zoological Science)

Page 79 of 79
DISCLAIMER
The services carried out and reported in this document have been done as accurately and
scientifically as allowed by the resources and knowledge available to Animalia Zoological &
Ecological Consultation CC at the time on which the requested services were provided to the
client. Animalia Zoological & Ecological Consultation CC reserves the right to modify aspects of
the document including the recommendations if and when new information may become
available from ongoing research or further work in this field, or pertaining to this investigation.
Although great care and pride have been taken to carry out the requested services accurately
and professionally, and to represent the relevant data in a clear and concise manner; no
responsibility or liability will be accepted by Animalia Zoological & Ecological Consultation CC.
And the client, by receiving this document, indemnifies Animalia Zoological & Ecological
Consultation CC and its staff against all claims, demands, losses, liabilities, costs, damages and
expenses arising from or in connection with services rendered, directly or indirectly by Animalia
Zoological & Ecological Consultation CC; and by the use of the information contained in this
document. The primary goal of Animalia’s services is to provide professionalism that is to the
benefit of the environment as well as the community.
COPYRIGHT
This document may not be altered or added to without the prior written consent of the author.
This also refers to electronic copies of this document which are supplied for the purposes of
inclusion as part of other reports. Similarly, any recommendations, statements or conclusions
drawn from or based on this document must make reference to this document.