Final Presentation High Speed Rail- Texas
21
Texas High Speed Rail By Susheel Kumar Siram
-
Upload
susheel-kumar-siram -
Category
Documents
-
view
108 -
download
0
Transcript of Final Presentation High Speed Rail- Texas

Texas High Speed RailBySusheel Kumar Siram

So what’s happening in Texas?
• Using Japanese technology to develop America’s first high speed rail line.
• Currently 2 lines are under consideration.
• Company claims $10 Billion in funding is required and it will be completed by 2021.
• Dallas to Houston in 90 minutes at 205 mph.

Who’s involved?
Central Japan Railway company is the primary advisor and will oversee the project and provide expertise.
Private Investors & Money Lenders
Will provide primary funding for the project. No taxpayer money will be required for the project’s completion. (That’s the claim TCR has made)

More Details
• N700-I Bullet Train• $33 Million per set• 500 passengers
• Our aim is to protect private property rights, maintain efficient modes of transportation, and prevent the wasteful use of taxpayer dollars or public subsidies for high-speed rail transportation.
• Our members include citizens, private property owners, business owners and elected officials from all across Texas who share our core belief of combating eminent domain for private use and our opposition to any tax-subsidized railway.

How does this benefit Texas?
Courtesy of the TCR website

Stakeholders
• Commuters in Texas
• Non commuters in Texas
• The investors and the government
• Counties through which the railway will pass.
High Influence, Low
Interest
High Influence, High Interest
Low Influence, High Interest
Low Influence, Low
Interest
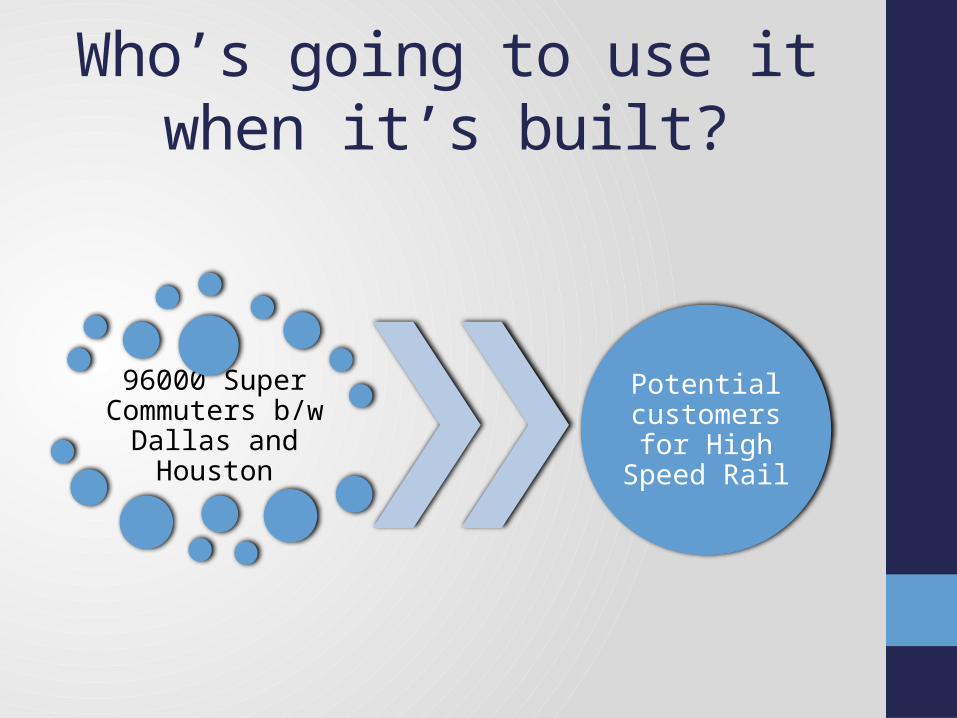
Who’s going to use it when it’s built?
96000 Super Commuters b/w
Dallas and Houston
Potential customers for High
Speed Rail
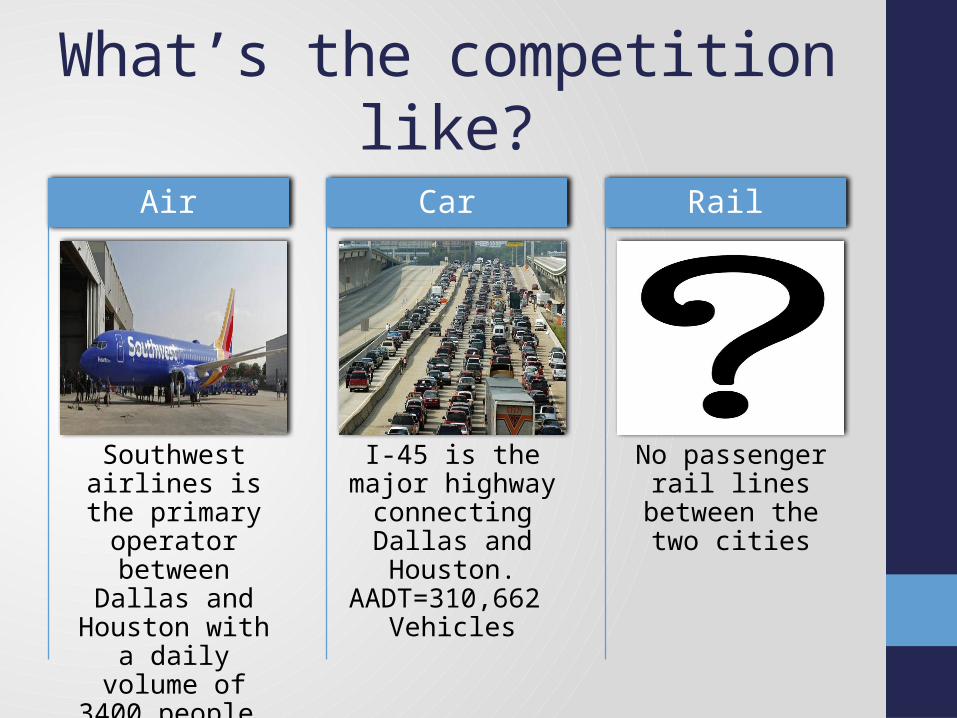
What’s the competition like?
Southwest airlines is the
primary operator
between Dallas and Houston with a daily
volume of 3400 people.
Air
I-45 is the major highway
connecting Dallas and Houston.
AADT=310,662 Vehicles
Car
No passenger rail lines
between the two cities
Rail

Do we really need it?

How much will it cost to build?
Capital Cost
Annual Operation
and Maintenan
ce Cost
Total Cost of the
project over
Design period

Capital Costs
Image from: Campos, de Rus; 2009

Capital Cost• The per distance cost of a HSR line depends
greatly on the topography of the land over which it is being built.
• The line will be built either adjacent to the existing BNSF track or along the utility corridor which run along mostly flat land.
• Based on a paper Campos, de Rus; 2009 , I concluded that $36 million per kilometer was the average cost of building a HSR line.
• Edward Glaeser who also ran a similar analysis used $53 million as the benchmark.
• Hence during my investigation I used these two values as best and worst case numbers.

What are the O&M costs?Item Dollars per Train Mile (2003$)
(based on CHSR Report 2004)Annual Costs (2003$)
Station Services 0.54 2,838,240
Insurance 1.32 6,937,920
General Support 0.95 4,993,200
Maintenance of Way 2.83 14,874,480
Train Operations 6.59 34,637,040
Equipment Maintenance 7.73 40,628,880
Marketing and Reservations 1.39 7,305,840
Power 4.66 24,492,960
Total 26.01 136,708,560
I calculated that the total annual mileage for 8 train sets is approximately 5,256,000 miles.

How much will the passenger have to pay?
• The figure on the left is from an article on the Transport Politic website by Yonah Freemark that compares rider cost per kilometer travelled.
• I assumed $0.3 per km to be acceptable. This yielded a ticket cost of about $116.

What are the sources of uncertainty?
Prior to Operation
During Operation
Phase
Annual O&M Cost
Ticket Prices
Ridership
Construction Time
Construction Cost
Primarily, construction cost and ridership will define the success or failure of the project. So for the purpose of my analysis, I will only be using them to construct scenarios.

Assumptions• The project will take 6 years to complete.• Ticket price remains constant over the design
period of 40 years.• The annual O&M cost is $136 million during year
1 of the operation after which it increase at a rate of 3%.
• Ridership increases at a rate of 5% till 2035 and then plateaus due to operational saturation.
• Load factor can be either 0.35 (worst case) or 0.75 (best case).
• Lower and upper bounds for per kilometer construction costs are $37 million and $53 million.
• No discounting to present value.

Scenario Construction & Analysis
• High Ridership• Low Construction Cost
Best Case Scenario
• High ridership and high constuction cost
• Low ridership and low construction cost
Neutral Scenarios
• Low Ridership• High Construction Cost
Worst Case
Scenariofile://localhost/Users/susheelsiram/Desktop/Evaluating Infrastructure Systems/Project (Policy Analysis)/Report 3/Cash Flow Sheet.xlsx

ResultsScenario
Total Construction Cost
Breakeven Year Net Project Revenue
Best Case $14,546,000,000 2033 $49,238,906,406
Neutral Case 1 $20,722,000,000 2036 $43,062,906,406
Neutral Case 2 $14,546,000,000 2045 $9,722,690,915
Worst Case $20,722,000,000 2055 $3,546,690,915
From the analysis, we can see that ridership is a more important factor than initial construction cost.

Recommendations
We want to limit the possibility of a bad outcome, both during construction and operation phase. Hence my recommendations would include:•A good travel demand model for the Dallas-Houston Corridor.• Limit the possibility of cost overruns for the project

Questions?

Thanks Prof. Schofer !!! From the class of 2015!
Picture Credits: Omer Verbas