Final PES Bussiness Models EN - Europa
32
1 SMALL-SCALE STUDY PES BUSINESS MODELS Authors and contributors: Andrea Naldini, Ismeri Europa, Italy; Carlo Chiattelli, Ismeri Europa, Italy; Simone Capolupo, Ismeri Europa, Italy; Eleonora Peruccacci, Ismeri Europa, Italy. Editor: Andy Fuller, Alphametrics Ltd, UK This report was prepared under contract to the European Commission, Directorate General for Employment, Social Affairs and Equal Opportunities in response to tender no. VT/2009/021 The views expressed in the report are not necessarily those of the European Commission nor those of the European Network of Public Employment Services. ISMERI EUROPA
Transcript of Final PES Bussiness Models EN - Europa

1
SMALL-SCALE STUDY
PES BUSINESS MODELS
Authors and contributors: Andrea Naldini, Ismeri Europa, Italy; Carlo Chiattelli, Ismeri Europa, Italy; Simone Capolupo, Ismeri Europa, Italy; Eleonora Peruccacci, Ismeri Europa, Italy.
Editor: Andy Fuller, Alphametrics Ltd, UK
This report was prepared under contract to the European Commission, Directorate General for Employment, Social Affairs and Equal Opportunities in response to tender no. VT/2009/021
The views expressed in the report are not necessarily those of the European Commission nor those of the European Network of Public Employment Services.
ISMERI EUROPA

2
TABLE OF CONTENTS
1. Introduction ........................................................................................................................................ 3
2. Methodology and expected outputs ................................................................................................... 4
3. Summary of results ............................................................................................................................ 5
4. Clustering of PES ............................................................................................................................ 23
5. Conclusions and potential policy implications ................................................................................. 26
Annex I – Matrix of results for variables used in the clustering exercise ... Error! Bookmark not defined.
ANNEX II – DATA LIMITATIONS ............................................................................................................. 31

3
1. INTRODUCTION
Public Employment Services (PES) are the focus of considerable attention in current European Union (EU) policy debates. On the one hand, as a consequence of the impact of the economic and financial crisis on labour markets, they are required - at a time of shrinking public budgets - to deal with an increased number of clients and to intensify efforts to counteract the risks of widespread long-term unemployment. On the other hand, they are being asked to review their service models in order to play an active role and contribute to meeting the ambitious targets and objectives set by Europe 2020 and the new Employment Guidelines1. The Agenda for New Skills and Jobs, for instance, notes how the PES have the capacity to become ‘transitions agencies’, to move away from the traditional role of servicing the unemployed and take a more comprehensive role as ‘lifelong service providers’2. For most PES this will mean catering for the needs of a broader range of client groups than before and delivering a wider range of services.
As a result, PES are faced with a unique mix of both immediate and future challenges. The European Commission is working actively with European PES to develop a common vision of how they should adapt their service model and mission in order to support the Europe 2020 objectives and play a key role in the delivery of the European Employment Strategy (EES). Presently, however, there is no clear picture (outside of each country/PES) of the current situation, or starting point, from which each PES has to build. It is apparent that there are both similarities and differences between PES in terms of organisation and financing model, client and service orientation, and target-setting and performance measurement systems. The extent of strategic reorientation necessary to achieve policy goals therefore varies significantly and, as a result, policy recommendations and progress assessments developed at European level should take into account the starting point of each PES. In this respect, PES are organisations in continue readapt in relation to the changes in the labour market and the national institutional arrangements and the same business models.. An information base describing the status quo, and which could be updated through time, would therefore be invaluable resource to support the current process of change.
In order to fill this information gap, the purpose of the present study is to develop and analyse structured and comparable EU-wide information on how PES are organised, who they service, what tools they use for serving their customers and how they measure their own performance – in other words, on PES ‘business models’. In order to do this, the study seeks to:
Collect and summarise relevant data provided directly by national Heads of PES through a questionnaire that was developed for this purpose;
Produce, on the basis of this information, comprehensive but concise information fiches on each of the respondents. These should be easy to look up and update and should serve as a key information resource for EU policy-makers dealing with such a diverse set of national institutions;
Systematise the information and identify key similarities and differences.
1 Council of the European Union (2010/707/EU), Council decision of 21 October 2010 on guidelines for the employment policies of the Member States. http://eur-lex.europa.eu/LexUriServ/LexUriServ.do?uri=OJ:L:2010:308:0046:0051:EN:PDF. 2 European Commission (2010), An Agenda for New Skills and Jobs: A European Contribution towards Full Employment, COM(2010) 682, 26.11.2010. http://eur-lex.europa.eu/LexUriServ/LexUriServ.do?uri=COM:2010:0682:FIN:EN:PDF

4
2. METHODOLOGY AND EXPECTED OUTPUTS
The study is based on information collected through a questionnaire sent to the Heads of PES in February 2011 and further enhanced in November 2011. Before launching the full data collection, the questionnaire was piloted, in January 2011, with a small number of PES (BE:VDAB, DE, EE, EL) selected to cover different criteria (size, geographical spread, competences, services and models, etc.). The results of this pilot were used to refine the final questionnaire.
The questionnaire consists of nine main sections as listed below. Each section includes one or more questions and sub-questions, which were specified to emphasise the key points of interest and the type of information required in order to try and obtain information that was sufficiently consistent to support a comparative analysis.
1. Basic organisational model; 2. Financing model; 3. Human resources; 4. Integration of employment services and benefit provision; 5. Clients/customers; 6. Types and methods of service provision; 7. Job vacancies and market share; 8. Active labour market policies; 9. Management logic and performance measurement;
The response rate was quite high with responses being received from 27 of 32 members of the EU/EEA PES network (Table 1)3. The quality of responses was generally reasonable though there were a number of specific issues (market share of job placement market, sources of financing, etc.) that were incomplete for a significant number of PES (see relevant sections below). A follow-up exercise was undertaken to improve data on financing.
Table 1 - Responding PES
BE
: AC
TIR
IS
BE
: FO
RE
M
BE
: VD
AB
BG
CZ
DK
DE
EE
IE
EL
ES
4
FR
IT
CY
LV
LT
LU
HU
MT
NL
AT
PL
PT
RO
SI
SK
FI
SE
UK
IS
NO
CH
X X X X X X X X X X X
X
X X X X X X X X X
X X X X X
X
The information from each response was then summarised into a standardised single-country/PES fiche in order to introduce a more or less common presentation in terms of content and style and make it more accessible and easier to use for comparative purposes. The completed fiches for each PES, which are approximately 5 pages in length, are included in annex.
The next step was to undertake a systematic analysis of the information from all fiches in order to give an overview of the situation and to highlight key similarities and differences in the PES models. The results of this analysis are described in section 3 below. On the basis of this information, Section 4 takes the analysis one step further and attempts to cluster and group PES by their different characteristics across a number of relevant dimensions.
3 This includes the 27 EU Member States – considering that Belgium has three employment services operating in the regional communities: VDAB, ACTIRIS and FOREM – plus Switzerland, Norway and Iceland. 4 Information on Spain refers to national PES.

5
The final stage of work was to demonstrate through examples how the information fiches can be used to support the ongoing development of policy. The PES will have a key role in the implementation of the Employment Guidelines, yet each has a specific remit within its own national set-up. There are a variety of different business models and some PES are at very different stages of development in terms of what they currently do in relation to, for example, support for clients outside the basic group of unemployed or provision of access to life-long learning opportunities. In other words, policy needs (where relevant) to take into account the different starting points of each PES and set objectives accordingly. In concluding the study, Section 5 summarises the main findings and uses the results of the clustering exercise to consider how the different groups of PES are positioned with respect to their capacity to respond to some key employment policy objectives.
3. SUMMARY OF RESULTS
Important notes
i) The analysis that follows attempts to identify key similarities and differences between PES for each of the issues covered but, at the same time, demonstrates that the information collected can only provide a first overview. In this perspective, the attribution of a PES to a group it does not mean that it perfectly corresponds to all the main features of the group.
ii) The analysis below covers only countries/PES that responded to the questionnaire (see Table 1 above). The situation in the following countries is therefore not taken into account: FR, CY, RO, CH, IS.
iii) The results of the analysis are dependent on the responses provided by each PES, which vary in quality and level of detail. Refer to Annex II for further information on the limitations of the data.
3.1 BASIC ORGANISATIONAL MODEL
Autonomy from government PES have a broadly similar mission across Europe – that is, to implement their government’s employment policies. However, the ways in which they organise themselves to pursue this task vary widely from country to country. First of all, PES have different degrees of autonomy from their governments and can be divided into two similar sized groups in terms of numbers of countries.
On the one hand, PES are executive agencies with their own separate management, but under the direct
control of government. This is the case in IE and LU, in Scandinavian countries (DK, SE, FI, NO) and in
some eastern countries (BG, HU, LT, PL, CZ, SK). PES in these countries are generally integrated into the
structure of Labour Ministries, though with some degree of administrative autonomy. The UK is a clear
example of this. JobCentre Plus has no policy-making authority and its structure, resources and operational
budgets and targets are all set by the parent government department (the Department of Work and
Pensions). Ireland is somewhat unusual in that, following the Government’s policy decision on organisational
restructuring in the provision of employment services, two Ministries are involved on a transitional basis. At
the present time, FÀS reports to the Department of Education and Skills but responsibility for employment
services policy and budgetary matters rests with the Department of Social Protection. However, this
situation is expected to change as the employment services and training arms of FÀS are being split into
separate organisations with employment services to become the sole responsibility of the Department of
Social Protection by the end of 2011.

6
In Italy there is another model. Tasks and functions on workers placement and active labour market policies
are attributed to the Regions and the local Administrations, within the coordination and promotion power and
policymaking role of the State. In particular, regarding the active labour market policies, Regions have the
task of planning and coordinating the measures aimed at increasing the employment and facilitating the
matching between supply and demand of labour. Within the bounds of their assignment, the Regions had put
the Province in charge of the management and provision of services, related to the placement activity. The
Province fulfill their tasks through specific offices, named Centri per l’Impiego (Public Employment Centers).
In other countries, on the other hand, PES are autonomous public bodies, though with different denominations and legal configurations (an ‘autonomous body of public administration’ in the Netherlands, a ‘regional public interest organisation’ in the Belgian region of Wallonia). This is the case in most of the continental (DE, AT, BE:FOREM, BE:VDAB, BE:ACTIRIS, NL) and southern countries within the sample (EL, ES, PT, MT), as well as in the remaining eastern countries (SI, EE, LV). In practice this means that, although the PES’ mandate is to implement the employment policies of the government in charge, the latter’s control over PES activities is limited5. In Germany, for instance, the Federal Ministry for Employment can only negotiate, but not impose, specific quantified targets to be reached by the Bundesagentur für Arbeit (BA). That said, it is worth stressing that even in these countries government control is to a different extent ensured by means of performance measurement mechanisms,or, like in Germany, by a mix of government addresses and performance measurement. PES are generally bound by multiannual contractual agreements with governments that detail the goals and targets to be reached (see section 3.8 below). Performance is monitored on a regular basis and financial bonuses and penalties are administered on the basis of results (see, for instance, DE and BE).
Decentralisation and local decision-making Due to the nature of their service-oriented work, all PES have a decentralised structure with local, district and regional offices, depending on country size. In broad terms, national or ‘head’ offices are generally tasked with coordinating with Labour Ministries and/or other government departments, providing nationwide labour market statistics and monitoring, and setting common rules for action, organisation and staff. Regional/district offices develop local objectives and priorities, support and coordinate the activities of local offices and, where appropriate or necessary, cooperate with regional governments. Finally, local offices are those that actually deliver services and deal directly with most of the clients.
Decentralised structures, however, do not necessarily imply decentralised decision-making. The participation
of local/regional offices in target setting and monitoring of performance tends to be more developed where
the PES are functionally independent from government (see, again, DE and BE). By contrast, the UK’s
JobCentre Plus must rank as Europe’s most centralised PES, with all decision-making and management
authority concentrated at the national level6. Two notable exceptions are Denmark - where the National
Labour Market Authority (AMS) has overall responsibility for the implementation and follow-up of employment
policies but local offices are run by municipalities, which are politically and financially responsible for active
labour market policies (ALMPs) – and Italy – where all responsibilities for PES were transferred to regional
authorities from 1990s, while in 2001 the Reform of Constitution has established the definitive devolution and
the exclusive legislative competence of the Regions on labour market policies. So the Central Government,
5 An exception is represented by Slovenia. The Ministry not only sets annual plans, but also defines the budget available to PES. 6 Weinshaupt, J. T. (2011), Managing Public Employment Services: Trends and Experiences with Recent Governance Reforms, unpublished paper.

7
by the Ministry of Labour, plans out strategies and policies, together with the Regions, Regions legislate
whereas Province deal with the provision of the employment services.
Finally, there is another rather different model in Spain, where the national PES deals mainly with unemployment benefits, while employment services are provided by the Autonomous Communities.
According to the above considerations and the previous observations on autonomy, it is possible to identify five main groups of PES:
Centralised PES (dependent on the Ministry and with limited decision making policy power), it includes small countries and countries with more centralised institutional organisation (BG, , SK, CZ, HU, LT; LU; LV;; UK);
Centralised with autonomy (dependent on the Ministry, but with autonomy in defining organisational and operational tools); it mainly includes federal states and north European countries (DE, EL, AT; PT, FI, SE, IE, MT, NO);
Decentralised with central coordination (local offices have a high degree of freedom in managing and intervention fields under the coordination of a central authority); it includes DK, PL, NL and SI.
Decentralised (dependent on regional/local authorities); it includes IT, ES and three PES of BE)
Independent public body - EE
Management structures PES have complex management structures with managing boards of different composition at the centre and different layers of local decision-making structures. Members of management boards are usually appointed by the government, whereas supervision of PES activities is either left to independent bodies composed of representatives of various stakeholders, or is performed directly by the relevant government department/ministry. The involvement of non-state actors like unions and employers varies, depending on national policy traditions and PES powers and competences.
In some countries the social partners are given an active role as members of managing boards or supervisory bodies. This tends to be the case in countries with insurance-based welfare state traditions, such as AT, DE and BE (FOREM, VDAB and ACTIRIS), where those who pay for benefit schemes, i.e. workers and employers, are also in charge of the bodies that manage them. Tripartite bodies of this kind are also present in those countries in the South (PT, EL, MT) and in the East (HU, SI, BG, EE, CZ) that chose to follow the traditional continental model. It is worth noting that in most, though not all, of these countries (AT, DE, EL, SI, HU) the PES are responsible for the payment of social benefits as well (see section 3.3).
In some other cases social partners have formal representation, but only in advisory bodies at different levels of government. This happens in ES and IT, in PL and in some of the Baltic states (LV, LT). Interestingly, this is also the case in NL and DK where, until recently, social partners held active management roles7.
In the UK and IE, in LU and in the remaining Scandinavian countries (FI, SE, NO) unions and employers are not directly involved in the management/governance of PES. Social partners may be regularly consulted, as is the case, for instance, in the UK. Yet, tellingly, the UK is a country in which unions and employers are nowadays considered as one stakeholder among many, and their actual impact on policy is generally rated as minimal6. Finally, in Slovakia tripartite bodies are not involved in the management of PES.
The overview of key features of PES organisational set-ups suggests the existence of at least two broad, but clearly identifiable models. 7 In the Netherlands, unions and employers were represented in PES managing boards at national and regional level until 2002. Nowadays they only participate in a tripartite advisory body advising the Minister for Employment and Social Affairs. In Denmark, a 2009 reform transferred all responsibility for ALMPs to Municipalities and forced social partners, which were previously actively involved in the implementation of ALMPs through their participation in Regional Labour Market Councils, into a purely advisory role.

8
On the one hand, in IE and most Scandinavian countries (FI, NO, SE), as well as in LU, PES are executive government agencies, they tend to be centralised and have management structures that do not provide for an active role on the part of social partners. On the other hand, PES in most continental countries in the sample (AT, BE:ACTIRIS, BE:FOREM, BE:VDAB, DE) are generally decentralised, functionally and organisationally independent from government and involve unions and employers in management structures. Similar systems are in place in some southern countries (EL; MT, PT) and in Slovenia.
In other countries (LV, NL, ES), PES are independent and decentralised, but social partners are only granted an advisory role. In the case of ES social partners are also involved in advisory bodies at different levels. It is worth noting, however, that not all respondents fit into these two broad models of PES organisation. Denmark and Poland, for instance, all have decentralised PES that are directly subject to government control, with social partners involved in advisory bodies at different levels. Bulgarian, Hungarian and Lithuanian PES, by contrast, are executive agencies in which social partners have a role, either in management (BG, HU) or in advisory bodies (LT).
3.2 FINANCING MODEL AND HUMAN RESOURCES
Financial resources In the questionnaire, PES were requested to provide information about their total expenditure for 2010 and 2011 (forecast) using the following breakdown: total budget, operational costs and ALMP costs. Where relevant, they were also asked to separate out the amounts spent on unemployment benefits (where these are paid out of the PES own budget) and identify the purposes of any residual expenditure not falling within the main categories. A breakdown of expenditure by source of financing was also requested.
From the 27 responses received, complete data (both 2010 and 2011) on financial resources were provided by 25 PES, while information on sources of finance was provided by 26 PES.
Table 2 - Completion of data on PES financing model8
BE
: AC
TIR
IS
BE
: FO
RE
M
BE
: VD
AB
BG CZ
DK
DE
EE IE
EL
ES
FR IT
CY
LV LT
LU
HU
MT
NL
AT
PL
PT
RO SI
SK FI
SE
UK IS
NO
CH
Total budget
X X X X X X X X X X X X X X X X X X X X X X X X X
Expenditure breakdown
X X X X X X X X X X X X X X X X X X X X X X X X X
Source of finance
X X X X X X X X X X X X X X X X X X X X X X X X X X
Changes in 2010-2011 budgets
A second issue covered by the questionnaire is the question of how expenditure is expected to change between 2010 and 2011. Results based on total reported expenditure (actual in 2010, budget in 2011) show that PES budgets are expected to:
increase by more than 5% in 5 out of the 24 PES providing data for both 2010 and 2011 (BE:ACTIRIS, BG, EE, EL, MT); decrease by more than 5% in 11 PES (DE, IE, LV, LT, NL, PL, PT, SI, CZ, SK and FI);
8 HU provided data on total budget and expenditure breakdown for 2010 only. BE: VDAB provided data for sources of finance, total budget and ALMP costs. NL data are not completely reliable. SK questionnaire was received too late to be included in the analysis.

9
not change significantly – within a +/- 5% range – for the remaining 8 PES (BE:FOREM, BE:VDAB, DK, ES, AT, SE, UK and NO).
However, these figures should be treated with extreme caution. Firstly, the figures for some countries are dominated by anticipated expenditure on benefits and may not reflect the underlying trend for the routine operation of the PES. Moreover, even for those countries where benefits are not included, the figures may not represent the real trend because of extraordinary events (e.g. restructuring) or unusual expenditure items (e.g. fixed-term crisis response measures), which can have an important impact on the overall figures.
The data also show some rather unexpected patterns when comparing the change anticipated for total expenditure and the breakdowns for ALMPs and operational costs. For example, in some cases, the data reported show that operational costs are expected to rise whilst ALMP budgets decline (e.g. DK, DE, LT, AT, )9. This depends mainly on the fact that budgets are often affected from one year to the next and/or as explained in the case of AT due to the fact that ALMP costs can be cut easier than staff or other fixed costs. The rather variable nature of the information provided (see further in Annex II) makes it difficult to identify clear trends in this respect.
Information on the sources of PES finance is less problematic, although some shortcomings do exist. For example, in some cases figures for different sources have been grouped together, without mentioning the relative weight of each. In addition, where the PES is responsible for the payment of unemployment and other benefits, the inclusion of this expenditure strongly influences the overall breakdown (benefit expenditure is almost always derived from social security contributions).
Bearing these points in mind, the most common sources of finance for PES, in order of priority, are as follows (lists refer to the 25 PES that provided a complete response on this issue):
Government and other public funding covers at least 95% of funding for 10 of the 25 PES that provided a complete response (BE:ACTIRIS, BG, DK, ES, HU, LU, PL, FI, SE, NO). Nine PES (BE:FOREM, BE:VDAB, IE, MT, NL, SI, CZ, UK, SK) are funded by government and other public funding for a share ranging between 50% and 95%, while the share ranges between 10% and 50% for four other PES (DE, EE, EL, LV). By contrast, government funding is of minor importance in LT and not mentioned at all by PT. In the case of AT there is a gap between revenues and expenditures and the government guarantees the funding of unemployment benefits.
Social security contributions are the sole, or almost the sole, source of funding for AT10 and the major source (between 50% and 95%) for a further 5 PES (DE, EE, EL, LT, PT). The share ranges between 10% and 50% for two PES (NL, UK). However, in the majority of cases (16 PES) social security contributions do not contribute to PES finance.
The ESF was the main source of finance (between 50% and 95%) for LV. It represented as a significant source of finance (between 10% and 50% of the total) for 7 PES (EL, LT, MT, PT, SI, CZ, SK) and a small contribution (less than 10%) for 6 more (BE:Actiris, BE:FOREM, BE:VDAB11, DE, EE, AT).
The category of ‘other sources’ supported between 10% and 50% of the total PES budget in Ireland (National Training Fund) and in Germany (Apportionment Funds and Reserve Assets).
PES own revenues accounted as a minor contribution in 4 other PES (BG, DE, IE, SI, BE:VDAB).
Two further sources of finance – EURES and other EU funding – are of minor importance in six cases (BE:FOREM, EE, LT, LV, BE:VDAB, CZ).
No clear regional patterns emerge across Europe in terms of financing sources, except perhaps in the Nordic countries where PES are financed exclusively by government and other public funding. In some Objective Convergence countries the importance of ESF is significant.
9 Or else ALMP costs are expected to decline proportionally more than operational costs (i.e. PL and PT). 10 The Austrian PES is financed by social insurance contributions of employers and employees. The budget for ALMP and operational costs is fixed each year by agreement between the administrative board and government. However, the government provides a guarantee to ensure payment of unemployment benefits in case expenditure exceeds revenue. This occurred in both 2009 and 2010. 11 ESF is mainly used by BE:VDAB vocational training department (about 2/3 of the whole amount).

10
Figure 1 - PES sources of finance, 2010
Source: European Commission, PES business model questionnaire, 2011
Human resources PES were asked to provide information on their human resources at the different organisational levels (e.g. central, regional, local) and to identify the proportion of those who service clients directly (jobseekers and/or employers). Table 3 below summarises the completion of each element of the data requested on the basis of the contributions received.
As would be expected, the number of staff working in PES varies greatly between countries but this is not, in general, a measure of efficiency as the numbers correlate significantly with the population of the appropriate country/region. PES resources range from around 110,000 staff in Germany to 227 in Malta. Unsurprisingly, most PES staff are employed in local offices where they work directly with clients, though the figures for each PES are not entirely comparable in this respect due to differences in the range of staff considered to be directly servicing clients (see Annex II).
Eight PES deploy at least 70% of their total workforce in local offices (AT, BG, DK, FI, LV, PL, SE, SK). In seven further cases (BE:VDAB, DE, EE, HU, IE, SI, CZ) local offices are combined with regional offices and together the share also reaches at least 70%. Head offices account for a significant share of PES employees in just a few cases: between one-fifth and one-third in EE, LV, SI and an extreme case of 71% in BE:ACTIRIS (the PES servicing the Brussels-capital region of Belgium)12, where however61% of their employees are directly servicing clients, including servicing at headquarters.
According to the data provided, but bearing in mind potential differences in coverage, the proportion of total staff directly servicing clients is above 60% for the vast majority of PES providing data (15), while the share decreases to a range between 20% and 50% for the remaining 3 PES (PL, PT, CZ) .
12 This analysis is based on 23 questionnaires. The 19 questionnaires providing complete and reliable data on PES staff, plus DK, BE:Forem, SK and EL that provided data for total staff split by organisational level.

11
Table 3 - Completion of data on PES human resources13
BE
: AC
TIR
IS
BE
: FO
RE
M
BE
: VD
AB
BG CZ
DK
DE
EE IE
EL
ES
FR IT
CY
LV LT
LU
HU
MT
NL
AT
PL
PT
RO SI
SK FI
SE
UK IS
NO
CH
Total staff X X X X x X X X X X X X X X X X X X X X x X X X X
Breakdown by level
X X X X x X X X X X X X X X X X X X X x X X X
Client-facing staff
X X X x X X X X X X X X X X X X X X X X X
PES resources summary Although no clear pattern emerged in terms of the changes in PES expenditure anticipated for 2011 (compared to 2010), it is worth noting that in nearly half of cases (9 out of the 22 PES providing data), expenditure is expected to decrease by more than 5%. This picture is confirmed by the findings of another questionnaire being conducted in parallel by DG Employment on 'PES adjustment to the crisis 2011' according to which a reduction in expenditures is expected in a majority of PES between 2010 and 201114. After a period of increased expenditure between 2007 and 2010 to cope with the impact of the economic crisis, it is likely that starting from 2011 a significant proportion of PES will be affected by government cuts. The detailed explanation for PES budget reductions will vary between countries but may be explained by a combination of austerity measures, the phasing out of temporary crisis support interventions, and a decrease in the number of clients needing support.
The most common source of finance for PES is government budget and other public funding. This covers more than 50% of the total budget for 19 of the 26 PES providing data. Social security contributions is the second most important source, being the most relevant source for AT (Austrian government covered almost 20% of the overall expenditure, namely for unemployment benefits) and the main one for 5 additional PES. There is no clear relationship between PES organisational models and their main source of finance. However, in a significant number of countries where PES are centralized executive government agencies, with management structures that do not provide for an active role for social partners, they tend to be funded mainly by government transfers (i.e. IE, LU, NO, SE, FI, UK). Conversely, where PES are more decentralised and independent from government as well as, sometimes, with a stronger involvement of social partners, social security contributions tend to be the largest source of finance (i.e. AT, DE, EE, EL, LT, PT). The three Belgian PES demonstrate a mix of decentralisation and government funding. The remaining PES associate government transfers with different levels of decentralisation, organisational autonomy and different degrees of involvement of social partners.
Most PES staff are employed in local and/or regional offices, where they are more likely (than those in head offices) to work directly with clients. The available information is insufficient to see if PES with a higher degree of decentralisation allocate more staff to local and regional offices.
The proportion of staff directly servicing clients is an important aspect of the PES strategy for dealing with both jobseekers and employers. Questionnaire results indicate that in the majority of PES at least 60% of staff work directly with clients. Findings of the questionnaire 'PES adjustment to the crisis 2011' show that in about two-thirds of the PES surveyed the total number of PES staff and the proportion directly servicing clients both rose in the period 2008-2010 in response to the economic crisis. The budget cut-backs now anticipated make it likely that PES will have to reduce staff numbers but it remains to be seen if the working model can be adapted to maintain high levels of frontline staff.
13 Data for Norway appear to be unreliable as PES total staff does not coincide with the sum of staff working at the different organisational levels. Note that some gaps in the data covered here are filled by data provided for the questionnaire on 'PES adjustment to the crisis 2011' 14 Assessment made on the basis of PES expenditure excluding the costs of unemployment benefits (where relevant).

12
3.3 INTEGRATION OF ACTIVE AND PASSIVE POLICIES
Unemployment benefits In many European countries PES have been merged with social security bodies and deal, in addition to employment services, also with the payment of unemployment benefits. This applies to some continental (DE, AT, NL, LU) and southern countries (ES, EL), as well as in the UK, NO and in a number of central and eastern EU Member States (SI, HU, EE, PL, CZ). Benefit payments are dealt with in one-stop shops at the local level, such as the Greek ‘Employment Promotion Centres’, or in separate Benefit Delivery Centres like in the UK.
That said, it is worth stressing that in all countries (an exception is represented by Slovakia, where PES is not responsible for the provision of any benefit), even those where active and passive policies are not integrated (BE: ACTIRIS, BE:FOREM, BE:VDAB, DK, SE, FI, IT, PT, MT, BG, LT, LV), the PES are responsible for registration and for checking the continued eligibility of recipients. It is, indeed, through registration/payment of unemployment benefits that PES come into contact with the unemployed, who traditionally form the bulk of their clientele.
Good information flows are critical to efficiently handling clients by benefit and other service providers. In cases where employment services and benefit provision are not integrated in the same structure, complex systems for the exchange of information between PES and social security bodies are usually in place. ICT tools can help greatly in reducing difficulties in information flows as well as enabling individual follow-up and thus minimise the possibility of benefit abuse. Coordination problems arising from information flows between different actors / institutions can be significantly reduced where benefit management is falls under the responsibility of one authority.
Other social welfare benefitsIn relation to Guideline 7 of the Employment Guidelines15 and the objective to increase participation in the labour market, one of the big questions for PES is how to establish contact with groups other than the traditional unemployed actively seeking a job. Increased PES attention from the registered unemployed to people more distant from the labour market is a big challenge for the PES’s usual practice and a fundamental support for a more flexible and participated labor market. One possibility is for the PES to take responsibility for payment of other types of welfare benefit, such as incapacity benefits, family allowances and minimum income schemes which would, by default, bring a range of inactive people (unemployed not actively searching for a job but potentially employable) into contact with the organisation and increase opportunities to offer employment and other guidance services. For instance, the JobCentre Plus in the UK deals with the Employment Support Allowance (ESA) for people who cannot currently work due to illness or disability. JobCentre Plus is responsible for registration and payment of benefits but also offers recipients access to personal advisors who can encourage people to deal with their condition and return to work. Specialised outsourced services are also available.
Further examples of PES dealing with disability, sickness and rehabilitation benefits can be found in NO, HU, CZ and NL. In Greece, local employment centres deal with the payment of family allowances and maternity benefits. Germany’s BA is in charge of supporting the long-term unemployed after entitlement to the regular unemployment benefit has expired. In Austria, AMS registers all people for minimum income allowance and provides services for recipients in co-operation with other bodies, including the municipalities which actually pay the benefits. In Spain, the national employment service (SEPE) is responsible for both contributory unemployment allowances and non-contributory welfare benefits, though employment services are provided by the PES of the Autonomous Communities.
15 http://eur-lex.europa.eu/LexUriServ/LexUriServ.do?uri=CELEX:32010D0707:EN:NOT

13
In summary, questionnaire responses indicate that nearly half of PES take charge of the actual payment of unemployment benefits in addition to their traditional role in processing benefit applications and monitoring the continued eligibility of recipients. Moreover, a significant number also have responsibility for other social benefits (DE, EL, ES, HU, NL, NO, UK, CZ), or are setting up new forms of cooperation with other public bodies to activate benefit recipients (AT16). Overall, there would seem to be a fundamental shift in the business model. PES clients are no longer exclusively unemployed jobseekers, rather the focus is on working-age beneficiaries of different forms of publicly-funded income support with the objective being to get people off benefits and (back) into work. This is particularly evident in countries where all benefits for people of working age are administered by the employment services (see HU, NL, UK, NO). As will be further discussed in Section 5, this is a critical development in relation to the over-arching EU objective of raising labour force participation since most recipients of social benefits are often not actively searching for a job and are therefore harder to reach by PES. These considerations imply a new role for PES, which goes beyond the responsibility for unemployed registered people and covers for other “non-registered” people with a broad range of instruments and partnerships.
3.4 CLIENTS/CUSTOMERS
Jobseeker clients PES in European countries adopt different approaches to tailor-made interventions on the needs of their clients and, at the same time, deal with major or increasing social problems. Some of them prefer a highly developed individualisation of the services in order to keep a generalised approach and at the same time answer to multidimensional needs. Others prefer to develop targeting and define tailor-made programmes or action plans for specific social groups. The two approaches are not alternatives and are often mixed up; in addition, both approaches utilise monitoring instruments or analyses for identifying the priority target groups and implementing specific actions for them. In the paragraph a map of these activities is proposed on the basis of the results of the survey; it provides an overview of the current priorities and of the range of different groups followed by different PES.
Most PES use target groups to categorise their clients. The following are most commonly used:
Unemployed/benefit recipients;
Employed;
Young (precise age-groups vary between PES);
Older;
Long-term unemployed;
Disabled.
Less frequent groupings include: the inactive; women/men re-entering the labour market after parental leave; ex-prisoners, ex-substance abusers; lone parents; legal immigrants.
For monitoring purposes, the breakdowns used by most PES are:
Gender (in all countries except IE and UK);
Age (everywhere);
Duration of unemployment (except IE and DE);
Disability (except BE:FOREM).
Less widely used breakdowns include: level of qualifications; employment history/work experience; sector of last job; immigration/refugee status and so forth.
16 The Austrian minimum income benefit is new, however persons receiving former social assistance and able to work have always been AMS clients.

14
It is worth noting that continental countries – and notably AT, NL and BE:VDAB and FOREM – seem to have the most complex systems for monitoring different jobseeker clients (6 or more different sub-groups) together with some eastern countries (PL, LT, LV, CZ). Countries like DK, FI, BG, the UK, IT, SK and MT resort to similarly complex groupings (5 sub-groups), while all the others only adopt 2 to 4.
Table 4 below takes the analysis one step further. Rather than listing client types or classes, it clusters them into 5 clearly distinct groups with clearly identifiable common features (unemployed, underrepresented groups, vulnerable groups, job-changers, people not actively searching for a job but employable). Some of these groups are composed by only one of the above client types, while in other cases they encompass 4 (underrepresented groups) or 5 (vulnerable groups). Respondents that target each of the groups (or at least two of the client types within them) are noted down in the right-hand column.
Table 4 - PES client groups
Unemployed/benefit recipients AT, BE:ACTIRIS, BE:FOREM, BE:VDAB, DE, LU, NL, DK, FI, NO, SE, BG, HU, EE, LT, PL, SI, IE, UK, EL, ES, IT, PT, MT, CZ
Underrepresented groups (young, older, women, legal migrants)
AT, BE:FOREM, BE:VDAB, DE, EE, NL, FI, LV, IT, MT, IE, EL, ES, CZ, SK
Vulnerable groups (disabled, long-term unemployed, ex-prisoners, ex-substance abusers, lone parents)
AT, BE:FOREM, BE:VDAB, LV, EE, UK, MT, IE, EL, DE, ES, CZ, SK
Job-changers (employed jobseekers)
BE:ACTIRIS, DE, NL, SE, BG, EE, LT, PL, SI, IE, ES, IT, PT, BE:VDAB
Inactive (people not actively searching for a job or registered but deemed employable)
DE, DK, NO, LT, BE:VDAB
This table offers an overview of different strategies concerning the targeting of jobseeker clients. Whereas the registered people are the traditional PES client base and are mentioned by all but two respondents (LV and SK), other groups are considered only by some. It is worth noting, for instance, that the inactive are acknowledged only by five countries as a specific client group (DE, DK, NO, LT, BE:VDAB). Based on this, a number of national differences or patterns can be identified. For instance, the UK appears to focus predominantly on vulnerable groups (i.e. those furthest from the labour market and most in need of assistance), DE and DK on the people not actively searching for a job or not registered and on job-changers, AT and FI on underrepresented groups, IT and NL on underrepresented groups and job-changers, and so on. The issue of national PES strategies is discussed in more detail in the conclusions.
Employer clients Employer clients are most often categorised by:
Sector of activity;
Size;
Type of support required (e.g. firms announcing collective redundancies);
Number of notified vacancies;
Need to train or re-train employees and/or willing to participate in ALMPs.
Often a mixture of several indicators is adopted to categorise employers and these categories need not be interpreted in an alternative way.
Table 5 below offers an overview of different criteria for classification and the countries that adopt them.

15
Table 5 - Classification of employer clients
Sector of activity BE:VDAB, LU, NL, NO, BG, HU, LT, IT, MT, PT, BE:ACTIRIS, ES, AT, CZ
Size BE:ACTIRIS, BE:FOREM, BE:VDAB, DE, NL, FI, BG, EE, HU, LT, LV, PL, SI, UK, MT, PT, ES, CZ, AT
Type of support required (ex. firms announcing collective redundancies)
DE, NL, FI, HU, EE, SI, BE:VDAB, ES, IE
Number of notified vacancies/Turnover vacancies AT, BE:VDAB, BG, EE, NO, PT, UK, ES
Need to train or re-train employees and/or willingness to participate in ALMPs
HU, EE, PL, EL, PT, ES
In addition to these categories, the territorial coverage of the services provided should be considered, , because in some cases support to employers is limited to the local level and in case of firms who do recruitment at the national level it is enlarged to the national level.
As can be noticed, company size in terms of the number of employees and the number of open positions is by far the most common means of classifying employers and is used by all PES except AT, LU, DK, NO, SE, IE, EL, ES and IT, though BE:FOREM also classifies employer clients in terms the development potential of firms. Other than that, very few countries rely on composite classifications: only AT, BE:VDAB, FI, BG, HU, EE, and PT report taking into account three or more sub-groups of employer. All other PES use just one or two criteria to categorise employers..
Nearly all PES reported targeting specific groups of jobseekers and employers. All mentioned at least one group of jobseeker clients, while just four made no reference to any categorisation of employer clients (DK, ES, IE, SE). However it was impossible, on the basis of the above data, to clearly identify different targeting strategies – an attempt at clustering respondents resulted in as many as 9 groups and still left out 3 outliers. What is more, other sources of information suggest that the approach to target specific categories of client is losing favour. For instance, the BA in Germany, now implements a generalised approach that does away with targeting of specific groups and is based on an early assessment to determine the employability of each client followed by individualised case management for hard-to-place clients17.
3.5 TYPES AND METHODS OF SERVICE PROVISION
Services for jobseekers The services most frequently offered by PES to jobseekers include:
General channels to provide services for jobseekers o Information, advice and guidance (counselling, orientation, referral to training, etc.) o Individual face-to-face support (skills testing, profiling, individual action plans, etc.) o Group activities (job clubs, information seminars, job fairs, etc.) o Multi-channelling provision of their services
Teams or advisors for special target groups (the long-term unemployed, the disabled, ex-prisoners, substance abusers, ethnic minorities, low-skilled or unskilled jobseekers)
Specialised services (normally by specialised counsellors), and notably: o Career guidance for the young (vocational orientation)
17 Müller, W. (2010), Vulnerable people on the labour market: The BA approach, Workshop presentation Inclusion through Mobility: addressing the needs of the most vulnerable, London, May 2010. http://www.mobilitypartnership.eu/WebApp/Events.aspx?EventID=4

16
o Career guidance for older workers (over 50 years of age) o Case management, intensive support for jobseekers facing multiple issues/barriers
In-house training for jobseekers
All PES offer at least some of the above services (Table 6). In particular, most report offering information and guidance and making recourse to multi-channelling through self-service facilities such as vacancy and CV databases and online access to relevant information. Referral to training or vocational activities is also widespread. Individual face-to-face support and specialised services, by contrast, are only provided by a limited number of PES. Individualised supports such as skills testing and profiling are carried out by less than half of PES (BE:VDAB, LU, NL, FI, NO, SE, SI, UK, ES, MT, PT). An exception is represented by EE, since PES carry out skills testing, but not profiling. Specialised counselling services for younger and older jobseekers are mentioned by a small number of respondents (BE:FOREM, BE:VDAB, DE, MT, SI). Finally, one in five respondents (BE:FOREM, BE:VDAB, HU, IE, MT) reported providing in-house training services.
Table 6 - PES services, channels and measures for jobseekers
General channels and methods for provision of services to jobseekers
Information, advice and guidance AT, BE:ACTIRIS, BE:FOREM, BE:VDAB, DE, NL, DK, FI, SE, BG, EE, HU, LT, SI, IE, EL, ES, IT, MT, PT, CZ, LV, LU, SK
Individual face-to-face supports AT, BE:ACTIRIS, BE:FOREM, BE:VDAB, DE, LU, NL, DK, FI, NO, SE, BG, EE, HU, LT, LV, PL, SI, IE, UK, EL, ES, IT, MT, PT, CZ, SK
Group activities AT, BE:ACTIRIS, BE:FOREM, BE:VDAB, LU, NL, FI, NO, EE, HU, PL, SI, IE, UK, EL, MT, ES, CZ, SE
Multi-channelling provision of services BE:ACTIRIS, BE:FOREM, BE:VDAB, DE, LU, NL, DK, FI, NO, SE, BG, EE HU, LT, LV, SI, IE, UK, EL, ES, IT, MT, PT, CZ, AT
Teams of advisors for special target groups BE: FOREM, FI, SE, LV, EL, ES, IT, SI
Specialised services
Career guidance for the young AT, BE:FOREM, BE:VDAB, DE, EE, SI, MT, ES, SK
Career guidance for adults (over 50 years of age)
AT, BE:VDAB, DE, EE, SI, ES
Case management, more intensive support for jobseekers facing multiple issues/barriers
AT, BE:FOREM, DE, BG, EE, HU, SI, IT, IE, ES, CZ, SK, LU, NL, LV, SE
In-house training for jobseekers BE:FOREM, BE:VDAB, HU, IE, MT
Services for employers As regards services routinely offered to employers, the most common ones include:
General services for employers o Information, advice and guidance for recruitment (vacancy registration, vacancy and CV
databases, pre-selection/selection services, etc.) o Legal and financial counselling (information and guidance on access to subsidies, advice on
contracts, etc.)
Specialised services o Support for human resources development or other (training for employees, placement
information/subsidies for hiring persons belonging to vulnerable groups, etc.).

17
Table 7 - PES services for employers
General services for employers Information, advice, guidance for recruitment
AT, BE:ACTIRIS, BE:FOREM, BE:VDAB, DE, LU, NL, DK, FI, NO, SE, BG, EE, HU, LT, LV, PL, SI, IE, UK, EL, ES, IT, MT, PT, CZ
Legal and financial counselling AT, BE:ACTIRIS, BE:FOREM, DE, BG, HU, SI, ES, NL, CZ, SK, LV, IT
Specialised services Support for human resources development or others
AT, BE:FOREM, BE:VDAB, DE, FI, SE, BG, HU, EE, LT, LV, PL, MT, SI, NL, CZ, SK
As is apparent in Table 7 above, fewer PES offer comprehensive services for employers than for jobseekers. About three quarters of respondents report offering at least two out of three of the service types listed above (AT, BE:ACTIRIS, BE:FOREM, BE:VDAB, DE, NL, BG, EE, HU, ES, IT, CZ, SK, LV, FI, SE, LT, PL, SI, MT). More specifically, among information and guidance for recruitment services, pre-selection is provided by three out of four PES, whereas web-based information services for employers are offered by 60% of PES (AT, BE:ACTIRIS, BE:FOREM, BE:VDAB, DE, LU, NL, DK, FI, NO, SE, BG, HU, EE, LT, LV, SI, IE, MT, CZ). Among specialised services, support for training for employees is offered by more than 50% of respondents (AT, BE:FOREM, BE:VDAB, DE, FI, SE, BG, HU, EE, LT, LV, PL, MT, CZ, SK, NL). Finally, legal and financial counselling services are only occasionally offered (AT, BE:ACTIRIS, BE:FOREM, DE, BG, HU, ES, IT, SI, CZ, SK, LV, IT).
3.6 JOB VACANCIES AND MARKET SHARE
Collection of information on job vacancies In most countries employers volunteer information on vacancies, the only exceptions being SI and LU, where notification of vacancies to the PES is mandatory. Employers choosing to advertise vacancies with PES are offered in return the entire palette of their services, including information, publicity, guidance and pre-selection18. Some respondents report offering tailor-made solutions for employers who are willing to take on jobseekers from vulnerable groups, such as pre-selection from application forms or work trials (see the UK).
Multi-channelling techniques are now widespread, so that employers can report vacancies in a variety of ways. They can either contact local PES offices via the use of traditional means (by free-phone, fax, etc.), or utilise web-based services such as self-service portals. Furthermore, all respondents maintain that PES contact employers directly on a regular basis to learn about vacancies and update their registers. Potential targets are identified either by recourse to ‘internal’ information (ALMP/employer registers) or using ‘external’ information (chambers of commerce, associations, public authorities) (see EL). Direct contacts take place, again, through different channels, from telephone interviews and face-to-face conversations to surveys and ad hoc campaigns (see SE, FI). Events like job fairs, open days and workshops with interested employers are organised throughout. In Malta, the Employment and Training Corporation (ETC) convened a seminar with private recruitment agencies in order to gain a better understanding of employers’ preferences and needs.
In some cases, where there is an established practice of partnership and cooperation between the PES and the relevant actors, Temporary Work Agencies (TWAs) and specialised recruitment websites may also supply information on vacancies (see BE:FOREM, BE:VDAB). EURES services support the diffusion of information on open positions in other EU Member States.
18 See section 3.5 above.

18
Vacancy statistics Three-quarters of PES provided information on numbers of vacancies and filled positions (AT, DE, NL, FI, SE, DK, NO, ES, EL, PT, UK, IE, PL, LT, HU, BG, CZ), but only about half of them were able to provide data on the number of referrals (AT, DE, FI, NO, UK, IE, HU, SI, LT, CZ. In ES vacancies statistics are calculated by the Regional PES and methods can differ, but statistics are normally provided.
The information provided by respondents have been broadly categorised under the different indicators used:
Filled vacancies (BG, CZ, DE, FI, HU, LV, MT) ); figures between 13% and 43%, but methods for calculating them are significantly different among countries;
Advertised vacancies19 (BE:ACTIRIS, BE:FOREM, BE:VDAB, FI, LT, NO, SI, UK); figures between 33% and 60%;
Mediated vacancies (EE) with a value of 44%;; Generic market share measures (ATError! Bookmark not defined., BE:FOREM, DK, PL); figures
between 30% and 86%. These figures should be treated with caution, however, as even those grouped together are not calculated on the same basis. Country fiches report all available information on figures and estimation methods; we suggest analysing them for more in-depth understanding of approaches and possible comparisons.
Anticipation of skills needs Monitoring of labour market needs is carried out regularly by some PES, but not by all. In particular, most southern countries (PT, MT, EL) apparently undertake no analyses of this sort. Among the PES that do attempt to assess demand, some utilise regular surveys of employers’ needs (AT, SE, FI, NO, LU, HU), while others cross-check the records of unemployment registers with the characteristics of advertised vacancies (DE, AT, LV, SI, BG). In some countries, monitoring is only carried out at the regional/local level (AT, UK, PL). Some PES have specific departments or research institutes dedicated to labour market analysis and skills forecasting (DE, BE:FOREM, BE:ACTIRIS, IE), while others rely on their local network of county offices and external contractors like polling firms (NO). The monitoring of the needs of the labour market is also regularly carried out by ES.
Although the anticipation of training needs is considered a crucial issue going forwards, relatively few PES indicate that they currently use the results of demand-side monitoring to plan training actions (AT, DE, BE:FOREM, BE:VDAB, NL, NO, PL, SI, EE, LT). In one case (BG) results are used to settle the university intake for the following year. However, the NL does not have any systematic labour market monitoring for planning of training policies, as the PES itself are barely involved in any training policies.
These findings concur with those of a recent study on the issue commissioned by DG Employment20, which observes that the capacity for anticipating skill needs varies widely among European PES. According to the study, employer surveys are the main source of labour market information and there is no systematic use of quantitative forecasts or foresight studies. The dialogue with employers mainly concerns current vacancies and often involves a rather small subset of potential targets. Cooperation with education and training providers is not widespread. Finally, in line with the observations above, the study also notes a geographical divide in terms of access to quality labour market data and forecasts: most PES in Southern and Eastern European countries lamented the limited availability and poor quality of forward-looking labour market information.
19 Ratio between the number of jobs mediated by the PES and the total number of job vacancies. 20 Danish Technological Institute et. al. (2010), Anticipating skill needs of the labour force and equipping people for new jobs: Which role for Public Employment Services in early identification of skill needs and labour up-skilling, VC/2009/005, Final Report. http://ec.europa.eu/social/BlobServlet?docId=6664&langId=en

19
3.7 ACTIVE LABOUR MARKET POLICIES
The questionnaire on which the present study is based asked respondents to list the principal categories of active labour market policy programmes they have in place, organised, according to the Eurostat classification, into labour market ‘services’ and ‘measures’21. Only specific programmes are of interest here, and not general services which have been reviewed above.
Labour market services (LMP category 1) Based on the information provided, the labour market services most widely offered by PES can be categorised into five main types:
Complex counselling and orientation services are offered by nearly all respondents. These include, inter alia, the drawing up of individual action plans (IAPs) detailing the steps to be undertaken by the PES and individual clients in order to facilitate the latter’s re-employment. More specific services, such as medical and psychological support, instead, are only offered by a few PES (BE:VDAB, DE, BG, HU, EE, SI, MT, PT, FI, SK). Guidance for vocational rehabilitation is only mentioned by four respondents (FI, HU, NO, CZ);
Advanced job search assistance in the form of job search workshops, job clubs and job coaching sessions are provided by less than half of respondents (AT, BE:ACTIRIS, BE:VDAB, NO, SE, EE, HU, SI, PL, IE, UK, EL, NL);
Advanced matching and placement support, notably in the form of placement or training vouchers or web-based services, is also offered by approximately half of PES (AT, BE:FOREM, DE, DK, FI, BG, SI,PL, IE, IT, MT, NL). The Danish Labour Market Authority, for instance, uses an online ‘Labour Market Exchange’, which continually monitors the job opportunities available on the market. On the basis of the types of jobs sought in previous months, this tool categorises job opportunities as ‘excellent’, ‘good’ and ‘less good’ for individual jobseekers who access it;
Intensive forms of support, mentoring and career guidance for particularly disadvantaged groups of clients, such as older workers (AT, BE:VDAB), younger jobseekers (AT, BE:FOREM, BE:VDAB, NL22 and MT), the long-term unemployed (AT, BE:VDAB, again), and unemployed people living in rural areas (IE, HU, SI). FI reports intensive forms of support, too;
Finally, preventative actions such as rapid response mechanisms, offering integrated guidance and counselling in case of planned restructuring and group dismissals, have been expanded as a response to the economic crisis in the UK and are also in use in AT, NL, IT, LV, SI, EE, IE and BE:VDAB.
Labour market measures (LMP categories 2-7) The most common labour market measures, organised according to the Eurostat LMP categories, are:
Training, on-the-job training and vocational rehabilitation, which are mentioned by all respondents (for instance, IE provides the unemployed with internships). In addition, BE:FOREM and LV report investing in the recognition of informal skills, DE, EE and EL intend to expand opportunities for recourse to apprenticeship programmes, and AT, BE:FOREM, DE, ES, MT, PL, SK, CZ and the UK provide incentives and subsidies for employers who want to train their staff. About one-third of respondents also mention work experience for young people (BE:FOREM, BE:VDAB, DE, LU, BG, LV, EL, MT, NO);
Incentives for job rotation and job sharing are referred to by just three respondents: FI (income support for workers taking 3 to 9 months leave); LT (job rotation as a way to create new employment opportunities); and ES (grants and allowances for beneficiaries of temporary work contracts);
21 Information about the Eurostat LMP database can be found here: http://epp.eurostat.ec.europa.eu/portal/page/portal/labour_market/labour_market_policy 22 These services may also be provided by municipalities.

20
Employment incentives and supported employment, in the form of wage subsidies and incentives for the recruitment of vulnerable groups are mentioned by 85% of PES (i.e. all but DE, PL, UK, IT). This category of ALMPs includes: programmes to subsidise the employment of the low-skilled (AT, BE:VDAB, BG, EL, LT), the young (AT, BE:FOREM, BG, EL, LU, LV, HU), older workers (LT, LU, SI) and the disabled (LT, LU, SI, IE); support to geographical mobility (AT, LU, BG, HU, LT); incentives to keeping the jobs of disadvantaged jobseekers and incentives to avert lay-offs (SK); and incentives to turn temporary (fixed-term) employment contracts into permanent (open-ended) ones (ES). In NL PES support tax authorities in implementing aid schemes for employment.
Direct job creation programmes, where public funding is used to provide non-market jobs in areas of public interest, typically through public works programmes or community work, are offered by around half of PES (AT, LU, SE, BG, EE, HU, LT, LV, IE, ES, MT, BE:ACTIRIS, CZ, SK, SI);
Start-up incentives, which help people to start a business or become self-employed, are mentioned by around 80% of PES (all except BE:FOREM, BE:VDAB23, DK, SK and IE). Some PES report programmes targeted at specific groups, such as women entrepreneurs or the disabled (EL), whilst others focus on the establishment of small and micro-sized businesses (LT, MT) or the promotion of employment within cooperatives (ES).
Delivery of LMPs: the role of partnerships
Most PES now co-operate with external providers in the delivery of labour market services and measures. The only exceptions among respondents being EL and LU, where the state still holds a monopoly over employment service provision. The list of PES partners is long: local authorities, government ministries, social partners, private employment agencies, third sector organisations, training bodies, and schools. Formal arrangements include tendering procedures, sub-contracting and voucher schemes, all of them generating very different market outcomes24.
Cooperation and partnership can cover all or some of the services provided and/or clients serviced.
i) Partnership between PES and private agencies generally concerns outsourcing of specific services or more general collaboration and exchange of information. This type of partnership is normally promoted on the basis that private actors may be more efficient in organising and managing complex services.
ii) The partnership between PES and third sector organisations often concerns support for the more difficult to place clients (disabled people, the socially excluded, substance abusers). Collaboration is based on the skills and experience of non-profit organisations in dealing with vulnerable groups.
iii) The third form of partnership – between PES and other public service providers (in health, education, training, social assistance) – includes different levels of networking from simple exchange of information to common protocols. It can rely on formal or informal agreements and is justified by the need for delivering multidimensional and integrated services to their target clients. Other types of partnerships also exist with education and training bodies for the provision and delivery of training, municipal authorities in the context of innovative and government-led programmes, and specific organisations, clubs and associations. S
The evidence collected through the questionnaire seems to indicate the emergence of two clearly identifiable models of partnership between PES and other service providers:
In some countries (see, for instance, DE, ES, IT) PES continue to act as the main service provider, but outsource specific services/activities, such as training, vocational rehabilitation and placement in community work;
In other countries (see the UK, DK) PES mainly act as a regulator, outsourcing all but the most basic employment services to other providers.
23 However, BE:VDAB uses a screening on self-employability tool. 24 Weinshaupt, J. T. (2011), Managing Public Employment Services: Trends and experiences with recent governance reforms, unpublished paper. Available here.

21
In-depth case studies are needed to investigate the functioning of different types of partnerships involving different actors and targeting different classes of clients within different national contexts and policy traditions. Case studies of this sort will form the bulk of a separate study by the Mobility Lab, which is being undertaken in the context of the PARES initiative and will be dedicated entirely to the issue of partnership and cooperation among employment services.
Evaluation of LMP The majority of PES report having recourse to evaluation to support the design of ALMPs. Only PT and SI25 state that they do not, while BE:VDAB, DE, NL26, EE did not respond to the question. It is worth noting, however, that, unlike the evaluations of programmes co-financed by the EU’s structural funds, many PES note that evaluations of LMP programmes are dealt with in-house and without relying on external experts. However, this is not the case universally. In the UK, for example, the Department for Work and Pensions undertakes a lot of evaluation work that is all contracted out to external providers and all project results are published freely on the internet as part of the DWP research report series27. In other cases, ES, responsibility and powers in this respect have been transferred to the regions and therefore diferent practices can be carried out in this respect.
3.8 MANAGEMENT LOGIC AND PERFORMANCE MEASUREMENT
Planning process Target-setting, performance measurement and lean management procedures are necessary management tools for modern and flexible public sector bodies. This is also true for PES, which need, therefore, to move from a traditional administrative approach to the performance of their tasks (‘management by regulation’) to an output-driven approach with agreed goals and realistic targets (‘management by objectives’).
It is notable, therefore, that all respondents report complex target-setting systems (only IT, LU, NL and EL give no information). The details of the systems described by each PES are diverse but there is a general correlation between the way in which targets and objectives are set and the type of relationship between the PES and their national government (see section 3.1). In particular:
In countries where PES are executive agencies directly subject to governmental control, targets and objectives are determined by Labour Ministries, either through ministerial budget documents (FI, SE) or in annual and multi-annual business plans agreed with the PES top management (NO, UK, IE, PT, SI, PL, HU, LV, BG); In relation to 'planning process' the case of NL can be assimilated more to an executive agency, rather than an autonomous agency.
In countries where PES are autonomous agencies, instead, targets and objectives are set in contract-type agreements such as ‘management contracts’, typically with some involvement on the part of local/regional branches and of the social partners (see AT, DE, BE:FOREM, BE:VDAB). Management contracts are negotiated by the PES directly with the relevant government departments, which cannot unilaterally impose their own view. However, the government is ultimately responsible for decisions about PES budgets and, in some cases, can apportion financial bonuses and penalties on the basis of performance against the agreed targets.
The only outliers in this respect are DK, SK and CZ. In Denmark municipalities are in charge of local employment offices and set their own targets autonomously and only inform regions about them. Slovakia reports that the planning process is based on the results of monitoring and evaluation of specific data and
25 However, Slovenian national PES prepares detailed and various reports on the programmes’ implementation aspects (descriptive statistics and evaluations) for the Ministry of Labour, the ESS Council and other supervisory institutions. 26 There is no annual evaluation or programme-bound evaluation. However, research on evaluation is often undertaken 27 http://research.dwp.gov.uk/asd/asd5/

22
they are analysed by different departments within the PES. Whereas in the Czech Republic objectives and targets are determined according to the Europe 2020 strategy.
Types of objectives and targets As may be expected, PES around Europe adopt a wide variety of targets and objectives. In broad terms, these can be divided into two main categories: (1) activity-based and (2) outcome-related.
Activity-based indicators are set in a relatively limited number of cases, the most common being:
Increasing productivity, e.g. number of clients serviced, volume of services provided (BE:ACTIRIS, BE:FOREM, DE,EL, FI, PT, SE, NO, SK);
Increasing customer satisfaction (BE:ACTIRIS, BE:VDAB, DE,EE, FI, HU, SE, NO);
Implementing multi-channelling service strategies (DE, EL, LT, SE, NO);
Increasing management transparency (BE:FOREM, DE, LT);
Developing cooperation with public and private bodies/services (BG, EL).
Outcome-related indicators are implemented by all PES that responded to the question. Four PES provided no information (IT, NL, NO, and LV). Of these, NO indicated that performance indicators have been adopted for 2011 but gave no details, and LV also notes objectives that were not described. Moreover, ES reports the use of most of the following types of objectives and targets, but as the competences in this area have been transferred to the Regions it is difficult to have detailed information. Amongst responding PES the following most common types of objectives were identified:
Reduce unemployment, increase employment and activity rates (AT, BE:FOREM, BE:VDAB, BG, DE, EE, FI, HU, LT, LU, MT, NL, PL, PT, SE, SI, CZ, SK);
Increase the number of participants in ALMP measures (BE:ACTIRIS, BE:FOREM, BE:VDAB, BG, EE, HU, IE, LT, MT, PL, SE, SI);
Increase the number of filled vacancies (BE:FOREM, DE, HU, MT, NL, PT, SE, SI);
Increase the number of business start-ups (EE, LT, PL);
Increase the participation of women in apprenticeship/training (AT, MT);
Increase out-flows from benefit-dependence into employment (DK, NL, UK).
The number of different targets/objectives set varies between PES. The most complex target-setting systems, which embrace at least five targets/objectives from the above list and in cases in even more, are found in AT, SE, BE:FOREM and LT. Slightly less complex systems (3 or 4 of the above) are used by some eastern (BG, EE, HU, PL, SI, SK) and southern countries (MT, PT), as well as by BE:VDAB, BE: ACTIRIS, and DE. All other respondents (DK, EL, FI, IE, LU, UK) mention just 1 or 2 targets. Note, however, that there is no link between the number of targets/objectives adopted and the quality of the PES strategy. The number of defined targets/objectives used by each PES is simply a measure of the complexity of the performance monitoring system. Some PES have a generalist approach where a broad range of policy instruments link with a broad range of targets, whilst others focus on specific policies and services and may, therefore, have more limited objectives.
The available data do not facilitate any straightforward categorisation of PES according to their targets/objectives. However, it is possible to advance some considerations based on the information above. As many as 20 PES report setting outcome-related targets, while only 13 set activity-based targets.
Amongst those using outcome-related targets/objectives, three out of four have specific targets to reduce unemployment and increase in employment/activity rates, and three out of five aim to increase participation in ALMP measures. Interestingly, these groups include all PES from group 2 identified in the clustering analysis in section 4 - i.e. those with an active policy, training and employer oriented approach. Other outcome related targets/objectives are much less widely used. Just two PES have targets for increasing out-flows from benefit-dependence into employment, and three have specific targets to increase of the number of business start-ups.

23
The most common activity-based targets are those to increase PES productivity and customer satisfaction, which are both pursued by 7 PES. Other activity-based targets are set by 4 PES or less.
Monitoring Monitoring systems are reported by most PES (except for EL, LU and NO) with Italy currently developing a Labour Market Monitoring Tools also. Depending on the degree of PES autonomy, the final monitoring authority is either a government department (the Ministry of Labour or the Treasury) or the employment service itself. The outcome of monitoring, however, is not always spelled out clearly. Only in a few cases are the results of monitoring said to feed into the reallocation of budgetary resources (DE, UK, MT, BG, EE) or used to identify best practices (FI). In one case performance measurement is an integral part of performance-related compensation schemes for local managers (DE) and in four cases it serves as the basis for internal dialogues at different levels to improve performance, promote mutual learning and support reallocation of resources (AT, DE, SE, SI). In DE, for instance, operational policy goals and monthly reports on progress form the basis of a regular dialogue at all organisational levels. The analysis focuses on weaknesses, that is, on goals which could not be reached or are likely not to be reached but the approach is forward-looking and focuses on how the goals could still be achieved rather than why they have not been met. The success (or otherwise) of any agreed measures is then discussed at the next dialogue. The results of these dialogues are assessed quarterly. Similarly, in NL performance targets are continuously monitored on both local and national levels through weekly, monthly and quarterly reporting. In CZ on the basis of the past results new short-term objectives are set up; whereas in SK monitoring is made following two main criteria: the number of appeals against the decisions of the labour offices and the percentage of employed jobseekers during a certain period of time. Finally, in the case of ES regions are responsible for monitoring systems and as a result differences exist between them.
Lean management Lean management processes, which aim to focus resources on providing value to clients, are currently implemented by relatively few PES. Whereas AT has had lean management tools in place for at least fifteen years, countries such as BE (VDAB), IE, IT, ES, EL, MT, FI, PL, HU, SI, LT, LV, EE make no mention of them. CZ will go through a centralization process, with a reduction of the administrative burden and a PES downsizing. A particularly well-developed experience can be observed in the UK, where a ‘Continuous Improvement Team’ and ‘Lean Champions’ lead on all lean activity nationally and in each region or district. Success stories include the streamlining of benefit processing. Lean Champions work across local offices and benefit centres to help staff create Value Stream Maps, visually representing every step of a particular process, in order to remove unnecessary work and create more efficient processes. Where waste is identified and a process changed, this is communicated across all benefit centres and reflected in new guidance directed at staff.
4. CLUSTERING OF PES
Important note
This section attempts to further exploit the responses provided and to identify some common patterns among PES business models in order to better understand their capacity and the propensity to face current and future challenges.
Note that the clustering attempted here does not in any way attempt to relate business models with outputs and performance or efficiency. Nor does it assess different organisational approaches to service provision because the information available on relevant issues is not always entirely comparable and would, in any case, require a complex contextualisation to facilitate any cross-country comparison. Hence, the clustering developed below is largely based on the types of services provided, which gives some indication of the scope, specialisation and capacity of the PES.

24
Before considering different types of business model it is worth reflecting on some common features: PES in all of the 25 responding PES provide basic services for both jobseekers (general information and guidance services and a range of active labour market measures) and employers (at least a job brokerage function), and in all cases the main clients are the unemployed, and in particular those who receive benefits. This fundamental homogeneity among PES should not be taken for granted. Fifteen or twenty years ago, labour market regulation and institutions in the EU27 Member States were much more diverse. The subsequent convergence is the result of a gradual strengthening of the role of PES as service providers, which was needed to counterbalance increasing labour market flexibility and to reduce some of the inefficiencies in social protection systems (e.g. benefit dependency). The European Commission and the European Social Fund (ESF) have played a central role in this process, which began in the 1990s, by promoting and supporting the reform of the PES, especially during the past ten years leading up to and following the EU’s eastern enlargement. This base of common services and actions represents a solid platform for further upgrading of PES capacity to meet the increasingly complex needs of modern labour markets, whilst respecting existing institutional arrangements.
The clustering of PES proposed here is essentially based on:
The competences assigned to PES (variables considered: active and passive LMPs and other benefits; number of labour market services (LMP category 1) and active measures (LMP categories 2 to 7) offered;
The attention devoted to client groups other than the traditional ones of unemployed jobseekers and employers (variables considered: number of specific target groups);
The provision of specialised services for jobseekers and employers (variables considered: provision of specialised services for jobseekers, provision of in-house training for jobseekers, provision of human resource management services);
The style of management (variables considered: lean management).
These variables were selected for clustering because, based on the analysis of the information in the previous sections, there appeared to be some evidence of distinct groupings of PES. Other dimensions of the questionnaire were not taken into account because it was impossible to establish any clear pattern of similarity/difference between different groups of PES (e.g. types of clients, performance targets).It is also important to point out that all EU PES provide a large number of basic and advanced services and consequently clustering tries to capture the differences in the BMs and give less emphasis to the common aspects. A summary matrix of the variables related to clients, services, LMP and lean management is included in Annex I.
The combined analysis28 of the functioning of PES based on these variables produces three main clusters of PES:
Group 1: generalist approach and wide range of ALMP. This first group includes 9 PES, a significant number of which integrate active and passive policies (5 on 9) and the delivery of other benefits (4). Employers are a major focus as a target group for a significant number of PES (5 out of 9) and a slight majority of cases provides specialised services (by 5 out of 9). No case of in-house training provision is included. PES in the group tend to manage a large number of LMP measures (categories 2 to 7) . Recourse to lean management is rare within this group (2 out of 9).
Group 2: focus on active policy, attention to employers and lean management. The second group includes 11 of the 25 PES in the sample. Most of the PES in this group (6 out of 11) are only responsible for active labour market policies, with the provision of unemployment and other benefits being left to other bodies (only 3 out of 11 PES provide other benefits) . PES in this group (5 out of
28 The grouping has also used the support of statistical methods carried out on the numeric or binomial variables corresponding to the selected concepts and imposing the number of 3 cluster (demonstrated as the one more suitable in relation to the number of cases).

25
11) tend to offer a broad range of specialised services and in few cases (2) provide also in-house training activities. Furthermore, the number of LMP services (category 1) and LMP measures (categories 2-7) managed by the PES in this group is clustered around the average of the entire sample. The service offer for employer clients is developed (5 PES offer legal and financial counselling and 6 support for human resources). Finally, the majority of PES (6) in this group adopt lean management practices.
Group 3: specialised services and high number of instruments. This third group includes 7 PES) . Three of them manage both active and passive policies. In respect of the other groups, the number of specialised services offered to jobseekers is generally high, and so is the number of different LMP services offered (category 1). Good attention is paid to specialised services for employers (3 supply legal and financial counselling and 6 support for human resources). Lean management practices and processes are widespread (4); similarly the provision of in-house training (in both cases 3 out of 7).
The clustering presented here is a first attempt at identifying some types of business models on the basis of the responses obtained. Other forms of aggregation could be tested using a different mix of variables or introducing additional variables. Legal and institutional frameworks are not considered here and consequently the freedom of the single PES in adapting its business model is also not included in the analysis. The lack of clear-cut patterns within many of the variables make it unlikely that clusters cannot be interpreted as radical alternative models, However, they represent some trends in organizational and institutional experience which have been consolidated in recent time. Furthermore, they could change rapidly, as past experiences have demonstrated in many countries. . This requires also to interpret the results of the clustering in a very cautious manner, essentially as a initial reflection which identifies some similarities and requires further investigations. In this exploratory framework, it is possible to compare the three groups of PES business models with other information from the questionnaires that was not taken into account in the clustering exercise. The different basic organisational features of PES (see table 8 below) cut across each of the groups identified above and, hence, seem relatively independent from service provision, which was the main criterion for grouping. It is worth noting that decentralised PES are more frequent in group 3. In these cases, a closer proximity of service provision to local needs is associated to a larger autonomy of PES and a more frequent involvement of social partners in management; a more participative and territorially articulated model emerges from this group in comparison to the others. . At the same time, more centralized approaches (more frequent in group 1 and 2) could favor coordination and concentration of critical mass of resources where needed.
Table 8 - PES basic organisational features
Governance Decentralisation * Involvement of social partners in management
Group 1 Prevalently executive agency (6 out of 9)
Less Frequent (3 decentralised out of 9)
Less Frequent (3 out of 9)
Group 2
Slightly prevalence of executive agency (6 out of 11)
Less Frequent (3 decentralised out of 11)
Less frequent (3 out of 11)
Group 3
Prevalently autonomous bodies (6 out of 7)
Frequent (5 decentralised out of 7)
More frequent (6 out of 7)
(*) Following the previous classification, here “centralized” and “centralised with autonomy” are considered centralized, while “decentralised with coordination” and “decentralized” are considered decentralized.
No clear patterns or significant differences concerning management models and performance measurement systems can be identified among different groups, however less relevant involvement of social partners in management is frequent in group 2 and a governance based on executive agency is generalized in group 1. Target setting systems and performance monitoring are more common in group 2 (active policy, training and employer-oriented approach), though similar tools are in use in the other groups too. In group 2 these

26
instruments seem to be partially supporting lean management procedures, which are more common than in the other groups.
This initial grouping cannot be used to analyze differences between national models, and belonging to a group does not signal more or less efficiency. We are aware of the complexity underlying the collection of information and of the subjectivity involved in providing and analyzing it. At the same time, from the exercise it is possible to identify some types of business models in relation to the different groups:
Model 1 - A first type of BM is focused on fundamental services in relation to job seekers and employers, but it also has significant responsibilities in the management of ALMP (LMP2-7 measures). The integration of active and passive labor policy, as well as other benefits, is common and gives to PES a broad range of tasks. The activity is undertaken with a strong linkage with the Ministry of Labor. Monitoring and lean management are practiced, but PES activity seems primarily respondent to administrative rules.
Model 2 - A second type of BM is more focused on active policy and promotes a wide range of services for employers too. The number of services provided is significant but not very high, nor is targeting highly emphasized. A limited number of ALMP measures is implemented, because responsibility for them is shared with other organizations. The management model is based on executive agency with well developed internal performance monitoring and lean management; a centralized approach and a direct coordination with the Ministry of Labor are also part of this model.
Model 3 - A third type of BM can either integrate or not active and passive policy, but it is principally focused on LMP1 measures, the traditional “core business” of PES. Within this administrative framework, the model is characterized by a very wide range of services and different channels to provide services. This model pays attention to different groups of clients; services are often tailored to different groups. Responsibilities for the other ALMP measures (LMP2-7) are limited and shared with other organizations. The model uses a executive agency and is often decentralized. This ensures high flexibility and adaptation capacity. Monitoring and lean management methods are developed.
5. CONCLUSIONS AND POTENTIAL POLICY IMPLICATIONS
Based on information provided by the PES themselves, the primary output of this study is the series of PES/country fiches that provide firsthand and up-to-date information on the operations of PES across Europe. These fiches offer a systematic overview of how PES in Europe are organised, what they do, whom they serve and how they measure and monitor their own performance. This information base can provide insight into what PES look like now but also, looking forwards, they provide a basis from which to assess where PES stand with respect to their capacity to support key policy objectives and targets.
The study has also made a first attempt to exploit the information collected, to identify similarities and differences in the approach of PES to each of the issues covered, and then to identify an initial typology of BM based on similar approaches to service provision. Building on this exercise, it is then possible to consider how each model is placed with respect to a number of key policy issues. The results of the clustering and the related policy implications are summarised below.
Four policy issues are to be considered in relation to each of the BM identified:
Increase the labour market participation of vulnerable groups – one of the main challenges for the next few years is to develop the capacity of PES so that they can serve different groups of clients in ALMP programmes, and especially those more distant from the labour market (e.g. people who are not ready for work or are discouraged from seeking work). On this issue differences between BMs are not great and different approaches may coexist in the same BM but two main approaches
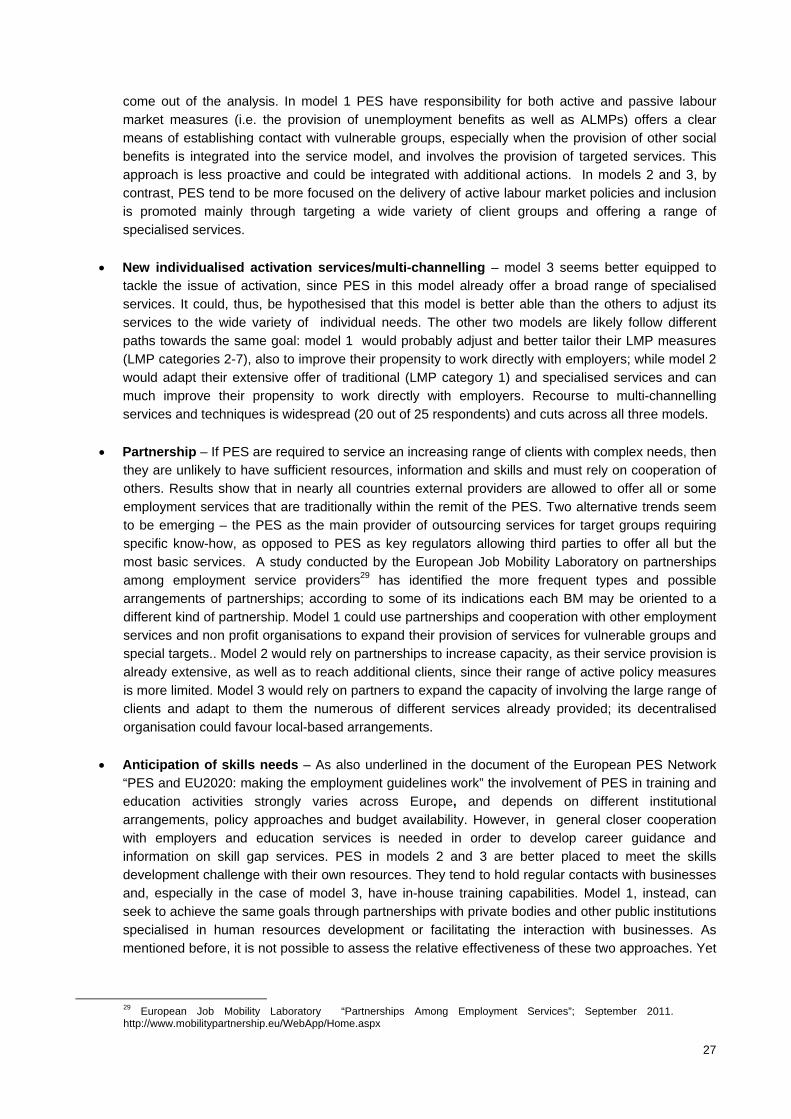
27
come out of the analysis. In model 1 PES have responsibility for both active and passive labour market measures (i.e. the provision of unemployment benefits as well as ALMPs) offers a clear means of establishing contact with vulnerable groups, especially when the provision of other social benefits is integrated into the service model, and involves the provision of targeted services. This approach is less proactive and could be integrated with additional actions. In models 2 and 3, by contrast, PES tend to be more focused on the delivery of active labour market policies and inclusion is promoted mainly through targeting a wide variety of client groups and offering a range of specialised services.
New individualised activation services/multi-channelling – model 3 seems better equipped to tackle the issue of activation, since PES in this model already offer a broad range of specialised services. It could, thus, be hypothesised that this model is better able than the others to adjust its services to the wide variety of individual needs. The other two models are likely follow different paths towards the same goal: model 1 would probably adjust and better tailor their LMP measures (LMP categories 2-7), also to improve their propensity to work directly with employers; while model 2 would adapt their extensive offer of traditional (LMP category 1) and specialised services and can much improve their propensity to work directly with employers. Recourse to multi-channelling services and techniques is widespread (20 out of 25 respondents) and cuts across all three models.
Partnership – If PES are required to service an increasing range of clients with complex needs, then they are unlikely to have sufficient resources, information and skills and must rely on cooperation of others. Results show that in nearly all countries external providers are allowed to offer all or some employment services that are traditionally within the remit of the PES. Two alternative trends seem to be emerging – the PES as the main provider of outsourcing services for target groups requiring specific know-how, as opposed to PES as key regulators allowing third parties to offer all but the most basic services. A study conducted by the European Job Mobility Laboratory on partnerships among employment service providers29 has identified the more frequent types and possible arrangements of partnerships; according to some of its indications each BM may be oriented to a different kind of partnership. Model 1 could use partnerships and cooperation with other employment services and non profit organisations to expand their provision of services for vulnerable groups and special targets.. Model 2 would rely on partnerships to increase capacity, as their service provision is already extensive, as well as to reach additional clients, since their range of active policy measures is more limited. Model 3 would rely on partners to expand the capacity of involving the large range of clients and adapt to them the numerous of different services already provided; its decentralised organisation could favour local-based arrangements.
Anticipation of skills needs – As also underlined in the document of the European PES Network “PES and EU2020: making the employment guidelines work” the involvement of PES in training and education activities strongly varies across Europe, and depends on different institutional arrangements, policy approaches and budget availability. However, in general closer cooperation with employers and education services is needed in order to develop career guidance and information on skill gap services. PES in models 2 and 3 are better placed to meet the skills development challenge with their own resources. They tend to hold regular contacts with businesses and, especially in the case of model 3, have in-house training capabilities. Model 1, instead, can seek to achieve the same goals through partnerships with private bodies and other public institutions specialised in human resources development or facilitating the interaction with businesses. As mentioned before, it is not possible to assess the relative effectiveness of these two approaches. Yet
29 European Job Mobility Laboratory “Partnerships Among Employment Services”; September 2011. http://www.mobilitypartnership.eu/WebApp/Home.aspx

28
the very existence of different orientations and organisational capacities suggests the need for different kinds of support to buttress the process of adjustment to new skills needs.
Finally, some conclusions can be derived from the survey and the analysis of PES business models:
The analysis of business models confirms a general similarity of the different national models in relation to the range of service provision and client groups. This means that policies to improve and reinforce the action of PES can have a common basis and similar objectives in all European countries.
Identifying clear and different business models is far from straightforward. Certainly more contextual information is needed in order to place the PES within the entire range of employment policy related actions within each country and their effectiveness and efficiency. This could allow a wider range of discriminating factors to be taken into account and a more precise classification of different models.
Outreach to new clients can follow a different logic in the different models identified, which in turn suggests different topics for in-depth analysis in the future. Two targeting strategies can be identified in this respect: one is based around establishing contact with clients through the social benefit system and compulsory administrative activities, whilst the other directs specific actions at problematic groups which are identified a priori. These strategies are not mutually exclusive, but some business models appear to be more prone to adopting only one of them. The use of targeting strategies or approaches should be extended and improved in the future and integrated with existing business models.
PES show a variable capacity to involve employers, with some PES more oriented than others towards employers as clients for whom they provide services other than a basic job matching function. Improving services for employer clients is likely to be an important element of the future development of PES, though more detailed analyses are needed in order to identify the needs of individual countries.
Finally, two main models for adapting services to customer needs seem to emerge from the analysis. In some cases, the ability to adapt depends on the different policy instruments given to the PES, so that any adjustment would require an overhaul of policy instruments and of PES competences and powers. In other cases, adaptation results from the mix of personal services put in place by PES or, in other words, on the prevailing PES business model rather than the national policy mix. This second approach would seem to be more flexible and responsive, since the PES can react to client needs through internal decisions without recourse to bureaucratic procedures. This also means that it is necessary to balance “top-down” adjustments (administrative reform, new policy instruments, etc.) with “bottom-up” adjustments (increase in PES skills, definition of new services, introduction of new marketing or IT tools).

29
ANNEX I – MATRIX OF RESULTS FOR VARIABLES USED IN THE CLUSTERING EXERCISE
The matrix below is a summary of the variables/information coming from the PES Business Model Questionnaire (sections 1, 4, 5, 6, 8 of the questionnaire), which were used for the clustering exercise described in section 4. Based on these characteristics, the clustering exercise identified three groups of PES, the characteristics of which are then used to draw some policy implications (see section Error! Reference source not found.).
The two final columns of the matrix show the number and proportion (%) of PES that have the appropriate characteristic or offer the specified service, etc. B
E:A
CT
IRIS
BE
:FO
RE
M
BE
:VD
AB
BG
CZ
DE
DK
EE
IE
EL
ES
IT
LV
LT
LU
HU
MT
NL
AT
PL
PT
SI
SK
FI
SE
UK
NO
To
tal
%
ORGANISATIONAL MODEL
Executive agency Y Y Y Y Y Y Y Y Y Y Y Y Y Y 14 52% Autonomous public bodies Y Y Y Y Y Y Y Y Y Y Y Y Y Y 14 52% Decentralised Y Y Y Y Y Y Y Y Y Y Y 11 41% Social partners in mng Y Y Y Y Y Y Y Y Y Y Y Y 12 44%
POLICY AREAS Active only Y Y Y Y Y Y Y Y Y Y Y Y Y 11 41% Active & Passive Y Y Y Y Y Y Y Y Y Y Y Y Y Y 11 41% Other benefits Y Y Y Y Y Y Y Y Y 9 33%
CLIENTS
Unemployed/benefit recipients Y Y Y Y Y Y Y Y Y Y Y Y Y Y Y Y Y Y Y Y Y Y Y Y Y Y 26 96% Underrepresented groups Y Y Y Y Y Y Y Y Y Y Y Y Y Y Y 15 56% Vulnerable groups Y Y Y Y Y Y Y Y Y Y Y Y Y Y 14 52% Job-changers Y Y Y Y Y Y Y Y Y Y Y Y Y Y Y 15 56% Inactive Y Y Y Y Y 5 19%
SERVICES FOR JOBSEEKERS
Services for jobseekers in general Individual face-to-face supports Y Y Y Y Y Y Y Y Y Y Y Y Y Y Y Y Y Y Y Y Y Y Y Y Y Y Y 27 100% Information, advice and guidance Y Y Y Y Y Y Y Y Y Y Y Y Y Y Y Y Y Y Y Y Y Y Y Y 24 89% Group activities Y Y Y Y Y Y Y Y Y Y Y Y Y Y Y Y Y 17 63% Multi-channelling Y Y Y Y Y Y Y Y Y Y Y Y Y Y Y Y Y Y Y Y Y Y Y Y Y 25 93% N. of services other than individual support 3 3 3 2 2 2 2 3 1 3 3 1 2 2 3 2 3 2 3 1 2 3 0 2 2 2 2 Teams of advisors for special target groups Y Y Y Y Y Y Y 7 26% At least one specialised service Y Y Y Y Y Y Y Y Y Y Y Y Y Y Y Y Y 17 63% Types of specialised services Career guidance for the young Y Y Y Y Y Y Y Y Y 9 33% Career guidance for adults (over 50 years of age) Y Y Y Y Y Y 6 22% Case management, intensive support Y Y Y Y Y Y Y Y Y Y Y Y Y Y Y 15 56% In-house training for jobseekers Y Y Y Y Y 5 19%
SERVICES FOR EMPLOYERS
Information, advice, guidance for recruitment Y Y Y Y Y Y Y Y Y Y Y Y Y Y Y Y Y Y Y Y Y Y Y Y Y Y 26 96% Legal and financial counselling Y Y Y Y Y Y Y Y Y Y Y Y Y 13 48% Support for human resources development or others Y Y Y Y Y Y Y Y Y Y Y Y Y Y Y Y Y 17 63%
LABOUR MARKET LMP category 1

30
BE
:AC
TIR
IS
BE
:FO
RE
M
BE
:VD
AB
BG
CZ
DE
DK
EE
IE
EL
ES
IT
LV
LT
LU
HU
MT
NL
AT
PL
PT
SI
SK
FI
SE
UK
NO
To
tal
%
Complex counselling and orientation Y Y Y Y Y Y Y Y Y Y Y Y Y Y Y Y Y Y Y Y Y Y Y Y Y Y Y 27 100% Medical and psychological support Y Y Y Y Y Y Y Y Y Y 10 37% Job clubs and job coaching Y Y Y Y Y Y Y Y Y Y Y Y Y 13 48% Advanced matching and placement support Y Y Y Y Y Y Y Y Y Y Y Y 12 44% Intensive forms of support for particular groups Y Y Y Y Y Y Y Y Y 9 33% Rapid response mechanisms Y Y Y Y Y Y Y Y Y 9 33% Total n. of LMP cat.1 2 3 5 3 1 3 2 4 5 2 1 3 2 1 1 4 4 5 5 3 2 6 2 4 2 3 3 LMP categories 2-7 Incentives for job rotation Y Y Y 3 11% Employment incentive Y Y Y Y Y Y Y Y Y Y Y Y Y Y Y Y Y Y Y Y Y Y Y 23 85% Direct job creation Y Y Y Y Y Y Y Y Y Y Y Y Y Y Y 15 56% Start-up incentive Y Y Y Y Y Y Y Y Y Y Y Y Y Y Y Y Y Y Y Y Y Y 22 81% Total n. of LMP cat.2-7 3 1 1 3 3 1 1 3 2 2 4 1 3 4 3 3 3 2 3 1 2 3 2 3 3 1 2 Total n. of LMP cat.1-7 5 4 6 6 4 4 3 7 7 4 5 4 5 5 4 7 7 7 8 4 4 9 4 7 5 4 5

31
ANNEX II – DATA LIMITATIONS
Conducting an exercise of this nature among the Public Employment Services of the EU 27 Member States plus Switzerland, Iceland and Norway poses some challenges in terms of data comparability and availability for a number of reasons. In some cases questions can be interpreted or answered in different ways, in others it is clear that questions need to be tailored and/or supplemented with further questions in order to provide information that is adequate to understand how PES operate. In others PES use and gather information in different ways to suit their own national context and may not be able to provide the precise data requested, which means that results may not be comparable.
As a result, the information is not always straightforward to compare across countries and it should be clear that both the general report and the PES country fiches are designed simply to give a picture of the current situation and not to facilitate any kind of assessment of the effectiveness of PES as service providers.
For questions that require qualitative, descriptive answers the responses inevitably vary considerably in the level of detail provided. For example, in respect of the types of services provided, some PES may not have mentioned the most basic of services because they are, so to speak, too obvious. The analysis here is based only on the information provided and PES are encouraged to review the individual country/PES fiches and submit complementary information where necessary.
In relation to questions that relate to quantitative data there are some more specific issues that warrant attentions as detailed below.
FINANCING MODEL AND HUMAN RESOURCES
Financial resources Information and responses provided by PES proved challenging to analyse in a comparative way. In a few cases there were shortcomings in the data but more importantly there are differences in the interpretation of how expenditure should be split between the different categories requested. In some cases there were large amounts not allocated to any category of expenditure – sometimes this referred to unemployment benefits, sometimes to capital expenditures, etc. In other cases the costs of unemployment benefits were aggregated with ALMP costs (e.g. ES). Despite a follow-up exercise to try and clarify some of these discrepancies, further detailed work is needed to develop data that could really be compared between countries.
Even if this could be achieved, any interpretation of the data would have to be undertaken with great care and it is not clear that there would be any great benefit in doing so unless expenditure can be broken down by detailed function. For example, where unemployment and other benefits are paid out of PES budgets these generally account for a large proportion of the total, distorting comparisons with countries where these are not included and dominating changes through time. These amounts therefore have to be taken out of the total before any reasonable comparison of PES can be undertaken.
However, this is only the start - the responsibility for paying benefits also implies additional costs for the PES (e.g. in terms of administrative staff) so that comparing total staff costs of PES with different competences is inherently unreliable unless such costs can be allocated to clearly identifiable functions. There are also difficulties to compare the direct costs of ALMPs, because the extent to which PES are the sole providers of publicly funded services varies between countries (e.g. municipalities may fund LMP actions from their own budgets) and in the UK, the costs of ALMP provision come from a separate budget of the Department for Work and Pensions so that there is a

32
zero figure for ALMP in the expenditure of JobCentre Plus even though they have responsibility for their implementation.
Human resources In some questionnaire responses the figure given for total staff does not coincide with the sum of the staff working in central, regional and local offices. This notwithstanding, most data are clear and comprehensive. Out of 25 responses received, complete and reliable data on PES staff by organisational level were provided by 17 PES.
However, more caution should be exercised in comparing figures on the proportion of staff counted as directly servicing clients because of different interpretations as to the meaning of “directly servicing”. For example, figures might cover only staff that have direct face to face contact with clients, or include call centre staff, or include people processing individual benefit claims, etc. Also, managers may or not be included.
JOB VACANCIES AND MARKET SHARE
Vacancy statistics
PES market share is known to vary considerably between countries, but vary PES are actually able to provide any estimates of this. 19 out of 27 interviewed PES provided figures of their market shares and 16 specified their methods for calculating the market share. Methods are very different and for this reason, other than for well known differences in socio-economic and institutional conditions, it is impossible compare national results at the moment. As mentioned in the main text, two main approaches are used:
Filled vacancies, more related to the effectiveness of the placement services; Advertised vacancies, more related to the capacity of PES in intercepting and treating the labor
demand.
In SE an indicator of customer satisfaction of employers is preferred.
In addition, the methods to calculate the market share are different and largely dependent on available data and resources. In some cases specific survey are used to estimate the figures (for instance in DE or UK); in other cases the market share is calculated on administrative data (for instance in AT or SI). In many cases administrative data and survey data are combined.