Final Operations Report for I-205 / Lammers Road ... · Final Traffic Operations Report...
128
F EHR & P EERS TRANSPORTATION CONSULTANTS Final Operations Report for I-205 / Lammers Road Interchange Project 100 Pringle Ave, Suite 600 Walnut Creek, CA Prepared for: City of Tracy Caltrans District 10 May 2009 WC06-2287
Transcript of Final Operations Report for I-205 / Lammers Road ... · Final Traffic Operations Report...

FEHR & PEERST R A N S P O R T A T I O N C O N S U L T A N T S
Final Operations Report for
I-205 / Lammers Road Interchange Project
100 Pringle Ave, Suite 600Walnut Creek, CA
Prepared for:City of TracyCaltrans District 10
May 2009
WC06-2287


Final Traffic Operations Report I-205/Lammers Road Interchange Project May 2009
TABLE OF CONTENTS
1. INTRODUCTION ................................................................................................................................................. 7
Purpose ............................................................................................................................................................... 7 Study Area ........................................................................................................................................................... 7
2. EXISTING CONDITIONS .................................................................................................................................. 10
Study Area ......................................................................................................................................................... 10 Data Collection .................................................................................................................................................. 10 Analysis Methodology and Key Assumptions.................................................................................................... 17 Existing Operations Analysis ............................................................................................................................. 20
3. ALTERNATIVES STUDIED .............................................................................................................................. 24
4. TRAFFIC FORECASTS .................................................................................................................................... 26
Forecasting Approach ....................................................................................................................................... 27 Travel Demand Model ....................................................................................................................................... 28 Department of Transportation Risk Assessment............................................................................................... 30 2035 Peak Hour Design Forecasts.................................................................................................................... 30 Opening Day (2015) Design Hour Forecasts .................................................................................................... 33
5. YEAR 2035 REGIONAL TRAFFIC OPERATIONS .......................................................................................... 54
Project Area Roadway Volumes and LOS ........................................................................................................ 54 Regional Measures of Effectiveness ................................................................................................................. 54
6. OPENING YEAR (2015) TRAFFIC OPERATIONS .......................................................................................... 57
Peak Hour Traffic Volumes and Lane Configurations ....................................................................................... 57 Intersection Operations ..................................................................................................................................... 57 Mainline and Ramp Analysis ............................................................................................................................. 76
7. DESIGN YEAR (2035) TRAFFIC OPERATIONS............................................................................................. 80
Peak Hour Traffic Volumes and Lane Configurations ....................................................................................... 80 Intersection Operations ..................................................................................................................................... 80 Mainline and Ramp Analysis ........................................................................................................................... 100
8. IMPACTS AND MITIGATION ......................................................................................................................... 104
Intersections .................................................................................................................................................... 104 Mainline and Ramps........................................................................................................................................ 105
Final Traffic Operations Report I-205/Lammers Road Interchange Project May 2009
9. RAMP METERING .......................................................................................................................................... 106
Ramp Metering Queuing Analysis ................................................................................................................... 107
APPENDICES
Appendix A Traffic Counts
Appendix B Model Validation and Existing Intersection Analysis Worksheets
Appendix C Existing Mainline and Ramp Junction Analysis Worksheets
Appendix D Travel Demand Model Calibration and Validation
Appendix E I-205 Mainline and Ramp Demand Volumes
Appendix F Opening Year (2015) Intersection Analysis Worksheets
Appendix G Opening Year (2015) Mainline and Ramp Junction Analysis Worksheets Using HCM
Appendix H Opening Year (2015) Mainline and Ramp Junction Analysis Worksheets Using FREQ
Appendix I Design Year (2035) Intersection Analysis Worksheets
Appendix J Design Year (2035) Mainline and Ramp Junction Analysis Worksheets Using HCM
Appendix K Design Year (2035) Mainline and Ramp Junction Analysis Worksheets Using FREQ
Appendix L Ramp Metering Queuing Results

Final Traffic Operations Report I-205/Lammers Road Interchange Project May 2009
LIST OF FIGURES
Figure 1 Study Area....................................................................................................................................... 9
Figure 2 Existing (2006) Intersection Lane Configurations and Peak Hour Volumes ................................. 12
Figure 3 Existing (2006) Freeway Lane Configuration and Peak Hour Volumes........................................ 14
Figure 4A 2035 No Build Alternative I-205 Mainline and Ramp Volumes ..................................................... 34
Figure 4B 2035 No Build Alternative Design Hour Intersection Turning Movement Volumes....................... 35
Figure 5A 2035 Build Alternative 1 I-205 Mainline and Ramp Volumes........................................................ 36
Figure 5B 2035 Build Alternative 1 Design Hour Intersection Turning Movement Volumes ......................... 37
Figure 6A 2035 Build Alternative 5A I-205 Mainline and Ramp Volumes ..................................................... 38
Figure 6B 2035 Build Alternative 5A Design Hour Intersection Turning Movement Volumes....................... 39
Figure 7A 2035 Build Alternative 5A-VA I-205 Mainline and Ramp Volumes ............................................... 40
Figure 7B 2035 Build Alternative 5A-VA Design Hour Intersection Turning Movement Volumes................. 41
Figure 8A 2035 Build Alternative 6 I-205 Mainline and Ramp Volumes........................................................ 42
Figure 8B 2035 Build Alternative 6 Design Hour Intersection Turning Movement Volumes ......................... 43
Figure 9A 2015 No Build Alternative I-205 Mainline and Ramp Volumes ..................................................... 44
Figure 9B 2015 No Build Alternative Design Hour Intersection Turning Movement Volumes....................... 45
Figure 10A 2015 Build Alternative 1 I-205 Mainline and Ramp Volumes........................................................ 46
Figure 10B 2015 Build Alternative 1 Design Hour Intersection Turning Movement Volumes ......................... 47
Figure 11A 2015 Build Alternative 5A I-205 Mainline and Ramp Volumes ..................................................... 48
Figure 11B 2015 Build Alternative 5A Design Hour Intersection Turning Movement Volumes....................... 49
Figure 12A 2015 Build Alternative 5A-VA I-205 Mainline and Ramp Volumes ............................................... 50
Figure 12B 2015 Build Alternative 5A-VA Design Hour Intersection Turning Movement Volumes................. 51
Figure 13A 2015 Build Alternative 6 I-205 Mainline and Ramp Volumes........................................................ 52
Figure 13B 2015 Build Alternative 6 Design Hour Intersection Turning Movement Volumes ......................... 53
Figure 14 Area PM Peak Hour Volumes and LOS........................................................................................ 55
Figure 15 Opening Day (Year 2015) Intersection Traffic Control and Lane Configurations – No Build........ 58
Figure 16 Opening Day (Year 2015) Intersection Traffic Control and Lane Configurations – Build Alternative 1 ................................................................................................................................................ 59

Final Traffic Operations Report I-205/Lammers Road Interchange Project May 2009
Figure 17 Opening Day (Year 2015) Intersection Traffic Control and Lane Configurations – Build Alternative 5A.............................................................................................................................................. 60
Figure 18 Opening Day (Year 2015) Intersection Traffic Control and Lane Configurations – Build Alternative 5A-VA........................................................................................................................................ 61
Figure 19 Opening Day (Year 2015) Intersection Traffic Control and Lane Configurations – Build Alternative 6 ................................................................................................................................................ 62
Figure 20 Design Year (2035) Intersection Traffic Control and Lane Configurations – No Build.................. 82
Figure 21 Design Year (2035) Intersection Traffic Control and Lane Configurations – Build Alternative 1 .. 83
Figure 22 Design Year (2035) Intersection Traffic Control and Lane Configurations – Build Alternative 5A 84
Figure 23 Design Year (2035) Intersection Traffic Control and Lane Configurations – Build Alternative 5A-VA.............................................................................................................................................. 85
Figure 24 Design Year (2035) Intersection Traffic Control and Lane Configurations – Build Alternative 6 .. 86

Final Traffic Operations Report I-205/Lammers Road Interchange Project May 2009
LIST OF TABLES
Table 1 Freeway AM/PM Vehicle Occupancy Counts - Year 2004 .................................................................. 15
Table 2 Existing Mainline Travel Times and Travel Speeds............................................................................. 16
Table 3 Intersection Level of Service Thresholds............................................................................................. 18
Table 4 Freeway Mainline Level of Service Criteria ......................................................................................... 19
Table 5 Ramp Junction (Merge and Diverge) Level of Service Criteria ........................................................... 19
Table 6 Existing Intersection Analysis 1,2 .......................................................................................................... 21
Table 7 Existing Mainline and Ramp Merge Diverge Analysis ......................................................................... 23
Table 8 SJCOG Adopted Regional Land use Totals ........................................................................................ 28
Table 9 Residential and Employment Adjustments To 2035 Housing and Employment ................................. 29
Table 10 Regional Measures of Effectiveness.................................................................................................. 56
Table 11 Opening Year (2015) Intersection Analysis 1 ..................................................................................... 63
Table 12 2015 No Build Alternative - 95th Percentile Queue Lengths .............................................................. 71
Table 13 2015 Alternative 1 - 95th Percentile Queue Lengths .......................................................................... 72
Table 14 2015 Alternative 5A - 95th Percentile Queue Lengths........................................................................ 73
Table 15 2015 Alternative 5A-VA - 95th Percentile Queue Lengths.................................................................. 74
Table 16 2015 Alternative 6 - 95th Percentile Queue Lengths .......................................................................... 75
Table 17 2015 AM Mainline/Weaving Segment Levels of Service ................................................................... 77
Table 18 2015 PM Mainline/Weaving Segment Levels of Service ................................................................... 78
Table 19 2015 Ramp Merge/Diverge Analysis ................................................................................................. 79
Table 20 Design Year (2035) Intersection Analysis 1 ....................................................................................... 87
Table 21 2035 No Build Alternative - 95th Percentile Queue Lengths .............................................................. 95
Table 22 2035 Alternative 1 - 95th Percentile Queue Lengths .......................................................................... 96
Table 23 2035 Alternative 5A - 95th Percentile Queue Lengths........................................................................ 97
Table 24 2035 Alternative 5A-VA - 95th Percentile Queue Lengths.................................................................. 98
Table 25 2035 Alternative 6 - 95th Percentile Queue Lengths .......................................................................... 99
Table 26 2035 AM Mainline/Weaving Segment Levels of Service ................................................................. 101

Final Traffic Operations Report I-205/Lammers Road Interchange Project May 2009
Table 27 2035 PM Mainline/Weaving Segment Levels of Service ................................................................. 102
Table 28 2035 Ramp Merge/Diverge Analysis ............................................................................................... 103
Table 29 year 2035 Ramp Metering Queuing Summary for Alternative 1...................................................... 108
Table 30 year 2035 Ramp Metering Queuing Summary for Alternative 5A (Diagonal Ramps) ..................... 109
Table 31 year 2035 Ramp Metering Queuing Summary for Alternative 5A (Loop Ramps) ........................... 110
Table 32 year 2035 Ramp Metering Queuing Summary for Alternative 5A-VA (Diagonal Ramps) ............... 111
Table 33 year 2035 Ramp Metering Queuing Summary for Alternative 5A-VA (Loop Ramps) ..................... 112
Table 34 year 2035 Ramp Metering Queuing Summary for Alternative 6 (Diagonal Ramps)........................ 113
Table 35 year 2035 Ramp Metering Queuing Summary for Alternative 6 (Loop Ramps).............................. 114
7
Final Traffic Operations Report I-205/Lammers Road Interchange Project May 2009
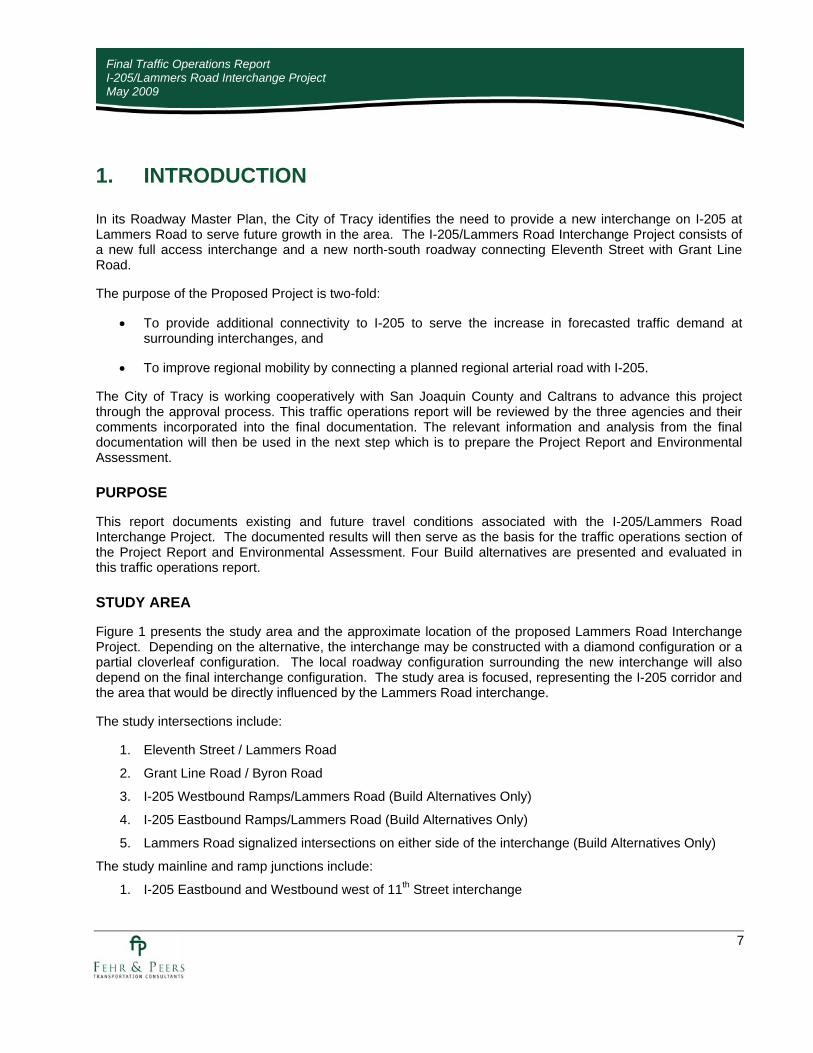
1. INTRODUCTION
In its Roadway Master Plan, the City of Tracy identifies the need to provide a new interchange on I-205 at Lammers Road to serve future growth in the area. The I-205/Lammers Road Interchange Project consists of a new full access interchange and a new north-south roadway connecting Eleventh Street with Grant Line Road.
The purpose of the Proposed Project is two-fold:
• To provide additional connectivity to I-205 to serve the increase in forecasted traffic demand at surrounding interchanges, and
• To improve regional mobility by connecting a planned regional arterial road with I-205.
The City of Tracy is working cooperatively with San Joaquin County and Caltrans to advance this project through the approval process. This traffic operations report will be reviewed by the three agencies and their comments incorporated into the final documentation. The relevant information and analysis from the final documentation will then be used in the next step which is to prepare the Project Report and Environmental Assessment.
PURPOSE
This report documents existing and future travel conditions associated with the I-205/Lammers Road Interchange Project. The documented results will then serve as the basis for the traffic operations section of the Project Report and Environmental Assessment. Four Build alternatives are presented and evaluated in this traffic operations report.
STUDY AREA
Figure 1 presents the study area and the approximate location of the proposed Lammers Road Interchange Project. Depending on the alternative, the interchange may be constructed with a diamond configuration or a partial cloverleaf configuration. The local roadway configuration surrounding the new interchange will also depend on the final interchange configuration. The study area is focused, representing the I-205 corridor and the area that would be directly influenced by the Lammers Road interchange.
The study intersections include:
1. Eleventh Street / Lammers Road
2. Grant Line Road / Byron Road
3. I-205 Westbound Ramps/Lammers Road (Build Alternatives Only)
4. I-205 Eastbound Ramps/Lammers Road (Build Alternatives Only)
5. Lammers Road signalized intersections on either side of the interchange (Build Alternatives Only)
The study mainline and ramp junctions include:
1. I-205 Eastbound and Westbound west of 11th Street interchange
8
Final Traffic Operations Report I-205/Lammers Road Interchange Project May 2009
2. I-205 Eastbound and Westbound between 11th Street and Grant Line Road interchange
3. I-205 Eastbound and Westbound east of Grant Line Road interchange
4. 11th Street ramp junctions (westbound on-ramp and eastbound off-ramp)
5. Lammers Road ramp junctions (Build Alternatives Only – all directions)
6. Grant Line/Naglee Road ramp junctions (all directions)
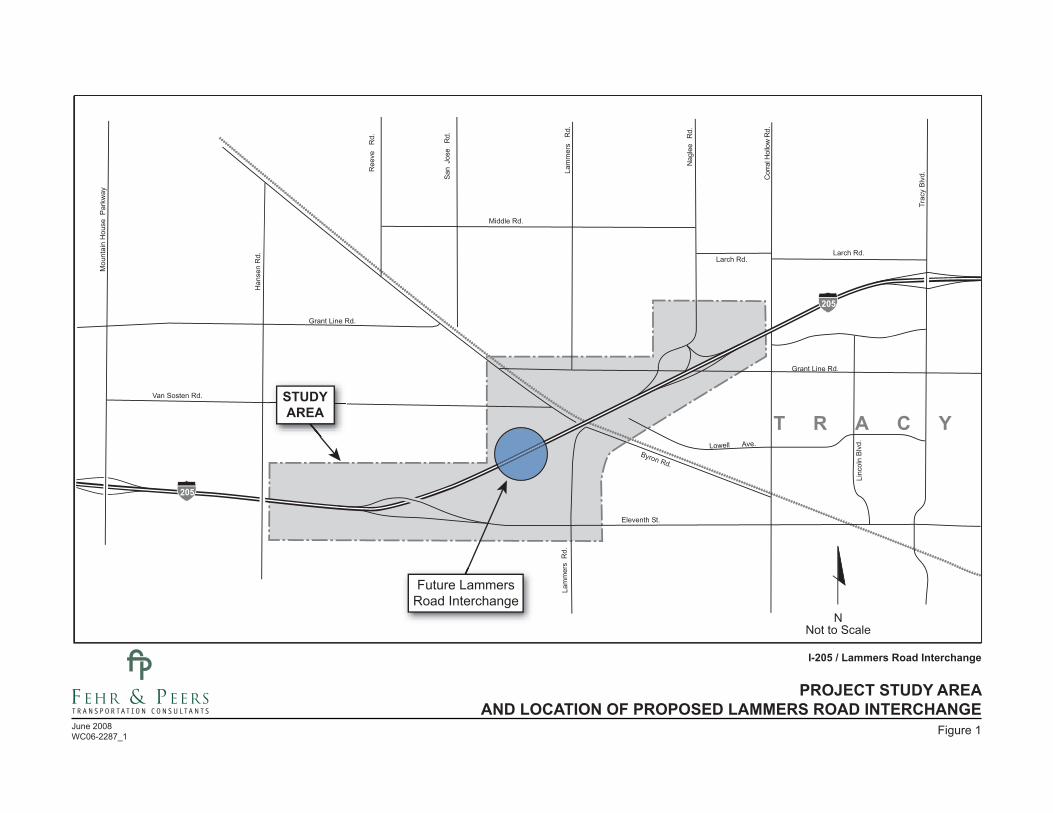
STUDYAREA
Future LammersRoad Interchange
PROJECT STUDY AREAAND LOCATION OF PROPOSED LAMMERS ROAD INTERCHANGE
I-205 / Lammers Road Interchange
Figure 1June 2008WC06-2287_1

10
Final Traffic Operations Report I-205/Lammers Road Interchange Project May 2009
2. EXISTING CONDITIONS
The existing conditions analysis presents the physical and operational characteristics of the roadway system in the vicinity of the proposed interchange project. This information provides part of the context for the purpose and need to construct improvements.
STUDY AREA
Interstate 205 (I-205) is an east-west freeway that connects Interstate 5 (I-5) to the east in San Joaquin County with Interstate 580 (I-580) to the west in Alameda County, and runs generally along the northern edge of the City of Tracy. It has two mixed-flow lanes in each direction east of Eleventh Street and three mixed-flow lanes in each direction from Eleventh Street west to the I-205/I-580 junction. According to the 2004 Traffic Volumes on the California State Highway System (Caltrans website), I-205 has an average daily traffic (ADT) volume of 111,000 between Eleventh Street and Mountain House Parkway, 93,000 between Eleventh Street and Tracy Boulevard, and 99,000 between Tracy Boulevard and I-5.
Eleventh Street also designated as Business 205 (Bus-205), is a four- to six-lane east-west expressway/ arterial that originates from I-205 in the west, passes through the City of Tracy, and terminates at I-5 south of the I-205/I-5 junction east of the City of Tracy. Eleventh Street provides direct access to the City of Tracy from Alameda County and the San Francisco Bay Area.
Lammers Road is a north-south rural roadway with one lane in each direction. South of I-205, it originates at Byron Road just south of the I-205/Byron Road underpass and terminates at the Union-Pacific Railroad south of Delta-Mendota Canal. North of I-205, Lammers Road extends northward from Grant Line Road and merges with Tracy Boulevard (J2) in San Joaquin County.
Grant Line Road is an east-west arterial. Within the study area, it is also designated as County Route J4. To the west, it crosses the San Joaquin/Alameda County line into Alameda County. In the study area, it intersects with Byron Road, passes under I-205 with interchange access to I-205, and continues east past Tracy Boulevard through the City of Tracy. To the east, it terminates at Eleventh Street, while Route J4 (Kasson Road) continues past Eleventh Street in a northwest-to-southeast direction. In the study area, Grant Line Road has two lanes in each direction east of I-205, and one lane in each direction west of I-205: there are sections between Naglee Road and Corral Hollow Road that are three lanes in each direction.
Eleventh Street Interchange is the first interchange on I-205 that provides direct access to and from the City of Tracy from the west. It is a partial interchange with access only to/from the west. It is a Caltrans Type F-8 interchange and is located at post mile 3.4 on I-205.
Grant Line Road/Naglee Road Interchange is configured differently for eastbound and westbound I-205 directions. In the eastbound I-205 direction, this interchange is configured as a Caltrans Type L-1 diamond interchange with on/off ramps that intersect with Grant Line Road. In the westbound direction, it is configured as a Caltrans Type-6 “hook” ramp with Naglee Road. This interchange also has a westbound on-ramp at the intersection of Grant Line Road/Naglee Road. This interchange is located at post mile 5.3.
DATA COLLECTION
Morning and evening peak period data was collected to determine the analysis AM and PM peak hours and to evaluate traffic operations during the peak hours. The analysis AM and PM peak hours usually reflects the

11
Final Traffic Operations Report I-205/Lammers Road Interchange Project May 2009
hour when traffic congestion is highest. In unusual cases when the peak hour on local streets differs from the freeway mainline peak hour, it is necessary to choose the local street or the mainline peak hour as the analysis peak hour for evaluation purposes. The decision on which peak hour to choose is often based on the project/study objectives.
The purpose of this traffic operations report is to evaluate design alternatives and determine the resulting operational impacts of the various build alternatives during the peak traffic volume conditions at the interchange. After consulting with Caltrans and other members of the project team, it was determined that existing traffic volumes and analysis for I-205 should be based on the likely peak hours of the future Lammers Road interchange whether or not the interchange peak corresponds to the peak hour of the freeway mainline. This approach results in consistent data and ensures that the peak traffic conditions at the Lammers Road interchange is accurately evaluated.
Traffic Counts
Peak period traffic counts were collected in Year 2005, 2006, and early 2007 during a typical weekday (Tuesday through Thursday). The counts are presented in Appendix A. The locations and year the data was collected are:
• 11th/Lammers Road (AM – May 2006; PM – May 2005)
• Byron Road/Grant Line Road (AM – May 2006; PM – May 2005)
• Grant Line Road/Naglee Road/I-205 Westbound On-Ramp (AM and PM – May 2005)
• Grant Line Road/I-205 Eastbound Ramps (AM and PM – May 2005)
• Naglee Road/I-205 Westbound Ramps (AM and PM – May 2005)
• I-205 Westbound and Eastbound Mainline at the Mountain House Parkway Undercrossing (AM and PM – March 2006; AM – January 2007)
• I-205 Westbound Ramps/Mountain House Parkway (AM and PM - January 2007)
• I-205 Eastbound Ramps/Mountain House Parkway (AM and PM - January 2007)
Intersection Peak Hour Volumes
Intersection peak hour volumes were based on the traffic counts. The count data indicates that the AM peak hour occurs from 6:30 AM to 7:30 AM and the PM peak hour occurs between 5:00 PM and 6:00 PM. During field reconnaissance, lane configurations, turning movement pocket lengths, speed limits, and signal timings were collected. Intersection lane configurations and peak hour intersection volumes at the existing study intersections are shown on Figure 2.

205
Lowell Ave.
Grant Line Rd.
Eleventh St.
Trac
y B
lvd.
Cor
ral
Hol
low
Rd.
Nag
lee
Rd.
T R A C Y
Larch Rd.
Lam
mer
sR
d.
nlocniL.dvl
B
Grant Line Rd.
Middle Rd.
Larch Rd.
San
Jose
Rd.
Ree
veR
d.
Byron Rd.
Lam
mer
s R
d.
NNot to Scale
1
2
1
Eleventh St.
Lam
mer
s Rd.
25 (69)1,374 (321)177 (65)
46 (2
7)83
(79)
76 (1
35)15 (170)
223 (1,665)26 (89)
145
(19)
54 (9
2)18
(52)
2
Grant Line Rd.
Byr
on R
d.
588 (258)152 (238)
127
(68)
119
(315
)
78 (1
96)
204
(456
)
STOP
STOP
= AM (PM) Peak HourXX (YY)
LEGEND:
STOP
= Traffic Signal
= Stop Sign
EXISTING (2006) INTERSECTIONLANE CONFIGURATIONS AND PEAK HOUR VOLUMES
June 2008WC06-2287_2
I-205 / Lammers Road Interchange
Figure 2

13
Final Traffic Operations Report I-205/Lammers Road Interchange Project May 2009
Freeway Mainline and Ramp Peak Hour Volumes
The AM peak hour mainline volumes were based on the mainline count collected on Tuesday, January 17, 2007 from 6:00 AM to 8:00 AM. The AM count collected in March 2006 was not used because it reflected volumes between 7:00 AM and 9:00 AM and did not include data between 6:30 AM and 7:00 AM. The PM peak hour mainline volumes were based on the count collected on Thursday, March 30, 2006. The traffic count also tracked data to determine the peak period truck percentage. Ramp peak hour volumes were based on the intersection traffic counts. I-205 mainline and ramp volumes are shown on Figure 3.
Caltrans has a traffic count station on I-205 west of Eleventh Street. The mainline volumes shown on Figure 3 were compared against 2004 traffic data collected by the count station to confirm that the volumes presented on Figure 3 were reliable. In all cases (AM and PM – both directions), the volumes presented on Figure 3 were slightly higher than the average of the 2004 data and appear to be reliable. The 2004 Caltrans data from the count station is presented in Appendix A.
The data from the count station located west of Eleventh Street and the mainline counts indicate that the predominant travel direction is westbound during the AM peak period and eastbound during the PM peak period. The count station data indicates that the AM peak hour of the mainline (5:00 AM to 6:00 AM) does not coincide with the AM peak hour of the local street system (6:30 AM to 7:30 AM), while the PM peak hour of the mainline (5:00 PM to 6:00 PM) does coincide with the PM peak hour of the local street system. Since the mainline and local street system peak hours do not coincide during the AM, the analysis peak hour for the mainline will be set at 6:30 AM to 7:30 AM to match the local street system peak hour. It is important to note that as traffic volumes on I-205 continue to grow in the future, traffic volumes between 6:30 AM and 7:30 AM will approach the volumes between 5:00 AM and 6:00 AM. Under present conditions, however, I-205 traffic volumes in the westbound direction from 6:30 AM to 7:30 AM are about 700 vehicles fewer than from 5:00 AM to 6:00 AM. Although traffic counts were not collected between 5:00 AM and 6:00 AM at the local study intersections, it is believed that volumes on the local streets are lower during the period of 5:00 AM to 6:00 AM than they are between 6:30 AM and 7:30 AM based on field observations.
The mainline traffic count data collected in March 2006 indicates that trucks make up about 7% and 11% of the total westbound I-205 traffic in the AM and PM peak hour, respectively; while trucks make up 18% and 5% of the total eastbound I-205 traffic in the AM and PM peak hour, respectively.
AM and PM Vehicle Occupancy Counts
AM and PM vehicle occupancy counts were manually counted along I-205 on Thursday, April 11, 2002 during the preparation of the traffic operations report for the I-205/Lammers Road Interchange Project Study Report (PSR). Counts east of Mountain House Parkway were taken from the Hansen Road overcrossing; those to the east of Eleventh Street were taken from the Eleventh Street overcrossing. Table 1 shows the AM and PM peak hour vehicle occupancy along I-205.

1,565 (367)
3,293 (2,205)
4,685 (2,312)
1,781 (4,977)
264 (1,924)
1,517 (3,053)
3,120 (1,945)
243 (528)
465
(567
)
156 (
114) 23
1 (2
17)
560 (591)
1,739 (3,092)
EXISTING (2006) FREEWAY LANE CONFIGURATION AND PEAK HOUR VOLUMESJune 2008WC06-2287_3
I-205 / Lammers Road Interchange
Figure 3

15
Final Traffic Operations Report I-205/Lammers Road Interchange Project May 2009
TABLE 1 FREEWAY AM/PM VEHICLE OCCUPANCY COUNTS - YEAR 2004
Autos Interstate 205 Traffic Volume 1
1 Person 2+ Persons % 2+ Occupancy
AM Peak Hour
Eastbound - East of Mt. House Parkway 1,551 1,168 139 10.6%
Westbound - East of Mt. House Parkway 5,222 4,148 757 15.4%
PM Peak Hour
Eastbound - East of Mt. House Parkway 4,877 3,645 933 20.4%
Westbound - East of Mt. House Parkway 2,413 1,620 605 27.2% 1 Traffic volume includes trucks. Source: I-205/Lammers Road Interchange Traffic Forecast & Corridor Operations Report, May 21, 2004
I-205 Travel Time Survey Results
Travel time surveys were performed on I-205 in both directions during the AM (5:00 AM to 9:00 AM) and PM (4:00 PM to 6:00 PM) periods using a laptop computer and the floating car technique in April and May 2006 on a typical weekday (Tuesday through Thursday). Fourteen runs and thirteen runs were performed during the AM and PM peak periods, respectively. The results are summarized in Table 2.
The travel time surveys indicate that traffic conditions during the analysis AM peak hour between 6:30 AM and 7:30 AM is slightly congested in the westbound direction and generally free-flow in the eastbound direction. The westbound direction experiences substantial congestion with speeds as low as 32 miles per hour between 5:00 AM and 6:00 AM which is prior to the analysis peak hour.
During the PM peak hour, the westbound direction is generally free-flow, while the eastbound direction is congested. The transition from three lanes to two lanes in the eastbound direction after the Eleventh Street off-ramp creates congestion that results in vehicle queues. The April 2006 field observations indicate that the queue extended about 800 feet upstream of the eastbound Eleventh Street off-ramp gore point, making it difficult for exiting vehicles to access the eastbound off-ramp. The 63 mph measured average travel speed results from free flow conditions until reaching the back of queue near the eastbound off-ramp.

16
Final Traffic Operations Report I-205/Lammers Road Interchange Project May 2009
TABLE 2 EXISTING MAINLINE TRAVEL TIMES AND TRAVEL SPEEDS
Travel Time (Minutes:Seconds) Travel Speed (Miles/Hour)
Segment Length (Feet) Average Max Min Average AM Peak Hour (6:30 AM to 7:30 AM) - Westbound Corral Hollow Undercrossing to Grant Line Off-Ramp 1,790 00:27 00:45 00:15 45
Grant Line Off-Ramp to Eleventh Street On-Ramp 14,740 02:59 03:52 02:02 56
Eleventh Street On-Ramp to Hansen Overcrossing 2,490 00:30 00:37 00:26 57
Overall 19,020 03:57 04:48 03:12 55 AM Peak Hour (6:30 AM to 7:30 AM) – Eastbound Hansen Overcrossing to Eleventh Street Off-Ramp 2,780 00:27 00:29 00:23 70
Eleventh Street Off-Ramp to Grant Line Off-Ramp 11,660 01:52 01:59 01:48 71
Grant Line Off-Ramp to Corral Hollow Undercrossing 4,580 00:48 00:54 00:42 65
Overall 19,020 03:06 03:15 02:58 70 PM Peak Hour (5:00 PM to 6:00 PM) - Westbound Corral Undercrossing to Grant Line Off-Ramp 1,790 00:19 00:24 00:14 68
Grant Line Off-Ramp to Eleventh Street On-Ramp 14,740 02:17 02:28 02:10 73
Eleventh Street On-Ramp to Hansen Overcrossing 2,490 00:32 00:49 00:24 57
Overall 19,020 03:08 03:28 02:50 70 PM Peak Hour (5:00 PM to 6:00 PM) – Eastbound Hansen Overcrossing to Eleventh Street Off-Ramp 2,780 00:30 00:37 00:23 631
Eleventh Street Off-Ramp to Grant Line Off-Ramp 11,660 03:52 05:17 02:05 34
Grant Line Off-Ramp to Corral Hollow Undercrossing 4,580 02:04 03:08 00:55 25
Overall 19,020 06:27 08:10 03:32 34 1 This average speed was collected on a day when vehicle queuing in the eastbound direction generally extended back to the
Eleventh Street off-ramp but not much further. Based on data presented in the I-205/Lammers Road Interchange Traffic Forecast and Corridor Operations Report, May 2004, the average speed for this segment was 32 mph, indicating that the vehicle queue was longer that particular day in 2004.
Source: Fehr & Peers, 2009

17
Final Traffic Operations Report I-205/Lammers Road Interchange Project May 2009
Based on previous field observations performed for other traffic studies in the City of Tracy, eastbound traffic during the PM peak period fluctuates and the extent of queuing varies from day to day. Fehr & Peers staff has observed the eastbound PM peak period queue extend back to the Hansen Road overcrossing, located about 2,800 feet from Eleventh Street eastbound off-ramp gore point. The I-205/Lammers Road Interchange Traffic Forecast and Corridor Operations Report (May 2004) indicated that the average travel speed in the eastbound direction between Hansen Road overcrossing and the Eleventh Street off-ramp gore point was 32 mph. This is consistent with previous field observations. In all cases (previous field observations and April 2006 observations) the Eleventh Street eastbound off-ramp during the PM peak period was observed to be severely congested as a result of vehicle queue spillback from the I-205 transition from three lanes to two lanes.
ANALYSIS METHODOLOGY AND KEY ASSUMPTIONS
The following presents the methodology and assumptions used to evaluate the study facilities.
Intersections
Level of service (LOS) is a description of the quality of an intersection’s operation, ranging from LOS A (indicating free-flow traffic conditions with little or no delay) to LOS F (representing over-saturated conditions where traffic flows exceed design capacity, resulting in long queues and delays). The City of Tracy policy is to maintain a service level of LOS D operations or better at intersections within ¼ mile of freeway interchanges.
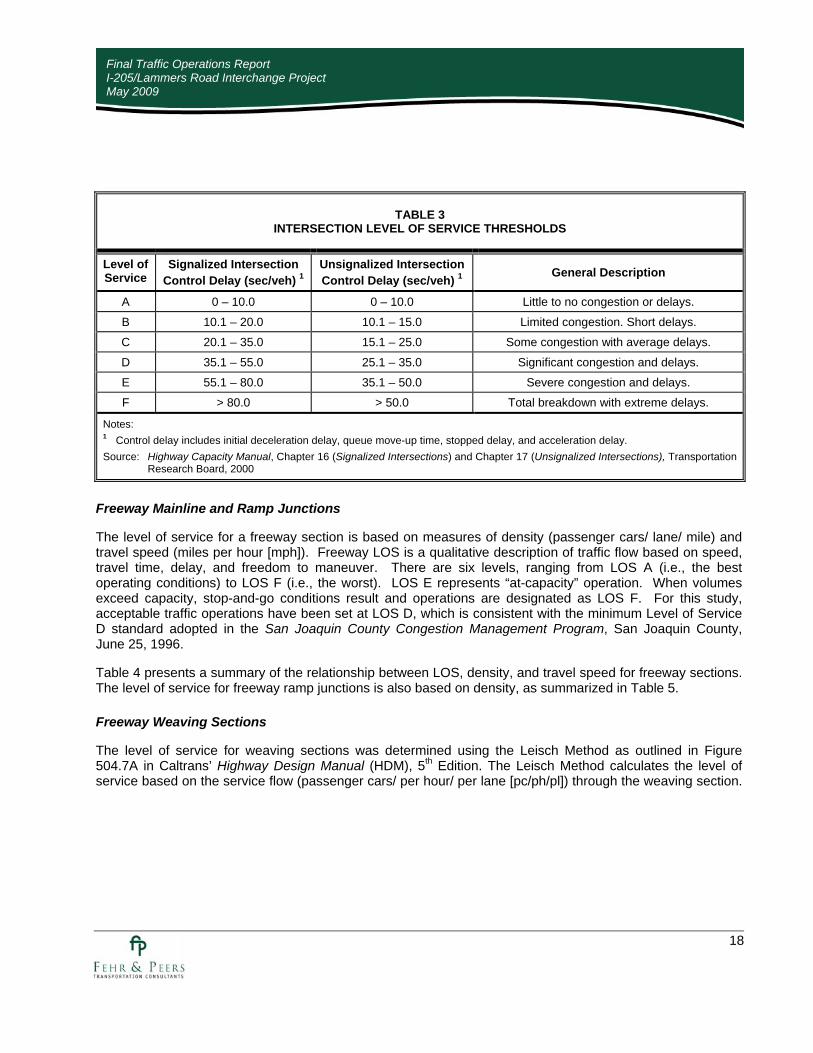
At signalized intersections, the LOS rating is based on the weighted average control delay of all movements measured in seconds per vehicle. Peak hour traffic volumes, lane configurations, and signal timing plans are used as inputs in the LOS calculations. At side-street stop-controlled intersections, the LOS rating is based on the control delay for each minor movement. For all-way stop-controlled intersections, the LOS rating is based on the weighted average control delay of all movements. The traffic analysis software, Synchro/SimTraffic 6.0, was used for this study. Synchro/SimTraffic is based on procedures outlined in the Transportation Research Board’s 2000 Highway Capacity Manual (HCM). Table 3 summarizes the relationship between the average control delay per vehicle and LOS for signalized and unsignalized intersections.
18
Final Traffic Operations Report I-205/Lammers Road Interchange Project May 2009
TABLE 3 INTERSECTION LEVEL OF SERVICE THRESHOLDS
Level of Service
Signalized Intersection Control Delay (sec/veh) 1
Unsignalized Intersection Control Delay (sec/veh) 1 General Description
A 0 – 10.0 0 – 10.0 Little to no congestion or delays.
B 10.1 – 20.0 10.1 – 15.0 Limited congestion. Short delays.
C 20.1 – 35.0 15.1 – 25.0 Some congestion with average delays.
D 35.1 – 55.0 25.1 – 35.0 Significant congestion and delays.
E 55.1 – 80.0 35.1 – 50.0 Severe congestion and delays.
F > 80.0 > 50.0 Total breakdown with extreme delays.
Notes: 1 Control delay includes initial deceleration delay, queue move-up time, stopped delay, and acceleration delay. Source: Highway Capacity Manual, Chapter 16 (Signalized Intersections) and Chapter 17 (Unsignalized Intersections), Transportation
Research Board, 2000
Freeway Mainline and Ramp Junctions
The level of service for a freeway section is based on measures of density (passenger cars/ lane/ mile) and travel speed (miles per hour [mph]). Freeway LOS is a qualitative description of traffic flow based on speed, travel time, delay, and freedom to maneuver. There are six levels, ranging from LOS A (i.e., the best operating conditions) to LOS F (i.e., the worst). LOS E represents “at-capacity” operation. When volumes exceed capacity, stop-and-go conditions result and operations are designated as LOS F. For this study, acceptable traffic operations have been set at LOS D, which is consistent with the minimum Level of Service D standard adopted in the San Joaquin County Congestion Management Program, San Joaquin County, June 25, 1996.
Table 4 presents a summary of the relationship between LOS, density, and travel speed for freeway sections. The level of service for freeway ramp junctions is also based on density, as summarized in Table 5.
Freeway Weaving Sections
The level of service for weaving sections was determined using the Leisch Method as outlined in Figure 504.7A in Caltrans’ Highway Design Manual (HDM), 5th Edition. The Leisch Method calculates the level of service based on the service flow (passenger cars/ per hour/ per lane [pc/ph/pl]) through the weaving section.

19
Final Traffic Operations Report I-205/Lammers Road Interchange Project May 2009
TABLE 4 FREEWAY MAINLINE LEVEL OF SERVICE CRITERIA
Level of Service Maximum Density (Passenger cars / mile / lane) Minimum Speed (mph)
A 11 70 B 18 70 C 26 68.2 D 35 61.5 E 45 53.3 F > 45 < 53.3
Notes: Freeway mainline LOS based on a 70 mph free-flow speed. Source: Highway Capacity Manual, Chapter 23 (Basic Freeway Sections), Transportation Research Board, 2000
TABLE 5 RAMP JUNCTION (MERGE AND DIVERGE) LEVEL OF SERVICE CRITERIA
Level of Service Maximum Density (Passenger cars / mile / lane)
A 10
B 20
C 28
D 35
E > 35
F Demand Exceeds Capacity
Source: Highway Capacity Manual, Chapter 25 (Ramps and Ramp Junctions Methodology), Transportation Research Board, 2000.

20
Final Traffic Operations Report I-205/Lammers Road Interchange Project May 2009
Key Assumptions
• Peak hour truck percentages of 7% and 11% for westbound I-205 were used for the AM and PM hour, respectively. Peak hour truck percentages of 18% and 5% for eastbound I-205 were used for the AM and PM hour, respectively. A peak hour truck percentage of 2 percent was used for all ramps.
• A measured free-flow speed of 70 mph was used for the freeway mainline and 45 mph for the ramps.
• Free-flow speed on the local streets was based on the posted speed limit.
• Analysis peak hours were from 6:30 AM to 7:30 AM and 5:00 PM to 6:00 PM.
EXISTING OPERATIONS ANALYSIS
Peak hour capacity analyses were performed for each intersection, ramp junction, and mainline freeway segment to define current operations. The following summarizes the analysis results for existing conditions.
Intersection Operations
Existing intersection conditions were evaluated based on lane configurations and traffic volumes as shown on Figure 2. In addition, signal timings (for signalized intersections), truck percentages, and pedestrians were included in the LOS analysis. The Synchro networks were converted to SimTraffic, a micro-simulation traffic engineering tool, to determine traffic operations. The primary difference between SimTraffic and Synchro/HCM is that HCM analyzes intersections in “isolation” and does not include the effects of upstream or downstream intersections. SimTraffic analyzes intersections as a “system,” with intersections directly affecting traffic flow through the entire project study area. Through SimTraffic, the effects of turn-pocket overflows and vehicle queue spillback are taken into consideration. SimTraffic also provides the ability to simulate a mixture of pedestrians, heavy vehicles, and automobiles and their interaction. SimTraffic provides measures of effectiveness consistent with HCM results, such as movement delay and weighted average delay.
To best reflect field conditions, the SimTraffic models were coded with turn pocket lengths, intersection spacing, posted speed limit, vehicle mix, and signal timings. SimTraffic uses a stochastic (or random-based) process to simulate vehicles. Therefore, SimTraffic output volumes may vary from input volumes. Prior to providing LOS results, the models were checked to ensure that each intersection was serving the existing volumes within an acceptable tolerance (+/- 5%) and that vehicle queues were consistent with field observations.
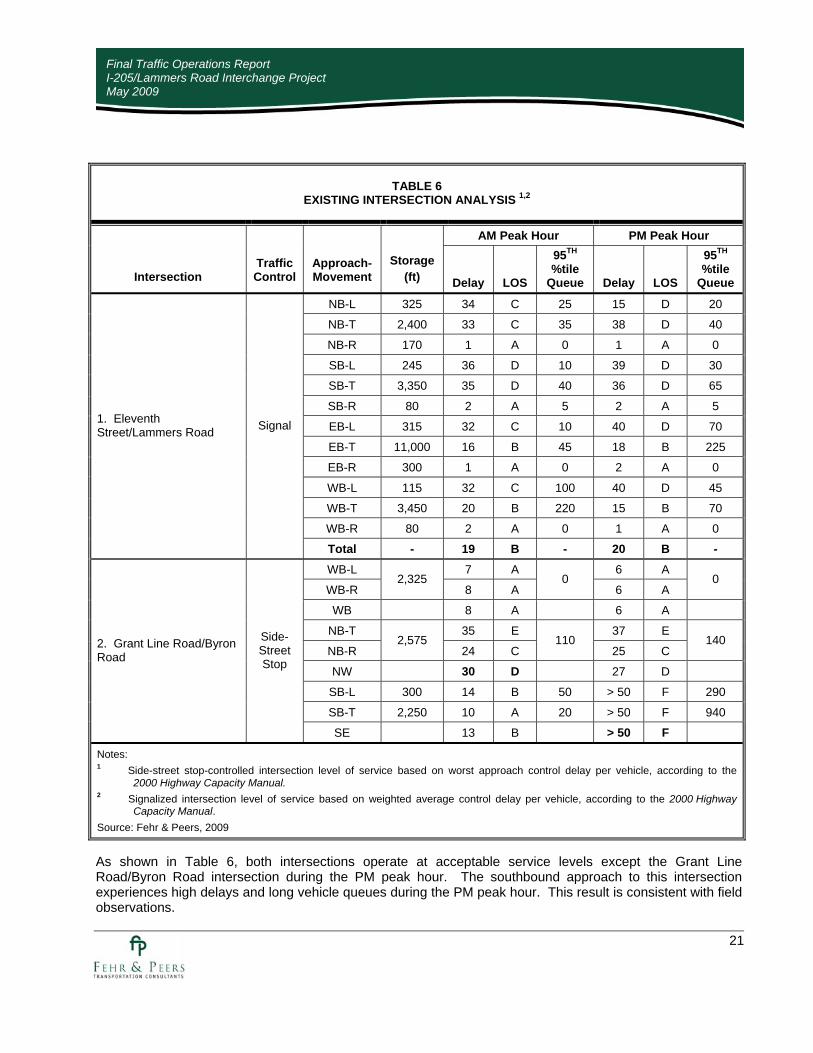
To improve the “statistical validity” of the SimTraffic simulation models, ten variations of each peak hour were created by changing the random seed number in the SimTraffic model to account for different driver behavior (e.g., accepting available gaps for turns, changing lanes, etc.). Both the Synchro and Fehr & Peers analysis worksheets from SimTraffic are presented in Appendix B. Please note that the delay and LOS from Synchro were not used. The Synchro worksheets are provided for informational purposes to present key inputs in the modeling including lanes, volumes, and timings. The results presented in Table 6 are from the Fehr & Peers analysis worksheets, which are the average of 10 SimTraffic model runs.
21
Final Traffic Operations Report I-205/Lammers Road Interchange Project May 2009
TABLE 6 EXISTING INTERSECTION ANALYSIS 1,2
AM Peak Hour PM Peak Hour
Intersection Traffic Control
Approach-Movement
Storage (ft) Delay LOS
95TH %tile
Queue Delay LOS
95TH %tile
Queue
NB-L 325 34 C 25 15 D 20
NB-T 2,400 33 C 35 38 D 40
NB-R 170 1 A 0 1 A 0
SB-L 245 36 D 10 39 D 30
SB-T 3,350 35 D 40 36 D 65
SB-R 80 2 A 5 2 A 5
EB-L 315 32 C 10 40 D 70
EB-T 11,000 16 B 45 18 B 225
EB-R 300 1 A 0 2 A 0
WB-L 115 32 C 100 40 D 45
WB-T 3,450 20 B 220 15 B 70
WB-R 80 2 A 0 1 A 0
1. Eleventh Street/Lammers Road Signal
Total - 19 B - 20 B - WB-L 7 A 6 A
WB-R 2,325
8 A 0
6 A 0
WB 8 A 6 A
NB-T 35 E 37 E
NB-R 2,575
24 C 110
25 C 140
NW 30 D 27 D
SB-L 300 14 B 50 > 50 F 290
SB-T 2,250 10 A 20 > 50 F 940
2. Grant Line Road/Byron Road
Side-Street Stop
SE 13 B > 50 F
Notes: 1 Side-street stop-controlled intersection level of service based on worst approach control delay per vehicle, according to the
2000 Highway Capacity Manual. 2 Signalized intersection level of service based on weighted average control delay per vehicle, according to the 2000 Highway
Capacity Manual. Source: Fehr & Peers, 2009
As shown in Table 6, both intersections operate at acceptable service levels except the Grant Line Road/Byron Road intersection during the PM peak hour. The southbound approach to this intersection experiences high delays and long vehicle queues during the PM peak hour. This result is consistent with field observations.

22
Final Traffic Operations Report I-205/Lammers Road Interchange Project May 2009
Mainline and Ramp Junction Operations
Field observations were conducted during the AM and PM peak periods to determine locations where high levels of congestion may render traditional freeway operations analysis techniques invalid. Field observations indicate heavy congestion in the westbound direction from about 5:00 AM to 6:00 AM and in the eastbound direction from about 4:00 PM to 6:00 PM. The heaviest congestion hour in the westbound direction during the AM on the mainline (5:00 AM to 6:00 AM) does not coincide with the heaviest congestion hour on the local street system (6:30 AM to 7:30 AM). This study evaluates the mainline during the hours of 6:30 AM to 7:30 AM and 5:00 PM to 6:00 PM to coincide with peak hour of the local street and freeway ramp system and the likely peak hours of the future Lammers Road interchange. Thus, traffic operations presented under existing conditions in the westbound direction during the AM do not represent the absolute highest congestion observed during the AM. Since the mainline is beneath capacity during the analysis AM peak hour (6:30 AM to 7:30 AM), traditional operations analysis techniques (i.e., HCM methodology) are valid.
During the PM peak hour, the westbound direction operates beneath capacity; therefore, traditional operations analysis techniques are valid. In the eastbound direction, however, severe congestion exists and traditional freeway operations analysis techniques are invalid. During the PM peak hour, measured vehicle speeds were used to determine level of service in the eastbound direction from the Eleventh Street off-ramp to east of Naglee Road.
Each mainline segment and ramp junction on I-205 was analyzed based on the volumes shown on Figure 3. There is one location with a mainline lane addition (Eleventh Street westbound on-ramp). At an on-ramp lane addition, the level of service is based on the operations of the downstream mainline segment. In addition to considering the operations of the downstream mainline segment, the volume of the on-ramp should be checked against the capacity of the on-ramp. At locations where the volume exceeds the capacity, the ramp itself would meter the amount of traffic that can merge on to the mainline, and traffic on the on-ramp could spillback onto surface streets and impact local street operations. The level of service results are summarized in Table 7. As shown in Table 7, I-205 operates at acceptable LOS D conditions or better except in the eastbound direction from the Eleventh Street off-ramp to east of Naglee Road. Detailed calculations are presented in Appendix C.

23
Final Traffic Operations Report I-205/Lammers Road Interchange Project May 2009
TABLE 7 EXISTING MAINLINE AND RAMP MERGE DIVERGE ANALYSIS
AM Peak Hour PM Peak Hour Mainline or Ramp
Number of
Lanes Density
or [Speed] 1
LOS Density
or [Speed] 1
LOS
Mainline Analysis
EB I-205 Hansen Road Overcrossing to Eleventh Street 3 10 A 25 C EB I-205 Eleventh Street to Grant Line 2 12 B [34]2 F EB I-205 Grant Line to Corral Hollow Undercrossing 2 14 B [25]2 F WB I-205 Corral Hollow Undercrossing to Grant Line 2 24 C 17 B WB I-205 Grant Line to Eleventh Street 2 23 C 15 B WB I-205 Eleventh Street to Hansen Road Overcrossing 3 25 C 12 B
Ramp Junction Analysis
EB I-205 Eleventh Street Off-Ramp 2 1 A [32]3 F EB I-205 Grant Line Off-Ramp 1 18 B [34]2 F EB I-205 Grant Line On-Ramp 1 17 B [25]2 F WB I-205 Naglee Off-Ramp 2 22 C 12 B WB I-205 Naglee On-Ramp 1 27 C 17 B WB I-205 Grant Line On-Ramp 1 28 D 18 B
WB I-205 Eleventh Street On-Ramp 1 25 / C (Lane Add)
V/C Ramp = 0.82 (D) 12 / B (Lane Add)
V/C Ramp = 0.19 (A)
Notes: 1 Mainline segment LOS based on vehicle density, according to the 2000 Highway Capacity Manual. Ramp merge/ diverge LOS
based on vehicle density, according to the 2000 Highway Capacity Manual. In cases where mainline congestion renders traditional analysis techniques invalid for mainline segments and ramps, LOS is based on vehicle speeds shown in italics and within brackets.
2 Based on travel time surveys performed by Fehr & Peers in April 2006. 3 Based on data presented in the I-205/Lammers Road Interchange Traffic Forecast and Corridor Operations Report, May 2004. Source: Fehr & Peers, 2009

24
Final Traffic Operations Report I-205/Lammers Road Interchange Project May 2009
3. ALTERNATIVES STUDIED
The I-205/Lammers Road Interchange Project proposes to construct a new interchange to improve freeway access and improve regional mobility. The design year for this study is 2035 and five design alternatives were studied:
No Build Alternative
The No Build alternative assumes that existing infrastructure conditions at the project site and on the freeway system would remain, with the exception of programmed improvements on SJCOG’s RTP Tier 1 list. There would be no construction of a new interchange, nor associated ramps and infrastructure. Lammers Road would terminate north of I-205 at Grant Line Road and would not connect with its southern segment at Lammers Road and Eleventh Street. Local road improvements would be built to serve future development in the urban reserves north and south of I-205.
Build Alternative 1 – New Spread Diamond Interchange at Lammers Road
This alternative would provide a new interchange at Lammers Road over I-205, with four new connection points to I-205. The existing Eleventh Street interchange with I-205 would be retained. Lammers Road would be realigned as a 6-lane arterial/expressway north of Eleventh Street with an overcrossing at I-205 and extend north to Grant Line Road and realign with Byron Road. A spread diamond (Type L-2) interchange would be constructed for Lammers Road at I-205 approximately one mile east of the Eleventh Street interchange and 1.2 miles west of the Grant Line Road interchange. Auxiliary lanes would connect the ramps between Lammers Road and Grant Line Road in each direction.
Local road improvements would include:
• Realignment and extension of Grant Line Road over Byron Road to connect with Lammers Road north of I-205
• Extension of Commerce Way north of Eleventh Street to connect with the new alignment of Lammers Road south of I-205
• Revised access to the Westgate neighborhood currently served by the existing Lammers Road
• Local road north of I-205 to connect Lammers Road and Byron Road
Build Alternative 5A – Modified Eleventh Street Partial Cloverleaf Interchange
This alternative would reconstruct the existing Eleventh Street partial interchange on I-205 by replacing it with a partial cloverleaf (Type L-9) at a realigned Eleventh Street while closing and removing the existing Eleventh Street ramps. The replacement interchange would be located approximately 2.3 miles east of the Mountain House Parkway interchange and 1.6 miles west of the Grant Line Road interchange. An auxiliary lane along I-205 would connect the westbound Grant Line Road on ramp to the westbound Eleventh Street exit ramp.
Local road improvements would include:
• Realignment and extension of Eleventh Street to curve to the north west of Lammers Road to connect to Byron Road north the I-205

25
Final Traffic Operations Report I-205/Lammers Road Interchange Project May 2009
• Realignment and extension of Grant Line Road over Byron Road to connect with Eleventh Street north of I-205
• Local road north of I-205 to connect Eleventh Street and Byron Road
Build Alternative 5A-VA – Value Assessment/ Modified Alternative 5A Interchange
This alternative, recommended by the Value Assessment Study, is similar to Alternative 5A. The alternative would reconstruct the existing Eleventh Street partial interchange on I-205 by replacing it with a partial cloverleaf (Type L-9) configuration westbound and a wide diamond (Type L-2) configuration eastbound at a realigned Eleventh Street while closing and removing the existing Eleventh Street ramps. The replacement interchange would be located approximately 2.3 miles east of the Mountain House Parkway interchange and 1.6 miles west of the Grant Line Road interchange. An auxiliary lane along I-205 would connect the westbound Grant Line Road on ramp to the westbound Eleventh Street exit ramp.
Local road improvements would include:
• Realignment and extension of Eleventh Street to curve to the north west of Lammers Road to connect to Byron Road north the I-205
• Realignment and extension of Grant Line Road over Byron Road to connect with Eleventh Street north of I-205
• Local road north of I-205 to connect Eleventh Street and Byron Road
Build Alternative 6 – New Partial Cloverleaf Interchange at Lammers Road
This alternative would construct a new partial cloverleaf (Type L-9) interchange on Lammers Road at I-205, located approximately one mile east of the Eleventh Street interchange and 1.2 miles west of the Grant Line Road interchange. This alternative would realign Lammers Road north of Eleventh Street with an overcrossing at I-205 and extend north to Grant Line Road and realign with Byron Road. The existing westbound on ramp at Eleventh Street would be closed, but the existing eastbound Eleventh Street exit ramp would be retained. Auxiliary lanes would connect the ramps between Lammers Road and Grant Line Road in each direction.
Local road improvements would include:
• Realignment and extension of Grant Line Road over Byron Road to connect with Lammers Road north of I-205
• Extension of Commerce Way north of Eleventh Street to connect with the new alignment of Lammers Road south of I-205
• Revised access to the Westgate neighborhood currently served by the existing Lammers Road
• Local road north of I-205 to connect Lammers Road and Byron Road

26
Final Traffic Operations Report I-205/Lammers Road Interchange Project May 2009
4. TRAFFIC FORECASTS
This chapter describes the traffic forecasting methodology and resulting traffic demand volumes in the study area that become the basis for the traffic operations analysis for the Build alternatives. Traffic forecasts were developed for 2015 (opening year) and 2035 (design year).
Two common methods for forecasting future traffic levels are historical trend line extrapolation and the use of 4-step travel demand models. The former method relies solely on past trends, while the latter bases forecasts on an assumed set of conditions that influence travel.
In applying a trend line extrapolation, one assumes the underlying conditions that affect trip making and route choice are static over time. Thus, if past trends indicate average annual traffic volume growth rate of 3%, one would increase the baseline volume at a particular location by 3% per year to derive the future traffic demand. This method may be valid in situations where the roadway network has ample capacity to support the existing and projected future traffic, and where the expected change in the demographic patterns of the study area and surrounding geography does not differ from the past.
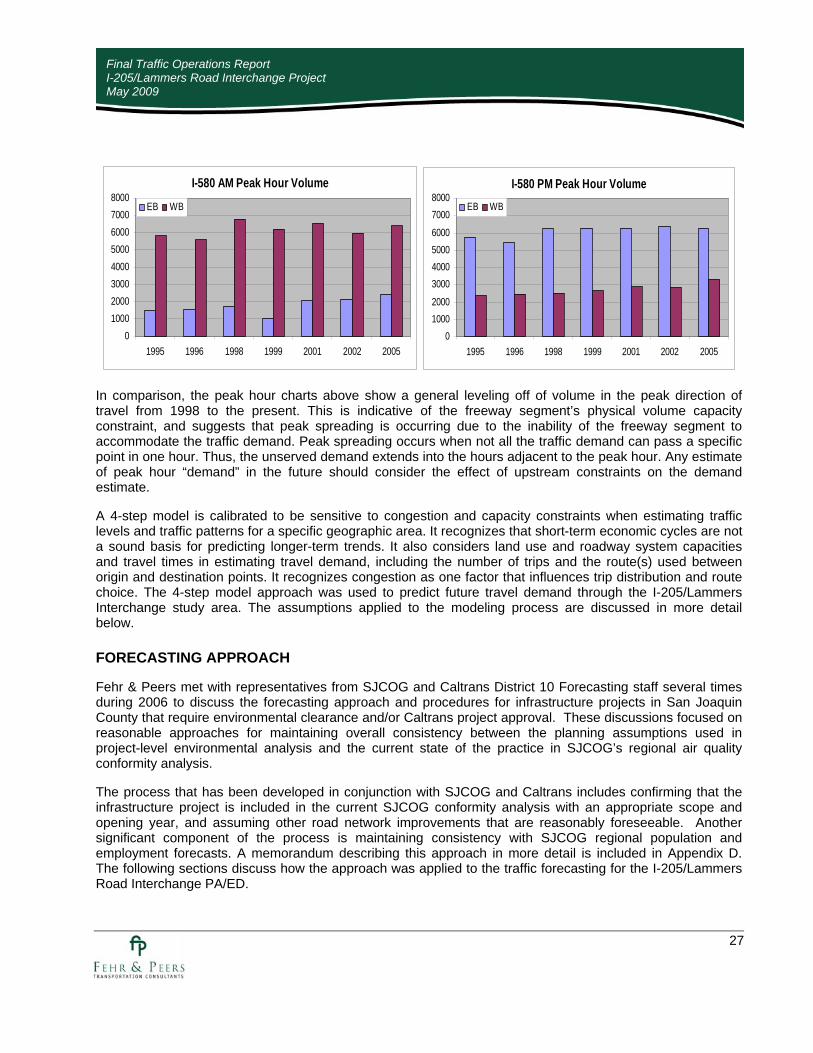
This is not the case for the Lammers interchange study area. Economic cycles and historical trends in traffic volume have fluctuated from year-to-year, making trend-line projections difficult. The charts below illustrate this point. Shown on the charts are the AM and PM peak hour and average weekday traffic volumes collected by Caltrans from 1995 to 2005 on Interstate 580 (I-580) at Greenville Road in Alameda County, at the edge of the Altamont Pass. This freeway segment controls the amount of traffic through the Altamont Pass and across the Alameda/San Joaquin county line. As indicated by the average weekday volume chart, I-580 experienced a slight drop in daily traffic volume in 1998, followed by fairly aggressive growth through 2001, then much slower growth from 2001 through 2005.
A trend-line projection based on this data would yield very different results depending on the analyst’s choice of “end points” to use for the projection. At an extreme, one could base the trend-line projection on the period from 1998 through 2001 when growth was most evident. This would yield an annual growth rate of over 11%. However, as revealed by the data, an 11% annual growth rate was not sustained beyond 2001. Taking a longer-range view, the data indicates an annual growth rate of about 2.7% for the 10-year period between 1995 and 2005. Yet in the most recent 5-year period (2001-2005), average weekday traffic volumes have grown by just over 1% annually.
I-580 Average Weekday Volume
010000200003000040000
50000600007000080000
1995 1996 1998 1999 2001 2002 2005
EB WB
27
Final Traffic Operations Report I-205/Lammers Road Interchange Project May 2009
I-580 AM Peak Hour Volume
010002000300040005000600070008000
1995 1996 1998 1999 2001 2002 2005
EB WB
I-580 PM Peak Hour Volume
010002000
3000400050006000
70008000
1995 1996 1998 1999 2001 2002 2005
EB WB
In comparison, the peak hour charts above show a general leveling off of volume in the peak direction of travel from 1998 to the present. This is indicative of the freeway segment’s physical volume capacity constraint, and suggests that peak spreading is occurring due to the inability of the freeway segment to accommodate the traffic demand. Peak spreading occurs when not all the traffic demand can pass a specific point in one hour. Thus, the unserved demand extends into the hours adjacent to the peak hour. Any estimate of peak hour “demand” in the future should consider the effect of upstream constraints on the demand estimate.
A 4-step model is calibrated to be sensitive to congestion and capacity constraints when estimating traffic levels and traffic patterns for a specific geographic area. It recognizes that short-term economic cycles are not a sound basis for predicting longer-term trends. It also considers land use and roadway system capacities and travel times in estimating travel demand, including the number of trips and the route(s) used between origin and destination points. It recognizes congestion as one factor that influences trip distribution and route choice. The 4-step model approach was used to predict future travel demand through the I-205/Lammers Interchange study area. The assumptions applied to the modeling process are discussed in more detail below.
FORECASTING APPROACH
Fehr & Peers met with representatives from SJCOG and Caltrans District 10 Forecasting staff several times during 2006 to discuss the forecasting approach and procedures for infrastructure projects in San Joaquin County that require environmental clearance and/or Caltrans project approval. These discussions focused on reasonable approaches for maintaining overall consistency between the planning assumptions used in project-level environmental analysis and the current state of the practice in SJCOG’s regional air quality conformity analysis.
The process that has been developed in conjunction with SJCOG and Caltrans includes confirming that the infrastructure project is included in the current SJCOG conformity analysis with an appropriate scope and opening year, and assuming other road network improvements that are reasonably foreseeable. Another significant component of the process is maintaining consistency with SJCOG regional population and employment forecasts. A memorandum describing this approach in more detail is included in Appendix D. The following sections discuss how the approach was applied to the traffic forecasting for the I-205/Lammers Road Interchange PA/ED.

28
Final Traffic Operations Report I-205/Lammers Road Interchange Project May 2009
TRAVEL DEMAND MODEL
A focused travel demand model was developed to serve as the forecasting tool for the I-205/Lammers Road Interchange Project. The focused model incorporates data from the SJCOG travel demand model. Additional detail was added to the City of Tracy planning area, including the Lammers Road interchange study area, to create the focused model. Fehr & Peers calibrated the focused model to match existing AM and PM peak hour conditions in the study area, and the model was reviewed and accepted for use in this study by Caltrans and SJCOG in 2007. Detailed documentation of the calibration process and validation results is included in Appendix D.
Network Assumptions
The 2035 roadway network assumes all Tier 1 improvements on the SJCOG 2007 Regional Transportation Plan Project List. The major improvements that could affect the Lammers interchange study area are:
• I-205 – Construct east and westbound auxiliary lanes between Tracy Boulevard and Mountain House Parkway
• I-205 – Widen to 8 lanes from I-580 to I-5
• I-5 Mossdale – Widen to 12 through lanes from SR-120 to I-205
Development Assumptions
Currently, SJCOG regional land use forecasts extend to the year 2030. For this study, 2035 land use forecasts were developed by extrapolating regional totals using simple annual growth rates of 2.7% and 1.6% for housing and employment, respectively. These growth rates are based on the regional growth between SJCOG’s adopted land use totals for 2005 and 2030. Using these growth rates, San Joaquin County would grow to approximately 387,200 dwelling units and 305,800 jobs by 2035 (from about 212,000 dwelling units and 207,400 jobs in 2005), as shown in Table 8.
TABLE 8 SJCOG ADOPTED REGIONAL LAND USE TOTALS
Residential Units Employment Year Tracy Planning
Area (TPA) SJ County
Outside TPA SJCOG Total Tracy Planning Area (TPA)
SJ County Outside TPA SJCOG Total
2005 1 23,480 188,544 212,024 19,459 187,913 207,372
2030 1 45,253 312,720 357,973 30,571 258,842 289,413
2035 2 49,608 337,555 387,163 32,793 273,029 305,822
Notes: 1. Source: SJCOG Model land use data. 2. Estimated by straight-line extrapolation from 2005 and 2030 data.

29
Final Traffic Operations Report I-205/Lammers Road Interchange Project May 2009
Housing Projections
The rate of growth in housing development in Tracy is controlled by the City’s residential growth ordinance, which limits the number of residential building permit approvals to 600 units per year. Based on estimates from the City’s planning department, the number of residential dwelling units in Tracy would increase to 42,514 by 2035 assuming the City’s growth ordinance remains in effect through 2035.
Because the units allocated to the Tracy Planning Area by SJCOG exceed the allowable total due to the City’s growth ordinance, the excess 7,094 units (49,608 - 42,514) were added to zones in the SJCOG region outside of Tracy to maintain the SJCOG officially adopted forecast total of 387,163 units for the SJCOG region as a whole. The adjustments to SJCOG zones were made in proportion to the change in residential units from 2005 to 2030 estimated by SJCOG.
Employment Projections
Employment growth in Tracy was allocated to zones surrounding the proposed interchange to achieve build-out of the study area based on the City’s approved development plans and adopted zoning designations. Specifically, employment build-out was assumed in the following development areas:
• Tracy Gateway – 18,990 jobs
• Tracy Urban Reserve 4 – 12,087 jobs
• Tracy Urban Reserve 5/18 – 2,643 jobs
A total of 33,720 new jobs were added to the Lammers Road Interchange study area, increasing the total employment in Tracy to 60,243 jobs by year 2035. As this total exceeds the SJCOG allocation of jobs to Tracy, jobs outside the Tracy Planning Area were decreased to maintain the SJCOG officially adopted forecast total of 305,822 jobs for the SJCOG region as a whole. The adjustments to SJCOG zones were made in proportion to the change in jobs from 2010 to 2030 estimated by SJCOG.
Table 9 shows the adjustments that were made to the residential and employment allocations for the Tracy Planning Area (TPA) and for areas outside the TPA in the SJCOG region.
TABLE 9 RESIDENTIAL AND EMPLOYMENT ADJUSTMENTS TO 2035 HOUSING AND EMPLOYMENT
Residential Units Employment
Tracy Planning Area
(TPA)
SJ County Outside TPA SJCOG Total
Tracy Planning Area
(TPA)
SJ County Outside TPA SJCOG Total
SJCOG Allocation 49,608 337,555 387,163 32,793 273,029 305,822
Adjustment -7,094 +7,094 - +27,450 -27,450 -
Lammers Model 42,514 344,649 387,163 60,243 245,579 305,822

30
Final Traffic Operations Report I-205/Lammers Road Interchange Project May 2009
DEPARTMENT OF TRANSPORTATION RISK ASSESSMENT
The Department supports the development of local, focused transportation models to assist in studying operational forecast data for project design. To protect the safety and operation of the State Highway System (SHS), these models should accurately assess future land use development and provide reliable future traffic forecasts to ensure proper sizing and location of transportation improvement projects.
Under the proposal presented by Fehr & Peers, the Department is comfortable with the development of focused area models or stand alone models as long as either approach maintains the integrity of SJCOG’s adopted regional forecasts for population and employment, as well as the certified zoning maps of local jurisdictions’ adopted general plans.
Under the proposal, for any specific transportation project requiring detailed analysis, land use within jurisdictions may be shifted to “reallocate post-2010 housing and/or employment growth from elsewhere in the city or region to achieve foreseeable buildout of the project area”. This shifting will be performed in a manner that conforms to the certified land use zoning pattern adopted through a local general plan and development approval process.
To support project development, regional travel demand models such as that administered by the SJCOG must undergo significant roadway network refinement and disaggregation of zonal land use data to obtain the level of precision required for operational analysis and project design. To maintain the integrity of regional air quality conformity determinations, this process must ensure that the development of refined models maintains consistency with the planning assumptions contained within the regional model. To a significant extent, the proposed approach maintains this consistency at the regional and city-by-city level. To maintain consistency at a more detailed level, SJCOG should continue to update its land use projections on a regular basis and should consider recent changes to adopted local land use plans when performing the updates.
However, this approach does not assure that this more detailed level of land use consistency will be maintained. Therefore, there is a risk associated with the possibility that future SJCOG land use projections and future regional transportation planning and air quality analysis may produce findings that differ from the assumptions and results contained in current project-specific studies. In that event, either: 1) future regional analysis will supersede the findings of the project-specific studies and will attempt to address any additional traffic or air quality impacts that result, or 2) there will be a risk to regional mobility and air quality conformity will not be maintained.
Under the second scenario, the risk relates to the possibility that successive studies that respond to individual development plans will result in an overestimation of the level of land use development as well as the transportation system built to facilitate it. If appropriate amendments are not made to regionally adopted land use projections used to make air quality conformity determinations, this process will result in a greater level of pollution than expected if not offset by appropriate mitigation strategies. The long term result will be higher levels of air pollution along with increased and unanticipated health hazards to local and regional populations. Another important foreseeable risk is that the San Joaquin County air quality conformity standards may be found to be in non-compliance by responsible reviewing agencies.
2035 PEAK HOUR DESIGN FORECASTS
Travel forecasts are used in the traffic capacity and operations analysis to determine the adequacy of design alternatives. The demand forecasts presented in this section are conservative estimates of travel demand during the morning and evening peak hours, and assume that “unconstrained” peak hour demand would

31
Final Traffic Operations Report I-205/Lammers Road Interchange Project May 2009
occur rather than the suppressed demand that is occurring today on I-205 due to capacity constraints and peak hour spreading. Suppressed demand occurs when limited roadway capacity constrains peak hour traffic volumes and causes traffic to spread into other hours of the day. Adjusting traffic forecasts to eliminate the effects travel suppression is only relevant at the locations and in the direction in which suppression actually occurs1. Traffic flowing in the opposite, or non-commute, direction does not experience suppression at the same time of day, and therefore is adjusted during its own respective peak hour instead. The following general procedure was employed to estimate peak hour design volumes representing unconstrained demand:
• Caltrans District 10 Forecasting group requires the use of 9.1% of daily directional volumes (ADT) for
design purposes. The 9.1% peak-hour peak-direction adjustment applies to westbound traffic during the AM peak hour and eastbound traffic during the PM peak hour. As peak traffic flows do not occur in both directions simultaneously, the 9.1% factor is not applied to both travel directions simultaneously.
• Consistent with the factoring of mainline freeway and ramp volumes, peak hour turning movement volume forecasts at the ramp intersections also assume 9.1% of ADT for the peak travel direction, while turning movement forecasts for the non-peak travel direction use calibrated model demand estimates.
With this methodology, “model adjusted” AM and PM peak hour design volumes that reflect unsuppressed peaking conditions for the respective time periods were developed. More specifically, design year 2035 peak hour design forecasts were developed using the following two-step process:
Step 1. The focused travel demand model with the development and network assumptions described above for the four alternatives was run to generate AM and PM peak hour model demand volumes. The forecasted “raw” model volumes were not used directly, but were calibrated based on the base-year model deviation results. The resulting calibrated demand volumes were further adjusted to balance mainline and ramp on/off volumes along the I-205 corridor. Average daily traffic volumes (ADT) were calculated using a factor of 8.75 times the sum of the AM and PM peak hour calibrated and balanced model demand estimates at each location. The 8.75 factor was derived from existing count data for I-205 west of Eleventh Street.
Step 2. Peak hour unconstrained design volumes were derived by factoring the peak directional ADT volume from Step 1 (i.e., westbound for the AM and eastbound for the PM peak hour) by 9.1%. The model calibrated peak hour demand volumes in the non-peak travel direction were not adjusted further.
Year 2035 peak hour constrained design volume forecasts are depicted on Figures 4 through 8 for the No Build Alternative and each Build Alternative2. It is important to note the mainline and ramp volumes do not match the intersection turning movement volumes at the ramps because only the mainline volumes were constrained for purposes of determining traffic operations on the mainline. The unconstrained (i.e. full demand) volumes were used at the individual intersections to avoid undersizing the interchange. These volumes represent a conservatively high estimate of future traffic demand based on the assumptions built into the forecasting process and the reasons stated below:
1. On I-205 peak travel demand is in the westbound direction during the morning (AM) commute period, and in the eastbound direction during the evening (PM) commute period.
2. The mainline and ramp volumes shown on 4A, 5A, 6A, 7A, and 8A have been constrained to the mainline capacity of 6,000 vehicles per hour. Unconstrained volumes are included in Appendix E.

32
Final Traffic Operations Report I-205/Lammers Road Interchange Project May 2009
• Development levels in the Lammers corridor have been maximized to General Plan build-out
• The 9.1% peaking factor reflects a peaking condition that has not occurred on I-205 since the 1990’s
• Lifestyle and employment changes in San Joaquin County (and throughout the United States) have been reducing peaking factors in general to less than 9%, with the expectation that the trend will continue into the future as travelers have more flexibility to choose when to travel
• The demand model used to estimate peak hour traffic produces hourly volumes throughout the region, even though longer travel distances (and travel times) preclude some trips from actually appearing on the study area network in the same hour that is being estimated
• The operations analysis may restrict the traffic flow into the study area by identifying capacity constraints upstream of the system under analysis
No Build Alternative
Under the No Build alternative, peak hour peak directional model estimated traffic demand volumes on I-205 are estimated to increase about 45% over 2006 levels, or 1.3% annually, at the west end of the study area (west of Eleventh Street). At the east end of the study area (east of Grant Line Road), peak hour peak directional model estimated traffic demand volumes are estimated to increase almost 100% over 2006 levels, or 2.4% annually.
Traffic volumes on the Eleventh Street ramps would increase more significantly in the off-peak directions (eastbound during the AM peak hour, and westbound during the PM peak hour), reflecting an overall shift in the commute pattern as more jobs are introduced into Tracy, and the regional roadway network becomes more congested.
Design hour volumes range from 9% to 25% higher than the model estimated peak hour demand volumes on mainline I-205.
Build Alternative 1 – New Spread Diamond Interchange at Lammers Road
A new spread diamond interchange at Lammers Road would draw more traffic into the I-205 corridor from the east, and also allow local travel between Grant Line Road and Lammers Road to access I-205. ADT on I-205 east of Grant Line Road would be 14% higher than under the No Build alternative because of additional access capacity to/from I-205 at Lammers Road.
Build Alternative 5A – Modified Eleventh Street Partial Cloverleaf Interchange and Build Alternative 5A-VA – Value Assessment/ Modified Alternative 5A Interchange
These two alternatives would relocate and reconstruct the Eleventh Street interchange to a full access interchange approximately 0.5 mile east of its current location. Compared to Build Alternative 1, Congestion on Lammers Road north of Eleventh Street leading to the interchange would cause some traffic with origins or destinations to the west to use I-580 from Mountain House Parkway instead. This effect is most pronounced during the PM peak hour in the eastbound direction for trips with destinations south of Eleventh Street and west of Lammers Road. Reducing this impact to the Patterson Pass I-580 interchange area would require that Lammers interchange Alternative 5A offer a greater amount of capacity on Lammers Road north of Eleventh Street than contained in the present plan.

33
Final Traffic Operations Report I-205/Lammers Road Interchange Project May 2009
Build Alternative 6 – New Partial Cloverleaf Interchange at Lammers Road
Under Alternative 6, the Eleventh Street eastbound off-ramp would remain open, while the westbound on-ramp would be closed. Similar to Alternative 5A, some traffic originating south of Eleventh Street and west of Lammers Road with destinations to the west would use I-580 from Mountain House Parkway to avoid the congestion on Lammers Road north of Eleventh Street. Reducing this diversion would require that Lammers Road offer a greater amount of capacity than contained in Alternative 6.
OPENING DAY (2015) DESIGN HOUR FORECASTS
Year 2015 design hour forecasts were developed using a similar process to the one described above for 2035. 2015 AM and PM peak hour model demand forecasts were developed by interpolating between the 2005 and 2035 trip tables from the focused travel demand model. The interpolated trip tables for AM and PM peak hour were assigned to a 2015 network. Roadway improvements identified in the 2007 SJCOG Regional Transportation Plan Project List that have completion dates of 2015 or earlier were included in the 2015 network. In the project study area, I-205 is assumed to be six lanes from I-580 to I-5. The 2015 peak hour design volume forecasts for the No Build and each Build alternative are depicted on Figures 9 through 13. It is important to note the mainline and ramp volumes do not match the intersection turning movement volumes at the ramps because only the mainline volumes were constrained for purposes of determining traffic operations on the mainline. The unconstrained (i.e. full demand) volumes were used at the individual intersections to avoid undersizing the interchange.

Gra
nt L
ine
Rd.
Lammers Rd.
Mountain House Pkwy.
Elev
enth
St.
205
N /
A
70,0
00
59,6
80
2,62
0 1
,830
98,7
9028
,790 95
0
2,05
9
86,5
40
16,2
68
18,6
66
94,0
95
91,4
69
6,77
3(8
14)
3,88
1(4
04)
7,20
9(8
86)
4,00
3(4
17)
2,84
0(2
70)
5,91
4(7
48)
6,00
0(7
89)
3,26
1(3
39)
4,84
7(6
28)
2,34
6(2
44)
4,84
7(6
28)
2,34
6(2
44)
2,09
0(1
98)
6,00
0(8
54)
154
1,65
260
61,
449
2,50
2(2
38)
5,85
7(7
94)
1,48
968
01,
997
815
22,7
48
17,4
6826
,860
300
2
40
3,33
023
,540
160
4
90
59,6
80
6,39
0
250
702,
190
70,0
00
88,0
20
81,3
80
1,48
0 2
,560
28,0
90
1,63
5(1
55)
4,04
4(5
48)
1,63
5(1
55)
4,04
4(5
48)
N /
A
N /
A
N /
A
1,81
4 1
,320
NN
ot to
Sca
le
LEG
END
AD
T
AM
Con
stra
ined
Vol
ume
(AM
HO
V V
olum
e)P
M C
onst
rain
ed V
olum
e(P
M H
OV
Vol
ume)
NOTE
: AM
Wes
tboun
d and
PM
Eastb
ound
volum
es en
tering
the s
tudy a
rea h
ave b
een c
onstr
ained
to th
e phy
sical
carry
ing ca
pacit
y of
the fr
eewa
y (2,0
00 ve
hicles
/lane
). Ma
inline
volum
es an
d off-
ramp
volum
es ha
ve be
en ad
justed
to re
flect
the vo
lume c
onstr
aining
proc
ess.
XX
X
2035
NO
BU
ILD
ALT
ERN
ATIV
EI-2
05 M
AIN
LIN
E A
ND
RA
MP
CO
NST
RA
INED
VO
LUM
ES
I-205
/ La
mm
ers
Roa
d In
terc
hang
e
Figu
re 4
AJu
ly 2
008
Gra
phic
s\Ju
ly 2
008\
WC
06-2
287_
4A

1 2 3
Eleventh St Grant Line RdConnection to Byron
4
Lam
mer
s R
d
320
(10)
650
(660
)10
0 (3
90)
210
(60)
360
(1,0
40)
50 (5
00)
180 (240)1,620 (820)390 (390)
5
Lam
mer
s R
d
10 (10)160 (490)
10 (1
0)
1,38
0 (1
,670
)
6
Lam
mer
s R
d
190
(320
)30
(180
)42
0 (1
,480
)10 (10)490 (660)240 (300)
10 (1
0)11
0 (1
90)
500
(460
)
510 (680)670 (600)1,030 (1,190)
40 (310)290 (1,830)
10 (450)
650 (1,980)430 (460)
Com
mer
ce W
ayEleventh St
7
130
(620
)16
0 (6
80)
100
(500
)
100
(540
)59
0 (4
60)
160
(920
)
410 (680)1,230 (670)500 (270)
150 (510)320 (1,310)
480 (300)
DoesNot
Exist
DoesNot
Exist
DoesNot
Exist
LEGEND = AM (PM) Peak Hour Traffic VolumesXX (YY)
2035 NO BUILD ALTERNATIVEPEAK HOUR INTERSECTION TURNING MOVEMENT VOLUMES
I-205 / Lammers Road Interchange
Figure 4BJune 2008WC06-2287_4B

205
Gra
nt L
ine
Rd.
Lammers Rd.
Mountain House Pkwy.
Elev
enth
St.
74,1
10
61,7
70
98,0
9023
,980
85,6
6023
,890
7,35
016
,280
81,4
60
10,1
50
2,01
093
,360
4,29
0
3,59
0
23,5
40
23,2
80
100,
280
92,9
20
21,6
10
16,2
68
18,6
66
93,5
70
90,7
04
6,34
2(8
08)
3,87
2(4
03)
2,08
1(1
97)
6,00
0(8
45)
154
1,66
560
61,
449
1,48
968
01,
871
815
6,65
2(8
80)
3,99
4(4
16)
22,7
48
17,4
68
2,18
01,
390
4,68
7(6
65)
2,73
5(2
85)
390
280
1,66
91,
340
5,79
3(8
38)
3,69
5(3
85)
180
140
670
690
1,11
991
0
6,00
0(9
00)
3,76
7(3
95)
2,49
3(2
37)
5,84
4(7
85)
840
1,84
4
1,72
6(1
64)
4,21
9(5
66)
120
280
950
2,12
0
2,48
3(2
37)
5,87
9(7
46)
310
823
3,24
1(3
09)
6,92
3(8
51)
1,14
01,
970
NN
ot to
Sca
le
LEG
END
AD
T
AM
Con
stra
ined
Vol
ume
(AM
HO
V V
olum
e)P
M C
onst
rain
ed V
olum
e(P
M H
OV
Vol
ume)
NOTE
: AM
Wes
tboun
d and
PM
Eastb
ound
volum
es en
tering
the s
tudy a
rea h
ave b
een c
onstr
ained
to th
e phy
sical
carry
ing ca
pacit
y of
the fr
eewa
y (2,0
00 ve
hicles
/lane
). Ma
inline
volum
es an
d off-
ramp
volum
es ha
ve be
en ad
justed
to re
flect
the vo
lume c
onstr
aining
proc
ess.
XX
X
2035
BU
ILD
ALT
ERN
ATIV
E 1
I-205
MA
INLI
NE
AN
D R
AM
P C
ON
STR
AIN
ED V
OLU
MES
I-205
/ La
mm
ers
Roa
d In
terc
hang
e
Figu
re 5
AJu
ly 2
008
Gra
phic
s\Ju
ly 2
008\
WC
06-2
287_
5A
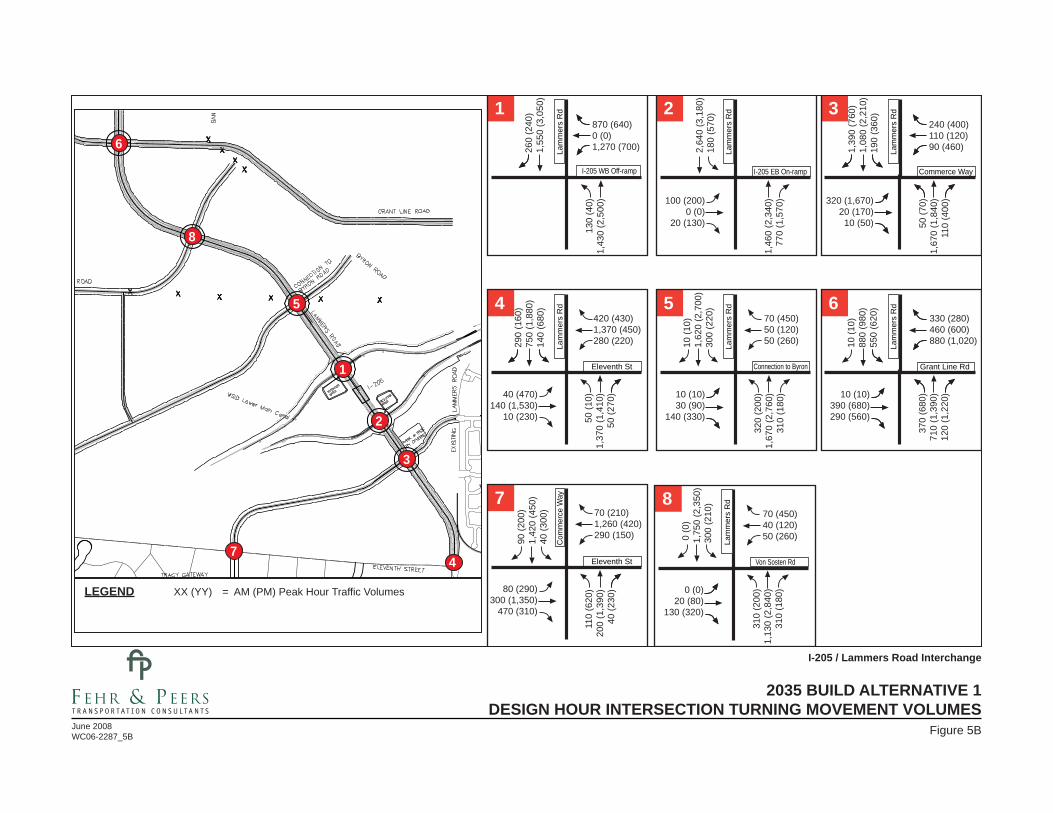
1
2
3
47
5
8
6
1
Lam
mer
s R
d
I-205 WB Off-ramp Commerce WayI-205 EB On-ramp
2
Lam
mer
s R
d 3
Lam
mer
s R
d
Eleventh St Grant Line RdConnection to Byron
4
Lam
mer
s R
d 5
Lam
mer
s R
d 6
Lam
mer
s R
d
Com
mer
ce W
ayEleventh St
7
130
(40)
1,43
0 (2
,500
)
260
(240
)1,
550
(3,0
50)
870 (640)0 (0)1,270 (700)
1,46
0 (2
,340
)77
0 (1
,570
)100 (200)0 (0)
20 (130)
2,64
0 (3
,180
)18
0 (5
70)
370
(680
)71
0 (1
,390
)12
0 (1
,220
)10 (10)390 (680)290 (560)
10 (1
0)88
0 (9
80)
550
(620
)
330 (280)460 (600)880 (1,020)
50 (1
0)1,
370
(1,4
10)
50 (2
70)
290
(160
)75
0 (1
,880
)14
0 (6
80)
420 (430)1,370 (450)280 (220)
40 (470)140 (1,530)
10 (230)
320
(200
)1,
670
(2,7
60)
310
(180
)10 (10)30 (90)
140 (330)
10 (1
0)1,
620
(2,7
00)
300
(220
)
70 (450)50 (120)50 (260)
110
(620
)20
0 (1
,390
)40
(230
)
90 (2
00)
1,42
0 (4
50)
40 (3
00) 70 (210)
1,260 (420)290 (150)
80 (290)300 (1,350)
470 (310)
50 (7
0)1,
670
(1,8
40)
110
(400
)320 (1,670)20 (170)
10 (50)
1,39
0 (7
60)
1,08
0 (2
,210
)19
0 (3
60)
240 (400)110 (120)90 (460)
Von Sosten Rd
8
Lam
mer
s R
d
310
(200
)1,
130
(2,8
40)
310
(180
)0 (0)20 (80)
130 (320)
0 (0
)1,
750
(2,3
50)
300
(210
)
70 (450)40 (120)50 (260)
LEGEND = AM (PM) Peak Hour Traffic VolumesXX (YY)
2035 BUILD ALTERNATIVE 1DESIGN HOUR INTERSECTION TURNING MOVEMENT VOLUMES
I-205 / Lammers Road Interchange
Figure 5BJune 2008WC06-2287_5B
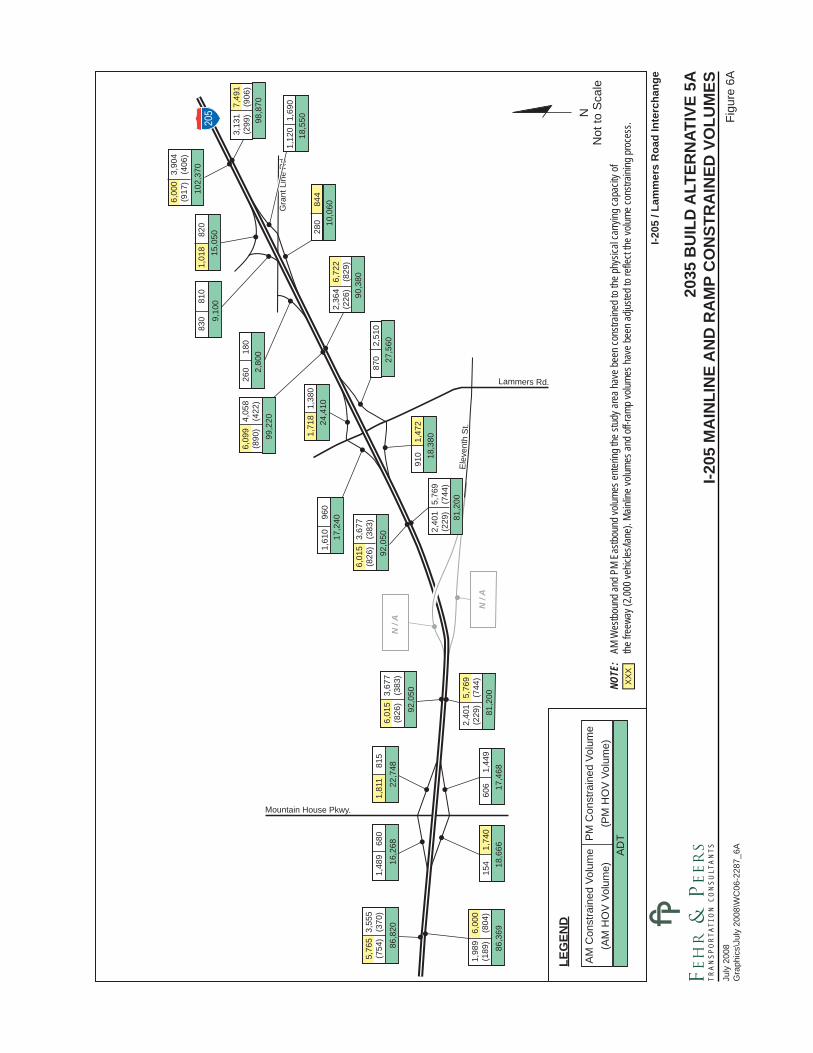
205
N /
A
N /
A
Gra
nt L
ine
Rd.
Lammers Rd.
Mountain House Pkwy.
Elev
enth
St.
92,0
50
81,2
00
92,0
50
81,2
00
9,10
015
,050
90,3
80
10,0
60
2,80
099
,220
17,2
40
18,3
80
24,4
10
27,5
60
102,
370
98,8
70
18,5
50
16,2
68
18,6
66
86,8
20
86,3
69
5,76
5(7
54)
3,55
5(3
70)
1,98
9(1
89)
6,00
0(8
04)
154
1,74
060
61,
449
1,48
968
01,
811
815
6,01
5(8
26)
3,67
7(3
83)
22,7
48
17,4
68
6,01
5(8
26)
3,67
7(3
83)
1,61
096
0
1,71
81,
380
6,09
9(8
90)
4,05
8(4
22)
260
180
830
810
1,01
882
0
6,00
0(9
17)
3,90
4(4
06)
2,40
1(2
29)
5,76
9(7
44)
2,40
1(2
29)
5,76
9(7
44)
910
1,47
2
870
2,51
0
2,36
4(2
26)
6,72
2(8
29)
280
844
3,13
1(2
99)
7,49
1(9
06)
1,12
01,
690
NN
ot to
Sca
le
LEG
END
AD
T
AM
Con
stra
ined
Vol
ume
(AM
HO
V V
olum
e)P
M C
onst
rain
ed V
olum
e(P
M H
OV
Vol
ume)
NOTE
: AM
Wes
tboun
d and
PM
Eastb
ound
volum
es en
tering
the s
tudy a
rea h
ave b
een c
onstr
ained
to th
e phy
sical
carry
ing ca
pacit
y of
the fr
eewa
y (2,0
00 ve
hicles
/lane
). Ma
inline
volum
es an
d off-
ramp
volum
es ha
ve be
en ad
justed
to re
flect
the vo
lume c
onstr
aining
proc
ess.
XX
X
2035
BU
ILD
ALT
ERN
ATIV
E 5A
I-205
MA
INLI
NE
AN
D R
AM
P C
ON
STR
AIN
ED V
OLU
MES
I-205
/ La
mm
ers
Roa
d In
terc
hang
e
Figu
re 6
AJu
ly 2
008
Gra
phic
s\Ju
ly 2
008\
WC
06-2
287_
6A

1
2
4
5
6
7
8
9
1
Ele
vent
h S
t
I-205 WB Off-ramp
830
(1,7
50)
1,43
0 (7
30)
140
(230
)1,
160
(2,2
80)
820 (630)0 (0)1,400 (750)
I-205 EB On-ramp
2
Ele
vent
h S
t
2,14
0 (2
,240
)70
0 (1
,650
)120 (240)0 (0)
790 (1,430)
170
(860
)2,
390
(2,1
70)
3
Eleventh St Von Sosten RdConnection to Byron
4
Lam
mer
s R
d
410
(80)
270
(470
)50
(320
)
220
(170
)11
0 (7
10)
30 (5
10)
220 (210)1,570 (760)320 (220)
5
Ele
vent
h S
t
880
(540
)51
0 (1
,340
)26
0 (5
00)50 (260)
90 (240)250 (970)
440
(100
)94
0 (7
20)
330
(580
) 6
Ele
vent
h S
t
10 (3
0)62
0 (2
,140
)20
(10)70 (230)
20 (50)20 (30)
220
(140
)1,
680
(1,3
40)
580
(710
)
260 (1,270)90 (40)10 (30)
70 (290)320 (1,440)
20 (340)
90 (580)80 (290)110 (820)
7
DoesNot
Exist
Trac
y G
atew
ay
Eleventh St
9
860
(1,2
30)
10 (5
90)
1,730 (940)470 (70)
400 (1,480)810 (1,190)
Ele
vent
h S
t
Commerce Way
8
370
(430
)2,
070
(1,4
10)
150
(330
)
1,89
0 (1
,130
)1,
050
(1,9
10)
240
(560
)
230 (570)80 (120)70 (320)
540 (1,910)20 (150)90 (440)
Ele
vent
h S
tGrant Line Rd
80 (5
90)
770
(2,2
30)
100
(820
)
10 (1
40)
1,47
0 (1
,420
)56
0 (8
10)
370 (320)50 (270)710 (470)
40 (80)190 (240)300 (300)
LEGEND = AM (PM) Peak Hour Traffic VolumesXX (YY)
2035 BUILD ALTERNATIVE 5ADESIGN HOUR INTERSECTION TURNING MOVEMENT VOLUMES
I-205 / Lammers Road Interchange
Figure 6BJune 2008WC06-2287_6B

205
N /
A
N /
A
Gra
nt L
ine
Rd.
Lammers Rd.
Mountain House Pkwy.
Elev
enth
St.
92,0
50
81,2
00
92,0
50
81,2
00
9,10
015
,050
90,3
80
10,0
60
2,80
099
,220
17,2
40
18,3
80
24,4
10
27,5
60
102,
370
98,8
70
18,5
50
16,2
68
18,6
66
86,8
20
86,3
69
5,76
5(7
54)
3,55
5(3
70)
1,98
9(1
89)
6,00
0(8
04)
154
1,74
060
61,
449
1,48
968
01,
811
815
6,01
5(8
26)
3,67
7(3
83)
22,7
48
17,4
68
6,01
5(8
26)
3,67
7(3
83)
1,57
096
01,
718
1,38
0
6,09
9(8
90)
4,05
8(4
22)
260
180
830
810
1,01
882
0
6,00
0(9
17)
3,90
4(4
06)
2,40
1(2
29)
5,76
9(7
44)
2,40
1(2
29)
5,76
9(7
44)
910
1,47
2
870
2,51
0
2,36
4(2
26)
6,72
2(8
29)
280
844
3,13
1(2
99)
7,49
1(9
06)
1,12
01,
690
NN
ot to
Sca
le
LEG
END
AD
T
AM
Con
stra
ined
Vol
ume
(AM
HO
V V
olum
e)P
M C
onst
rain
ed V
olum
e(P
M H
OV
Vol
ume)
NOTE
: AM
Wes
tboun
d and
PM
Eastb
ound
volum
es en
tering
the s
tudy a
rea h
ave b
een c
onstr
ained
to th
e phy
sical
carry
ing ca
pacit
y of
the fr
eewa
y (2,0
00 ve
hicles
/lane
). Ma
inline
volum
es an
d off-
ramp
volum
es ha
ve be
en ad
justed
to re
flect
the vo
lume c
onstr
aining
proc
ess.
XX
X
2035
BU
ILD
ALT
ERN
ATIV
E 5A
-VA
I-205
MA
INLI
NE
AN
D R
AM
P C
ON
STR
AIN
ED V
OLU
MES
I-205
/ La
mm
ers
Roa
d In
terc
hang
e
Figu
re 7
AJu
ly 2
008
Gra
phic
s\Ju
ly 2
008\
WC
06-2
287_
7A

1
2
4
5
6
7
89
1
Ele
vent
h S
t
I-205 WB Off-ramp
830
(1,7
50)
1,43
0 (7
30)
140
(230
)1,
160
(2,2
80)
820 (630)0 (0)1,400 (750)
I-205 EB On-ramp
2
Ele
vent
h S
t
2,14
0 (2
,240
)70
0 (1
,650
)120 (240)0 (0)
790 (1,430)
2,39
0 (2
,170
)17
0 (8
60) 3
Eleventh St Von Sosten RdConnection to Byron
4
Lam
mer
s R
d
410
(80)
270
(470
)50
(320
)
220
(170
)11
0 (7
10)
30 (5
10)
220 (210)1,570 (760)320 (220)
5
Ele
vent
h S
t
880
(540
)51
0 (1
,340
)26
0 (5
00)50 (260)
90 (240)250 (970)
440
(100
)94
0 (7
20)
330
(580
) 6
Ele
vent
h S
t
10 (3
0)62
0 (2
,140
)20
(10)70 (230)
20 (50)20 (30)
220
(140
)1,
680
(1,3
40)
580
(710
)
260 (1,270)90 (40)10 (30)
70 (290)320 (1,440)
20 (340)
90 (580)80 (290)110 (820)
7
DoesNot
Exist
Trac
y G
atew
ay
Eleventh St
9
860
(1,2
30)
10 (5
90)
1,730 (940)470 (70)
400 (1,480)810 (1,190)
Ele
vent
h S
t
Commerce Way
8
370
(430
)2,
070
(1,4
10)
150
(330
)
1,89
0 (1
,130
)1,
050
(1,9
10)
240
(560
)
230 (570)80 (120)70 (320)
540 (1,910)20 (150)90 (440)
Ele
vent
h S
tGrant Line Rd
80 (5
90)
770
(2,2
30)
100
(820
)
10 (1
40)
1,47
0 (1
,420
)56
0 (8
10)
370 (320)50 (270)710 (470)
40 (80)190 (240)300 (300)
LEGEND = AM (PM) Peak Hour Traffic VolumesXX (YY)
2035 BUILD ALTERNATIVE 5A-VADESIGN HOUR INTERSECTION TURNING MOVEMENT VOLUMES
I-205 / Lammers Road Interchange
Figure 7BJune 2008WC06-2287_7B

205
N /
A
Gra
nt L
ine
Rd.
Lammers Rd.
Mountain House Pkwy.
Elev
enth
St.
90,2
10
60,5
50
90,2
10
84,7
90
8,31
016
,100
87,1
50
10,3
30
2,10
098
,170
15,5
80
3,76
0
23,4
50
30,3
60
103,
860
95,1
10
18,2
90
16,2
68
18,6
66
84,6
45
89,9
39
5,54
6(7
37)
3,44
6(3
59)
2,07
2(1
96)
6,00
0(8
37)
154
1,68
060
61,
449
1,48
968
01,
781
815
5,78
4(8
09)
3,56
8(3
72)
22,7
48
17,4
68
5,78
4(8
09)
3,56
8(3
72)
1,42
082
01,
630
1,35
0
5,92
3(8
80)
4,04
8(4
22)
181
150
760
770
1,07
889
0
6,00
0(9
31)
4,02
1(4
19)
2,28
4(2
36)
5,82
9(7
77)
1,71
7(1
63)
4,16
1(5
54)
24,2
40
767
(73)
1,66
8(2
23)
120
291
1,01
02,
760
2,52
9(2
41)
6,38
6(7
98)
310
852
3,20
5(3
05)
7,12
2(8
70)
1,05
01,
660
NN
ot to
Sca
le
LEG
END
AD
T
AM
Con
stra
ined
Vol
ume
(AM
HO
V V
olum
e)P
M C
onst
rain
ed V
olum
e(P
M H
OV
Vol
ume)
NOTE
: AM
Wes
tboun
d and
PM
Eastb
ound
volum
es en
tering
the s
tudy a
rea h
ave b
een c
onstr
ained
to th
e phy
sical
carry
ing ca
pacit
y of
the fr
eewa
y (2,0
00 ve
hicles
/lane
). Ma
inline
volum
es an
d off-
ramp
volum
es ha
ve be
en ad
justed
to re
flect
the vo
lume c
onstr
aining
proc
ess.
XX
X
2035
BU
ILD
ALT
ERN
ATIV
E 6
I-205
MA
INLI
NE
AN
D R
AM
P C
ON
STR
AIN
ED V
OLU
MES
I-205
/ La
mm
ers
Roa
d In
terc
hang
e
Figu
re 8
AJu
ly 2
008
Gra
phic
s\Ju
ly 2
008\
WC
06-2
287_
8A

1
2
3
47
5
8
6
1
Lam
mer
s R
d
I-205 WB Off-ramp Commerce Way
1,37
0 (2
,390
)1,
210
(530
)
210
(290
)1,
610
(3,1
60)
860 (640)0 (0)1,280 (710)
I-205 EB On-ramp
2
Lam
mer
s R
d
2,48
0 (2
,720
)77
0 (1
,840
)100 (200)0 (0)
20 (140)
240
(920
)2,
650
(2,9
50)
3
Lam
mer
s R
d
30 (5
0)2,
550
(2,2
20)
110
(360
)430 (1,940)20 (160)
10 (50)
1,38
0 (7
30)
1,09
0 (1
,990
)20
0 (3
70)
270 (400)110 (150)90 (550)
Eleventh St Grant Line RdConnection to Byron
4
Lam
mer
s R
d
20 (1
0)1,
740
(1,5
00)
50 (2
40)
200
(160
)81
0 (1
,760
)18
0 (6
70)
890 (510)640 (340)410 (220)
5
Lam
mer
s R
d
310
(20)
1,63
0 (2
,620
)29
0 (3
90)10 (10)
30 (110)120 (340)
10 (1
0)1,
640
(2,5
50)
290
(380
) 6
Lam
mer
s R
d
410
(780
)68
0 (1
,370
)11
0 (9
40)10 (10)
410 (730)320 (560)
10 (1
0)90
0 (8
70)
470
(700
)
330 (280)460 (560)840 (980)
60 (620)130 (1,590)
10 (190)
70 (440)60 (120)60 (560)
Com
mer
ce W
ayEleventh St
7
270
(1,6
40)
40 (3
10)
1,48
0 (5
60)
40 (3
70)
130 (230)
270 (190)
60 (280)300 (1,410)
470 (310)LEGEND = AM (PM) Peak Hour Traffic VolumesXX (YY)
2035 BUILD ALTERNATIVE 6DESIGN HOUR INTERSECTION TURNING MOVEMENT VOLUMES
I-205 / Lammers Road Interchange
Figure 8BJune 2008WC06-2287_8B
Von Sosten Rd
8
Lam
mer
s R
d
300
(20)
1,13
0 (2
,660
)28
0 (3
90)0 (0)
20 (110)120 (340)
0 (0
)1,
770
(2,0
40)
290
(370
)
70 (430)50 (110)50 (560)

Gra
nt L
ine
Rd.
Lammers Rd.
Mountain House Pkwy.
Elev
enth
St.
205
5,27
3 2
,420
N /
A
59,5
80
1,41
0 4
,004
47,9
50
7,23
3 3
,390
1,96
0
970
81,1
1021
,530
1,85
0 5
,598
440
1,
594
67,1
10
8,41
5
10,2
51
670
2
7097
8
144
79
64
649
1,04
8
82,0
35
71,7
49
7,54
1 3
,264
1,82
0 6
,000
7,15
5
6,16
319
,160
430
3
60
900
4,73
015
,230
1,41
0 4
,004
210
6
32
47,9
50
7,53
0
5,27
3 2
,420
190
1
102,
100
59,5
80
6,00
0 2
,850
67,9
80
2,18
0 5
,072
59,1
50
980
1,
700
18,7
30
N /
A
N /
A
N /
A
1,34
7
NN
ot to
Sca
le
LEG
END
AM
Pea
k H
our
PM
Pea
k H
our
AD
TNO
TE:
AM W
estbo
und a
nd P
M Ea
stbou
nd vo
lumes
enter
ing th
e stud
y are
a hav
e bee
n con
strain
ed to
the p
hysic
al ca
rrying
capa
city o
fthe
free
way (
2,000
vehic
les/la
ne).
Mainl
ine vo
lumes
and o
ff-ra
mp vo
lumes
have
been
adjus
ted to
refle
ct the
volum
e con
strain
ing pr
oces
s.X
XX
2015
NO
BU
ILD
ALT
ERN
ATIV
EI-2
05 M
AIN
LIN
E A
ND
RA
MP
CO
NST
RA
INED
VO
LUM
ES
I-205
/ La
mm
ers
Roa
d In
terc
hang
e
Figu
re 9
AJu
ly 2
008
Gra
phic
s\Ju
ly 2
008\
WC
06-2
287_
9A

1 2 3
Eleventh St Grant Line RdConnection to Byron
4
Lam
mer
s R
d
10 (1
0)17
0 (3
00)
20 (1
90)
90 (2
0)19
0 (3
70)
30 (8
0) 40 (80)870 (370)180 (110)
5
Lam
mer
s R
d
10 (10)60 (200)
10 (1
0)
540
(70)
6
Lam
mer
s R
d
70 (1
80)
10 (9
0)19
0 (8
70)10 (10)
250 (400)80 (150)
10 (1
0)40
(70)
230
(380
)
230 (340)230 (270)420 (520)
20 (150)150 (890)
10 (60)
260 (1,130)160 (160)
Com
mer
ce W
ayEleventh St
7
40 (2
70)
60 (3
60)
20 (1
90)
30 (1
70)
270
(140
)40
(290
)
130 (210)1,420 (530)180 (70)
40 (140)230 (1,510)
170 (100)
DoesNot
Exist
DoesNot
Exist
DoesNot
Exist
LEGEND = AM (PM) Peak Hour Traffic VolumesXX (YY)
2015 NO BUILD ALTERNATIVEPEAK HOUR INTERSECTION TURNING MOVEMENT VOLUMES
I-205 / Lammers Road Interchange
Figure 9BJune 2008WC06-2287_9B

205
Gra
nt L
ine
Rd.
Lammers Rd.
Mountain House Pkwy.
Elev
enth
St.
5,19
7 2
,550
59,1
50
1,47
0 4
,125
49,0
80
6,93
7 3
,360
1,74
0
810
78,3
1019
,160
1,87
0 5
,586
400
1,
461
66,4
10
8,41
5
10,2
51
665
2
7097
8
144
79
64
649
1,06
0
79,9
35
71,3
24
7,25
0 3
,234
1,84
0 6
,000
7,15
5
6,16
317
,330
710
6
90
420
7,79
06,
480
1,80
0 5
,058
280
8
18
59,2
30
9,54
0
6,33
5 3
,400
190
1
602,
100
72,2
70
200
1
102,
190
50
15
71,
8401,
338
96
015
,310
380
1,
090
11,9
90
6,00
0 2
,970
68,8
60
2,17
0 5
,340
61,7
70
650
1,
100
12,0
80
565
NN
ot to
Sca
le
LEG
END
AM
Pea
k H
our
PM
Pea
k H
our
AD
TNO
TE:
AM W
estbo
und a
nd P
M Ea
stbou
nd vo
lumes
enter
ing th
e stud
y are
a hav
e bee
n con
strain
ed to
the p
hysic
al ca
rrying
capa
city o
fthe
free
way (
2,000
vehic
les/la
ne).
Mainl
ine vo
lumes
and o
ff-ra
mp vo
lumes
have
been
adjus
ted to
refle
ct the
volum
e con
strain
ing pr
oces
s.X
XX
2015
BU
ILD
ALT
ERN
ATIV
E 1
I-205
MA
INLI
NE
AN
D R
AM
P C
ON
STR
AIN
ED V
OLU
MES
I-205
/ La
mm
ers
Roa
d In
terc
hang
e
Figu
re 1
0AJu
ly 2
008
Gra
phic
s\Ju
ly 2
008\
WC
06-2
287_
10A

1
2
3
47
5
8
6
1
Lam
mer
s R
d
I-205 WB Off-ramp Commerce WayI-205 EB On-ramp
2
Lam
mer
s R
d 3
Lam
mer
s R
d
Eleventh St Grant Line RdConnection to Byron
4
Lam
mer
s R
d 5
Lam
mer
s R
d 6
Lam
mer
s R
d
Com
mer
ce W
ayEleventh St
7
100
(20)
560
(1,0
10)
100
(90)
490
(1,2
80)
650 (450)0 (0)740 (510)
650
(930
)31
0 (8
40)40 (100)
0 (0)10 (70)
1,16
0 (1
,540
)70
(250
)
140
(230
)45
0 (7
70)
50 (3
90)10 (10)
190 (380)100 (230)
10 (1
0)33
0 (4
30)
230
(390
)
70 (110)130 (200)180 (220)
10 (1
0)56
0 (7
10)
20 (1
20)
60 (6
0)44
0 (8
90)
90 (2
60) 160 (200)
780 (270)130 (70)
10 (100) 120 (650)
10 (10)
150
(90)
910
(1,2
60)
150
(110
)10 (10)10 (20)
60 (140)
10 (1
0)52
0 (1
,010
)70
(110
) 10 (160)10 (20)10 (220)
40 (2
70)
70 (6
00)
10 (1
00)
30 (6
0)55
0 (1
80)
10 (7
0)
30 (60)1,320 (470)110 (50)
20 (70)220 (1,420)
160 (100)
20 (2
0)67
0 (9
10)
40 (8
0)100 (640)10 (60)10 (30)
520
(260
)55
0 (1
,090
)10
0 (2
60)
160 (220)50 (30)30 (90)
Von Sosten Rd
8
Lam
mer
s R
d
160
(90)
620
(1,2
30)
150
(110
)0 (0)10 (20)
50 (130)
0 (0
)53
0 (7
80)
80 (1
00) 20 (160)
10 (20)20 (220)
LEGEND = AM (PM) Peak Hour Traffic VolumesXX (YY)
2015 BUILD ALTERNATIVE 1DESIGN HOUR INTERSECTION TURNING MOVEMENT VOLUMES
I-205 / Lammers Road Interchange
Figure 10BJune 2008WC06-2287_10B

205
N /
A
N /
A
Gra
nt L
ine
Rd.
Lammers Rd.
Mountain House Pkwy.
Elev
enth
St.
5,93
1 2
,990
68,5
10
1,90
0 5
,546
63,7
00
5,93
1 2
,990
68,5
10
1,90
0 5
,546
63,7
00
8,41
5
10,2
51
651
2
7097
8
144
79
64
649
1,10
0
70,4
10
69,5
39
6,25
8 2
,864
1,87
0 6
,000
7,15
5
6,16
3
920
8
60
470
10,0
607,
180
1,83
0 5
,769
310
9
37
65,5
40
10,6
80
6,59
3 3
,670
280
2
103,
060
76,8
20
830
3
509,
100
490
1,
167
13,3
901,49
2 1
,030
17,4
10
420
1,
390
15,2
30
6,00
0 3
,070
70,8
80
2,06
0 5
,722
64,6
60
540
8
909,
800
607
NN
ot to
Sca
le
LEG
END
AM
Pea
k H
our
PM
Pea
k H
our
AD
TNO
TE:
AM W
estbo
und a
nd P
M Ea
stbou
nd vo
lumes
enter
ing th
e stud
y are
a hav
e bee
n con
strain
ed to
the p
hysic
al ca
rrying
capa
city o
fthe
free
way (
2,000
vehic
les/la
ne).
Mainl
ine vo
lumes
and o
ff-ra
mp vo
lumes
have
been
adjus
ted to
refle
ct the
volum
e con
strain
ing pr
oces
s.X
XX
2015
BU
ILD
ALT
ERN
ATIV
E 5A
I-205
MA
INLI
NE
AN
D R
AM
P C
ON
STR
AIN
ED V
OLU
MES
I-205
/ La
mm
ers
Roa
d In
terc
hang
e
Figu
re 1
1AJu
ly 2
008
Gra
phic
s\Ju
ly 2
008\
WC
06-2
287_
11A

1
2
4
5
6
7
8
9
1
Ele
vent
h S
t
I-205 WB Off-ramp
280
(680
)81
0 (2
80)
20 (7
0)36
0 (8
20)
580 (460)0 (0)1,000 (570)
I-205 EB On-ramp
2
Ele
vent
h S
t
1,05
0 (8
70)
330
(1,0
30)40 (90)
0 (0)450 (1,130)
90 (3
60)
1,27
0 (1
,030
)
3
Eleventh St Von Sosten RdConnection to Byron
4
Lam
mer
s R
d
10 (1
0)80
(140
)20
(110
)
100
(140
)50
(180
)20
(60) 20 (60)
890 (340)120 (60)
5
Ele
vent
h S
t
210
(110
)58
0 (8
90)
70 (1
40)10 (40)
20 (40)60 (180)
60 (2
0)30
0 (5
50)
50 (8
0)
6
Ele
vent
h S
t
200
(100
)34
0 (8
30)
70 (1
30)0 (40)
10 (30)50 (180)
50 (1
0)34
0 (3
20)
40 (7
0) 10 (120)10 (40)20 (150)
50 (200)220 (770)
10 (20)
20 (130)20 (50)20 (160)
7
DoesNot
Exist
Trac
y G
atew
ay
Eleventh St
9
380
(410
)
10 (3
0)
960 (480)40 (10)
270 (960)390 (930)
Ele
vent
h S
t
Commerce Way
8
180
(140
)1,
120
(660
)40
(90)
1,02
0 (4
30)
610
(1,5
40)
90 (1
90)
70 (210)30 (30)20 (120)
190 (1,030)10 (40)
30 (230)
Ele
vent
h S
tGrant Line Rd
10 (1
0)32
0 (9
70)
20 (1
0)
70 (6
0)41
0 (3
80)
180
(350
)
150 (400)30 (10)10 (10)
20 (110)10 (20)10 (10)
LEGEND = AM (PM) Peak Hour Traffic VolumesXX (YY)
2015 BUILD ALTERNATIVE 5ADESIGN HOUR INTERSECTION TURNING MOVEMENT VOLUMES
I-205 / Lammers Road Interchange
Figure 11BJune 2008WC06-2287_11B

205
N /
A
N /
A
Gra
nt L
ine
Rd.
Lammers Rd.
Mountain House Pkwy.
Elev
enth
St.
5,93
1 2
,990
68,5
10
1,90
0 5
,546
63,7
00
5,93
1 2
,990
68,5
10
1,90
0 5
,546
63,7
00
8,41
5
10,2
51
651
2
7097
8
144
79
64
649
1,10
0
70,4
10
69,5
39
6,25
8 2
,864
1,87
0 6
,000
7,15
5
6,16
3
920
8
60
470
10,0
607,
180
1,83
0 5
,769
310
9
37
65,5
40
10,6
80
6,59
3 3
,670
280
2
103,
060
76,8
20
830
3
509,
100
490
1,
167
13,3
901,49
2 1
,030
17,4
10
420
1,
390
15,2
30
6,00
0 3
,070
70,8
80
2,06
0 5
,722
64,6
60
540
8
909,
800
607
NN
ot to
Sca
le
LEG
END
AM
Pea
k H
our
PM
Pea
k H
our
AD
TNO
TE:
AM W
estbo
und a
nd P
M Ea
stbou
nd vo
lumes
enter
ing th
e stud
y are
a hav
e bee
n con
strain
ed to
the p
hysic
al ca
rrying
capa
city o
fthe
free
way (
2,000
vehic
les/la
ne).
Mainl
ine vo
lumes
and o
ff-ra
mp vo
lumes
have
been
adjus
ted to
refle
ct the
volum
e con
strain
ing pr
oces
s.X
XX
2015
BU
ILD
ALT
ERN
ATIV
E 5A
-VA
I-205
MA
INLI
NE
AN
D R
AM
P C
ON
STR
AIN
ED V
OLU
MES
I-205
/ La
mm
ers
Roa
d In
terc
hang
e
Figu
re 1
2AJu
ly 2
008
Gra
phic
s\Ju
ly 2
008\
WC
06-2
287_
12A

1
2
4
5
6
7
89
1
Ele
vent
h S
t
I-205 WB Off-ramp
280
(680
)81
0 (2
80)
20 (7
0)36
0 (8
20)
580 (460)0 (0)1,000 (570)
I-205 EB On-ramp
2
Ele
vent
h S
t
1,05
0 (8
70)
330
(1,0
30)40 (90)
0 (0)450 (1,130)
1,27
0 (1
,030
)90
(360
)
3
Eleventh St Von Sosten RdConnection to Byron
4
Lam
mer
s R
d
10 (1
0)80
(140
)20
(110
)
100
(140
)50
(180
)20
(60) 20 (60)
890 (340)120 (60)
5
Ele
vent
h S
t
210
(110
)58
0 (8
90)
70 (1
40)10 (40)
20 (40)60 (180)
60 (2
0)30
0 (5
50)
50 (8
0)
6
Ele
vent
h S
t
200
(100
)34
0 (8
30)
70 (1
30)0 (40)
10 (30)50 (180)
50 (1
0)34
0 (3
20)
40 (7
0) 10 (120)10 (40)20 (150)
50 (200)220 (770)
10 (20)
20 (130)20 (50)20 (160)
7
DoesNot
Exist
Trac
y G
atew
ay
Eleventh St
9
380
(410
)
10 (3
0)
960 (480)40 (10)
270 (960)390 (930)
Ele
vent
h S
t
Commerce Way
8
180
(140
)1,
120
(660
)40
(90)
1,02
0 (4
30)
610
(1,5
40)
90 (1
90)
70 (210)30 (30)20 (120)
190 (1,030)10 (40)
30 (230)
Ele
vent
h S
tGrant Line Rd
10 (1
0)32
0 (9
70)
20 (1
0)
70 (6
0)41
0 (3
80)
180
(350
)
150 (400)30 (10)10 (10)
20 (110)10 (20)10 (10)
LEGEND = AM (PM) Peak Hour Traffic VolumesXX (YY)
2015 BUILD ALTERNATIVE 5A-VADESIGN HOUR INTERSECTION TURNING MOVEMENT VOLUMES
I-205 / Lammers Road Interchange
Figure 12BJune 2008WC06-2287_12B

205
N /
A
Gra
nt L
ine
Rd.
Lammers Rd.
Mountain House Pkwy.
Elev
enth
St.
6,16
3 3
,030
71,8
40
1,48
0 4
,133
49,2
60
400
1,
457
17,3
30
6,16
3 3
,030
71,8
40
1,88
0 5
,590
66,5
90
8,41
5
10,2
51
645
2
7097
8
144
79
64
649
1
,056
73,0
35
71,5
79
6,49
6 2
,904
1,85
0 6
,000
7,15
5
6,16
3
750
7
00
8,23
06,
480
1,77
0 5
,036
280
8
25
59,0
60
9,63
0
6,39
7 3
,600
190
1
602,
100
75,5
10
1,06
0
390
11,6
40
50
1
571,
8401,
294
96
015
,310
340
1,
060
11,6
40
6,00
0 3
,160
71,6
60
2,17
0 5
,341
61,8
60
680
1,
130
12,4
30
543
4
20
NN
ot to
Sca
le
LEG
END
AM
Pea
k H
our
PM
Pea
k H
our
AD
TNO
TE:
AM W
estbo
und a
nd P
M Ea
stbou
nd vo
lumes
enter
ing th
e stud
y are
a hav
e bee
n con
strain
ed to
the p
hysic
al ca
rrying
capa
city o
fthe
free
way (
2,000
vehic
les/la
ne).
Mainl
ine vo
lumes
and o
ff-ra
mp vo
lumes
have
been
adjus
ted to
refle
ct the
volum
e con
strain
ing pr
oces
s.X
XX
2015
BU
ILD
ALT
ERN
ATIV
E 6
I-205
MA
INLI
NE
AN
D R
AM
P C
ON
STR
AIN
ED V
OLU
MES
I-205
/ La
mm
ers
Roa
d In
terc
hang
e
Figu
re 1
3AJu
ly 2
008
Gra
phic
s\Ju
ly 2
008\
WC
06-2
287_
13A
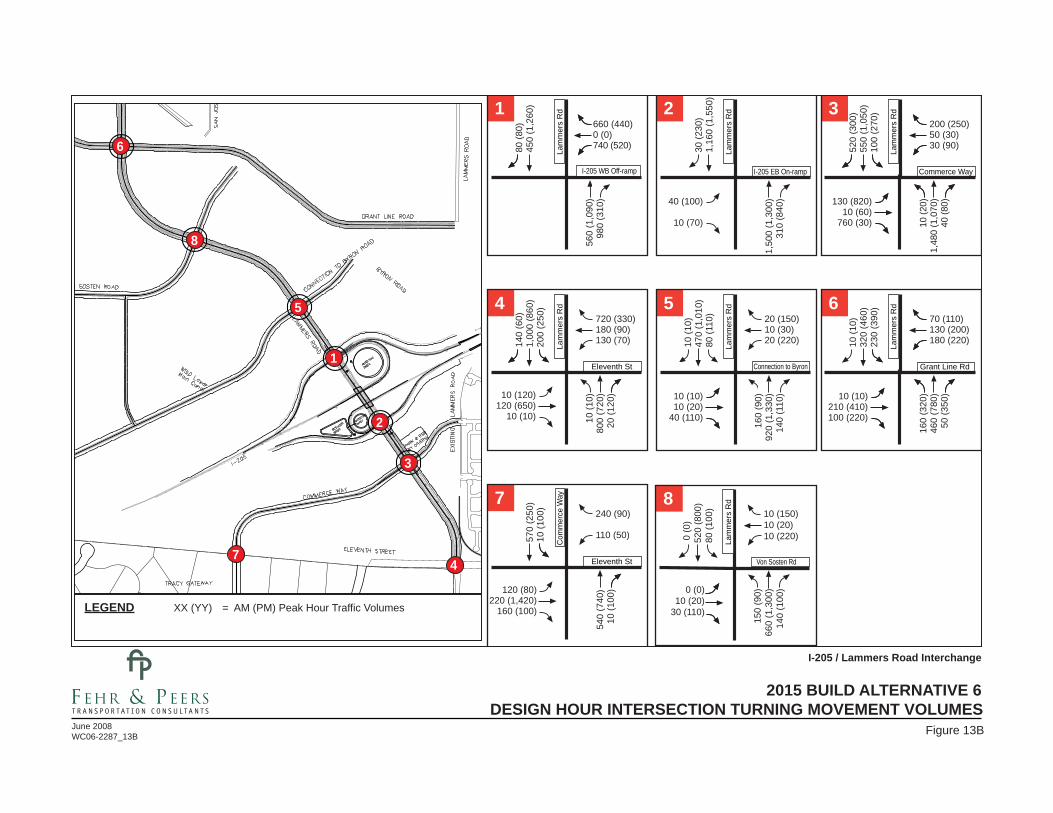
1
2
3
47
5
8
6
1
Lam
mer
s R
d
I-205 WB Off-ramp Commerce Way
560
(1,0
90)
980
(310
)
80 (8
0)45
0 (1
,260
)
660 (440)0 (0)740 (520)
I-205 EB On-ramp
2
Lam
mer
s R
d
1,50
0 (1
,300
)31
0 (8
40)40 (100)
10 (70)
30 (2
30)
1,16
0 (1
,550
)
3
Lam
mer
s R
d
10 (2
0)1,
480
(1,0
70)
40 (8
0)130 (820)10 (60)
760 (30)
520
(300
)55
0 (1
,050
)10
0 (2
70)
200 (250)50 (30)30 (90)
Eleventh St Grant Line RdConnection to Byron
4
Lam
mer
s R
d
10 (1
0)80
0 (7
20)
20 (1
20)
140
(60)
1,00
0 (8
60)
200
(250
)
720 (330)180 (90)130 (70)
5
Lam
mer
s R
d
160
(90)
920
(1,3
30)
140
(110
)10 (10)10 (20)
40 (110)
10 (1
0)47
0 (1
,010
)80
(110
)
6
Lam
mer
s R
d
160
(320
)46
0 (7
80)
50 (3
50)10 (10)
210 (410)100 (220)
10 (1
0)32
0 (4
60)
230
(390
)
70 (110)130 (200)180 (220)
10 (120) 120 (650)
10 (10)
20 (150)10 (30)20 (220)
Com
mer
ce W
ay Von Sosten Rd
8
Lam
mer
s R
d
150
(90)
660
(1,3
00)
140
(100
)0 (0)10 (20)
30 (110)
0 (0
)52
0 (8
00)
80 (1
00) 10 (150)
10 (20)10 (220)
Eleventh St
7
540
(740
)10
(100
)
570
(250
)10
(100
)
240 (90)
110 (50)
120 (80)220 (1,420)
160 (100)LEGEND = AM (PM) Peak Hour Traffic VolumesXX (YY)
2015 BUILD ALTERNATIVE 6DESIGN HOUR INTERSECTION TURNING MOVEMENT VOLUMES
I-205 / Lammers Road Interchange
Figure 13BJune 2008WC06-2287_13B

54
Final Traffic Operations Report I-205/Lammers Road Interchange Project May 2009
5. YEAR 2035 REGIONAL TRAFFIC OPERATIONS
The regional impacts of the Project Alternatives were evaluated by examining the PM peak hour traffic volumes on project area roadways. In addition, regional measures of effectiveness (MOEs) such as vehicle miles of travel (VMT) and vehicle hours of delay (VHD) were also determined. PM peak hour MOEs were chosen for reporting purposes because traffic levels are higher during the afternoon peak period than during the morning peak period.
PROJECT AREA ROADWAY VOLUMES AND LOS
Figure 14 shows the Year 2035 PM peak hour traffic volumes on local streets in the study area. From a regional perspective, Build Alternatives 5A and 5A-VA are identical. Both Alternatives provide the same access to I-205 and local street connections. The improved access to I-205 under each of the Build alternatives would increase demand on the I-205 mainline but substantially reduce demand on key local roadways in the project area including Grant Line Road, Eleventh Street, and Corral Hollow Road.
Under the Build Alternatives, traffic volumes on Grant Line Road are expected to decrease between 16% and 27% east of the I-205/Grant Line Road interchange and between 28% and 48% west of the interchange. On Eleventh Street, PM peak hour volumes are expected to drop between 10% and 18%, while volumes on Corral Hollow Road are expected to drop between 24% and 31% depending on the Alternative. The shifts in traffic due to the Lammers Road Interchange Project is not expected to adversely affect LOS on the local streets. On the contrary, the reduction in traffic on some key arterials results in improved LOS at various locations:
• Eleventh Street east of Lammers Road (eastbound) – from LOS E to LOS D
• Grant Line Road west of I-205/Grant Line Road interchange – from LOS D to LOS C
• Corral Hollow Road south of Grant Line Road – from LOS D to LOS C
REGIONAL MEASURES OF EFFECTIVENESS
Regional measures of effectiveness were calculated to determine the impacts under the Build Alternatives. Table 10 summarizes the area-wide vehicle miles of travel, vehicle hours of travel, vehicle hours of delay, and average travel speed. A brief description of the MOEs follows:
• Vehicle Miles of Travel (VMT) – measure of the total miles traveled by all vehicles in the study area during the analysis period
• Vehicle Hours of Travel (VHT) – measure of the total hours traveled by all vehicles
• Vehicle Hours of Delay (VHD) – the amount of total delay incurred by all vehicles as a result of congestion
• Average Travel Speed – the average speed (mph) experienced by all vehicles in the study area during the analysis period. This measure is calculated by dividing VMT by VHT.

Byr
on R
d
11
th S
t
MacArthur Dr
Pavilion
Pkwy
TRACY
Lammers Rd
Gra
nt
Lin
e R
d
Tracy Blvd
Naglee Rd
Corral Hollow Rd
Gra
nt
Lin
e R
d
205
J4J4
2,44
0 / D
1,76
0 / C
1,27
0 / C
1,71
0 / C
1,11
0 / C
810
/ C81
0 / C
800
/ C
1,51
0 / C
1,26
0 / C
1,10
0 / C
1,16
0 / C
1,42
0 / C
1,27
0 / C
1,29
0 / C
1,26
0 / C
1,85
0 / C
1,74
0 / C
1,68
0 / C
1,73
0 / C
700
/ C67
0 / C
660
/ C67
0 / C
840
/ C80
0 / C
780
/ C79
0 / C
1,34
0 / C
1,29
0 / C
1,45
0 / C
1,32
0 / C
2,36
0 / D
1,88
0 / C
2,10
0 / D
1,88
0 / C
2,53
0 / D
1,85
0 / C
1,92
0 / C
1,74
0 / C
660
/ C69
0 / C
720
/ D71
0 / D
1,47
0 / C
1,04
0 / C
1,08
0 / C
1,02
0 / C
2,61
0 / E
2,31
0 / D
2,15
0 / D
2,35
0 / D
1,07
0 / C
1,31
0 / C
1,18
0 / C
1,24
0 / C
1,99
0 / C
2,21
0 / C
1,85
0 / C
2,19
0 / C
1,48
0 / C
1,26
0 / C
1,28
0 / C
1,27
0 / C
1,96
0 / C
1,97
0 / C
1,96
0 / C
1,98
0 / C
830
/ D83
0 / D
750
/ D82
0 / D
570
/ C51
0 / C
500
/ C51
0 / C
740
/ C65
0 / C
530
/ C57
0 / C
1,37
0 / C
1,34
0 / C
1,35
0 / C
1,36
0 / C
960
/ C1,
070
/ C1,
020
/ C1,
070
/ C
950
/ C81
0 / C
770
/ C80
0 / C
2,58
0 / D
2,36
0 / D
1,97
0 / C
2,21
0 / D
N
No
t to
Sca
le
LEGEN
D
No
Bu
ild
/ LO
SA
lt. 1
/ LO
SA
lts.
5A
& 5
A-V
A /
LOS
Alt
. 6 /
LOS
NOTE
:LO
S C
= C
or b
ette
r
AR
EA P
M P
EAK
HO
UR
VO
LUM
ES A
ND
LO
S
I-205
/ La
mm
ers
Roa
d In
terc
hang
e
Figu
re 1
4Ju
ly 2
008
WC
06-2
287_
14
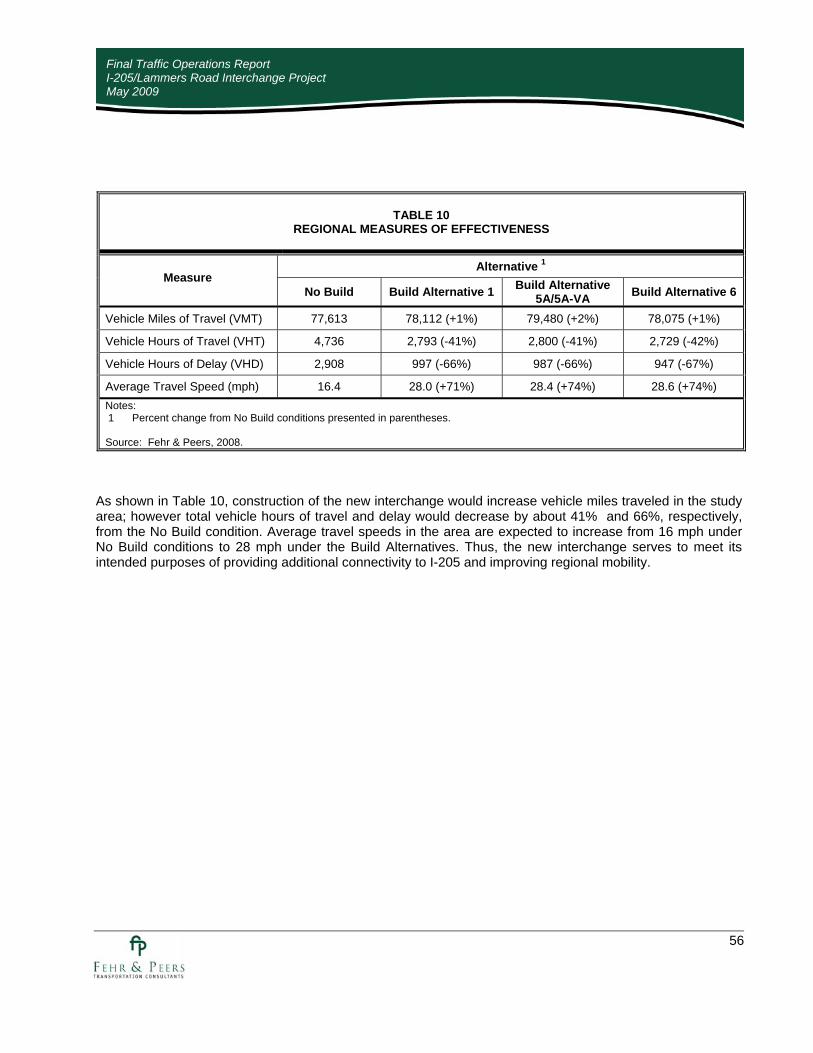
56
Final Traffic Operations Report I-205/Lammers Road Interchange Project May 2009
TABLE 10
REGIONAL MEASURES OF EFFECTIVENESS
Alternative 1
Measure No Build Build Alternative 1 Build Alternative
5A/5A-VA Build Alternative 6
Vehicle Miles of Travel (VMT) 77,613 78,112 (+1%) 79,480 (+2%) 78,075 (+1%)
Vehicle Hours of Travel (VHT) 4,736 2,793 (-41%) 2,800 (-41%) 2,729 (-42%)
Vehicle Hours of Delay (VHD) 2,908 997 (-66%) 987 (-66%) 947 (-67%)
Average Travel Speed (mph) 16.4 28.0 (+71%) 28.4 (+74%) 28.6 (+74%) Notes: 1 Percent change from No Build conditions presented in parentheses. Source: Fehr & Peers, 2008.
As shown in Table 10, construction of the new interchange would increase vehicle miles traveled in the study area; however total vehicle hours of travel and delay would decrease by about 41% and 66%, respectively, from the No Build condition. Average travel speeds in the area are expected to increase from 16 mph under No Build conditions to 28 mph under the Build Alternatives. Thus, the new interchange serves to meet its intended purposes of providing additional connectivity to I-205 and improving regional mobility.

57
Final Traffic Operations Report I-205/Lammers Road Interchange Project May 2009
6. OPENING YEAR (2015) TRAFFIC OPERATIONS
This chapter presents the results of the traffic operations analysis for opening year (2015). The operations analysis focuses on intersection, mainline, and ramp operations.
PEAK HOUR TRAFFIC VOLUMES AND LANE CONFIGURATIONS
The intersection peak hour traffic volumes presented in Chapter 4 (Figures 9 through 13) were used to reflect opening year (2015) peak hour demand. Figures 15 through 19 present the 2015 intersection traffic control and lane configurations under the No Build alternative and each Build alternative.
The lane configurations at the local intersections assumed the maximum practical widths given the estimated demand. Traffic forecasts developed for this study (see Chapter 4) are highly conservative estimates to ensure that the interchange design would serve traffic demand at acceptable levels of service for a twenty-year life. At this time, there are no specific development plans for the local area; therefore key assumptions about the local street connections and intersection geometries will not be finalized until traffic studies for specific area development projects are conducted. For this study, assumptions regarding local intersection geometries were made to provide a basis to compare interchange configuration alternatives, with the understanding that the local street design will be established during future studies including individual development project reviews when land uses are specified and local traffic access would be determined.
INTERSECTION OPERATIONS
Table 11 presents the overall LOS and delay for the study intersections under the various alternatives. Delay and LOS by approach is presented in Appendix F. Both the Synchro and Fehr & Peers analysis worksheets are presented in Appendix F. Note that the delay and LOS from Synchro were not used. The Synchro worksheets are provided for informational purposes to present key inputs in the modeling including lanes, volumes, and timings. The results presented in Table 11 are from the Fehr & Peers SimTraffic analysis worksheets, which are the average of 10 SimTraffic model runs.
Under the No Build alternative, two of the study intersections are anticipated to operate at unacceptable levels of service (LOS E or worse) during the PM peak hour. All of the study intersections operate at an acceptable level of service (LOS D or better) under each of the Build Alternatives. Alternative 5A provides the lowest overall system-wide vehicle delay during the peak hours.
Tables 12 through 16 provide 95th percentile queue estimates for the study intersections under No Build and each of the Build alternatives.
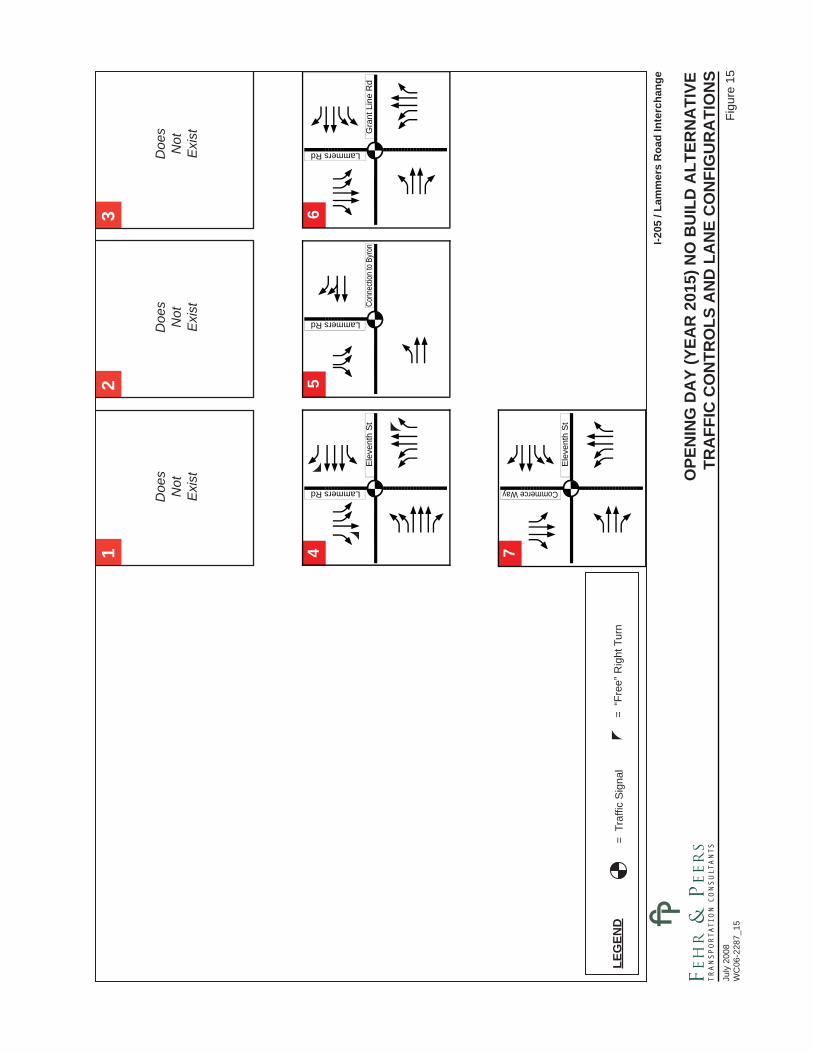
Gra
nt L
ine
Rd
TRU
E
6
addgLammers Rd
addg
g
qqeet
qqee
t
TRU
E
TRU
E
addg
qqee
t
7
Commerce WayTR
UE
qqeet
addg
Ele
vent
h S
t
Ele
vent
h S
tTR
UE
TRU
E
adddgg
qqee
t
Lammers Rd
4
qeee t
a dgg
TRU
E
ddg
TRU
E
5
Lammers Rd
agg
ert
Conn
ectio
n to
Byr
on
3
Doe
sN
otE
xist
2
Doe
sN
otE
xist
1
Doe
sN
otE
xist
LEG
END
= T
raffi
c S
igna
l=
“Fre
e” R
ight
Tur
n
O
PEN
ING
DA
Y (Y
EAR
201
5) N
O B
UIL
D A
LTER
NA
TIVE
TRA
FFIC
CO
NTR
OLS
AN
D L
AN
E C
ON
FIG
UR
ATI
ON
S
I-205
/ La
mm
ers
Roa
d In
terc
hang
e
F
igur
e 15
July
200
8W
C06
-228
7_15

1
2
3
47
5
8
6
qeee
et
TRU
ETR
UE
Lammers Rd
sddd
g
qqrt
8
asg
Von
Sos
ten
Rd
qqee
ett
a dddgLammers Rd
6 sddg
ggTR
UE
qqqeet
TRU
EG
rant
Lin
e R
oad
Lammers Rd
Com
mer
ce W
ayTR
UE
3
sggg
aa dd
dgg
qqqet
qeee
et
TRU
E
TRU
E
adddgg
qqee
et
4
Lammers Rd
TRU
E
qqeee t
sddg
ggE
leve
nth
St
Lammers Rd
TRU
ETR
UE
qeee
1
qqw t
sddd
I-205
WB
Ram
psTR
UE
afg
eeet
t
TRU
E
2
Lammers Rd
dddg
gI-2
05 E
B Ra
mps
TRU
Eqqeetqq
eeet
7
TRU
Eadddgg
Ele
vent
h S
tad
dgg
Commerce Way
Lammers Rdasg
qeee
et
TRU
ETR
UE
5
qqrt
sddd
gCo
nnec
tion
to B
yron
LEG
END
= T
raffi
c S
igna
l=
“Fre
e” R
ight
Tur
n
I-205
/ La
mm
ers
Roa
d In
terc
hang
e
Fig
ure
16Ju
ly 2
008
WC
06-2
287_
16
TRA
FFIC
CO
NTR
OLS
AN
D L
AN
E C
ON
FIG
UR
ATI
ON
S
OPE
NIN
G D
AY
(YEA
R 2
015)
BU
ILD
ALT
ERN
ATI
VE 1

1
2
4
5
67
8
9Lammers Rd
Ele
vent
h S
tTR
UE
4
adddg
sdgg
qqeeet
qqee
t
TRU
E
3
Doe
sN
otE
xist
qqee
ert
addgEleventh St
7 sddg
ggTR
UE
qqeet
TRU
EG
rant
Lin
e R
d
Eleventh Stsdg
qeer
TRU
ETR
UE
Von
Sos
ten
Rd
6
qe t
addg
gg
TRU
Eqqert
qqee
eet
8
TRU
E
adgggEleventh St
Com
mer
ce W
ayaa
dddg
gEleventh St
TRU
ETR
UE
eett
1
qqrt
addd
I-205
WB
Ram
psTR
UE
aa fg
eeet
t
TRU
E
2
Eleventh St
addd
I-205
EB
Ram
ps
qqqt
TRU
ETR
UE
qqeee
9
asdd
Ele
vent
h S
t
Tracy Gateway
TRU
E
aadgg
qqee
et
5
Eleventh St
TRU
E
qqqet
addd
ggCo
nnec
tion
to B
yron
LEG
END
= T
raffi
c S
igna
l=
“Fre
e” R
ight
Tur
n
I-205
/ La
mm
ers
Roa
d In
terc
hang
e
F
igur
e 17
July
200
8W
C06
-228
7_17
TRA
FFIC
CO
NTR
OLS
AN
D L
AN
E C
ON
FIG
UR
ATI
ON
S
O
PEN
ING
DA
Y (Y
EAR
201
5) B
UIL
D A
LTER
NA
TIVE
5A

1
2
4
5
67
89
Lammers Rd
Ele
vent
h S
tTR
UE
4
adddg
sdgg
qqeeet
qqee
t
TRU
E
qqee
ert
addgEleventh St
7 sddg
ggTR
UE
qqeet
TRU
EG
rant
Lin
e R
d
Eleventh Stsdg
qeer
TRU
ETR
UE
Von
Sos
ten
Rd
6
qe t
addg
gg
TRU
Eqqert
qqee
eet
8
TRU
E
adgggEleventh St
Com
mer
ce W
ayaa
dddg
gEleventh St
TRU
ETR
UE
eett
1
qqrt
addd
I-205
WB
Ram
psTR
UE
aa fg
eeet
t
TRU
E
2
Eleventh St
dddg
gI-2
05 E
B Ra
mps
3
Doe
sN
otE
xist
qqqt
TRU
ETR
UE
qqeee
9
asdd
Ele
vent
h S
t
Tracy Gateway
TRU
E
aadgg
qqee
et
5
Eleventh St
TRU
E
qqqet
addd
ggCo
nnec
tion
to B
yron
LEG
END
= T
raffi
c S
igna
l=
“Fre
e” R
ight
Tur
n
I-205
/ La
mm
ers
Roa
d In
terc
hang
e
Fig
ure
18Ju
ly 2
008
WC
06-2
287_
18
TRA
FFIC
CO
NTR
OLS
AN
D L
AN
E C
ON
FIG
UR
ATI
ON
S
OPE
NIN
G D
AY
(YEA
R 2
015)
BU
ILD
ALT
ERN
ATI
VE 5
A-V
A

1
2
3
47
5
8
6
Lammers Rd
Com
mer
ce W
ayTR
UE
3
sggg
aa dd
dgg
qqqet
qeee
et
TRU
E
TRU
E
adddgg
qqee
et
4
Lammers Rd
TRU
E
qqeee t
sddg
ggE
leve
nth
St
qeee
et
TRU
ETR
UE
Lammers Rd
sddd
gg
qqqeet
8
asg
Von
Sos
ten
Rd
qqqe
eett
a dddgLammers Rd
sddg
ggTR
UE
qqqeet
TRU
EG
rant
Lin
e R
d
6
Lammers Rd
TRU
ETR
UE
ert
1
qw t
sddd
I-205
WB
Ram
psTR
UE
ag
eee t
t
TRU
E
2
Lammers Rd
a ddd
I-205
EB
Ram
ps
TRU
Eqqtee
et
7
TRU
E
adddgE
leve
nth
St
ddgg
Commerce Way
Lammers Rdaadg
qeee
et
TRU
ETR
UE
5
qqqet
sddd
ggCo
nnec
tion
to B
yron
LEG
END
= T
raffi
c S
igna
l=
“Fre
e” R
ight
Tur
n
I-205
/ La
mm
ers
Roa
d In
terc
hang
e
Fig
ure
19Ju
ly 2
008
WC
06-2
287_
19
O
PEN
ING
DA
Y (Y
EAR
201
5) B
UIL
D A
LTER
NA
TIVE
6TR
AFF
IC C
ON
TRO
LS A
ND
LA
NE
CO
NFI
GU
RA
TIO
NS

63
Final Traffic Operations Report I-205/Lammers Road Interchange Project May 2009
TABLE 11 OPENING YEAR (2015) INTERSECTION ANALYSIS 1
Alternative Intersection Peak
Hour Approach-Movement
No Build
1 5A 5A-VA 6
NB-L 42/D - - - NB-T 9/A 13/B 14/B 13/B NB-R - 6/A 6/A 9/A SB-T 13/B 10/A 11/B 12/B SB-R 13/B 3/A 4/A 6/A WB-L 32/C 23/C 23/C 32/C WB-R 13/B 7/A 7/A 12/B
AM
Total
-
19/B 13/B 13/B 15/B NB-L 60/E - - - NB-T 6/A 10/A 6/A 11/B NB-R - 2/A 2/A 4/A SB-T 8/A 11/B 10/B 5/A SB-R 8/A 6/A 4/A 5/A WB-L 34/C 27/C 27/C 32/C WB-R 10/A 7/A 7/A 8/A
Lammers Road and I-205 WB Ramps
PM
Total
-
12/B 12/B 11/B 11/B NB-T 3/A 4/A 5/A 5/A NB-R 2/A 3/A 3/A 3/A SB-L 42/D 4/A 48/D - SB-T 4/A 3/A 4/A 3/A SB-R - - - 3/A EB-L 44/D 42/D 50/D 39/D EB-R 11/B 2/A 2/A 14/B
AM
Total
-
5/A 4/A 6/A 5/A NB-T 7/A 3/A 9/A 4/A NB-R 6/A 6/A 11/B 4/A SB-L 34/C 3/A 35/D 5/A SB-T 4/A 6/A 3/A 4/A EB-L 38/D 40/D 43/D 37/D EB-R 13/B 7/A 7/A 15/B
Lammers Road and I-205 EB Ramps
PM
Total
-
9/A 5/A 10/B 6/A

64
Final Traffic Operations Report I-205/Lammers Road Interchange Project May 2009
TABLE 11 OPENING YEAR (2015) INTERSECTION ANALYSIS 1
Alternative Intersection Peak
Hour Approach-Movement
No Build
1 5A 5A-VA 6
NB-L 51/D 48/D NB-T 8/A 23/C NB-R 5/A 9/A SB-L 28/C 45/D SB-T 6/A 12/B SB-R 3/A 3/A EB-L 48/D 52/D EB-T 49/D 42/D EB-R 10/B 25/C WB-L 38/D 76/E WB-T 42/D 27/C WB-R 11/B 11/B
AM
Total
-
11/B
- -
20/C NB-L 56/E 42/D NB-T 17/B 18/B NB-R 8/A 8/A SB-L 55/E >80/F SB-T 13/B 13/B SB-R 3/A 4/A EB-L 43/D 44/D EB-T 43/D 24/C EB-R 24/C 13/B WB-L 39/D 39/D WB-T 48/D 43/D WB-R 22/C 23/C
Lammers Road and Commerce Way
PM
Total
-
23/C
- -
26/C

65
Final Traffic Operations Report I-205/Lammers Road Interchange Project May 2009
TABLE 11 OPENING YEAR (2015) INTERSECTION ANALYSIS 1
Alternative Intersection Peak
Hour Approach-Movement
No Build
1 5A 5A-VA 6
NB-L 45/D 49/D 45/D 44/D 49/D NB-T 13/B 14/A 33/C 36/D 13/B NB-R 2/A 6/A 5/A 5/A 6/A SB-L 47/D 47/C 44/D 38/D 37/D SB-T 17/B 7/A 32/C 34/C 11/B SB-R 7/A 8/A 15/B 15/B 12/B EB-L 52/D 70/D 41/D 42/D 64/E EB-T 21/C 15/D 5/A 5/A 14/B EB-R 3/A 6/B 3/A 3/A 8/A WB-L 39/D 66/D 42/D 42/D 68/E WB-T 28/C 32/D 9/A 10/A 30/C WB-R 8/A 7/B 7/A 6/A 10/B
AM
Total 24/C 22/C 15/B 15/B 16/B NB-L 53/D 53/D 48/D 45/D 43/D NB-T 28/C 20/C 34/C 32/C 21/C NB-R 2/A 12/B 11/B 10/A 12/B SB-L >80/F 74/E 43/D 43/D 56/E SB-T 34/C 9/A 30/C 30/C 9/A SB-R 9/A 9/A 20/B 23/C 11/B EB-L 69/E 67/E 48/D 48/D 54/D EB-T 13/B 16/B 6/A 6/A 11/B EB-R 6/A 16/B 4/A 4/A 11/B WB-L 55/E 51/D 43/D 40/D 48/D WB-T 29/C 35/C 16/B 17/B 26/C WB-R 7/A 6/A 6/A 5/A 5/A
Lammers Road and Eleventh Street
PM
Total 23/C 21/C 19/B 19/B 17/B

66
Final Traffic Operations Report I-205/Lammers Road Interchange Project May 2009
TABLE 11 OPENING YEAR (2015) INTERSECTION ANALYSIS 1
Alternative Intersection Peak
Hour Approach-Movement
No Build
1 5A 5A-VA 6
NB-L - 44/D 35/D 35/C 44/D NB-T - 9/A 7/A 8/A 9/A NB-R - 8/A 2/A 3/A 5/A SB-L 8/A 52/D 55/D 52/D 39/D SB-T - 6/A 8/A 9/A 14/B SB-R 6/A 5/A 5/A 5/A 9/A EB-L 44/D 51/D 39/D 48/D 51/D EB-T 29/C 35/C 34/C 39/D 34/C EB-R - 5/A 4/A 4/A 4/A WB-L - 44/D 43/D 40/D 45/D WB-T 33/C 32/C 36/D 39/D 41/D WB-R 10/A 7/A 10/A 9/A 10/B
AM
Total 14/B 13/B 14/B 14/B 15/B NB-L - 49/D 37/D 37/D 44/D NB-T - 14/B 12/B 11/B 14/B NB-R - 9/A 4/A 4/A 5/A SB-L 16/B 45/D 44/D 40/D 35/C SB-T - 13/B 11/B 10/A 19/B SB-R 4/A 11/B 5/A 5/A 17/B EB-L 71/E 48/D 43/D 49/D 57/E EB-T 25/C 41/D 41/D 44/D 41/D EB-R - 9/A 7/A 6/A 8/A WB-L - 42/D 48/D 43/D 35/C WB-T 31/C 26/C 37/D 34/C 28/C WB-R 17/B 10/B 13/B 13/B 15/B
Lammers Road 2 and Connection to Byron
PM
Total 20/B 18/B 17/B 16/B 19/B
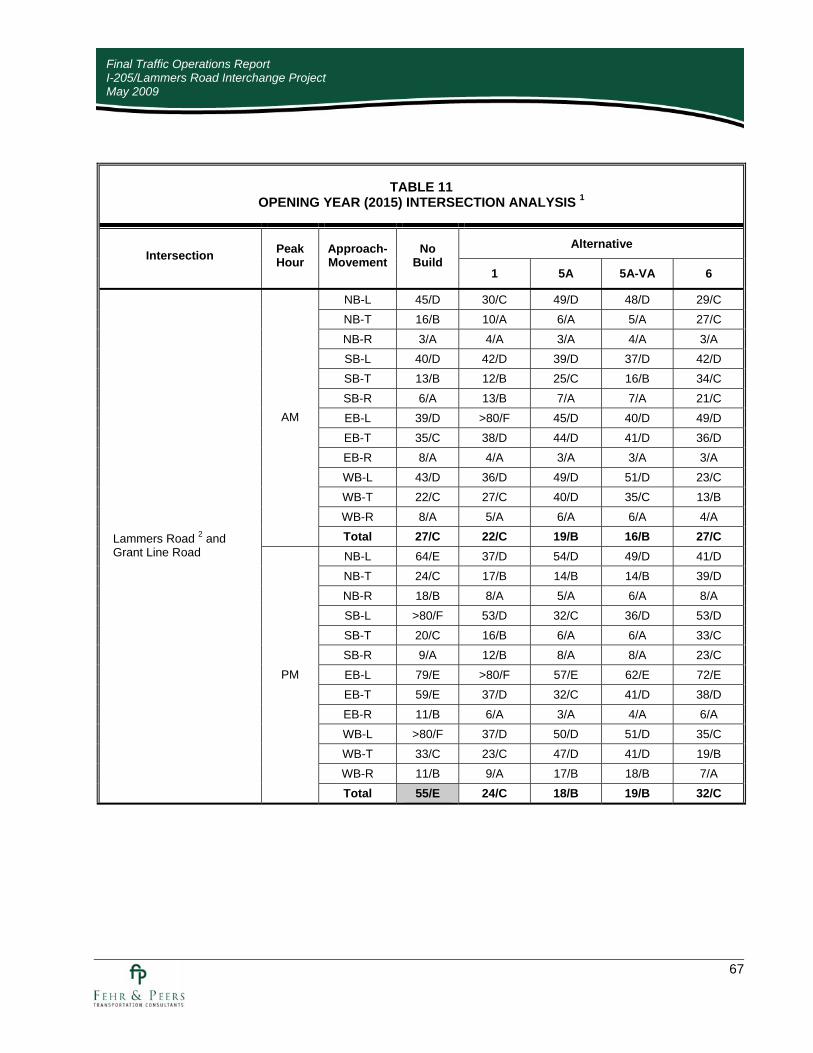
67
Final Traffic Operations Report I-205/Lammers Road Interchange Project May 2009
TABLE 11 OPENING YEAR (2015) INTERSECTION ANALYSIS 1
Alternative Intersection Peak
Hour Approach-Movement
No Build
1 5A 5A-VA 6
NB-L 45/D 30/C 49/D 48/D 29/C NB-T 16/B 10/A 6/A 5/A 27/C NB-R 3/A 4/A 3/A 4/A 3/A SB-L 40/D 42/D 39/D 37/D 42/D SB-T 13/B 12/B 25/C 16/B 34/C SB-R 6/A 13/B 7/A 7/A 21/C EB-L 39/D >80/F 45/D 40/D 49/D EB-T 35/C 38/D 44/D 41/D 36/D EB-R 8/A 4/A 3/A 3/A 3/A WB-L 43/D 36/D 49/D 51/D 23/C WB-T 22/C 27/C 40/D 35/C 13/B WB-R 8/A 5/A 6/A 6/A 4/A
AM
Total 27/C 22/C 19/B 16/B 27/C NB-L 64/E 37/D 54/D 49/D 41/D NB-T 24/C 17/B 14/B 14/B 39/D NB-R 18/B 8/A 5/A 6/A 8/A SB-L >80/F 53/D 32/C 36/D 53/D SB-T 20/C 16/B 6/A 6/A 33/C SB-R 9/A 12/B 8/A 8/A 23/C EB-L 79/E >80/F 57/E 62/E 72/E EB-T 59/E 37/D 32/C 41/D 38/D EB-R 11/B 6/A 3/A 4/A 6/A WB-L >80/F 37/D 50/D 51/D 35/C WB-T 33/C 23/C 47/D 41/D 19/B WB-R 11/B 9/A 17/B 18/B 7/A
Lammers Road 2 and Grant Line Road
PM
Total 55/E 24/C 18/B 19/B 32/C
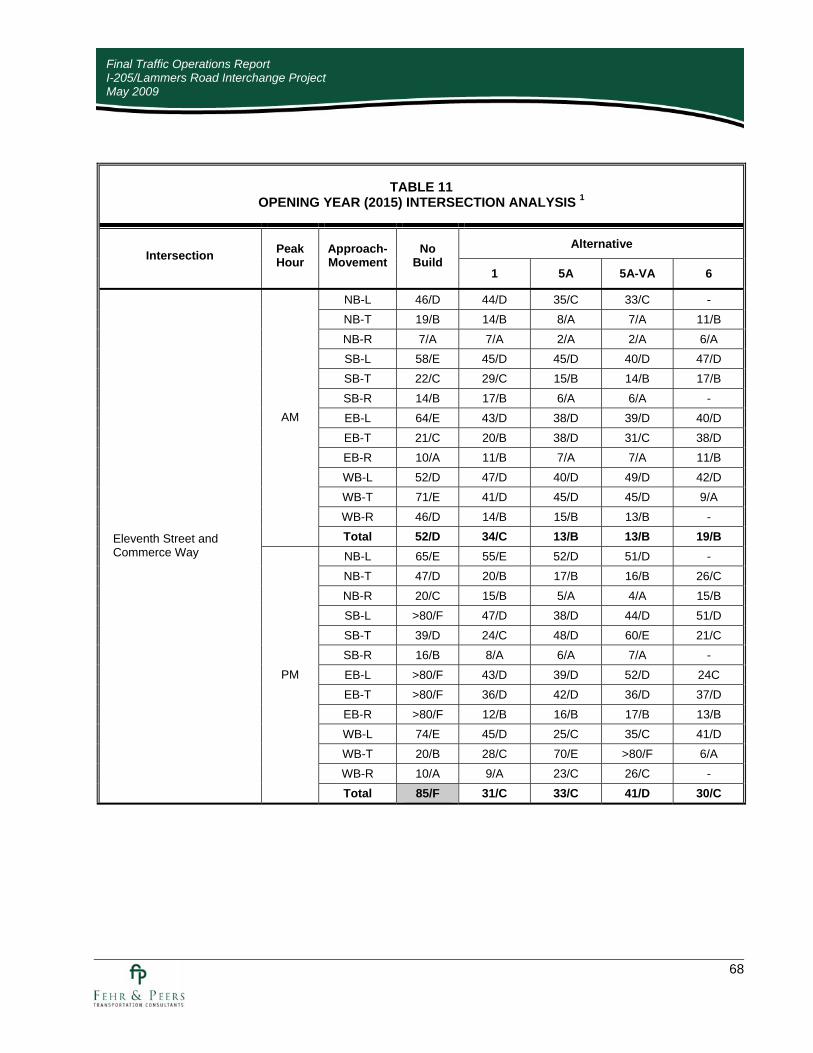
68
Final Traffic Operations Report I-205/Lammers Road Interchange Project May 2009
TABLE 11 OPENING YEAR (2015) INTERSECTION ANALYSIS 1
Alternative Intersection Peak
Hour Approach-Movement
No Build
1 5A 5A-VA 6
NB-L 46/D 44/D 35/C 33/C - NB-T 19/B 14/B 8/A 7/A 11/B NB-R 7/A 7/A 2/A 2/A 6/A SB-L 58/E 45/D 45/D 40/D 47/D SB-T 22/C 29/C 15/B 14/B 17/B SB-R 14/B 17/B 6/A 6/A - EB-L 64/E 43/D 38/D 39/D 40/D EB-T 21/C 20/B 38/D 31/C 38/D EB-R 10/A 11/B 7/A 7/A 11/B WB-L 52/D 47/D 40/D 49/D 42/D WB-T 71/E 41/D 45/D 45/D 9/A WB-R 46/D 14/B 15/B 13/B -
AM
Total 52/D 34/C 13/B 13/B 19/B NB-L 65/E 55/E 52/D 51/D - NB-T 47/D 20/B 17/B 16/B 26/C NB-R 20/C 15/B 5/A 4/A 15/B SB-L >80/F 47/D 38/D 44/D 51/D SB-T 39/D 24/C 48/D 60/E 21/C SB-R 16/B 8/A 6/A 7/A - EB-L >80/F 43/D 39/D 52/D 24C EB-T >80/F 36/D 42/D 36/D 37/D EB-R >80/F 12/B 16/B 17/B 13/B WB-L 74/E 45/D 25/C 35/C 41/D WB-T 20/B 28/C 70/E >80/F 6/A WB-R 10/A 9/A 23/C 26/C -
Eleventh Street and Commerce Way
PM
Total 85/F 31/C 33/C 41/D 30/C

69
Final Traffic Operations Report I-205/Lammers Road Interchange Project May 2009
TABLE 11 OPENING YEAR (2015) INTERSECTION ANALYSIS 1
Alternative Intersection Peak
Hour Approach-Movement
No Build
1 5A 5A-VA 6
NB-L 47/D 38/D 41/D 36/D NB-T 6/A 5/A 5/A 5/A NB-R 5/A 5/A 5/A 4/A SB-L 42/D 43/D 41/D 51/D SB-T 7/A 10/A 10/B 12/B SB-R - 3/A 3/A - EB-T 40/D 31/C 39/D 50/D EB-R 5/A 6/A 7/A 5/A WB-L 43/D 49/D 50/D 43/D WB-T 42/D 50/D 52/D 46/D WB-R 4/A 1/A 1/A 9/A
AM
Total
-
13/B 15/B 16/B 13/B NB-L 59/E 47/D 49/D 39/D NB-T 10/B 11/B 11/B 10/A NB-R 6/A 12/B 12/B 5/A SB-L 51/D 45/D 45/D 54/D SB-T 14/B 11/B 12/B 14/B SB-R - 3/A 3/A - EB-L - 34/C 37/D - EB-T 40/D 34/C 36/D 45D EB-R 7/A 12/B 12/B 9/A WB-L 44/D 57/E 58/E 39/D WB-T 26/C 43/D 44/D 30/C WB-R 10/A 2/A 2/A 13/B
Lammers Road 2 and Von Sosten Road
PM
Total
-
17/B 18/B 19/B 16/B

70
Final Traffic Operations Report I-205/Lammers Road Interchange Project May 2009
TABLE 11 OPENING YEAR (2015) INTERSECTION ANALYSIS 1
Alternative Intersection Peak
Hour Approach-Movement
No Build
1 5A 5A-VA 6
NB-L 30/C 32/C NB-R 3/A 3/A EB-T 8/A 6/A EB-R 4/A 4/A WB-L 36/D 40/D WB-T 10/B 10/A
AM
Total
- -
13/B 13/B
-
NB-L 30/C 31/C NB-R 5/A 5/A EB-T 9/A 9/A EB-R 8/A 9/A WB-L 42/D 58/E WB-T 7/A 7/A
Eleventh Street and Tracy Gateway
PM
Total
- -
12/B 12/B
-
AM 70 90 60 60 90 System-Wide Vehicle Delay (vehicle hours) 3
PM 170 140 110 130 150 AM 100% 100% 100% 100% 100% System-Wide Percent
Demand Served PM 100% 100% 100% 100% 100%
Notes: Shading denotes locations where level of service threshold is exceeded. 1. Delay (seconds per vehicle) / level of service (LOS). 2. Lammers Road is Eleventh Street under Alternatives 5A and 5A-VA 3. System-wide vehicle delay calculated by adding up each intersection’s vehicle delay which is computed by multiplying the
demand volume by the intersection delay. Source: Fehr & Peers, 2008.

71
TABLE 12 2015 NO BUILD ALTERNATIVE - 95TH PERCENTILE QUEUE LENGTHS
NB SB EB WB Intersection Peak
Hour Left Through Right Left Through Right Left Through Right Left Through Right
Storage (ft) 250 310 275 100 3,620 225 200 1,275 325 225 3,405 275
AM 35 80 0 80 145 10 40 85 0 185 225 40 4. Eleventh Street /
Lammers Road
PM 35 140 30 135 360 70 120 230 0 155 135 45
Storage (ft) - - - 1,285 - 150 50 2,185 - - 2,055 300
AM - - - 135 - 15 35 60 - - 125 125 5. Eleventh Street / Connection to Byron
PM - - - 55 - 15 35 115 - - 400 300
Storage (ft) 400 1,315 550 375 2,075 100 50 3,160 650 375 3,310 425
AM 65 20 15 120 40 25 30 110 35 210 105 65 6. Grant Line Road /
Lammers Road
PM 1450 290 555 325 260 25 40 225 65 380 515 105
Storage (ft) 375 680 325 400 3,865 275 375 4,355 575 175 2,050 300
AM 50 50 35 75 110 35 75 90 70 795 910 320 7. Eleventh Street /
Commerce Way
PM 185 205 130 470 545 100 360 2,070 570 70 140 55 Notes: Shading denotes locations where storage length is exceeded. Results shown here are average of five SimTraffic runs.
Source: Fehr & Peers, 2008.

72
TABLE 13 2015 ALTERNATIVE 1 - 95TH PERCENTILE QUEUE LENGTHS
NB SB EB WB Intersection Peak Hour
Left Through Right Left Through Right Left Through Right Left Through Right
Storage (ft) 300 975 - - 1,040 - - - 2,180 475
AM 125 115 - - 155 - - - 245 0 1. Lammers Road/I-205
Westbound Ramps PM 45 115 - - 130 - - - 155 0
Storage (ft) - 625 500 975 975 - 2,250 200 - - -
AM - 70 40 65 85 - 60 35 - - - 2. Lammers Road / I-
205 Eastbound Ramps PM - 180 120 140 130 - 80 75 - - -
Storage (ft) 200 1,665 600 500 625 400 3,205 3,205 965 965 500
AM 30 75 25 90 110 0 65 50 20 50 40 3. Lammers Road /
Commerce Way PM 35 160 45 175 210 0 195 110 40 40 125
Storage (ft) 300 2,400 350 600 1,665 500 1,475 300 300 3,375 600
AM 25 130 15 80 115 35 80 20 120 245 0 4. Lammers Road /
Eleventh Street PM 25 185 70 160 155 110 240 25 65 120 0
Storage (ft) 500 1,040 400 500 1,435 300 995 400 860 860 400
AM 160 155 40 90 80 35 55 55 20 30 30 5. Lammers Road / Connection to Byron
PM 120 230 40 145 170 40 80 80 130 75 75
Storage (ft) 450 1,075 1,075 500 2,055 300 3,150 600 3,260 3,260 400
AM 80 105 30 115 100 30 85 0 85 65 30 6. Lammers Road /
Grant Line Road PM 105 170 80 160 120 30 125 0 100 80 45
Storage (ft) 400 675 400 400 3,205 3,205 400 4,350 600 1,810 1,810 300
AM 55 45 20 35 210 55 35 80 85 390 585 120 7. Eleventh Street /
Commerce Way PM 165 180 70 70 100 55 62 355 40 50 180 35
Storage (ft) 500 1,435 500 500 1,075 300 1,020 400 400 795 400
AM 180 90 60 95 90 0 35 35 30 25 25 8. Lammers Road / Von
Sosten Road PM 130 135 35 155 135 0 50 50 140 50 50
Notes: Results shown here are average of five SimTraffic runs.
Source: Fehr & Peers, 2008.
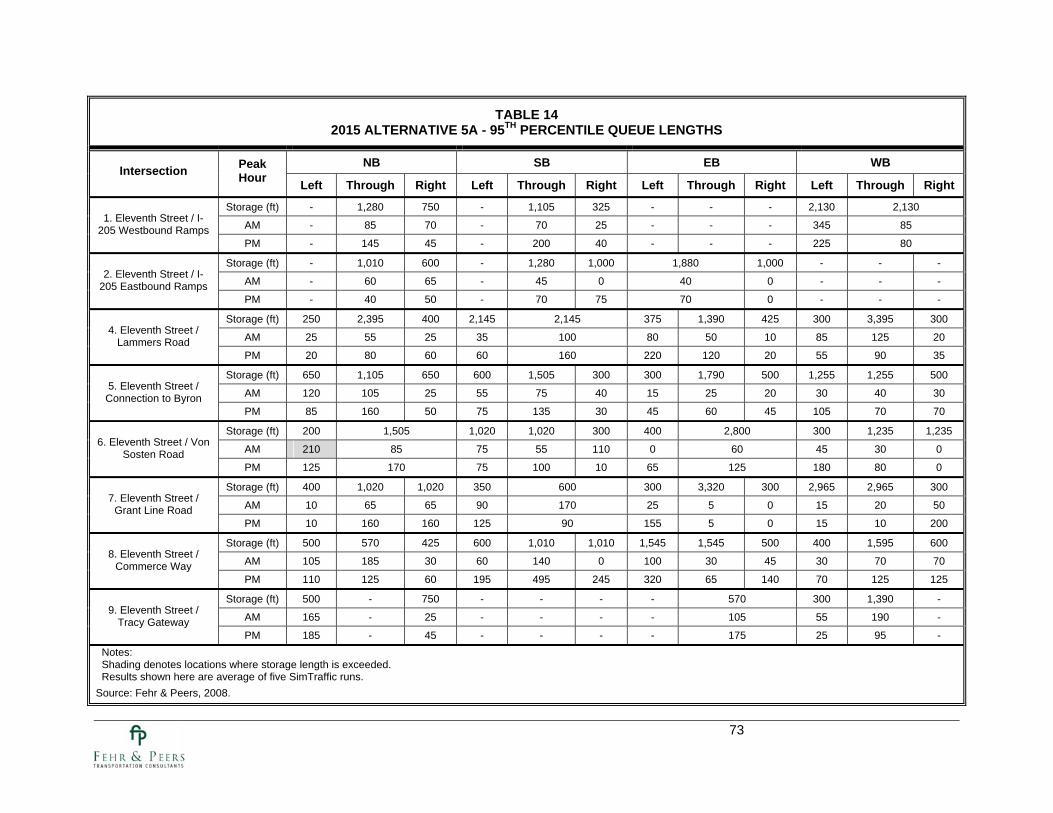
73
TABLE 14 2015 ALTERNATIVE 5A - 95TH PERCENTILE QUEUE LENGTHS
NB SB EB WB Intersection Peak
Hour Left Through Right Left Through Right Left Through Right Left Through Right
Storage (ft) - 1,280 750 - 1,105 325 - - - 2,130 2,130
AM - 85 70 - 70 25 - - - 345 85 1. Eleventh Street / I-
205 Westbound Ramps PM - 145 45 - 200 40 - - - 225 80
Storage (ft) - 1,010 600 - 1,280 1,000 1,880 1,000 - - -
AM - 60 65 - 45 0 40 0 - - - 2. Eleventh Street / I-
205 Eastbound Ramps PM - 40 50 - 70 75 70 0 - - -
Storage (ft) 250 2,395 400 2,145 2,145 375 1,390 425 300 3,395 300
AM 25 55 25 35 100 80 50 10 85 125 20 4. Eleventh Street /
Lammers Road PM 20 80 60 60 160 220 120 20 55 90 35
Storage (ft) 650 1,105 650 600 1,505 300 300 1,790 500 1,255 1,255 500
AM 120 105 25 55 75 40 15 25 20 30 40 30 5. Eleventh Street / Connection to Byron
PM 85 160 50 75 135 30 45 60 45 105 70 70
Storage (ft) 200 1,505 1,020 1,020 300 400 2,800 300 1,235 1,235
AM 210 85 75 55 110 0 60 45 30 0 6. Eleventh Street / Von Sosten Road
PM 125 170 75 100 10 65 125 180 80 0
Storage (ft) 400 1,020 1,020 350 600 300 3,320 300 2,965 2,965 300
AM 10 65 65 90 170 25 5 0 15 20 50 7. Eleventh Street /
Grant Line Road PM 10 160 160 125 90 155 5 0 15 10 200
Storage (ft) 500 570 425 600 1,010 1,010 1,545 1,545 500 400 1,595 600
AM 105 185 30 60 140 0 100 30 45 30 70 70 8. Eleventh Street /
Commerce Way PM 110 125 60 195 495 245 320 65 140 70 125 125
Storage (ft) 500 - 750 - - - - 570 300 1,390 -
AM 165 - 25 - - - - 105 55 190 - 9. Eleventh Street /
Tracy Gateway PM 185 - 45 - - - - 175 25 95 -
Notes: Shading denotes locations where storage length is exceeded. Results shown here are average of five SimTraffic runs.
Source: Fehr & Peers, 2008.

74
TABLE 15 2015 ALTERNATIVE 5A-VA - 95TH PERCENTILE QUEUE LENGTHS
NB SB EB WB Intersection Peak
Hour Left Through Right Left Through Right Left Through Right Left Through Right
Storage (ft) - 1,290 1,290 - 1,105 325 - - - 2,130 2,130
AM - 90 75 - 85 25 - - - 320 85 1. Eleventh Street / I-
205 Westbound Ramps PM - 90 45 - 140 40 - - - 245 75
Storage (ft) - 1,010 600 600 1,290 - 1,890 1,000 - - -
AM - 95 45 80 35 - 55 0 - - - 2. Eleventh Street / I-
205 Eastbound Ramps PM - 150 225 170 70 - 85 105 - - -
Storage (ft) 250 2,395 400 2,145 2,145 375 1,390 425 300 3,395 300
AM 20 60 25 35 95 85 55 10 85 135 15 4. Eleventh Street /
Lammers Road PM 25 85 60 55 170 230 125 15 60 100 35
Storage (ft) 650 1,105 650 600 1,505 300 300 1,790 1,790 1,255 1,255 500
AM 110 105 30 55 80 45 20 25 20 35 45 30 5. Eleventh Street / Connection to Byron
PM 85 155 50 70 110 25 40 60 40 90 70 70
Storage (ft) 200 1,505 1,020 1,020 300 400 2,800 300 1,235 1,235
AM 85 85 55 105 30 0 60 55 35 0 6. Eleventh Street / Von Sosten Road
PM 135 165 70 95 15 70 140 200 70 0
Storage (ft) 400 1,020 1,020 350 600 300 3,320 300 2,965 2,965 300
AM 10 60 60 90 145 30 5 5 30 35 65 7. Eleventh Street /
Grant Line Road PM 15 165 165 120 95 150 10 0 10 10 230
Storage (ft) 500 570 425 600 1,010 1,010 1,545 1,545 500 400 1,595 600
AM 105 150 25 60 140 0 100 30 45 35 65 65 8. Eleventh Street /
Commerce Way PM 110 130 50 375 575 525 405 75 155 80 135 135
Storage (ft) 500 - 750 - - - - 570 300 1,390 -
AM 160 - 25 - - - - 90 50 170 - 9. Eleventh Street /
Tracy Gateway PM 200 - 50 - - - - 230 25 100 -
Notes: Results shown here are average of five SimTraffic runs.
Source: Fehr & Peers, 2008.
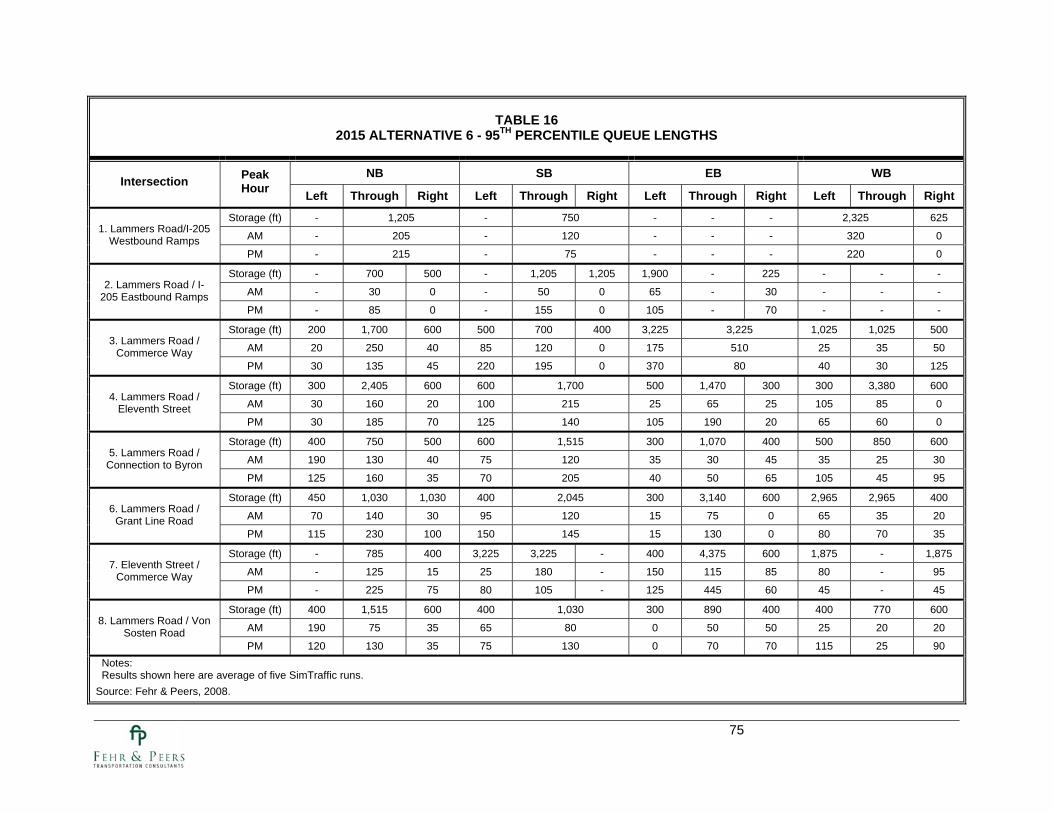
75
TABLE 16 2015 ALTERNATIVE 6 - 95TH PERCENTILE QUEUE LENGTHS
NB SB EB WB Intersection Peak
Hour Left Through Right Left Through Right Left Through Right Left Through Right
Storage (ft) - 1,205 - 750 - - - 2,325 625
AM - 205 - 120 - - - 320 0 1. Lammers Road/I-205
Westbound Ramps PM - 215 - 75 - - - 220 0
Storage (ft) - 700 500 - 1,205 1,205 1,900 - 225 - - -
AM - 30 0 - 50 0 65 - 30 - - - 2. Lammers Road / I-
205 Eastbound Ramps PM - 85 0 - 155 0 105 - 70 - - -
Storage (ft) 200 1,700 600 500 700 400 3,225 3,225 1,025 1,025 500
AM 20 250 40 85 120 0 175 510 25 35 50 3. Lammers Road /
Commerce Way PM 30 135 45 220 195 0 370 80 40 30 125
Storage (ft) 300 2,405 600 600 1,700 500 1,470 300 300 3,380 600
AM 30 160 20 100 215 25 65 25 105 85 0 4. Lammers Road /
Eleventh Street PM 30 185 70 125 140 105 190 20 65 60 0
Storage (ft) 400 750 500 600 1,515 300 1,070 400 500 850 600
AM 190 130 40 75 120 35 30 45 35 25 30 5. Lammers Road /
Connection to Byron PM 125 160 35 70 205 40 50 65 105 45 95
Storage (ft) 450 1,030 1,030 400 2,045 300 3,140 600 2,965 2,965 400
AM 70 140 30 95 120 15 75 0 65 35 20 6. Lammers Road /
Grant Line Road PM 115 230 100 150 145 15 130 0 80 70 35
Storage (ft) - 785 400 3,225 3,225 - 400 4,375 600 1,875 - 1,875
AM - 125 15 25 180 - 150 115 85 80 - 95 7. Eleventh Street /
Commerce Way PM - 225 75 80 105 - 125 445 60 45 - 45
Storage (ft) 400 1,515 600 400 1,030 300 890 400 400 770 600
AM 190 75 35 65 80 0 50 50 25 20 20 8. Lammers Road / Von
Sosten Road PM 120 130 35 75 130 0 70 70 115 25 90
Notes: Results shown here are average of five SimTraffic runs.
Source: Fehr & Peers, 2008.

76
Final Traffic Operations Report I-205/Lammers Road Interchange Project May 2009
MAINLINE AND RAMP ANALYSIS
HCM Methodology/Leisch Method
Each mainline segment and ramp junction on I-205 was analyzed based on the opening year (2015) volumes shown on Figures 9 through 13. The results are summarized in Tables 17 and 18 (Mainline Segment Analysis) and Table 19 (Ramp Merge/Diverge Analysis). Detailed calculations are presented in Appendix G.
During the AM peak hour, all of the westbound mainline segments are anticipated to operate at LOS E or F under No Build conditions except between Grant Line Road and Eleventh Street. The HCM analysis result for westbound I-205 between Grant Line Road and Eleventh Street indicates LOS D. However, this result does not take into consideration the queuing impacts of a downstream bottleneck. Under each of the Build Alternatives, mainline operations are anticipated to be similar to the No Build Alternative.
FREQ Analysis
Based on discussions with Caltrans traffic operations staff it was recognized that the limitations of the HCM methodology to fully account for the impacts of mainline bottlenecks on system-wide traffic operations was leading to an inaccurate representation of the traffic operations on I-205. As requested by Caltrans, a FREQ macroscopic model was developed for I-205. FREQ is a freeway simulation model that can be used to evaluate basic mainline segments, weaving segments, HOV lanes, and ramp metering. The advantage of FREQ when compared to the HCM methodology is that FREQ evaluates the corridor as a system instead of in isolation, such that the traffic operations of one freeway section impact the operations of adjacent sections. From a traffic engineering perspective, a FREQ model is a better tool for estimating traffic operations than HCM.
In consideration of the fact that the HCM methodology does not take into consideration the effect of bottlenecks on mainline operations, two FREQ models (westbound AM and eastbound PM) were developed for No Project conditions to provide a better understanding of traffic operations during these peak periods. The limits of the westbound AM model are from east of Grant Line Road to west of Mountain House Parkway. The limits of the eastbound PM model are from west of Mountain House Parkway to east of Traffic Boulevard. The FREQ models assumed three mixed flow lanes in each direction of travel and no ramp metering.
The results of the FREQ analysis are presented in brackets in Table 17 and Table 19, while the detailed calculations are presented in Appendix H. The results of the FREQ analysis indicate that a bottleneck would develop in the westbound AM direction west of Mountain House Parkway. The bottleneck would result in a vehicle queue that would extend past Grant Line Road resulting in LOS F conditions from Mountain House Parkway to east of Grant Line Road. In the eastbound PM direction, there are no projected bottlenecks and the FREQ results are similar to the HCM results.
Based on the projected volumes the westbound AM bottleneck west of Mountain House Parkway is anticipated to occur with or without the project. Therefore, I-205 is also anticipated to operate at LOS F conditions from Mountain House Parkway to east of Grant Line Road under all of the project alternatives.

77
TABLE 17 2015 AM
MAINLINE/WEAVING SEGMENT LEVELS OF SERVICE
2015 No Build
2015 Alt 1
2015 Alt 5A
2015 Alt 5A-VA
2015 ALT 6 Mainline Segment # of
Lanes Truck
% Vol Density LOS Vol Density LOS Vol Density LOS Vol Density LOS Vol Density LOS
I-205 Eastbound Mountain House Parkway to 11th St. 3 18% 1,850 Leisch A 1,870 Leisch A 1,880 Leisch A
I-205 Eastbound 11th Street to Lammers Road 3 18% 1,470 8 A
1,900 Leisch A 1,900 Leisch A 1,480 8 A
I-205 Eastbound Lammers Road to Grant Line Road 3 18%
1,410 8 A 1,800 Leisch A 1,830 10 A 1,830 10 A 1,770 Leisch A
I-205 Eastbound East of Grant Line Road 3 18% 2,180 12 B 2,170 12 B 2,060 11 B 2,060 11 B 2,170 12 B
I-205 Westbound East of Grant Line Road 3 7% 6,000 [> 45]1 [F]1 6,000 [> 45]1 [F]1 6,000 [> 45]1 [F]1 6,000 [> 45]1 [F]1 6,000 [> 45]1 [F]1
I-205 Westbound Grant Line Road to Lammers Road 3 7% 6,335 [> 45]1 [F]1 6,593 [> 45]1 [F]1 6,593 [> 45]1 [F]1 6,397 [> 45]1 [F]1
I-205 Westbound Lammers Road to 11th Street 3 7%
5,273 [> 45]1 [F]1 5,197 [> 45]1 [F]1
I-205 Westbound 11th Street to Mountain House Pkwy. 3 7% 7,233 [> 45]1 [F]1 6,937 [> 45]1 [F]1
5,931 [> 45]1 [F]1 5,931 [> 45]1 [F]1 6,163 [> 45]1 [F]1
Notes: 1. Results presented in brackets are based on FREQ. Based on the FREQ analysis results for No Build conditions these segments are anticipated to be in queue from the
bottleneck that would develop west of Mountain House Parkway. For the project alternatives, the projected volumes west of Mountain House Parkway are also anticipated to result in a bottleneck similar to No Build conditions such that traffic operations would be similar to No Build conditions.
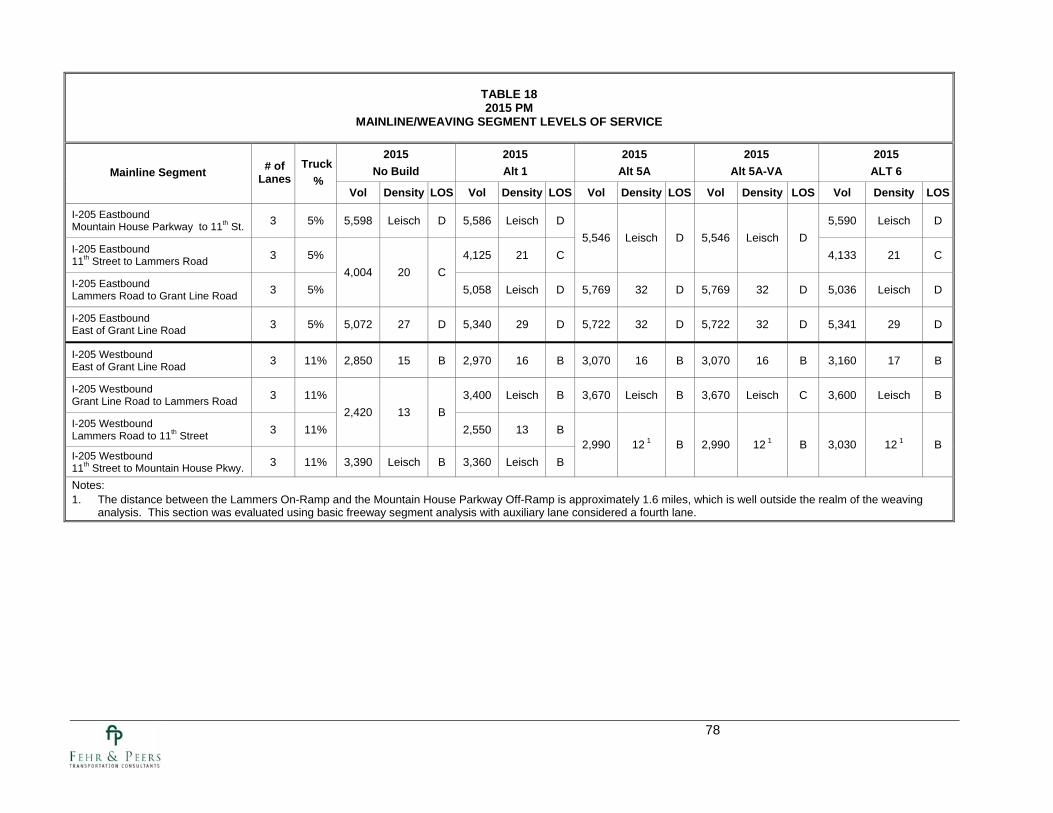
78
TABLE 18 2015 PM
MAINLINE/WEAVING SEGMENT LEVELS OF SERVICE
2015 No Build
2015 Alt 1
2015 Alt 5A
2015 Alt 5A-VA
2015 ALT 6 Mainline Segment # of
Lanes Truck
% Vol Density LOS Vol Density LOS Vol Density LOS Vol Density LOS Vol Density LOS
I-205 Eastbound Mountain House Parkway to 11th St. 3 5% 5,598 Leisch D 5,586 Leisch D 5,590 Leisch D
I-205 Eastbound 11th Street to Lammers Road 3 5% 4,125 21 C
5,546 Leisch D 5,546 Leisch D 4,133 21 C
I-205 Eastbound Lammers Road to Grant Line Road 3 5%
4,004 20 C 5,058 Leisch D 5,769 32 D 5,769 32 D 5,036 Leisch D
I-205 Eastbound East of Grant Line Road 3 5% 5,072 27 D 5,340 29 D 5,722 32 D 5,722 32 D 5,341 29 D
I-205 Westbound East of Grant Line Road 3 11% 2,850 15 B 2,970 16 B 3,070 16 B 3,070 16 B 3,160 17 B
I-205 Westbound Grant Line Road to Lammers Road 3 11% 3,400 Leisch B 3,670 Leisch B 3,670 Leisch C 3,600 Leisch B
I-205 Westbound Lammers Road to 11th Street 3 11%
2,420 13 B 2,550 13 B
I-205 Westbound 11th Street to Mountain House Pkwy. 3 11% 3,390 Leisch B 3,360 Leisch B
2,990 12 1 B 2,990 12 1 B 3,030 12 1 B
Notes: 1. The distance between the Lammers On-Ramp and the Mountain House Parkway Off-Ramp is approximately 1.6 miles, which is well outside the realm of the weaving
analysis. This section was evaluated using basic freeway segment analysis with auxiliary lane considered a fourth lane.
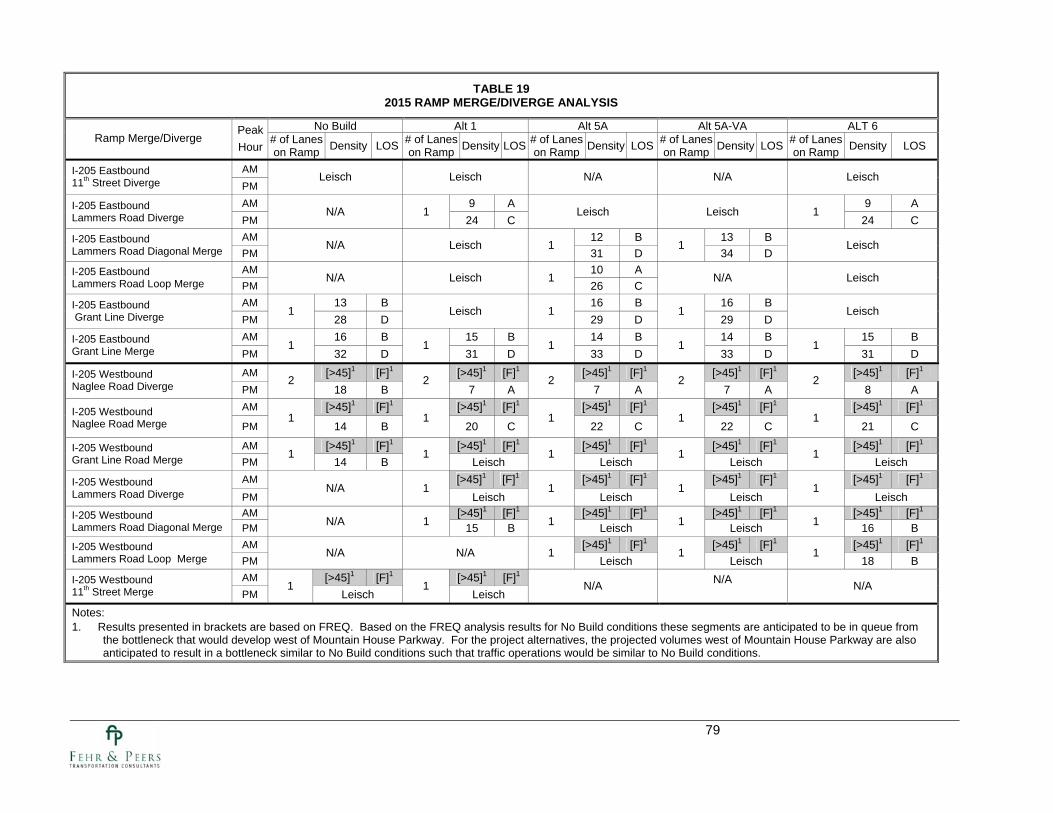
79
TABLE 19 2015 RAMP MERGE/DIVERGE ANALYSIS
No Build Alt 1 Alt 5A Alt 5A-VA ALT 6 Ramp Merge/Diverge
Peak Hour
# of Lanes on Ramp Density LOS # of Lanes
on Ramp Density LOS # of Lanes on Ramp Density LOS # of Lanes
on Ramp Density LOS # of Lanes on Ramp Density LOS
AM I-205 Eastbound 11th Street Diverge PM
Leisch Leisch N/A N/A Leisch
AM 9 A 9 A I-205 Eastbound Lammers Road Diverge PM
N/A 1 24 C
Leisch Leisch 1 24 C
AM 12 B 13 B I-205 Eastbound Lammers Road Diagonal Merge PM
N/A Leisch 1 31 D
1 34 D
Leisch
AM 10 A I-205 Eastbound Lammers Road Loop Merge PM
N/A Leisch 1 26 C
N/A Leisch
AM 13 B 16 B 16 B I-205 Eastbound Grant Line Diverge PM
1 28 D
Leisch 1 29 D
1 29 D
Leisch
AM 16 B 15 B 14 B 14 B 15 B I-205 Eastbound Grant Line Merge PM
1 32 D
1 31 D
1 33 D
1 33 D
1 31 D
AM [>45]1 [F]1 [>45]1 [F]1 [>45]1 [F]1 [>45]1 [F]1 [>45]1 [F]1 I-205 Westbound Naglee Road Diverge PM
2 18 B
2 7 A
2 7 A
2 7 A
2 8 A
AM [>45]1 [F]1 [>45]1 [F]1 [>45]1 [F]1 [>45]1 [F]1 [>45]1 [F]1 I-205 Westbound Naglee Road Merge PM
1 14 B
1 20 C
1 22 C
1 22 C
1 21 C
AM [>45]1 [F]1 [>45]1 [F]1 [>45]1 [F]1 [>45]1 [F]1 [>45]1 [F]1 I-205 Westbound Grant Line Road Merge PM
1 14 B
1 Leisch
1 Leisch
1 Leisch
1 Leisch
AM [>45]1 [F]1 [>45]1 [F]1 [>45]1 [F]1 [>45]1 [F]1 I-205 Westbound Lammers Road Diverge PM
N/A 1 Leisch
1 Leisch
1 Leisch
1 Leisch
AM [>45]1 [F]1 [>45]1 [F]1 [>45]1 [F]1 [>45]1 [F]1 I-205 Westbound Lammers Road Diagonal Merge PM N/A 1 15 B 1 Leisch 1 Leisch 1 16 B
AM [>45]1 [F]1 [>45]1 [F]1 [>45]1 [F]1 I-205 Westbound Lammers Road Loop Merge PM
N/A N/A 1 Leisch
1 Leisch
1 18 B
AM [>45]1 [F]1 [>45]1 [F]1 I-205 Westbound 11th Street Merge PM
1 Leisch
1 Leisch
N/A N/A N/A
Notes: 1. Results presented in brackets are based on FREQ. Based on the FREQ analysis results for No Build conditions these segments are anticipated to be in queue from
the bottleneck that would develop west of Mountain House Parkway. For the project alternatives, the projected volumes west of Mountain House Parkway are also anticipated to result in a bottleneck similar to No Build conditions such that traffic operations would be similar to No Build conditions.

80
Final Traffic Operations Report I-205/Lammers Road Interchange Project May 2009
7. DESIGN YEAR (2035) TRAFFIC OPERATIONS
This chapter presents the results of the traffic operations analysis for Design Year (2035). The operations analysis focuses on intersection, mainline, and ramp operations.
PEAK HOUR TRAFFIC VOLUMES AND LANE CONFIGURATIONS
The intersection peak hour traffic volumes presented in Chapter 4 (Figures 4 through 8) were used to reflect design year (2035) peak hour demand. Figures 20 through 24 present the 2035 intersection traffic control and lane configurations under the No Build alternative and each Build alternative.
The lane configurations at the local intersections assumed the maximum practical widths given the estimated demand. Traffic forecasts developed for this study are highly conservative estimates to ensure that the interchange design would serve traffic demand at acceptable levels of service for a twenty-year life. There are no specific development plans for the local area; therefore key assumptions about local street connections and intersection geometries will not be finalized until traffic studies for specific area development projects are conducted. For this study, assumptions regarding local intersection geometries were made to provide a basis to compare interchange configuration alternatives, with the understanding that the local street design will be established during future studies including individual development project reviews when land uses are specified and local traffic access would be determined.
INTERSECTION OPERATIONS
Table 20 presents the overall LOS and delay for the study intersections under the various alternatives. Delay and LOS by approach is presented in Appendix I. Both the Synchro and Fehr & Peers analysis worksheets are presented in Appendix I. Note that the delay and LOS from Synchro were not used. The Synchro worksheets are provided for informational purposes to present key inputs in the modeling including lanes, volumes, and timings. The results presented in Table 15 are from the Fehr & Peers SimTraffic analysis worksheets, which are the average of 10 SimTraffic model runs.
Under the No Build Alternative, all study intersections are anticipated to operate at unacceptable levels of service (LOS E or worse). PM peak hour system-wide vehicle hours of delay is anticipated to be 3,950 vehicle hours, and only 67% of the traffic demand would be served.
All of the ramp intersections are expected to operate at LOS D or better during both peak hours with the Build Alternatives. PM peak hour system-wide delay would be reduced to less than 50% of the No Build condition. While AM peak hour system-wide delay with either the No Build Alternative or any of the Build Alternatives would be similar. Alternative 1 provides the lowest overall system-wide vehicle delay during the PM peak hour.
Tables 21 through 25 provide 95th percentile queue estimates for the study intersections under No Build and each of the Build alternatives. Under Alternative 1, the northbound through movement 95th percentile queue at Lammers Road/Connection to Byron is estimated to extend back to the Lammers interchange WB Ramps. This may cause merging problems for the WB Off-ramp right turn movement at intermittent periods during the AM peak hour. The southbound through and right turn movements 95th percentile queues at Lammers Road/Commerce Way is estimated to extend back to the Lammers interchange EB Ramps. This may cause delays for the southbound through traffic on the bridge at intermittent periods during the PM peak hour.
Under Alternative 5A, the southbound movements 95th percentile queues at Eleventh Street/Commerce Way is estimated to extend back to the Lammers interchange EB Ramps. This may cause delays for the southbound through traffic on the bridge at intermittent periods during the PM peak hour.

81
Final Traffic Operations Report I-205/Lammers Road Interchange Project May 2009
Under Alternative 5A-VA, the southbound movements 95th percentile queues at Eleventh Street/Commerce Way is estimated to extend back to the Lammers interchange EB Ramps. This may cause delays for the southbound through traffic on the bridge at intermittent periods during the AM and PM peak hours.

Gra
nt L
ine
Rd
TRU
E
6
addgLammers Rd
addg
g
qqeet
qqee
t
TRU
E
TRU
E
addg
qqee
t
7
Commerce WayTR
UE
qqeet
addg
Ele
vent
h S
t
Ele
vent
h S
tTR
UE
TRU
E
adddgg
qqee
t
Lammers Rd
4
qeee t
a dgg
TRU
E
ddg
TRU
E
5
Lammers Rd
agg
ert
Conn
ectio
n to
Byr
on
3
Doe
sN
otE
xist
2
Doe
sN
otE
xist
1
Doe
sN
otE
xist
LEG
END
= T
raffi
c S
igna
l=
“Fre
e” R
ight
Tur
n
D
ESIG
N Y
EAR
(203
5) N
O B
UIL
D A
LTER
NA
TIVE
TRA
FFIC
CO
NTR
OLS
AN
D L
AN
E C
ON
FIG
UR
ATI
ON
S
I-205
/ La
mm
ers
Roa
d In
terc
hang
e
F
igur
e 20
July
200
8W
C06
-228
7_20
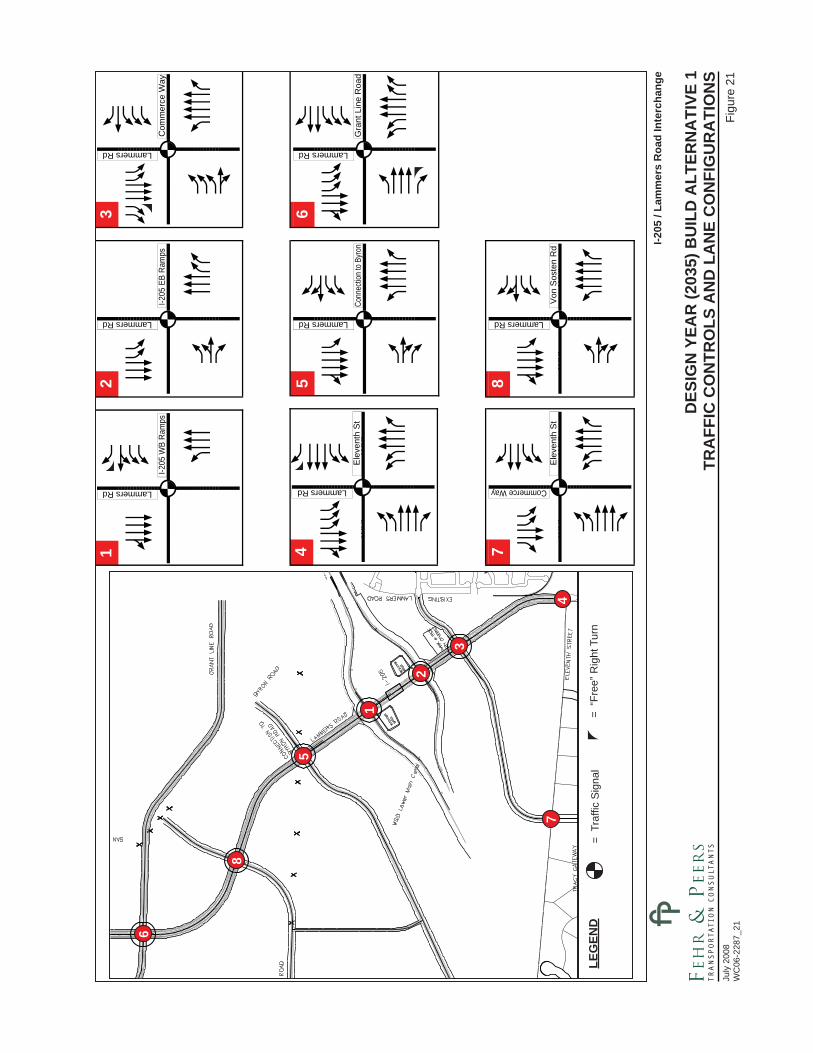
1
2
3
47
5
8
6
qeee
et
TRU
ETR
UE
Lammers Rd
sddd
g
qqrt
8
asg
Von
Sos
ten
Rd
qqee
ett
a dddgLammers Rd
6 sddg
ggTR
UE
qqqeet
TRU
EG
rant
Lin
e R
oad
Lammers Rd
Com
mer
ce W
ayTR
UE
3
sggg
aa dd
dgg
qqqet
qeee
et
TRU
E
TRU
E
adddgg
qqee
et
4
Lammers Rd
TRU
E
qqeee t
sddg
ggE
leve
nth
St
Lammers Rd
TRU
ETR
UE
qeee
1
qqw t
sddd
I-205
WB
Ram
psTR
UE
afg
eeet
t
TRU
E
2
Lammers Rd
dddg
gI-2
05 E
B Ra
mps
TRU
Eqqeetqq
eeet
7
TRU
Eadddgg
Ele
vent
h S
tad
dgg
Commerce Way
Lammers Rdasg
qeee
et
TRU
ETR
UE
5
qqrt
sddd
gCo
nnec
tion
to B
yron
LEG
END
= T
raffi
c S
igna
l=
“Fre
e” R
ight
Tur
n
I-205
/ La
mm
ers
Roa
d In
terc
hang
e
Fig
ure
21Ju
ly 2
008
WC
06-2
287_
21
TRA
FFIC
CO
NTR
OLS
AN
D L
AN
E C
ON
FIG
UR
ATI
ON
S
D
ESIG
N Y
EAR
(203
5) B
UIL
D A
LTER
NA
TIVE
1

1
2
4
5
67
8
9Lammers Rd
Ele
vent
h S
tTR
UE
4
adddg
sdgg
qqeeet
qqee
t
TRU
E
3
Doe
sN
otE
xist
qqee
ert
addgEleventh St
7 sddg
ggTR
UE
qqeet
TRU
EG
rant
Lin
e R
d
Eleventh Stsdg
qeer
TRU
ETR
UE
Von
Sos
ten
Rd
6
qe t
addg
gg
TRU
Eqqert
qqee
eet
8
TRU
E
adgggEleventh St
Com
mer
ce W
ayaa
dddg
gEleventh St
TRU
ETR
UE
eett
1
qqrt
addd
I-205
WB
Ram
psTR
UE
aa fg
eeet
t
TRU
E
2
Eleventh St
addd
I-205
EB
Ram
ps
qqqt
TRU
ETR
UE
qqeee
9
asdd
Ele
vent
h S
t
Tracy Gateway
TRU
E
aadgg
qqee
et
5
Eleventh St
TRU
E
qqqet
addd
ggCo
nnec
tion
to B
yron
LEG
END
= T
raffi
c S
igna
l=
“Fre
e” R
ight
Tur
n
I-205
/ La
mm
ers
Roa
d In
terc
hang
e
F
igur
e 22
July
200
8W
C06
-228
7_22
TRA
FFIC
CO
NTR
OLS
AN
D L
AN
E C
ON
FIG
UR
ATI
ON
S
DES
IGN
YEA
R (2
035)
BU
ILD
ALT
ERN
ATI
VE 5
A

1
2
4
5
67
89
Lammers Rd
Ele
vent
h S
tTR
UE
4
adddg
sdgg
qqeeet
qqee
t
TRU
E
qqee
ert
addgEleventh St
7 sddg
ggTR
UE
qqeet
TRU
EG
rant
Lin
e R
d
Eleventh Stsdg
qeer
TRU
ETR
UE
Von
Sos
ten
Rd
6
qe t
addg
gg
TRU
Eqqert
qqee
eet
8
TRU
E
adgggEleventh St
Com
mer
ce W
ayaa
dddg
gEleventh St
TRU
ETR
UE
eett
1
qqrt
addd
I-205
WB
Ram
psTR
UE
aa fg
eeet
t
TRU
E
2
Eleventh St
dddg
gI-2
05 E
B Ra
mps
3
Doe
sN
otE
xist
qqqt
TRU
ETR
UE
qqeee
9
asdd
Ele
vent
h S
t
Tracy Gateway
TRU
E
aadgg
qqee
et
5
Eleventh St
TRU
E
qqqet
addd
ggCo
nnec
tion
to B
yron
LEG
END
= T
raffi
c S
igna
l=
“Fre
e” R
ight
Tur
n
I-205
/ La
mm
ers
Roa
d In
terc
hang
e
Fig
ure
23Ju
ly 2
008
WC
06-2
287_
23
TRA
FFIC
CO
NTR
OLS
AN
D L
AN
E C
ON
FIG
UR
ATI
ON
S
DES
IGN
YEA
R (2
035)
BU
ILD
ALT
ERN
ATI
VE 5
A-V
A

1
2
3
47
5
8
6
Lammers Rd
Com
mer
ce W
ayTR
UE
3
sggg
aa dd
dgg
qqqet
qeee
et
TRU
E
TRU
E
adddgg
qqee
et
4
Lammers Rd
TRU
E
qqeee t
sddg
ggE
leve
nth
St
qeee
et
TRU
ETR
UE
Lammers Rd
sddd
gg
qqqeet
8
asg
Von
Sos
ten
Rd
qqqe
eett
a dddgLammers Rd
sddg
ggTR
UE
qqqeet
TRU
EG
rant
Lin
e R
d
6
Lammers Rd
TRU
ETR
UE
ert
1
qw t
sddd
I-205
WB
Ram
psTR
UE
ag
eee t
t
TRU
E
2
Lammers Rd
a ddd
I-205
EB
Ram
ps
TRU
Eqqtee
et
7
TRU
E
adddgE
leve
nth
St
ddgg
Commerce Way
Lammers Rdaadg
qeee
et
TRU
ETR
UE
5
qqqet
sddd
ggCo
nnec
tion
to B
yron
LEG
END
= T
raffi
c S
igna
l=
“Fre
e” R
ight
Tur
n
I-205
/ La
mm
ers
Roa
d In
terc
hang
e
Fig
ure
24Ju
ly 2
008
WC
06-2
287_
24
D
ESIG
N Y
EAR
(203
5) B
UIL
D A
LTER
NA
TIVE
6TR
AFF
IC C
ON
TRO
LS A
ND
LA
NE
CO
NFI
GU
RA
TIO
NS

87
Final Traffic Operations Report I-205/Lammers Road Interchange Project May 2009
TABLE 20 DESIGN YEAR (2035) INTERSECTION ANALYSIS 1
Alternative Intersection Peak
Hour Approach-Movement No Build
1 5A 5A-VA 6
NB-L 79/E - - - NB-T 15/B 30/C 29/C 50/D NB-R - 13/B 18/B 24/C SB-T 32/C 23/C 23/C 12/B SB-R 43/D 7/A 8/A 9/A WB-L 59/E 35/C 33/C 74/E WB-R 32/C 19/B 18/B 27/C
AM
Total
-
35/D 24/C 24/C 36/D NB-L >80/F - - - NB-T 10/A 13/B 7/A 23/C NB-R - 4/A 6/A 6/A SB-T 39/D 16/B 12/B 18/B SB-R 49/D 8/A 6/A 23/C WB-L 46/D 69/E 73/E 55/D WB-R 13/B 18/B 20/C 13/B
Lammers Road and I-205 WB Ramps
PM
Total
-
29/C 21/C 20/B 22/C NB-T 8/A 8/A 16/B 9/A NB-R 5/A 6/A 8/A 5/A SB-L 35/D - 47/D - SB-T 25/C 4/D1 24/C 32/C SB-R - 5/A - 6/A EB-L 52/D 57/E 56/E 52/D EB-R 47/D 4/A 4/A 48/D
AM
Total
-
18/B 21/C 18/B 19/B NB-T 14/B 5/A 25/C 8/A NB-R 13/B 7/A 25/C 7/A SB-L 55/E 27/C 51/D 13/B SB-T 22/C 13/B 21/C 13/B EB-L 49/D 56/E 58/E 50/D EB-R 52/D 14/B 14/B 48/D
Lammers Road and I-205 EB Ramps
PM
Total
-
22/C 16/B 26/C 12/B

88
Final Traffic Operations Report I-205/Lammers Road Interchange Project May 2009
TABLE 20 DESIGN YEAR (2035) INTERSECTION ANALYSIS 1
Alternative Intersection Peak
Hour Approach-Movement No Build
1 5A 5A-VA 6
NB-L 49/D 64/E NB-T 20/B 44/D NB-R 12/B 17/B SB-L 41/D 42/D SB-T 14/B 11/B SB-R 9/A 9/A EB-L 56/E 65/E EB-T 59/E 39/D EB-R 17/B 13/B WB-L 44/D 57/E WB-T 56/E 79/E WB-R 24/C 26/C
AM
Total
-
20/C
- -
32/C NB-L 61/E >80/F NB-T 48/D >80/F NB-R 20/B 55/D SB-L >80/F >80/F SB-T 33/C 24/C SB-R 8/A 7/A EB-L >80/F >80/F EB-T >80/F >80/F EB-R >80/F >80/F WB-L >80/F >80/F WB-T >80/F >80/F WB-R >80/F >80/F
Lammers Road and Commerce Way
PM
Total
-
>100/F
- -
>100/F

89
Final Traffic Operations Report I-205/Lammers Road Interchange Project May 2009
TABLE 20 DESIGN YEAR (2035) INTERSECTION ANALYSIS 1
Alternative Intersection Peak
Hour Approach-Movement No Build
1 5A 5A-VA 6
NB-L 56/E 67/E 67/E 66/E 63/E NB-T 45/D 57/E 34/C 35/C 52/D NB-R 4/A 14/B 7/A 7/A 11/B SB-L >80/F 46/D 57/E 56/E 50/D SB-T >80/F 35/C 43/D 47/D 27/C SB-R >80/F 39/D 38/D 38/D 30/C EB-L 60/E >80/F 51/D 61/E 44/D EB-T 19/B 7/A 30/C 26/C 22/C EB-R 4/A 5/A 12/B 13/B 10/A WB-L >80/F 63/E 62/E 63/E >80/F WB-T 78/E 41/D 34/C 34/C 39/D WB-R 46/D 11/B 13/B 14/B 14/B
AM
Total >82/F 41/D 39/D 39/D 41/D NB-L >80/F >80/F 62/E 71/E 80/F NB-T 65/E >80/F 49/D 48/D 80/F NB-R 7/A >80/F 23/C 26/C 80/F SB-L >80/F >80/F 60/E 58/E 80/F SB-T >80/F 24/C 38/D 38/D 26/C SB-R >80/F 29/C 38/D 37/D 32/C EB-L 67/E >80/F 60/E 60/E 80/F EB-T 55/D >80/F 38/D 38/D 80/F EB-R 13/B >80/F 23/C 23/C 80/F WB-L >80/F >80/F 69/E 58/E 80/F WB-T >80/F 47/D 53/D 53/D 47/D WB-R >80/F 9/A 13/B 13/B 8/A
Lammers Road and Eleventh Street
PM
Total >100/F >100/F 43/D 43/D >100/F
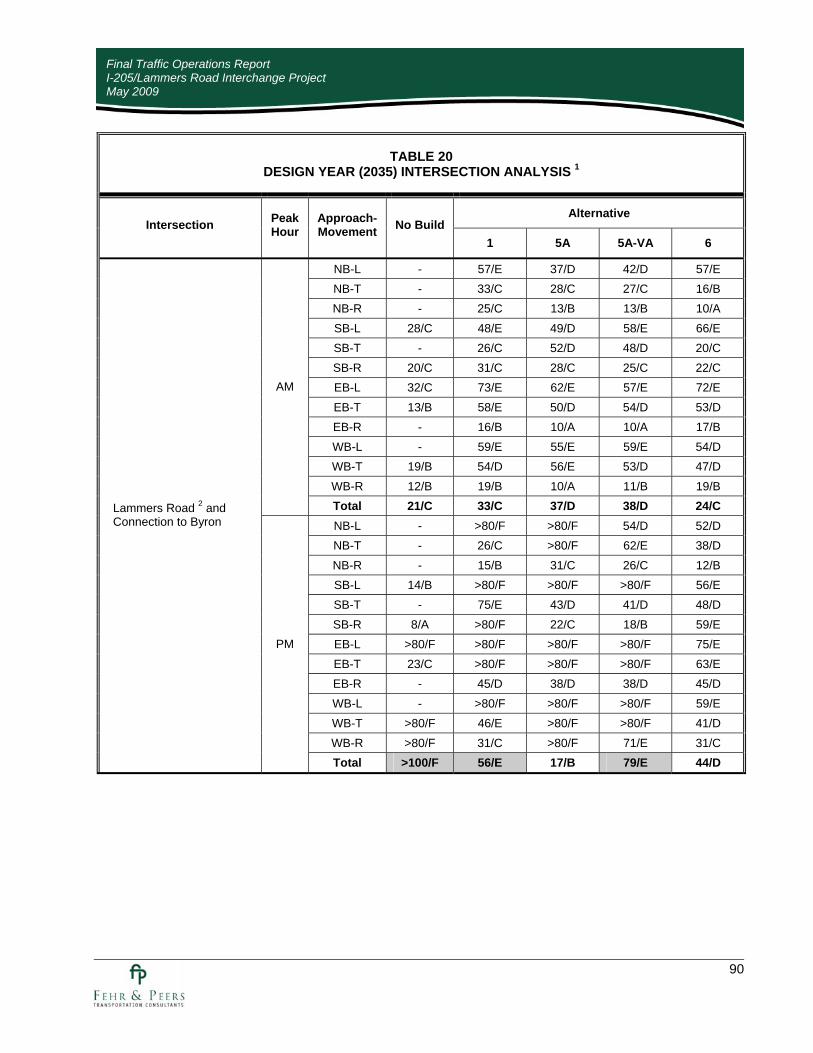
90
Final Traffic Operations Report I-205/Lammers Road Interchange Project May 2009
TABLE 20 DESIGN YEAR (2035) INTERSECTION ANALYSIS 1
Alternative Intersection Peak
Hour Approach-Movement No Build
1 5A 5A-VA 6
NB-L - 57/E 37/D 42/D 57/E NB-T - 33/C 28/C 27/C 16/B NB-R - 25/C 13/B 13/B 10/A SB-L 28/C 48/E 49/D 58/E 66/E SB-T - 26/C 52/D 48/D 20/C SB-R 20/C 31/C 28/C 25/C 22/C EB-L 32/C 73/E 62/E 57/E 72/E EB-T 13/B 58/E 50/D 54/D 53/D EB-R - 16/B 10/A 10/A 17/B WB-L - 59/E 55/E 59/E 54/D WB-T 19/B 54/D 56/E 53/D 47/D WB-R 12/B 19/B 10/A 11/B 19/B
AM
Total 21/C 33/C 37/D 38/D 24/C NB-L - >80/F >80/F 54/D 52/D NB-T - 26/C >80/F 62/E 38/D NB-R - 15/B 31/C 26/C 12/B SB-L 14/B >80/F >80/F >80/F 56/E SB-T - 75/E 43/D 41/D 48/D SB-R 8/A >80/F 22/C 18/B 59/E EB-L >80/F >80/F >80/F >80/F 75/E EB-T 23/C >80/F >80/F >80/F 63/E EB-R - 45/D 38/D 38/D 45/D WB-L - >80/F >80/F >80/F 59/E WB-T >80/F 46/E >80/F >80/F 41/D WB-R >80/F 31/C >80/F 71/E 31/C
Lammers Road 2 and Connection to Byron
PM
Total >100/F 56/E 17/B 79/E 44/D

91
Final Traffic Operations Report I-205/Lammers Road Interchange Project May 2009
TABLE 20 DESIGN YEAR (2035) INTERSECTION ANALYSIS 1
Alternative Intersection Peak
Hour Approach-Movement No Build
1 5A 5A-VA 6
NB-L 65/E 50/D 37/D 37/D 66/E NB-T 29/C 33/C 28/C 28/C 48/D NB-R 7/A 10/B 12/B 12/B 7/A SB-L >80/F 79/E 71/E 75/E 73/E SB-T 38/D 36/D 61/E 68/E 43/D SB-R 10/B 36/D 61/E 66/E 37/D EB-L >80/F >80/F 56/E 62/E >80/F EB-T >80/F 49/D 53/D 51/D 48/D EB-R 26/C 7/A 40/D 36/D 7/A WB-L >80/F 57/E 55/D 56/E 49/D WB-T 47/D 26/C 27/C 25/C 25/C WB-R 23/C 14/B 13/B 12/B 12/B
AM
Total >100/F 42/D 48/D 51/D 43/D NB-L 55/E 63/E >80/F >80/F 61/E NB-T 24/C >80/F 65/E 52/D >80/F NB-R 80/F 28/C 38/D 30/C 21/C SB-L 80/F >80/F >80/F >80/F >80/F SB-T 80/F 76/E >80/F >80/F >80/F SB-R 80/F 79/E >80/F >80/F >80/F EB-L 80/F 66/E 80/F >80/F 74/E EB-T 80/F 58/E 65/E 70/E 52/D EB-R 80/F 11/B 28/C 26/C 10/A WB-L 80/F >80/F >80/F >80/F >80/F WB-T 80/F 30/C 46/D 47/D 28/C WB-R 80/F 16/B 20/B 20/C 14/B
Lammers Road 2 and Grant Line Road
PM
Total >100/F 78/E >100/F >100/F >100/F

92
Final Traffic Operations Report I-205/Lammers Road Interchange Project May 2009
TABLE 20 DESIGN YEAR (2035) INTERSECTION ANALYSIS 1
Alternative Intersection Peak
Hour Approach-Movement No Build
1 5A 5A-VA 6
NB-L 59/E 66/E 73/E 74/E - NB-T 35/C 17/B 25/C 24/C 21/C NB-R 9/A 8/A 4/A 4/A 8/A SB-L 61/E 73/E 52/D 53/D 74/E SB-T 42/D 73/E 31/C 31/C 39/D SB-R 26/C 24/C 15/B 15/B - EB-L 63/E 78/D 53/D 53/D 36/D EB-T 39/D 37/D 55/D 63/E 39/D EB-R 36/D 54/D 10/A 10/A >80/F WB-L >80/F 77/E 49/D 48/D >80/F WB-T >80/F >80/F 61/E 60/E - WB-R >80/F 50/D 36/D 31/C 7/A
AM
Total 76/E 70/E 29/C 29/C 56/E NB-L >80/F >80/F 72/E 72/E - NB-T >80/F >80/F 18/B 19/B >80/F NB-R >80/F >80/F 10/A 10/A >80/F SB-L >80/F 59/E 52/D 57/E >80/F SB-T >80/F 40/D 80/E >80/F 22/C SB-R >80/F 17/B 21/C 25/C - EB-L >80/F >80/F >80/F >80/F >80/F EB-T >80/F >80/F >80/F >80/F >80/F EB-R >80/F 32/C >80/F >80/F 47/D WB-L >80/F >80/F >80/F >80/F >80/F WB-T >80/F >80/F >80/F >80/F - WB-R >80/F >80/F 46/D 66/E >80/F
Eleventh Street and Commerce Way
PM
Total >100/F >100/F >100/F >100/F >100/F
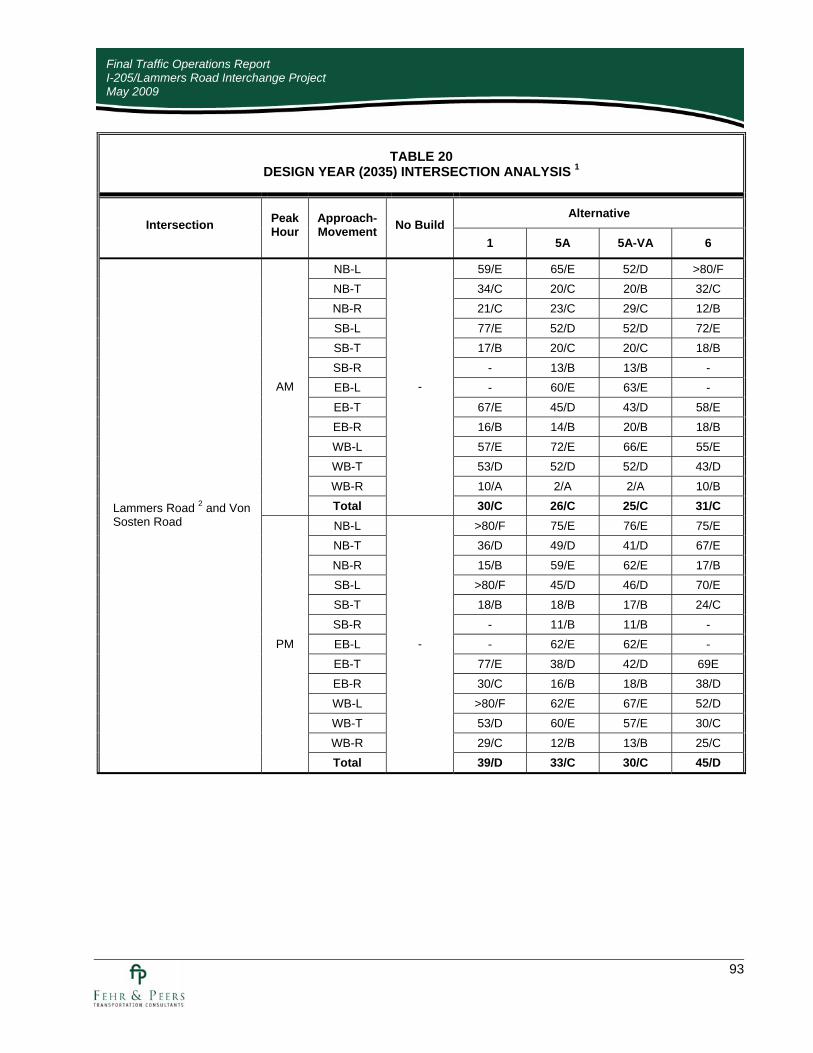
93
Final Traffic Operations Report I-205/Lammers Road Interchange Project May 2009
TABLE 20 DESIGN YEAR (2035) INTERSECTION ANALYSIS 1
Alternative Intersection Peak
Hour Approach-Movement No Build
1 5A 5A-VA 6
NB-L 59/E 65/E 52/D >80/F NB-T 34/C 20/C 20/B 32/C NB-R 21/C 23/C 29/C 12/B SB-L 77/E 52/D 52/D 72/E SB-T 17/B 20/C 20/C 18/B SB-R - 13/B 13/B - EB-L - 60/E 63/E - EB-T 67/E 45/D 43/D 58/E EB-R 16/B 14/B 20/B 18/B WB-L 57/E 72/E 66/E 55/E WB-T 53/D 52/D 52/D 43/D WB-R 10/A 2/A 2/A 10/B
AM
Total
-
30/C 26/C 25/C 31/C NB-L >80/F 75/E 76/E 75/E NB-T 36/D 49/D 41/D 67/E NB-R 15/B 59/E 62/E 17/B SB-L >80/F 45/D 46/D 70/E SB-T 18/B 18/B 17/B 24/C SB-R - 11/B 11/B - EB-L - 62/E 62/E - EB-T 77/E 38/D 42/D 69E EB-R 30/C 16/B 18/B 38/D WB-L >80/F 62/E 67/E 52/D WB-T 53/D 60/E 57/E 30/C WB-R 29/C 12/B 13/B 25/C
Lammers Road 2 and Von Sosten Road
PM
Total
-
39/D 33/C 30/C 45/D

94
Final Traffic Operations Report I-205/Lammers Road Interchange Project May 2009
TABLE 20 DESIGN YEAR (2035) INTERSECTION ANALYSIS 1
Alternative Intersection Peak
Hour Approach-Movement No Build
1 5A 5A-VA 6
NB-L 38/D 38/D NB-R 3/A 3/A EB-T 21/C 21/C EB-R 9/A 9/A WB-L 56/E 54/D WB-T 13/B 13/B
AM
Total
- -
23/C 22/C
-
NB-L >80/F >80/F NB-R 36/D 35/C EB-T 21/C 21/C EB-R 12/B 12/B WB-L 48/D 45/D WB-T 27/C 28/C
Eleventh Street and Tracy Gateway
PM
Total
- -
39/D 38/D
-
AM 300 390 330 330 380 System-Wide Vehicle Delay (vehicle hours) 3
PM 3,950 1,590 1,890 1,870 1,920 AM 100% 100% 100% 100% 100% System-Wide Percent
Demand Served PM 67% 88% 88% 88% 84%
Notes: Shading denotes locations where level of service threshold is exceeded. 1. Delay (seconds per vehicle) / level of service (LOS). 2. Lammers Road is Eleventh Street under Alternatives 5A and 5A-VA 3. System-wide vehicle delay calculated by adding up each intersection’s vehicle delay which is computed by multiplying the
demand volume by the intersection delay. Source: Fehr & Peers, 2008.
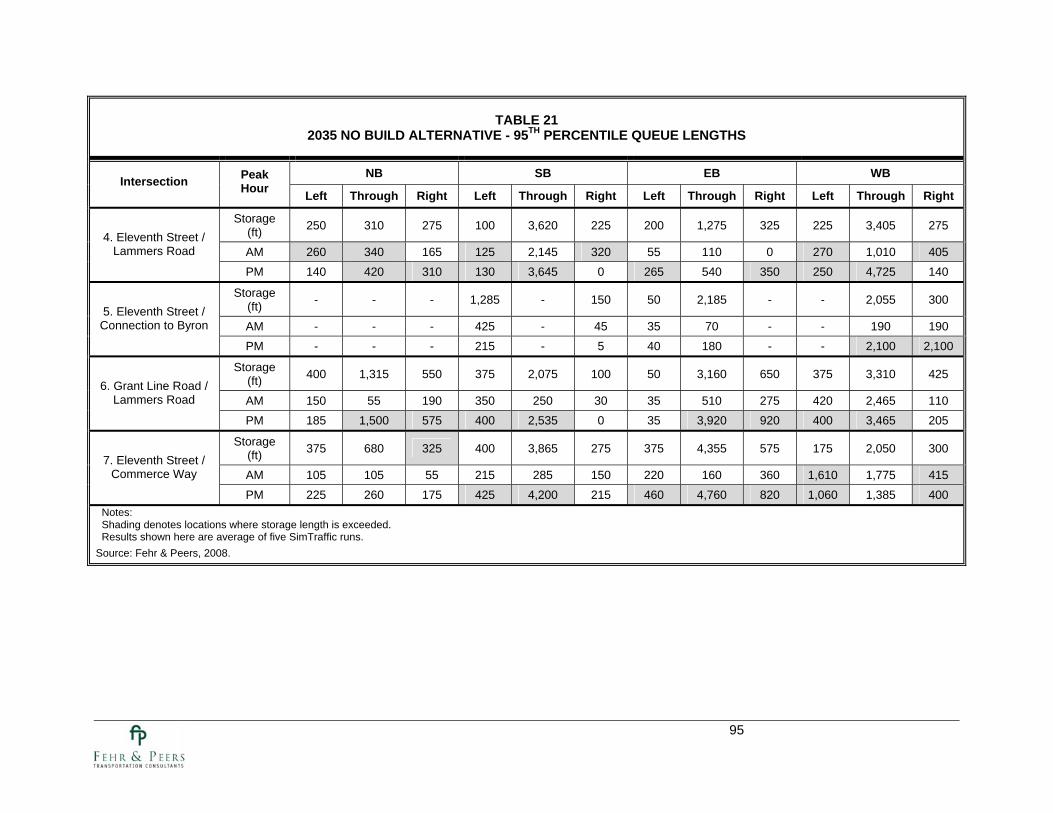
95
TABLE 21 2035 NO BUILD ALTERNATIVE - 95TH PERCENTILE QUEUE LENGTHS
NB SB EB WB Intersection Peak
Hour Left Through Right Left Through Right Left Through Right Left Through Right
Storage (ft) 250 310 275 100 3,620 225 200 1,275 325 225 3,405 275
AM 260 340 165 125 2,145 320 55 110 0 270 1,010 405 4. Eleventh Street /
Lammers Road
PM 140 420 310 130 3,645 0 265 540 350 250 4,725 140
Storage (ft) - - - 1,285 - 150 50 2,185 - - 2,055 300
AM - - - 425 - 45 35 70 - - 190 190 5. Eleventh Street / Connection to Byron
PM - - - 215 - 5 40 180 - - 2,100 2,100
Storage (ft) 400 1,315 550 375 2,075 100 50 3,160 650 375 3,310 425
AM 150 55 190 350 250 30 35 510 275 420 2,465 110 6. Grant Line Road /
Lammers Road
PM 185 1,500 575 400 2,535 0 35 3,920 920 400 3,465 205
Storage (ft) 375 680 325 400 3,865 275 375 4,355 575 175 2,050 300
AM 105 105 55 215 285 150 220 160 360 1,610 1,775 415 7. Eleventh Street /
Commerce Way
PM 225 260 175 425 4,200 215 460 4,760 820 1,060 1,385 400 Notes: Shading denotes locations where storage length is exceeded. Results shown here are average of five SimTraffic runs.
Source: Fehr & Peers, 2008.

96
TABLE 22 2035 ALTERNATIVE 1 - 95TH PERCENTILE QUEUE LENGTHS
NB SB EB WB Intersection Peak
Hour Left Through Right Left Through Right Left Through Right Left Through Right
Storage (ft) 300 975 - - 1,040 - - - 2,180 475
AM 200 255 - - 525 - - - 980 165 1. Lammers Road/I-205
Westbound Ramps PM 70 175 - - 795 - - - 260 0
Storage (ft) - 625 500 975 975 - 2,250 200 - - -
AM - 175 120 640 925 - 90 55 - - - 2. Lammers Road / I-
205 Eastbound Ramps PM - 270 360 380 740 - 145 185 - - -
Storage (ft) 200 1,665 600 500 625 400 3,205 3,205 965 965 500
AM 65 170 50 130 250 0 135 55 50 155 140 3. Lammers Road /
Commerce Way PM 75 415 220 385 640 465 3,990 4,070 1,170 1,320 700
Storage (ft) 300 2,400 350 600 1,665 500 1,475 300 300 3,375 600
AM 80 560 150 100 455 65 65 20 210 415 0 4. Lammers Road /
Eleventh Street PM 65 2,025 555 385 525 665 1,275 465 445 1,255 0
Storage (ft) 500 1,040 400 500 1,435 300 995 400 860 860 400
AM 400 1,295 190 420 280 40 95 95 60 115 115 5. Lammers Road / Connection to Byron
PM 285 500 55 545 975 35 330 330 250 340 340
Storage (ft) 450 1,075 1,075 500 2,055 300 3,150 600 3,260 3,260 400
AM 160 265 60 250 255 35 155 0 300 165 140 6. Lammers Road /
Grant Line Road PM 390 875 865 400 710 20 255 50 1,435 1,055 1450
Storage (ft) 400 675 400 400 3,205 3,205 400 4,350 600 1,810 1,810 300
AM 95 85 35 125 970 510 80 120 515 1,075 1,100 285 7. Eleventh Street /
Commerce Way PM 505 815 450 200 225 130 615 4,240 205 595 1,975 515
Storage (ft) 500 1,435 500 500 1,075 300 1,020 400 400 795 400
AM 490 455 225 415 260 0 75 75 60 80 80 8. Lammers Road / Von
Sosten Road PM 420 525 115 450 430 0 190 190 280 260 260
Notes: Shading denotes locations where storage length is exceeded. Results shown here are average of five SimTraffic runs.
Source: Fehr & Peers, 2008.

97
TABLE 23 2035 ALTERNATIVE 5A - 95TH PERCENTILE QUEUE LENGTHS
NB SB EB WB Intersection Peak
Hour Left Through Right Left Through Right Left Through Right Left Through Right
Storage (ft) - 1,280 750 - 1,105 325 - - - 2,130 2,130
AM - 490 465 - 215 55 - - - 580 415 1. Eleventh Street / I-
205 Westbound Ramps PM - 285 55 - 385 85 - - - 475 205
Storage (ft) - 1,010 600 - 1,280 1,000 1,880 1,000 - - -
AM - 120 30 - 800 210 90 55 - - - 2. Eleventh Street / I-
205 Eastbound Ramps PM - 100 140 - 545 280 220 305 - - -
Storage (ft) 250 2,395 400 2,145 2,145 375 1,390 425 300 3,395 300
AM 265 225 30 40 235 135 165 40 320 530 110 4. Eleventh Street /
Lammers Road PM 75 265 195 305 375 300 320 175 270 405 105
Storage (ft) 650 1,105 650 600 1,505 300 300 1,790 1,790 1,255 1,255 500
AM 455 310 165 220 400 325 50 130 65 80 130 55 5. Eleventh Street / Connection to Byron
PM 445 665 420 720 870 120 360 1,115 1,020 980 1,035 495
Storage (ft) 200 1,505 1,020 1,020 300 400 2,800 300 1,235 1,235
AM 40 180 460 600 110 135 55 35 144 0 6. Eleventh Street / Von Sosten Road
PM 65 730 520 655 55 315 75 70 190 310
Storage (ft) 400 1,020 1,020 2,140 2,140 300 3,320 300 2,965 2,965 300
AM 50 200 200 245 555 55 100 255 370 25 185 7. Eleventh Street /
Grant Line Road PM 500 935 865 2,545 2,478 120 185 230 365 150 185
Storage (ft) 500 570 425 600 1,010 1,010 1,545 1,545 500 400 1,595 600
AM 220 400 65 135 1,255 0 230 45 70 70 170 170 8. Eleventh Street /
Commerce Way PM 280 205 130 645 1,265 1,110 1,589 1,570 1,830 255 355 355
Storage (ft) 500 - 750 - - - - 570 300 1,390 -
AM 315 - 20 - - - - 185 250 260 - 9. Eleventh Street /
Tracy Gateway PM 735 - 615 - - - - 365 90 360 -
Notes: Shading denotes locations where storage length is exceeded. Results shown here are average of five SimTraffic runs.
Source: Fehr & Peers, 2008.

98
TABLE 24 2035 ALTERNATIVE 5A-VA - 95TH PERCENTILE QUEUE LENGTHS
NB SB EB WB Intersection Peak
Hour Left Through Right Left Through Right Left Through Right Left Through Right
Storage (ft) - 1,290 1,290 - 1,105 325 - - - 2,130 2,130
AM - 780 1,180 - 220 55 - - - 645 480 1. Eleventh Street / I-
205 Westbound Ramps PM - 60 40 - 285 75 - - - 495 285
Storage (ft) - 1,010 600 600 1,290 - 1,890 1,000 - - -
AM - 320 95 115 495 - 105 0 - - - 2. Eleventh Street / I-
205 Eastbound Ramps PM - 340 350 470 475 - 200 415 - - -
Storage (ft) 250 2,395 400 2,145 2,145 375 1,390 425 300 3,395 300
AM 255 165 35 40 230 125 155 40 320 585 135 4. Eleventh Street /
Lammers Road PM 80 255 225 285 370 310 325 180 260 420 110
Storage (ft) 650 1,105 650 600 1,505 300 300 1,790 1,790 1,255 1,255 500
AM 530 360 165 265 330 290 45 120 60 90 120 55 5. Eleventh Street / Connection to Byron
PM 280 495 405 585 510 100 295 970 865 765 720 480
Storage (ft) 200 1,505 1,020 1,020 300 400 2,800 300 1,235 1,235
AM 35 200 455 590 90 125 55 35 140 0 6. Eleventh Street / Von Sosten Road
PM 105 640 510 620 25 315 135 75 215 175
Storage (ft) 400 1,020 1,020 2,140 2,140 300 3,320 300 2,965 2,965 300
AM 50 200 200 345 605 70 95 250 415 20 155 7. Eleventh Street /
Grant Line Road PM 455 770 630 2,560 2,375 155 175 225 405 150 185
Storage (ft) 500 570 425 600 1,010 1,010 1,545 1,545 500 400 1,595 600
AM 255 410 65 145 1,175 120 240 55 55 70 155 155 8. Eleventh Street /
Commerce Way PM 275 215 125 715 1,300 1,200 1,595 1,575 1,820 250 515 515
Storage (ft) 500 - 750 - - - - 570 300 1,390 -
AM 315 - 20 - - - - 160 255 270 - 9. Eleventh Street /
Tracy Gateway PM 815 - 65 - - - - 405 65 350 -
Notes: Shading denotes locations where storage length is exceeded. Results shown here are average of five SimTraffic runs.
Source: Fehr & Peers, 2008.

99
TABLE 25 2035 ALTERNATIVE 6 - 95TH PERCENTILE QUEUE LENGTHS
NB SB EB WB Intersection Peak
Hour Left Through Right Left Through Right Left Through Right Left Through Right
Storage (ft) - 1,205 - 750 - - - 2,325 625
AM - 755 - 180 - - - 1,195 475 1. Lammers Road/I-205
Westbound Ramps PM - 480 - 475 - - - 410 40
Storage (ft) - 700 500 - 1,205 1,205 1,900 - 225 - - -
AM - 155 0 - 905 90 150 - 50 - - - 2. Lammers Road / I-
205 Eastbound Ramps PM - 125 5 - 405 0 255 - 195 - - -
Storage (ft) 200 1,700 600 500 700 400 3,225 3,225 1,025 1,025 500
AM 110 515 90 130 150 0 245 65 45 175 175 3. Lammers Road /
Commerce Way PM 165 1,540 890 290 420 50 3,725 3,720 1,225 1,335 625
Storage (ft) 300 2,405 600 600 1,700 500 1,470 300 300 3,380 600
AM 60 660 75 115 325 70 110 25 340 425 0 4. Lammers Road /
Eleventh Street PM 30 2,755 1,135 330 525 665 1,335 430 450 1,245 0
Storage (ft) 400 750 500 600 1,515 300 1,070 400 500 850 600
AM 375 570 55 175 235 35 70 90 65 95 65 5. Lammers Road / Connection to Byron
PM 40 545 140 240 645 40 190 215 255 130 365
Storage (ft) 450 1,030 1,030 400 2,045 300 3,140 600 2,965 2,965 400
AM 180 260 50 205 290 25 135 0 275 155 120 6. Lammers Road /
Grant Line Road PM 315 765 480 540 2,705 25 250 0 1,935 1,435 115
Storage (ft) - 785 400 3,225 3,225 - 400 4,375 600 1,875 - 1,875
AM - 105 40 60 570 - 90 685 695 305 - 50 7. Eleventh Street /
Commerce Way PM - 980 635 270 180 - 620 4,690 400 1,285 - 1,379
Storage (ft) 400 1,515 600 400 1,030 300 890 400 400 770 600
AM 410 510 180 215 265 0 80 80 55 55 45 8. Lammers Road / Von
Sosten Road PM 145 880 250 185 390 0 265 265 245 70 285
Notes: Shading denotes locations where storage length is exceeded. Results shown here are average of five SimTraffic runs.
Source: Fehr & Peers, 2008.

100
Final Traffic Operations Report I-205/Lammers Road Interchange Project May 2009
MAINLINE AND RAMP ANALYSIS
HCM Methodology/Leisch Method
Each mainline segment and ramp junction on I-205 was analyzed based on the design year (2035) volumes shown on Figures 4 through 8. Tables 26 and 27 (Mainline/Weaving Segment Analysis) and Table 28 (Ramp Merge/Diverge Analysis) summarize the results. Calculations are presented in Appendix J.
During the AM peak hour, all of the westbound mainline segments are anticipated to operate at LOS E or F under No Build conditions. The HCM analysis result for westbound I-205 between Grant Line Road and Eleventh Street indicates LOS C. However, this result does not take into consideration the queuing impacts of a downstream bottleneck. Under each of the Build Alternatives, mainline operations are anticipated to be similar to the No Build Alternative.
During the PM peak hour, eastbound I-205 west of Eleventh Street is anticipated to operate at LOS F under No Build conditions. The segments east of Eleventh Street are expected to operate at LOS D or better. However, these results do not take into consideration the queuing impacts of a downstream bottleneck. The construction of a new interchange would degrade eastbound mainline operations to LOS E or F east of the proposed interchange.
FREQ Analysis
In consideration of the fact that the HCM methodology does not take into consideration the effect of bottlenecks on mainline operations, two FREQ models (westbound AM and eastbound PM) were developed for No Project conditions to provide a better understanding of traffic operations during these peak periods. The limits of the westbound AM model are from east of Grant Line Road to west of Mountain House Parkway. The limits of the eastbound PM model are from west of Mountain House Parkway to east of Traffic Boulevard. The FREQ models assumed three mixed flow lanes and one HOV lane in each direction of travel and ramp metering.
The results of the FREQ analysis are presented in brackets in Tables 26, 27, and 28, while the detailed calculations are presented in Appendix K. The results of the FREQ analysis indicate that a bottleneck would develop in the westbound AM direction west of Mountain House Parkway. The bottleneck would result in a vehicle queue that would extend past Grant Line Road resulting in LOS F conditions from Mountain House Parkway to east of Grant Line Road. In the eastbound PM direction, a bottleneck would develop east of the Tracy Boulevard interchange. The bottleneck would result in a vehicle queue that would extend to 11th Street resulting in LOS F conditions from 11th Street to Tracy Boulevard.
Based on the projected volumes the westbound AM bottleneck west of Mountain House Parkway and the eastbound PM bottleneck east of Tracy Boulevard are anticipated to occur with or without the project. Therefore, I-205 is also anticipated to operate at LOS F conditions from Mountain House Parkway to east of Grant Line Road in the westbound AM and from Mountain House Parkway to Tracy Boulevard in the eastbound PM under all of the project alternatives.

101
TABLE 26 2035 AM
MAINLINE/WEAVING SEGMENT LEVELS OF SERVICE
2035 No Build
2035 Alt 1
2035 Alt 5A
2035 Alt 5A-VA
2035 ALT 6 Mainline Segment # of
Lanes Truck
% Vol 1 Density LOS Vol1 Density LOS Vol1 Density LOS Vol1 Density LOS Vol1 Density LOS
I-205 Eastbound Mountain House Parkway to 11th St. 3 18% 2,502 Leisch A 2,493 Leisch A 2,484 Leisch A
I-205 Eastbound 11th Street to Lammers Road 3 18% 1,726 9 A
2,401 Leisch A 2,401 Leisch A 1,717 9 A
I-205 Eastbound Lammers Road to Grant Line Road 3 18%
1,634 9 A 2,483 Leisch A 2,364 13 B 2,364 13 B 2,529 14 A
I-205 Eastbound East of Grant Line Road 3 18% 2,840 16 B 3,241 18 B 3,131 17 B 3,131 17 B 3,205 18 B
I-205 Westbound East of Grant Line Road 3 7% 6,000 [>45]2 [F]2 6,000 [>45]2 [F]2 6,000 [>45]2 [F]2 6,000 [>45]2 [F]2 6,000 [>45]2 [F]2
I-205 Westbound Grant Line Road to Lammers Road 3 7% 5,793 [>45]2 [F]2 6,099 [>45]2 [F]2 6,099 [>45]2 [F]2 5,923 [>45]2 [F]2
I-205 Westbound Lammers Road to 11th Street 3 7%
4,847 [>45]2 [F]2 4,687 [>45]2 [F]2
I-205 Westbound 11th Street to Mountain House Pkwy. 3 7% 7,209 [>45]2 [F]2 6,652 [>45]2 [F]2
6,015 [>45]2 [F]2 6,015 [>45]2 [F]2 5,784 [>45]2 [F]2
Notes: 1. Volume on mixed flow lanes only. 2. Results presented in brackets are based on FREQ. Based on the FREQ analysis results for No Build conditions these segments are anticipated to be in queue from the
bottleneck that would develop west of Mountain House Parkway. For the project alternatives, the projected volumes west of Mountain House Parkway are also anticipated to result in a bottleneck similar to No Build conditions such that traffic operations would be similar to No Build conditions.

102
TABLE 27 2035 PM
MAINLINE/WEAVING SEGMENT LEVELS OF SERVICE
2035 No Build
2035 Alt 1
2035 Alt 5A
2035 Alt 5A-VA
2035 ALT 6 Mainline Segment # of
Lanes Truck
% Vol 1 Density LOS Vol 1 Density LOS Vol 1 Density LOS Vol 1 Density LOS Vol 1 Density LOS
I-205 Eastbound Mountain House Parkway to 11th St. 3 5% 5,857 [>45]2 [F]2 5,844 [>45]2 [F]2 5,829 [>45]2 [F]2
I-205 Eastbound 11th Street to Lammers Road 3 5% 4,219 [>45]2 [F]2
5,769 [>45]2 [F]2 5,769 [>45]2 [F]2 4,161 [>45]2 [F]2
I-205 Eastbound Lammers Road to Grant Line Road 3 5%
4,044 [>45]2 [F]2 5,879 [>45]2 [F]2 6,722 [>45]2 [F]2 6,722 [>45]2 [F]2 6,386 [>45]2 [F]2
I-205 Eastbound East of Grant Line Road 3 5% 5,914 [>45]2 [F]2 6,923 [>45]2 [F]2 7,491 [>45]2 [F]2 7,491 [>45]2 [F]2 7,122 [>45]2 [F]2
I-205 Westbound East of Grant Line Road 3 11% 3,260 17 B 3,767 20 C 3,904 20 C 3,904 20 C 4,021 21 C
I-205 Westbound Grant Line Road to Lammers Road 3 11% 3,695 Leisch B 4,058 Leisch C 4,058 Leisch C 4,048 Leisch C
I-205 Westbound Lammers Road to 11th Street 3 11%
2,346 12 B 2,735 14 B
I-205 Westbound 11th Street to Mountain House Pkwy. 3 11% 4,003 Leisch C 3,994 Leisch C
3,677 142 143 3,677 143 B 3,568 143 B
Notes: 1. Volume on mixed flow lanes only. 2. Results presented in brackets are based on FREQ. Based on the FREQ analysis results for No Build conditions these segments are anticipated to be in queue from the
bottleneck that would develop east of Tracy Boulevard. For the project alternatives, the projected volumes east of Tracy Boulevard are also anticipated to result in a bottleneck similar to No Build conditions such that traffic operations would be similar to No Build conditions.
3. The distance between the Lammers On-Ramp and the Mountain House Parkway Off-Ramp is approximately 1.6 miles, which is well outside the realm of the weaving analysis. This section was evaluated using basic freeway segment analysis with auxiliary lane considered a fourth lane.

103
TABLE 28 2035 RAMP MERGE/DIVERGE ANALYSIS
2035 No Build
2035 Alt 1
2035 Alt 5A
2035 Alt 5A-VA
2035 ALT 6 Ramp Merge/Diverge Peak
Hour # of Lanes on Ramp Density LOS # of Lanes
on Ramp Density LOS # of Lanes on Ramp Density LOS # of Lanes
on Ramp Density LOS # of Lanes on Ramp Density LOS
AM Leisch Leisch Leisch I-205 Eastbound 11th Street Diverge PM
2 [>45]1 [F]1 2
[>45]1 [F]1 N/A N/A 2 [>45]1 [F]1
AM 11 B Leisch Leisch 11 B I-205 Eastbound Lammers Road Diverge PM
N/A 1 [>45]1 [F]1
2 [>45]1 [F]1 2
[>45]1 [F]1 1 [>45]1 [F]1
AM Leisch 16 B 17 B Leisch I-205 Eastbound Lammers Road Diagonal Merge PM
N/A 1 [>45]1 [F]1
1 [>45]1 [F]1
1 [>45]1 [F]1
1 [>45]1 [F]1
AM Leisch 11 B Leisch I-205 Eastbound Lammers Road Loop Merge PM
N/A 1 [>45]1 [F]1
1 [>45]1 [F]1
N/A 1 [>45]1 [F]1
AM 15 B Leisch 20 B 20 B Leisch I-205 Eastbound Grant Line Diverge PM
1 [>45]1 [F]1 1
[>45]1 [F]1 1
[>45]1 [F]1 1
[>45]1 [F]1 1
[>45]1 [F]1 AM 21 C 22 C 22 C 22 C 22 C I-205 Eastbound
Grant Line Merge PM 1
[>45]1 [F]1 1 [>45]1 [F]1
1 [>45]1 [F]1
1 [>45]1 [F]1
1 [>45]1 [F]1
AM [>45]2 [F]2 [>45]2 [F]2 [>45]2 [F]2 [>45]2 [F]2 [>45]2 [F]2 I-205 Westbound Naglee Road Diverge PM
2 22 C
2 11 B
2 12 B
2 12 B
2 13 B
AM [>45]2 [F]2 [>45]2 [F]2 [>45]2 [F]2 [>45]2 [F]2 [>45]2 [F]2 I-205 Westbound Naglee Road Merge PM
1 14 B
1 22 C
1 24 C
1 24 C
1 24 C
AM [>45]2 [F]2 [>45]2 [F]2 [>45]2 [F]2 [>45]2 [F]2 [>45]2 [F]2 I-205 Westbound Grant Line Road Merge PM
1 14 B
1 Leisch
1 Leisch
1 Leisch
1 Leisch
AM [>45]2 [F]2 [>45]2 [F]2 [>45]2 [F]2 [>45]2 [F]2 I-205 Westbound Lammers Road Diverge PM
N/A 1 Leisch
1 Leisch
1 Leisch
1 Leisch
AM [>45]2 [F]2 [>45]2 [F]2 [>45]2 [F]2 [>45]2 [F]2 I-205 Westbound Lammers Road Diagonal Merge PM N/A 1 17 B 1 Leisch 1 Leisch 1 18 B
AM [>45]2 [F]2 [>45]2 [F]2 [>45]2 [F]2 I-205 Westbound Lammers Road Loop Merge PM
N/A N/A 1 Leisch
1 Leisch
1 20 C
AM [>45]2 [F]2 [>45]2 [F]2 I-205 Westbound 11th Street Merge PM
1 Leisch
1 Leisch
N/A N/A N/A
1. Results presented in brackets are based on FREQ. Based on the FREQ analysis results for No Build conditions these segments are anticipated to be in queue from the bottleneck that would develop east of Tracy Boulevard. For the project alternatives, the projected volumes east of Tracy Boulevard are also anticipated to result in a bottleneck similar to No Build conditions such that traffic operations would be similar to No Build conditions.
2. Results presented in brackets are based on FREQ. Based on the FREQ analysis results for No Build conditions these segments are anticipated to be in queue from the bottleneck that would develop west of Mountain House Parkway. For the project alternatives, the projected volumes west of Mountain House Parkway are also anticipated to result in a bottleneck similar to No Build conditions such that traffic operations would be similar to No Build conditions.

104
Final Traffic Operations Report I-205/Lammers Road Interchange Project May 2009
8. IMPACTS AND MITIGATION
INTERSECTIONS
The lane configurations at the local intersections assumed the maximum practical widths given the estimated demand. Traffic forecasts developed for this study (see Chapter 4) are highly conservative estimates to ensure that the interchange design would serve traffic demand at acceptable levels of service for a twenty-year life. At this time, there are no specific development plans for the local area; therefore key assumptions about the local street connections and intersection geometries will not be finalized until traffic studies for specific area development projects are conducted. For this study, assumptions regarding local intersection geometries were made to provide a basis to compare interchange configuration alternatives, with the understanding that the local street design will be established during future studies including individual development project reviews when land uses are specified and local traffic access would be determined.
As analyzed in this report, impacts to local intersections are significant and unavoidable.
Under Alternative 1, there are potential vehicle queue spillback impacts from adjacent local street intersections to the Lammers Road/I-205 Westbound Ramps intersection. The 95th percentile queue at the Lammers Road/Connection to Byron intersection for the northbound through movement is estimated to extend back 1,295 feet during the AM peak hour. The final location of this local intersection has not been determined and this analysis indicates that the placement of the Lammers Road/Connection to Byron intersection at least 1,295 feet north of the Lammers Road/I-205 Westbound Ramps intersection would mitigate potential impacts due to queuing.
Under Alternative 1, there are potential vehicle queue spillback impacts from adjacent local street intersections to the Lammers Road/I-205 Eastbound Ramps intersection. The 95th percentile queue at the Lammers Road/Commerce Way intersection for the southbound through movement is estimated to extend back 640 feet during the PM peak hour. The final location of this local intersection has not been determined and this analysis indicates that the placement of the Lammers Road/Commerce Way intersection at least 640 feet south of the Lammers Road/I-205 Eastbound Ramps intersection would mitigate potential impacts due to queuing.
Under Alternative 5A, there are potential vehicle queue spillback impacts from adjacent local street intersections to the Lammers Road/I-205 Eastbound Ramps intersection. The 95th percentile queue at the Eleventh Street/Commerce Way intersection for the southbound through movement is estimated to extend back 1,265 feet during the PM peak hour. The final location of this local intersection has not been determined and this analysis indicates that the placement of the Eleventh Street/Commerce Way intersection at least 1,265 feet south of the Lammers Road/I-205 Eastbound Ramps intersection would mitigate potential impacts due to queuing.
Under Alternative 5A-VA, there are potential vehicle queue spillback impacts from adjacent local street intersections to the Lammers Road/I-205 Eastbound Ramps intersection. The 95th percentile queue at the Eleventh Street/Commerce Way intersection for the southbound through movement is estimated to extend back 1,300 feet during the PM peak hour. The final location of this local intersection has not been determined and this analysis indicates that the placement of the Eleventh Street/Commerce Way intersection at least 1,300 feet south of the Lammers Road/I-205 Eastbound Ramps intersection would mitigate potential impacts due to queuing.
Due to the uncertainty of the development plans for the local area, the final location of the local street intersections can be modified from this analysis based on queuing analysis results from detailed traffic studies

105
Final Traffic Operations Report I-205/Lammers Road Interchange Project May 2009
prepared for the local development projects. The local street intersections should be placed at locations where vehicle queues do not impact traffic operations at the Lammers Road/I-205 interchange.
MAINLINE AND RAMPS
I-205 is anticipated to operate at LOS F in the westbound AM and eastbound PM directions under No Project conditions. Under Project conditions, I-205 would continue to operate at LOS F conditions in the westbound AM and eastbound PM directions. No mainline impacts are anticipated to occur with the project alternatives.

106
Final Traffic Operations Report I-205/Lammers Road Interchange Project May 2009
9. RAMP METERING
The San Joaquin Council of Governments (SJCOG) recently prepared a ramp metering and HOV lane master plan. The results are documented in the Northern San Joaquin Valley Regional Ramp Metering and High Occupancy Vehicle (HOV) Lane Master Plan (December 24, 2008). This report identified the need to provide ramp metering on I-205 in the future to improve mainline operations. Ramp metering benefits mainline operations because it restricts traffic flow onto the mainline to a specified amount, thus minimizing impacts from on-ramp traffic. However, by limiting traffic flow onto the mainline, ramp metering can result in vehicle queues on the ramp that may extend back to the local street system and impact its operations. For this reason, metering rates are often set to the lowest rate that achieves improved mainline operations while not allowing the formation of queues that affect the local street system. Ramp metering impacts on the local street system vary depending on the amount of vehicle storage provided on the ramp itself. The more vehicles that can be stored on the ramp, the lower the metering rates that can be used before queuing impacts occur and the greater the benefit to the mainline. Ramp metering is intended to encourage short-distance travelers to use alternate local streets instead of the freeway. The net effect of this redistribution often results in balanced delays across all ramps in a corridor and less overall demand on the freeway. The following is an excerpt from the SJCOG Ramp Metering and HOV Master Plan (page 83): The objective of this Master Plan was to identify those segments where ramp metering would be appropriate and provide direction for potential implementation. To this end, it is recommended that the ramp metering strategy for the North San Joaquin Valley Region incorporate the following principles:
• Caltrans and local jurisdictions should enter into a ramp meter operating agreement that covers topics such as the monitoring of meter operations, acceptable level of impact to local streets, and actions to be taken if the impacts exceed acceptable levels.
• HOV preferential lanes shall be provided where feasible.
• Ramp improvements (i.e. widening at the meter or additional storage) should be implemented where
feasible to enhance the effectiveness of ramp metering and minimize impacts to local streets.
• Ramp meter queues should be limited to the storage capacity of the on-ramps plus any dedicated lane accessing the ramp, and that queues not be allowed to routinely spill back onto the adjacent arterial.
• Queue spillback detectors should be installed at the upstream end of ramps to minimize the
occurrence of meter queues spilling back onto local streets. Where and when queues exceed the maximum storage capacity, meters should be programmed to operate at a higher rate or in “all green” mode until the queue dissipates to a level within the capacity limit.
• Where and when demand exceeds maximum metering capacity, meters should operate in “all green”
mode to avoid excessive queuing.
• Mainline detection systems should be installed to monitor mainline flows to allow for the adaptive operation of the meters and avoid metering when not necessary.
• While the deployment of metering equipment may occur on a ramp-by-ramp basis, meters should be
activated on a segment basis, rather than individual ramps to provide a consistency in deployment,
107
Final Traffic Operations Report I-205/Lammers Road Interchange Project May 2009
avoid driver confusion, and handle variations in traffic demands that may result from changes in actual development patterns and from incidents.
All of the project alternatives include the following recommended components of the ramp metering strategy:
• HOV preferential lanes
• Queue spillback detectors
RAMP METERING QUEUING ANALYSIS
Maximum and minimum queue lengths are based on Caltrans lower and upper metering output limits of 240 and 900 vehicles per hour per lane (vphpl). Therefore, the maximum queue lengths are calculated using the lowest metering flow rate of 240 vphpl and the minimum queue lengths are calculated using the highest metering flow rate of 900 vphpl. Resulting queue lengths are the expected queue lengths at the end of the analyzed peak hour. While each on-ramp under the Project alternatives includes an HOV preferential lane, the District has indicated that the HOV lanes would not be metered when the District’s ramp metering plan is implemented; therefore they are not included in the ramp metering queuing analysis. For this queuing analysis, a reasonable estimate of 10% HOVs were assumed. The number of high occupancy vehicles is deducted from the total number of vehicles to calculate the queues on the ramps. Ramp metering calculation sheets are presented in Appendix L.
The Year 2035 ramp metering queuing summaries are presented in Tables 29 through 35 for the project alternatives under various metering rates. As shown in these tables only Alternatives 5A and 6 provide adequate vehicle storage assuming maximum metering rates. These alternatives provide adequate storage as a result of providing two on-ramps in each direction.
The eastbound diagonal on-ramp under Alternative 1 and Alternative 5A-VA does not provide adequate vehicle storage to accommodate vehicle queuing even at the maximum metering rate (i.e. 900 vphpl). This would result in vehicle queue spillback impacts on the local street system. To mitigate this impact the eastbound on-ramp would need to provide about 1,900 feet of vehicle storage per lane or be widened to provide a total 3,800 feet of vehicle storage. Under Alternative 5A-VA the queue (229 vehicles under maximum metering rate) far exceeds the storage that could be provided by any practical on-ramp design. Therefore, there is no improvement that could be provided at the eastbound diagonal on-ramp to accommodate the queue under Alternative 5A-VA.
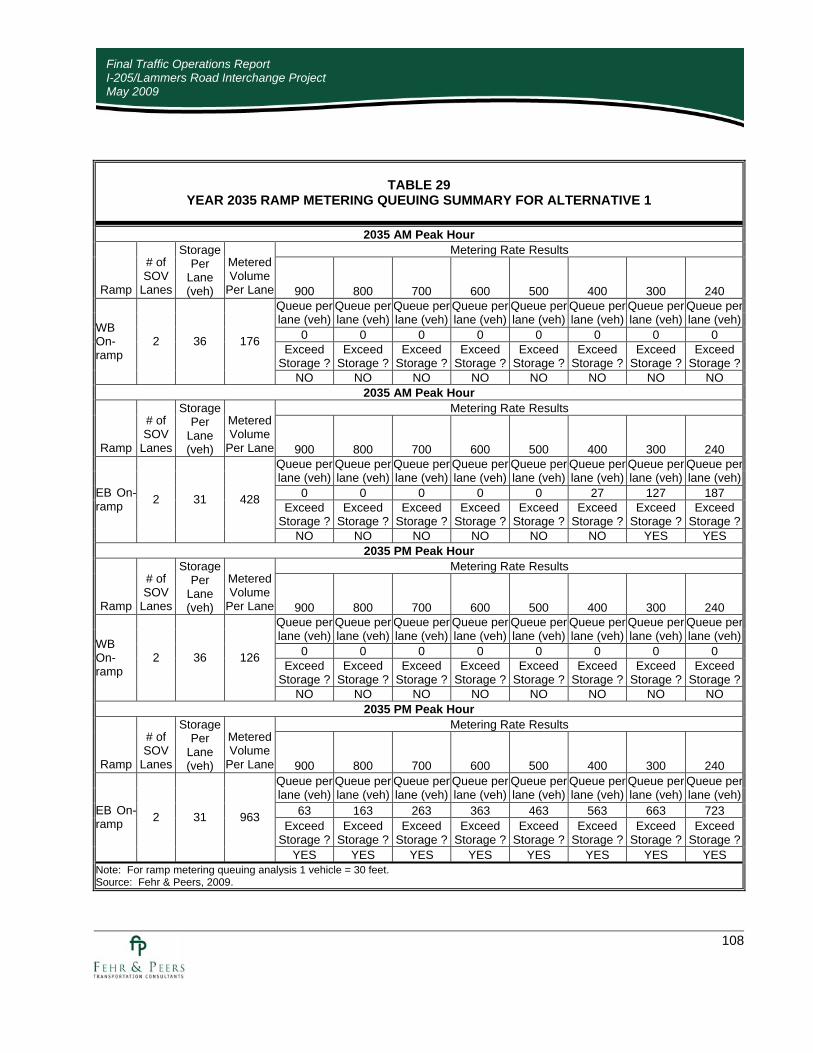
108
Final Traffic Operations Report I-205/Lammers Road Interchange Project May 2009
TABLE 29 YEAR 2035 RAMP METERING QUEUING SUMMARY FOR ALTERNATIVE 1
2035 AM Peak Hour Metering Rate Results
Ramp
# of SOV
Lanes
Storage Per
Lane (veh)
Metered Volume
Per Lane 900 800 700 600 500 400 300 240 Queue per lane (veh)
Queue per lane (veh)
Queue per lane (veh)
Queue per lane (veh)
Queue per lane (veh)
Queue per lane (veh)
Queue per lane (veh)
Queue perlane (veh)
0 0 0 0 0 0 0 0 Exceed
Storage ?Exceed
Storage ?Exceed
Storage ?Exceed
Storage ?Exceed
Storage ?Exceed
Storage ? Exceed
Storage ?Exceed
Storage ?
WB On-ramp
2 36 176
NO NO NO NO NO NO NO NO 2035 AM Peak Hour
Metering Rate Results
Ramp
# of SOV
Lanes
Storage Per
Lane (veh)
Metered Volume
Per Lane 900 800 700 600 500 400 300 240 Queue per lane (veh)
Queue per lane (veh)
Queue per lane (veh)
Queue per lane (veh)
Queue per lane (veh)
Queue per lane (veh)
Queue per lane (veh)
Queue perlane (veh)
0 0 0 0 0 27 127 187 Exceed
Storage ?Exceed
Storage ?Exceed
Storage ?Exceed
Storage ?Exceed
Storage ?Exceed
Storage ? Exceed
Storage ?Exceed
Storage ?
EB On-ramp 2 31 428
NO NO NO NO NO NO YES YES 2035 PM Peak Hour
Metering Rate Results
Ramp
# of SOV
Lanes
Storage Per
Lane (veh)
Metered Volume
Per Lane 900 800 700 600 500 400 300 240 Queue per lane (veh)
Queue per lane (veh)
Queue per lane (veh)
Queue per lane (veh)
Queue per lane (veh)
Queue per lane (veh)
Queue per lane (veh)
Queue perlane (veh)
0 0 0 0 0 0 0 0 Exceed
Storage ?Exceed
Storage ?Exceed
Storage ?Exceed
Storage ?Exceed
Storage ?Exceed
Storage ? Exceed
Storage ?Exceed
Storage ?
WB On-ramp
2 36 126
NO NO NO NO NO NO NO NO 2035 PM Peak Hour
Metering Rate Results
Ramp
# of SOV
Lanes
Storage Per
Lane (veh)
Metered Volume
Per Lane 900 800 700 600 500 400 300 240 Queue per lane (veh)
Queue perlane (veh)
Queue per lane (veh)
Queue per lane (veh)
Queue per lane (veh)
Queue per lane (veh)
Queue per lane (veh)
Queue perlane (veh)
63 163 263 363 463 563 663 723 Exceed
Storage ?Exceed
Storage ?Exceed
Storage ?Exceed
Storage ?Exceed
Storage ?Exceed
Storage ? Exceed
Storage ?Exceed
Storage ?
EB On-ramp 2 31 963
YES YES YES YES YES YES YES YES Note: For ramp metering queuing analysis 1 vehicle = 30 feet. Source: Fehr & Peers, 2009.

109
Final Traffic Operations Report I-205/Lammers Road Interchange Project May 2009
TABLE 30 YEAR 2035 RAMP METERING QUEUING SUMMARY FOR ALTERNATIVE 5A (DIAGONAL RAMPS)
2035 AM Peak Hour Metering Rate Results
Ramp
# of SOV
Lanes
Storage Per
Lane (veh)
Metered Volume
Per Lane 900 800 700 600 500 400 300 240 Queue per lane (veh)
Queue per lane (veh)
Queue per lane (veh)
Queue per lane (veh)
Queue per lane (veh)
Queue per lane (veh)
Queue per lane (veh)
Queue perlane (veh)
0 0 0 0 0 0 0 0 Exceed
Storage ?Exceed
Storage ?Exceed
Storage ?Exceed
Storage ?Exceed
Storage ?Exceed
Storage ? Exceed
Storage ?Exceed
Storage ?
WB Diagonal On-Ramp
2 55 63
NO NO NO NO NO NO NO NO 2035 AM Peak Hour
Metering Rate Results
Ramp
# of SOV
Lanes
Storage Per
Lane (veh)
Metered Volume
Per Lane 900 800 700 600 500 400 300 240 Queue per lane (veh)
Queue per lane (veh)
Queue per lane (veh)
Queue per lane (veh)
Queue per lane (veh)
Queue per lane (veh)
Queue per lane (veh)
Queue perlane (veh)
0 0 0 0 0 0 15 75 Exceed
Storage ?Exceed
Storage ?Exceed
Storage ?Exceed
Storage ?Exceed
Storage ?Exceed
Storage ? Exceed
Storage ?Exceed
Storage ?
EB Diagonal On-Ramp
2 32 315
NO NO NO NO NO NO NO NO 2035 PM Peak Hour
Metering Rate Results
Ramp
# of SOV
Lanes
Storage Per
Lane (veh)
Metered Volume
Per Lane 900 800 700 600 500 400 300 240 Queue per lane (veh)
Queue per lane (veh)
Queue per lane (veh)
Queue per lane (veh)
Queue per lane (veh)
Queue per lane (veh)
Queue per lane (veh)
Queue perlane (veh)
0 0 0 0 0 0 0 0 Exceed
Storage ?Exceed
Storage ?Exceed
Storage ?Exceed
Storage ?Exceed
Storage ?Exceed
Storage ? Exceed
Storage ?Exceed
Storage ?
WB Diagonal On-Ramp
2 55 104
NO NO NO NO NO NO NO NO 2035 PM Peak Hour
Metering Rate Results
Ramp
# of SOV
Lanes
Storage Per
Lane (veh)
Metered Volume
Per Lane 900 800 700 600 500 400 300 240 Queue per lane (veh)
Queue per lane (veh)
Queue per lane (veh)
Queue per lane (veh)
Queue per lane (veh)
Queue per lane (veh)
Queue per lane (veh)
Queue perlane (veh)
0 0 42 142 242 342 442 502 Exceed
Storage ?Exceed
Storage ?Exceed
Storage ?Exceed
Storage ?Exceed
Storage ?Exceed
Storage ? Exceed
Storage ?Exceed
Storage ?
EB Diagonal On-Ramp
2 32 743
NO NO YES YES YES YES YES YES Note: For ramp metering queuing analysis 1 vehicle = 30 feet. Source: Fehr & Peers, 2009.

110
Final Traffic Operations Report I-205/Lammers Road Interchange Project May 2009
TABLE 31 YEAR 2035 RAMP METERING QUEUING SUMMARY FOR ALTERNATIVE 5A (LOOP RAMPS)
2035 AM Peak Hour Metering Rate Results
Ramp
# of SOV
Lanes
Storage Per
Lane (veh)
Metered Volume
Per Lane 900 800 700 600 500 400 300 240 Queue per lane (veh)
Queue per lane (veh)
Queue per lane (veh)
Queue per lane (veh)
Queue per lane (veh)
Queue per lane (veh)
Queue per lane (veh)
Queue perlane (veh)
0 0 0 43 143 243 343 403 Exceed
Storage ?Exceed
Storage ?Exceed
Storage ?Exceed
Storage ?Exceed
Storage ?Exceed
Storage ? Exceed
Storage ?Exceed
Storage ?
WB Loop On-Ramp
2 54 644
NO NO NO NO YES YES YES YES 2035 AM Peak Hour
Metering Rate Results
Ramp
# of SOV
Lanes
Storage Per
Lane (veh)
Metered Volume
Per Lane 900 800 700 600 500 400 300 240 Queue per lane (veh)
Queue per lane (veh)
Queue per lane (veh)
Queue per lane (veh)
Queue per lane (veh)
Queue per lane (veh)
Queue per lane (veh)
Queue perlane (veh)
0 0 0 0 0 0 0 0 Exceed
Storage ?Exceed
Storage ?Exceed
Storage ?Exceed
Storage ?Exceed
Storage ?Exceed
Storage ? Exceed
Storage ?Exceed
Storage ?
EB Loop On-Ramp
2 38 77
NO NO NO NO NO NO NO NO 2035 PM Peak Hour
Metering Rate Results
Ramp
# of SOV
Lanes
Storage Per
Lane (veh)
Metered Volume
Per Lane 900 800 700 600 500 400 300 240 Queue per lane (veh)
Queue per lane (veh)
Queue per lane (veh)
Queue per lane (veh)
Queue per lane (veh)
Queue per lane (veh)
Queue per lane (veh)
Queue perlane (veh)
0 0 0 0 0 0 28 88 Exceed
Storage ?Exceed
Storage ?Exceed
Storage ?Exceed
Storage ?Exceed
Storage ?Exceed
Storage ? Exceed
Storage ?Exceed
Storage ?
WB Loop On-Ramp
2 54 329
NO NO NO NO NO NO NO NO 2035 PM Peak Hour
Metering Rate Results
Ramp
# of SOV
Lanes
Storage Per
Lane (veh)
Metered Volume
Per Lane 900 800 700 600 500 400 300 240 Queue per lane (veh)
Queue per lane (veh)
Queue per lane (veh)
Queue per lane (veh)
Queue per lane (veh)
Queue per lane (veh)
Queue per lane (veh)
Queue perlane (veh)
0 0 0 0 0 2 87 147 Exceed
Storage ?Exceed
Storage ?Exceed
Storage ?Exceed
Storage ?Exceed
Storage ?Exceed
Storage ? Exceed
Storage ?Exceed
Storage ?
EB Loop On-Ramp
2 32 387
NO NO NO NO NO NO YES YES Note: For ramp metering queuing analysis 1 vehicle = 30 feet. Source: Fehr & Peers, 2009.

111
Final Traffic Operations Report I-205/Lammers Road Interchange Project May 2009
TABLE 32 YEAR 2035 RAMP METERING QUEUING SUMMARY FOR ALTERNATIVE 5A-VA (DIAGONAL RAMPS)
2035 AM Peak Hour Metering Rate Results
Ramp # of SOV
Lanes
Storage Per
Lane (veh)
Metered Volume
Per Lane 900 800 700 600 500 400 300 240
Queue per lane (veh)
Queue per lane (veh)
Queue per lane (veh)
Queue per lane (veh)
Queue per lane (veh)
Queue per lane (veh)
Queue per lane (veh)
Queue perlane (veh)
0 0 0 0 0 0 0 0 Exceed
Storage ?Exceed
Storage ?Exceed
Storage ?Exceed
Storage ?Exceed
Storage ?Exceed
Storage ? Exceed
Storage ?Exceed
Storage ?
WB Diagonal On-Ramp
2 55 63
NO NO NO NO NO NO NO NO 2035 AM Peak Hour
Metering Rate Results
Ramp # of SOV
Lanes
Storage Per
Lane (veh)
Metered Volume
Per Lane 900 800 700 600 500 400 300 240
Queue per lane (veh)
Queue per lane (veh)
Queue per lane (veh)
Queue per lane (veh)
Queue per lane (veh)
Queue per lane (veh)
Queue per lane (veh)
Queue perlane (veh)
0 0 0 0 0 3 92 152 Exceed
Storage ?Exceed
Storage ?Exceed
Storage ?Exceed
Storage ?Exceed
Storage ?Exceed
Storage ? Exceed
Storage ?Exceed
Storage ?
EB Diagonal On-Ramp
2 30 392
NO NO NO NO NO NO YES YES 2035 PM Peak Hour
Metering Rate Results
Ramp # of SOV
Lanes
Storage Per
Lane (veh)
Metered Volume
Per Lane 900 800 700 600 500 400 300 240
Queue per lane (veh)
Queue per lane (veh)
Queue per lane (veh)
Queue per lane (veh)
Queue per lane (veh)
Queue per lane (veh)
Queue per lane (veh)
Queue perlane (veh)
0 0 0 0 0 0 0 0 Exceed
Storage ?Exceed
Storage ?Exceed
Storage ?Exceed
Storage ?Exceed
Storage ?Exceed
Storage ? Exceed
Storage ?Exceed
Storage ?
WB Diagonal On-Ramp
2 55 104
NO NO NO NO NO NO NO NO 2035 PM Peak Hour
Metering Rate Results
Ramp # of SOV
Lanes
Storage Per
Lane (veh)
Metered Volume
Per Lane 900 800 700 600 500 400 300 240
Queue per lane (veh)
Queue per lane (veh)
Queue per lane (veh)
Queue per lane (veh)
Queue per lane (veh)
Queue per lane (veh)
Queue per lane (veh)
Queue perlane (veh)
229 329 429 529 629 729 829 889 Exceed
Storage ?Exceed
Storage ?Exceed
Storage ?Exceed
Storage ?Exceed
Storage ?Exceed
Storage ? Exceed
Storage ?Exceed
Storage ?
EB Diagonal On-Ramp
2
30
1,130
YES YES YES YES YES YES YES YES Note: For ramp metering queuing analysis 1 vehicle = 30 feet. Source: Fehr & Peers, 2009.

112
Final Traffic Operations Report I-205/Lammers Road Interchange Project May 2009
TABLE 33 YEAR 2035 RAMP METERING QUEUING SUMMARY FOR ALTERNATIVE 5A-VA (LOOP RAMPS)
2035 AM Peak Hour Metering Rate Results
Ramp # of SOV
Lanes
Storage Per
Lane (veh)
Metered Volume
Per Lane 900 800 700 600 500 400 300 240
Queue per lane (veh)
Queue per lane (veh)
Queue per lane (veh)
Queue per lane (veh)
Queue per lane (veh)
Queue per lane (veh)
Queue per lane (veh)
Queue perlane (veh)
0 0 0 43 143 243 343 403 Exceed
Storage ?Exceed
Storage ?Exceed
Storage ?Exceed
Storage ?Exceed
Storage ?Exceed
Storage ? Exceed
Storage ?Exceed
Storage ?
WB Loop On-
Ramp
2 54 644
NO NO NO NO YES YES YES YES 2035 PM Peak Hour
Metering Rate Results
Ramp # of SOV
Lanes
Storage Per
Lane (veh)
Metered Volume
Per Lane 900 800 700 600 500 400 300 240
Queue per lane (veh)
Queue per lane (veh)
Queue per lane (veh)
Queue per lane (veh)
Queue per lane (veh)
Queue per lane (veh)
Queue per lane (veh)
Queue perlane (veh)
0 0 0 0 0 0 28 88 Exceed
Storage ?Exceed
Storage ?Exceed
Storage ?Exceed
Storage ?Exceed
Storage ?Exceed
Storage ? Exceed
Storage ?Exceed
Storage ?
WB Loop On-
Ramp
2 54 329
NO NO NO NO NO NO NO NO Note: For ramp metering queuing analysis 1 vehicle = 30 feet. Source: Fehr & Peers, 2009.

113
Final Traffic Operations Report I-205/Lammers Road Interchange Project May 2009
TABLE 34 YEAR 2035 RAMP METERING QUEUING SUMMARY FOR ALTERNATIVE 6 (DIAGONAL RAMPS)
2035 AM Peak Hour Metering Rate Results
Ramp # of SOV
Lanes
Storage Per
Lane (veh)
Metered Volume
Per Lane 900 800 700 600 500 400 300 240
Queue per lane (veh)
Queue per lane (veh)
Queue per lane (veh)
Queue per lane (veh)
Queue per lane (veh)
Queue per lane (veh)
Queue per lane (veh)
Queue perlane (veh)
0 0 0 0 0 0 0 0 Exceed
Storage ?Exceed
Storage ?Exceed
Storage ?Exceed
Storage ?Exceed
Storage ?Exceed
Storage ? Exceed
Storage ?Exceed
Storage ?
WB Diagonal On-Ramp
2 39 95
NO NO NO NO NO NO NO NO 2035 AM Peak Hour
Metering Rate Results
Ramp # of SOV
Lanes
Storage Per
Lane (veh)
Metered Volume
Per Lane 900 800 700 600 500 400 300 240
Queue per lane (veh)
Queue per lane (veh)
Queue per lane (veh)
Queue per lane (veh)
Queue per lane (veh)
Queue per lane (veh)
Queue per lane (veh)
Queue perlane (veh)
0 0 0 0 0 0 47 107 Exceed
Storage ?Exceed
Storage ?Exceed
Storage ?Exceed
Storage ?Exceed
Storage ?Exceed
Storage ? Exceed
Storage ?Exceed
Storage ?
EB Diagonal On-Ramp
2 24 347
NO NO NO NO NO NO YES YES 2035 PM Peak Hour
Metering Rate Results
Ramp # of SOV
Lanes
Storage Per
Lane (veh)
Metered Volume
Per Lane 900 800 700 600 500 400 300 240
Queue per lane (veh)
Queue per lane (veh)
Queue per lane (veh)
Queue per lane (veh)
Queue per lane (veh)
Queue per lane (veh)
Queue per lane (veh)
Queue perlane (veh)
0 0 0 0 0 0 0 0 Exceed
Storage ?Exceed
Storage ?Exceed
Storage ?Exceed
Storage ?Exceed
Storage ?Exceed
Storage ? Exceed
Storage ?Exceed
Storage ?
WB Diagonal On-Ramp
2 39 131
NO NO NO NO NO NO NO NO 2035 PM Peak Hour
Metering Rate Results
Ramp # of SOV
Lanes
Storage Per
Lane (veh)
Metered Volume
Per Lane 900 800 700 600 500 400 300 240
Queue per lane (veh)
Queue per lane (veh)
Queue per lane (veh)
Queue per lane (veh)
Queue per lane (veh)
Queue per lane (veh)
Queue per lane (veh)
Queue perlane (veh)
0 28 128 228 328 428 528 588 Exceed
Storage ?Exceed
Storage ?Exceed
Storage ?Exceed
Storage ?Exceed
Storage ?Exceed
Storage ? Exceed
Storage ?Exceed
Storage ?
EB Diagonal On-Ramp
2 24 828
NO YES YES YES YES YES YES YES Note: For ramp metering queuing analysis 1 vehicle = 30 feet. Source: Fehr & Peers, 2009.
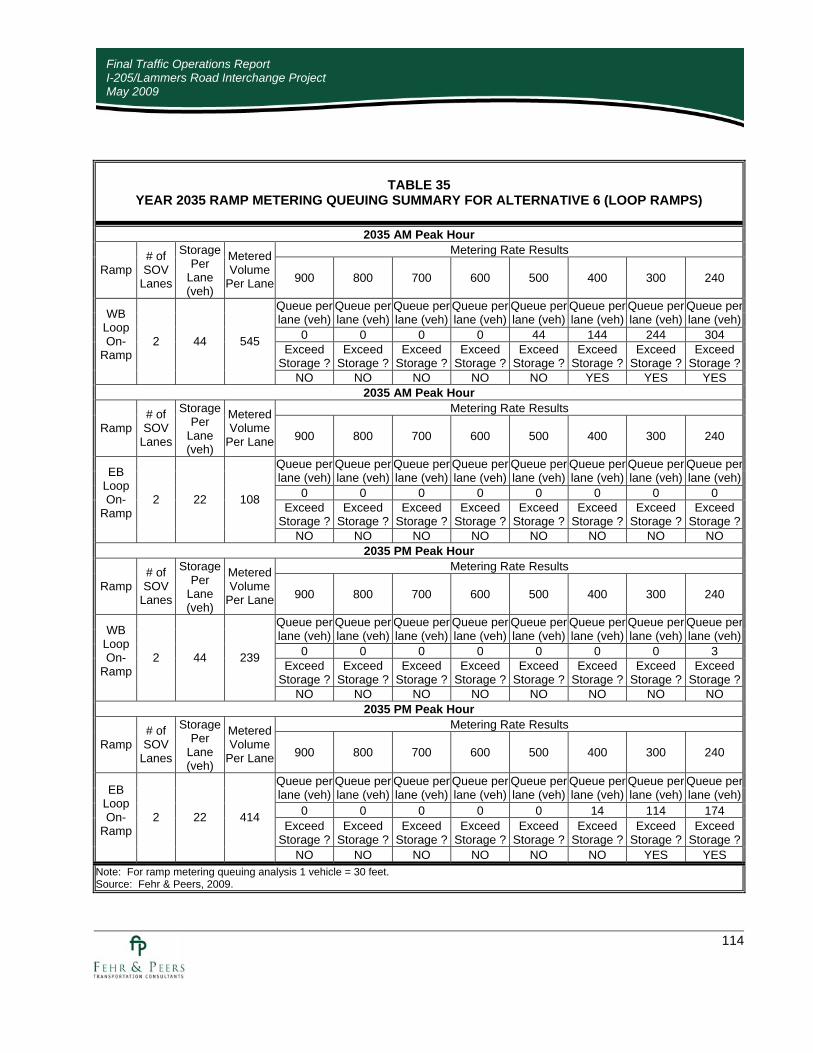
114
Final Traffic Operations Report I-205/Lammers Road Interchange Project May 2009
TABLE 35 YEAR 2035 RAMP METERING QUEUING SUMMARY FOR ALTERNATIVE 6 (LOOP RAMPS)
2035 AM Peak Hour Metering Rate Results
Ramp # of SOV
Lanes
Storage Per
Lane (veh)
Metered Volume
Per Lane 900 800 700 600 500 400 300 240
Queue per lane (veh)
Queue per lane (veh)
Queue per lane (veh)
Queue per lane (veh)
Queue per lane (veh)
Queue per lane (veh)
Queue per lane (veh)
Queue perlane (veh)
0 0 0 0 44 144 244 304 Exceed
Storage ?Exceed
Storage ?Exceed
Storage ?Exceed
Storage ?Exceed
Storage ?Exceed
Storage ? Exceed
Storage ?Exceed
Storage ?
WB Loop On-
Ramp
2 44 545
NO NO NO NO NO YES YES YES 2035 AM Peak Hour
Metering Rate Results
Ramp # of SOV
Lanes
Storage Per
Lane (veh)
Metered Volume
Per Lane 900 800 700 600 500 400 300 240
Queue per lane (veh)
Queue per lane (veh)
Queue per lane (veh)
Queue per lane (veh)
Queue per lane (veh)
Queue per lane (veh)
Queue per lane (veh)
Queue perlane (veh)
0 0 0 0 0 0 0 0 Exceed
Storage ?Exceed
Storage ?Exceed
Storage ?Exceed
Storage ?Exceed
Storage ?Exceed
Storage ? Exceed
Storage ?Exceed
Storage ?
EB Loop On-
Ramp
2 22 108
NO NO NO NO NO NO NO NO 2035 PM Peak Hour
Metering Rate Results
Ramp # of SOV
Lanes
Storage Per
Lane (veh)
Metered Volume
Per Lane 900 800 700 600 500 400 300 240
Queue per lane (veh)
Queue per lane (veh)
Queue per lane (veh)
Queue per lane (veh)
Queue per lane (veh)
Queue per lane (veh)
Queue per lane (veh)
Queue perlane (veh)
0 0 0 0 0 0 0 3 Exceed
Storage ?Exceed
Storage ?Exceed
Storage ?Exceed
Storage ?Exceed
Storage ?Exceed
Storage ? Exceed
Storage ?Exceed
Storage ?
WB Loop On-
Ramp
2 44 239
NO NO NO NO NO NO NO NO 2035 PM Peak Hour
Metering Rate Results
Ramp # of SOV
Lanes
Storage Per
Lane (veh)
Metered Volume
Per Lane 900 800 700 600 500 400 300 240
Queue per lane (veh)
Queue per lane (veh)
Queue per lane (veh)
Queue per lane (veh)
Queue per lane (veh)
Queue per lane (veh)
Queue per lane (veh)
Queue perlane (veh)
0 0 0 0 0 14 114 174 Exceed
Storage ?Exceed
Storage ?Exceed
Storage ?Exceed
Storage ?Exceed
Storage ?Exceed
Storage ? Exceed
Storage ?Exceed
Storage ?
EB Loop On-
Ramp
2 22 414
NO NO NO NO NO NO YES YES Note: For ramp metering queuing analysis 1 vehicle = 30 feet. Source: Fehr & Peers, 2009.
Final Traffic Operations Report I-205/Lammers Road Interchange Project May 2009
APPENDIX A TRAFFIC COUNTS

Final Traffic Operations Report I-205/Lammers Road Interchange Project May 2009
APPENDIX B MODEL VALIDATION AND EXISTING INTERSECTION ANALYSIS
WORKSHEETS

Final Traffic Operations Report I-205/Lammers Road Interchange Project May 2009
APPENDIX C EXISTING MAINLINE AND RAMP JUNCTION ANALYSIS WORKSHEETS

Final Traffic Operations Report I-205/Lammers Road Interchange Project May 2009
APPENDIX D TRAVEL DEMAND MODEL CALIBRATION AND VALIDATION

Final Traffic Operations Report I-205/Lammers Road Interchange Project May 2009
APPENDIX E I-205 MAINLINE AND RAMP DEMAND VOLUMES

Final Traffic Operations Report I-205/Lammers Road Interchange Project May 2009
APPENDIX F OPENING YEAR (2015) INTERSECTION ANALYSIS WORKSHEETS

Final Traffic Operations Report I-205/Lammers Road Interchange Project May 2009
APPENDIX G OPENING YEAR (2015) MAINLINE AND RAMP JUNCTION ANALYSIS
WORKSHEETS USING HCM

Final Traffic Operations Report I-205/Lammers Road Interchange Project May 2009
APPENDIX H OPENING YEAR (2015) MAINLINE AND RAMP JUNCTION ANALYSIS
WORKSHEETS USING FREQ

Final Traffic Operations Report I-205/Lammers Road Interchange Project May 2009
APPENDIX I DESIGN YEAR (2035) INTERSECTION ANALYSIS WORKSHEETS
Final Traffic Operations Report I-205/Lammers Road Interchange Project May 2009
APPENDIX J DESIGN YEAR (2035) MAINLINE AND RAMP JUNCTION ANALYSIS
WORKSHEETS USING HCM

Final Traffic Operations Report I-205/Lammers Road Interchange Project May 2009
APPENDIX K DESIGN YEAR (2035) MAINLINE AND RAMP JUNCTION ANALYSIS
WORKSHEETS USING FREQ

Final Traffic Operations Report I-205/Lammers Road Interchange Project May 2009
APPENDIX L RAMP METERING QUEUING RESULTS


![Rebecca Lammers - How YouTube Can Change Your Music Career [Darker Music Talks - February 2016]](https://static.fdocuments.us/doc/165x107/58a7da481a28ab8a7e8b5ee3/rebecca-lammers-how-youtube-can-change-your-music-career-darker-music-talks.jpg)