FINAL OFFICIAL STATEMENT DATED OCTOBER 16, 2019 CITY OF ...
220
FINAL OFFICIAL STATEMENT DATED OCTOBER 16, 2019 CITY OF SOMERVILLE, MASSACHUSETTS $105,000,000 GENERAL OBLIGATION BOND ANTICIPATION NOTES Dated Due October 25, 2019 October 23, 2020 __________________ Number Award Coupon Rate Yield CUSIP 1 40,000,000 $ 2.25% 1.13% 835240 3D2 __________________ The provisions of the accompanying NOTICE OF SALE AND PRELIMINARY OFFICIAL STATEMENT DATED OCTOBER 8, 2019 supplemented and modified hereby, are incorporated in and made part of this Final Official Statement. Hilltop Securities Inc. Financial Advisor
Transcript of FINAL OFFICIAL STATEMENT DATED OCTOBER 16, 2019 CITY OF ...

FINAL OFFICIAL STATEMENT DATED OCTOBER 16, 2019
CITY OF SOMERVILLE, MASSACHUSETTS
$105,000,000 GENERAL OBLIGATION BOND ANTICIPATION NOTES
Dated DueOctober 25, 2019 October 23, 2020
__________________
Number Award Coupon Rate Yield CUSIP1 40,000,000$ 2.25% 1.13% 835240 3D2
__________________
The provisions of the accompanying NOTICE OF SALE AND PRELIMINARY OFFICIAL STATEMENT DATED OCTOBER 8, 2019 supplemented and modified hereby, are incorporated in and made part of this Final Official
Statement.
Hilltop Securities Inc.
Financial Advisor

FINAL OFFICIAL STATEMENT DATED OCTOBER 16, 2019
CITY OF SOMERVILLE, MASSACHUSETTS
$105,000,000 GENERAL OBLIGATION BOND ANTICIPATION NOTES
Dated DueOctober 25, 2019 October 23, 2020
__________________
Number Award Coupon Rate Yield CUSIP2 30,000,000$ 2.25% 1.15% 835240 3D2
__________________
The provisions of the accompanying NOTICE OF SALE AND PRELIMINARY OFFICIAL STATEMENT DATED OCTOBER 8, 2019 supplemented and modified hereby, are incorporated in and made part of this Final Official
Statement.
Hilltop Securities Inc.
Financial Advisor
FINAL OFFICIAL STATEMENT DATED OCTOBER 16, 2019
CITY OF SOMERVILLE, MASSACHUSETTS
$105,000,000 GENERAL OBLIGATION BOND ANTICIPATION NOTES
Dated Due
October 25, 2019 October 23, 2020 __________________
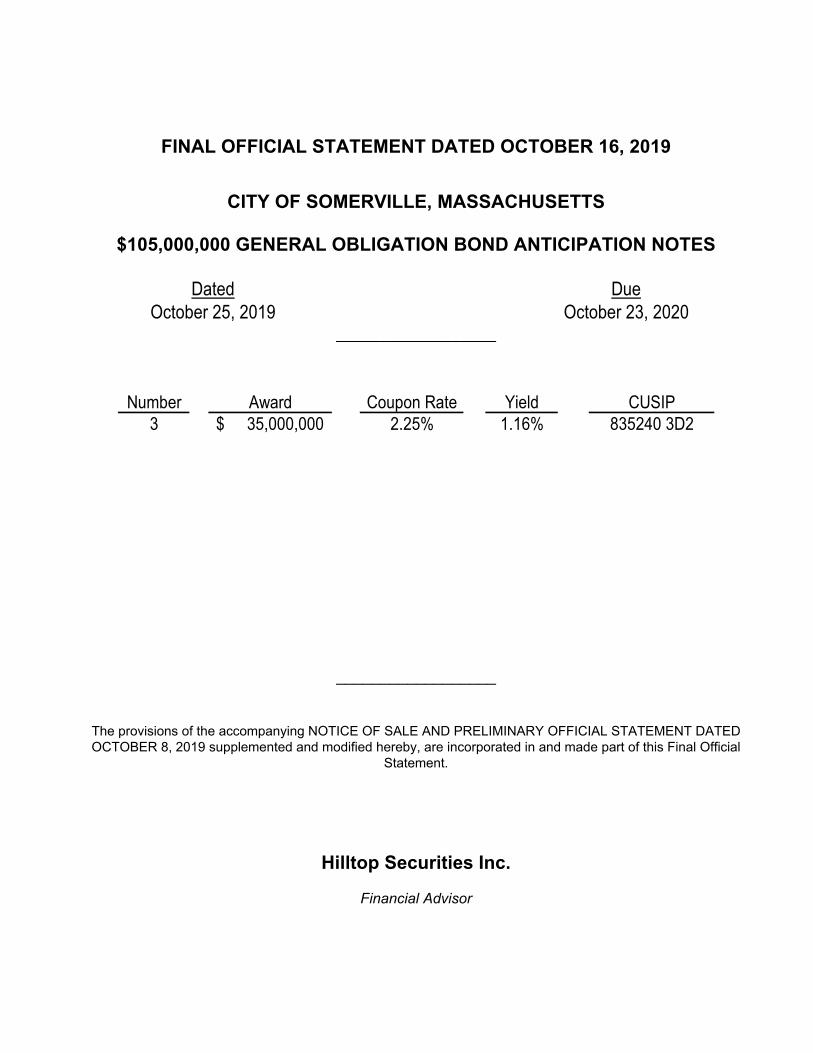
Number Award Coupon Rate Yield CUSIP3 35,000,000$ 2.25% 1.16% 835240 3D2
__________________
The provisions of the accompanying NOTICE OF SALE AND PRELIMINARY OFFICIAL STATEMENT DATED OCTOBER 8, 2019 supplemented and modified hereby, are incorporated in and made part of this Final Official
Statement.
Hilltop Securities Inc.
Financial Advisor

1
NOTICE OF SALE AND PRELIMINARY OFFICIAL STATEMENT DATED OCTOBER 8, 2019
Rating: S&P Global Ratings: SP-1+ In the opinion of Locke Lord LLP, Bond Counsel, based upon an analysis of existing law and assuming, among other matters, compliance with certain covenants, interest on the Notes is excluded from gross income for federal income tax purposes under the Internal Revenue Code of 1986, as amended (the “Code”). Interest on the Notes will not be included in computing the alternative minimum taxable income of individuals. Under existing law, interest on the Notes is exempt from Massachusetts personal income taxes, and the Notes are exempt from Massachusetts personal property taxes. Bond Counsel expresses no opinion regarding any other tax consequences related to the ownership or disposition of, or the accrual or receipt of interest on, the Notes. See “Tax Exemption” herein. The Notes will not be designated as “qualified tax-exempt obligations” for purposes of Section 265(b)(3) of the Code.
CITY OF SOMERVILLE, MASSACHUSETTS
$105,000,000 GENERAL OBLIGATION BOND ANTICIPATION NOTES
The City of Somerville, Massachusetts (the “City”) will receive telephone and electronic bids at Hilltop Securities Inc., (617-619-4400) in the case of telephone bids and via PARITY in the case of electronic bids until 11:00 a.m., Eastern Time, Wednesday, October 16, 2019, for the purchase of the following described General Obligation Bond Anticipation Notes of the City: $105,000,000 General Obligation Bond Anticipation Notes (new money and renewals) dated October 25, 2019 and
payable on October 23, 2020. Interest on the Notes will be calculated on a 30 day-month/360 day-year basis (358/360). The Notes will not be subject to redemption prior to their stated maturity date.
The Notes will be issued by means of a book-entry system, evidencing ownership of the Notes in the principal amount of $1,000 or integral multiples thereof, with transfers of ownership effected on the records of The Depository Trust Company (DTC) and its participants pursuant to the rules and procedures adopted by DTC, unless the issuance of a fully registered note certificate is requested by the successful bidder and the issuance of such certificate is approved by the City. (See Preliminary Official Statement, “Book-Entry Transfer System.”) Principal and interest on the Notes will be payable upon maturity in federal reserve funds by U.S. Bank National Association, or its successor, as Paying Agent. Disbursements of such payments to the DTC Participants is the responsibility of DTC, and disbursements of such payments to the Beneficial Owners is the responsibility of the DTC Participants and the Indirect Participants.
Notice is hereby given that electronic proposals will be received via PARITY, in the manner described above, until 11:00 a.m., Eastern Time, on October 16, 2019 for the Notes. Bids may be submitted electronically via PARITY pursuant to this Notice of Sale until 11:00 a.m., Eastern Time, but no bid will be received after the time for receiving bids specified above. To the extent any instructions or directions set forth in PARITY conflict with this Notice of Sale, the terms of this Notice of Sale shall control. For further information about PARITY, potential bidders may contact Hilltop Securities Inc. or PARITY at (212) 404-8102.
Bids may be for all or part of the Notes at a single or various rates of interest in a multiple of one-hundredth (1/100) of one percent (1%). No bid of less than par and accrued interest to the date of delivery will be considered. No bid on the Notes with a coupon rate exceeding 2.50% will be accepted and a premium of at least $0.85 must be included for each $1,000 bid. The right is reserved to reject any or all bids and to reject any bid not complying with this Notice of Sale and, so far as permitted by law, to waive any irregularity with respect to any bid. The Notes are not subject to redemption prior to maturity.
Any bidder who submits a winning bid by telephone in accordance with this Notice of Sale shall be required to provide written confirmation of the terms of the bid by faxing or e-mailing a completed, signed bid form to Hilltop Securities Inc. by not later than 12:00 Noon, Eastern Time, on the date of the sale. An electronic bid made in accordance with this Notice of Sale shall be deemed an offer to purchase the Notes in accordance with the terms provided in this Notice of Sale and shall be binding upon the bidder as if made by a signed and sealed written bid delivered to the City.
The award of the Notes to the successful bidder(s) will not be effective until the respective bid has been approved by the Treasurer and the Mayor of the City.
The purchaser(s) will be furnished, without cost, the opinion of Locke Lord LLP, Boston, Massachusetts, approving the legality of the Notes. The opinion will indicate that the Notes and the enforceability thereof may be subject to bankruptcy and other laws affecting creditor's rights and that their enforceability may also be subject to the exercise of judicial discretion in appropriate cases. The Notes will be valid general obligations of the City of Somerville and, except to the extent they
2
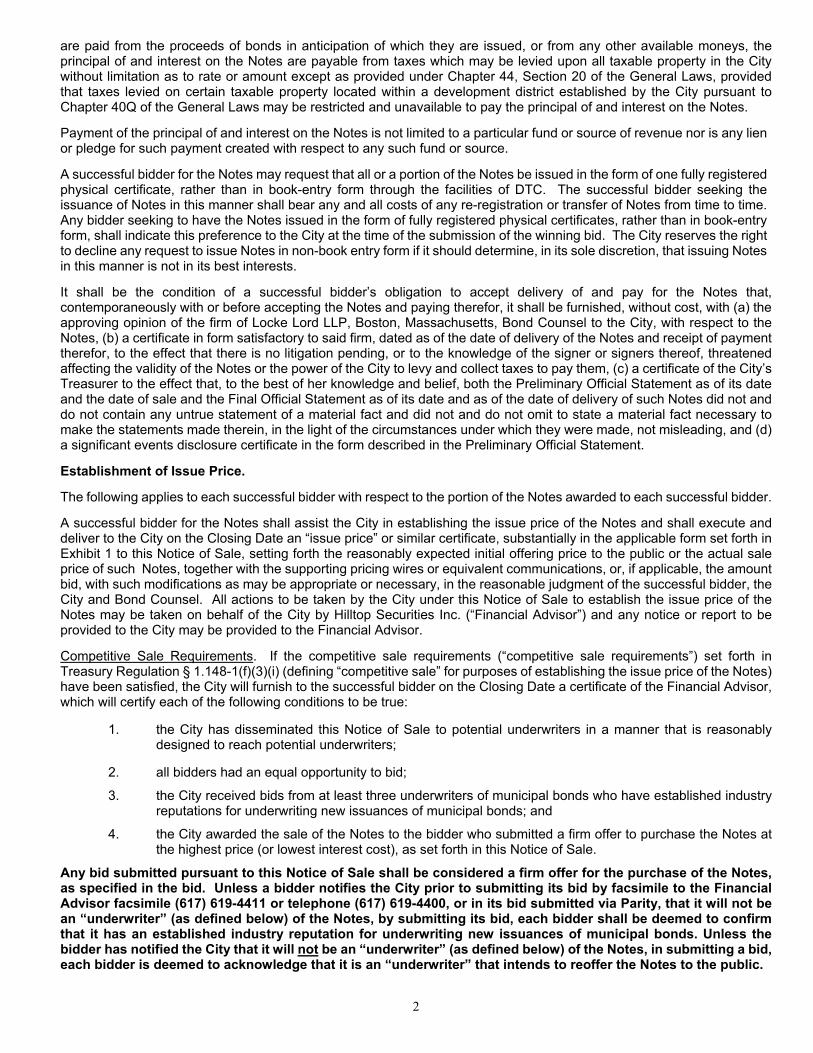
are paid from the proceeds of bonds in anticipation of which they are issued, or from any other available moneys, the principal of and interest on the Notes are payable from taxes which may be levied upon all taxable property in the City without limitation as to rate or amount except as provided under Chapter 44, Section 20 of the General Laws, provided that taxes levied on certain taxable property located within a development district established by the City pursuant to Chapter 40Q of the General Laws may be restricted and unavailable to pay the principal of and interest on the Notes.
Payment of the principal of and interest on the Notes is not limited to a particular fund or source of revenue nor is any lien or pledge for such payment created with respect to any such fund or source.
A successful bidder for the Notes may request that all or a portion of the Notes be issued in the form of one fully registered physical certificate, rather than in book-entry form through the facilities of DTC. The successful bidder seeking the issuance of Notes in this manner shall bear any and all costs of any re-registration or transfer of Notes from time to time. Any bidder seeking to have the Notes issued in the form of fully registered physical certificates, rather than in book-entry form, shall indicate this preference to the City at the time of the submission of the winning bid. The City reserves the right to decline any request to issue Notes in non-book entry form if it should determine, in its sole discretion, that issuing Notes in this manner is not in its best interests.
It shall be the condition of a successful bidder’s obligation to accept delivery of and pay for the Notes that, contemporaneously with or before accepting the Notes and paying therefor, it shall be furnished, without cost, with (a) the approving opinion of the firm of Locke Lord LLP, Boston, Massachusetts, Bond Counsel to the City, with respect to the Notes, (b) a certificate in form satisfactory to said firm, dated as of the date of delivery of the Notes and receipt of payment therefor, to the effect that there is no litigation pending, or to the knowledge of the signer or signers thereof, threatened affecting the validity of the Notes or the power of the City to levy and collect taxes to pay them, (c) a certificate of the City’s Treasurer to the effect that, to the best of her knowledge and belief, both the Preliminary Official Statement as of its date and the date of sale and the Final Official Statement as of its date and as of the date of delivery of such Notes did not and do not contain any untrue statement of a material fact and did not and do not omit to state a material fact necessary to make the statements made therein, in the light of the circumstances under which they were made, not misleading, and (d) a significant events disclosure certificate in the form described in the Preliminary Official Statement.
Establishment of Issue Price.
The following applies to each successful bidder with respect to the portion of the Notes awarded to each successful bidder.
A successful bidder for the Notes shall assist the City in establishing the issue price of the Notes and shall execute and deliver to the City on the Closing Date an “issue price” or similar certificate, substantially in the applicable form set forth in Exhibit 1 to this Notice of Sale, setting forth the reasonably expected initial offering price to the public or the actual sale price of such Notes, together with the supporting pricing wires or equivalent communications, or, if applicable, the amount bid, with such modifications as may be appropriate or necessary, in the reasonable judgment of the successful bidder, the City and Bond Counsel. All actions to be taken by the City under this Notice of Sale to establish the issue price of the Notes may be taken on behalf of the City by Hilltop Securities Inc. (“Financial Advisor”) and any notice or report to be provided to the City may be provided to the Financial Advisor.
Competitive Sale Requirements. If the competitive sale requirements (“competitive sale requirements”) set forth in Treasury Regulation § 1.148-1(f)(3)(i) (defining “competitive sale” for purposes of establishing the issue price of the Notes) have been satisfied, the City will furnish to the successful bidder on the Closing Date a certificate of the Financial Advisor, which will certify each of the following conditions to be true:
1. the City has disseminated this Notice of Sale to potential underwriters in a manner that is reasonably designed to reach potential underwriters;
2. all bidders had an equal opportunity to bid;
3. the City received bids from at least three underwriters of municipal bonds who have established industry reputations for underwriting new issuances of municipal bonds; and
4. the City awarded the sale of the Notes to the bidder who submitted a firm offer to purchase the Notes at the highest price (or lowest interest cost), as set forth in this Notice of Sale.
Any bid submitted pursuant to this Notice of Sale shall be considered a firm offer for the purchase of the Notes, as specified in the bid. Unless a bidder notifies the City prior to submitting its bid by facsimile to the Financial Advisor facsimile (617) 619-4411 or telephone (617) 619-4400, or in its bid submitted via Parity, that it will not be an “underwriter” (as defined below) of the Notes, by submitting its bid, each bidder shall be deemed to confirm that it has an established industry reputation for underwriting new issuances of municipal bonds. Unless the bidder has notified the City that it will not be an “underwriter” (as defined below) of the Notes, in submitting a bid, each bidder is deemed to acknowledge that it is an “underwriter” that intends to reoffer the Notes to the public.

3
In the event that the competitive sale requirements are not satisfied, the City shall so advise the successful bidder. Failure to Meet the Competitive Sale Requirements – Option A – The Successful Bidder Intends to Reoffer the Notes to the Public and the 10% Test to Apply. If the competitive sale requirements are not satisfied with respect to the Notes and the successful bidder intends to reoffer such Notes to the public, the Successful Bidder may, at its option, use the first price at which 10% of the Notes (the “10% test”) is sold to the public as the issue price of the Notes. The successful bidder shall advise the Financial Advisor if the 10% test is satisfied as of the date and time of the award of the Notes. The City will not require bidders to comply with the “hold-the-offering-price rule” set forth in the applicable Treasury Regulations and therefore does not intend to use the initial offering price to the public as of the Sale Date as the issue price of the Notes if the competitive sale requirements are not met and this option is chosen. If the competitive sale requirements are not satisfied, then until the 10% test has been satisfied as to Notes or all of the Notes are sold to the public, the successful bidder agrees to promptly report to the Financial Advisor the prices at which the unsold Notes have been sold to the public, which reporting obligation shall continue, whether or not the Closing Date has occurred, until the 10% test has been satisfied for the Notes or until all the Notes have been sold. The successful bidder shall be obligated to report each sale of Notes to the Financial Advisor until notified in writing by the City or the Financial Advisor that it no longer needs to do so.
By submitting a bid and if the competitive sale requirements are not met, each bidder confirms that: (i) any agreement among underwriters, any selling group agreement and each third-party distribution agreement (to which the bidder is a party) relating to the initial sale of the Notes to the public, together with the related pricing wires, contains or will contain language obligating each underwriter, each dealer who is a member of the selling group, and each broker-dealer that is a party to such third-party distribution agreement, as applicable, to report the prices at which it sells to the public the unsold Notes allotted to it until it is notified by the successful bidder that either the 10% test has been satisfied as to the Notes or all of the Notes have been sold to the public, if and for so long as directed by the successful bidder and as set forth in the related pricing wires and (ii) any agreement among underwriters relating to the initial sale of the Notes to the public, together with the related pricing wires, contains or will contain language obligating each underwriter that is a party to a third-party distribution agreement to be employed in connection with the initial sale of the Notes to the public to require each broker-dealer that is a party to such third-party distribution agreement to report the prices at which it sells to the public the unsold Notes allotted to it until it is notified by the successful bidder or such underwriter that either the 10% test has been satisfied as to the Notes or that all of the Notes have been sold to the public if and for so long as directed by the successful bidder or such underwriter and as set forth in the related pricing wires. Sales of any Notes to any person that is a related party to an underwriter shall not constitute sales to the public for purposes of this Notice of Sale. Further, for purposes of this Notice of Sale:
1. “public” means any person other than an underwriter or a related party,
2. “underwriter” means (A) any person, including the successful bidder, that agrees pursuant to a written contract with the City (or with the lead underwriter to form an underwriting syndicate) to participate in the initial sale of the Notes to the public and (B) any person that agrees pursuant to a written contract directly or indirectly with a person described in clause (A) to participate in the initial sale of the Notes to the public (including a member of a selling group or a party to a third-party distribution agreement participating in the initial sale of the Notes to the public), and
3. a purchaser of any of the Notes is a “related party” to an underwriter if the underwriter and the purchaser are subject, directly or indirectly, to (i) more than 50% common ownership of the voting power or the total value of their stock, if both entities are corporations (including direct ownership by one corporation of another), (ii) more than 50% common ownership of their capital interests or profits interests, if both entities are partnerships (including direct ownership by one partnership of another), or (iii) more than 50% common ownership of the value of the outstanding stock of the corporation or the capital interests or profit interests of the partnership, as applicable, if one entity is a corporation and the other entity is a partnership (including direct ownership of the applicable stock or interests by one entity of the other).
Failure to Meet the Competitive Sale Requirements — Option B — The Successful Bidder Intends to Reoffer the Notes to the Public and Agrees to Hold the Price of Maturities of Notes for Which the 10% Test in Option A Is Not Met as of the Sale Date. The successful bidder may, at its option, notify the Financial Advisor in writing, which may be by email (the "Hold the Price Notice"), not later than 4:00 p.m. on the Sale Date, that it has not sold 10% of the Notes listed in the Hold the Price Notice (the "Unsold Maturities") and that the successful bidder will not offer the Unsold Maturities to any person at a price that is higher than the initial offering price to the public during the period starting on the Sale Date and ending on the earlier of (i) the close of the fifth business day after the Sale Date or (ii) the date on which the successful bidder has sold at least 10% of the applicable Unsold Maturity to the public at a price that is no higher than the initial offering price to the public. If the successful bidder delivers a Hold the Price Notice to the Financial Advisor, the successful bidder must provide to the City on or before the Closing Date, in addition to the certification described in Option A above, evidence that each underwriter of the Notes, including underwriters in an underwriting syndicate

4
or selling group, has agreed in writing to hold the price of the Unsold Maturities in the manner described in the preceding sentence. Failure to Meet the Competitive Sale Requirements and/or the Successful Bidder Does Not Intend to Reoffer the Notes to the Public – Option C. If the successful bidder has purchased the Notes for its own account and will not distribute or resell the Notes to the public, then, whether or not the competitive sale requirements were met, the issue price certificate will recite such facts and identify the price or prices at which the purchase of the Notes was made. In order to assist bidders in complying with the requirements of paragraph (b)(5)(i)(C) of Rule 15c2-12 promulgated by the Securities and Exchange Commission, the City will undertake to provide notices of certain significant events. A description of this undertaking is set forth in the Preliminary Official Statement. It is anticipated that CUSIP identification numbers will be printed on Notes issued in book-entry form. The City assumes no responsibility for any CUSIP Service Bureau or other charge that may be imposed for the assignment of such number. The Notes will be delivered to The Depository Trust Company or the office of its custodial agent, or to the registered owner if a fully registered note certificate is requested by the successful bidder and the issuance of such certificate is approved by the City, on or about October 25, 2019 for credit to the City in federal reserve funds. Additional information concerning the City of Somerville and the Notes is contained in the Preliminary Official Statement dated October 8, 2019 to which prospective bidders are directed. The Preliminary Official Statement is provided for informational purposes, and is not a part of this Notice of Sale. The Preliminary Official Statement has been deemed final by the City except for the omission of the reoffering prices, interest rates, and other terms of the Notes depending on such matters, and the identity of the underwriters, but is subject to change without notice and to completion or amendment in a Final Official Statement. Copies of the Preliminary Official Statement may be obtained from Hilltop Securities Inc., 54 Canal Street, Suite 320, Boston, Massachusetts 02114 (Telephone: 617-619-4400). Within seven business days following the award of the Notes and receipt of necessary information from the successful bidder(s), 5 copies of the Final Official Statement will be made available to the successful bidder(s). Upon request, additional copies will be provided at the expense of the requesting successful bidder.
CITY OF SOMERVILLE, MASSACHUSETTS
/s/ Linda Dubuque, Treasurer/Collector
October 8, 2019

5
EXHIBIT 1
[Issue Price Certificate for Use If the Competitive Sale Requirements Are Met]
City of Somerville, Massachusetts $105,000,000 General Obligation Bond Anticipation Notes dated October 25, 2019
ISSUE PRICE CERTIFICATE AND RECEIPT
The undersigned, on behalf of _______________________ (the “Successful Bidder”), hereby certifies as set forth below with respect to the sale of the above-captioned obligations (the “Notes”) of the City of Somerville, Massachusetts (the “Issuer”).
1. Reasonably Expected Initial Offering Prices.
(a) As of the Sale Date, the reasonably expected initial offering prices of the Notes to the Public by the Successful Bidder are the prices listed in Schedule A (the “Expected Offering Prices”). The Expected Offering Prices are the prices for the Maturities of the Notes used by the Successful Bidder in formulating its bid to purchase the Notes. Attached as Schedule B is a true and correct copy of the bid provided by the Successful Bidder to purchase the Notes.
(b) The Successful Bidder was not given the opportunity to review other bids prior to submitting its bid.
(c) The bid submitted by the Successful Bidder constituted a firm offer to purchase the Notes.
2. Defined Terms.
(a) Maturity means Notes with the same credit and payment terms. Notes with different maturity dates, or Notes with the same maturity date but different stated interest rates, are treated as separate Maturities.
(b) Public means any person (including an individual, trust, estate, partnership, association, company, or corporation) other than an Underwriter or a related party to an Underwriter. The term “related party” for purposes of this certificate generally means any two or more persons who have greater than 50 percent common ownership, directly or indirectly.
(c) Sale Date means the first day on which there is a binding contract in writing for the sale of a Maturity of the Notes. The Sale Date of the Notes is October 16, 2019.
(d) Underwriter means (i) any person, including the Successful Bidder, that agrees pursuant to a written contract with the Issuer (or with the lead underwriter to form an underwriting syndicate) to participate in the initial sale of the Notes to the Public, and (ii) any person that agrees pursuant to a written contract directly or indirectly with a person described in clause (i) of this paragraph to participate in the initial sale of the Notes to the Public (including a member of a selling group or a party to a third-party distribution agreement participating in the initial sale of the Notes to the Public).
3. Receipt. The Successful Bidder hereby acknowledges receipt of the Notes and further acknowledges receipt of all certificates, opinions, and other documents required to be delivered to the Successful Bidder, before or simultaneously with the Notes, which certificates, opinions, and other documents are satisfactory to the Successful Bidder.
The representations set forth in this certificate are limited to factual matters only. Nothing in this certificate represents the Successful Bidders interpretation of any laws, including specifically Sections 103 and 148 of the Internal Revenue Code of 1986, as amended, and the Treasury Regulations thereunder. The undersigned understands that the foregoing information will be relied upon by the Issuer with respect to certain of the representations set forth in the Tax Certificate and with respect to compliance with the federal income tax rules affecting the Notes, and by Locke Lord LLP in connection with rendering its opinion that the interest on the Notes is excluded from gross income for federal income tax purposes, the preparation of the Internal Revenue Service Form 8038-G, and other federal income tax advice that it may give to the Issuer from time to time relating to the Notes. Dated: ___________, 2019 [NAME OF SUCCESSFUL BIDDER]
By: ________________________________ Name: Title:

6
SCHEDULE A
EXPECTED OFFERING PRICES
(To Be Attached)
SCHEDULE B
COPY OF SUCCESSFUL BIDDER’S BID
(To Be Attached)

7
EXHIBIT 1 – OPTION A
[Issue Price Certificate for Use If the Competitive Sale Requirements Are Not Met and the Hold the Price Rule Is Not Used]
City of Somerville, Massachusetts $105,000,000 General Obligation Bond Anticipation Notes dated October 25, 2019
ISSUE PRICE CERTIFICATE AND RECEIPT
The undersigned, on behalf of ______________________, (the “[Successful Bidder][Representative]”), on behalf of itself [and [NAMES OF OTHER UNDERWRITERS]] hereby certifies as set forth below with respect to the sale and issuance of the above-captioned obligations (the “Notes”) of the City of Somerville, Massachusetts (the “Issuer”).
1. Sale of the Notes. As of the date of this certificate, [except as set forth in the following paragraph,] for each Maturity of the Notes, the first price at which at least 10% of such Maturity of the Notes was sold to the Public is the respective price listed in Schedule A.
[Only use the next paragraph if the 10% test has not been met or all of the Notes have not been sold for one or more Maturities of Notes as of the Closing Date.]
For each Maturity of the Notes as to which no price is listed in Schedule A, as set forth in the Notice of Sale for the Notes, until at least 10% of each such Maturity of the Notes is sold to the Public (the “10% test”) or all of the Notes are sold to the Public, the [Successful Bidder][Representative] agrees to promptly report to the Issuer’s financial advisor, Hilltop Securities Inc. (the “Financial Advisor”) the prices at which the unsold Notes of each Maturity have been sold to the Public, which reporting obligation shall continue after the date hereof until the 10% test has been satisfied for each Maturity of the Notes or until all the Notes of a Maturity have been sold. The [Successful Bidder][Representative] shall continue to report each sale of Notes to the Financial Advisor until notified by email or in writing by the Issuer or the Financial Advisor that it no longer needs to do so.
2. Defined Terms.
(a) Maturity means Notes with the same credit and payment terms. Notes with different maturity dates, or Notes with the same maturity date but different stated interest rates, are treated as separate Maturities.
(b) Public means any person (including an individual, trust, estate, partnership, association, company, or corporation) other than an Underwriter or a related party to an Underwriter. The term “related party” for purposes of this certificate generally means any two or more persons who have greater than 50 percent common ownership, directly or indirectly.
(c) Underwriter means (i) any person, including the [Successful Bidder][Representative], that agrees pursuant to a written contract with the Issuer (or with the lead underwriter to form an underwriting syndicate) to participate in the initial sale of the Notes to the Public, and (ii) any person that agrees pursuant to a written contract directly or indirectly with a person described in clause (i) of this paragraph to participate in the initial sale of the Notes to the Public (including a member of a selling group or a party to a third-party distribution agreement participating in the initial sale of the Notes to the Public).
3. Receipt. The [Successful Bidder][Representative] hereby acknowledges receipt of the Notes and further acknowledges receipt of all certificates, opinions, and other documents required to be delivered to the [Successful Bidder][Representative], before or simultaneously with the Notes, which certificates, opinions, and other documents are satisfactory to the [Successful Bidder][Representative].
The representations set forth in this certificate are limited to factual matters only. Nothing in this certificate represents the [Successful Bidder][Representative]’s interpretation of any laws, including specifically Sections 103 and 148 of the Internal Revenue Code of 1986, as amended, and the Treasury Regulations thereunder. The undersigned understands that the foregoing information will be relied upon by the Issuer with respect to certain of the representations set forth in the Tax Certificate and with respect to compliance with the federal income tax rules affecting the Notes, and by Locke Lord LLP in connection with rendering its opinion that the interest on the Notes is excluded from gross income for federal income tax purposes, the preparation of the Internal Revenue Service Form 8038-G, and other federal income tax advice that it may give to the Issuer from time to time relating to the Notes. Dated: __________, 2019 [SUCCESSFUL BIDDER][REPRESENTATIVE]
By: ________________________________ Name:
Title:

8
SCHEDULE A
SALE PRICES (To be Attached)

9
EXHIBIT 1 – OPTION B
[Issue Price Certificate for Use If the Competitive Sale Requirements Are Not Met and the Hold the Price Rule Is Used]
City of Somerville, Massachusetts
$105,000,000 General Obligation Bond Anticipation Notes dated October 25, 2019
ISSUE PRICE CERTIFICATE AND RECEIPT
The undersigned, on behalf of ______________________ (the (“[Successful Bidder][Representative]”), on behalf of itself [and [NAMES OF OTHER UNDERWRITERS] ]hereby certifies as set forth below with respect to the sale and issuance of the above-captioned obligations (the “Notes”) of the City of Somerville, Massachusetts (the “Issuer”).
1. Sale of the Notes. As of the date of this certificate, [except as set forth in following paragraph,] for each Maturity of the Notes, the first price at which at least 10% of such Maturity of the Notes was sold to the Public is the respective price listed in Schedule A.
[Only use the next paragraph if the 10% test has not been met as of the Sale Date.]
For each Maturity of the Notes as to which no price is listed in Schedule A (the “Unsold Maturities”), as set forth in the Notice of Sale for the Notes, the [Successful Bidder][Representative] and any other Underwriter did not [and will not] reoffer the Unsold Maturities until the earlier of (i) __________, 2019 or (ii) the date on which the [Successful Bidder][Representative] or any other Underwriter sold at least 10% of each Unsold Maturity at a price that is no higher than the initial offering price to the Public.
2. Defined Terms.
(a) Maturity means Notes with the same credit and payment terms. Notes with different maturity dates, or Notes with the same maturity date but different stated interest rates, are treated as separate Maturities.
(b) Public means any person (including an individual, trust, estate, partnership, association, company, or corporation) other
than an Underwriter or a related party to an Underwriter. The term “related party” for purposes of this certificate generally means any two or more persons who have greater than 50 percent common ownership, directly or indirectly.
(c) Underwriter means (i) any person, including the [Successful Bidder][Representative], that agrees pursuant to a written
contract with the Issuer (or with the lead underwriter to form an underwriting syndicate) to participate in the initial sale of the Notes to the Public, and (ii) any person that agrees pursuant to a written contract directly or indirectly with a person described in clause (i) of this paragraph to participate in the initial sale of the Notes to the Public (including a member of a selling group or a party to a third-party distribution agreement participating in the initial sale of the Notes to the Public).
3. Receipt. The [Successful Bidder][Representative] hereby acknowledges receipt of the Notes and further acknowledges receipt of all certificates, opinions and other documents required to be delivered to the [Successful Bidder][Representative], before or simultaneously with the delivery of the Notes, which certificates, opinions and other documents are satisfactory to the [Successful Bidder][Representative].
The representations set forth in this certificate are limited to factual matters only. Nothing in this certificate represents the [Successful Bidder’s][Representative’s] interpretation of any laws, including specifically Sections 103 and 148 of the Internal Revenue Code of 1986, as amended, and the Treasury Regulations thereunder. The undersigned understands that the foregoing information will be relied upon by the Issuer with respect to certain of the representations set forth in the Tax Certificate and with respect to compliance with the federal income tax rules affecting the Notes, and by Locke Lord LLP in connection with rendering its opinion that the interest on the Notes is excluded from gross income for federal income tax purposes, the preparation of the Internal Revenue Service Form 8038-G, and other federal income tax advice that it may give to the Issuer from time to time relating to the Notes. Dated: ______________, 2019 [SUCCESSFUL BIDDER][REPRESENTATIVE]
By: ________________________________ Name: Title:

10
SCHEDULE A
SALE PRICES
(To be Attached)
11
OFFICIAL STATEMENT
CITY OF SOMERVILLE, MASSACHUSETTS
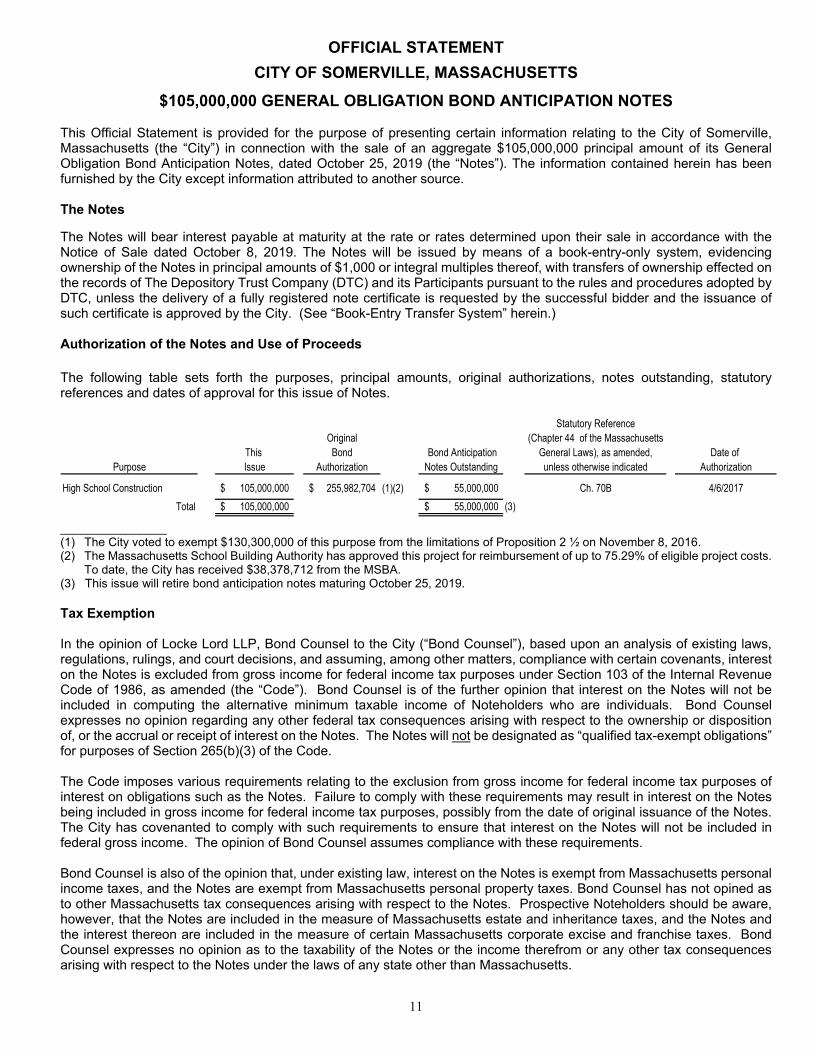
$105,000,000 GENERAL OBLIGATION BOND ANTICIPATION NOTES This Official Statement is provided for the purpose of presenting certain information relating to the City of Somerville, Massachusetts (the “City”) in connection with the sale of an aggregate $105,000,000 principal amount of its General Obligation Bond Anticipation Notes, dated October 25, 2019 (the “Notes”). The information contained herein has been furnished by the City except information attributed to another source. The Notes The Notes will bear interest payable at maturity at the rate or rates determined upon their sale in accordance with the Notice of Sale dated October 8, 2019. The Notes will be issued by means of a book-entry-only system, evidencing ownership of the Notes in principal amounts of $1,000 or integral multiples thereof, with transfers of ownership effected on the records of The Depository Trust Company (DTC) and its Participants pursuant to the rules and procedures adopted by DTC, unless the delivery of a fully registered note certificate is requested by the successful bidder and the issuance of such certificate is approved by the City. (See “Book-Entry Transfer System” herein.) Authorization of the Notes and Use of Proceeds The following table sets forth the purposes, principal amounts, original authorizations, notes outstanding, statutory references and dates of approval for this issue of Notes.
Statutory ReferenceOriginal (Chapter 44 of the Massachusetts
This Bond Bond Anticipation General Laws), as amended, Date of Purpose Issue Authorization Notes Outstanding unless otherwise indicated Authorization
High School Construction 105,000,000$ 255,982,704$ (1)(2) 55,000,000$ Ch. 70B 4/6/2017
Total 105,000,000$ 55,000,000$ (3)
________________ (1) The City voted to exempt $130,300,000 of this purpose from the limitations of Proposition 2 ½ on November 8, 2016. (2) The Massachusetts School Building Authority has approved this project for reimbursement of up to 75.29% of eligible project costs.
To date, the City has received $38,378,712 from the MSBA. (3) This issue will retire bond anticipation notes maturing October 25, 2019. Tax Exemption In the opinion of Locke Lord LLP, Bond Counsel to the City (“Bond Counsel”), based upon an analysis of existing laws, regulations, rulings, and court decisions, and assuming, among other matters, compliance with certain covenants, interest on the Notes is excluded from gross income for federal income tax purposes under Section 103 of the Internal Revenue Code of 1986, as amended (the “Code”). Bond Counsel is of the further opinion that interest on the Notes will not be included in computing the alternative minimum taxable income of Noteholders who are individuals. Bond Counsel expresses no opinion regarding any other federal tax consequences arising with respect to the ownership or disposition of, or the accrual or receipt of interest on the Notes. The Notes will not be designated as “qualified tax-exempt obligations” for purposes of Section 265(b)(3) of the Code. The Code imposes various requirements relating to the exclusion from gross income for federal income tax purposes of interest on obligations such as the Notes. Failure to comply with these requirements may result in interest on the Notes being included in gross income for federal income tax purposes, possibly from the date of original issuance of the Notes. The City has covenanted to comply with such requirements to ensure that interest on the Notes will not be included in federal gross income. The opinion of Bond Counsel assumes compliance with these requirements. Bond Counsel is also of the opinion that, under existing law, interest on the Notes is exempt from Massachusetts personal income taxes, and the Notes are exempt from Massachusetts personal property taxes. Bond Counsel has not opined as to other Massachusetts tax consequences arising with respect to the Notes. Prospective Noteholders should be aware, however, that the Notes are included in the measure of Massachusetts estate and inheritance taxes, and the Notes and the interest thereon are included in the measure of certain Massachusetts corporate excise and franchise taxes. Bond Counsel expresses no opinion as to the taxability of the Notes or the income therefrom or any other tax consequences arising with respect to the Notes under the laws of any state other than Massachusetts.
12
To the extent the issue price of any maturity of the Notes is less than the amount to be paid at maturity of such Notes (excluding amounts stated to be interest and payable at least annually over the term of such Notes), the difference constitutes “original issue discount,” the accrual of which, to the extent properly allocable to each owner thereof, is treated as interest on the Notes which is excluded from gross income for federal income tax purposes and is exempt from Massachusetts personal income taxes. For this purpose, the issue price of a particular maturity of the Notes is either the reasonably expected initial offering price to the public or the first price at which a substantial amount of such maturity of the Notes is sold to the public, as applicable. The original issue discount with respect to any maturity of the Notes accrues daily over the term to maturity of such Notes on the basis of a constant interest rate compounded semiannually (with straight-line interpolations between compounding dates). The accruing original issue discount is added to the adjusted basis of such Notes to determine taxable gain or loss upon disposition (including sale, redemption, or payment on maturity) of such Notes. Noteholders should consult their own tax advisors with respect to the tax consequences of ownership of Notes with original issue discount, including the treatment of purchasers who do not purchase such Notes in the original offering to the public at the reasonably expected initial offering price or, if applicable, the first price at which a substantial amount of such Notes is sold to the public. Notes purchased, whether at original issuance or otherwise, for an amount greater than the stated principal amount to be paid at maturity of such Notes, or, in some cases, at the earlier redemption date of such Notes (“Premium Notes”), will be treated as having amortizable note premium for federal income tax purposes and Massachusetts personal income tax purposes. No deduction is allowable for the amortizable note premium in the case of obligations, such as the Premium Notes, the interest on which is excluded from gross income for federal income tax purposes. However, a Noteholder’s basis in a Premium Note will be reduced by the amount of amortizable note premium properly allocable to such Noteholder. Holders of Premium Notes should consult their own tax advisors with respect to the proper treatment of amortizable note premium in their particular circumstances. Bond Counsel has not undertaken to determine (or to inform any person) whether any actions taken (or not taken) or events occurring (or not occurring) after the date of issuance of the Notes may adversely affect the value of, or the tax status of interest on, the Notes. Although Bond Counsel is of the opinion that interest on the Notes is excluded from gross income for federal income tax purposes and is exempt from Massachusetts personal income taxes, the ownership or disposition of, or the accrual or receipt of interest on, the Notes may otherwise affect the federal or state tax liability of a Noteholder. Among other possible consequences of ownership or disposition of, or the accrual or receipt of interest on, the Notes, the Code requires recipients of certain social security and certain railroad retirement benefits to take into account receipts or accruals of interest on the Notes in determining the portion of such benefits that are included in gross income. The nature and extent of all such other tax consequences will depend upon the particular tax status of the Noteholder or the Noteholder’s other items of income, deduction, or exclusion. Bond Counsel expresses no opinion regarding any such other tax consequences, and Noteholders should consult with their own tax advisors with respect to such consequences. Risk of Future Legislative Changes and/or Court Decisions Legislation affecting tax-exempt obligations is regularly considered by the United States Congress and may also be considered by the Massachusetts legislature. Court proceedings may also be filed, the outcome of which could modify the tax treatment of obligations such as the Notes. There can be no assurance that legislation enacted or proposed, or actions by a court, after the date of issuance of the Notes will not have an adverse effect on the tax status of interest on the Notes or the market value or marketability of the Notes. These adverse effects could result, for example, from changes to federal or state income tax rates, changes in the structure of federal or state income taxes (including replacement with another type of tax), or repeal (or reduction in the benefit) of the exclusion of interest on the Notes from gross income for federal or state income tax purposes for all or certain taxpayers.
For example, H.R. 1, signed into law on December 22, 2017, reduces the corporate tax rate, modifies individual tax rates, eliminates many deductions, and raises the income threshold above which the individual alternative minimum tax is invoked, among other things. These changes may increase, reduce or otherwise change the financial benefits of owning state and local government bonds or notes. Additionally, Noteholders should be aware that future legislative actions (including federal income tax reform) may retroactively change the treatment of all or a portion of the interest on the Notes for federal income tax purposes for all or certain taxpayers. In all such events, the market value of the Notes may be affected and the ability of Noteholders to sell their Notes in the secondary market may be reduced. The Notes are not subject to special mandatory redemption, and the interest rate on the Notes is not subject to adjustment, in the event of any such change in the tax treatment of interest on the Notes.
Investors should consult their own financial and tax advisors to analyze the importance of these risks.

13
Book-Entry Transfer System
The following section shall apply to the Notes unless the successful bidder requests and the City approves the delivery of a fully registered physical certificate to such bidder. The Depository Trust Company ("DTC"), New York, NY, will act as securities depository for the Notes. The Notes will be issued in fully-registered form registered in the name of Cede & Co. (DTC's partnership nominee) or such other name as may be requested by an authorized representative of DTC. One-fully registered Note certificate will be issued for each interest rate, each in the aggregate principal amount bearing such interest rate, and will be deposited with DTC. DTC, the world's largest securities depository, is a limited-purpose trust company organized under the New York Banking Law, a "banking organization" within the meaning of the New York Banking Law, a member of the Federal Reserve System, a "clearing corporation" within the meaning of the New York Uniform Commercial Code, and a "clearing agency" registered pursuant to the provisions of Section 17A of the Securities Exchange Act of 1934. DTC holds and provides asset servicing for over 3.5 million issues of U.S. and non-U.S. equity, corporate and municipal debt issues, and money market instruments (from over 100 countries) that DTC's participants ("Direct Participants") deposit with DTC. DTC also facilitates the post-trade settlement among Direct Participants of sales and other securities transactions in deposited securities, through electronic computerized book-entry transfers and pledges between Direct Participants' accounts. This eliminates the need for physical movement of securities certificates. Direct Participants include both U.S. and non-U.S. securities brokers and dealers, banks, trust companies, clearing corporations, and certain other organizations. DTC is a wholly-owned subsidiary of The Depository Trust & Clearing Corporation ("DTCC"). DTCC is the holding company for DTC, National Securities Clearing Corporation and Fixed Income Clearing Corporation, all of which are registered clearing agencies. DTCC is owned by the users of its regulated subsidiaries. Access to the DTC system is also available to others such as both U.S. and non-U.S. securities brokers and dealers, banks, trust companies, and clearing corporations that clear through or maintain a custodial relationship with a Direct Participant, either directly or indirectly ("Indirect Participants"). DTC has a Standard & Poor's AA+ rating. The DTC Rules applicable to its Participants are on file with the Securities and Exchange Commission. More information about DTC can be found at www.dtcc.com. Purchases of securities deposited with DTC must be made by or through Direct Participants, which will receive a credit for such securities on DTC's records. The ownership interest of each actual purchaser of each security deposited with DTC ("Beneficial Owner") is in turn to be recorded on the Direct and Indirect Participants' records. Beneficial Owners will not receive written confirmation from DTC of their purchase. Beneficial Owners are, however, expected to receive written confirmations providing details of the transaction, as well as periodic statements of their holdings, from the Direct or Indirect Participant through which the Beneficial Owner entered into the transaction. Transfers of ownership interests in the securities deposited with DTC are to be accomplished by entries made on the books of Direct and Indirect Participants acting on behalf of Beneficial Owners. Beneficial Owners will not receive certificates representing their ownership interests in the securities deposited with DTC, except in the event that use of the book-entry system for such securities is discontinued. To facilitate subsequent transfers, all securities deposited by Direct Participants with DTC are registered in the name of DTC's partnership nominee, Cede & Co., or such other name as may be requested by an authorized representative of DTC. The deposit of securities with DTC and their registration in the name of Cede & Co. or such other DTC nominee do not effect any change in beneficial ownership. DTC has no knowledge of the actual Beneficial Owners of the securities deposited with DTC; DTC's records reflect only the identity of the Direct Participants to whose accounts such securities are credited, which may or may not be the Beneficial Owners. The Direct and Indirect Participants will remain responsible for keeping account of their holdings on behalf of their customers. Conveyance of notices and other communications by DTC to Direct Participants, by Direct Participants to Indirect Participants, and by Direct Participants and Indirect Participants to Beneficial Owners will be governed by arrangements among them, subject to any statutory or regulatory requirements as may be in effect from time to time. Neither DTC nor Cede & Co. (nor such other DTC nominee) will consent or vote with respect to securities deposited with DTC unless authorized by a Direct Participant in accordance with DTC's MMI Procedures. Under its usual procedures, DTC mails an Omnibus Proxy to the issuer of such securities or its paying agent as soon as possible after the record date. The Omnibus Proxy assigns Cede & Co.'s consenting or voting rights to those Direct Participants to whose accounts such securities are credited on the record date (identified in a listing attached to the Omnibus Proxy). Principal and interest payments on securities held by DTC will be made to Cede & Co., or such other nominee as may be requested by an authorized representative of DTC. DTC's practice is to credit Direct Participants' accounts upon DTC's receipt of funds and corresponding detail information from the issuer of such securities or its paying agent, on the payable date in accordance with their respective holdings shown on DTC's records. Payments by Participants to Beneficial Owners will be governed by standing instructions and customary practices, as is the case with securities held for the accounts of customers in bearer form or registered in "street name," and will be the responsibility of such Participant and not of DTC

14
(nor its nominee), the issuer of such securities or its paying agent, subject to any statutory or regulatory requirements as may be in effect from time to time. Payment of principal and interest to Cede & Co. (or such other nominee as may be requested by an authorized representative of DTC) is the responsibility of the issuer of such securities or its paying agent, disbursement of such payments to Direct Participants will be the responsibility of DTC, and disbursement of such payments to the Beneficial Owners will be the responsibility of Direct and Indirect Participants. DTC may discontinue providing its services as depository with respect to securities held by it at any time by giving reasonable notice to the issuer of such securities or its paying agent. Under such circumstances, in the event that a successor depository is not obtained, physical certificates are required to be printed and delivered to Beneficial Owners. The issuer of securities may decide to discontinue use of the system of book-entry-only transfers through DTC (or a successor securities depository). In that event, physical certificates will be printed and delivered to Beneficial Owners. The information in this section concerning DTC and DTC's book-entry system has been obtained from sources that the City believes to be reliable, but the City takes no responsibility for the accuracy thereof. Security and Remedies Full Faith and Credit. General obligation bonds and notes of a Massachusetts city or town constitute a pledge of its full faith and credit. Payment is not limited to a particular fund or revenue source. Except for “qualified bonds” as described (see “Serial Bonds and Notes” under “TYPES OF OBLIGATIONS” below) and setoffs of state distributions as described below (see “State Distributions” below), no provision is made by the Massachusetts statutes for priorities among bonds and notes and other general obligations, although the use of certain moneys may be restricted. Tax Levy. The Massachusetts statutes direct the municipal assessors to include annually in the tax levy for the next fiscal year “all debt and interest charges matured and maturing during the next fiscal year and not otherwise provided for and all amounts necessary to satisfy final judgments”. Specific provision is also made for including in the next tax levy payments of rebate amounts not otherwise provided for and payment of notes in anticipation of federal or state aid, if the aid is no longer forthcoming. The total amount of a tax levy is limited by statute. However, the voters in each municipality may vote to exclude from the limitation any amounts required to pay debt service on indebtedness incurred before November 4, 1980. Local voters may also vote to exempt specific subsequent bond issues from the limitation. (See “Tax Limitations” Under “PROPERTY TAXATION” below.) In addition, obligations incurred before November 4, 1980 may be constitutionally entitled to payment from taxes in excess of the statutory limit. No Lien. Except for taxes on the increased value of certain property in designated development districts which may be pledged for the payment of debt service on bonds issued to finance economic development projects within such districts, no provision is made for a lien on any portion of the tax levy or any other moneys to secure particular bonds or notes or bonds and notes generally (or judgments on bonds or notes) in priority to other claims. Provision is made, however, for borrowing to pay judgments, subject to the General Debt Limit. (See “DEBT LIMITS” below.) Subject to the approval of the State Director of Accounts for judgments above $10,000, judgments may also be paid from available funds without appropriation and included in the next tax levy unless other provision is made. Court Proceedings. Cities and towns are subject to suit on their general obligation bonds and notes and courts of competent jurisdiction have power in appropriate proceedings to order payment of a judgment on the bonds or notes from lawfully available funds or, if necessary, to order the city or town to take lawful action to obtain the required money, including the raising of it in the next annual tax levy, within the limits prescribed by law. (See “Tax Limitations” under “PROPERTY TAXATION” below.) In exercising their discretion as to whether to enter such an order, the courts could take into account all relevant factors including the current operating needs of the city or town and the availability and adequacy of other remedies. The Massachusetts Supreme Judicial Court has stated in the past that a judgment against a municipality can be enforced by the taking and sale of the property of any inhabitant. However, there has been no judicial determination as to whether this remedy is constitutional under current due process and equal protection standards. Restricted Funds. Massachusetts statutes also provide that certain water, gas and electric, community antenna television system, telecommunications, sewer, parking meter and passenger ferry fees, community preservation and affordable housing receipts may be used only for water, gas and electric, community antenna television system, telecommunications, sewer, parking, mitigation of ferry service impacts, community preservation and affordable housing purposes, respectively; accordingly, moneys derived from these sources may be unavailable to pay general obligation bonds and notes issued for other purposes. A city or town that accepts certain other statutory provisions may establish an enterprise fund for a utility, health care, solid waste, recreational or transportation facility and for police or fire services; under those provisions any surplus in the fund is restricted to use for capital expenditures or reduction of user charges. In addition, subject to certain limits, a city or town may annually authorize the establishment of one or more revolving funds in connection with use of certain revenues
15
for programs that produce those revenues; interest earned on a revolving fund is treated as general fund revenue. A city or town may also establish an energy revolving loan fund to provide loans to owners of privately-held property in the city or town for certain energy conservation and renewable energy projects, and may borrow to establish such a fund. The loan repayments and interest earned on the investment of amounts in the fund shall be credited to the fund. Also, the annual allowance for depreciation of a gas and electric plant or a community antenna television and telecommunications system is restricted to use for plant or system renewals and improvements, for nuclear decommissioning costs, and costs of contractual commitments, or, with the approval of the State Department of Telecommunications and Energy, to pay debt incurred for plant or system reconstruction or renewals. Revenue bonds and notes issued in anticipation of them may be secured by a prior lien on specific revenues. Receipts from industrial users in connection with industrial revenue financings are also not available for general municipal purposes. State Distributions. State grants and distributions may in some circumstances be unavailable to pay general obligation bonds and notes of a city or town in that the State Treasurer is empowered to deduct from such grants and distributions the amount of any debt service paid on “qualified bonds” (See “Serial Bonds and Notes” under “TYPES OF OBLIGATIONS” below) and any other sums due and payable by the city or town to the Commonwealth or certain other public entities, including any unpaid assessments for costs of any public transportation authority (such as the Massachusetts Bay Transportation Authority or a regional transit authority) of which it is a member, for costs of the Massachusetts Water Resources Authority if the city or town is within the territory served by the Authority, for any debt service due on obligations issued to the Massachusetts School Building Authority. or for charges necessary to meet obligations under the Commonwealth’s Clean Water and Drinking Water Revolving Loan Programs, including such charges imposed by another local governmental unit that provides wastewater collection or treatment services or drinking water services to the city or town. If a city or town is (or is likely to be) unable to pay principal or interest on its bonds or notes when due, it is required to notify the State Commissioner of Revenue. The Commissioner shall in turn, after verifying the inability, certify the inability to the State Treasurer. The State Treasurer shall pay the due or overdue amount to the paying agent for the bonds or notes, in trust, within three days after the certification or one business day prior to the due date (whichever is later). This payment is limited, however, to the estimated amount otherwise distributable by the Commonwealth to the city or town during the remainder of the fiscal year (after the deductions mentioned in the foregoing paragraph). If for any reason any portion of the certified sum has not been paid at the end of the fiscal year, the State Treasurer shall pay it as soon as practicable in the next fiscal year to the extent of the estimated distributions for that fiscal year. The sums so paid shall be charged (with interest and administrative costs) against the distributions to the city or town. The foregoing does not constitute a pledge of the faith and credit of the Commonwealth. The Commonwealth has not agreed to maintain existing levels of state distributions, and the direction to use estimated distributions to pay debt service may be subject to repeal by future legislation. Moreover, adoption of the annual appropriation act has sometimes been delayed beyond the beginning of the fiscal year and estimated distributions which are subject to appropriation may be unavailable to pay local debt service until they are appropriated. Bankruptcy. Enforcement of a claim for payment of principal or interest on general obligation bonds or notes would be subject to the applicable provisions of federal bankruptcy laws and to the provisions of other statutes, if any, hereafter enacted by the Congress or the State legislature extending the time for payment or imposing other constraints upon enforcement insofar as the same may be constitutionally applied. Massachusetts municipalities are not generally authorized by the Massachusetts General Laws to file a petition for bankruptcy under federal bankruptcy laws. In cases involving significant financial difficulties faced by a single city, town or regional school district, however, the Commonwealth has enacted special legislation to permit the appointment of a fiscal overseer, finance control board or, in the most extreme cases, a state receiver. In a limited number of these situations, however, such special legislation has also authorized the filing of federal bankruptcy proceedings, with the prior approval of the Commonwealth. In each case where such authority was granted, it expired at the termination of the Commonwealth’s oversight of the financially distressed city, town or regional school district. To date, no such filings have been approved or made. Opinion of Bond Counsel The unqualified approving opinion as to the validity of the Notes will be rendered by Locke Lord LLP, Boston, Massachusetts, Bond Counsel. The opinion will be dated the date of original delivery of the Notes and will speak only as of such date. Except as to matters expressly set forth in their opinion, the scope of engagement of Bond Counsel does not extend to passing upon or assuming responsibility for the accuracy or adequacy of any statement made in this Official Statement, and they make no representation that they have independently verified the same other than matters expressly set forth as their opinion.

16
Financial Advisory Services of Hilltop Securities Inc. Hilltop Securities Inc., Boston, Massachusetts, serves as financial advisor to the City. Disclosure of Significant Events In order to assist underwriters in complying with the requirements of paragraph (b)(5)(i)(C) of Rule 15c2-12 promulgated by the Securities and Exchange Commission (as amended, the “Rule”) applicable to municipal securities having a stated maturity of 18 months or less, the City will covenant for the benefit of the owners of the Notes to file with the Municipal Securities Rulemaking Board (the “MSRB”), notices of the occurrence of any of the following events with respect to the Notes within ten business days of such occurrence: (a) principal and interest payment delinquencies; (b) non-payment related defaults, if material; (c) unscheduled draws on debt service reserves reflecting financial difficulties; (d) unscheduled draws on credit enhancements reflecting financial difficulties; (e) substitution of credit or liquidity providers, or their failure to perform; (f) adverse tax opinions, the issuance by the Internal Revenue Service of proposed or final determination of taxability, Notices of Proposed Issue (IRS Form 5701-TEB) or other material notices or determinations with respect to the tax status of the Notes, or other material events affecting the tax status of the Notes; (g) modifications to rights of owners of the Notes, if material; (h) bond calls, if material, and tender offers; (i) defeasances; (j) release, substitution or sale of property securing the repayment of the Notes, if material; (k) ratings changes on the Notes; (l) bankruptcy, insolvency, receivership or similar event of the City; (m) the consummation of a merger, consolidation, or acquisition involving the City or the sale of all or substantially all of the assets of the City, other than in the ordinary course of business, the entry into a definitive agreement to undertake such an action or the termination of a definitive agreement relating to any such actions, other than pursuant to its terms, if material; (n) appointment of a successor or additional trustee or the change of name of a trustee, if material; (o) incurrence of a financial obligation of the City, if material, or agreement to covenants, events of default, remedies, priority rights, or other similar terms of a financial obligation of the City, any of which affect owners of the Notes, if material; and (p) default, event of acceleration, termination event, modification of terms, or other similar events under the terms of a financial obligation of the City, any of which reflect financial difficulties. The covenant will be included in a Significant Events Disclosure Certificate to be executed by the signers of the Notes and incorporated by reference in the Notes. The sole remedy available to the owners of the Notes for the failure of the City to comply with any provision of the certificate shall be an action for specific performance of the City’s obligations under the certificate and not for money damages; no other person shall have any right to enforce any provision of the certificate. In the past five years, the City has complied, in all material respects, with its previous undertakings to provide annual reports or notices of significant events in accordance with the Rule. The City has implemented procedures to assist in complying with its continuing disclosure obligations, including the additional significant events added to SEC Rule 15c2-12 that became effective on February 27, 2019.

17
CITY OF SOMERVILLE, MASSACHUSETTS General The City of Somerville, Massachusetts (the “City” or “Somerville”) is located in Middlesex County, three miles northwest of Boston. It is bordered by Cambridge on the south and southeast, Everett and the Charlestown section of Boston on the east, Medford on the north and Arlington on the west. Somerville has a population of 75,754 (Federal 2010 Census) and occupies a land area of 4.1 square miles. Settled in 1630 as a part of Charlestown, the City was established as a separate town in 1842 and incorporated as a city in 1872. The City has an elected Mayor and an eleven member City Council and operates under a Charter. Under the Charter, the City Council is the legislative body of the City.
PRINCIPAL CITY OFFICIALS
Manner of Entered Title Name Selection Office Term Expires (1)
Mayor Joseph A. Curtatone Elected January 2004 January 2020Treasurer/Collector Linda Dubuque Appointed October 2018 (2)Auditor Edward F. Bean Appointed April 2000 March 2018Clerk John Long Appointed January 2001 August 2020City Solicitor Francis X. Wright, Jr. Appointed May 2010 January 2018
_______________ (1) City officials with expired contracts continue to serve until such time as the contract is renewed or a new official is appointed. (2) Appointment by City Council pending.
Municipal Services The City provides governmental services for the territory within its boundaries, including police and fire protection, disposal of garbage and rubbish, public education in grades K-12, water and sewer services, street maintenance, and parks and recreational facilities. Water and sewer services are provided via connections to the Massachusetts Water Resources Authority. The Somerville Housing Authority provides housing for low income and elderly residents of the City. Transportation services include commuter bus, commuter train and public transit service to Boston, which is provided by the Massachusetts Bay Transportation Authority. Climate Change and Severe Weather Risks In 2017, the City released an extensive Climate Change Vulnerability Assessment (available here). This report assessed and ranked Somerville infrastructure, economy, and health and safety relative to the projected impacts of climate change. The study finds that precipitation-related flooding, coastal flooding, and more extreme hot summers are expected. In 2018, the City released its first climate action plan, Somerville Climate Forward (available here). This plan, created with community participation as well as leading technical experts, identifies 13 top actions to reduce the vulnerabilities identified in the 2017 analysis, as well as reduce greenhouse gas emissions. The actions in this Climate Forward include: stormwater management in public and private property (Action #5), education and outreach on climate preparedness (Action #8), and regional coordination on coastal flooding threats located outside Somerville boarders (#13). Progress has been made in each of these areas. Stormwater system modeling has been conducted, and stormwater capacity enhancement projects are currently in construction (e.g., Somerville Avenue Utility and Streetscape Improvements Project). A state grant from the Executive Office of Energy and Environmental Affairs funded the development of multi-language flood preparedness materials for residents and business owners. In late 2018, Somerville helped form the Resilient Mystic Collaborative, a group of 15 cities that are coordinating planning and action on shared infrastructure risks (e.g., the Amelia Earhart Dam).

18
Education The City’s public school facilities include ten elementary schools, two schools for specialized programs, a charter school and a comprehensive senior high school. Most elementary schools currently house grades kindergarten through 8. The City completed a $25 million renovation and remodeling of the senior high school in the mid 1980s and completed the building of a new West Somerville Community School in September 1996, a new Kennedy elementary school in 1998, a new Healey elementary school in 1999 and a new Capuano early childhood center (PK-2) in 2003. The high school now houses students in grades 9 through 12. Bonds for the construction of a new high school facility have been authorized. The capacity of the school system is approximately 7,000 students. The table below shows the recent trend in public school enrollments.
PUBLIC SCHOOL ENROLLMENTS (as of October 1)
Grades 2014 2015 2016 2017 2018
Elementary (Pre K-8) 3,937 3,624 3,611 3,737 3,644 Senior High and Vocational 1,293 1,281 1,320 1,273 1,339 Somerville Charter School 488 476 458 427 418 Totals 5,718 5,381 5,389 5,437 5,401
Actual
_____________ SOURCE: Office of the Superintendent of Schools. Economy The City of Somerville has a series of neighborhood commercial districts or “squares” which provide neighborhood retail, banking and other services to city residents and employees. Somerville has three major central business districts: Assembly Square, Davis Square and Union Square. These commercial districts contain small retail, banking, professional offices, services, restaurant and entertainment uses. Other commercial uses include fast food restaurants, automotive repair, sales, rental and service stations. In addition, the City has an older industrial, manufacturing and warehousing base, some of which has transformed to office, high technology, telecommunications and biotechnology uses. Over the past twenty years, a number of the City’s older, non-conforming industrial and manufacturing properties have been converted to residential use as property values and the demand for new housing have increased. In the commercial and industrial segments of the local economy, Somerville continues to experience substantial growth.
EMPLOYMENT AND PAYROLLS
The chart below uses the North American Industry Classification System (NAICS) as the basis for the assignment and tabulation of economic data by industry.
Industry 2014 2015 2016 2017 2018
Construction 660 692 728 719 706 Manufacturing 832 950 912 989 1,125 Trade, Transportation & Utilities 5,117 5,333 5,373 5,095 5,013 Information 383 387 550 607 700 Financial Activities 656 660 706 739 803 Professional and Business Services 4,592 4,370 4,486 4,309 5,034 Education and Health Services 6,725 6,912 5,930 6,046 5,838 Leisure and Hospitality 3,373 4,061 4,227 3,824 4,756 Other Services 1,677 1,657 1,657 1,631 1,681 Public Administration 1,140 1,148 1,139 1,139 1,156 Total Employment 25,155 26,170 25,708 25,098 26,812
Number of Establishments 1,808 1,888 1,985 1,965 2,061 Average Weekly Wages 867$ 901$ 948$ 1,024$ 1,270$ Total Wages 1,133,964,282$ 1,226,799,557$ 1,317,425,205$ 1,450,156,596$ 2,312,972,117$
Calendar Year
_____________ Source: Massachusetts Department of Education and Training. Data based upon place of employment, not place of
residence.

19
LARGEST EMPLOYERS
The following table provides a listing of the largest employers in Somerville with 100 employees or more, including the City itself.
Name Function Number of Employees
Partners Healthcare Healthcare 4,500 City of Somerville Municipal 2,633 Tufts University* Education Institution 2,000 ABM Industries Janitorial Services 2,000 Cambridge Health Alliance Health Care 1,014 J&S Electric Company Somerville Hospital
Building Equipment Health Care
525 500
Angelica Laundry 412 Royal Hospitality Services Inc. Office Supplies 380 Market Basket Grocery Store 372 FormLabs Scientific Research 300 Rogers Foam Corporation Foam Products 300 Super Stop & Shop Grocery Store 300 Visiting Nurses Healthcare 250 Atrius Health Healthcare 225 Home Depot Retail 210 Gentle Giant Trucking 200 Target Retail 200 Triumvirate Environmental Inc. Environmental Services 200 MS Walker Liquor Wholesale 185 Shaws Supermarket Grocery 180 Star Markets Grocery 180 Smartbear Software 175 Paint Nite Events 150 NGP Van Software 144 Somerville/Cambridge Elder Services Continuing Care 142 US Post Office Package Delivery Service 131 Cataldo Ambulance Healthcare 120 Whole Foods Retail 115 Citizens Bank Banking 100 MedTouch Software 100
_______________ Source: Company or institution listed. * Approximately fifty percent of the campus is in Somerville and the balance is in Medford, Massachusetts. Labor Force, Employment and Unemployment Rates According to the Massachusetts Department of Employment and Training preliminary data, in August 2019, the City had a total labor force of 55,150 of which 54,110 were employed and 1,040 or 1.9% were unemployed as compared with 2.9% for the Commonwealth (seasonally unadjusted). The following table sets forth the City's average labor force and unemployment rates for each of the calendar years 2014 through 2018 and the unemployment rate for the Commonwealth and nation as a whole for the same periods.

20
UNEMPLOYMENT RATES City of Somerville Massachusetts United StatesYear Labor Force Unemployment Rate Unemployment Rate Unemployment Rate
2018 53,909 2.2 % 3.3 % 3.9 %2017 51,993 2.5 3.7 4.42016 50,407 2.4 3.9 4.92015 49,395 3.3 4.9 5.02014 49,425 3.7 5.8 6.2
_____________ SOURCE: Mass. Department of Employment and Training, Federal Reserve Bank of Boston and U.S. Bureau of Labor
Statistics. Data based upon place of residence, not place of employment.
MAJOR PRIVATE CAPITAL INVESTMENT PROJECTS
There has been significant private capital investment in real estate and construction in the past several years in the City. The following table lists the major projects completed in the City or in the process of being permitted since 2014 and the estimated value of each project.
Major Building Permits - Calendar Years 2019 through 2014
Approximate Project Description Value
Calendar Year 2019:250 DAWES ST Erect a new 654,150 sf 9 story office lab, including retail 185,301,876$
101 SOUTH ST Construction of a 270,000 ZFA Lab Building 90,240,357 40 COLLEGE AVE West Branch Library - renovation of building interior 9,997,000 14 WARD ST Construction of a new mixed use building 6,746,882 39 LATIN WAY R Renovation of common areas and bathrooms with MEP system upgrades 5,988,643 29 LATIN WAY Interior renovation of Bush Hall at Tufts University and exterior window replacement 4,396,639 70 INNER BELT RD Fit-out of approximately 14,248 SF on the first floor for a computer room within an existing two story building. 4,210,000 117 SUMMER ST Renovation of interior to include New MEP systems. Phase I No Construction work on floor 3. 3,816,000 375 REVOLUTION DR Tenant fit out of existing inline space to a full service restaurant Ruth's Chris Steak House 2,300,000 109 PROSPECT ST Complete new construction of 15 units 1,980,000 105 WASHINGTON ST New ground up 4 story building - 7 residential units, commercial first floor suite 1,950,000 36 LAUREL ST remodel existing 1 unit building and build addition for two more units. 1 family to 3 family 1,863,380 70 INNER BELT RD Installation of twenty (20) Bloom Energy natural gas outdoor fuel cells 1,815,824 3 SUMMER ST New construction of a 5-unit, 3-story residential building to be located on an approximately 0.10 acre plot of land 1,632,912 14 WARD ST Foundation for new construction mixed use building, 1 level (S2) Parking, 4 levels multifamily residential (R2) 1,253,118 32 GLEN ST Construct a large addition to the existing dwelling. Proposed addition will include six residential units. 2 Units 2 baths 2 beds, 4 Units 2 1,200,000 141 CROSS ST Construct a 3 Unit building on a existing vacant lot 1,200,000 702 GRAND UNION BLVD Chase Bank complete build out of new bank location 1,153,000 17-27 HOLLAND ST Construct 7 residential and 2 commercial units 1,000,000 30 LOWER CAMPUS RD Dormitory roof replacement with minor masonry repairs 985,299 165 CEDAR ST Construct a new +/- 7218 s.f. building, 4 story 4 unit building 975,000 56 FRANKLIN ST Addition of 2 new units to existing 1 Family house 967,239 0 INNER BELT RD Tenant fitout of 3,846 sf in Project Consisting of Building Management Suite/Conference Center 931,914 14 PEARL ST 2 additional single family units to and remove existing building 900,000 399 REVOLUTION DR Installation of two (2) Bloom Energy ES5 outdoor natural gas clean energy servers 881,467 19 BOW ST Install finish trim, spray foam insulation, install hardi plank siding, install new store front, install electrical, remove existing heat 713,431 15 MOSSLAND ST Converting a single family to a 3 unit 700,000 54 DANE ST Renovate existing two-family residence by altering the dormers on both sides of roof and adding 3-story addition 645,000 46 LAUREL ST Renovate existing 4 unit building and add a rear addition. 2 story addition, 1400 square feet 625,000 31 LAKE ST Conversion from a 2 family to a 1 family 622,680 10 WHEATLAND ST Addition and renovation of existing 2 Family townhouse 600,000 75 WASHINGTON ST New Construction of 4 Unit Building 600,000 57 PRESCOTT ST Residential demolition and reconstruction 600,000 51 OLIVER ST New 3 Family Townhouses 550,000
165 MIDDLESEX AVE Interior renovation of finishes and layout of Staples store 587,000 44 BARTLETT ST Interior renovation of 2 family. Add 3.5 baths. Philadelphia bedroom on 2nd fl. Basement storage 550,000 10 OAK ST Addition and total renovation Change from 2 family to 3 family 528,000 12 CONWELL AVE Gut house and install new mechanical, electric. and plumbing. Install new kitchen in same footprint. 505,236 24 KENSINGTON AVE Rehab a single family to a three unit multifamily 500,933 246 ELM ST Restaurant fit out of existing space 500,000
61 MYRTLE ST Complete renovation of existing home and a brand new addition of an additional dwelling, 2 family to 3 family 500,000 111 SUMMER ST Complete renovation of existing structure and a addition of an additional dwelling 500,000
Total: 343,513,830$
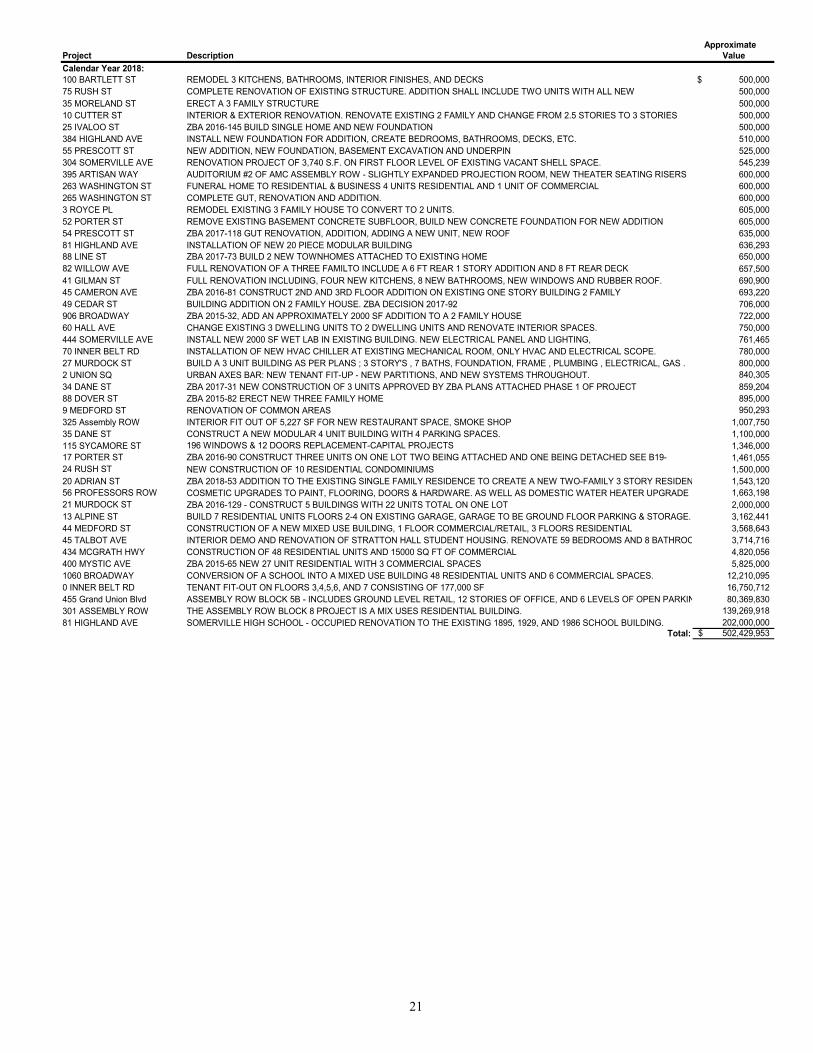
21
Approximate Project Description Value
Calendar Year 2018:100 BARTLETT ST REMODEL 3 KITCHENS, BATHROOMS, INTERIOR FINISHES, AND DECKS 500,000$ 75 RUSH ST COMPLETE RENOVATION OF EXISTING STRUCTURE. ADDITION SHALL INCLUDE TWO UNITS WITH ALL NEW 500,000 35 MORELAND ST ERECT A 3 FAMILY STRUCTURE 500,000 10 CUTTER ST INTERIOR & EXTERIOR RENOVATION. RENOVATE EXISTING 2 FAMILY AND CHANGE FROM 2.5 STORIES TO 3 STORIES 500,000 25 IVALOO ST ZBA 2016-145 BUILD SINGLE HOME AND NEW FOUNDATION 500,000 384 HIGHLAND AVE INSTALL NEW FOUNDATION FOR ADDITION, CREATE BEDROOMS, BATHROOMS, DECKS, ETC. 510,000 55 PRESCOTT ST NEW ADDITION, NEW FOUNDATION, BASEMENT EXCAVATION AND UNDERPIN 525,000 304 SOMERVILLE AVE RENOVATION PROJECT OF 3,740 S.F. ON FIRST FLOOR LEVEL OF EXISTING VACANT SHELL SPACE. 545,239 395 ARTISAN WAY AUDITORIUM #2 OF AMC ASSEMBLY ROW - SLIGHTLY EXPANDED PROJECTION ROOM, NEW THEATER SEATING RISERS 600,000 263 WASHINGTON ST FUNERAL HOME TO RESIDENTIAL & BUSINESS 4 UNITS RESIDENTIAL AND 1 UNIT OF COMMERCIAL 600,000 265 WASHINGTON ST COMPLETE GUT, RENOVATION AND ADDITION. 600,000 3 ROYCE PL REMODEL EXISTING 3 FAMILY HOUSE TO CONVERT TO 2 UNITS. 605,000 52 PORTER ST REMOVE EXISTING BASEMENT CONCRETE SUBFLOOR, BUILD NEW CONCRETE FOUNDATION FOR NEW ADDITION 605,000 54 PRESCOTT ST ZBA 2017-118 GUT RENOVATION, ADDITION, ADDING A NEW UNIT, NEW ROOF 635,000 81 HIGHLAND AVE INSTALLATION OF NEW 20 PIECE MODULAR BUILDING 636,293 88 LINE ST ZBA 2017-73 BUILD 2 NEW TOWNHOMES ATTACHED TO EXISTING HOME 650,000 82 WILLOW AVE FULL RENOVATION OF A THREE FAMILTO INCLUDE A 6 FT REAR 1 STORY ADDITION AND 8 FT REAR DECK 657,500 41 GILMAN ST FULL RENOVATION INCLUDING, FOUR NEW KITCHENS, 8 NEW BATHROOMS, NEW WINDOWS AND RUBBER ROOF. 690,900 45 CAMERON AVE ZBA 2016-81 CONSTRUCT 2ND AND 3RD FLOOR ADDITION ON EXISTING ONE STORY BUILDING 2 FAMILY 693,220 49 CEDAR ST BUILDING ADDITION ON 2 FAMILY HOUSE. ZBA DECISION 2017-92 706,000 906 BROADWAY ZBA 2015-32, ADD AN APPROXIMATELY 2000 SF ADDITION TO A 2 FAMILY HOUSE 722,000 60 HALL AVE CHANGE EXISTING 3 DWELLING UNITS TO 2 DWELLING UNITS AND RENOVATE INTERIOR SPACES. 750,000 444 SOMERVILLE AVE INSTALL NEW 2000 SF WET LAB IN EXISTING BUILDING. NEW ELECTRICAL PANEL AND LIGHTING, 761,465 70 INNER BELT RD INSTALLATION OF NEW HVAC CHILLER AT EXISTING MECHANICAL ROOM, ONLY HVAC AND ELECTRICAL SCOPE. 780,000 27 MURDOCK ST BUILD A 3 UNIT BUILDING AS PER PLANS ; 3 STORY'S , 7 BATHS, FOUNDATION, FRAME , PLUMBING , ELECTRICAL, GAS . 800,000 2 UNION SQ URBAN AXES BAR: NEW TENANT FIT-UP - NEW PARTITIONS, AND NEW SYSTEMS THROUGHOUT. 840,305 34 DANE ST ZBA 2017-31 NEW CONSTRUCTION OF 3 UNITS APPROVED BY ZBA PLANS ATTACHED PHASE 1 OF PROJECT 859,204 88 DOVER ST ZBA 2015-82 ERECT NEW THREE FAMILY HOME 895,000 9 MEDFORD ST RENOVATION OF COMMON AREAS 950,293325 Assembly ROW INTERIOR FIT OUT OF 5,227 SF FOR NEW RESTAURANT SPACE, SMOKE SHOP 1,007,750 35 DANE ST CONSTRUCT A NEW MODULAR 4 UNIT BUILDING WITH 4 PARKING SPACES. 1,100,000 115 SYCAMORE ST 196 WINDOWS & 12 DOORS REPLACEMENT-CAPITAL PROJECTS 1,346,000 17 PORTER ST ZBA 2016-90 CONSTRUCT THREE UNITS ON ONE LOT TWO BEING ATTACHED AND ONE BEING DETACHED SEE B19- 1,461,055 24 RUSH ST NEW CONSTRUCTION OF 10 RESIDENTIAL CONDOMINIUMS 1,500,000 20 ADRIAN ST ZBA 2018-53 ADDITION TO THE EXISTING SINGLE FAMILY RESIDENCE TO CREATE A NEW TWO-FAMILY 3 STORY RESIDEN 1,543,120 56 PROFESSORS ROW COSMETIC UPGRADES TO PAINT, FLOORING, DOORS & HARDWARE. AS WELL AS DOMESTIC WATER HEATER UPGRADE 1,663,198 21 MURDOCK ST ZBA 2016-129 - CONSTRUCT 5 BUILDINGS WITH 22 UNITS TOTAL ON ONE LOT 2,000,000 13 ALPINE ST BUILD 7 RESIDENTIAL UNITS FLOORS 2-4 ON EXISTING GARAGE, GARAGE TO BE GROUND FLOOR PARKING & STORAGE. 3,162,441 44 MEDFORD ST CONSTRUCTION OF A NEW MIXED USE BUILDING, 1 FLOOR COMMERCIAL/RETAIL, 3 FLOORS RESIDENTIAL 3,568,643 45 TALBOT AVE INTERIOR DEMO AND RENOVATION OF STRATTON HALL STUDENT HOUSING. RENOVATE 59 BEDROOMS AND 8 BATHROO 3,714,716 434 MCGRATH HWY CONSTRUCTION OF 48 RESIDENTIAL UNITS AND 15000 SQ FT OF COMMERCIAL 4,820,056 400 MYSTIC AVE ZBA 2015-65 NEW 27 UNIT RESIDENTIAL WITH 3 COMMERCIAL SPACES 5,825,000 1060 BROADWAY CONVERSION OF A SCHOOL INTO A MIXED USE BUILDING 48 RESIDENTIAL UNITS AND 6 COMMERCIAL SPACES. 12,210,095 0 INNER BELT RD TENANT FIT-OUT ON FLOORS 3,4,5,6, AND 7 CONSISTING OF 177,000 SF 16,750,712 455 Grand Union Blvd ASSEMBLY ROW BLOCK 5B - INCLUDES GROUND LEVEL RETAIL, 12 STORIES OF OFFICE, AND 6 LEVELS OF OPEN PARKIN 80,369,830 301 ASSEMBLY ROW THE ASSEMBLY ROW BLOCK 8 PROJECT IS A MIX USES RESIDENTIAL BUILDING. 139,269,918 81 HIGHLAND AVE SOMERVILLE HIGH SCHOOL - OCCUPIED RENOVATION TO THE EXISTING 1895, 1929, AND 1986 SCHOOL BUILDING. 202,000,000
Total: 502,429,953$

22
Approximate Project Description Value
Calendar Year 2017:1127 BROADWAY THIRD FLOOR ADDITION TO AN EXISTING 2 STORY BUILDING 750,000$ 145 MIDDLESEX AVE INTERIOR FIT-OUT OF AN EXISTING DEMISED SPACE FOR GROCER TENANT 779,103
8 BROADWAY NEW BUILDING - 11 RESIDENTIAL UNITS AND 2 RETAIL COMMERCIAL UNITS IN ACCORDANCE WITH PLANS 4,700,000 116 HOLLAND ST. NEW 4 UNIT ADDITION TO BE ADDED TO THE SIDE OF THE CURRENT BUILDING 854,000 60 CROSS ST NEW CONSTRUCTION 75 UNIT RESIDENTIAL BUILDING WITH COVERED PARKING 4,500,000 285 WASHINGTON ST. RENOVATIONS TO EXISTING THREE STORY BUILDING 726,303 145 MIDDLESEX AVE INTERIOR WORK ONLY FOR TRADER JOE'S 600,000 201 CENTRAL ST. NEW ELEVATOR, NEW SPRINKLER, MODIFY EXISTING FACP, AND RELATED RENOVATION WORK 1,034,968 0 INNER BELT RD CORE AND SHELL DESIGN OF A LAB AND OFFICES BUILDING. INCLUDING 3 LEVELS OF SUB-GRADE PARKING GARAGE 51,233,389 1060 BROADWAY INTERIOR DEMOLITION OF AN EXISTING SCHOOL 1,315,981 383 REVOLUTION DR. ORANGE THEORY TENANT FIT OUT WALLS, FLOORING, PLUMBING, FIRE PROTECTION, HVAC & ELECTRIC 531,724 440 FOLEY ST TENANT FIT OUT MASS GENERAL 1,499,425 355 REVOLUTION DR RESTAURANT FIT OUT ZO GREEK 902,450 40 HOLLAND ST STRUCTURAL SLAB RESTORATION 600,000 62 TALBOT AVE COMMERCIAL RENOVATION 2,896,678 475 REVOLUTION DR 1400SF NEW RESTAURANT, SABROSO TAQUERIA 533,410 231 LOWELL ST FOUNDATION AND CONSTRUCTION FOR 22 DWELLING UNITS, 2 COMMERCIAL STUDIOS 3,400,000 12 WARWICK ST NEW SINGLE FAMILY DWELLING 12 A WARWICK ST 720,000 12 WARWICK ST NEW SINGLE FAMILY DWELLING UNIT 12 B 720,000 12 WARWICK ST NEW SINGLE FAMILY DWELLING 12 C WARWICK ST 720,000 70 INNER BELT RD DATA CENTER FIT-OUT 1,909,380 251 GRAND UNION NEW 2 STORY CHILD CARE CENTER FOR PARTNERS HEALTHCARE CAMPUS 599,927 375 REVOLUTION DR INTERIOR TENANT FIT-OUT FOR A NEW RESTAURANT (WAXY'S MODERN IRISH BAR + KITCHEN) 1,501,644 425 REVOLUTION DR TENANT BUILD OUT FOR CAPITAL ONE BANK AND 360 CAFE WITH 54 SEATS 2,100,000 18 KENT CT BUILD 5 NEW CONSTRUCTION RESIDENTIAL UNITS 1,075,000 351 SUMMER ST CONSTRUCT 29 UNIT RESIDENTIAL CONDOMINIUM FACILITY 6,800,000
0 ELMWOOD ST NEW 5 UNIT RESIDENTIAL BUILDING 1,000,000 62 TALBOT AVE REMOVE EXISTING FAILING ROOF SYSTEM AND REPLACE WITH NEW TPO ROOF SYSTEM 976,725 490 FOLEY STREET INTERIOR FITOUT OF EXISTING SHELL SPACE FOR TAP ROOM 678,800
375 ASSEMBLY INTERIOR FIT OUT CAFFE NERO 650,000 463 ASSEMBLY BUILDOUT OF MIDICIS NEAPOLITAN RESTAURANT 1,029,686 1060 BROADWAY CONVERSION OF A SCHOOL INTO A MIXED USE BUILDING 12,210,095 325 REVOLUTION DR BLOCK 11 LUCKY STRIKE SOCIAL NEW RESTAURANT, BAR, ARCADE & BOWLING VENUE 4,000,000 337 SOMERVILLE AVE RENOVATION OF EXISTING BUILDING FOR NEW COMMERCIAL USE 2,257,664 163 GLEN ST ALTERATIONS TO EXISTING STRUCTURE TO BUILD 11 CONDOMINIUM UNITS 3,100,000 81 PARK ST 16 BUILD 3 RESIDENCES/ & 1 COMMERCIAL 1,000,000 10 EMERSON ST CONSTRUCTION OF 2 FAMILY STRUCTURE 850,000 352 HIGHLAND AVE ADDITION OF 4 RESIDENTIAL UNITS AND A COMMERCIAL SPACE 850,000 81 HIGHLAND AVE UTILITY ENABLING WORK TO SERVE THE MODULAR CLASSROOM BUILDING AT HIGH SCHOOL 500,000 76 SCHOOL ST A FULL RENOVATION IS PROPOSED 750,000 19 KENT CT CONSTRUCT A THREE FAMILY STRUCTURE ON CONCRETE FOUNDATION 530,000 240 ELM ST NEW BUILDOUT FROM SHELL SPACE FOR EXECUTIVE OFFICE SUITES 950,000 119 HIGHLAND AVE REMODEL AND A ADDITION CONSTRUCTING FIVE RESIDENTIAL APARTMENTS 1,517,156 8 APPLETON ST NEW CONSTRUCTION TO RESTORE TO PRE-FIRE CONDITION 3-UNIT BUILDING 805,000 22 BILLINGHAM ST ADD ADDITION TO REAR OF HOUSE 527,695 39 MURDOCK ST NEW 3 FAMILY DWELLING 900,000
17 HOLLAND ST 2 FAMILY STRUCTURE 3,000,000
408 HIGHLAND AVE RESIDENTIAL ADDITION 1,000,000
133 MIDDLESEX AVE INTERIOR RENOVATION FIT OUT RETAIL 865,000
22 LINDEN AVE COMMERCIAL RENOVATION 760,000
30 INNER BELT RD COMMERCIAL RENOVATION- WAREHOUSE & OFFICE SPACE 1,591,967
200 INNER BELT RD THIRD FLOOR ADDITION TO AN EXISTING 2 STORY BUILDING 535,115
5 MIDDLESEX AVE RENOVATION OF UNOCCUPIED OFFICE SPACE 1,900,000
143 MORRISON AVE TOTAL GUT & REMOVAL OF DECK 536,400
4 JOY ST INTERIOR AND EXTERIOR RENOVATION TO CATALDO AMBULANCE 525,000
460 ASSEMBLY ROW PHASE I OF DARKBOX LANDLORD, INTERIOR WORK ONLY 932,000
42 BOW ST ZBA 2017-77 CHANGE 4 UNITS TO 5 500,000
490 ASSEMBLY ROW PHASE I OF DARKBOX LANDLORD, INTERIOR WORK ONLY 575,000
22 MCGRATH HWY FORM LABS INTERIOR FITOUT OF EXISTING COMMERCIAL OFFICE SPACE 1,080,000
37 DAY ST RENOVATION OF EXISTING 2 FAMILY 510,000
39 RUSSELL ST CONSTRUCTION OF NEW SINGLE FAMILY RESIDENCE 510,000
51 MONROE ST DEMOLITION OF ENTIRE HOUSE INTERIOR ONLY 507,473 Total: 143,414,159$

23
Approximate Project Description ValueCalendar Year 2016:375 CANAL ST ASSEMBLY SQUARE - NEW CONSTRUCTION, FOUNDATION FOR 13-STORY BUILDING MIXED USE BUILDING 15,282,880$ 260 BEACON ST NEW CONSTRUCTION - 17 RESIDENTIAL UNITS, GROUND FLOOR COMMERCIAL, UNDERGROUND PARKING 3,420,000 399 REVOLUTION DRIVE COMMERCIAL - SOLAR PV CANOPY SYSTEM (PARTNERS PARKING GARAGE) 3,415,425 56 PROFESSORS ROW TUFTS UNIVERSITY - BUILDING RENOVATION (METCALF HALL) 2,034,098 290 HIGHLAND AVE NEW CONSTRUCTION- 7 RESIDENTIAL UNITS, GROUND FLOOR COMMERCIAL 1,800,000 266 BEACON ST NEW CONSTRUCTION- 7 RESIDENTIAL UNITS 1,256,800 240 ELM ST COMMERCIAL- TENANT FIT OUT (BFRESH SUPERMARKET) 1,000,000 483 SOMERVILLE AVE NEW CONSTRUCTION- 3 RESIDENTIAL UNITS,1 COMMERCIAL UNIT 1,000,000 500 ASSEMBLY ROW COMMERCIAL- TENANT FIT OUT (SOUTHERN KIN) 850,000 26 PUTNAM STREET RENOVATION- RESIDENTIAL 2-FAMILY AND 6-FAMILY HOMES 816,400 83 BELMONT ST REPAIR - 2-FAMILY HOME 813,000 29 KIDDER AVE RENOVATION - RESIDENTIAL 2-FAMILY HOME 809,050 75 PACKARD AVE TUFTS UNIVERSITY - BUILDING RENOVATION (LEWIS HALL) 807,489 56 BOW STREET RENOVATION - RESIDENTIAL 2-FAMILY HOME 802,291 62 TALBOT AVE TUFTS UNIVERSITY - BUILDING RENOVATION (PEARSON HALL LAB) 759,249 44 MEACHAM RD RENOVATION AND ADDITION TO RESIDENTIAL SINGLE FAMILY HOME 750,000 46 MURDOCK STREET NEW CONSTRUCTION - RESIDENTIAL 3-UNIT BUILDING 725,000 200 INNER BELT RD RENOVATION OF EXISTING COMMERCIAL (OPEN BIOME) 656,655 7 DOW ST RENOVATION - RESIDENTIAL 2-UNIT BUILDING 650,000 53 JOSEPHINE AVE NEW CONSTRUCTION - RESIDENTIAL 3-UNIT BUILDING 650,000 74 CHANDLER ST RENOVATION - RESIDENTIAL SINGLE FAMILY HOME 650,000 56 LINE ST NEW CONSTRUCTION - RESIDENTIAL 3-UNIT BUILDING 517,500 140 MORRISON AVE RENOVATION - RESIDENTIAL SINGLE FAMILY HOME 509,200 20 GEORGE STREET RENOVATION - RESIDENTIAL 4-UNIT BUILDING 505,000
Total: 40,480,037$
Calendar Year 2015:399 REVOLUTION DR ASSEMBLY SQUARE- NEW CONSTRUCTION, COMMERCIAL (PARTNERS OFFICE BUILDING) 126,836,425$ 449 CANAL ST ASSEMBLY SQUARE- NEW CONSTRUCTION, MIXED USE BLDG 79,350,000 399 REVOLUTION DR ASSEMBLY SQUARE- NEW CONSTRUCTION - COMMERCIAL (PARTNERS OFFICE BUILDING) 73,067,352 399 REVOLUTION DR ASSEMBLY SQUARE- NEW CONSTRUCTION, COMMERCIAL (PARTNERS PARKING GARAGE) 31,258,334 191 WASHINGTON ST NEW CONSTRUCTION - 35 RESIDENTIAL UNITS, GROUND FLOOR COMMERCIAL 5,605,687 197 WASHINGTON ST NEW CONSTRUCTION - 30 RESIDENTIAL UNITS, GROUND FLOOR RETAIL 5,125,285 315 BROADWAY NEW CONSTRUCTION - 46 RESIDENTIAL UNITS, 8485 SF RETAIL 3,500,000 315 HIGHLAND AVE NEW CONSTRUCTION - 7 RESIDENTIAL UNITS, GROUND FLOOR COMMERCIAL, GARAGE 2,800,000 45 TALBOT AVE TUFTS UNIVERSITY - BUILDING RENOVATION 2,676,592 28 PROFESSORS ROW TUFTS UNIVERSITY - BUILDING RENOVATION (RICHARDSON HOUSE) 2,331,180 200 INNER BELT RD RENOVATION - COMMERCIAL OFFICE 1,650,000 625 GRAND UNION BLVD #120 ASSEMBLY SQUARE - COMMERCIAL - TENANT FIT OUT (OUTBACK STEAKHOUSE) 1,500,000 30 INNER BELT RD RENOVATION - COMMERCIAL ROOF 1,380,000 200 COLLEGE AVE TUFTS UNIVERSITY - BUILDING RENOVATION (ROBINSON BUILDING) 1,308,060 61 MEDFORD ST RENOVATION - COMMERCIAL INTERIOR (BIOGEN IDEC) 1,256,219 450 ARTISAN WAY ASSEMBLY SQUARE - COMMERCIAL - TENANT FIT OUT (AVIGILON) 1,248,500 203 HOLDEN RENOVATION - MASONRY 972,191 450 ARTISAN WAY ASSEMBLY SQUARE - COMMERCIAL - TENANT FIT OUT (MEDTOUCH) 900,000 508 SOMERVILLE AVE NEW CONSTRUCTION - 3 RESIDENTIAL UNITS, GROUND FLOOR RETAIL 875,000 318 BEACON ST NEW CONSTRUCTION - RESIDENTIAL 3-UNIT BUILDING 875,000 220 WASHINGTON ST RENOVATION - SOMERVILLE FIRE DEPT ENGINE 3 DORMITORY ADDITION 832,486 593 SOMERVILLE AVE NEW CONSTRUCTION - 6 RESIDENTIAL UNITS, 2 COMMERCIAL. MOVE HISTORIC HOME 750,000 53 KENT ST NEW CONSTRUCTION - RESIDENTIAL 4-UNIT BUILDING 750,000 109 COLLEGE AVE RENOVATION - COMMERCIAL & PARKING 714,000 121 HANCOCK ST RENOVATION - RESIDENTIAL (CONVERT 6 UNIT TO 4 UNIT BUILDING) 650,000 510 SOMERVILLE AVE NEW CONSTRUCTION - RESIDENTIAL 3 UNITS 645,000 200 HIGHLAND AVE RENOVATION - RESIDENTIAL 4-UNIT BUILDING 635,000 40 PITMAN ST RENOVATION - RESIDENTIAL (CONVERT 2-FAMILY TO 5 UNIT BUILDING) 630,000 460 SOMERVILLE AVE RENOVATION - COMMERCIAL 626,071 7 FAIRVIEW TERR NEW CONSTRUCTION - 2 SINGLE-FAMILY HOMES 600,000 8 CLYDE ST RENOVATION - RESIDENTIAL 3-UNIT BUILDING 570,000 48 GROVE ST COMMERCIAL - TENANT FIT OUT (SPOTIFY) 550,000 645 BROADWAY RENOVATION - COMMERCIAL 516,114
Total: 352,984,496$

24
Approximate Project Description ValueCalendar Year 2014:399 Revolution Drive Assembly Square-New Construction, Office Building Structural 38,602,568$ 399 Revolution Drive Assembly Square - New Construction, Office Building Foundation 12,064,433 399 Revolution Drive Assembly Square - New Construction, Parking Garage Foundation 10,321,389 9 Medford St Renovation Residential Building - Interior Work 9,555,441 9 Medford St Renovation Residential Building - Shell, Stairs/Elevator, Utility Work 8,241,373 70 Prospect St New Construction -Residential Units, Retail, Parking Spaces 3,500,000 5 Middlesex Ave Renovation - Commercial 3,225,861 81 Highland Ave Somerville High School (Kitchen & Cafeteria, Auditorium, HVAC) 2,279,700 97 Prospect St New Construction: 7 Residential Units, With Underground Parking 2,000,000 100 Talbot Ave Tufts University - Renovation (Hodgson Hall) 1,964,150 699 Assembly Row #325 Assembly Square - Tenant Fit Out (Tony C'S) 1,800,000 47 Hunting St New Construction - 6 Residential Units, Parking Below 1,769,957 450 Artisan Way Assembly Square - New Construction, Commercial 1,559,424 371 Beacon St New Construction - 30+ Room Boutique Style Hotel 1,500,000 301 Great River Rd Assembly Square - Tenant Fit Out (Legal On The Mystic) 1,355,000 200 Innerbelt Rd Renovation Of Existing Commercial - Office Building 1,180,000 92 Properzi Way Renovation Of Existing Residential 1,000,000 35 Medford St Renovation Of Existing Commercial - Office Building 1,000,000 17 Village St New Construction - 6 Residential Units 1,000,000 9R Sherman St New Construction - Commercial Space 1,000,000 331 Great River Rd Assembly Square - Tenant Fit Out (Papagayo) 900,000 82 Highland Ave New Construction - 6 Residential Units 900,000 631 Assembly Row #230 Assembly Square - Tenant Fit Out (Paul Bakery) 850,000 599 Somerville Ave New Construction - 4 Residential Units, 1 Retail 800,000 660 Assembly Row Assembly Square - Renovation Of Existing Commercial - HVAC 780,000 399 Highland Ave Renovation Of Existing Commercial 630,000 170 School St New Construction - 5 Residential Units, 1 Retail 600,000 10 Beech St Renovation Of Existing Residential 600,000 139 Summer St Renovation Of Existing Residential 500,000
Total: 111,479,296$ Building Permits The table below sets forth the recent trend in estimated dollar value of residential and non-residential new construction and alterations. The estimated dollar values are builders' estimates.
Calendar
Year No Value No Value No Value
2019 (1) 24 296,197,525$ 1424 100,670,705$ 1448 396,868,230$ 2018 32 250,875,242 (2) 1136 325,496,116 (3) 1168 576,371,358 2017 61 98,103,092 1677 96,552,319 1738 194,655,411 2016 45 82,967,317 1900 102,838,078 1945 185,805,395 2015 27 335,037,068 (4) 1963 82,585,915 1990 417,622,983 2014 68 91,196,207 1787 79,257,395 1855 170,453,602
TotalNew Construction Additions/Alterations
_________________ SOURCE: City Building Inspector. (1) As of September 16, 2019. (2) Increase attributable to construction of a mixed-use residential building at Assembly Row Block 8 ($139 million) and
office building at Assembly Row Block 5 ($80 million). (3) Increase attributable to Somerville High School renovations and additions ($202 million). (4) Construction of the new Partners Health Care and Block 6 in Assembly Square accounts for approximately $158
million and $79.35 million, respectively, of the new construction permit value.

25
The following table compares retail trade data for the City of Somerville with that of the Commonwealth as a whole.
RETAIL SALES
Somerville MassachusettsEstablishments:
2012 183 24,311 2007 179 23,942 2002 178 25,761 1997 208 26,209
Sales(000):2012 759,415$ 92,915,380$ 2007 761,543 88,082,966 2002 603,989 73,903,837 1997 558,967 58,578,048
Per Capita Sales:2012 9,849$ 13,980$ 2007 10,061 13,553 2002 6,696 11,640 1997 7,335 9,736
_____________ SOURCE: 2012, 2007, 2002 and 1997 U.S. Census of Retail Trade.

26
ECONOMIC DEVELOPMENT
The City of Somerville, working through the Mayor’s Office of Strategic Planning and Community Development (OSPCD), has taken the lead role in planning and implementing major economic development projects designed to increase the City’s tax base and create new jobs. With the 2012 approval of the SomerVision Comprehensive Plan, Somerville is pursuing a strategy to add 30,000 new jobs and 6,000 new housing units between 2010 and 2030. The following sections contain forward-looking statements that are based upon plans, projections and estimates. While these projections are reasonably based on current knowledge, there can be no guarantee that every plan will occur as projected herein, or that estimated benefits will be realized as discussed. SomerVision: A Strategy for Growth and Conservation In 2008, the City of Somerville and its community partners began work on SomerVision, the City’s first-ever Comprehensive Plan. In April 2012, the SomerVision Comprehensive Plan was adopted by the Somerville Planning Board, and formally endorsed by the Somerville City Council as the official master plan for the City under Massachusetts General Law. The SomerVision process was structured to build consensus around strategies to preserve Somerville’s identity as an accessible, mixed-income, multicultural city, while at the same time identifying an actionable policy agenda to invite and leverage public and private investment in transit-oriented development and generate economic opportunity for all Somerville residents. Work was overseen by a 60-member Steering Committee composed of residents, business owners, nonprofit agencies and elected officials. More than 60 public meetings were held using creative public engagement techniques, including World Café facilitation, multilingual interpreters, graphic recording, online and mailed surveys and unedited meeting broadcasts on community access television. Hundreds of Somerville residents saw their own words fed through a series of iterative feedback loops, yielding tremendous public buy-in for SomerVision’s statement of values, vision statement, future land use map, and more than 500 goals, policy and action statements. SomerVision calls for the City and its partners to conserve Somerville’s great residential neighborhoods, enhance its commercial squares and corridors, and transform former industrial districts into engines of economic and housing growth. It articulates goals, policies and actions related to civic engagement, housing opportunity, provision of public services, workforce development, small business assistance, infrastructure upgrades, open space improvements and environmental sustainability. Major Areas for Economic Development
Assembly Square Assembly Square is Somerville’s largest commercial and industrial district and is among a short list of sites with the greatest potential for development in the Metro Boston Area. Assembly Square is a 145-acre district located at the northeast corner of the City on the Boston border.
Its location, less than 2.5 miles from downtown Boston and just two miles from Kendall Square in Cambridge, and existing transportation infrastructure make it one of the premier development sites in New England. Assembly Square is directly accessible from Interstate 93 and State Route 28. In December 2011, the MBTA commenced construction of the MBTA’s Orange Line in Assembly Square station and opened the station to riders in September of 2014. Assembly Square contains more than five acres of waterfront open space located along the banks of the Mystic River. To capitalize on these strengths, the City has undertaken an aggressive planning and redevelopment effort designed to convert this former industrial district to a transit-oriented, mixed-use “urban village”, using smart growth principles to maximize development potential. In May 2011, the developer Federal Realty Investment Trust (FRIT), the State, and the City entered into a Tri-Party Agreement outline roles and responsibilities to fund major infrastructure and sequence public and private development. Implementing a District Increment Financing (DIF) strategy and a commitment from the Commonwealth to fund the Orange Line T Station were critical elements of the Agreement. The development at Assembly Row has been very successful. Eight development blocks have been built, generating 860,000 square feet of office space, 500,000 square feet of retail, restaurant and entertainment space and over 1,000 new residential units. The development is highlighted by the 750,000 square foot headquarters for Partners HealthCare, the largest medical group and employer in the Commonwealth. In 2013, Partners announced its intention to consolidate a dozen facilities around Boston under one roof in a state-of-the-art, signature building at Assembly. Today, 4,500 employees work at the Partners headquarters and the company has the opportunity to expand its presence and build a new, 400,000 square foot building at some point in the future. From a municipal finance perspective, the project has been just as successful. To date, the DIF-captured increment has significantly exceeded debt service payment amounts with an anticipated fund balance of $9 million by the end FY2020 to be used for infrastructure improvements.

27
Development activity is accelerating. Federal Realty recently completed a 768,000 square foot project on Block 6, a 7-story, 447-unit apartment complex with 48,000 square feet of ground floor retail. The project, known as Montaje is fully-leased. Across the street, Federal Realty is about to complete Block 5A, a 303,000 square foot project that includes a 160-room Marriot Autograph Collection hotel, 20,000 square feet of ground floor retail and 132 high-end condominiums. In March of 2019, Federal Realty broke ground on Block 5B, which will be known as 455 Grand Union Blvd. Puma announced it is moving its North American headquarters to the building and will anchor the 275,000 square foot office building, featuring a 19,000 square foot roof deck, basketball court, state of the art fitness center and new, ground floor company store. Federal Realty has also broken ground on Block 8, a 525,300 square foot residential building which will feature 500 units of housing and 26,500 square feet of ground floor retail. The success of Assembly Row has attracted further investment in the Assembly area. Two other major development projects have been permitted in the past year: Assembly Edge and XMBLY. Assembly Edge was permitted in 2018 as a two building, 360,000 square foot project, including a 13-story, 180-room hotel, and a 21-story residential building with 210 units. Assembly Edge will also have ground floor retail and restaurant space as well as on-site parking. XMBLY encompasses over 9 acres located at 5 Middlesex Avenue. A project master plan was approved in 2018 that envisions a 1.4 million square foot mixed use development. The first phase of an 8-story, 329-unit multifamily residential building has broken ground. Union Square
Union Square is Somerville’s second largest business district, known throughout the region as a diverse arts and dining destination. In 2004, the City worked with neighborhood residents, businesses, and property owners to create “Union Square Main Streets,” a non-profit community organization based on the National Main Street Center’s successful downtown revitalization model. In the past few years, the City has received a $415,000 grant from ArtPlace America as well as a $460,000 grant to fund the creation of “ArtFarm for Social Innovation” on the site of a former waste transfer station; a $42,000 grant for strategic planning for the development of city-owned properties in Union Square; over $1,000,000 in new state and federal Brownfields funding for parcels in the area; the initiation of a Saturday farmers market partially funded by a Robert Wood Johnson Grant, and the construction of two small urban parks to go along with the complete renovation of Lincoln Park just outside the square. The City has completed both a $24 million new elementary school at the edge of Union Square and a $21 million reconstruction of Somerville Avenue between Union and Porter Squares. In January 2015, a Full Funding Grant Agreement between the MBTA and the US Department of Transportation Federal Transportation Administration was signed. Under this FFGA, federal dollars have been committed to fund approximately one half of the Green Line Extension Project. In April 2009, the City Council approved rezoning of the Union Square and Boynton Yards areas. In 2012, the City initiated a multi-year comprehensive planning process with the goal of transforming Union Square back to its historic prominence as a major employment center. The centerpiece of this effort entails concentrating new mixed-used development around the new Union Square transit stop that will come along with the expansion of the MBTA Green Line. In 2012, the City and the Somerville Redevelopment Authority (SRA) approved the Union Square Urban Revitalization Plan that identified seven distinct parcels for major redevelopment. In 2014, the SRA selected Union Square Station Associates (US2) as the master developer for Union Square. A robust community planning process resulted in the Union Square Neighborhood Plan, adopted by the City’s Planning Board in May of 2016 as an amendment and implementation appendix to SomerVision. Union Square was rezoned in 2017 to reflect the goals of the plan. The Somerville Planning Board approved US2’s Coordinated Development Special Permit in December of 2017, which entitles US2’s 2.3 million square foot development program that includes housing, retail, office and lab space. The first phase of construction began in the fall of 2019. Concurrently, the City began work with the community to develop a comprehensive infrastructure plan for Union Square. Conceptual plans were developed in 2012 and seek to balance traffic flow in the context of quality of life, future development, greater design goals, and the introduction of MBTA light rail. The project will see the reconstruction of two major arterials through the square, continuation of the newly separated Somerville Avenue storm and sanitary sewer lines, and significant expansion of the public plaza. In the fall of 2017, City administration submitted to the City Council for their approval a DIF financing plan for $141 million in infrastructure and streetscape projects that will both help alleviate existing flooding issues for two-thirds of the city as well as unlock development potential in the district. In December of 2017, the City Council approved the DIF financing plan as well as the first phase of projects, which includes a $63 million authorization for Somerville Ave. water, sewer and streetscape work. These projects are currently underway.

28
Union Square has recently become an emerging center for tech-focused business development. Greentown Labs relocated to a facility just outside of Union Square in 2012 to occupying a 33,000 square-foot within a converted envelope factory. The location offers a prototyping lab, co-located office space, machine and electronics shops, and a developing community of startups looking to rapidly grow and progress new products in the clean energy industry. In 2018, Greentown Labs opened up its Global Center for Cleantech Innovation next door, which increased its facilities to 93,000 square feet – making Greentown the largest clean technology incubator in the United States. The facility has helped over 170 startups to date and helps to attract millions in new investment each year for its resident firms. This allows Somerville to stake its claim as a global hub for the clean technology industry. Greentown Labs is part of cluster of economic development anchor institutions located in the former Ames Envelope factory. Back in 2010, corporate consolidation led to the closure of the Ames Envelope factory, which had one of Somerville’s largest employers for eight decades. Over the last ten years however, this former industrial facility has been revitalized as a true, mixed-use center of economic activity. The establishment of Artisan’s Asylum in 2012 placed Somerville as the center of the emerging Makerspace creative movement and helped to jump start the transformation. Soon after, Greentown Labs moved in and in 2013, Brooklyn Boulders opened a 40,000 square foot rock climbing and fitness facility. These institutions have helped to attract new technology companies to locate in the facility and establish it as the center of Somerville’s tech ecosystem. The property was sold in 2018 for $88 million and rebranded as SomerNova. Today, more people are employed at the complex than during the peak of Ames Envelope’s production. Boynton Yards The extension of the Green Line into Union Square has generated new interest in Boynton Yards; the transit stop lies in the northwest corner of the 35-acre district. In April 2009, the City Council approved a rezoning of this important development area and much of Boynton Yards is now located in a Transit Oriented District (TOD), which allows for maximum density and building heights. The City contracted with Parsons Brinckerhoff to conduct a transportation and utility study of Boynton Yards as the first step in creating a new road network and utility infrastructure to support more intense commercial development. The study envisions significant long-term public and private investments in infrastructure allowing for transformational change in Boynton Yards. Through the focal point of the proposed MBTA Green Line Union Square Station, Boynton Yards and Union Square will develop a cohesive identity and become a regional destination for art, shopping and dining. Development interest in Boynton Yards is increasing. The City’s Union Square Master Developer partner, Union Square Station Associates, has entered into an agreement with one of the largest property owners on the D3 block, located at the entrance to Boynton Yards. DLJ Capital Partners received approval last spring and has broken ground on a 270,000 square foot office/lab building at 101 South Street. There is substantial development interest in other parcels in Boynton Yards as the area is poised for transformation from the current industrial and automobile salvage uses to higher value, people-intensive ones. Inner Belt/Brickbottom The Inner Belt is a 160-acre manufacturing and warehouse district that is anticipated to transition to higher-end office and biotechnology uses. An off-ramp which was constructed as part of the Central Artery Project (the “Big Dig”) has improved regional automobile access to Inner Belt. To facilitate Inner Belt’s transition to higher-end uses, the City approved a significant privately-financed infrastructure investment to connect Inner Belt to the fiber optic loop around Boston and Cambridge. The location of this major communications node makes Inner Belt a very competitive location for technology-oriented businesses along with proximity to nearby Kendall Square in Cambridge. This district will benefit dramatically from the planned McGrath Highway Boulevard Project. The City has completed a formal study and is looking to undertake design work and environmental review associated with the long-term conversion of the elevated McCarthy overpass into an at-grade boulevard with “complete streets” style bicycle and pedestrian accommodations. Development activity has picked up with public and private initiatives to activate the area closest to the Washington Street Green Line station, set to open in 2021. At 20 Inner Belt Rd, a development that includes both a new, extended stay hotel and a 205-unit apartment building was approved in February of 2019. The project is expected to break ground by the end of 2019. The Somerville Redevelopment Authority recently acquired a four-acre parcel located at 90 Washington Street. A new public safety complex is planned along with anticipated transit oriented development. Cambridge Crossing DivcoWest is implementing a master plan on 43 acres of land that is split between Somerville, Cambridge and Boston. The project is approved for over 4.5 million square feet of total development, including 2.1 million square feet of science

29
and technology space. The project sits adjacent to the MBTA Community College Orange Line and Lechmere Station Green Line transit stops. The project is positioned to attract growing companies seeking space close to the dynamic life sciences and technology concentration in nearby Kendall Square. Philips announced it will become a lead tenant in the new building at 250 North Street, which sits on the Cambridge/Somerville line. In 2020, it will move its North American headquarters into 350,000 square feet within the building, which is currently under construction. The next building, located on Parcel E/F is a 483,000 square foot lab building which sits entirely in Somerville. The project is currently under construction. Davis Square Davis Square is one of the City’s most vibrant central business districts. This commercial center is located close to Tufts University and anchored by an MBTA Red Line subway station. The combination of this district’s location and public transit access has resulted in strong demand for office, retail, restaurant and entertainment uses. Consequently, Davis Square has limited vacancy in the retail and office market segments. Davis Square has become a regional dining and entertainment destination with some of the Boston area’s finest restaurants, nightclubs, and live entertainment venues. The residential neighborhood surrounding Davis Square has seen dramatic increases in property values and rents, which has resulted in considerable new investment and condominium conversion. Future plans in Davis Square will focus on strategic infill development, streetscape updates or rehabilitation projects to enhance the already vibrant community. The Davis Square Neighborhood Plan is expected to be published in 2019. In May of 2014, the Mayors of Somerville, Cambridge, Boston, Quincy & Braintree launched the Life Sciences Corridor Initiative to promote the robust life sciences sector which has developed along the Red Line, including Davis Square. Together, the five cities represent over 460 companies within the life sciences industry, all connected through the MBTA Red Line. Gilman Square / Ball Square / Lowell Street
“Somerville by Design” is a philosophy of public participation that has grown from the successful SomerVision Comprehensive Plan. Somerville by Design encourages the City and its partners to be deliberate and proactive in planning for a built environment that is safe, attractive, vibrant and equitable. It recognizes that physical planning is an effective way to get average residents and community stakeholders involved in policy making, and crowd-sources the expertise of our community to create a better public realm and better private redevelopment outcomes. To ensure the highest and best use of available parcels, as well as the preservation of established neighborhoods and open spaces, the City has taken steps to consider land use policies surrounding the new Green Line stations. In April 2012, the City adopted a Comprehensive Plan for the City, streetscapes called SomerVision. The SomerVision plan includes six key implementation steps. One of those steps involves the development of design-based plans for future Green Line station areas and that enhance connectivity to, from, and between them. Another involves the overhaul of the Somerville Zoning Ordinance to bring it in-line with SomerVision goals for station-area development as well as neighborhood conservation. The Somerville by Design initiative will implement these key SomerVision strategies. It is funded in part by a grant from the federal Department of Housing and Urban Development’s Sustainable Communities program. Two “series” have already been held, the first centered on station area planning in advance of the green line extension project, the second focused on complete streets policy and design. The City and the MBTA are working closely together to plan for the second stage of the GLX project along the existing Fitchburg Line. It is expected that with the completion of the Green Line Stations, property acquisition, roadway realignments and selective demolition will result in the creation of new Transit Oriented Development parcels. The City has begun to work with area stakeholders to identify strategies to implement the Gilman Square Station Area Plan. Business Assistance Programs
The City of Somerville has instituted several small business assistance programs to support and stimulate local economic development activities. The programs help to stabilize the tax base and insure the economic vitality of the local business community. These are described below. Brownfield Program
The purpose of the Somerville Brownfield Program is to facilitate the assessment, cleanup and reuse or redevelopment of city-owned property.

30
In October of 1996, the City of Somerville was selected by the U.S. Environmental Protection Agency (EPA) to be a Brownfields Site Assessment Pilot Community. Utilizing grant funds totaling $600,000 from the EPA and HUD funds of $100,000, the City has facilitated development of Brownfields sites by providing environmental site testing services and remediation cost overrun coverage to interested redevelopers of Brownfields sites. Pilot project locations have included 220 Washington Street (Union Square), 56 Webster Avenue (Boynton Yards), 29, 30 & 33 Allen Street (Union Square), and 405 Alewife Brook Parkway (the Conwell School). In each instance, site testing and associated environmental engineering services were provided through the program so that redevelopment considerations regarding cleanup costs could be understood at an early stage. In August of 2015, the EPA announced its intention to provide an additional $300,000 to the City’s Brownfield Revolving Loan Fund.
Grant Awards 2009-2014
Grant Sources Awarded/Allocated Use
1 State’s Interagency Permitting Board (IPB) Chapter 43D Technical Assistance Grant 2009
$ 100,000 Permit streamlining for Priority Development Sites (PDS)
2 MassDevelopment - Brownfield Redevelopment Fund 2010
$ 95,000 Assessment of Kiley Barrel
3 MassDevelopment - Brownfield Redevelopment Fund 2011
$ 297,400 Assessment of Kiley Barrel
4 MassDevelopment - Brownfield Redevelopment Fund 2012
$ 950,000 Cleanup of Kiley Barrel
5 MassDEP Brownfield Coalition Grant 2011 $ 50,000 Assessment of Kiley Barrel
6 USEPA Brownfields Cleanup Grant 2011 $ 600,000 Cleanup of Kiley Barrel
7 USEPA Brownfields Cleanup Grant 2012 $ 600,000 Cleanup of Kiley Barrel
8 USEPA Brownfields Assessment Grant 2010 $ 200,000 Targeted for publically-owned sites city-wide
9 USEPA Brownfield Cleanup Revolving Loan Fund 2010
$ 400,000 Targeted for private sites city-wide
10 USEPA Brownfield Cleanup Revolving Loan Fund 2012
$ 450,000 Targeted for the rest of the North Prospect Block
11 USEPA Emergency Planning and Response Branch 2012
Estimated at $1.5M
Restores several abutting residential properties along Allen Street to healthy conditions
12 USEPA Brownfields Assessment Grant 2014 $ 400,000 Targeted for city-wide sites with focus on Inner Belt/ Brickbottom
The former Kiley Barrel site is the largest known brownfield site owned by the SRA and the City of Somerville and exists within the North Prospect Block in Union Square. In 2009, the former Kiley Barrel site was designated as one of a handful of contaminated sites state-wide to join the Lt. Governor’s Brownfield Support Team (BST), which is an initiative aimed to target Brownfield sites that exhibit the greatest need in areas with the greatest economic promise. The BST brought forth collaboration between many state and federal and local agencies that resulted in a significant amount of assistance as shown above. In 2012, the former Kiley Barrel site’s Assessment Phase concluded and the site’s cleanup has been fully funded. In 2014, the City of Somerville completed the soils remediation work at the Kiley barrel site. In addition, the City was also awarded a $400,000 grant from the US Environmental Protection Agency for the assessment of scattered brownfields sites. In April of 2018, the City was awarded another $300,000 Brownfields Site Assessment Grant.

31
Brownfield Cleanup Revolving Loan Fund (BCRLF)
The City’s Brownfield Cleanup Revolving Loan (BCRLF) fund falls under the umbrella of the Somerville Brownfields Program. Somerville aims to utilize the BCRLF to accelerate the transformation of Brownfields from blighting influences on the neighborhood into assets for the community. The economic reuse of these sites will have a positive effect on the local economy by contributing to the commercial tax base and creating new jobs. The BCRLF was first introduced to Somerville in September of 1999, when Somerville was approved by the U.S. Environmental Protection Agency (EPA) as a Brownfield Cleanup Revolving Loan Fund (BCRLF) pilot community. Through a $460,000 initial grant, Somerville has launched a loan program that is available to eligible redevelopers of Brownfields properties within Somerville. In 2003, the EPA streamlined the rules and regulations of the program to make it easier for municipalities to administer it. In 2009, the City made a loan to KSS Realty, Inc. for the MaxPak development that allowed for demolition of structures and soil cleanup at the site, as well as, provided a grant to the Community Action Agency of Somerville (CAAS) to fund the monitoring of conditions at the existing day care center. In fall 2010, Somerville applied and received a $400,000 increase in funding for the BCRLF and spent the award on cleaning up the Conway Park Ice Skating Rink. In 2012, the City applied and was awarded an additional $450,000 in BCRLF funds and is actively working with developers to identify projects to use the funds. Assistance to Small Businesses Lending - While the traditional lending market covers much of Somerville’s business financing needs, the City has complemented this by building relationships with additional financial institutions, created our own loan program, and marketed innovative financial tools, including crowd funding campaigns, to Somerville small businesses. There are also many business financing needs that do not fit into the traditional lending market. With many innovation companies not fitting the underwriting standards of many banks, the City created the Innovation Fund (I-Fund), a $1 million flexible loan fund targeted toward innovative companies looking to expand or relocate in the City. The loan fund acts as a junior lender and matches the loan duration and rate of a senior lender. Financing can be used toward purchasing a building, expansion, equipment purchases, and other uses. The City completed a $300,000 loan in 2013 with Greentown Labs as part of their relocation to Somerville, a $500,000 working capital loan in 2016 with Greentown Labs as part of their Somerville expansion and a $100,000 working capital loan to Somerville Brewing Company to support their New American Fresh Brewhouse at Assembly Row. Many businesses also have smaller financing needs that do not require a traditional loan. For businesses looking for less than $50,000 in financing, the City refers businesses to micro-loan programs, including ACCION, as well as crowdfunding campaign platforms. Many Somerville businesses have successfully used crowdfunding campaigns like Kickstarter and Indiegogo, including Bergamot, Float Boston, MF Dulock, and more. This financing can be used for equipment purchase, renovations, and working capital. Commercial Property Improvement Program - In addition to retail improvements, the City offers incentives for businesses and property owners to upgrade the façade of their buildings. After focusing on East Broadway in 2014 and Winter Hill/Magoun Square in 2015, the program is now focused on greater Union Square and Somerville Avenue. The program is completing projects with 10 storefront businesses in East Broadway, projects with 15 businesses in greater Winter Hill, and a current pipeline of projects with 7 storefront businesses in Union Square. These projects can leverage private investment to upgrade signage, lighting, awning, handicap accessibility, and storefront systems. Somerville Main Streets Program - Somerville currently hosts 2 Main Streets programs – East Somerville Main Streets and Union Square Main Streets. Both organizations are modeled on the National Main Street Center’s successful downtown revitalization structure. East Somerville Main Streets (ESMS), formed in 2006, is a non-profit organization dedicated to improving the lives in the East Broadway community and beyond by establishing a vibrant heart and hub for East Somerville in the East Broadway Business District. ESMS is best known for co-organizing the Carnaval street festival, the Foodie Crawl, and other local events that draw thousands of people to East Somerville in addition to other neighborhood revitalization efforts in the neighborhood. In September, 2013 East Somerville Main Streets received a $50,000 multi-year grant from the National Endowment for the Arts to support efforts to foster a cultural identity and community partnership in relation to the ongoing East Broadway Streetscape project and the newly opened Chuckie Harris Park.

32
Union Square Main Streets (USMS), formed in 2005, focuses on supporting the Union Square business district. USMS is best known for organizing, in partnership with Relish Management, the weekly Union Square Farmer’s Market, the annual Fluff Fest, and other business district activities that have historically drawn several thousand spectators into Union Square. Both organizations are partners on Somerville’s Business Assistance Program to support their neighborhood businesses. Other Notable Projects: Maxwell’s Green: (formerly MaxPac) The project consists of the construction of a multi-building project including a
total of 199 units of housing with dedication of substantial amounts of open space to the public, and construction of new public access to the community path adjacent to the site. The project is complete and now fully occupied.
181-197 Washington Street: 40-units of affordable housing and 44 units of market rate housing with ground level retail, completed in 2017;
625 McGrath Highway: 32 units of housing substantially, completed in 2016;
315 Broadway: 46 units of residential over ground floor retail substantially complete;
771 McGrath Highway: 75-unit residential building, including 9 affordable units, under construction;
434 McGrath Highway: 48 units of housing with ground floor retail and office space, under construction;
373 Beacon Street: 35-room boutique hotel, under construction;
Powder House: MarKa LLC will rehabilitate the former Powder House Community School into 48 new homes including affordable, senior and live-work artist units, and more than 11,000 square feet of commercial space including collaborative maker spaces and an artists’ hall. They are also providing 40 percent of the site be used as publicly accessible open space. Construction is underway;
515 Somerville Avenue: 165 room hotel, project approved. Transportation and Infrastructure Transit As mentioned above, the City secured funding for a new Assembly Square Orange Line station (combination of federal, state and private funding). The station opened on September 2, 2014 and is fully operational. The MBTA Green Line Extension (“GLX”) is currently under construction. This long-standing transit commitment will produce seven new light-rail stations (five in Somerville and two just outside the municipal borders) as well as a regionally-significant pedestrian and bicycle path. The project will improve the City’s air quality, reduce roadway congestion and catalyze major redevelopment activities. Station openings are currently projected for 2021. Major funding sources include a $996 million grant awarded by the Federal Transit Administration in January 2015, as well as at least $1 billion in Commonwealth special transit bond financing. In December 2015, the MassDOT Board of Directors and the MBTA Fiscal Management and Control Board (FMCB) formally resolved that in order for the Green Line Extension to continue, non-state funding commitments would be required from the Boston Region Metropolitan Planning Organization (MPO) and the municipal governments hosting the GLX. On May 5, 2016, the MPO formally voted to reprogram $152 million in flexed highway funds to support the GLX. On May 6, 2016 the City and the City of Cambridge formally announced their intentions to seek local legislative approval to contribute $50 million (Somerville) and $25 million (Cambridge) to support construction of the GLX. On May 9, 2016 the MassDOT Board and the FMCB acknowledged these unprecedented commitments as a key factor in their decision to vote to continue the GLX. The two cities provided binding commitments for funding in the fall of 2016 in order for MassDOT to conclude its contract negotiations with the Federal Transit Administration. In 2017, GLX Contracting was selected to build out the project. Construction is underway with an expected completion by 2021. The City of Somerville has 14 MBTA bus lines serving roughly 20,000 daily trips. The City has installed more than 30 miles of dedicated bicycle facilities since 2010, and also has 12 bike share stations through the regional Hubway program.

33
Roadway, Bridge and Open Space Funded Projects: The City has secured over $52 million in various federal and state government appropriations and earmarks for various roadway, bridge and open space improvements and access studies. The projects include: Roadway Broadway in East Somerville streetscape improvements ($8 million) – a streetscape and utility improvements project
completed in the summer of 2015. McGrath De-elevation Study ($120,000) – study underway by state to prepare a locally preferred alternative for a de-
elevated/boulevard style roadway. Beacon Street ($9 million) – a streetscape and roadway reconstruction currently underway in the Boston region’s most
bicycled roadway. I-93 in Somerville and Boston – ($11 million) funding is programmed for the repaving of I-93 in Somerville to Boston.
Project complete. Community Path from Cedar to Lowell Street ($2 million) – Extension of the Community Path from its existing terminus
at Cedar Street to Lowell Street. Project completion was completed in the spring of 2015. Streetscape and Adaptive Re-Use ($600,000) – a citywide transportation study and associated analysis of the Inner
Belt district will provide the City with a transportation “roadmap” for the next 25-30 years. Route 28 Undercarriage ($1 million) – a bicycle and pedestrian walkway currently under construction between the ten
hills neighborhood of Somerville to the new Assembly Square Orange Line Station. This project was completed in 2014.
Bridges McCarthy Overpass Improvements ($11 million) – Improvements to the existing elevated roadway structure and interim
improvements to the existing signals, with significant bicycle and pedestrian upgrades. Project is complete. Cross Street Bridge ($4.2 million) – Reconstruction of the Cross Street Bridge in East Somerville. Project was
completed in early 2014. Gilman Street Rail Bridge ($12 million) – Planned reconstruction of the Rail Bridge over Gilman Street in East
Somerville. Open Spaces Chuckie Harris Park ($906,000) – An innovative new park in East Somerville, project was completed in 2013. Baxter Park ($700,000) - Improvements to Baxter Park on the Mystic River, project was completed in 2014. North Street Park ($1 million) – A reconstruction and expansion of North Street Park, project construction was
completed in 2014. Kenney Park in Davis Square ($400,000) – The City has designed a rehabilitation and improvements to Kenney Park
in Davis Square, project construction was completed in 2014. Symphony Park – A new park on the corner of Pearl St. in East Somerville, completed in summer 2015. Marshal St. Playground – A significant reconstruction of an existing park in Winter Hill, completed in spring of 2015. Projects currently in the Planning Stages: Beyond the $53 million currently under construction or contract listed above, the City is actively planning for continued growth and investment. These projects include: Davis Square Streetscape (est. $12.5 million) - The City is currently enlisting the services of Crosby Schlesinger and
Smallridge to finalize the designs. Estimated investment in the next 24 months is $7 million. Central Broadway (est. $12 million) – extending the streetscape and utility improvements recently completed on East
Broadway west to Ball Square. Transportation and Utilities Encouraging a trend toward more pedestrian and bicycle travel, Somerville continues its commitment to providing better pedestrian circulation and access by pursuing expansion and improvements to existing pedestrian paths, and by striping bicycle paths throughout its street network. This commitment was recently recognized by Somerville’s designation as a “Bike Friendly Community” by the League of American Bicyclists. The City also saw an increase of more than 56% in bicycle commuting share between 2010 and 2013 – making it the #1 bike commuting City in the Northeast according to

34
the League of American Bicyclists. Accordingly, the City has made significant investments, painting over 30 miles of bike lanes and sharrows and increasing bike parking with the installation of bike racks and 10 bike corrals. The City’s streetscape projects make use of bumpouts, curb extensions, and raised intersections with the goal of calming traffic and improving the pedestrian experience. The Broadway project in East Somerville is the cornerstone of this effort. This year the City attended the groundbreaking of the expansion of the Minuteman Trail, which now extends from Somerville to Lexington. The City continues to work with MassDOT on the completion of the Community Path to NorthPoint in Cambridge. Several of these segments are under construction or were recently completed using various federal funds. The City is served by Interstate 93, McGrath and O’Brien Highways, Route 38 (Mystic Avenue), Route 16 and the Fellsway. Rapid transit and bus service within the City and to neighboring communities, including Boston, is provided by the Massachusetts Bay Transportation Authority (MBTA). Other private carriers provide taxicab (with one locally owned cab company) and other transportation services to various city businesses and institutions such as Tufts University. Complete water and sewer services are provided for by connections to the Massachusetts Water Resources Authority (MWRA) system. Gas and electric services are provided by established private utilities. Income Levels and Population
POPULATION AND INCOME
Somerville Massachusetts United StatesMedian Age:
2010 31.4 39.1 37.22000 31.1 36.5 35.31990 31.0 33.6 32.91980 29.9 31.2 30.0
Median Family Income:2010 $69,245 $81,165 $51,1442000 51,243 61,644 50,0461990 38,532 44,367 35,2251980 18,220 21,166 19,908
Per Capita Income:2010 $32,517 $33,966 $27,3342000 23,628 25,952 21,5871990 15,179 17,224 14,420 1980 6,249 7,459 7,313
_____________ SOURCE: U.S. Bureau of the Census.
POPULATION TRENDS
2010 2000 1990 1980
75,754 77,478 76,210 77,372 _____________ SOURCE: U.S. Bureau of the Census. On the basis of the 2010 Federal Census, the City has a population density of approximately 18,427 persons per square mile.
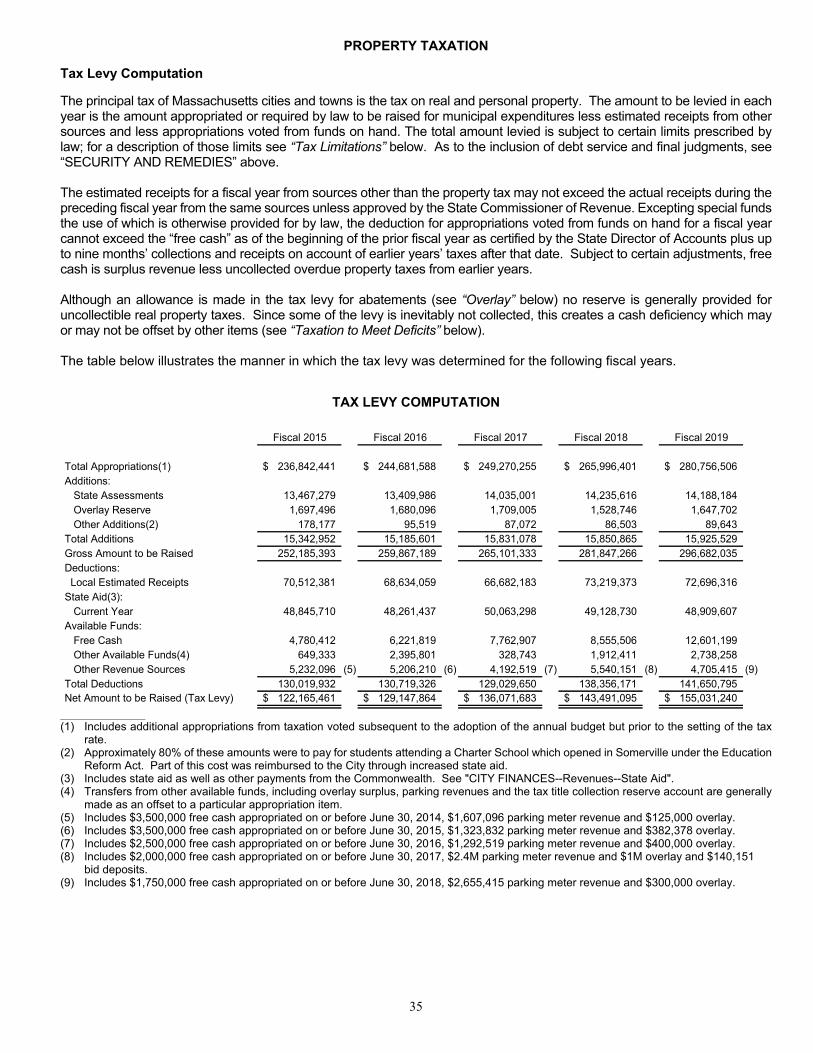
35
PROPERTY TAXATION Tax Levy Computation The principal tax of Massachusetts cities and towns is the tax on real and personal property. The amount to be levied in each year is the amount appropriated or required by law to be raised for municipal expenditures less estimated receipts from other sources and less appropriations voted from funds on hand. The total amount levied is subject to certain limits prescribed by law; for a description of those limits see “Tax Limitations” below. As to the inclusion of debt service and final judgments, see “SECURITY AND REMEDIES” above. The estimated receipts for a fiscal year from sources other than the property tax may not exceed the actual receipts during the preceding fiscal year from the same sources unless approved by the State Commissioner of Revenue. Excepting special funds the use of which is otherwise provided for by law, the deduction for appropriations voted from funds on hand for a fiscal year cannot exceed the “free cash” as of the beginning of the prior fiscal year as certified by the State Director of Accounts plus up to nine months’ collections and receipts on account of earlier years’ taxes after that date. Subject to certain adjustments, free cash is surplus revenue less uncollected overdue property taxes from earlier years. Although an allowance is made in the tax levy for abatements (see “Overlay” below) no reserve is generally provided for uncollectible real property taxes. Since some of the levy is inevitably not collected, this creates a cash deficiency which may or may not be offset by other items (see “Taxation to Meet Deficits” below). The table below illustrates the manner in which the tax levy was determined for the following fiscal years.
TAX LEVY COMPUTATION
Fiscal 2015 Fiscal 2016 Fiscal 2017 Fiscal 2018 Fiscal 2019
Total Appropriations(1) 236,842,441$ 244,681,588$ 249,270,255$ 265,996,401$ 280,756,506$ Additions: State Assessments 13,467,279 13,409,986 14,035,001 14,235,616 14,188,184 Overlay Reserve 1,697,496 1,680,096 1,709,005 1,528,746 1,647,702 Other Additions(2) 178,177 95,519 87,072 86,503 89,643 Total Additions 15,342,952 15,185,601 15,831,078 15,850,865 15,925,529 Gross Amount to be Raised 252,185,393 259,867,189 265,101,333 281,847,266 296,682,035 Deductions: Local Estimated Receipts 70,512,381 68,634,059 66,682,183 73,219,373 72,696,316 State Aid(3): Current Year 48,845,710 48,261,437 50,063,298 49,128,730 48,909,607 Available Funds: Free Cash 4,780,412 6,221,819 7,762,907 8,555,506 12,601,199 Other Available Funds(4) 649,333 2,395,801 328,743 1,912,411 2,738,258 Other Revenue Sources 5,232,096 (5) 5,206,210 (6) 4,192,519 (7) 5,540,151 (8) 4,705,415 (9)Total Deductions 130,019,932 130,719,326 129,029,650 138,356,171 141,650,795 Net Amount to be Raised (Tax Levy) 122,165,461$ 129,147,864$ 136,071,683$ 143,491,095$ 155,031,240$
_______________________
(1) Includes additional appropriations from taxation voted subsequent to the adoption of the annual budget but prior to the setting of the tax rate.
(2) Approximately 80% of these amounts were to pay for students attending a Charter School which opened in Somerville under the Education Reform Act. Part of this cost was reimbursed to the City through increased state aid.
(3) Includes state aid as well as other payments from the Commonwealth. See "CITY FINANCES--Revenues--State Aid". (4) Transfers from other available funds, including overlay surplus, parking revenues and the tax title collection reserve account are generally
made as an offset to a particular appropriation item. (5) Includes $3,500,000 free cash appropriated on or before June 30, 2014, $1,607,096 parking meter revenue and $125,000 overlay. (6) Includes $3,500,000 free cash appropriated on or before June 30, 2015, $1,323,832 parking meter revenue and $382,378 overlay. (7) Includes $2,500,000 free cash appropriated on or before June 30, 2016, $1,292,519 parking meter revenue and $400,000 overlay. (8) Includes $2,000,000 free cash appropriated on or before June 30, 2017, $2.4M parking meter revenue and $1M overlay and $140,151
bid deposits. (9) Includes $1,750,000 free cash appropriated on or before June 30, 2018, $2,655,415 parking meter revenue and $300,000 overlay.

36
Assessed Valuations and Tax Levies Property is classified for the purpose of taxation according to its use. The legislature has in substance created three classes of taxable property: (1) residential real property, (2) open space land, and (3) all other (commercial, industrial and personal property). Within limits, cities and towns are given the option of determining the share of the annual levy to be borne by each of the three categories. The share required to be borne by residential real property is at least 50 per cent of its share of the total taxable valuation; the effective rate for open space must be at least 75 per cent of the effective rate for residential real property; and the share of commercial, industrial and personal property must not exceed 175 percent of their share of the total valuation. A city or town may also exempt up to 20 percent of the valuation of residential real property (where used as the taxpayer’s principal residence) and up to 10 percent of the valuation of commercial real property (where occupied by certain small businesses). Property may not be classified in a city or town until the State Commissioner of Revenue certifies that all property in the city or town has been assessed at its fair cash value. Such certification must take place every five years, or pursuant to a revised schedule as may be issued by the Commissioner. Related statutes provide that certain forest land, agricultural or horticultural land (assessed at the value it has for these purposes) and recreational land (assessed on the basis of its use at a maximum of 25 percent of its fair cash value) are all to be taxed at the rate applicable to commercial property. Land classified as forest land is valued for this purpose at five percent of fair cash value but not less than ten dollars per acre. The City has used multiple tax rates for different classes of property since fiscal year 1986. Professional reevaluations of all property in the City to full and fair cash value in compliance with Massachusetts law were mostly recently completed for use in fiscal year 2017. The City conducts an interim year adjustment on values annually.
The table below sets forth the trend in the City's assessed valuations, tax rates, tax levies, and tax levies per capita for the following fiscal years.
Real Personal Total Tax Rate PerFiscal Estate Property Assessed $1,000 Valuation Tax LevyYear Valuation Valuation Valuation Residential All other Tax Levy Per Capita(2)
2019 15,363,243,508$ 293,268,510$ 15,656,512,018$ 10.76$ 17.33$ 155,031,240$ 2,047$ 2018 13,524,586,100 266,170,830 13,790,756,930 11.31 18.21 143,491,095 1,894 2017 (1) 12,409,326,300 251,203,200 12,660,529,500 11.67 18.81 136,071,683 1,796 2016 10,974,792,900 223,981,370 11,198,774,270 12.53 20.18 129,147,863 1,705 2015 10,276,528,400 215,696,880 10,492,225,280 12.61 20.38 122,165,461 1,613
_____________ (1) Professional revaluation year. (2) Based on 2010 Federal Census figure. Classification of Property The following is a breakdown of the City's assessed valuation of real estate in fiscal years 2017, 2018 and 2019.
Amount % of Total Amount % of Total Amount % of Total
Residential 10,814,213,402$ 85.4 % 11,826,529,847$ 85.8 % 13,505,275,940$ 86.3 %
Commercial 1,255,256,698 9.9 1,349,824,853 9.8 1,503,833,168 9.6
Industrial 339,856,200 2.7 348,231,400 2.5 354,134,400 2.3
Personal 251,203,200 2.0 266,170,830 1.9 293,268,510 1.9
Total Real Estate 12,660,529,500$ 100.0 % 13,790,756,930$ 100.0 % 15,656,512,018$ 100.0 %
Property Type
20192017 (1) 2018
_____________ (1) Professional revaluation year.

37
Largest Taxpayers
The following table lists the ten largest taxpayers in the City based upon assessed valuation for fiscal 2019. All of the taxpayers listed below are current in their tax payments.
Total Assessed % of
Nature of Valuation for Amount TotalName Business Fiscal 2019 of Tax Levy
Street Retail Inc. Commercial - Residential $488,130,000 $6,805,968 4.39 %FR Assembly Square LLC Shopping Mall 77,747,900 1,347,371 0.87 NSTAR Electric Co Electric Company 76,599,590 1,327,471 0.86 DW NP PROPERTY LLC Office Building 62,366,600 1,080,813 0.70 Twin City Plaza LLC Retail Mall 54,998,900 953,131 0.61 NSTAR Gas Co Gas Company 51,026,530 884,290 0.57 National Tax Search LLC Trustee Office Building 41,721,500 723,034 0.47 I-93 Somerville LLC Retail 40,743,100 706,078 0.46 Assembly Row Condominium Residential 64,588,300 694,970 0.45 CRP 70 Inner Belt LLC Telecom 39,560,600 685,585 0.44 Total $997,483,020 $15,208,711 9.81 %
State Equalized Valuation In order to determine appropriate relative values for the purposes of certain distributions to and assessments upon cities and towns, the Commissioner of Revenue biennially makes a determination of the fair cash value of the taxable property in each municipality as of January 1 of even numbered years. This is known as the "equalized value". Local assessed valuations are determined annually as of January 1 and used for the fiscal year beginning on the next July 1. The following table sets forth the State equalized valuation of the City.
State Equalized City %
January 1, Valuation Increase
2018 $15,170,069,800 21.91 %2016 12,444,120,100 19.12 2014 10,446,575,400 13.09 2012 9,237,328,000 1.08 2010 9,139,060,000 (4.92)2008 9,612,275,100 10.25
Abatements and Overlay The City is authorized to increase each tax levy by an amount approved by the Commissioner of Revenue as an "overlay" to provide for tax abatements. If abatements are granted in excess of the applicable overlay, the resultant "overlay deficit" is required to be added to the next tax levy. An abatement granted after a tax payment has been made is accounted for as a refund on the books of the City. Any balance in the overlay account, in excess of the amount of the warrant remaining to be collected or abated, is transferred to a reserve fund to be used for extraordinary or unforeseen expenses. Abatements are granted where exempt real or personal property has been assessed or where taxable real or personal property has been overvalued or disproportionately valued. The assessors may also abate uncollectible personal property taxes. They may abate real and personal property taxes on broad grounds (including inability to pay) with the approval of the State Commissioner of Revenue.

38
The following table sets forth the amount of the overlay reserve for each of the last five fiscal years and actual abatements and refunds granted through June 30, 2019 against each levy.
Fiscal Net Tax Dollar As a % ofYear Levy(1) Amount Net Levy
2019 $153,383,538 $1,647,702 1.1 % $798,518 2018 141,962,349 1,528,746 1.1 1,190,339 2017 134,362,678 1,709,005 1.3 1,282,209 2016 127,467,767 1,680,096 1.3 1,289,256 2015 120,467,965 1,697,496 1.4 1,301,316
Overlay Reserve AbatementsGranted Through
June 30, 2019
_____________ (1) Tax levy prior to addition of overlay reserve. Tax Collections Property tax bills are payable quarterly on August 1, November 1, February 1, and May 1 of each fiscal year. Interest accrues on delinquent taxes at the rate of 14 percent per annum. Real property (land and buildings) is subject to a lien for the taxes assessed upon it, subject to any paramount federal lien and subject to bankruptcy and insolvency laws. If the property has been transferred, an unenforced lien expires on the fourth December 31 after the end of the fiscal year to which the tax relates. If the property has not been transferred by the fourth December 31, an unenforced lien expires upon a later transfer of the property. Provision is made, however, for continuation of the lien where it could not be enforced because of a legal impediment. The persons against whom real or personal property taxes are assessed are personally liable for the tax (subject to bankruptcy and insolvency laws). In the case of real property, this personal liability is effectively extinguished by sale or taking of the property as described below. The table below compares the City's net tax collections with its net (gross tax levy less overlay reserve for abatements) tax levies for the following fiscal years.
TAX COLLECTIONS
Fiscal Gross Tax Net Dollar % of Dollar % ofYear Levy Tax Levy(1) Amount Net Levy Amount Net Levy
2019 $155,031,240 $153,383,538 $152,029,828 99.12 % $152,029,828 99.12 %2018 143,491,095 141,962,349 140,570,868 99.02 141,731,710 99.842017 136,071,683 134,362,678 133,104,108 99.06 134,310,189 99.962016 129,147,863 127,467,767 126,428,749 99.18 127,454,326 99.992015 122,165,461 120,467,965 119,569,681 99.25 120,442,179 99.98
Collections During Collections as ofFiscal Year Payable (2) June 30, 2019 (2)
_____________ (1) Net after deduction of overlay for abatements. (2) Actual dollar collections net of refunds. Does not include abatements or other non-cash credits.

39
Tax Titles and Possessions Massachusetts law permits a municipality either to sell by public sale (at which the municipality may become the purchaser) or to take real property for non-payment of taxes. In either case the property owner can redeem the property by paying the unpaid taxes, with interest and other charges, but if the right of redemption is not exercised within six months (which may be extended an additional year in the case of certain installment payments) it can be foreclosed by petition to the Land Court. Upon such foreclosure, a tax title purchased or taken by the municipality becomes a "tax possession" and may be held and disposed of in the same manner as other land held for municipal purposes. Uncollectible real property taxes are ordinarily not written off until they become municipal tax titles by purchase at the public sale or by taking, at which time the tax is written off in full by reserving the amount of tax and charging surplus. The following table sets forth the amount of tax titles and possessions outstanding at the end of each of the last five fiscal years.
Total TaxFiscal Titles andYear Possessions2019 1,297,908$ 2018 818,578 2017 851,508 2016 1,212,680 2015 1,368,643
Sale of Tax Receivables Cities and towns are authorized to sell delinquent property tax receivables by public sale or auction, either individually or in bulk. The City does not expect to utilize this option at this time. Taxation to Meet Deficits As noted elsewhere (see “Overlay” above) overlay deficits, i.e. tax abatements in excess of the overlay included in the tax levy to cover abatements, are required to be added to the next tax levy. It is generally understood that revenue deficits, i.e. those resulting from non-property tax revenues being less than anticipated, are also required to be added to the tax levy (at least to the extent not covered by surplus revenue). Amounts lawfully expended since the prior tax levy and not included therein are also required to be included in the annual tax levy. The circumstances under which this can arise are limited since municipal departments are generally prohibited from incurring liabilities in excess of appropriations except for major disasters, mandated items, contracts in aid of housing and renewal projects and other long-term contracts. In addition, utilities must be paid at established rates and certain established salaries, e.g. civil service, must legally be paid for work actually performed, whether or not covered by appropriations. Cities and towns are authorized to appropriate sums, and thus to levy taxes, to cover deficits arising from other causes, such as “free cash” deficits arising from a failure to collect taxes. This is not generally understood, however, and it has not been the practice to levy taxes to cover free cash deficits. Except to the extent that such deficits have been reduced or eliminated by subsequent collections of uncollected taxes (including sales of tax titles and tax possessions), lapsed appropriations, non-property tax revenues in excess of estimates, other miscellaneous items or funding loans authorized by special act, they remain in existence. Tax Limitations Chapter 59, Section 21C of the General Laws, also known as Proposition 2½, imposes two separate limits on the annual tax levy of a city or town. The primary limitation is that the tax levy cannot exceed 2½ percent of the full and fair cash value. If a city or town exceeds the primary limitation, it must reduce its tax levy by at least 15 percent annually until it is in compliance, provided that the reduction can be reduced in any year to not less than 7½ percent by majority vote of the voters, or to less than 7½ percent by two-thirds vote of the voters. For cities and towns at or below the primary limit, a secondary limitation is that the tax levy cannot exceed the maximum levy limit for the preceding fiscal year as determined by the State Commissioner of Revenue by more than 2 1/2 percent, subject to

40
exceptions for property added to the tax rolls or property which has had an increase, other than as part of a general revaluation, in its assessed valuation over the prior year’s valuation. This “growth” limit on the tax levy may be exceeded in any year by a majority vote of the voters, but an increase in the secondary or growth limit under this procedure does not permit a tax levy in excess of the primary limitation, since the two limitations apply independently. In addition, if the voters vote to approve taxes in excess of the “growth” limit for the purpose of funding a stabilization fund, such increased amount may only be taken into account for purposes of calculating the maximum levy limit in each subsequent year if the board of selectmen of a town or the city council of a city votes by a two-thirds vote to appropriate such increased amount in such subsequent year to the stabilization fund. The applicable tax limits may also be reduced in any year by a majority vote of the voters. The State Commissioner of Revenue may adjust any tax limit “to counterbalance the effects of extraordinary, non-recurring events which occurred during the base year”. Proposition 2 1/2 further provides that the voters may exclude from the taxes subject to the tax limits and from the calculation of the maximum tax levy (a) the amount required to pay debt service on bonds and notes issued before November 4, 1980, if the exclusion is approved by a majority vote of the voters, and (b) the amount required to pay debt service on any specific subsequent issue for which similar approval is obtained. Even with voter approval, the holders of the obligations for which unlimited taxes may be assessed do not have a statutory priority or security interest in the portion of the tax levy attributable to such obligations. It should be noted that Massachusetts General Laws Chapter 44, Section 20 requires that the taxes excluded from the levy limit to pay debt service on any such bonds and notes be calculated based on the true interest cost of the issue. Accordingly, the Department of Revenue limits the amount of taxes which may be levied in each year to pay debt service on any such bonds and notes to the amount of such debt service, less a pro rata portion of any original issue premium received by the city or town that was not applied to pay costs of issuance. Voters may also exclude from the Proposition 2½ limits the amount required to pay specified capital outlay expenditures or for the city or town’s apportioned share for certain capital outlay expenditures by a regional governmental unit. In addition, the city council of a city, with the approval of the mayor if required, may vote to exclude from the Proposition 2½ limits taxes raised in lieu of sewer or water charges to pay debt service on bonds or notes issued by the municipality (or by an independent authority, commission or district) for water or sewer purposes, provided that the municipality’s sewer or water charges are reduced accordingly. In addition, Proposition 2½ limits the annual increase in the total assessments on cities and towns by any county, district, authority, the Commonwealth or any other governmental entity (except regional school districts, the MWRA and certain districts for which special legislation provides otherwise) to the sum of (a) 2½ percent of the prior year’s assessments and (b) “any increases in costs, charges or fees for services customarily provided locally or for services subscribed to at local option”. Regional water districts, regional sewerage districts and regional veterans districts may exceed these limitations under statutory procedures requiring a two-thirds vote of the district’s governing body and either approval of the local appropriating authorities (by two-thirds vote in districts with more than two members or by majority vote in two-member districts) or approval of the registered voters in a local election (in the case of two-member districts). Under Proposition 2½ any State law to take effect on or after January 1, 1981 imposing a direct service or cost obligation on a city or town will become effective only if accepted or voluntarily funded by the city or town or if State funding is provided. Similarly, State rules or regulations imposing additional costs on a city or town or laws granting or increasing local tax exemptions are to take effect only if adequate State appropriations are provided. These statutory provisions do not apply to costs resulting from judicial decisions.
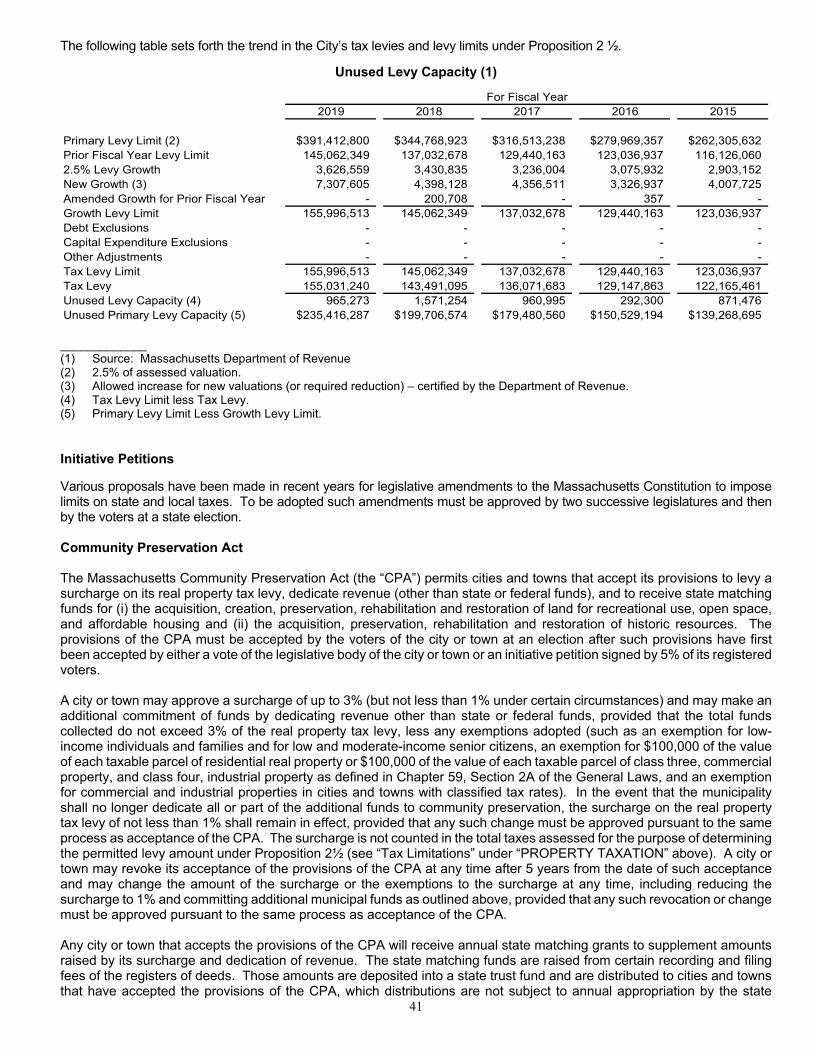
41
The following table sets forth the trend in the City’s tax levies and levy limits under Proposition 2 ½.
Unused Levy Capacity (1)
2019 2018 2017 2016 2015
Primary Levy Limit (2) $391,412,800 $344,768,923 $316,513,238 $279,969,357 $262,305,632Prior Fiscal Year Levy Limit 145,062,349 137,032,678 129,440,163 123,036,937 116,126,0602.5% Levy Growth 3,626,559 3,430,835 3,236,004 3,075,932 2,903,152New Growth (3) 7,307,605 4,398,128 4,356,511 3,326,937 4,007,725Amended Growth for Prior Fiscal Year - 200,708 - 357 - Growth Levy Limit 155,996,513 145,062,349 137,032,678 129,440,163 123,036,937Debt Exclusions - - - - - Capital Expenditure Exclusions - - - - - Other Adjustments - - - - - Tax Levy Limit 155,996,513 145,062,349 137,032,678 129,440,163 123,036,937Tax Levy 155,031,240 143,491,095 136,071,683 129,147,863 122,165,461Unused Levy Capacity (4) 965,273 1,571,254 960,995 292,300 871,476Unused Primary Levy Capacity (5) $235,416,287 $199,706,574 $179,480,560 $150,529,194 $139,268,695
For Fiscal Year
_____________ (1) Source: Massachusetts Department of Revenue (2) 2.5% of assessed valuation. (3) Allowed increase for new valuations (or required reduction) – certified by the Department of Revenue. (4) Tax Levy Limit less Tax Levy. (5) Primary Levy Limit Less Growth Levy Limit. Initiative Petitions Various proposals have been made in recent years for legislative amendments to the Massachusetts Constitution to impose limits on state and local taxes. To be adopted such amendments must be approved by two successive legislatures and then by the voters at a state election. Community Preservation Act The Massachusetts Community Preservation Act (the “CPA”) permits cities and towns that accept its provisions to levy a surcharge on its real property tax levy, dedicate revenue (other than state or federal funds), and to receive state matching funds for (i) the acquisition, creation, preservation, rehabilitation and restoration of land for recreational use, open space, and affordable housing and (ii) the acquisition, preservation, rehabilitation and restoration of historic resources. The provisions of the CPA must be accepted by the voters of the city or town at an election after such provisions have first been accepted by either a vote of the legislative body of the city or town or an initiative petition signed by 5% of its registered voters. A city or town may approve a surcharge of up to 3% (but not less than 1% under certain circumstances) and may make an additional commitment of funds by dedicating revenue other than state or federal funds, provided that the total funds collected do not exceed 3% of the real property tax levy, less any exemptions adopted (such as an exemption for low-income individuals and families and for low and moderate-income senior citizens, an exemption for $100,000 of the value of each taxable parcel of residential real property or $100,000 of the value of each taxable parcel of class three, commercial property, and class four, industrial property as defined in Chapter 59, Section 2A of the General Laws, and an exemption for commercial and industrial properties in cities and towns with classified tax rates). In the event that the municipality shall no longer dedicate all or part of the additional funds to community preservation, the surcharge on the real property tax levy of not less than 1% shall remain in effect, provided that any such change must be approved pursuant to the same process as acceptance of the CPA. The surcharge is not counted in the total taxes assessed for the purpose of determining the permitted levy amount under Proposition 2½ (see “Tax Limitations” under “PROPERTY TAXATION” above). A city or town may revoke its acceptance of the provisions of the CPA at any time after 5 years from the date of such acceptance and may change the amount of the surcharge or the exemptions to the surcharge at any time, including reducing the surcharge to 1% and committing additional municipal funds as outlined above, provided that any such revocation or change must be approved pursuant to the same process as acceptance of the CPA. Any city or town that accepts the provisions of the CPA will receive annual state matching grants to supplement amounts raised by its surcharge and dedication of revenue. The state matching funds are raised from certain recording and filing fees of the registers of deeds. Those amounts are deposited into a state trust fund and are distributed to cities and towns that have accepted the provisions of the CPA, which distributions are not subject to annual appropriation by the state

42
legislature. The amount distributed to each city and town is based on a statutory formula and the total state distribution made to any city or town may not exceed 100% of the amount raised locally by the surcharge on the real property tax levy. The amounts raised by the surcharge on taxes, the dedication of revenue and received in state matching funds are required to be deposited in a dedicated community preservation fund. Each city or town that accepts the provisions of the CPA is required to establish a community preservation committee to study the community preservation needs of the community and to make recommendations to the legislative body of the city or town regarding the community preservation projects that should be funded from the community preservation fund. Upon the recommendations of the committee, the legislative body of the city or town may appropriate amounts from the fund for permitted community preservation purposes or may reserve amounts for spending in future fiscal years, provided that at least 10% of the total annual revenues to the fund must be spent or set aside for open space purposes, 10% for historic resource purposes and 10% for affordable housing purposes. The CPA authorizes cities and towns that accept its provisions to issue bonds and notes in anticipation of the receipt of surcharge and dedicated revenues to finance community preservation projects approved under the provisions of the CPA. Bonds and notes issued under the CPA are general obligations of the city or town and are payable from amounts on deposit in the community preservation fund. In the event that a city or town revokes its acceptance of the provisions of the CPA, the surcharge shall remain in effect until all contractual obligations incurred by the city or town prior to such revocation, including the payment of bonds or notes issued under the CPA, have been fully discharged. On November 6, 2012, the City adopted the CPA. The CPA was implemented in the first quarter of fiscal year 2014.
Community Preservation Fund Major Revenues
Fiscal Year Property Tax State Contribution All Other Total
2019 1,952,974$ 432,342$ 122,590$ 2,507,906$ 2018 1,794,508 370,465 510,594 2,675,567 2017 1,664,815 420,681 507,659 2,593,155 2016 1,546,198 829,456 518,866 2,894,520 2015 1,430,721 904,917 1,207,134 3,542,772
The CPA fund balance at June 30, 2019 was $4,346,315.

43
CITY FINANCES Budget and Appropriation Process Pursuant to the City Charter, City department heads are required to submit their budget requests to the Mayor between January and February in each year. The Mayor then submits a budget request and recommendation for the next fiscal year beginning on July 1, to the City Council in March or April in each year. Under the Charter, the City Council must adopt a budget by June 30. The Mayor is required to submit a budget. The City Council may make appropriations for the recommended purposes and may reduce or reject any item. Without a recommendation of the Mayor, the City Council may not make any appropriation for a purpose not included in the proposed budget (except by a two-thirds vote in case of the failure of the Mayor to recommend an appropriation for such a purpose within 7 days after a request from the City Council). The City Council may not increase any item without the recommendation of the Mayor (except as provided by legislation, subject to local acceptance, under which the school budget or regional school district assessment can be increased upon recommendation of the school committee and the two-thirds vote of the City Council, provided that such increase does not cause the total annual budget to exceed the property tax limitations). If the City Council fails to act on any item of the proposed budget within 45 days, that item takes effect. If the Mayor does not make a timely budget submission, provision is made for preparation of a budget by the City Council. Provision is also made for supplementary appropriations upon recommendation of the Mayor. Water department expenditures are required to be included in the budget adopted by the City Council. As a result of an initiative law adopted in November 1980, school committees are no longer autonomous with respect to school expenditures for current purposes. The school budget is limited to the amount appropriated by the City Council, but the school committee retains full power to allocate the funds appropriated. Mandatory items, such as state assessments, the overlay for abatements, abatements in excess of overlays, principal and interest not otherwise provided for and final judgments are included in the tax levy whether or not included in the budget. Revenues are not required to be set forth in the budget but estimated non-tax revenues are taken into account by the assessors in fixing the tax levy. (See "Security and Remedies" and "PROPERTY TAXATION--Tax Levy Computation".) The table below sets forth the trend in operating budgets in the format recommended by the Mayor and voted by the City Council for the following fiscal years.
BUDGET COMPARISON
Fiscal 2016 Fiscal 2017 Fiscal 2018 Fiscal 2019 Fiscal 2020
General Government 18,134,833$ 18,879,501$ 20,225,509$ 21,342,545$ 24,981,523$ Public Safety 38,280,561 41,249,438 41,852,045 42,702,095 45,432,626Education 62,512,658 65,420,081 68,622,970 72,679,325 76,257,481Culture & Recreation 2,847,503 3,282,026 3,978,780 5,035,007 4,502,265Debt Service 9,874,161 10,748,066 9,974,364 11,646,258 12,511,140Insurance 23,107,579 23,889,393 25,537,761 24,958,572 25,464,960 Compensation and Pensions 14,322,080 14,776,683 14,848,561 15,464,385 15,465,460Public Works 24,784,573 26,662,191 27,374,212 27,169,910 28,503,712Water & Sewer 32,359,777 32,399,057 35,717,179 37,368,802 43,239,431Other 1,906,851 2,156,507 3,700,068 4,911,270 4,216,571 Grand Total 228,130,576$ 239,462,943$ 251,831,449$ 263,278,169$ 280,575,169$
44
Revenues Property Taxes: Property taxes together with State aid are the major sources of revenue for the City. The total amount of property taxes to be levied is subject to certain limits prescribed by law; for a description of those limits see "PROPERTY TAXATION--Tax Limitations". Federal Aid: On January 25, 2017, President Trump issued an Executive Order (the “Order”) intended to enforce the U.S. immigration laws. The Order includes a provision directing the Attorney General and the Secretary of Homeland Security to ensure that state and local jurisdictions that willfully refuse to comply with federal law concerning the provision of information on individuals' immigration status will not be eligible to receive federal grants except as deemed necessary for law enforcement purposes. The City Council adopted a resolution in the mid-1980s declaring Somerville to be a sanctuary city and the Mayor has recently reaffirmed this status, which could possibly subject the City to the loss of federal funds following implementation of the Order. The validity of the Order is currently being challenged in court by various communities, including two cities in Massachusetts. The City currently receives approximately $12.2 million in annual federal grants. The City cannot predict how the federal government will implement the Order, what impact, if any, enforcement of the Order may have on the amount or timing of receipt of federal funds or the City’s financial condition or what actions, if any the City might take in response to the Order or any action under it. State Aid: The City's State aid entitlement is based upon a number of different formulas, and while said formulas might indicate that a particular amount of State aid is owed, the amount of State aid actually paid is limited to the amount appropriated by the State Legislature. The State annually estimates State aid but actual payments may vary from the estimate. See "PROPERTY TAXATION--Tax Levy Computation" above. Motor Vehicle Excise: An excise is imposed on the registration of motor vehicles (subject to exemptions) at a uniform rate of $25 per $1,000 of valuation. The excise tax is collected by and for the benefit of the municipality in which the owner of the motor vehicle resides. Valuations are determined by a statutory formula based on manufacturer's list price and year of manufacture. Bills not paid when due bear interest at 12 per cent per annum. Provision is also made for the non-renewal of registration and operator’s license by the registrar of motor vehicles. In fiscal 2017, the City's motor vehicle excise receipts totaled $6,578,842. In fiscal 2018, the City's motor vehicle excise receipts totaled $6,641,141. In fiscal 2019, the City's motor vehicle excise receipts totaled $6,892,122. Water and Sewer Rates and Services: Beginning in fiscal 2006, the City’s water and sewer operations are fully self-supporting and accounted for in separate Water and Sewer Enterprise Funds. Effective July 1, 2019, water rates range between $3.19 and $6.83 per 100 cubic feet and sewer rates range between $7.79 and $11.99 per 100 cubic feet. The vast majority of account holders are billed tri-annually; larger users, including commercial and industrial buildings, are billed six (6) times per year. These rates are set annually by the Director of Water & Sewer and approved by the Mayor and City Council. Water and sewer rate revenues collected in fiscal year 2017 (including prior year commitments) were $35,195,245. Water and sewer rate revenues collected in fiscal year 2018 (including prior year commitments) were $36,251,370. Water and sewer rate revenues collected in fiscal year 2019 (including prior year commitments) were $37,661,969. Room Occupancy Tax: Under G.L. Chapter 64G, s. 3A local governments may tax the provision of hotel, motel and lodging house rooms at a rate not to exceed six percent (6%) of the cost of renting such rooms. The tax is paid by the operator of the hotel, motel or lodging house to the State Commissioner of Revenue, who in turn pays the tax back to the municipality in which the rooms are located. The City levied 4% as permitted under the law beginning in fiscal 2009. The City approved an additional 2% on August 27, 2009. Revenues totaled $847,900 in fiscal 2017, $888,186 in fiscal 2018 and $1,324,361 in fiscal 2019. Meals Tax: On August 27, 2009, the City approved a local meals tax of 0.75%. The tax is paid by the vendor to the State Commissioner of Revenue, who in turn pays the tax to the municipality in which the meal was sold. Revenues from this tax generated $1,870,348 in fiscal 2017, $1,954,864 in fiscal 2018 and $2,182,516 in fiscal year 2019. Other Revenues: Other major sources of General Fund revenues in fiscal 2017 included fees, fines and charges, $26,758,646 and interest income, $325,743. Other major sources of General Fund revenues in fiscal 2018 included fees, fines and charges, $28,866,584 and interest income, $925,494. Other major sources of General Fund revenues in fiscal 2019 included fees, fines and charges of $26,985,989 and interest income of $2,694,730.
45
State School Building Assistance Program Under its school building assistance program, the Commonwealth of Massachusetts provides grants to cities, towns and regional school districts for school construction projects. Until July 26, 2004, the State Board of Education was responsible for approving grants for school projects and otherwise administering the program. Grant amounts ranged from 50% to 90% of approved project costs. Municipalities generally issued bonds to finance the entire project cost, and the Commonwealth disbursed the grants in equal annual installments over the term of the related bonds. Pursuant to legislation which became effective on July 26, 2004, the state legislature created the Massachusetts School Building Authority (the “Authority”) to finance and administer the school building assistance program. The Authority has assumed all powers and obligations of the Board of Education with respect to the program. In addition to certain other amounts, the legislation dedicates a portion of Commonwealth sales tax receipts to the Authority to finance the program. Projects previously approved for grants by the State Board of Education are entitled to receive grant payments from the Authority based on the approved project cost and reimbursement rate applicable under the prior law. The Authority has paid and is expected to continue to pay the remaining amounts of the grants for such projects either in annual installments to reimburse debt service on bonds issued by the municipalities to finance such projects, or as lump sum payments to contribute to the defeasance of such bonds. Projects on the priority waiting list as of July 1, 2004 are also entitled to receive grant payments from the Authority based on the eligible project costs and reimbursement rates applicable under the prior law. With limited exceptions, the Authority is required to fund the grants for such projects in the order in which they appear on the waiting list. Grants for any such projects that have been completed or substantially completed have been paid and are expected to continue to be paid by the Authority in lump sum payments, thereby eliminating the need for the Authority to reimburse interest expenses that would otherwise be incurred by the municipalities to permanently finance the Authority’s share of such project costs. Interest on debt issued by municipalities prior to July 1, 2004 to finance such project costs, and interest on temporary debt until receipt of the grant, is included in the approved costs of such projects. Grants for any such projects that have not yet commenced or that are underway have been and are expected to continue to be paid by the Authority as project costs are incurred by the municipality pursuant to a project funding agreement between the Authority and the municipality, eliminating the need for the municipality to borrow even on a temporary basis to finance the Authority’s share of the project costs in most cases. The range of reimbursement rates for new project grant applications submitted to the Authority on or after July 1, 2007 has been reduced to between 40% and 80% of approved project costs. The Authority promulgated new regulations with respect to the application and approval process for projects submitted after July 1, 2007. The Authority expects to pay grants for such projects as project costs are incurred pursuant to project funding agreements between the Authority and the municipalities. None of the interest expense incurred on debt issued by municipalities to finance their portion of the costs of new projects will be included in the approved project costs eligible for reimbursement. Education Reform State legislation known as the Education Reform Act of 1993, as amended, imposes certain minimum expenditure requirements on municipalities with respect to funding for education and related programs, and may affect the level of state aid to be received for education. The requirements are determined on the basis of formulas affected by various measures of wealth and income, enrollments, prior levels of local spending and state aid, and other factors. Fiscal year appropriations by the City have exceeded the minimum required funding levels. Investment of City Funds Investments of funds of cities and towns, except for trust funds, are generally restricted by Massachusetts General Laws Chapter 44, §55. That statute permits investments of available revenue funds and bond and note proceeds in term deposits and certificates of deposits of banks and trust companies, in obligations issued or unconditionally guaranteed by the federal government or an agency thereof with a maturity of not more than one year, in repurchase agreements with a maturity of not more than 90 days secured by federal or federal agency securities, in participation units in the Massachusetts Municipal Depository Trust (“MMDT”), or in shares in SEC-registered money market funds with the highest possible rating from at least one nationally recognized rating organization. MMDT is an investment pool created by the Commonwealth. The State Treasurer is the sole trustee, and the funds are managed under contract by an investment firm under the supervision of the State Treasurer’s office. According to the State Treasurer the Trust’s investment policy is designed to maintain an average weighted maturity of 90 days or less and is limited to high-quality, readily marketable fixed income instruments, including U.S. Government obligations and highly-rated corporate securities with maturities of one year or less.
46
Trust funds, unless otherwise provided by the donor, may be invested in accordance with §54 of Chapter 44, which permits a broader range of investments than §55, including any bonds or notes that are legal investments for savings banks in the Commonwealth. The restrictions imposed by §§54 and 55 do not apply to city and town retirement systems. A breakdown of current investments may be obtained from the City Treasurer. Summary of Significant Accounting Policies of the City See Appendix A. Annual Audits The City's accounts were independently audited for the fiscal years ended June 30, 1995 through 2018 by Powers & Sullivan, Certified Public Accountants. The audit for fiscal 2018 is attached as Appendix A. The attached report speaks only as of its date, and only to the matters expressly set forth therein. The auditors have not been engaged to review this Official Statement or to perform audit procedures regarding the post-audit period, nor have the auditors been requested to give their consent to the inclusion of their report in Appendix A. Except as stated in their report, the auditors have not been engaged to verify the financial information set out in Appendix A and are not passing upon and do not assume responsibility for the sufficiency, accuracy or completeness of the financial information presented in that appendix. Financial Statements Set forth on the following pages for the City’s Governmental Funds are Balance Sheets for the fiscal years ended June 30, 2018, June 30, 2017 and June 30, 2016, and Statements of Revenues, Expenditures and Changes in Fund Balance for fiscal years ended June 30, 2014 through June 30, 2018. Also included for the City’s Proprietary Funds are Statements of Net Assets for the fiscal years ended June 30, 2018, June 30, 2017 and June 30, 2016 and Statements of Revenues, Expenditures and Changes in Fund Balance for fiscal years ended June 30, 2014 through June 30, 2018. All of these statements were extracted from the City's audited Financial Statements.

47
StrategicPlanning & Capital Nonmajor TotalCommunity Projects Bond Governmental Governmental
General Development Fund Funds FundsASSETS
Cash and cash equivalents $ 70,193,709 273,407$ 62,974,786$ 23,247,128$ 156,689,030$ Receivables, net of uncollectibles: Real estate and personal property taxes 1,656,202 - - - 1,656,202 Tax liens 818,578 - - 6,752 825,330 Community preservation fund surtax - - - 18,338 18,338 Motor vehicle excise taxes 725,685 - - - 725,685 Departmental and other 2,849,995 - - - 2,849,995 Intergovernmental 6,717,364 1,995,742 - 5,490,133 14,203,239 Community preservation state share - - - 233,552 233,552 Loans - 16,256,458 - 7,536,276 23,792,734 Due to other funds 2,163,092 - - - 2,163,092 TOTAL ASSETS 85,124,625$ 18,525,607$ 62,974,786$ 36,532,179$ 203,157,197$
LIABILITIES Warrants payable 4,776,899$ -$ 4,051,109$ 966,695$ 9,794,703$ Accrued payroll 1,657,252 8,937 650 252,763 1,919,602 Tax refunds payable 971,000 - 971,000 Due to other funds - - - 2,163,092 2,163,092 Other liabilities 1,324,760 - - - 1,324,760 Notes payable - - 89,958,702 - 89,958,702 TOTAL LIABILITIES 8,729,911 8,937 94,010,461 3,382,550 106,131,859
DEFERRED INFLOWS OF RESOURCES Unavailable Revenue 12,140,351 1,995,742 - 2,318,863 16,454,956
FUND BALANCESNonspendable - - - 433,126 433,126 Restricted - 16,520,928 - 30,397,640 46,918,568 Committed 38,756,437 - - - 38,756,437 Assigned 5,831,550 - - - 5,831,550 Unassigned 19,666,376 - (31,035,675) - (11,369,299) TOTAL FUND BALANCES 64,254,363 16,520,928 (31,035,675) 30,830,766 80,570,382 TOTAL LIABILITIES, DEFERRED INFLOWS OF RESOURCES, AND FUND BALANCES 85,124,625$ 18,525,607$ 62,974,786$ 36,532,179$ 203,157,197$ _____________________
(1) Extracted from audited financial statements of the City.
CITY OF SOMERVILLE, MASSACHUSETTSGOVERNMENTAL FUNDS
BALANCE SHEET JUNE 30, 2018 (1)

48
StrategicPlanning & Capital Nonmajor TotalCommunity Projects Bond Governmental Governmental
General Development Fund Funds FundsASSETS
Cash and cash equivalents $ 67,674,601 -$ 27,658,970$ 22,514,056$ 117,847,627$ Receivables, net of uncollectibles: Real estate and personal property taxes 1,795,183 - - - 1,795,183 Tax liens 851,508 - - - 851,508 Motor vehicle excise taxes 176,902 - - - 176,902 Departmental and other 3,061,585 - - 26,172 3,087,757 Intergovernmental 8,498,625 1,148,368 - 3,890,770 13,537,763 Loans - 15,335,829 - 2,989,584 18,325,413 Due to other funds - - - 1,371,806 1,371,806 TOTAL ASSETS 82,058,404$ 16,484,197$ 27,658,970$ 30,792,388$ 156,993,959$
LIABILITIES AND FUND BALANCES Warrants payable $ 3,832,741 -$ -$ 121,127$ 3,953,868$ Accrued payroll 1,585,313 13,343 652 258,029 1,857,337 Tax refunds payable 862,000 - - - 862,000 Payroll withholdings 1,033,916 - - - 1,033,916 Abandoned property 374,997 - - - 374,997 Due to other funds - 1,057,482 - 314,324 1,371,806 Notes payable - - 39,043,332 - 39,043,332 TOTAL LIABILITIES 7,688,967 1,070,825 39,043,984 693,480 48,497,256
DEFERRED INFLOWS OF RESOURCES Unavailable Revenue 13,733,570 1,148,368 - 3,602,618 18,484,556
FUND BALANCESNonspendable - - - 433,126 433,126 Restricted - 14,265,004 - 26,063,164 40,328,168 Committed 34,533,997 - - - 34,533,997 Assigned 5,907,817 - - - 5,907,817 Unassigned 20,194,053 - (11,385,014) - 8,809,039 TOTAL FUND BALANCES 60,635,867 14,265,004 (11,385,014) 26,496,290 90,012,147 TOTAL LIABILITIES AND FUND BALANCES 82,058,404$ 16,484,197$ 27,658,970$ 30,792,388$ 156,993,959$ _____________________
(1) Extracted from audited financial statements of the City.
CITY OF SOMERVILLE, MASSACHUSETTSGOVERNMENTAL FUNDS
BALANCE SHEET JUNE 30, 2017 (1)

49
StrategicPlanning & Capital Nonmajor TotalCommunity Projects Bond Governmental Governmental
General Development Fund Funds FundsASSETS
Cash and cash equivalents 61,665,038$ 1,616,994$ 11,338,746$ 21,648,696$ 96,269,474$ Receivables, net of uncollectibles: Real estate and personal property taxes 1,096,313 - - - 1,096,313 Tax liens 1,061,267 - - - 1,061,267 Motor vehicle excise taxes 157,895 - - - 157,895 Departmental and other 3,168,590 - - 18,877 3,187,467 Intergovernmental 10,829,874 4,989,292 - 3,870,704 19,689,870 Loans - 12,923,548 - 1,634,380 14,557,928 TOTAL ASSETS 77,978,977$ 19,529,834$ 11,338,746$ 27,172,657$ 136,020,214$
LIABILITIES AND FUND BALANCES Warrants payable 3,255,334$ 702,183$ 203,752$ 13,469$ 4,174,738$ Accrued payroll 2,360,827 24,305 1,665 205,894 2,592,691 Tax refunds payable 1,278,000 - - - 1,278,000 Payroll withholdings 664,328 - - - 664,328 Abandoned property 27,736 - - - 27,736 Notes payable - - 26,029,000 - 26,029,000 TOTAL LIABILITIES 7,586,225 726,488 26,234,417 219,363 34,766,493
DEFERRED INFLOWS OF RESOURCES Unavailable Revenue 15,707,863 4,989,292 - 3,889,581 24,586,736
FUND BALANCESNonspendable - - - 433,126 433,126 Restricted - 13,814,054 - 22,630,587 36,444,641 Committed 33,354,136 - - - 33,354,136 Assigned 5,823,265 - - - 5,823,265 Unassigned 15,507,488 - (14,895,671) - 611,817 TOTAL FUND BALANCES 54,684,889 13,814,054 (14,895,671) 23,063,713 76,666,985 TOTAL LIABILITIES AND FUND BALANCES 77,978,977$ 19,529,834$ 11,338,746$ 27,172,657$ 136,020,214$ _____________________
(1) Extracted from audited financial statements of the City.
CITY OF SOMERVILLE, MASSACHUSETTSGOVERNMENTAL FUNDS
BALANCE SHEET JUNE 30, 2016 (1)

50
CITY OF SOMERVILLE, MASSACHUSETTSGOVERNMENTAL FUNDS
STATEMENT OF REVENUES, EXPENDITURESAND CHANGES IN FUND BALANCEFiscal Year Ended June 30, 2018 (1)
StrategicPlanning & Capital Nonmajor TotalCommunity Projects Governmental Governmental
REVENUES: General Development Funds Funds Funds
Real Estate and Personal Property Taxes net of Tax Refunds 142,059,305$ -$ -$ -$ 142,059,305$ Tax liens 192,533 - - - 192,533 Motor Vehicle and Other Excise Taxes 9,484,191 - - - 9,484,191 Penalties and interest on taxes 869,868 - - - 869,868 Payments in Lieu of Taxes 1,327,790 - - - 1,327,790 Intergovernmental - Teachers Retirement 15,799,215 - - - 15,799,215 Intergovernmental 49,452,074 6,771,912 12,099,480 19,480,474 87,803,940 Departmental and Other 25,592,325 - - 8,299,089 33,891,414 Community Preservation Taxes - - - 1,794,508 1,794,508 Community Preservation State Match - - - 370,465 370,465 Contributions and Donations 338,636 - - 305,481 644,117 Investment Income 1,345,247 11,067 - 58,917 1,415,231 Miscellaneous 537,703 - - - 537,703 Total Revenues 246,998,887$ 6,782,979$ 12,099,480$ 30,308,934$ 296,190,280$
EXPENDITURES:
Current: General Government 21,580,283$ -$ 14,436,468$ 4,034,921$ 40,051,672$ Public Safety 39,410,678 - 689,719 937,433 41,037,830 Education 68,799,420 - 20,296,626 13,834,507 102,930,553 Public Works 26,890,369 - 3,233,014 2,335,647 32,459,030 Community Development - 4,556,946 - - 4,556,946 Health and Human Services - - - 276,304 276,304 Culture and Recreation 3,749,817 - 3,525,050 250,538 7,525,405 Community Preservation - - - 5,061,851 5,061,851 Pension Benefits 13,943,033 - - - 13,943,033 Pension Benefits - Teachers Retirement 15,799,215 - - - 15,799,215 Employee Benefits 30,438,102 - - - 30,438,102 State and County Charges 13,634,548 - - - 13,634,548 Debt Service Principal 5,011,623 - - - 5,011,623 Principal payment on current refunding 2,090,000 - - - 2,090,000 Interest 4,112,187 - - - 4,112,187 Total Expenditures 245,459,275$ 4,556,946$ 42,180,877$ 26,731,201$ 318,928,299$
Excess (Deficiency) of Revenues Over Expenditures 1,539,612$ 2,226,033$ (30,081,397)$ 3,577,733$ (22,738,019)$
OTHER FINANCING SOURCES:
Issuance of Bonds -$ -$ 10,143,102$ -$ 10,143,102$ Issuance of Refunding Bonds 7,810,975 - - - 7,810,975 Premium from Issuance of Bonds - - 273,998 1,845,411 2,119,409 Premium from Issuance of Refunding Bonds 578,540 - - - 578,540 Payments to Refunded Bond Escrow Agent (8,448,080) - - - (8,448,080) Proceeds from the Sale of Capital Assets 3,911 - - - 3,911 Transfers in 3,934,577 29,891 20,055 1,572,148 5,556,671 Transfers out (1,801,039) - (6,419) (2,660,816) (4,468,274) Total Other Financing Sources 2,078,884 29,891 10,430,736 756,743 13,296,254 Net Change in Fund Balances 3,618,496 2,255,924 (19,650,661) 4,334,476 (9,441,765) FUND BALANCES AT BEGINNING OF YEAR 60,635,867 14,265,004 (11,385,014) 26,496,290 90,012,147 FUND BALANCES AT END OF YEAR 64,254,363$ 16,520,928$ (31,035,675)$ 30,830,766$ 80,570,382$ _____________________(1) Extracted from audited financial statements of the City.

51
CITY OF SOMERVILLE, MASSACHUSETTSGOVERNMENTAL FUNDS
STATEMENT OF REVENUES, EXPENDITURESAND CHANGES IN FUND BALANCEFiscal Year Ended June 30, 2017 (1)
StrategicPlanning & Capital Nonmajor TotalCommunity Projects Governmental Governmental
REVENUES: General Development Funds Funds Funds
Real Estate and Personal Property Taxes net of Tax Refunds 134,759,721$ -$ -$ -$ 134,759,721$ Tax liens 392,962 - - - 392,962 Motor Vehicle and Other Excise Taxes 9,297,090 - - - 9,297,090 Payments in Lieu of Taxes 1,248,682 - - - 1,248,682 Intergovernmental 65,262,079 10,138,587 803,627 15,057,356 91,261,649 Departmental and Other 20,835,081 - 404,376 7,999,205 29,238,662 Community Preservation Taxes - - - 2,085,496 2,085,496 Contributions 380,501 - - 240,887 621,388 Investment Income 457,948 8,383 - 34,579 500,910 Miscellaneous 134,582 - - - 134,582 Total Revenues 232,768,646$ 10,146,970$ 1,208,003$ 25,417,523$ 269,541,142$
EXPENDITURES:
Current: General Government 19,167,204$ -$ 2,265,584$ 2,423,943$ 23,856,731$ Public Safety 40,492,885 - - 757,248 41,250,133 Education 65,062,143 - 3,313,819 14,070,437 82,446,399 Public Works 24,698,789 - 1,937,858 1,849,197 28,485,844 Community Development - 9,696,020 - - 9,696,020 Human Services - - - 244,417 244,417 Culture and Recreation 3,057,850 - 4,331,985 207,596 7,597,431 Pension Benefits 28,429,418 - - - 28,429,418 Employee Benefits 24,274,992 - - - 24,274,992 Claims and Judgements 53,800 - - - 53,800 Community Preservation - - - 2,314,179 2,314,179 State and County Charges 13,532,201 - - - 13,532,201 Debt Service Principal 7,455,123 - - - 7,455,123 Interest 3,639,566 - - - 3,639,566 Total Expenditures 229,863,971$ 9,696,020$ 11,849,246$ 21,867,017$ 273,276,254$
Excess (Deficiency) of Revenues Over Expenditures 2,904,675$ 450,950$ (10,641,243)$ 3,550,506$ (3,735,112)$
OTHER FINANCING SOURCES:
Issuance of debt -$ -$ 12,335,000$ -$ 12,335,000$ Premium form issuance of bonds 952,000 - 1,419,349 598,829 2,970,178 Sale of capital assets - - - 2,120,152 2,120,152 Transfers in 4,631,838 - 397,551 507,531 5,536,920 Transfers out (2,537,535) - - (3,344,441) (5,881,976) Total Other Financing Sources 3,046,303 - 14,151,900 (117,929) 17,080,274 Net Change in Fund Balances 5,950,978 450,950 3,510,657 3,432,577 13,345,162 FUND BALANCES AT BEGINNING OF YEAR 54,684,889 13,814,054 (14,895,671) 23,063,713 76,666,985 FUND BALANCES AT END OF YEAR 60,635,867$ 14,265,004$ (11,385,014)$ 26,496,290$ 90,012,147$ _____________________(1) Extracted from audited financial statements of the City.
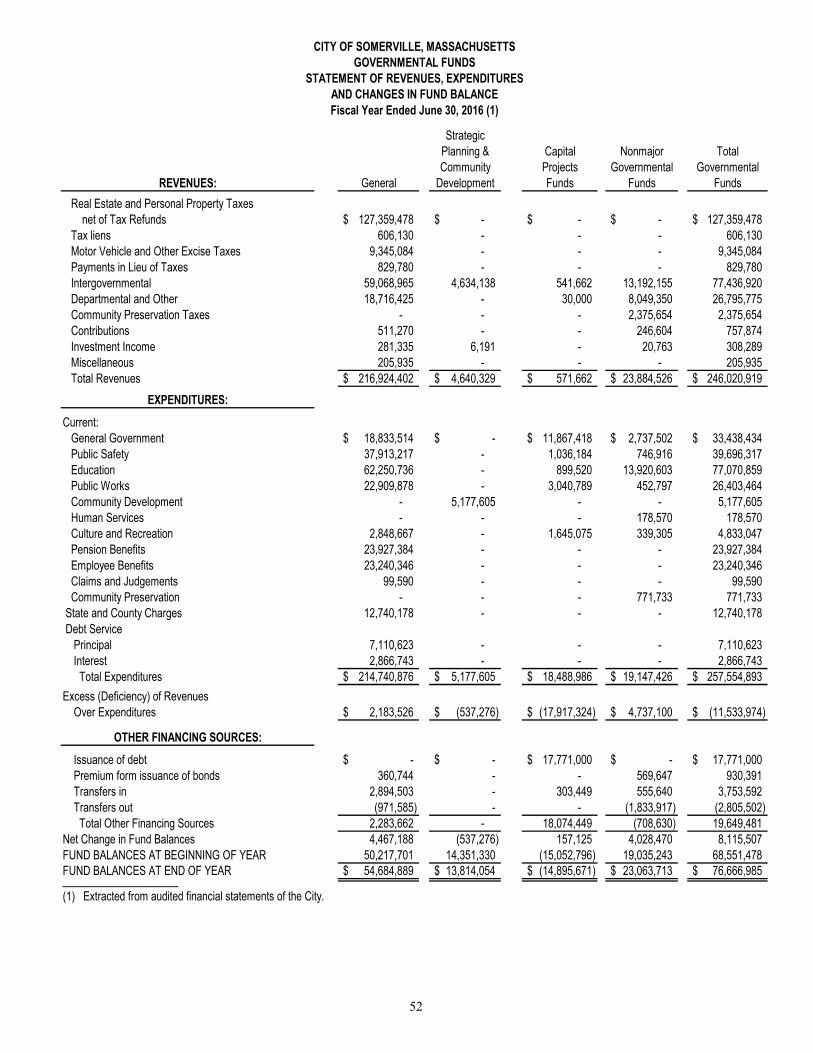
52
CITY OF SOMERVILLE, MASSACHUSETTSGOVERNMENTAL FUNDS
STATEMENT OF REVENUES, EXPENDITURESAND CHANGES IN FUND BALANCEFiscal Year Ended June 30, 2016 (1)
StrategicPlanning & Capital Nonmajor TotalCommunity Projects Governmental Governmental
REVENUES: General Development Funds Funds Funds
Real Estate and Personal Property Taxes net of Tax Refunds 127,359,478$ -$ -$ -$ 127,359,478$ Tax liens 606,130 - - - 606,130 Motor Vehicle and Other Excise Taxes 9,345,084 - - - 9,345,084 Payments in Lieu of Taxes 829,780 - - - 829,780 Intergovernmental 59,068,965 4,634,138 541,662 13,192,155 77,436,920 Departmental and Other 18,716,425 - 30,000 8,049,350 26,795,775 Community Preservation Taxes - - - 2,375,654 2,375,654 Contributions 511,270 - - 246,604 757,874 Investment Income 281,335 6,191 - 20,763 308,289 Miscellaneous 205,935 - - - 205,935 Total Revenues 216,924,402$ 4,640,329$ 571,662$ 23,884,526$ 246,020,919$
EXPENDITURES:
Current: General Government 18,833,514$ -$ 11,867,418$ 2,737,502$ 33,438,434$ Public Safety 37,913,217 - 1,036,184 746,916 39,696,317 Education 62,250,736 - 899,520 13,920,603 77,070,859 Public Works 22,909,878 - 3,040,789 452,797 26,403,464 Community Development - 5,177,605 - - 5,177,605 Human Services - - - 178,570 178,570 Culture and Recreation 2,848,667 - 1,645,075 339,305 4,833,047 Pension Benefits 23,927,384 - - - 23,927,384 Employee Benefits 23,240,346 - - - 23,240,346 Claims and Judgements 99,590 - - - 99,590 Community Preservation - - - 771,733 771,733 State and County Charges 12,740,178 - - - 12,740,178 Debt Service Principal 7,110,623 - - - 7,110,623 Interest 2,866,743 - - - 2,866,743 Total Expenditures 214,740,876$ 5,177,605$ 18,488,986$ 19,147,426$ 257,554,893$
Excess (Deficiency) of Revenues Over Expenditures 2,183,526$ (537,276)$ (17,917,324)$ 4,737,100$ (11,533,974)$
OTHER FINANCING SOURCES:
Issuance of debt -$ -$ 17,771,000$ -$ 17,771,000$ Premium form issuance of bonds 360,744 - - 569,647 930,391 Transfers in 2,894,503 - 303,449 555,640 3,753,592 Transfers out (971,585) - - (1,833,917) (2,805,502) Total Other Financing Sources 2,283,662 - 18,074,449 (708,630) 19,649,481 Net Change in Fund Balances 4,467,188 (537,276) 157,125 4,028,470 8,115,507 FUND BALANCES AT BEGINNING OF YEAR 50,217,701 14,351,330 (15,052,796) 19,035,243 68,551,478 FUND BALANCES AT END OF YEAR 54,684,889$ 13,814,054$ (14,895,671)$ 23,063,713$ 76,666,985$ _____________________(1) Extracted from audited financial statements of the City.

53
CITY OF SOMERVILLE, MASSACHUSETTSGOVERNMENTAL FUNDS
STATEMENT OF REVENUES, EXPENDITURESAND CHANGES IN FUND BALANCEFiscal Year Ended June 30, 2015 (1)
StrategicPlanning & Capital Nonmajor TotalCommunity Projects Governmental Governmental
REVENUES: General Development Funds Funds Funds
Real Estate and Personal Property Taxes net of Tax Refunds 120,742,247$ -$ -$ -$ 120,742,247$ Tax liens 654,405 - - - 654,405 Motor Vehicle and Other Excise Taxes 8,596,756 - - - 8,596,756 Payments in Lieu of Taxes 304,688 - - - 304,688 Intergovernmental 55,722,697 6,215,918 - 13,073,509 75,012,124 Departmental and Other 24,624,066 - - 6,690,026 31,314,092 Community Preservation Taxes - - - 2,335,638 2,335,638 Contributions 644,445 - - 2,399,995 3,044,440 Investment Income 277,779 2,726 - 11,707 292,212 Miscellaneous 113,209 - - - 113,209 Total Revenues 211,680,292$ 6,218,644$ -$ 24,510,875$ 242,409,811$
EXPENDITURES:
Current: General Government 16,261,576$ -$ 3,662,789$ 2,522,835$ 22,447,200$ Public Safety 37,471,917 - 2,391,797 703,993 40,567,707 Education 59,090,888 - 2,903,126 12,800,325 74,794,339 Public Works 27,844,533 - 2,791,301 2,470,716 33,106,550 Community Development - 6,731,292 - - 6,731,292 Human Services - - - 229,633 229,633 Culture and Recreation 2,630,531 - 768,591 257,900 3,657,022 Pension Benefits 19,710,963 - - - 19,710,963 Employee Benefits 23,167,986 - - - 23,167,986 Claims and Judgements 237,987 - - - 237,987 Community Preservation - - - 77,672 77,672 State and County Charges 12,569,633 - - - 12,569,633 Debt Service Principal 7,968,384 - - - 7,968,384 Interest 3,016,183 - - - 3,016,183 Total Expenditures 209,970,581$ 6,731,292$ 12,517,604$ 19,063,074$ 248,282,551$
Excess (Deficiency) of Revenues Over Expenditures 1,709,711$ (512,648)$ (12,517,604)$ 5,447,801$ (5,872,740)$
OTHER FINANCING SOURCES:
Issuance of debt -$ -$ 8,603,000$ -$ 8,603,000$ Transfers in 3,510,179 118,060 - 1,200,000 4,828,239 Transfers out (1,537,436) - - (2,404,797) (3,942,233) Total Other Financing Sources 1,972,743 118,060 8,603,000 (1,204,797) 9,489,006 Net Change in Fund Balances 3,682,454 (394,588) (3,914,604) 4,243,004 3,616,266 FUND BALANCES AT BEGINNING OF YEAR 46,535,247 14,745,918 (11,138,192) 14,792,239 64,935,212 FUND BALANCES AT END OF YEAR 50,217,701$ 14,351,330$ (15,052,796)$ 19,035,243$ 68,551,478$ _____________________(1) Extracted from audited financial statements of the City.
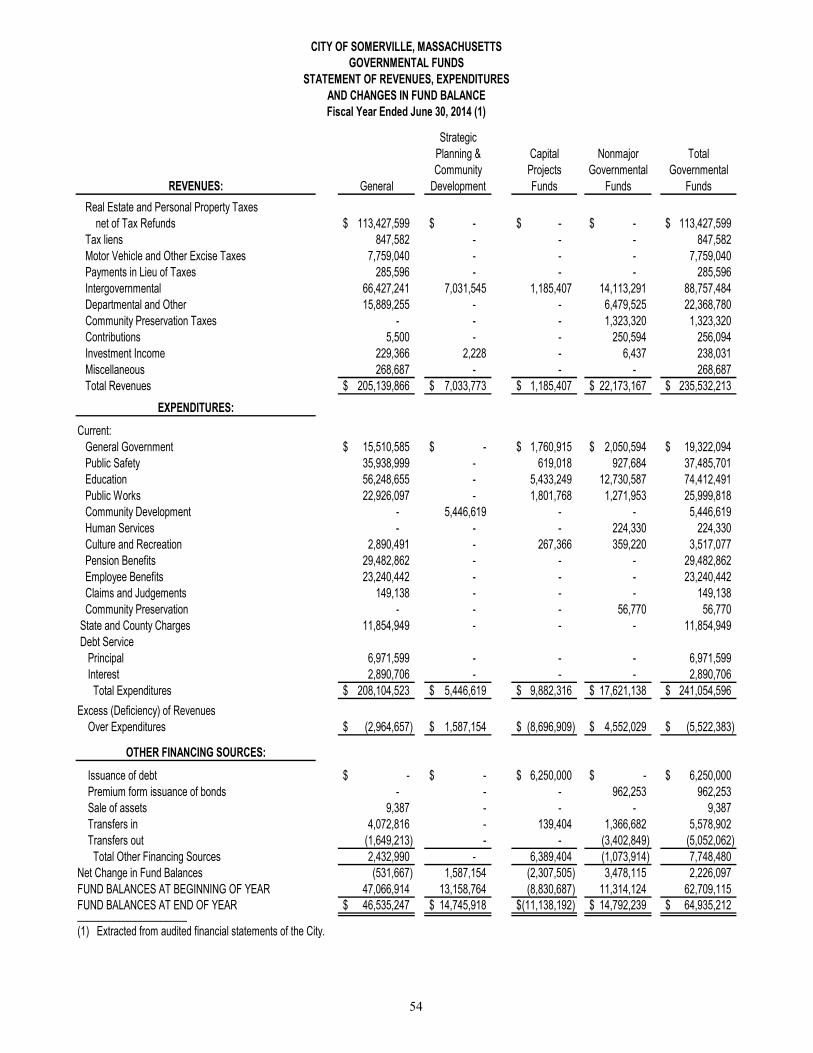
54
CITY OF SOMERVILLE, MASSACHUSETTSGOVERNMENTAL FUNDS
STATEMENT OF REVENUES, EXPENDITURESAND CHANGES IN FUND BALANCEFiscal Year Ended June 30, 2014 (1)
StrategicPlanning & Capital Nonmajor TotalCommunity Projects Governmental Governmental
REVENUES: General Development Funds Funds Funds
Real Estate and Personal Property Taxes net of Tax Refunds 113,427,599$ -$ -$ -$ 113,427,599$ Tax liens 847,582 - - - 847,582 Motor Vehicle and Other Excise Taxes 7,759,040 - - - 7,759,040 Payments in Lieu of Taxes 285,596 - - - 285,596 Intergovernmental 66,427,241 7,031,545 1,185,407 14,113,291 88,757,484 Departmental and Other 15,889,255 - - 6,479,525 22,368,780 Community Preservation Taxes - - - 1,323,320 1,323,320 Contributions 5,500 - - 250,594 256,094 Investment Income 229,366 2,228 - 6,437 238,031 Miscellaneous 268,687 - - - 268,687 Total Revenues 205,139,866$ 7,033,773$ 1,185,407$ 22,173,167$ 235,532,213$
EXPENDITURES:
Current: General Government 15,510,585$ -$ 1,760,915$ 2,050,594$ 19,322,094$ Public Safety 35,938,999 - 619,018 927,684 37,485,701 Education 56,248,655 - 5,433,249 12,730,587 74,412,491 Public Works 22,926,097 - 1,801,768 1,271,953 25,999,818 Community Development - 5,446,619 - - 5,446,619 Human Services - - - 224,330 224,330 Culture and Recreation 2,890,491 - 267,366 359,220 3,517,077 Pension Benefits 29,482,862 - - - 29,482,862 Employee Benefits 23,240,442 - - - 23,240,442 Claims and Judgements 149,138 - - - 149,138 Community Preservation - - - 56,770 56,770 State and County Charges 11,854,949 - - - 11,854,949 Debt Service Principal 6,971,599 - - - 6,971,599 Interest 2,890,706 - - - 2,890,706 Total Expenditures 208,104,523$ 5,446,619$ 9,882,316$ 17,621,138$ 241,054,596$
Excess (Deficiency) of Revenues Over Expenditures (2,964,657)$ 1,587,154$ (8,696,909)$ 4,552,029$ (5,522,383)$
OTHER FINANCING SOURCES:
Issuance of debt -$ -$ 6,250,000$ -$ 6,250,000$ Premium form issuance of bonds - - - 962,253 962,253 Sale of assets 9,387 - - - 9,387 Transfers in 4,072,816 - 139,404 1,366,682 5,578,902 Transfers out (1,649,213) - - (3,402,849) (5,052,062) Total Other Financing Sources 2,432,990 - 6,389,404 (1,073,914) 7,748,480 Net Change in Fund Balances (531,667) 1,587,154 (2,307,505) 3,478,115 2,226,097 FUND BALANCES AT BEGINNING OF YEAR 47,066,914 13,158,764 (8,830,687) 11,314,124 62,709,115 FUND BALANCES AT END OF YEAR 46,535,247$ 14,745,918$ (11,138,192)$ 14,792,239$ 64,935,212$ _____________________(1) Extracted from audited financial statements of the City.

55
PROPRIETARY FUNDSStatement of Net Assets
June 30, 2018 (1)
VeteransMemorial Dilboy
Water Sewer Ice Rank Stadium Total
ASSETSCURRENT:
Cash and cash equivalents 14,150,843$ 27,542,728$ 104,409$ 276,536.00$ 42,074,516$ Receivables, net of allowance for uncollectibles:
User charges 4,279,445 7,430,559 - - 11,710,004
TOTAL CURRENT ASSETS 18,430,288 34,973,287 104,409 276,536 53,784,520
NONCURRENTCapital assets, non depreciable 393,486 2,106,846 - - 2,500,332 Capital assets, net of accumulated depreciation 32,866,239 23,517,257 2,963,494 - 59,346,990
TOTAL NONCURRENT ASSETS 33,259,725 25,624,103 2,963,494 - 61,847,322
TOTAL ASSETS 51,690,013$ 60,597,390$ 3,067,903$ 276,536$ 115,631,842$
DEFERRED OUTFLOWS OF RESOURCESDeferred loss on refunding 62,149$ 10,804$ -$ -$ 72,953 Deferred outflows related to pensions 120,123 80,478 - - 200,601 Deferred outflows related to other post employment benefits 308 93 - - 401
TOTAL DEFERRED OUTFLOWS OF RESOURCES 182,580 91,375 - - 273,955
LIABILITIESCURRENT
Warrants payable 191,007 630,153 213 - 821,373 Accrued payroll 17,909 14,706 1,369 2,897 36,881 Accrued interest 31,841 13,886 19,838 - 65,565 Compensated absences 1,400 200 - - 1,600 Notes payable 8,732,500 21,194,500 - - 29,927,000 Bonds payable 1,194,832 375,851 200,000 0 1,770,683
Total current liabilities 10,169,489 22,229,296 221,420 2,897 32,623,102
NONCURRENTCompensated absences 36,700 30,800 - - 67,500 Net pension liability 881,359 590,479 - - 1,471,838 Net other postemployment benefits liability 1,423,747 429,810 - - 1,853,557 Bonds payable 4,354,861 1,433,300 1,710,000 - 7,498,161
Total noncurrent liabilities 6,696,667 2,484,389 1,710,000 - 10,891,056 TOTAL LIABILITIES 16,866,156 24,713,685 1,931,420 2,897 43,514,158
DEFERRED INFLOWS OF RESOURCESDeferred inflows related to pensions 148,822 99,705 - - 248,527 Deferred inflows related to other postemployment benefits 171,212 51,687 - - 222,899
TOTAL DEFERRED INFLOWS OF RESOURCES 320,034 151,392 - - 471,426
NET POSITIONNet investment in capital assets 25,465,446 19,116,535 1,053,494 - 45,635,475 Unrestricted 9,220,957 16,707,153 82,989 273,639 26,284,738
TOTAL NET POSITION 34,686,403$ 35,823,688$ 1,136,483$ 273,639$ 71,920,213$ ____________(1) Extracted from audited financial statements of the City.
Business-Type Activities - Enterprise Funds
CITY OF SOMERVILLE, MASSACHUSETTS

56
PROPRIETARY FUNDSStatement of Net Assets
June 30, 2017 (1)
VeteransMemorial Dilboy
Water Sewer Ice Rank Stadium Total
ASSETSCURRENT:
Cash and cash equivalents 9,853,049$ 11,150,440$ 96,554$ 188,353.00$ 21,288,396$ Receivables, net of allowance for uncollectibles:
User fees 4,252,054 7,165,147 - - 11,417,201
TOTAL CURRENT ASSETS 14,105,103 18,315,587 96,554 188,353 32,705,597
NONCURRENTOther postemployment benefits asset - 297,281 - - 297,281 Capital assets, non depreciable - 22,244 - - Capital assets, net of accumulated depreciation 31,394,277 21,986,873 3,049,392 - 56,430,542
TOTAL NONCURRENT ASSETS 31,394,277 22,306,398 3,049,392 - 56,727,823
TOTAL ASSETS 45,499,380$ 40,621,985$ 3,145,946$ 188,353$ 89,455,664$
DEFERRED OUTFLOWS OF RESOURCESDeferred outflows related to pensions 198,764$ 79,666$ -$ -$ 278,430$
LIABILITIESCURRENT
Warrants payable 20,230 137,107 29 - 157,366 Accrued payroll 27,326 12,991 3,475 3,176 46,968 Accrued interest 26,338 17,504 21,788 - 65,630 Compensated absences 1,600 100 - - 1,700 Notes payable 3,800,000 5,200,000 - - 9,000,000 Bonds payable 1,302,739 305,051 195,000 0 1,802,790
Total current liabilities 5,178,233 5,672,753.00 220,292.00 3,176 11,074,454
NONCURRENTCompensated absences 47,100 14,700 - - 61,800 Other post-employment benefits 383,554 - - - 383,554 Net pension liability 1,218,198 488,265 - - 1,706,463 Bonds payable 5,062,870 1,175,051 1,910,000 - 8,147,921
Total noncurrent liabilities 6,711,722 1,678,016 1,910,000 - 10,299,738
TOTAL LIABILITIES 11,889,955 7,350,769 2,130,292 3,176 21,374,192
DEFERRED INFLOWS OF RESOURCESDeferred inflows related to pensions 20,740 8,313 - - 29,053
NET POSITIONNet investment in capital assets 25,192,328 19,944,722 944,392 - 46,081,442 Unrestricted 8,595,121 13,397,847 71,262 185,177 22,249,407
TOTAL NET ASSETS 33,787,449$ 33,342,569$ 1,015,654$ 185,177$ 68,330,849$ ____________(1) Extracted from audited financial statements of the City.
Business-Type Activities - Enterprise Funds
CITY OF SOMERVILLE, MASSACHUSETTS

57
PROPRIETARY FUNDSStatement of Net Assets
June 30, 2016 (1)
VeteransMemorial Dilboy
Water Sewer Ice Rank Stadium Total
ASSETSCURRENT:
Cash and cash equivalents 4,714,911$ 7,325,926$ 96,357$ 145,693.00$ 12,282,887$ Receivables, net of allowance for uncollectibles:
User fees 4,227,587 6,653,732 - - 10,881,319
TOTAL CURRENT ASSETS 8,942,498 13,979,658 96,357 145,693 23,164,206
NONCURRENTCapital assets, non depreciable 116,945 274,824 - - 391,769Capital assets, net of accumulated depreciation 30,698,200 18,844,487 3,135,290.00 - 52,677,977
TOTAL NONCURRENT ASSETS 30,815,145 19,119,311 3,135,290 - 53,069,746
TOTAL ASSETS 39,757,643$ 33,098,969$ 3,231,647$ 145,693$ 76,233,952$
DEFERRED OUTFLOWS OF RESOURCESDeferred outflows related to pensions 136,664$ 48,565$ -$ -$ 185,229$
LIABILITIESCURRENT
Warrants payable 178,692 419,197 4,077 1,599 603,565 Accrued payroll 36,869 11,885 5,806 4,238 58,798 Accrued interest 32,618 19,551 23,175 - 75,344 Compensated absences 2,000 1,100 - - 3,100 Notes payable 500,000 700,000 - - 1,200,000 Bonds payable 1,388,045 630,338 185,000 0 2,203,383
Total current liabilities 2,138,224 1,782,071.00 218,058.00 5,837 4,144,190
NONCURRENTCompensated absences 49,100 23,400 - - 72,500 Other post-employment benefits 822,507 183,690 - - 1,006,197 Net pension liability 1,017,401 361,547 - - Bonds payable 4,705,606 1,480,105 2,105,000 - 8,290,711
Total noncurrent liabilities 6,594,614 2,048,742 2,105,000 - 9,369,408
TOTAL LIABILITIES 8,732,838 3,830,813 2,323,058 5,837 13,513,598
DEFERRED INFLOWS OF RESOURCESDeferred inflows related to pensions 370 131 - - 501
NET ASSETSNet investment in capital assets 25,030,183 17,935,309 845,290 - 43,810,782 Unrestricted 6,130,916 11,381,281 63,299 139,856 17,715,352
TOTAL NET ASSETS 31,161,099$ 29,316,590$ 908,589$ 139,856$ 61,526,134$ ____________(1) Extracted from audited financial statements of the City.
Business-Type Activities - Enterprise Funds
CITY OF SOMERVILLE, MASSACHUSETTS

58
CITY OF SOMERVILLE, MASSACHUSETTS
PROPRIETARY FUNDS
Statement of Revenues, Expenses and Changes in Fund Net Assets
Fiscal Year Ended June 30, 2018 (1)
VeteransMemorial Dilboy
Water Sewer Ice Rink Stadium Total
OPERATING REVENUES:Charges for services 13,557,291$ 21,513,572$ 634,804$ 232,101$ 35,937,768$ Liens - charges for services 470,429 882,472 - - 1,352,901
Total Operating Revenues 14,027,720 22,396,044 634,804 232,101 37,290,669
OPERATING EXPENSES:Cost of services and administration 10,083,312 18,011,863 546,105 143,967 28,785,247 Depreciation 1,260,686 544,040 85,898 - 1,890,624
Total Operating Expenses 11,343,998 18,555,903 632,003 143,967 30,675,871
OPERATING INCOME (LOSS) 2,683,722 3,840,141 2,801 88,134 6,614,798
NONOPERATING REVENUES (EXPENSES):Investment income 138,502 131,767 328 328 270,925 Interest expense (73,360) (54,254) (81,300) - (208,914)
TOTAL NONOPERATING - REVENUES (EXPENSES), NET 65,142 77,513 (80,972) 328 62,011
INCOME (LOSS) BEFORE TRANSFERS 2,748,864 3,917,654 (78,171) 88,462 6,676,809
TRANSFERS:Transfers in - - 199,000 - 199,000 Transfers out (631,696) (655,701) - - (1,287,397) Total Operating Transfers (631,696) (655,701) 199,000 - (1,088,397)
Change in Net Position 2,117,168 3,261,953 120,829 88,462 5,588,412
NET POSITION AT BEGINNING OF YEAR 32,569,235 32,561,735 1,015,654 185,177 66,331,801
NET POSITION AT END OF YEAR 34,686,403$ 35,823,688$ 1,136,483$ 273,639$ 71,920,213$
____________(1) Extracted from audited financial statements of the City.
Business-Type Activities-Enterprise Funds
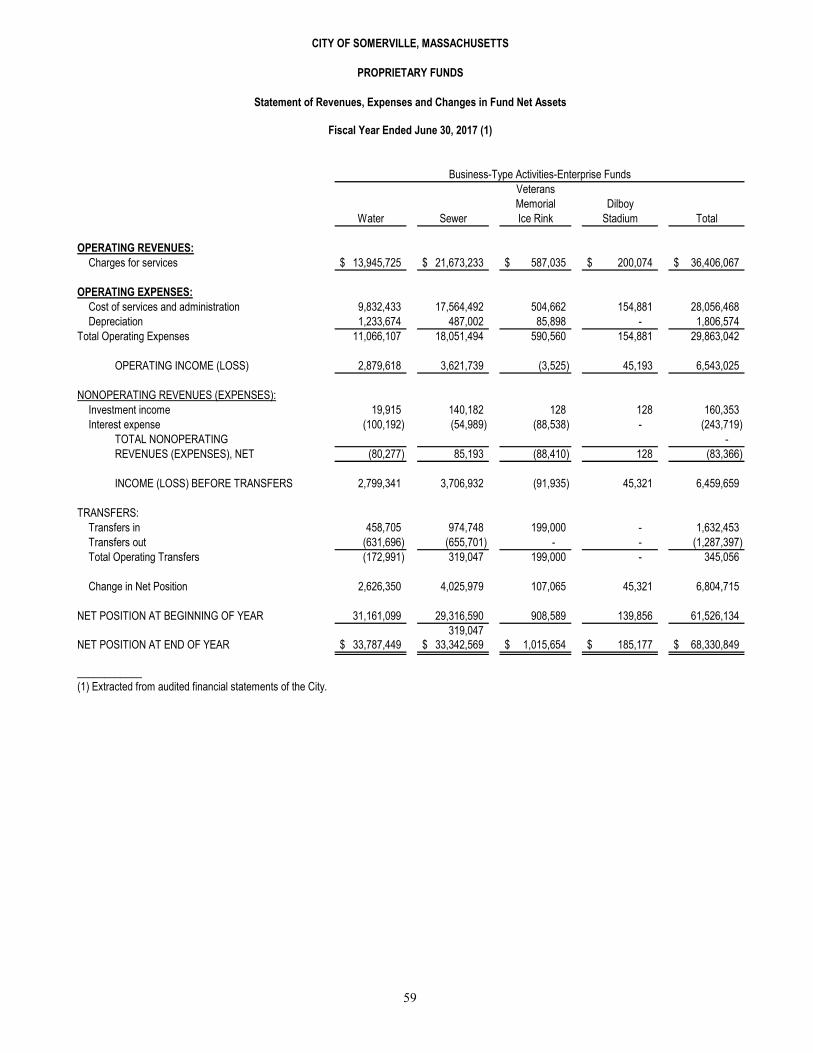
59
CITY OF SOMERVILLE, MASSACHUSETTS
PROPRIETARY FUNDS
Statement of Revenues, Expenses and Changes in Fund Net Assets
Fiscal Year Ended June 30, 2017 (1)
VeteransMemorial Dilboy
Water Sewer Ice Rink Stadium Total
OPERATING REVENUES:Charges for services 13,945,725$ 21,673,233$ 587,035$ 200,074$ 36,406,067$
OPERATING EXPENSES:Cost of services and administration 9,832,433 17,564,492 504,662 154,881 28,056,468 Depreciation 1,233,674 487,002 85,898 - 1,806,574
Total Operating Expenses 11,066,107 18,051,494 590,560 154,881 29,863,042
OPERATING INCOME (LOSS) 2,879,618 3,621,739 (3,525) 45,193 6,543,025
NONOPERATING REVENUES (EXPENSES):Investment income 19,915 140,182 128 128 160,353 Interest expense (100,192) (54,989) (88,538) - (243,719)
TOTAL NONOPERATING - REVENUES (EXPENSES), NET (80,277) 85,193 (88,410) 128 (83,366)
INCOME (LOSS) BEFORE TRANSFERS 2,799,341 3,706,932 (91,935) 45,321 6,459,659
TRANSFERS:Transfers in 458,705 974,748 199,000 - 1,632,453 Transfers out (631,696) (655,701) - - (1,287,397) Total Operating Transfers (172,991) 319,047 199,000 - 345,056
Change in Net Position 2,626,350 4,025,979 107,065 45,321 6,804,715
NET POSITION AT BEGINNING OF YEAR 31,161,099 29,316,590 908,589 139,856 61,526,134 319,047
NET POSITION AT END OF YEAR 33,787,449$ 33,342,569$ 1,015,654$ 185,177$ 68,330,849$
____________(1) Extracted from audited financial statements of the City.
Business-Type Activities-Enterprise Funds

60
CITY OF SOMERVILLE, MASSACHUSETTS
PROPRIETARY FUNDS
Statement of Revenues, Expenses and Changes in Fund Net Assets
Fiscal Year Ended June 30, 2016 (1)
VeteransMemorial Dilboy
Water Sewer Ice Rink Stadium Total
OPERATING REVENUES:Charges for services 13,249,816$ 19,298,052$ 638,822$ 227,234$ 33,413,924$
OPERATING EXPENSES:Cost of services and administration 8,897,314 16,611,756 542,042 136,199 26,187,311 Depreciation 1,191,972 430,641 85,898 - 1,708,511
Total Operating Expenses 10,089,286 17,042,397 627,940 136,199 27,895,822
OPERATING INCOME (LOSS) 3,160,530 2,255,655 10,882 91,035 5,518,102
NONOPERATING REVENUES (EXPENSES):Investment income 9,503 132,663 94 94 142,354 Interest expense (122,009) (56,762) (94,050) - (272,821)
TOTAL NONOPERATING - REVENUES (EXPENSES), NET (112,506) 75,901 (93,956) 94 (130,467)
INCOME (LOSS) BEFORE TRANSFERS 3,048,024 2,331,556 (83,074) 91,129 5,387,635
TRANSFERS:Transfers in - - 157,292 - 157,292 Transfers out (607,059) (498,323) - - (1,105,382) Total Operating Transfers (607,059) (498,323) 157,292 - (948,090)
Change in Net Position 2,440,965 1,833,233 74,218 91,129 4,439,545
NET POSITION AT BEGINNING OF YEAR 28,720,134 27,483,357 834,371 48,727 57,086,589
NET POSITION AT END OF YEAR 31,161,099$ 29,316,590$ 908,589$ 139,856$ 61,526,134$
____________(1) Extracted from audited financial statements of the City.
Business-Type Activities-Enterprise Funds

61
CITY OF SOMERVILLE, MASSACHUSETTS
PROPRIETARY FUNDS
Statement of Revenues, Expenses and Changes in Fund Net Assets
Fiscal Year Ended June 30, 2015 (1)
VeteransMemorial Dilboy
Water Sewer Ice Rink Stadium Total
OPERATING REVENUES:Charges for services 11,923,024$ 17,304,880$ 575,908$ 181,942$ 29,985,754$
OPERATING EXPENSES:Cost of services and administration 8,510,993 15,872,979 540,438 160,855 25,085,265 Depreciation 1,122,077 373,430 85,898 - 1,581,405
Total Operating Expenses 9,633,070 16,246,409 626,336 160,855 26,666,670
OPERATING INCOME (LOSS) 2,289,954 1,058,471 (50,428) 21,087 3,319,084
NONOPERATING REVENUES (EXPENSES):Investment income 4,878 158,618 3,630 40 167,166 Interest expense (146,562) (65,928) (124,308) - (336,798)
TOTAL NONOPERATING - REVENUES (EXPENSES), NET (141,684) 92,690 (120,678) 40 (169,632)
INCOME (LOSS) BEFORE TRANSFERS 2,148,270 1,151,161 (171,106) 21,127 3,149,452
Capital Contributions - - 668,830 - 668,830
TRANSFERS:Transfers in - - 150,000 69,376 219,376 Transfers out (607,059) (498,323) - - (1,105,382) Total Operating Transfers (607,059) (498,323) 150,000 69,376 (886,006)
Change in Net Position 1,541,211 652,838 647,724 90,503 2,932,276
NET POSITION AT BEGINNING OF YEAR 27,178,923 26,830,519 186,647 (41,776) 54,154,313
NET POSITION AT END OF YEAR 28,720,134$ 27,483,357$ 834,371$ 48,727$ 57,086,589$
____________(1) Extracted from audited financial statements of the City.
Business-Type Activities-Enterprise Funds
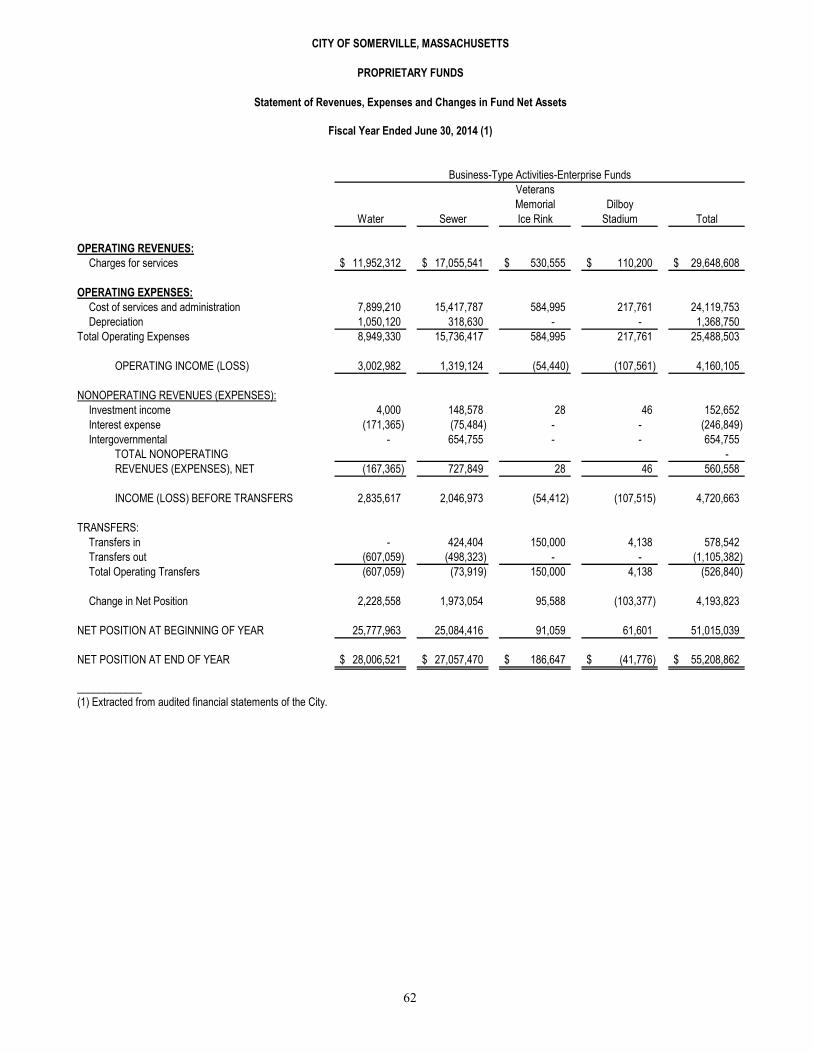
62
CITY OF SOMERVILLE, MASSACHUSETTS
PROPRIETARY FUNDS
Statement of Revenues, Expenses and Changes in Fund Net Assets
Fiscal Year Ended June 30, 2014 (1)
VeteransMemorial Dilboy
Water Sewer Ice Rink Stadium Total
OPERATING REVENUES:Charges for services 11,952,312$ 17,055,541$ 530,555$ 110,200$ 29,648,608$
OPERATING EXPENSES:Cost of services and administration 7,899,210 15,417,787 584,995 217,761 24,119,753 Depreciation 1,050,120 318,630 - - 1,368,750
Total Operating Expenses 8,949,330 15,736,417 584,995 217,761 25,488,503
OPERATING INCOME (LOSS) 3,002,982 1,319,124 (54,440) (107,561) 4,160,105
NONOPERATING REVENUES (EXPENSES):Investment income 4,000 148,578 28 46 152,652 Interest expense (171,365) (75,484) - - (246,849) Intergovernmental - 654,755 - - 654,755
TOTAL NONOPERATING - REVENUES (EXPENSES), NET (167,365) 727,849 28 46 560,558
INCOME (LOSS) BEFORE TRANSFERS 2,835,617 2,046,973 (54,412) (107,515) 4,720,663
TRANSFERS:Transfers in - 424,404 150,000 4,138 578,542 Transfers out (607,059) (498,323) - - (1,105,382) Total Operating Transfers (607,059) (73,919) 150,000 4,138 (526,840)
Change in Net Position 2,228,558 1,973,054 95,588 (103,377) 4,193,823
NET POSITION AT BEGINNING OF YEAR 25,777,963 25,084,416 91,059 61,601 51,015,039
NET POSITION AT END OF YEAR 28,006,521$ 27,057,470$ 186,647$ (41,776)$ 55,208,862$
____________(1) Extracted from audited financial statements of the City.
Business-Type Activities-Enterprise Funds

63
Free Cash Under Massachusetts law an amount known as "free cash" is certified as of the beginning of each fiscal year by the State Bureau of Accounts and this, together with certain subsequent tax receipts, is used as the basis for subsequent appropriations from available funds, which are not required to be included in the annual tax levy. The following table sets forth the recent trend in Free Cash for the City.
Free CashYear (July 1)
2018 14,524,715$ 2017 11,621,352 2016 10,833,988 2015 11,512,278 2014 10,651,386
Stabilization Fund The City maintains two stabilization funds, which are accounted for in the Trust Funds. Funded by an appropriation, the general stabilization fund plus interest income may be appropriated at any City Council meeting for any municipal purpose. The water/sewer stabilization fund plus interest income may be appropriated at any City Council meeting for any water or sewer purpose. The following table lists the Stabilization Fund balances for the following fiscal years.
General Water/SewerStabilization Stabilization Fund Balance Fund Balance
Year (June 30) (June 30)
2019 $31,150,176 $12,035,137 2018 31,444,517 10,474,860 2017 25,306,315 8,856,910 2016 21,286,724 7,752,581 2015 16,026,377 7,655,739
Tax Increment Financing for Development Districts Under recent legislation, cities and towns are authorized to establish development districts to encourage increased residential, industrial and commercial activity. All or a portion of the taxes on growth in assessed value in such districts may be pledged and used solely to finance economic development projects pursuant to the town or city’s development program for the district. This includes pledging such “tax increments” for the payment of bonds issued to finance such projects. As a result of any such pledge, tax increments raised from new growth properties in development districts are not available for other municipal purposes. Tax increments are taken into account in determining the total taxes assessed for the purpose of calculating the maximum permitted tax levy under Proposition 2 ½. In 2010, the City established one such Development District - Assembly Row. In December 2017, Phase 1 of the Union Square DIF was passed by the City Council. City staff has identified District Improvement Financing (DIF), authorized under M.G.L. Chapter 40Q, as an effective tool to provide the City with enhanced borrowing terms to implement needed infrastructure investments in Union Square. These investments will address long‐needed improvements to city infrastructure that serves over 60% of Somerville residents and unlock the development potential of Union Square, generating a new stream of tax revenue that can in turn be used to help pay the debt service for the infrastructure improvements. The City anticipates investment of approximately $141 million in utility and streetscape improvements. The City anticipates that over 4.45 million square feet of new commercial and residential development will occur on private property located within the USQ Development District. The Union Square Neighborhood Plan articulates a vision of establishing Union Square as a transit‐oriented, 18‐hour, mixed‐used urban employment center.

64
INDEBTEDNESS Authorization Procedure and Debt Limitation Bonds and notes are generally authorized on behalf of the City by a vote of two-thirds of all the members of the City Council on the recommendation of the Mayor. Provision is made for a referendum on the filing of a petition bearing the requisite number of signatures. Borrowings for certain purposes require state administrative approval. Under State law the Treasurer with the approval of the Mayor, is authorized to borrow in anticipation of current revenues and state and federal grants. The general debt limit of the City consists of a normal debt limit and a double debt limit. The normal debt limit is 5 per cent of the valuation of taxable property as last equalized by the State Department of Revenue. The City can authorize debt up to this amount without State approval. It can authorize debt up to twice this amount (the double debt limit) with approval of the State Municipal Finance Oversight Board. There are many categories of general obligation debt which are exempt from and do not count against the General Debt Limit. Among others, these exempt categories include revenue anticipation notes and grant anticipation notes; emergency loans; loans exempted by special laws; certain school bonds, sewer bonds, water bonds, bonds for electric, gas and telecommunication systems, solid waste disposal facility bonds and economic development bonds supported by tax increment financing; and subject to special debt limits, including housing, urban renewal and economic development. Revenue bonds are not subject to these debt limits. The General Debt Limit applies at the time the debt is authorized. The special debt limits generally apply at the time the debt is incurred. The amount borrowed in each fiscal year by the issue of revenue anticipation notes is limited to the tax levy of the prior fiscal year, together with the net receipts in the prior fiscal year from the motor vehicle excise and certain payments made by the Commonwealth in lieu of taxes. The fiscal year ends on June 30. Notes may mature in the following fiscal year, and notes may be refunded into the following fiscal year to the extent of the uncollected, unabated current tax levy and certain other items, including revenue deficits, overlay deficits, final judgments and lawful unappropriated expenditures, which are to be added to the next tax levy, but excluding deficits arising from a failure to collect taxes of earlier years. (See “Taxation to Meet Deficits” under “PROPERTY TAXATION” above.) In any event, the period from an original borrowing to its final maturity cannot exceed one year. Types of Obligations General Obligations. Massachusetts cities and towns are authorized to issue general obligation indebtedness of these types: Serial Bonds and Notes. These are generally required to be payable in annual principal amounts beginning no later than the end of the next fiscal year commencing after the date of issue and ending within the terms permitted by law. A level debt service schedule, or a schedule that provides for a more rapid amortization of principal than level debt service, is permitted. The principal amounts of certain economic development bonds supported by tax increment financing may be payable in equal, diminishing or increasing amounts beginning within 5 years after the date of issue. The maximum terms of serial bonds and notes vary from one year to 40 years, depending on the purpose of the issue. The maximum terms permitted are set forth in the statutes. In addition, for many projects, the maximum term may be determined in accordance with useful life guidelines promulgated by the State Department of Revenue (“DOR”). Serial bonds and notes may be issued for the purposes set forth in the statutes. In addition, serial bonds and notes may be issued for any other public work improvement or asset not specifically listed in the Statutes that has a useful life of at least 5 years. Bonds or notes may be made callable and redeemed prior to their maturity, and a redemption premium may be paid. Refunding bonds or notes may be issued subject to the maximum applicable term measured from the date of the original bonds or notes and must produce present value savings over the debt service of the refunded bonds. Generally, the first required annual payment of principal of the refunding bonds cannot be later than the first principal payment of any of the bonds or notes being refunded thereby, however, principal payments made before the first principal payment of any of the bonds or notes being refunded thereby may be in any amount. Serial bonds may be issued as “qualified bonds” with the approval of the state Municipal Finance Oversight Board composed of the State Treasurer, the State Auditor, the Attorney General and the Director of Accounts, subject to such conditions and limitations (including restrictions on future indebtedness) as may be required by the Board. Qualified bonds may mature not less than 10 nor more than 30 years from their dates and are not subject to the amortization requirements described above. The State Treasurer is required to pay the debt service on qualified bonds and thereafter to withhold the amount of the debt service paid by the State from state aid or other state payments; administrative costs and any loss of interest income to the State are to be assessed upon the city or town.

65
Tax Credit Bonds or Notes. Subject to certain provisions and conditions, the officers authorized to issue bonds or notes may designate any duly authorized issue of bonds or notes as “tax credit bonds” to the extent such bonds and notes are otherwise permitted to be issued with federal tax credits or other similar subsidies for all or a portion of the borrowing costs. Tax credit bonds may be made payable without regard to the annual installments required by any other law, and a sinking fund may be established for the payment of such bonds. Any investment that is part of such a sinking fund may mature not later than the date fixed for payment or redemption of the applicable bonds. Bond Anticipation Notes. These generally must mature within two years of their original dates of issuance but may be refunded from time to time for a period not to exceed ten years from their original dates of issuance, provided that for each year that the notes are refunded beyond the second year they must be paid in part from revenue funds in an amount at least equal to the minimum annual payment that would have been required if the bonds had been issued at the end of the second year. For certain school projects, however, notes may be refunded from time to time for a period not to exceed seven years without having to pay any portion of the principal of the notes from revenue funds. The maximum term of bonds issued to refund bond anticipation notes is measured (except for certain school projects) from the date of the original issue of the notes. Revenue Anticipation Notes. These are issued to meet current expenses in anticipation of taxes and other revenues. They must mature within one year but, if payable in less than one year, may be refunded from time to time up to one year from the original date of issue. Grant Anticipation Notes. These are issued for temporary financing in anticipation of federal grants and state and county reimbursements. Generally, they must mature within two years but may be refunded from time to time as long as the municipality remains entitled to the grant or reimbursement. Revenue Bonds. Cities and towns may issue revenue bonds for solid waste disposal facilities, for projects financed under the Commonwealth’s Clean Water Revolving Loan Programs and for certain economic development projects supported by tax increment financing. In addition, cities and towns having electric departments may issue electric revenue bonds, and notes in anticipation of such bonds, subject to the approval of the State Department of Telecommunications and Energy.
GENERAL OBLIGATION DEBT
DIRECT DEBT SUMMARY AS OF JUNE 30, 2019
Long Term Debt: General Obligation Bonds: Sewer (1) 6,173,075$ Water (2) 10,092,861 General (3) 50,959,725 Rink 1,710,000 School (4) 28,997,931 DIF (5) 23,915,000 CPA 5,660,000 Total Long-Term Debt Outstanding 127,508,592$
Short Term Debt: Bond Anticipation Notes Outstanding (6) 118,150,511 This Issue of New Money Bond Anticipation Notes 50,000,000 Total Short-Term Debt Outstanding After This Issue (7) 168,150,511
Total Direct Debt 295,659,103$
_________________
(1) $4,000,000 is not subject to the City’s debt limit. (2) $10,037,661 is not subject to the City’s debt limit. (3) Subject to the City's debt limit. Includes bonds for street, equipment, building remodeling, parks, computers, library and land acquisition.
$7,235,000 is not subject to the City’s debt limit. (4) $10,207,410 is not subject to the City’s debt limit. School construction will be reimbursed by the State at the rate of 90% of principal and interest
over the life of outstanding school bonds. The City expects to receive school construction grants from the Massachusetts School Building Authority in the amount of $3,406,473.
(5) Outside the City’s debt limit. (6) Includes Bond Anticipation Notes issues payable October 25, 2019 ($55,000,000- to be renewed with this issue) and June 5, 2020 ($63,150,511). (7) Payable June 5, 2020 ($63,150,511) and October 23, 2020 (this issue- $105,000,000)

66
Debt Ratios
The table below sets forth debt as a percentage of assessed valuation and per capita debt at the end of the following fiscal years. The table considers the principal amount of general obligation bonds of the City only and does not deduct anticipated state grant payments applicable to the principal amount of outstanding bonds or debt that may be supported in whole, or part, by non-tax revenues.
General Obligation 2010 State Bonds as a % ofFiscal Bonds Federal Census Equalized Per Capita Equalized
Year End Outstanding Population Valuation Debt Valuation
2019 127,508,592$ 75,754 15,170,069,800$ 1,683$ 0.8 %2018 111,262,425 75,754 12,444,120,100 1,469 0.92017 106,688,839 75,754 12,444,120,100 1,408 0.92016 84,581,348 75,754 10,446,575,400 1,117 0.82015 85,433,062 75,754 10,446,575,400 1,128 0.8
Projected Principal Payments by Purpose
The following table sets forth principal payments by purpose for the City’s outstanding general obligation debt.
GENERAL OBLIGATION BONDS PRINCIPAL PAYMENTS BY PURPOSE
AS OF JUNE 30, 2019 Fiscal TotalYear Sewer (1) Water (2) General (3) Rink School (4) DIF (5) CPA Long-Term Debt2020 $419,978 $1,032,234 $4,161,000 $205,000 $2,854,623 $400,000 $110,000 $9,182,8352021 424,978 978,234 4,180,000 215,000 2,914,623 715,000 115,000 $9,542,8352022 367,078 958,009 3,923,975 190,000 2,971,172 750,000 120,000 $9,280,2342023 244,978 797,034 3,916,000 200,000 1,458,622 785,000 125,000 $7,526,6342024 246,178 676,400 3,777,500 210,000 1,482,322 815,000 130,000 $7,337,4002025 254,978 677,800 3,633,000 220,000 1,511,622 850,000 140,000 $7,287,4002026 234,978 600,300 3,450,000 230,000 1,489,622 885,000 145,000 $7,034,9002027 234,978 605,300 3,345,000 240,000 1,509,622 920,000 155,000 $7,009,9002028 179,978 438,250 3,273,250 - 1,392,422 955,000 160,000 $6,398,9002029 184,978 464,300 2,775,000 - 1,289,622 980,000 170,000 $5,863,9002030 140,000 210,000 2,725,000 - 1,309,622 1,005,000 175,000 $5,564,6222031 145,000 120,000 2,180,000 - 1,329,622 1,035,000 185,000 $4,994,6222032 150,000 125,000 1,940,000 - 1,359,622 1,060,000 190,000 $4,824,6222033 155,000 130,000 1,035,000 - 1,384,622 1,100,000 195,000 $3,999,6222034 165,000 135,000 1,075,000 - 1,015,517 1,135,000 205,000 $3,730,5172035 170,000 140,000 960,000 - 420,517 1,175,000 215,000 $3,080,5172036 175,000 140,000 700,000 - 420,517 1,210,000 220,000 $2,865,5172037 180,000 150,000 720,000 - 425,517 1,250,000 225,000 $2,950,5172038 185,000 155,000 740,000 - 440,517 1,290,000 235,000 $3,045,5172039 190,000 155,000 350,000 - 440,517 1,330,000 240,000 $2,705,5172040 195,000 160,000 350,000 - 445,517 1,380,000 250,000 $2,780,5172041 205,000 165,000 370,000 - 455,517 1,420,000 255,000 $2,870,5172042 210,000 170,000 370,000 - 460,517 1,470,000 265,000 $2,945,5172043 215,000 180,000 240,000 - 215,517 - 270,000 $1,120,5172044 225,000 185,000 240,000 - - - 280,000 $930,0002045 225,000 185,000 245,000 - - - 285,000 $940,0002046 235,000 190,000 260,000 - - - 295,000 $980,0002047 215,000 170,000 25,000 - - - 305,000 $715,000
Total 6,173,075$ 10,092,861$ 50,959,725$ $1,710,000 $28,997,931 23,915,000$ 5,660,000$ $127,508,592
_____________ (1) $4,000,000 is not subject to the City’s debt limit (2) $10,037,661 is not subject to the City’s debt limit. (3) Subject to the City's debt limit. Includes bonds for street, equipment, building remodeling, parks, computers, library and land acquisition.
$7,235,000 is not subject to the City’s debt limit. (4) $10,207,410 is not subject to the City’s debt limit. School construction will be reimbursed by the State at the rate of 90% of principal and interest
over the life of outstanding school bonds. The City expects to receive school construction grants from the Massachusetts School Building Authority in the amount of $3,406,473.
(5) Outside the City’s debt limit.

67
Debt Service Requirements The following table sets forth the required principal and interest payments on outstanding general obligation bonds of the City.
GENERAL OBLIGATION BONDS DEBT SERVICE REQUIREMENTS
AS OF JUNE 30, 2019
TotalFiscal Total Total MSBA Net DebtYear Principal Interest Subsidy Service
2020 9,182,835$ 4,398,926$ (1,135,491)$ 12,446,269$ 2021 9,542,835 4,060,827 (1,135,491) 12,468,170 2022 9,280,234 3,689,674 (1,135,491) 11,834,417 2023 7,526,634 3,318,977 - 10,845,610 2024 7,337,400 3,044,729 - 10,382,129 2025 7,287,400 2,756,862 - 10,044,261 2026 7,034,900 2,475,054 - 9,509,953 2027 7,009,900 2,212,577 - 9,222,476 2028 6,398,900 1,975,672 - 8,374,572 2029 5,863,900 1,775,942 - 7,639,842 2030 5,564,622 1,596,475 - 7,161,097 2031 4,994,622 1,413,988 - 6,408,610 2032 4,824,622 1,246,637 - 6,071,259 2033 3,999,622 1,083,060 - 5,082,682 2034 3,730,517 954,675 - 4,685,192 2035 3,080,517 845,199 - 3,925,716 2036 2,865,517 753,183 - 3,618,700 2037 2,950,517 664,429 - 3,614,946 2038 3,045,517 572,381 - 3,617,898 2039 2,705,517 484,214 - 3,189,731 2040 2,780,517 400,441 - 3,180,958 2041 2,870,517 313,906 - 3,184,423 2042 2,945,517 224,246 - 3,169,763 2043 1,120,517 143,504 - 1,264,021 2044 930,000 111,050 - 1,041,050 2045 940,000 81,825 - 1,021,825 2046 980,000 52,275 - 1,032,275 2047 715,000 21,450 - 736,450 Total 127,508,592$ 40,672,177$ (3,406,473)$ 164,774,296$
Authorized Unissued Debt The City has approximately $401 million authorized but unissued debt as follows: $231 million for the construction of a new high school (up to 75.29% of which will be paid for with Massachusetts School Building Authority (MSBA) grant reimbursement payments), $63 million for streetscape and infrastructure improvements along Somerville Avenue, $50 million for the City’s share of the Massachusetts Bay Transportation Authority (MBTA) Green Line extension project, $9.4 million for the construction and reconstruction of various parks throughout the City and the balance for miscellaneous equipment and public improvements. The City plans to issue approximately $136 million of bonds for the high school construction project, of which $130.3 million has been excluded from Proposition 2 ½. As noted above, most of the balance of the high school construction project costs is expected to be paid with MSBA grants.

68
Overlapping Debt The City of Somerville is a member of the Massachusetts Water Resources Authority and the Massachusetts Bay Transportation Authority. The following table sets forth the outstanding bonded debt, exclusive of temporary loans in anticipation of bonds or current revenue, of the Massachusetts Water Resources Authority and the Massachusetts Bay Transportation Authority and the City's gross share of such debt and the fiscal 2019 dollar assessment for each.
Somerville's Fiscal 2019 Outstanding Estimated Dollar
Overlapping Entity Debt Share (1) Assessment (2)
Massachusetts Water Resources Authority(3): Water 2,044,213,000$ 3.22 % 4,736,542$ Sewer 3,449,020,000 3.51 11,374,468 Massachusetts Bay Transportation Authority(4) 5,728,840,000 3.12 5,309,973
_____________ (1) Estimated share based on debt service only. (2) Estimated dollar assessment based upon total net operating expenses, inclusive (where applicable) of debt service. (3) SOURCE: Massachusetts Water Resources Authority. Outstanding debt as of June 30, 2018. The Massachusetts Water Resources
Authority (the “MWRA”) provides wholesale drinking water services in whole or in part to 48 cities, towns and special purpose entities and provides wastewater collection and treatment services to 43 cities, towns and special purpose entities. Under its enabling legislation, as amended, the aggregate principal amount of all bonds issued by the MWRA for its corporate purposes may not exceed $6.1 billion outstanding at any time. Its obligations are secured by revenues of the MWRA. The MWRA assesses member cities, towns and special purpose entities, which continue to provide direct retail water and sewer services to users. The cities, towns and other entities collect fees from the users to pay all or part of the assessments; some municipalities levy property taxes to pay part of the amounts assessed upon them.
(4) SOURCE: Massachusetts Bay Transportation Authority ("MBTA"). Outstanding debt as of June 30, 2018. The Massachusetts Bay Transportation Authority (the “MBTA”) was created in 1964 to finance and operate mass transportation facilities within the greater Boston metropolitan area. Under its enabling act, the MBTA is authorized to issue bonds for capital purposes, other than refunding bonds, and for certain specified purposes to an outstanding amount, which does not exceed the aggregate principal amount of $3,556,300,000. In addition, pursuant to certain of the Commonwealth’s transportation bond bills, the MBTA is authorized to issue additional bonds for particular capital projects. The MBTA also is authorized to issue bonds of the purpose of refunding bonds. Under the MBTA’s enabling act debt service, as well as other operating expenses of the MBTA, are to be financed by a dedicated revenue stream consisting of the amounts assessed on the cities and towns of the MBTA and a dedicated portion of the statewide sales tax. The amount assessed to each city and town is based on its weighted percentage of the total population of the authority as provided in the enabling act. The aggregate amount of such assessments is generally not permitted to increase by more than 2.5 percent per year. (See “Tax Limitations” under “PROPERTY TAXATION” above.)
Contractual Obligations Municipal contracts are generally limited to currently available appropriations. A city or town generally has authority to enter into contracts for the exercise of any of its corporate powers for any period of time deemed to serve its best interest, but generally only when funds are available for the first fiscal year; obligations for succeeding fiscal years generally are expressly subject to availability and appropriation of funds. Municipalities have specific authority in relatively few cases for long-term contractual obligations that are not subject to annual appropriation, including contracts for refuse disposal and sewage treatment and disposal. Municipalities may also enter into long-term contracts in aid of housing and renewal projects. There may be implied authority to make other long-term contracts required to carry out authorized municipal functions, such as contracts to purchase water from private water companies. Municipal contracts relating to solid waste disposal facilities may contain provisions requiring the delivery of minimum amounts of waste and payments based thereon and requiring payments in certain circumstances without regard to the operational status of the facilities. Municipal electric departments have statutory power to enter into long-term contracts for joint ownership and operation of generating and transmission facilities and for the purchase or sale of capacity, including contracts requiring payments without regard to the operational status of the facilities.

69
Pursuant to the Home Rule Amendment to the Massachusetts Constitution, cities and towns may also be empowered to make other contracts and leases. The City has a limited number of such contractual obligations, the largest of which are for rubbish disposal, school transportation, and equipment leasing. All are subject to annual appropriation by the City Council. The City has a ten-year contract expiring on June 30, 2023 with Waste Management, Inc. for the disposal of rubbish. The cost in fiscal 2017, fiscal 2018 and fiscal 2019 was approximately $1,271,996, $1,259,856, and $1,133,178 respectively. The City budgeted $1,350,000 for this contract for fiscal 2020. The School Department has two transportation contracts. The first contract is for Special Education students which expires June 30, 2022. The cost of this three year contract is $7,289,734. The second contract is for pupil transportation with Eastern Bus which expires on August 28, 2020. The total cost of this three year contract is $599,400.
RETIREMENT PLAN The Massachusetts General Laws provide for the establishment of contributory retirement systems for state employees, for teachers and for county, city and town employees other than teachers. Teachers are assigned to a separate statewide teachers’ system and not to the city and town systems. For all employees other than teachers, this law is subject to acceptance in each city and town. Substantially all employees of an accepting city or town are covered. If a town has a population of less than 10,000 when it accepts the statute, its non-teacher employees participate through the county system and its share of the county cost is proportionate to the aggregate annual rate of regular compensation of its covered employees. In addition to the contributory systems, cities and towns provide non-contributory pensions to a limited number of employees, primarily persons who entered service prior to July 1, 1937 and their dependents. The Public Employee Retirement Administration Commission (“PERAC”) provides oversight and guidance for and regulates all state and local retirement systems. The obligations of a city or town, whether direct or through a county system, are contractual legal obligations and are required to be included in the annual tax levy. If a city or town, or the county system of which it is a member, has not established a retirement system funding schedule as described below, the city or town is required to provide for the payment of the portion of its current pension obligations which is not otherwise covered by employee contributions and investment income. “Excess earnings,” or earnings on individual employees’ retirement accounts in excess of a predetermined rate, are required to be set aside in a pension reserve fund for future, not current, pension liabilities. Cities and towns may voluntarily appropriate to their system’s pension reserve fund in any given year up to five percent of the preceding year’s tax levy. The aggregate amount in the fund may not exceed ten percent of the equalized valuation of the city or town. If a city or town, or each member city and town of a county retirement system, has accepted the applicable law, it is required to annually appropriate an amount sufficient to pay not only its current pension obligations, but also a portion of its future pension liability. The portion of each such annual payment allocable to future pension obligations is required to be deposited in the pension reserve fund. The amount of the annual city or town appropriation for each such system is prescribed by a retirement system funding schedule which is periodically reviewed and approved by PERAC. Each system’s retirement funding schedule is designed to reduce the unfunded actuarial pension liability of the system to zero by not later than June 30, 2030, with annual increases in the scheduled payment amounts of not more than 4.5 percent. The funding schedule must provide that payment in any year of the schedule is not less than 95 percent of the amount appropriated in the previous fiscal year. City, town and county systems which have an approved retirement funding schedule receive annual pension funding grants from the Commonwealth for the first 16 years of such funding schedule. Pursuant to recent legislation, a system (other than the state employees’ retirement system and the teachers’ retirement system) which conducts an actuarial valuation as of January 1, 2009, or later, may establish a revised schedule which reduces the unfunded actuarial liability to zero by not later than June 30, 2040, subject to certain conditions. If the schedule is so extended under such provisions and a later updated valuation allows for the development of a revised schedule with reduced payments, the revised schedule shall be adjusted to provide that the appropriation for each year shall not be less than that for such year under the prior schedule, thus providing for a shorter schedule rather than reduced payments. City, town and county systems may choose to participate in the Pension Reserves Investment Trust Fund (the “PRIT Fund”), which receives additional state funds to offset future pension costs of participating state and local systems. If a local system participates in the PRIT Fund, it must transfer ownership and control of all assets of its system to the Pension Reserves Investment Management Board, which manages the investment and reinvestment of the PRIT Fund. Cities and towns with systems participating in the PRIT Fund continue to be obligated to fund their pension obligations in the manner described above. The additional state appropriations to offset future pension liabilities of state and local systems participating in the PRIT Fund are required to total at least 1.3 percent of state payroll. Such additional state appropriations are deposited in

70
the PRIT Fund and shared by all participating systems in proportion to their interests in the assets of the PRIT Fund as of July 1 for each fiscal year. Cost-of-living increases for each local retirement system may be granted and funded only by the local system, and only if it has established a funding schedule. Those statutory provisions are subject to acceptance by the local retirement board and approval by the local legislative body, which acceptance may not be revoked. The teachers and certain administrative and other professional employees of the City's school department participate individually in a contributory retirement plan administered by the Massachusetts Teachers' Retirement Board. The City does not contribute to this plan. Substantially all other employees of the City are participants in the City of Somerville Contributory Retirement System (the System). Under the provisions of the System, active employees contribute certain percentages of their pay (5%, 7% or 8%, depending upon date of employment) and are eligible for retirement benefits after meeting the prescribed age and period of service criteria. In addition, the City and the Somerville Housing Authority contribute to the System an annual amount, determined by the State Division of the Public Employee Retirement Administration, primarily on the basis of projected annual benefit payments for the year (the "pay-as-you-go" method). Generally accepted accounting principles require the System to perform an actuarial valuation to determine the pension benefit obligation at least biennially, with an actuarial update to the date 12 months after that biennial valuation. The most recent actuarial valuation of the City was completed as of January 1, 2017. The total unfunded pension benefit obligation applicable to the City's employees was $132,035,273 at January 1, 2017 as follows: Total pension benefit obligation ...................................................... $392,656,092 Net assets available for benefits, at market value .......................... 260,620,819 Unfunded pension benefit obligation .............................................. $132,035,273 The City is currently on a funding schedule that will amortize its unfunded pension liability by June 30, 2033. Current law allows funding by 2040. Investments of system assets in bonds are valued at amortized cost and equity investments are valued in the manner determined by the State Commissioner of Insurance. The assets of the system were approximately $260,620,819 as of January 1, 2017. The estimated unfunded actuarial liability of the contributory retirement system as of January 1, 2017 is approximately $132,035,273 assuming an 8.00% interest rate of return. In addition to the contributory systems, cities and towns provide non-contributory pensions to a limited number of employees, primarily persons who entered service prior to July 1, 1937 and their dependents. The annual required contributions of the City to each retirement system for the 2015 through 2019 fiscal years and budgeted for fiscal year 2020 are as follows:
Fiscal Year Contributory Non-Contributory
2020 (budgeted) $14,273,369 $99,706 2019 14,364,292 108,112 2018 13,808,937 134,096 2017 13,711,675 121,265 2016 13,304,274 119,000 2015 12,324,940 255,023

71
Current Funding Schedule
Appropriation Forecast
Fiscal Employee Amortization Employer EmployerYear Employee Normal Cost Payments Total Cost Total Cost Funded Unfunded
Ending Contributions with Interest with Interest with Interest % of Payroll Ratio %** Liability
2018 6,284,686$ 2,301,386$ 12,503,950$ 14,805,336$ 20.7 % 66.1 % 133,382,538$ 2019 6,606,449 2,320,306 12,906,635 15,226,941 20.5 67.2 131,058,655 2020 6,877,129 2,314,585 12,700,429 15,015,014 19.6 68.7 128,021,994 2021 7,158,104 2,306,432 12,756,127 15,062,559 19.1 70.1 124,952,681 2022 7,449,748 2,295,707 13,202,592 15,498,299 19.1 71.4 121,716,638 2023 7,752,448 2,282,263 13,664,683 15,946,946 19.1 72.9 117,758,582 2024 8,066,606 2,265,946 14,142,947 16,408,893 19.0 74.5 113,004,544 2025 8,392,636 2,246,596 14,637,950 16,884,546 19.0 76.3 107,374,066 2026 8,730,968 2,224,046 15,150,278 17,374,324 19.0 78.1 100,779,672 2027 9,082,046 2,198,120 15,680,538 17,878,658 19.0 80.2 93,126,274 2028 9,446,331 2,168,638 16,229,356 18,397,994 19.0 82.4 84,310,553 2029 9,824,300 2,135,408 16,797,384 18,932,792 19.0 84.9 74,220,270 2030 10,216,445 2,098,233 17,385,292 19,483,525 18.9 87.5 62,733,534 2031 10,623,276 2,056,905 17,993,778 20,050,683 18.9 90.3 49,718,008 2032 11,045,323 2,011,209 18,623,560 20,634,769 18.9 93.4 35,030,042 2033 11,483,132 1,960,921 19,275,384 21,236,305 18.9 96.6 18,513,750 2034 11,937,268 1,905,805 - 1,905,805 1.6 100.0 - 2035 12,408,318 1,845,617 - 1,845,617 1.5 100.0 - 2036 12,896,887 1,780,102 - 1,780,102 1.4 100.0 - 2037 13,283,793 1,833,505 - 1,833,505 1.4 100.0 - 2038 13,682,307 1,888,510 - 1,888,510 1.4 100.0 - 2039 14,092,777 1,945,166 - 1,945,166 1.4 100.0 - 2040 14,515,560 2,003,521 - 2,003,521 1.4 100.0 - 2041 14,951,027 2,063,626 - 2,063,626 1.4 100.0 - 2042 15,399,557 2,125,535 - 2,125,535 1.4 100.0 - 2043 15,861,544 2,189,301 - 2,189,301 1.4 100.0 - 2044 16,337,390 2,254,980 - 2,254,980 1.4 100.0 - 2045 16,827,512 2,322,630 - 2,322,630 1.4 100.0 - 2046 17,332,338 2,392,308 - 2,392,308 1.4 100.0 - 2047 17,852,308 2,464,078 - 2,464,078 1.4 100.0 - 2048 18,387,877 2,538,000 - 2,538,000 1.4 100.0 - 2049 18,939,513 2,614,140 - 2,614,140 1.4 100.0 -
**Beginning of Fiscal Year
______________ Source: January 1, 2017 Actuarial Valuation Report of the Somerville Contributory Retirement System, Sherman
Actuarial Services.

72
Other Post-Employment Benefits In addition to pension benefits, cities and towns may provide retired employees with health care and life insurance benefits. The portion of the cost of such benefits paid by cities and towns is generally provided on a pay-as-you-go basis. The pay-as-you-go costs to the City for such benefits in recent years have been as follows:
FiscalYear Amount
2020 (budgeted) 8,088,775$ 2019 7,703,595 2018 7,880,627 2017 9,258,566 2016 8,533,496 2015 9,645,790
The Governmental Accounting Standards Board (“GASB”) Statement Nos. 43 and 45 require public sector entities to report the future costs of these non-pension, post-employment benefits in their financial statements. These accounting standards do not require pre-funding the payment of these costs as the liability for such costs accrues, but the basis applied by the standards for measurement of costs and liabilities for these benefits is conservative if they continue to be funded on a pay-as-you-go basis and will result in larger yearly cost and liability accruals than if the cost of such benefits were pre-funded in a trust fund in the same manner as traditional pension benefits. Cities and towns that choose to self-insure all or a portion of the cost of the health care benefits they provide to employees and retirees may establish a trust fund for the purpose of paying claims. In addition, cities and towns may establish a trust fund for the purpose of pre-funding other post-employment benefits liability in the same manner as traditional pension benefits. As of June 30, 2018, the total OPEB liability for benefits was $275,979,622 and the fiduciary net position was $7,348,077, resulting in a net OPEB liability of $268,631,545, assuming a 3.75% investment rate of return. The actuarial determined contribution (ADC) is an amount determined by the actuary pursuant to GASB Statement No. 74/75 which represents a level of funding that, if paid on an ongoing basis, is projected to cover the service cost each year and amortize any unfunded actuarial liabilities. As of June 30, 2018, the ADC was $22,034,131. The City established an irrevocable trust fund on March 8, 2012 to fund the other post-employment benefit (OPEB) liability and appropriated $200,000 to the fund before June 30, 2012. The balance in the fund as of June 30, 2019 was $8,904,259. On August 1, 2009, contributions for the indemnity plan changed from 99% City - 1% retiree to 60% City - 40% retiree. Additionally, HMO and PPO plans changed from 90% City - 10% retiree to 75% City - 25% retiree. These changes will significantly reduce the OPEB liability.

73
EMPLOYEE RELATIONS
The City employs approximately 2,442 full and part-time workers, of whom 1,200 are employed by the School Department, 146 by the Police Department, 168 by the Fire Department, 121 by the Department of Public Works and the remainder by various other departments of the City. City and town employees (other than managerial and confidential employees) are entitled to join unions and to bargain collectively on questions of wages, hours and other terms and conditions of employment. Of the approximately 2,442 employees of the City, approximately 1,500 employees are represented by unions including employees of the School, Police and Fire Departments.
ContractUnion Expiration Date (1)
AFSCME Cafeteria 8/31/2020AFSCME Secretarial 6/30/2020Somerville Administrators Association 8/31/2022STA Instructional Paraprofessionals 8/31/2019STA Unit A, Teachers 8/31/2021STA Unit D, Scale Employees Union 8/31/2020UAW Community School 6/30/2021UAW Scale Program Administrators 8/31/2021Somerville Municipal Employees’ Association (SMEA) Unit D (a residual unit) 6/30/2016SMEA Unit A (supervisory employees and school nurses) 6/30/2022SMEA Unit B (clerical, technical and trades employees, and librarians) 6/30/2022SEIU/National Conference of Firemen and Oilers (school custodians) 6/30/2022Service Employees International Union, Local 888 (911 call takers and crossing guards) 6/30/2020Somerville Police Superior Officers Association 6/30/2018Somerville Police Employees Association 6/30/2015Somerville Firefighters 6/30/2018Fire Alarm Operators 6/30/2018
______________ (1) Expired contracts are currently in negotiation.
LITIGATION
The City is involved in various litigation in various state and federal courts and other forums in the Commonwealth of Massachusetts. In the opinion of the City Solicitor, none of the pending litigation, either individually or in the aggregate, is likely to result in final judgments against the City which would have a materially adverse effect on the City’s financial position.
_______________________
CITY OF SOMERVILLE, MASSACHUSETTS /s/ Linda Dubuque, Treasurer/Collector
October 8, 2019
CITY OF SOMERVILLE MASSACHUSETTS
COMPREHENSIVE ANNUAL FINANCIAL REPORT
For the Year Ended June 30, 2018
Joseph A. Curtatone, Mayor Edward Bean, Finance Director
Prepared by the City of Somerville Finance Department

On the Cover – Union Square Mural
Located in the heart of Union Square, the First Flag Mural depicts the first raising of the American flag (Jan 1, 1776) with George Washington in front of Prospect Hill.
Photo by Rie Lowenstein

CITY OF SOMERVILLE, MASSACHUSETTS
COMPREHENSIVE ANNUAL FINANCIAL REPORT
For the Year Ended June 30, 2018
Prepared by the City of Somerville Finance Department

CITY OF SOMERVILLE, MASSACHUSETTS
COMPREHENSIVE ANNUAL FINANCIAL REPORT
JUNE 30, 2018
TABLE OF CONTENTS
Introductory Section ......................................................................................................................................................... 1
Letter of Transmittal ..................................................................................................................................................... 2
Certificate of Achievement for Excellence in Financial Reporting .............................................................................. 14
Distinguished Budget Presentation Award ................................................................................................................. 15
Organizational Chart .................................................................................................................................................. 16
Principal Officials ........................................................................................................................................................ 17
Financial Section ........................................................................................................................................................... 19
Independent Auditor’s Report ..................................................................................................................................... 21
Management’s Discussion and Analysis .................................................................................................................... 23
Basic Financial Statements ........................................................................................................................................ 34
Statement of Net Position ....................................................................................................................................... 35
Statement of Activities ............................................................................................................................................ 36
Governmental Funds – Balance Sheet .................................................................................................................. 38
Reconciliation of the Governmental Funds Balance Sheet Total Fund Balances to the
Statement of Net Position .................................................................................................................................. 39
Governmental Funds – Statement of Revenues, Expenditures and Changes in Fund Balances ......................... 40
Reconciliation of the Statement of Revenues, Expenditures, and Changes in Fund Balances of the
Governmental Funds to the Statement of Activities .......................................................................................... 41
Proprietary Funds – Statement of Net Position ...................................................................................................... 42
Proprietary Funds – Statement of Revenues, Expenses and Changes in Net Position ........................................ 43
Proprietary Funds – Statement of Cash Flows ...................................................................................................... 44
Fiduciary Funds – Statement of Fiduciary Net Position ......................................................................................... 45
Fiduciary Funds – Statement of Changes in Fiduciary Net Position ...................................................................... 46
Notes to Basic Financial Statements ..................................................................................................................... 47
Required Supplementary Information ........................................................................................................................ 88
Schedule of Revenues, Expenditures and Changes in Fund Balance – General Fund – Budget and Actual ...... 89
Pension Plan Schedules – Retirement System .......................................................................................................... 93
Schedule of Changes in the Net Pension Liability and Related Ratios ................................................................. 94

Schedule of Contributions ...................................................................................................................................... 95
Schedule of Investment Return .............................................................................................................................. 96
Pension Plan Schedules - City ................................................................................................................................... 97
Schedule of the City’s Proportionate Share of the Net Pension Liability ............................................................... 98
Schedule of the City’s Contributions ...................................................................................................................... 99
Schedule of the Special Funding Amounts of the Net Pension Liability .............................................................. 100
Other Postemployment Benefits Plan Schedules .................................................................................................... 101
Schedule of Changes in the City’s Net Other Postemployment Benefit Liability and Related Ratios ................. 102
Schedule of the City’s Contributions .................................................................................................................... 103
Schedule of Investment Returns .......................................................................................................................... 104
Notes to Required Supplementary Information ........................................................................................................ 105
Combining and Individual Fund Statements ........................................................................................................ 109
Nonmajor Governmental Funds ....................................................................................................................... 110
Nonmajor Governmental Funds – Combining Balance Sheet ...................................................................... 112
Nonmajor Governmental Funds – Combining Statement of Revenues, Expenditures, and Changes in
Fund Balances ......................................................................................................................................... 116
Agency Fund ..................................................................................................................................................... 119
Agency Fund – Statement of Changes in Assets and Liabilities .................................................................. 120
Statistical Section ..................................................................................................................................................... 121
Net Position by Component – Last Ten Years ..................................................................................................... 122
Changes in Net Position – Last Ten Years .......................................................................................................... 123
Fund Balances, Governmental Funds – Last Ten Years ..................................................................................... 124
Changes in Fund Balances, Governmental Funds – Last Ten Years .................................................................. 125
Assessed Value and Actual Value of Taxable Property by Classification and Tax Rates –
Last Ten Years ................................................................................................................................................ 126
Principal Taxpayers – Current Year and Nine Years Ago .................................................................................... 127
Property Tax Levies and Collections – Last Ten Years ....................................................................................... 128
Ratios of Outstanding Debt and General Bonded Debt – Last Ten Years .......................................................... 129
Computation of Legal Debt Margin – Last Ten Years .......................................................................................... 130
Direct and Overlapping Governmental Activities Debt ......................................................................................... 131
Demographic and Economic Statistics – Last Ten Years .................................................................................... 132
Principal Employers (Excluding City) – Current Year and Nine Years Ago ......................................................... 133
Full-Time Equivalent City Employees – Last Ten Years ...................................................................................... 134
Operating Indicators by Function/Program – Last Ten Years .............................................................................. 135
Capital Asset Statistics by Function/Program – Last Ten Years .......................................................................... 136

Introductory Section
The Somerville Public Libraries were constructed with the assistance of funds from Andrew Carnegie. The West Branch, completed in 1909, was designed by Maclean and Wright. It is a fine example of the Neoclassical
architecture of the early 20th century and a civic landmark in the Davis Square area. The West Branch Library is scheduled to be renovated beginning in the Winter of 2018/2019.
Photo by Rie Lowenstein

City of Somerville, Massachusetts 1 Comprehensive Annual Financial Report
Introductory Section

City of Somerville, Massachusetts 2 Comprehensive Annual Financial Report
City of Somerville, Massachusetts Joseph A. Curtatone
MAYOR Letter of Transmittal January 25, 2019 We are pleased to submit to you the Comprehensive Annual Financial Report (CAFR) of the City of Somerville (City) for the year ended June 30, 2018. The CAFR is prepared by the City's Finance Department, and is intended to provide information regarding the financial position of the City. This report is prepared in accordance with U.S. generally accepted accounting principles (GAAP) and meets all requirements of state finance law of the Commonwealth of Massachusetts. The responsibility for the accuracy, completeness, and fairness of the data presented, including disclosures, rests with the City. City management believes this report is accurate in all material respects and is presented in a manner which impartially sets forth the financial position and results of operations of the City. Management is also responsible for establishing and maintaining internal accounting controls designed to provide reasonable, but not absolute, assurance that these financial statements are complete and accurate in their presentation. The Commonwealth of Massachusetts, through Chapter 190 of the Acts of 1982, requires that the City undergo an annual audit performed by a firm of independent public accountants. The City has selected Powers & Sullivan, LLC, to perform the June 30, 2018, audit. The goal of the independent audit was to provide reasonable assurance that the financial statements of the City of Somerville for the year ended June 30, 2018, are free of material misstatements. The independent audit involved examining, on a test basis, evidence supporting the amounts and disclosures in the financial statements; assessing the accounting principles used and significant estimates made by management; and evaluating the overall financial statement presentation. The independent auditor concluded, based upon the audit, that there was a reasonable basis for rendering an unmodified opinion that the City of Somerville’s financial statements for the year ended June 30, 2018, are fairly presented in conformity with GAAP. The independent auditor’s report is presented as the first component of the financial section of this report. The independent audit of the financial statements of the City of Somerville was part of a broader, federally mandated “Single Audit” designed to meet the special needs of federal grantor agencies. The standards governing Single Audit engagements require the independent auditor to report not only on the fair presentation of the financial statements, but also on the audited government’s internal controls and compliance with legal requirements, with special emphasis on internal controls and legal requirements involving the administration of federal awards. These reports are available in the City of Somerville’s separately issued Single Audit Report. The City’s Single Audit report for the year ended June 30, 2018, included no instances of significant violations of the applicable laws and regulations reported. Generally accepted accounting principles require that management provide a narrative introduction, overview and analysis to accompany the basic

City of Somerville, Massachusetts 3 Comprehensive Annual Financial Report
financial statements in the form of an MD&A. This letter of transmittal is designed to complement the MD&A where the financial analysis is now presented. The City’s MD&A can be found immediately following the independent auditor’s report from Powers & Sullivan, LLC. GENERAL PROFILE Somerville is a city located in Middlesex County, Massachusetts, just two miles north of Boston. Occupying slightly more than four square miles and with a population of 81,360, including thriving immigrant communities from all over the world, Somerville is the most densely populated community in New England and one of the most ethnically diverse cities in the nation. Rich in both history and culture, the City boasts numerous intriguing historical sites, community spaces, businesses, and restaurants. Somerville was first settled in 1630 as a part of Charlestown, and was established as a town in 1842, when it was separated from the urbanizing Charlestown because it was still largely rural. Somerville was officially incorporated as a City in 1872 due to its growing population and increasing industrialization. By the early 1900s, Somerville itself had become a densely packed urban area. As a part of Charlestown, areas existing in modern-day Somerville were critical military positions in the American Revolution. The historic Powder House - now considered one of the most distinct pre-Revolutionary structures in Massachusetts - housed gunpowder for Revolutionary soldiers during the war. During British invasion, Somerville (then Charlestown) was part of the route ridden by Paul Revere on his famous "Midnight Ride." Finally, and most notably, Prospect Hill was the site of the raising of the first Grand Union Flag, under the orders of General George Washington, on January 1, 1776. Today, Somerville is an eclectic mix of blue-collar families, young professionals, growing and established families, college students, and recent immigrants from countries as varied as Brazil, Haiti, and Nepal. There are more than 50 spoken languages in Somerville schools. With a large immigrant population, Somerville celebrates its diversity through numerous events celebrating cultural traditions and holidays. Somerville is a diverse, dense, walkable, community. Given the City’s convenient location near numerous educational institutions, including three of the nation’s leading institutions of higher learning, Tufts, Harvard, and MIT, it comes as no surprise that college and graduate students make up almost one-fifth of the population. Somerville is defined by its city squares. Its large number of squares help mark neighborhood boundaries while also featuring bustling businesses and entertainment centers. The primary business districts of the city are Assembly Square, Davis Square, and Union Square. Additionally, Ball Square, Teele Square, and Magoun Square are popular destinations with their own history and unique storefronts. Each offers a mix of ethnic restaurants, bars, shops and small businesses to fit every taste and occasion. The City shares its southern border with Cambridge and the MBTA Red Line connects Davis Square to Cambridge and Boston. Somerville has a mayor-city council form of municipal government. The Board of Aldermen consists of 4 at-large (city-wide) positions and 7 ward representatives. Somerville has received national recognition as a model of innovation and efficiency for their 311 customer service helpline and SomerStat, a data-driven style of managing government services. Somerville was also the first community in Massachusetts to employ both a 311 customer service help line and a Connect-CTY mass outreach (reverse 911) program.

City of Somerville, Massachusetts 4 Comprehensive Annual Financial Report
QUALITY OF LIFE Somerville is home to a thriving arts community. Regular arts-related events, such as the annual "ArtBeat" festival, occur throughout the year. In addition, numerous galleries and music clubs showcase the talents of residents and others. Two major art studios, the Brickbottom Artists Building and the Joy Street Studios, are located in former industrial buildings in the Brickbottom District of the city. The Somerville Theatre, located in Davis Square, houses the Somerville branch of the Museum of Bad Art and plays host to the Independent Film Festival of Boston each spring. The Somerville Arts Council and Somerville Open Studios both host annual events involving the community in homegrown arts. The Somerville Public Schools (SPS) is a richly diverse school district that ranks as one of the top-performing urban districts in the Commonwealth. MCAS scores have continued to rise in the past several years and the district has maintained extraordinary overall growth, exceeding most other Massachusetts school districts. Somerville High School, a fully comprehensive high school that offers a rigorous core curriculum and one of the best Career and Technical Education (CTE) programs in the state, is the only MA urban high school to earn a Level I state accountability rating for five straight years. The district 4-year graduation rate has steadily improved to a current (2017) all-time high of 87.9% while the drop-out rate has continued to decline to all-time lows. (1.5% in the latest report,2017). SPS emphasizes supporting the “whole child” through a data-informed, collaborative system of support, and programs that ensure that every student has the opportunity to grow and succeed. A strong core curriculum is supplemented with equally strong visual and performing arts, world language, health and physical education, and a rich array of technology programs, as well as a plethora of extra-curricular activities. Recent investments in pre-K and afterschool programming help lay a solid educational foundation for students, and partnerships play a critical role in providing SPS students with the support they need to succeed in a global economy. Partners such as Biogen Foundation, Lesley STEAM, Teen Empowerment, Parts and Crafts, Groundwork Somerville, Breakthrough Greater Boston, Enroot, Citizen Schools, Beautiful Stuff Project, and others provide Somerville students with continuous hands-on support and opportunities for real-world connections and learning. The City has also overhauled its youth programs by hiring new directors, and reinstating lost programs and services. Programs include the SomerTime Day Camp, the Mayor's Summer Jobs Program, and a partnership with Teen Empowerment, the nationally known non-profit organization, to establish a broad-based teen leadership program. In 2008, the City of Somerville was selected by the America's Promise Alliance as one of the top 100 communities in the U.S. for youth programming and learning opportunities. Alternative transportation is also important to Somerville residents. The City was acknowledged by the National Association of City Transportation Officials as an affiliate member for its commitment to sustainable transportation initiatives. Additionally, the League of American Bicyclists ranked Somerville the number one city on the East coast and seventh in the nation in terms of bike commuting share in their 2016 annual report. The 2015 report showed an incredible 53.2% of all commuting trips made by bicycle, transit or walking – a metric which is only expected to increase with the extension of the MBTA’s Green Line through Somerville in the coming years. Nearly ten years ago in 2009, the Somerville community came together over the course of more than 50 meetings, visioning sessions, and workshops to hammer out a guiding document for the city. The resulting SomerVision plan includes more than 584 values-driven goals, policies, and actions ranging from housing, job, and open space creation to neighborhood preservation, transformational development, and transportation advances, and more. Since then, SomerVision and its metrics, goals, and priorities have served as the cornerstone of City policy and planning and City efforts to make Somerville an exceptional place to live, work, play, and raise a family. In the fall of 2018, the Mayor’s Office of Strategic Planning & Community Development announced SomerVision 2040, a process to revisit SomerVision 2030 and build in goals for 2040. This process is currently underway and the City is looking forward to a robust community process in the coming year.

City of Somerville, Massachusetts 5 Comprehensive Annual Financial Report
With its bright development future featuring new, mixed-use development projects, and innovative local government management, Somerville has been recognized as "the best run City in the Commonwealth" by the Boston Globe magazine. The National Civic League recognized Somerville as an All-America City in 2009 for outstanding civic accomplishments in innovation, inclusiveness, civic engagement, and cross sector collaboration to address pressing local challenges. In 2015, Somerville again received this award for engaging and supporting vulnerable boys and young men. ECONOMIC DEVELOPMENT Through the Mayor’s Office of Strategic Planning and Community Development (OSPCD), the City of Somerville has taken the lead role in planning and implementing major economic projects designed to increase the City’s tax base and create new jobs. Several major economic development activities are described below. Assembly Square Assembly Square is Somerville’s largest commercial and industrial district and is among a short list of sites with the greatest potential for development in the Metro Boston Area. Assembly Square is a 145-acre district located at the northeast corner of the City on the Boston border.
Source: u/vanhoosear on Flickr
Its location, less than 2.5 miles from downtown Boston and just two miles from Kendall Square in Cambridge, and existing transportation infrastructure make it one of the premier development sites in New England. Assembly Square is directly accessible from Interstate 93 and State Route 28. In December 2011, the MBTA commenced construction of the MBTA’s Orange Line in Assembly Square station and opened the station to riders in September of 2014. Assembly Square contains more than five acres of waterfront open space located along the banks of the Mystic River. To capitalize on these strengths, the City has undertaken an aggressive planning and redevelopment effort designed to convert this former industrial district to a transit-oriented, mixed-use “urban village”, using smart growth principles to maximize development potential. In May 2011, the developer Federal Realty Investment Trust (FRIT), the State, and the City entered into a Tri-Party Agreement that outlines roles and responsibilities to fund major infrastructure and sequence public and private development. Implementing a District Improvement Financing (DIF) strategy and a commitment from the Commonwealth to fund the Orange Line T Station were critical elements of the Agreement. The development at Assembly Row has been an astonishing success. Eight development blocks have been built, generating 860,000 square feet of office space, 500,000 square feet of retail, restaurant and entertainment space and over 1,000 new residential units. The development is highlighted the 750,000 square foot headquarters for Partners HealthCare, the largest medical group and employer in the Commonwealth. In 2013, Partners announced its intention to consolidate a dozen facilities around Boston under one roof in a state-of-the-art, signature building at Assembly. Today, 4,500 employees work at the Partners headquarters and the company has the opportunity to expand its presence and build a new, 400,000 square foot building at some point in the future. From a municipal finance perspective,

City of Somerville, Massachusetts 6 Comprehensive Annual Financial Report
the project has been just as successful. To date, the DIF-captured tax incremental revenue has significantly exceeded debt service payment amounts needed for infrastructure improvements at Assembly Square. Union Square
Union Square is the City’s second largest business district, known throughout the region as a multi-ethnic arts and dining destination. In 2004, the City worked with neighborhood residents, businesses, and property owners to create “Union Square Main Streets,” a non-profit community organization based on the National Main Street Center’s successful downtown revitalization model. In the past few years, the City has received a $415,000 grant from ArtPlace America as well as a $460,000 grant to fund the creation of “ArtFarm for Social Innovation” on the site of a former waste transfer station; a $42,000 grant for strategic planning for the development of City-owned properties in Union Square; over $1,000,000 in new state and federal Brownfields funding for parcels in the area; the initiation of a Saturday farmers market partially funded by a Robert Wood Johnson Grant, and the construction of two small urban parks to go along with the complete renovation of Lincoln Park just outside the square. The City has completed both a $24 million new elementary school at the edge of Union Square and a $21 million reconstruction of Somerville Avenue between Union and Porter Squares. In January 2015, a Full Funding Grant Agreement between the MBTA and the US Department of Transportation Federal Transportation Administration was signed. Under this FFGA, federal dollars have been committed to fund approximately one half of the Green Line Extension Project. In April 2009, the Board of Aldermen approved rezoning of the Union Square and Boynton Yards areas. In 2012, the City initiated a multi-year comprehensive planning process with goal of transforming Union Square back to its historic prominence as a major employment center. The centerpiece of this effort entails concentrating new mixed-used development around the new Union Square transit stop that will come along with the expansion of the MBTA Green Line. In 2012, the City and the Somerville Redevelopment Authority (SRA) approved the Union Square Urban Revitalization Plan that identified seven distinct parcels for major redevelopment. In 2014, the SRA selected Union Square Station Associates (US2) as the master developer for Union Square. A robust community planning process resulted in the Union Square Neighborhood Plan, adopted by the City’s Planning Board in May of 2016 as an amendment and implementation appendix to SomerVision. Union Square was rezoned in 2017 to reflect the goals of the plan. The Somerville Planning Board approved US2’s Coordinated Development Special Permit in December of 2017, which entitles US2’s 2.3 million square foot development program that includes housing, retail, office and lab space. The first phase of construction is expected in 2019. Concurrently, the City began work with the community to develop a comprehensive infrastructure plan for Union Square. Conceptual plans were developed in 2012 and seek to balance traffic flow in the context of quality of life, future development, greater design goals, and the introduction of MBTA light rail. The project will see the reconstruction of two major arterials through the square, continuation of the newly separated Somerville Avenue storm and sanitary sewer lines, and significant expansion of the public plaza. In the fall of 2017, the administration submitted to the Board of Aldermen for their approval a DIF financing plan for $141 million in infrastructure and streetscape projects that will both help alleviate existing flooding issues for two-thirds of the city as well as unlock development potential in the district. In December of 2017, the Board of Alderman approved the DIF financing plan as well as the first phase of projects, which includes a $63 million authorization for Somerville Ave water, sewer and streetscape work. These projects are currently underway.

City of Somerville, Massachusetts 7 Comprehensive Annual Financial Report
Union Square has recently become an emerging center for tech-focused business development. Greentown Labs relocated to a facility just outside of Union Square in 2012 to occupying a 33,000 square-foot within a converted envelope factory. The location offers a prototyping lab, co-located office space, machine and electronics shops, and a developing community of startups looking to rapidly grow and progress new products in the clean energy industry. In 2018, Greentown Labs opened up its Global Center for Cleantech Innovation next door, which increased its facilities to 93,000 square feet – making Greentown the largest clean technology incubator in the United States. The facility has helped over 170 startups to date and helps to attract millions in new investment each year for its resident firms. This allows Somerville to stake its claim as a global hub for the clean technology industry. Boynton Yards Inner Belt/Brickbottom The extension of the Green Line into Union Square has generated new interest in Boynton Yards; the transit stop lies in the northwest corner of the 35-acre district. In April 2009, the Board of Aldermen approved a rezoning of this important development area and much of Boynton Yards is now located in a Transit Oriented District (TOD), which allows for maximum density and building heights. The City contracted with Parsons Brinckerhoff to conduct a transportation and utility study of Boynton Yards as the first step in creating a new road network and utility infrastructure to support more intense commercial development. The study envisions significant long-term public and private investments in infrastructure allowing for transformational change in Boynton Yards. Through the focal point of the proposed MBTA Green Line Union Square Station, Boynton Yards and Union Square will develop a cohesive identity and become a regional destination for art, shopping and dining.
Inner Belt/Brickbottom The Inner Belt is a 160-acre manufacturing and warehouse district that is anticipated to transition to higher-end office and biotechnology uses. An off-ramp which was constructed as part of the Central Artery Project (the “Big Dig”) has improved regional automobile access to Inner Belt. To facilitate Inner Belt’s transition to higher-end uses, the City approved a significant privately-financed infrastructure investment to connect Inner Belt to the fiber optic loop around Boston and Cambridge. The location of this major communications node makes Inner Belt a very competitive location for technology-oriented businesses along with proximity to nearby Kendall Square in Cambridge. This district will benefit dramatically from the planned McGrath Highway Boulevard Project. The City has completed a formal study and is looking to undertake design work and environmental review associated with the long-term conversion of the elevated McCarthy overpass into an at-grade boulevard with “complete streets” style bicycle and pedestrian accommodations. Established employers, including ABM Industries, the Angelica Corporation, and the Cambridge Health Alliance continue to provide employment opportunities in Somerville. The City, working through OSPCD, has completed various studies, including a planning study that identified public actions necessary to facilitate transformation of this district to office and biotechnology uses. Access studies were completed in 2005 to predict the impact of economic development on traffic patterns in the Inner Belt. The City has been taking preliminary steps, with the assistance of Greenberg/CBT consultants to develop a comprehensive plan for the area. The Greenberg/CBT scoping study identified a build out potential of 2.5 million square feet of Lab/R&D, 3 million square feet of office, 200,000 square feet of retail space, 200-450 hotel rooms, and 3,000 residential units.

City of Somerville, Massachusetts 8 Comprehensive Annual Financial Report
Davis Square Davis Square is one of the City’s most vibrant central business districts. This commercial center is located close to Tufts University and anchored by an MBTA Red Line subway station. The combination of this district’s location and public transit access has resulted in strong demand for office, retail, restaurant and entertainment uses. Consequently, Davis Square has limited vacancy in the retail and office market segments. Davis Square has become a regional dining and entertainment destination with some of the Boston area’s finest restaurants, nightclubs, and live entertainment venues. The residential neighborhood surrounding Davis Square has seen dramatic increases in property values and rents, which has resulted in considerable new investment and condominium conversion. Future plans in Davis Square will focus on strategic infill development, streetscape updates or rehabilitation projects to enhance the already vibrant community. The Davis Square Neighborhood Plan is expected to be published in 2019. In May of 2014, the Mayors of Somerville, Cambridge, Boston, Quincy & Braintree launched the Life Sciences Corridor Initiative to promote the robust life sciences sector which has developed along the Red Line, including Davis Square. Together, the five cities represent over 460 companies within the life sciences industry, all connected through the MBTA Red Line. Transportation Improvements
Transportation investments are poised to remake Somerville. The City secured funding for a new Assembly Square Orange Line station using a combination of federal, state and private funding. The station was opened for use in September of 2014, the first new MBTA station since 1987. This investment has been a key to Assembly Square’s dramatic evolution. The Green Line Extension (GLX) promised an event bigger impact on urban mobility. When it’s completed in 2021, rapid transit will be within walking distance to 85% of Somerville’s residents and will also significantly improve the city’s air quality, connectivity, and economic
opportunity. The City is currently planning or undertaking multiple streetscape and roadway improvement projects which will increase multimodal mobility and continue to bring an infrastructure network built in the early 1900s into the 21st century. These projects include a full-depth reconstruction of Beacon St (One of the most heavily-trafficked stretches of road in the region by bicycle commuters), a streetscape and utility update in Davis Square, Central Broadway Streetscape upgrades, major Union Square utility work, and roadway improvements in Ball and Gilman Squares to prepare for the Green Line Extension. Altogether, these projects will continue to make Somerville one of the most bike and pedestrian-friendly communities in the Northeast while updating an underground infrastructure network built primarily in the 1800’s. FINANCIAL SUMMARY The City continues to be in sound financial condition as demonstrated by the financial statements and schedules included in this report. Throughout the year, the City maintained a strong cash and investment position and once again did not issue any tax anticipation notes.
Source: u/Pi.1415926535 on Wikipedia
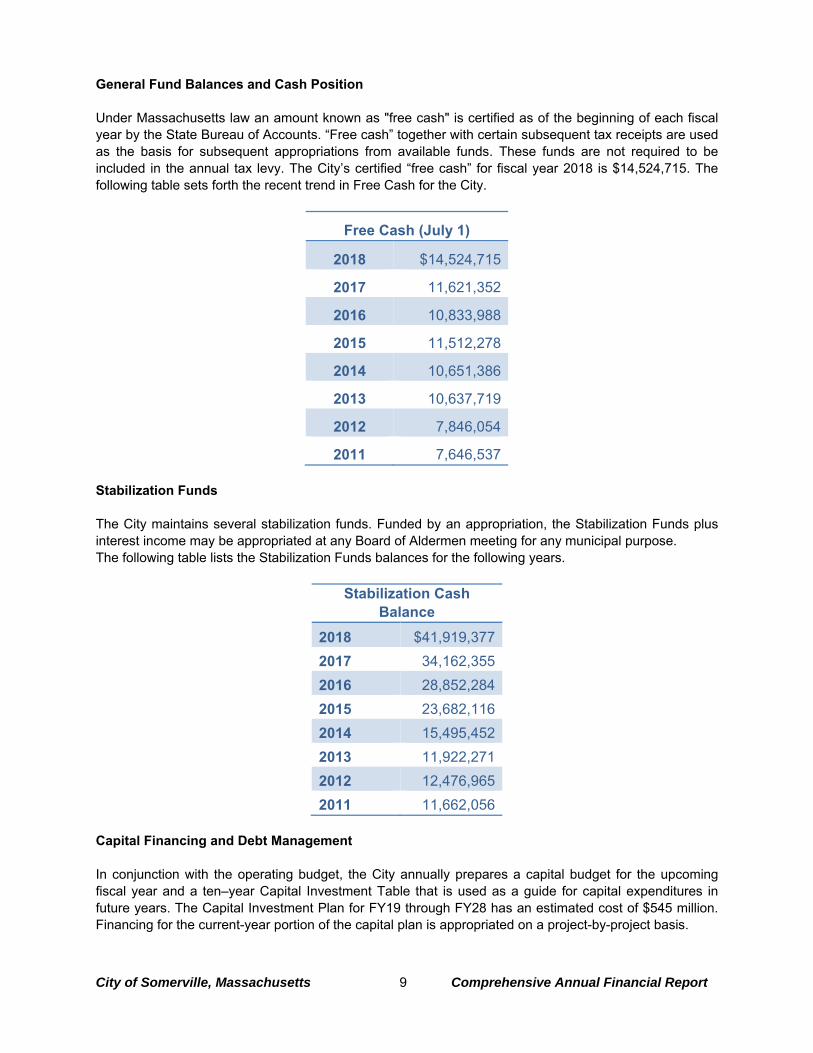
City of Somerville, Massachusetts 9 Comprehensive Annual Financial Report
General Fund Balances and Cash Position Under Massachusetts law an amount known as "free cash" is certified as of the beginning of each fiscal year by the State Bureau of Accounts. “Free cash” together with certain subsequent tax receipts are used as the basis for subsequent appropriations from available funds. These funds are not required to be included in the annual tax levy. The City’s certified “free cash” for fiscal year 2018 is $14,524,715. The following table sets forth the recent trend in Free Cash for the City.
Free Cash (July 1)
2018 $14,524,715
2017 11,621,352
2016 10,833,988
2015 11,512,278
2014 10,651,386
2013 10,637,719
2012 7,846,054
2011 7,646,537 Stabilization Funds The City maintains several stabilization funds. Funded by an appropriation, the Stabilization Funds plus interest income may be appropriated at any Board of Aldermen meeting for any municipal purpose. The following table lists the Stabilization Funds balances for the following years.
Stabilization Cash Balance
2018 $41,919,377
2017 34,162,355
2016 28,852,284
2015 23,682,116
2014 15,495,452
2013 11,922,271
2012 12,476,965
2011 11,662,056 Capital Financing and Debt Management In conjunction with the operating budget, the City annually prepares a capital budget for the upcoming fiscal year and a ten–year Capital Investment Table that is used as a guide for capital expenditures in future years. The Capital Investment Plan for FY19 through FY28 has an estimated cost of $545 million. Financing for the current-year portion of the capital plan is appropriated on a project-by-project basis.

City of Somerville, Massachusetts 10 Comprehensive Annual Financial Report
The City issues its debt in accordance with the life of the asset. In addition, the City has funded a portion of its Capital Improvement Program on a “pay-as-you-go” basis out of current revenues. The City’s General Obligation (GO) outstanding bonded debt as of June 30, 2018, totaled $108.7 million. The following table sets forth debt as a percentage of assessed valuation and per capita debt at the end of the last five fiscal years. The table considers the principal amount of GO bonds of the City only and does not deduct anticipated state grant payments applicable to the principal amount of outstanding bonds or debt that may be supported in whole, or part, by non-tax revenues.
Year End
General Obligation Bonds
Outstanding
Local Assessed Valuation
Per Capita Debt
Bonds as a % of Assessed
Valuation
2018 $108,719,425 $13,790,756,930 $1,336 0.78
2017 106,688,839 12,660,529,500 1,312 0.84
2016 104,244,459 11,198,774,270 1,298 0.93
2015 95,151,544 10,492,225,280 1,206 0.91
2014 96,283,023 9,445,672,400 1,222 1.02
2013 97,615,491 8,595,335,050 1,275 1.14
2012 90,422,762 8,390,572,190 1,186 1.08
2011 81,971,701 8,297,876,320 1,079 0.99 Property Valuations Based on valuations of all real and personal property as of January 1, 2017, the total value of all property in the City is $13.8 billion. Professional reevaluations of all property in the City to full and fair cash value in compliance with Massachusetts law were mostly recently completed for use in 2018. The next reevaluation will be completed in 2021. The City conducts an interim year adjustment on values annually. The table below sets forth the trend in the City's assessed valuations, tax rates, tax levies, and tax levies per capita for the following years.
FY Real Estate
Valuation
Personal Property
Valuation Assessed Valuation
Tax Rate Per $1,000
Valuation
Tax Levy
Tax Levy
Per Capita Resid.
All other
2018 $13,524,586,100 $266,170,830 $13,790,756,930 $11.31 $18.21 $143,491,095 $1,763
2017 12,409,326,300 251,203,200 12,660,529,500 11.67 18.81 136,071,683 1,675
2016 10,974,792,900 223,981,370 11,198,774,270 12.53 20.18 129,147,863 1,608
2015 10,276,528,400 215,696,880 10,492,225,280 12.61 20.38 122,165,461 1,548
2014 9,246,622,500 199,049,900 9,445,672,400 12.66 21.51 116,126,060 1,473
2013 8,409,496,900 185,838,150 8,595,335,050 13.42 22.38 109,923,036 1,446
2012 8,212,040,400 178,531,790 8,390,572,190 13.09 21.85 104,829,090 1,383
2011 8,132,444,500 165,431,820 8,297,876,320 12.71 21.21 100,548,992 1,327

City of Somerville, Massachusetts 11 Comprehensive Annual Financial Report
Pension Liability Generally accepted accounting principles (GAAP) require the City to perform an actuarial valuation to determine the pension benefit obligation at least biennially, with an actuarial update to the date twelve months after that biennial valuation. The most recent actuarial valuation of the City was completed as of January 1, 2017. The total unfunded pension benefit obligation applicable to the City's employees was $115,186,814 at December 31, 2017. Total pension benefit obligation $402,269,188 Net Position available for benefits, at market value (279,217,264) Unfunded pension benefit obligation $123,051,924 The City is currently on a funding schedule that will amortize its unfunded pension liability by June 30, 2033. Current law allows funding out as far as 2040. In addition to the contributory systems, cities and towns provide non-contributory pensions to a limited number of employees, primarily persons who entered service prior to July 1, 1937, and their dependents. The annual required contributions of the City to the retirement system for the 2011 through 2018 fiscal years are as follows:
Year Contributory Non-
Contributory 2018 $13,808,937 $134,096 2017 13,711,675 121,197 2016 13,304,274 119,000 2015 12,324,940 255,023 2014 11,457,093 234,769 2013 11,084,135 231,999 2012 10,985,945 283,996 2011 10,830,988 333,431

City of Somerville, Massachusetts 12 Comprehensive Annual Financial Report
Other Post-Employment Benefits (OPEB) Liability In addition to pension benefits, cities and towns may provide retired employees with health care and life insurance benefits. The portion of the cost of such benefits paid by cities and towns is generally provided on a pay-as-you-go basis. The pay-as-you-go costs to the City for such benefits in recent years have been as follows:
Year Amount
2018 $8,485,245
2017 9,258,566
2016 8,533,496
2015 9,645,790
2014 9,044,970
2013 10,402,192
2012 10,036,871
2011 10,200,914 The City implemented GASB Statement #75 in 2018 and recognized an unfunded OPEB liability of $268,631,545. The City's annual required contribution (ARC) totaled $22,034,131 on a pay-as-you-go basis and $14,251,067 on a full prefunding basis. INDEPENDENT AUDIT The City’s financial records, books of accounts, and financial transactions are audited each year by an independent firm of certified public accountants. The City’s annual audit was performed by the independent public accounting firm of Powers & Sullivan, LLC. The independent auditors’ report on the basic financial statements for the year ended June 30, 2018 is included herein. AWARDS AND ACKNOWLEDGEMENTS The Government Finance Officers Association of the United States and Canada (GFOA) awarded a Certificate of Achievement for Excellence in Financial Reporting to the City of Somerville for its comprehensive annual financial report since fiscal year 2012, six years in a row that the City has achieved this prestigious award. Additionally, the City’s FY14 through FY18 annual operating budgets received the Distinguished Budget Presentation Award. In order to be awarded a Certificate of Achievement, a government must publish an easily readable and efficiently organized comprehensive annual financial report or budget. This report must satisfy both generally accepted accounting principles and applicable legal requirements. A Certificate of Achievement is valid for a period of one year only. We believe that our current Comprehensive Annual Financial Report continues to meet Certificate of Achievement Program’s requirements and will be submitting it to the GFOA to determine its eligibility for another certificate.

City of Somerville, Massachusetts 13 Comprehensive Annual Financial Report
MOVING FORWARD The City will continue the necessary work of growing our commercial tax base. The long-term outlook for Somerville remains very strong as long as we continue to manage our resources wisely. Both our bond rating and our development prospects have been buttressed by the City’s effort to develop comprehensive and coordinated plans to make the most of coming transit improvements and new investments in retail, commercial and residential growth. While no community can be fully insulated from continued turbulence in the national and regional economies, Somerville is well positioned to preserve its high level of municipal services while preparing for future economic development. We are governing in the present with an eye on our future. Sincerely,
Mayor Joseph A. Curtatone

City of Somerville, Massachusetts 14 Comprehensive Annual Financial Report
Certificate of Achievement for Excellence in Financial Reporting

City of Somerville, Massachusetts 15 Comprehensive Annual Financial Report
Distinguished Budget Presentation Award

City of Somerville, Massachusetts 16 Comprehensive Annual Financial Report
Organizational Chart
OrganizationalChart

City of Somerville, Massachusetts 17 Comprehensive Annual Financial Report
Principal Officials
CityGovernment
JosephA.Curtatone,Mayor
EdwardBean,FinanceDirector
ColleenTam,DeputyCityAuditor
MichaelMastrobuoni,BudgetManager
BoardofAldermen
KatjanaBallantyne,President,Ward7
MatthewC.McLaughlin,VicePresident,Ward1 StephanieHirsch,At‐large
WilfredN.Mbah,At‐large
MaryJoRossetti,At‐large
WilliamA.WhiteJr,At‐large
JeffersonThomasScott,Ward2
BenEwen‐Campen,Ward3
JesseClingan,Ward4
MarkNiedergang,Ward5
LanceL.Davis,Ward6

City of Somerville, Massachusetts 18 Comprehensive Annual Financial Report
This page intentionally left blank.

Financial Section
Nathan Tufts Park near Davis Square, was added to the National Register of Historic Places in 1975, the first of many landmarks in Somerville to be added. The City of Somerville designated the park a local historic
district in 1985. Photo taken by Rie Lowenstein

City of Somerville, Massachusetts 19 Comprehensive Annual Financial Report
Financial Section

City of Somerville, Massachusetts 20 Comprehensive Annual Financial Report
This page intentionally left blank.

City of Somerville, Massachusetts 21 Comprehensive Annual Financial Report
Independent Auditor’s Report To the Honorable Mayor and Board of Alderman City of Somerville, Massachusetts Report on the Financial Statements We have audited the accompanying financial statements of the governmental activities, the business-type activities, each major fund, and the aggregate remaining fund information of the City of Somerville, Massachusetts, as of and for the year ended June 30, 2018, (except for the Somerville Contributory Retirement System which is as of and for the year ended December 31, 2017), and the related notes to the financial statements, which collectively comprise the City’s basic financial statements as listed in the table of contents. Management’s Responsibility for the Financial Statements Management is responsible for the preparation and fair presentation of these financial statements in accordance with accounting principles generally accepted in the United States of America; this includes the design, implementation, and maintenance of internal control relevant to the preparation and fair presentation of financial statements that are free from material misstatement, whether due to fraud or error. Auditor’s Responsibility Our responsibility is to express opinions on these financial statements based on our audit. We conducted our audit in accordance with auditing standards generally accepted in the United States of America and the standards applicable to financial audits contained in Government Auditing Standards, issued by the Comptroller General of the United States. Those standards require that we plan and perform the audit to obtain reasonable assurance about whether the financial statements are free of material misstatement. An audit involves performing procedures to obtain audit evidence about the amounts and disclosures in the financial statements. The procedures selected depend on the auditor’s judgment, including the assessment of the risks of material misstatement of the financial statements, whether due to fraud or error. In making those risk assessments, the auditor considers internal control relevant to the entity’s preparation and fair presentation of the financial statements in order to design audit procedures that are appropriate in the circumstances, but not for the purpose of expressing an opinion on the effectiveness of the entity’s internal control. Accordingly, we express no such opinion. An audit also includes evaluating the appropriateness of accounting policies used and the reasonableness of significant accounting estimates made by management, as well as the evaluating the overall presentation of the financial statements. We believe that the audit evidence we have obtained is sufficient and appropriate to provide a basis for our audit opinions. Opinions In our opinion, the financial statements referred to above present fairly, in all material respects, the respective financial position of the governmental activities, the business-type activities, each major fund, and the aggregate remaining fund information of the City of Somerville, Massachusetts, as of June 30, 2018 (except for the Somerville Contributory Retirement System which is as of December 31, 2017), and the respective changes in financial position and, where applicable, cash flows thereof for the year then ended in accordance with accounting principles generally accepted in the United States of America.
City of Somerville, Massachusetts 22 Comprehensive Annual Financial Report
Other Matters Required Supplementary Information Accounting principles generally accepted in the United States of America require that the management’s discussion and analysis and required supplementary information, as listed in the table of contents, be presented to supplement the basic financial statements. Such information, although not a part of the basic financial statements, is required by the Governmental Accounting Standards Board who considers it to be an essential part of financial reporting for placing the basic financial statements in an appropriate operational, economic, or historical context. We have applied certain limited procedures to the required supplementary information in accordance with auditing standards generally accepted in the United States of America, which consisted of inquiries of management about the methods of preparing the information and comparing the information for consistency with management’s responses to our inquiries, the basic financial statements, and other knowledge we obtained during our audit of the basic financial statements. We do not express an opinion or provide any assurance on the information because the limited procedures do not provide us with sufficient evidence to express an opinion or provide any assurance. Other Information Our audit was conducted for the purpose of forming opinions on the financial statements that collectively comprise the City of Somerville’s basic financial statements. The introductory section, combining and individual fund statements, and statistical sections are presented for purposes of additional analysis and are not a required part of the basic financial statements. The combining and individual fund statements, as listed in the table of contents, are the responsibility of management and were derived from and relates directly to the underlining accounting and other records used to prepare the basic financial statements. Such information has been subjected to the auditing procedures applied in the audit of the basic financial statements and certain additional procedures, including comparing and reconciling such information directly to the underlying accounting and other records used to prepare the basic financial statements or to the basic financial statements themselves, and other additional procedures in accordance with auditing standards generally accepted in the United States of America. In our opinion, the combining and individual fund statements are fairly stated, in all material respects, in relation to the basic financial statements as a whole. The introductory and statistical sections have not been subjected to the auditing procedures applied in the audit of the basic financial statements, and accordingly, we do not express an opinion or provide any assurance on them. Other Reporting Required by Government Auditing Standards In accordance with Government Auditing Standards, we have also issued our report dated January 25, 2019, on our consideration of the City of Somerville, Massachusetts’ internal control over financial reporting and on our tests of its compliance with certain provisions of laws, regulations, contracts, and grant agreements and other matters. The purpose of that report is to describe the scope of our testing of internal control over financial reporting and compliance and the results of that testing, and not to provide an opinion on internal control over financial reporting or on compliance. That report is an integral part of an audit performed in accordance with Government Auditing Standards in considering the City of Somerville’s internal control over financial reporting and compliance.
January 25, 2019

City of Somerville, Massachusetts 23 Comprehensive Annual Financial Report
Management’s Discussion and Analysis
Management’s Discussion and Analysis

City of Somerville, Massachusetts 24 Comprehensive Annual Financial Report
Management’s Discussion and Analysis As management of the City of Somerville, we offer readers of these financial statements this narrative overview and analysis of the financial activities for the year ended June 30, 2018. We encourage readers to consider the information presented in this report in conjunction with additional information that we have furnished in our letter of transmittal. The Governmental Accounting Standards Board (GASB) is the authoritative standard setting body that provides guidance on how to prepare financial statements in conformity with generally accepted accounting principles (GAAP). Users of these financial statements (such as investors and rating agencies) rely on the GASB to establish consistent reporting standards for all governments in the United States. This consistent application is the only way users (including citizens, the media, legislators and others) can assess the financial condition of one government compared to others. Overview of the Financial Statements This discussion and analysis is intended to serve as an introduction to the City of Somerville’s basic financial statements. The City of Somerville’s basic financial statements comprise three components: 1) government-wide financial statements, 2) fund financial statements, and 3) notes to the financial statements. The approach focuses on both the City as a whole (government-wide) and the fund financial statements. The government-wide financial statements provide both long-term and short-term information about the City as a whole. The fund financial statements focus on the individual parts of the City government, reporting the City’s operations in more detail than the government-wide statements. Both presentations (government-wide and fund) allow the user to address relevant questions, broaden the basis of comparison and enhance the City’s accountability. An additional part of the basic financial statements are the notes to the financial statements. This report also contains other supplementary information in addition to the basic financial statements themselves. Government-wide financial statements. The government-wide financial statements are designed to provide readers with a broad overview of the City of Somerville’s finances, in a manner similar to a private-sector business. The statements provide both short-term and long-term information about the City’s financial position, which assists in assessing the City’s economic position at the end of the year. The statements are prepared using the full accrual basis of accounting. All revenues and expenses connected with the year are considered even if the cash involved has not been received or disbursed. The government-wide financial statements include two statements: The statement of net position presents information on all of the City of Somerville’s assets and deferred outflows and liabilities and deferred inflows, with the difference between them reported as net position. Over time, increases or decreases in net position may serve as a useful indicator of whether the financial position of the City of Somerville is improving or deteriorating. The statement of activities presents information showing how the government’s net position changed during the most recent year. All changes in net position are reported as soon as the underlying event giving rise to the change occurs, regardless of the timing of related cash flows. Thus, revenues and expenses are reported in this statement for some items that will only result in cash flows in future periods (e.g., uncollected taxes and earned but unused vacation leave). Both of the government-wide financial statements distinguish functions of the City of Somerville that are principally supported by taxes and intergovernmental revenues (governmental activities) from other functions that are intended to recover all or a significant portion of their costs through user fees and charges (business-type activities). The governmental activities of the City of Somerville include general government, public safety, education, public works, community development, human services, community preservation, culture and

City of Somerville, Massachusetts 25 Comprehensive Annual Financial Report
recreation, and interest. The business-type activities include water, sewer, the Veteran’s Memorial Ice Rink and Dilboy Stadium. Fund financial statements - A fund is a grouping of related accounts that is used to maintain control over resources that have been segregated for specific activities or objectives. The City of Somerville, like other state and local governments, uses fund accounting to ensure and demonstrate compliance with finance-related legal requirements. All of the funds of the City of Somerville can be divided into three categories: governmental funds, proprietary funds and fiduciary funds. Governmental funds - Governmental funds are used to account for essentially the same functions reported as governmental activities in the government-wide financial statements. However, unlike the government-wide financial statements, governmental fund financial statements focus on near-term inflows and outflows of spendable resources, as well as on balances of spendable resources available at the end of the year. Such information may be useful in evaluating a government’s near-term financing requirements. Because the focus of governmental funds is narrower than that of the government-wide financial statements, it is useful to compare the information presented for governmental funds with similar information presented for governmental activities in the government-wide financial statements. By doing so, readers may better understand the long-term impact of the government’s near-term financing decisions. Both the governmental fund balance sheet and the governmental fund statement of revenues, expenditures, and changes in fund balances provide a reconciliation to facilitate this comparison between governmental funds and governmental activities. The City of Somerville maintains seventeen individual governmental funds. Information is presented separately for the general fund, the strategic planning and community development fund and the capital projects fund in the governmental fund balance sheet and the governmental fund statement of revenues, expenditures, and changes in fund balances. Data for certain governmental funds are combined into a single aggregated presentation under the caption nonmajor governmental funds. The City of Somerville adopts an annual appropriated budget for its general fund. A budget to actual schedule has been provided as required supplementary information for the general fund to demonstrate compliance with this budget. Proprietary funds. Proprietary funds provide the same information shown as business-type activities in the government wide financial statements, only in more detail. The City uses proprietary funds to account for its water, sewer, Veteran’s Memorial Ice Rink and Dilboy Stadium operations. Fiduciary funds. Fiduciary funds are used to account for resources held for the benefit of parties outside the government. Fiduciary funds are not reflected in the government-wide financial statement because the resources of those funds are not available to support the City of Somerville’s own programs. The accounting used for fiduciary funds records transactions using the flow of economic resources measurement focus and the accrual basis of accounting. The fiduciary fund financial statements provide information for the pension and Other Employee Benefits trust funds and the private purpose trust funds. All other fiduciary funds are combined into a single, aggregate presentation in the fiduciary fund financial statements under the caption agency funds. The City implemented GASB Statement No. 75, Accounting and Financial Reporting for Postemployment benefits Other Than Pensions. As a result, the net postemployment benefit liability was recognized, beginning balances were revised and additional footnote disclosures and required supplementary information were added to the report. See Note 12 for more information.

City of Somerville, Massachusetts 26 Comprehensive Annual Financial Report
The City established an Other Postemployment Benefits Trust Fund (OPEB) to account for funds set aside to help offset future post-employment benefits for retirees. These activities are excluded from the City’s government-wide financial statements because the City cannot use these assets to finance its operations. At year end, the balance in the OPEB trust fund was $7.3 million. Notes to the financial statements. The notes provide additional information that is essential to a full understanding of the data provided in the government-wide and fund financial statements. Other information. In addition to the basic financial statements and accompanying notes, this report also presents certain required supplementary information concerning the City of Somerville’s budgetary basis of accounting and information regarding other postemployment benefits paid by the City. Required supplementary information can be found after the notes to the financial statements. Government-wide Financial Analysis As noted earlier, net position may serve over time as a useful indicator of a government’s financial position. The City of Somerville’s assets and deferred outflows of resources were exceeded by liabilities and deferred inflows of resources by $89.4 million at the close of 2018, which was an increase of $28.9 million from the prior year balances. Net position of $184.6 million reflects its investment in capital assets (e.g., land, buildings, infrastructure, machinery, and equipment); less any related debt used to acquire those assets that are still outstanding. The City uses these capital assets to provide services to citizens; consequently, these assets are not available for future spending. Although the investment in its capital assets is reported net of its related debt, it should be noted that the resources needed to repay this debt must be provided from other sources, since the capital assets themselves cannot be used to liquidate these liabilities. An additional portion of net position, $43.2 million, represents resources that are subject to external restrictions on how they may be used. The remaining balance of unrestricted net position has a year-end deficit of $317.2 million. The primary reason for this deficit balance is the recognition of the Pension and OPEB liabilities. At year-end, the City is able to report positive balances in two of three categories of net position, for the City as a whole and for its governmental activities. Its business-type activities report positive balances in both applicable categories. The governmental activity and business-type activity components are presented on the following pages. As noted earlier, net position may serve over time as a useful indicator of a government’s financial position. In the case of the City of Somerville, governmental liabilities and deferred inflows of resources exceeded assets and deferred outflows of resources by $161.3 million and the business-type assets and deferred outflows of resources exceeded liabilities and deferred inflows of resources by $71.9 million at the close of the most recent year. Governmental Activities The City of Somerville’s liabilities and deferred inflows of resources exceeded assets and deferred outflows of resources by $161.3 million at the close of 2018.

City of Somerville, Massachusetts 27 Comprehensive Annual Financial Report
20172018 (As Revised)
Assets:Current assets…………………………………………… $ 195,405,981 $ 152,104,713 Noncurrent assets (excluding capital)………………… 5,588,124 3,517,440 Capital assets, nondepreciable………………………… 92,936,623 53,391,868 Capital assets, net of accumulated depreciation……… 176,126,610 178,924,960
Total assets…………………………………………… 470,057,338 387,938,981
Deferred outflows of resources…………………………… 1,974,980 22,929,752
Liabilities: Current liabilities (excluding debt)……………………… 15,257,419 9,443,777 Noncurrent liabilities (excluding debt)………………… 384,664,714 443,215,945 Current debt……………………………………………… 97,450,927 46,653,925 Noncurrent debt…………………………………………… 98,832,554 93,812,752
Total liabilities……………………………………… 596,205,614 593,126,399
Deferred inflows of resources…………………………… 37,171,890 2,357,303
Net position: Net investment in capital assets………………………… 138,950,212 128,346,108 Restricted………………………………………………… 43,189,284 26,765,236 Unrestricted……………………………………………… (343,484,682) (339,726,313)
Total net position……………………………………$ (161,345,186) $ (184,614,969)
The largest portion of the City of Somerville’s net position, $139.0 million, reflects its investment in capital assets (e.g., land, buildings, machinery, and equipment) less any related debt used to acquire those assets that is still outstanding. The City uses these capital assets to provide services to its citizens; consequently, these assets are not available for future spending. Although the City of Somerville’s investment in its capital assets is reported net of related debt, it should be noted that resources needed to repay this debt must be provided from other sources, since the capital assets themselves cannot be used to liquidate these liabilities. An additional portion of the City of Somerville’s net position, $43.2 million, represents resources that are subject to external restrictions on how they may be used. These include funds for street improvement (Chapter 90), community development projects to be funded by future federal reimbursements, outstanding loan balance authorized under various housing and urban development federal grants, expendable and nonexpendable funds and grants and gifts. The City has $76.3 million of positive unrestricted net position excluding the recorded liabilities for the other postemployment benefits obligation and the net pension liability, along with the associated deferred outflows/inflows. Those liabilities are long-term in nature, and will not be funded from the $343.5 million deficit of unrestricted net position at June 30, 2018. The City began the process of pre-funding a portion of the OPEB liability in 2013 by establishing an irrevocable trust which, as of June 30, 2018, has a balance of $7.3 million and is reported within the Fiduciary Funds in the City’s financial statements. Included within the noncurrent assets (excluding capital) is $5.5 million in future school construction reimbursement grants.

City of Somerville, Massachusetts 28 Comprehensive Annual Financial Report
Long-term liabilities include $98.8 million in general obligation bonds; $3.5 million in compensated absence liabilities for unused vacation, special leave, and enhanced longevity benefits payable; $691,000 in future year workers’ compensation benefits payable; $113.7 million in future pension benefits; and $266.8 million in future other postemployment benefits. Governmental activities net position increased by $23.3 million in 2018.
20172018 (As Revised)
Program Revenues:
Charges for services……………………………………………$ 33,414,711 $ 26,958,884
Operating grants and contributions…………………………… 62,086,194 59,892,628
Capital grants and contributions……………………………… 14,224,905 2,039,456
General Revenues:
Real estate and personal property taxes,
net of tax refunds payable………………………………… 141,935,979 135,251,425 Tax and other liens…………………………………………… 159,603 201,283 Motor vehicle and other excise taxes………………………… 10,032,977 9,316,095 Community preservation tax………………………………… 1,794,508 1,664,815 Penalties and interest on taxes……………………………… 869,868 729,944 Payments in lieu of taxes……………………………………… 1,327,790 1,248,682 Grants and contributions not restricted to
specific programs…………………………………………… 26,368,477 25,455,469 Unrestricted investment income……………………………… 1,407,965 496,273 Gain (loss) on sale of capital assets………………………… 3,911 2,031,564 Miscellaneous…………………………………………………… 537,703 184,008
Total revenues…………………………………………… 294,164,591 265,470,526
Expenses: General government…………………………………………… 39,372,354 42,466,048
Public safety…………………………………………………… 54,307,824 58,162,943
Education……………………………………………………… 128,921,395 124,569,560
Public works…………………………………………………… 30,766,736 31,017,577
Community development……………………………………… 4,556,946 9,696,020
Health and human services…………………………………… 279,442 244,418
Culture and recreation………………………………………… 5,843,577 5,245,570 Community preservation……………………………………… 4,207,687 1,522,282 Interest…………………………………………………………… 3,727,244 3,563,654
Total expenses…………………………………………… 271,983,205 276,488,072
Excess (Deficiency) before transfers………………………… 22,181,386 (11,017,546)
Transfers…………………………………………………………… 1,088,397 (345,056)
Change in net position…………………………………………… 23,269,783 (11,362,602)
Net position, beginning of year (as revised)………………… (184,614,969) (173,252,367)
Net position, end of year…………………………………………$ (161,345,186) $ (184,614,969)

City of Somerville, Massachusetts 29 Comprehensive Annual Financial Report
The primary reasons for the $23.3 million increase relates to a decrease of $33.6 million and $24.8 million in the City’s OPEB liability and net pension liability, respectfully, and the recognition of $14.2 million of capital grants. These increases were offset by a net increase of $55.9 million in deferred outflows and deferred inflows of resources related to pensions and other postemployment benefits, and the fact that depreciation exceeded principal payments by $4.0 million. Real estate and personal property tax revenue increased $6.5 million due to new tax base growth and the proposition 2 ½ budgetary increase. General government expenses decreased by $4.5 million, which was primarily the result of decreases in pension and other postemployment benefit costs. Education expenses increased by $4.4 million, this increase is due to an increase in on-behalf payments associated with the Massachusetts Teachers’ Retirement System, as well as an increase in the School’s operating budget. Public works expenses decreased by $251,000, this decrease relates directly to a decrease in the operational costs of the Department. Community Development expenses decreased $5.1 million as a result of decreased activity in the various loan programs and other program related costs. Business-type Activities The following summarizes the key financial components of the City’s Business-type Activities:
20172018 (As Revised)
Assets:Current assets…………………………………………… $ 53,784,520 $ 32,705,597 Capital assets, nondepreciable………………………… 2,500,332 22,244 Capital assets, net of accumulated depreciation……… 59,346,990 56,727,823
Total assets…………………………………………… 115,631,842 89,455,664
Deferred outflows of resources…………………………… 273,955 278,430
Liabilities: Current liabilities (excluding debt)……………………… 925,419 271,664 Noncurrent liabilities (excluding debt)………………… 3,392,895 4,150,865 Current debt……………………………………………… 31,697,683 10,802,790 Noncurrent debt…………………………………………… 7,498,161 8,147,921
Total liabilities……………………………………… 43,514,158 23,373,240
Deferred inflows of resources…………………………… 471,426 29,053
Net position: Net investment in capital assets………………………… 45,635,475 46,081,442 Unrestricted……………………………………………… 26,284,738 20,250,359
Total net position……………………………………$ 71,920,213 $ 66,331,801
Business-type net position of $45.6 million represents investments in capital assets net of related debt. The remaining $26.3 million is available to be used for the ongoing operation of the City’s water, Veteran’s Memorial Ice Rink, Dilboy Stadium, and sewer activities. There was an overall increase of $5.6 million in net position reported in connection with the enterprise funds.

City of Somerville, Massachusetts 30 Comprehensive Annual Financial Report
20172018 (As Revised)
Program Revenues:Charges for services……………………………………………$ 37,290,669 $ 36,406,067
General Revenues: Unrestricted investment income……………………………… 270,925 160,353
Total revenues…………………………………………… 37,561,594 36,566,420
Expenses: Water…………………………………………………………… 11,417,358 11,166,299 Sewer…………………………………………………………… 18,610,157 18,106,483 Veteran's Memorial Ice Rink………………………………… 713,303 679,098 Dilboy Stadium………………………………………………… 143,967 154,881
Total expenses…………………………………………… 30,884,785 30,106,761
Excess (Deficiency) before transfers………………………… 6,676,809 6,459,659
Transfers…………………………………………………………… (1,088,397) 345,056
Change in net position…………………………………………… 5,588,412 6,804,715
Net position, beginning of year (as revised)………………… 66,331,801 59,527,086
Net position, end of year…………………………………………$ 71,920,213 $ 66,331,801
The water enterprise fund net position increased $2.1 million. This is primarily due to an increase in water rates coupled with an increase in consumption which led to an increase in related revenue, the receipt of $470 thousand of water liens, the fact that principal payments on debt exceeded depreciation on capital assets and the funds ability to maintain a minimal increase in overall operating costs. The sewer enterprise fund net position increased by $3.3 million. This is primarily due to an increase in sewer rates, and the fact that principal payments on debt exceeded depreciation on capital assets. The Veterans Memorial Ice Rink enterprise fund net position increased by $121 thousand. This is the result of an operational subsidy from the general fund offset by interest expense. The Dilboy Stadium enterprise fund net position increased by $88 thousand. This is primarily the way this fund is designed to operate. User fees are designed to cover operational and capital related costs of operations. Financial Analysis of the Government’s Funds
As noted earlier, the City of Somerville uses fund accounting to ensure and demonstrate compliance with finance-related legal requirements. Governmental funds. The focus of the City of Somerville’s governmental funds is to provide information on near-term inflows, outflows, and balances of spendable resources. Such information is useful in assessing the City of Somerville’s financing requirements. In particular, unassigned fund balance may serve as a useful measure of a government’s net resources available for spending at the end of the year.

City of Somerville, Massachusetts 31 Comprehensive Annual Financial Report
At the end of the current year, the City of Somerville’s governmental funds combined ending balances totaled $80.6 million, of which positive balances of $64.3 million was reported in the general fund, $16.5 million in the Strategic Planning and Community Development fund, and $30.8 million in the nonmajor governmental funds. The capital projects fund reported a deficit of $31.0 million. Cumulatively, there was a decrease in the governmental funds of $9.4 million in fund balance from prior year. This is due to a $19.7 million operating deficit in the capital projects fund offset by an operating surplus of $2.3 million in the Strategic Planning & Community Development Fund, a general fund surplus in the general fund of $3.6 million and the timing between the expenditure and the receipt of grant funds. The general fund is the chief operating fund of the City of Somerville. At the end of the current year, unassigned fund balance of the general fund totaled $19.7 million and was comprised of two components: an unreserved fund balance of $15.6 million and a rainy day stabilization fund of $4.1 million. Assigned fund balance, which represents amounts designated for the 2019 budget and amounts that have been reserved for the use of liquidating prior purchase orders, contracts, and ongoing capital articles, totaled $5.8 million. Committed fund balance, which represents the City’s various use-specific stabilization funds and the health claims trust, totaled $38.8 million. As a measure of the general fund’s liquidity, it may be useful to compare both unassigned fund balance and total fund balance to total expenditures. At year-end unassigned fund balance equaled 8.0% of total general fund expenditures, while total fund balance equaled 26.2% of the same amount. Please see Note 9 for further details. The City’s general fund increased $3.6 million in the current year. The change was primarily due to positive budgetary results and an increase in the accrual for 60 day receipts, offset by an increase in the accrual for Appellate Tax Board cases. The City’s Strategic Planning and Community Development fund balance increased by $2.3 million. The fund operates on a grant drawdown basis and the results of operations are primarily the result of the timing of the expenditure of grant allotments. The City’s capital projects funds decreased by $19.7 million. The decrease is due to the net effect of $42.2 million of capital expenditures on current and prior year’s projects offset by the issuance of $10.1 million in bonds, the receipt of a $274,000 bond premium and $12.1 million of intergovernmental receipts. General Fund Budgetary Highlights There was an $8.5 million increase between the original budget and the final amended budget. The increase was primarily attributable to transfers to various stabilization funds and the net of other increases/decreases in various departmental budgets. Capital Asset and Debt Administration Capital assets. The City of Somerville’s investment in capital assets for its governmental activities as of June 30, 2018, amounts to $269.1 million (net of accumulated depreciation) and its business-type activities amounted to $61.8 million (net of accumulated depreciation). This investment in capital assets includes land, construction in progress, land improvements, books and periodicals, buildings and improvements, machinery and equipment, vehicles, and infrastructure. The net increase in the City’s investment in capital assets for the current year governmental assets was $36.7 million and business-type assets was $5.4 million.

City of Somerville, Massachusetts 32 Comprehensive Annual Financial Report
Major capital asset events during the year included the following: Investments made to improve and expand the buildings of the School department; Land improvements to various City parks; A variety of infrastructure investments in the street, sidewalk, water and sewer systems and; Various departmental vehicle and equipment acquisitions.
In conjunction with the operating budget, the City annually prepares a capital budget for the upcoming year and a five-year Capital Improvement Plan (CIP) that is used as a guide for future capital expenditures. Additional information on the City’s capital assets may be found in Note 4 to the financial statements. Long and short-term debt. At the end of the current year, the City of Somerville had total governmental bonded debt outstanding of $106.3 million. Additionally, the City reported governmental short-term borrowing of $90.0 million related to the High School Construction, the Union Square Revitalization Plan, road reconstruction and improvement projects, the Green Line extension, and various other projects around the City.
During 2018, the City’s governmental long-term debt increased $4.9 million. This change is due to the net effect of the current year issuance of Municipal Purpose bonds for various governmental projects offset by principal payments during the year. The sewer, water and rink enterprise funds have outstanding long-term debt totaling $1.8 million, $5.5 million, and $1.9 million, respectively, at year end. Other than the Rink, all enterprise fund debt is fully supported by the rates and does not rely on a general fund subsidy. Standard & Poor’s have assigned a rating of AA+ and Moody’s have assigned a rating of Aa1 to the City’s bonds. The Commonwealth of Massachusetts is obligated to provide school construction grants for approved school projects. The grants are paid annually to support future interest expense on school construction related long-term debt and the construction costs funded by that debt. At June 30, 2018, the City is scheduled to receive $1.2 million of future interest grants and $3.5 million of capital grants. The payment schedule for the Commonwealth is structured to match the debt service expenditures. The Commonwealth changed the method for funding the school building assistance program. Under the new program, the assistance is paid to support construction costs and reduce the total debt service of the City. Through the end of 2018, the City has recorded capital grant proceeds totaling $13.8 million related to the East Somerville Community School, $16.9 million related to the Somerville High School project, and $938,000 related to the Winter Hill Community School, from the MSBA, which is equal to 80%, 75.29%, and 70.32%, respectively, of approved construction costs submitted for reimbursement. The City anticipates receiving an additional $1.4 million related to the East Somerville Community School project, $107.1 million related to the Somerville High School project, and $873,000 related to the Winter Hill Community school. Accordingly, a $4.8 million intergovernmental receivable and corresponding deferred inflow of resources - unavailable revenue has been reported in the governmental fund financial statements. This receivable relates to expenditures incurred during 2018 and submitted for reimbursement from the MSBA. The unavailable revenue has been recognized as revenue in the conversion to the government-wide financial statements.

City of Somerville, Massachusetts 33 Comprehensive Annual Financial Report
On December 7 and June 7 of the current year, the City issued $9,465,000 and $11,120,000, respectively, of general obligation bonds which were comprised of a $6,669,925 advance refunding, a $2,795,075 current refunding and $11,120,000 of new general obligation bonds. See below for a description of each issuance. In order to take advantage of favorable interest rates the City:
Issued $6,669,925 of general obligation refunding bonds. $6,905,000 of general obligation bonds were defeased by placing the proceeds of the refunding bonds in an irrevocable trust to provide for all future debt service payments on the refunded bonds. At June 30, 2018, $6,050,000 of governmental and $855,000 of enterprise fund bonds outstanding from the advance refunding are considered defeased.
Issued $2,795,075 of general obligation refunding bonds. $2,945,000 of general obligation bonds were
callable and paid down as a result of this transaction. At June 30, 2018, $2,090,000 of governmental and $855,000 of sewer enterprise fund bonds were called and are not included in the basic financial statements.
Issued $11,120,000 of new general obligation bonds. The current year financial statements have
recognized bond proceeds in the amount of $10,143,102 in the governmental funds, $496,898 in the water enterprise fund, and $680,000 in the sewer enterprise fund.
See Notes 7 & 8 for further debt information. Economic Factors and Next Year’s Budgets and Rates
According to the U.S. Census Bureau, the median household income of the City for the period 2013 –
2017, was $84,722 compared with $74,167 for the Commonwealth and $57,562 for the nation. The per capita income was $44,399, compared with $39,913 for the Commonwealth and $31,177 for the nation.
The unemployment rate for the City of Somerville as of November 2018 is approximately 1.7%, which is a
.4% year-over-year decrease from a rate of 2.1% in November 2017. This compares favorably to the state’s average seasonally-adjusted unemployment rate of 3.4% and the national average of 3.7%.
According to the City’s Board of Assessors, for 2018, the average single family parcel in the City is valued
at $695,200; the average two-family home is valued at $731,700; the average 2018 commercial and industrial property is valued at $2,227,500. All compared favorably with state and national property values.
Requests for Information This financial report is designed to provide a general overview of the City of Somerville’s finances for all those with an interest in the government’s finances. Questions concerning any of the information provided in this report or requests for additional financial information should be addressed to the Director of Finance, City Hall, 93 Highland Ave, Somerville, Massachusetts 02143.

City of Somerville, Massachusetts 34 Comprehensive Annual Financial Report
Basic Financial Statements
Basic Financial Statements

Governmental Business-type
Activities Activities Total
ASSETS
CURRENT:
Cash and cash equivalents…………………………………………$ 156,689,030 $ 42,074,516 $ 198,763,546
Receivables, net of allowance for uncollectibles:
Real estate and personal property taxes……………………… 1,656,202 - 1,656,202
Tax liens……………………………………...…………………… 825,330 - 825,330
Community preservation fund surtax…………………………… 18,338 - 18,338
Motor vehicle and other excise taxes………………………… 725,685 - 725,685
User charges……………………………………………………… - 11,710,004 11,710,004
Departmental and other………………………………………… 2,849,995 - 2,849,995
Intergovernmental………………………………………………… 8,615,115 - 8,615,115
Community preservation state share…………………………… 233,552 - 233,552
Loans……………………………………………………………… 23,792,734 - 23,792,734
Total current assets………………………………………… 195,405,981 53,784,520 249,190,501
NONCURRENT:
Receivables, net of allowance for uncollectibles:
Intergovernmental………………………………………………… 5,588,124 - 5,588,124
Capital assets, nondepreciable…………………………………… 92,936,623 2,500,332 95,436,955
Capital assets, net of accumulated depreciation………………… 176,126,610 59,346,990 235,473,600
Total noncurrent assets……………………………………… 274,651,357 61,847,322 336,498,679
TOTAL ASSETS………………………………………………………… 470,057,338 115,631,842 585,689,180
DEFERRED OUTFLOWS OF RESOURCES
Deferred outflows for refunding debt……………………………… 529,419 72,953 602,372
Deferred outflows related to pensions…………………………… 1,387,813 200,601 1,588,414
Deferred outflows related to other postemployment benefits…… 57,748 401 58,149
TOTAL DEFERRED OUTFLOWS OF RESOURCES……………… 1,974,980 273,955 2,248,935
LIABILITIES
CURRENT:
Warrants payable…………………………………………………… 9,794,703 821,373 10,616,076
Accrued payroll……………………………………………………… 1,919,602 36,881 1,956,483
Tax refunds payable………………………………………………… 971,000 - 971,000
Accrued interest……………………………………………………… 870,404 65,565 935,969
Other liabilities……………………………………………………… 1,324,760 - 1,324,760
Compensated absences…………………………………………… 146,700 1,600 148,300
Workers' compensation…………………………………………… 230,250 - 230,250
Notes payable………………………………………………………… 89,958,702 29,927,000 119,885,702
Bonds payable……………………………………………………… 7,492,225 1,770,683 9,262,908
Total current liabilities………………………………………… 112,708,346 32,623,102 145,331,448
NONCURRENT:
Compensated absences…………………………………………… 3,481,000 67,500 3,548,500
Workers' compensation…………………………………………… 690,750 - 690,750
Net pension liability………………………………………………… 113,714,976 1,471,838 115,186,814
Net other postemployment benefits liability……………………… 266,777,988 1,853,557 268,631,545
Bonds payable……………………………………………………… 98,832,554 7,498,161 106,330,715
Total noncurrent liabilities…………………………………… 483,497,268 10,891,056 494,388,324
TOTAL LIABILITIES…………………………………………………… 596,205,614 43,514,158 639,719,772
DEFERRED INFLOWS OF RESOURCES
Deferred inflows related to pensions……………………………… 5,090,619 248,527 5,339,146
Deferred inflows related to other postemployment benefits…… 32,081,271 222,899 32,304,170
TOTAL DEFERRED INFLOWS OF RESOURCES………………… 37,171,890 471,426 37,643,316
NET POSITION
Net investment in capital assets………………………………..……… 138,950,212 45,635,475 184,585,687
Restricted for:
Streets………………………………………………………………… 2,060,220 - 2,060,220
Community Development…………………………………………… 1,995,742 - 1,995,742
Loans………………………………………………………………… 23,792,734 - 23,792,734
Permanent funds:
Expendable……….……………………………………………… 161,034 - 161,034
Nonexpendable…………………………………………………… 433,126 - 433,126
Gifts and grants……………………………………………………… 3,788,543 - 3,788,543
Community preservation…………………………………………… 10,957,885 - 10,957,885
Unrestricted……………………………………………………………… (343,484,682) 26,284,738 (317,199,944)
TOTAL NET POSITION…………………………………………………$ (161,345,186) $ 71,920,213 $ (89,424,973)
See notes to basic financial statements.
Primary Government
STATEMENT OF NET POSITION
JUNE 30, 2018
City of Somerville, Massachusetts 35 Comprehensive Annual Financial Report

Operating Capital
Charges for Grants and Grants and Net (Expense)
Functions/Programs Expenses Services Contributions Contributions Revenue
Primary Government:
Governmental Activities:
General government………………………… $ 39,372,354 $ 17,374,072 $ 6,351,895 $ 1,152,426 $ (14,493,961)
Public safety…………………………………… 54,307,824 10,933,048 780,100 - (42,594,676)
Education……………………………………… 128,921,395 3,689,821 46,045,575 12,072,086 (67,113,913)
Public works…………………………………… 30,766,736 691,642 389,071 766,841 (28,919,182)
Community development…………………… 4,556,946 - 7,619,395 - 3,062,449
Health and human services………………… 279,442 321,108 384,353 - 426,019
Culture and recreation………………………… 5,843,577 405,020 102,206 - (5,336,351)
Community preservation……………………… 4,207,687 - 7,157 233,552 (3,966,978)
Interest………………………………………… 3,727,244 - 406,442 - (3,320,802)
Total Governmental Activities……………… 271,983,205 33,414,711 62,086,194 14,224,905 (162,257,395)
Business-Type Activities:
Water…………………………………………… 11,417,358 14,027,720 - - 2,610,362
Sewer…………………………………………… 18,610,157 22,396,044 - - 3,785,887
Veteran's Memorial Ice Rink………………… 713,303 634,804 - - (78,499)
Dilboy Stadium………………………………… 143,967 232,101 - - 88,134
Total Business-Type Activities…………… 30,884,785 37,290,669 - - 6,405,884
Total Primary Government………………… $ 302,867,990 $ 70,705,380 $ 62,086,194 $ 14,224,905 $ (155,851,511)
See notes to basic financial statements. (Continued)
STATEMENT OF ACTIVITIES
YEAR ENDED JUNE 30, 2018
Program Revenues
City of Somerville, Massachusetts 36 Comprehensive Annual Financial Report

Governmental Business-Type
Activities Activities Total
Changes in net position:
Net (expense) revenue from previous page……………$ (162,257,395) $ 6,405,884 $ (155,851,511)
General revenues:
Real estate and personal property taxes,
net of tax refunds payable………………………… 141,935,979 - 141,935,979
Tax and utility liens…………………………………… 159,603 - 159,603
Motor vehicle and other excise taxes……………… 10,032,977 - 10,032,977
Community preservation tax………………………… 1,794,508 - 1,794,508
Penalties and interest on taxes……………………… 869,868 - 869,868
Payments in lieu of taxes…………………………… 1,327,790 - 1,327,790
Grants and contributions not restricted to
specific programs…………………………………… 26,368,477 - 26,368,477
Unrestricted investment income…………………… 1,407,965 270,925 1,678,890
Gain (loss) on sale of capital assets……………… 3,911 - 3,911
Miscellaneous………………………………………… 537,703 - 537,703 Transfers, net …………………………………………… 1,088,397 (1,088,397) -
Total general revenues and transfers………………… 185,527,178 (817,472) 184,709,706
Change in net position……………………………… 23,269,783 5,588,412 28,858,195
Net position:
Beginning of year (as revised)……………………… (184,614,969) 66,331,801 (118,283,168)
End of year…………………………………………… $ (161,345,186) $ 71,920,213 $ (89,424,973)
See notes to basic financial statements. (Concluded)
Primary Government
STATEMENT OF ACTIVITIES (continued)
YEAR ENDED JUNE 30, 2018
City of Somerville, Massachusetts 37 Comprehensive Annual Financial Report

Strategic
Planning & Capital Nonmajor Total
Community Projects Governmental Governmental
General Development Fund Funds Funds
ASSETS
Cash and cash equivalents……………………………………$ 70,193,709 $ 273,407 $ 62,974,786 $ 23,247,128 $ 156,689,030
Receivables, net of uncollectibles:
Real estate and personal property taxes………………… 1,656,202 - - - 1,656,202
Tax liens……………………………………...…………… 818,578 - - 6,752 825,330
Community preservation fund surtax…………………… - - - 18,338 18,338
Motor vehicle and other excise taxes…………………… 725,685 - - - 725,685
Departmental and other…………………………………… 2,849,995 - - - 2,849,995
Intergovernmental………………………………………… 6,717,364 1,995,742 - 5,490,133 14,203,239
Community preservation state share…………………… - - - 233,552 233,552
Loans………………………………………………………… - 16,256,458 - 7,536,276 23,792,734
Due from other funds………………………………………… 2,163,092 - - - 2,163,092
TOTAL ASSETS……………………………………………… $ 85,124,625 $ 18,525,607 $ 62,974,786 $ 36,532,179 $ 203,157,197
LIABILITIES
Warrants payable………………………………………… $ 4,776,899 $ - $ 4,051,109 $ 966,695 $ 9,794,703
Accrued payroll…………………………………………… 1,657,252 8,937 650 252,763 1,919,602
Tax refunds payable……………………………………… 971,000 - - - 971,000
Due to other funds………………………………………… - - - 2,163,092 2,163,092
Other liabilities……………………………………………… 1,324,760 - - - 1,324,760
Notes payable……………………………………………… - - 89,958,702 - 89,958,702
TOTAL LIABILITIES…………………………………………… 8,729,911 8,937 94,010,461 3,382,550 106,131,859
DEFERRED INFLOWS OF RESOURCES
Unavailable revenue……………………………………… 12,140,351 1,995,742 - 2,318,863 16,454,956
FUND BALANCES
Nonspendable……………………………………………… - - - 433,126 433,126
Restricted…………………………………………………… - 16,520,928 - 30,397,640 46,918,568
Committed………………………………………………… 38,756,437 - - - 38,756,437
Assigned…………………………………………………… 5,831,550 - - - 5,831,550
Unassigned………………………………………………… 19,666,376 - (31,035,675) - (11,369,299)
TOTAL FUND BALANCES…………………………………… 64,254,363 16,520,928 (31,035,675) 30,830,766 80,570,382
TOTAL LIABILITIES, DEFERRED INFLOWS OF RESOURCES, AND FUND BALANCES………………… $ 85,124,625 $ 18,525,607 $ 62,974,786 $ 36,532,179 $ 203,157,197
See notes to basic financial statements.
GOVERNMENTAL FUNDS
BALANCE SHEET
JUNE 30, 2018
City of Somerville, Massachusetts 38 Comprehensive Annual Financial Report

Total governmental fund balances………………………………………………………………… $ 80,570,382
Capital assets (net) used in governmental activities are not financial resources and, therefore, are not reported in the funds………………………………………………… 269,063,233
Accounts receivable are not available to pay for current-period
expenditures and, therefore, are unavailable in the funds………………………………… 16,454,956
The statement of net position includes certain deferred inflows of resourcesand deferred outflows of resources that will be amortized over future periods.In governmental funds, these amounts are not deferred…………………………………… (35,196,910)
In the statement of activities, interest is accrued on outstanding long-term debt, whereas in governmental funds interest is not reported until due………………………… (870,404)
Long-term liabilities are not due and payable in the current period and, therefore,
are not reported in the governmental funds: Bonds payable……………………………………………………………………………… (106,324,779) Net pension liability………………………………………………………………………… (113,714,976) Net other postemployment benefits liability……………………………………………… (266,777,988) Workers' compensation…………………………………………………………………… (921,000) Compensated absences…………………………………………………………………… (3,627,700)
Net effect of reporting long-term liabilities…………………………………………… (491,366,443)
Net position of governmental activities…………………………………………………………… $ (161,345,186)
See notes to basic financial statements.
RECONCILIATION OF THE GOVERNMENTAL FUNDS BALANCE SHEETTOTAL FUND BALANCES TO THE STATEMENT OF NET POSITION
JUNE 30, 2018
City of Somerville, Massachusetts 39 Comprehensive Annual Financial Report

Strategic
Planning & Capital Nonmajor Total
Community Projects Governmental Governmental
General Development Fund Funds Funds
REVENUES:
Real estate and personal property taxes,
net of tax refunds……………………………………………$ 142,059,305 $ - $ - $ - $ 142,059,305
Tax liens………………………………………………………… 192,533 - - - 192,533
Motor vehicle and other excise taxes……………………… 9,484,191 - - - 9,484,191
Penalties and interest on taxes……………………………… 869,868 - - - 869,868
Payments in lieu of taxes……………………………………… 1,327,790 - - - 1,327,790
Intergovernmental - Teachers Retirement………………… 15,799,215 - - - 15,799,215
Intergovernmental……………………………………………… 49,452,074 6,771,912 12,099,480 19,480,474 87,803,940
Departmental and other……………………………………… 25,592,325 - - 8,299,089 33,891,414
Community preservation taxes……………………………… - - - 1,794,508 1,794,508
Community preservation state match……………………… - - - 370,465 370,465
Contributions and donations………………………………… 338,636 - - 305,481 644,117
Investment income…………………………………………… 1,345,247 11,067 - 58,917 1,415,231
Miscellaneous………………………………………………… 537,703 - - - 537,703
TOTAL REVENUES…………………………………… 246,998,887 6,782,979 12,099,480 30,308,934 296,190,280
EXPENDITURES:
Current:
General government……………………………………… 21,580,283 - 14,436,468 4,034,921 40,051,672
Public safety………………………………………………… 39,410,678 - 689,719 937,433 41,037,830
Education…………………………………………………… 68,799,420 - 20,296,626 13,834,507 102,930,553
Public works………………………………………………… 26,890,369 - 3,233,014 2,335,647 32,459,030
Community development………………………………… - 4,556,946 - - 4,556,946
Health and human services……………………………… - - - 276,304 276,304
Culture and recreation…………………………………… 3,749,817 - 3,525,050 250,538 7,525,405
Community preservation………………………………… - - - 5,061,851 5,061,851
Pension benefits…………………………………………… 13,943,033 - - - 13,943,033
Pension benefits - Teachers Retirement………………… 15,799,215 15,799,215
Employee benefits………………………………………… 30,438,102 - - - 30,438,102
State and county charges…………………………………… 13,634,548 - - - 13,634,548
Debt service:
Principal…………………………………………………… 5,011,623 - - - 5,011,623
Principal payment on current refunding………………… 2,090,000 - - - 2,090,000
Interest……………………………………………………… 4,112,187 - - - 4,112,187
TOTAL EXPENDITURES……………………………… 245,459,275 4,556,946 42,180,877 26,731,201 318,928,299
EXCESS (DEFICIENCY) OF REVENUES
OVER (UNDER) EXPENDITURES………………………… 1,539,612 2,226,033 (30,081,397) 3,577,733 (22,738,019)
OTHER FINANCING SOURCES (USES):
Issuance of bonds…………………………………………… - - 10,143,102 - 10,143,102
Issuance of refunding bonds………………………………… 7,810,975 - - - 7,810,975
Premium from issuance of bonds…………………………… - - 273,998 1,845,411 2,119,409
Premium from issuance of refunding bonds………………… 578,540 - - - 578,540
Payments to refunded bond escrow agent………………… (8,448,080) - - - (8,448,080)
Proceeds from the sale of capital assets…………………… 3,911 - - - 3,911
Transfers in…………………………………………………… 3,934,577 29,891 20,055 1,572,148 5,556,671
Transfers out…………………………………………………… (1,801,039) - (6,419) (2,660,816) (4,468,274)
TOTAL OTHER FINANCING SOURCES (USES)… 2,078,884 29,891 10,430,736 756,743 13,296,254
NET CHANGE IN FUND BALANCES………………………… 3,618,496 2,255,924 (19,650,661) 4,334,476 (9,441,765)
FUND BALANCES AT BEGINNING OF YEAR……………… 60,635,867 14,265,004 (11,385,014) 26,496,290 90,012,147
FUND BALANCES AT END OF YEAR…………………………$ 64,254,363 $ 16,520,928 $ (31,035,675) $ 30,830,766 $ 80,570,382
See notes to basic financial statements.
GOVERNMENTAL FUNDS
STATEMENT OF REVENUES, EXPENDITURES AND CHANGES IN FUND BALANCES
YEAR ENDED JUNE 30, 2018
City of Somerville, Massachusetts 40 Comprehensive Annual Financial Report

Net change in fund balances - total governmental funds………………………………………………………… $ (9,441,765)
Governmental funds report capital outlays as expenditures. However, in the
Statement of Activities the cost of those assets is allocated over their
estimated useful lives and reported as depreciation expense.
Capital outlay……………………………………………………………………………………………… 45,762,085
Depreciation expense……………………………………………………………………………………… (9,015,680)
Net effect of reporting capital assets……………………………………………………………… 36,746,405
Revenues in the Statement of Activities that do not provide current financial
resources are unavailable in the Statement of Revenues, Expenditures and
Changes in Fund Balances. Therefore, the recognition of revenue for various
types of accounts receivable differ between the two statements. This amount
represents the net change in unavailable revenue………………………………………………………… (2,029,600)
The issuance of long-term debt provides current financial resources to governmental
funds, while the repayment of the principal of long-term debt consumes the
financial resources of governmental funds. Neither transaction has any effect
on net position. Also, governmental funds report the effect of premiums,
discounts, and similar items when debt is first issued, whereas these amounts
are unavailable and amortized in the Statement of Activities.
Issuance of bonds………………………………………………………………………………………… (10,143,102)
Issuance of refunding bonds……………………………………………………………………………… (7,810,975)
Premium from issuance of bonds………………………………………………………………………… (2,119,409)
Premium from issuance of refunding bonds…………………………………………………………… (578,540)
Payments to refunded bond escrow agent……………………………………………………………… 8,448,080
Principal payment on advanced refunded debt………………………………………………………… 2,090,000
Net amortization of premium from issuance of bonds………………………………………………… 508,970
Net change in deferred charge on refunding…………………………………………………………… (117,024)
Debt service principal payments………………………………………………………………………… 5,011,623
Net effect of reporting long-term debt…………………………………………………………… (4,710,377)
Some expenses reported in the Statement of Activities do not require the use of
current financial resources and, therefore, are not reported as expenditures
in the governmental funds.
Net change in compensated absences accrual………………………………………………………… 136,500
Net change in accrued interest on long-term debt……………………………………………………… (7,004)
Net change in deferred outflow/(inflow) of resources related to pensions…………………………… (23,936,893)
Net change in net pension liability………………………………………………………………………… 24,744,952
Net change in deferred outflow/(inflow) of resources related to other postemployment benefits… (32,023,523)
Net change in net other postemployment benefits liability……………………………………………… 33,357,088
Net change in workers' compensation liability…………………………………………………………… 434,000
Net effect of recording long-term liabilities……………………………………………………… 2,705,120
Change in net position of governmental activities………………………………………………………………… $ 23,269,783
See notes to basic financial statements.
RECONCILIATION OF THE STATEMENT OF REVENUES, EXPENDITURES,
AND CHANGES IN FUND BALANCES OF GOVERNMENTAL FUNDS
TO THE STATEMENT OF ACTIVITIES
YEAR ENDED JUNE 30, 2018
City of Somerville, Massachusetts 41 Comprehensive Annual Financial Report

Business-type Activities - Enterprise Funds
Veterans
Memorial Dilboy
Water Sewer Ice Rink Stadium Total
ASSETS
CURRENT:
Cash and cash equivalents………………………………………………$ 14,150,843 $ 27,542,728 $ 104,409 $ 276,536 $ 42,074,516
Receivables, net of allowance for uncollectibles:
User charges………………………………………………………… 4,279,445 7,430,559 - - 11,710,004
Total current assets……………………………………………… 18,430,288 34,973,287 104,409 276,536 53,784,520
NONCURRENT:
Capital assets, non depreciable………………………………………… 393,486 2,106,846 - - 2,500,332
Capital assets, net of accumulated depreciation……………………… 32,866,239 23,517,257 2,963,494 - 59,346,990
Total noncurrent assets…………………………………………… 33,259,725 25,624,103 2,963,494 - 61,847,322
TOTAL ASSETS……………………………………………………………… 51,690,013 60,597,390 3,067,903 276,536 115,631,842
DEFERRED OUTFLOWS OF RESOURCES
Deferred loss on refunding……………………………………………… 62,149 10,804 - - 72,953
Deferred outflows related to pensions………………………………… 120,123 80,478 - - 200,601
Deferred outflows related to other postemployment benefits……… 308 93 - - 401
TOTAL DEFERRED OUTFLOWS OF RESOURCES…………………… 182,580 91,375 - - 273,955
LIABILITIES
CURRENT:
Warrants payable………………………………………………………… 191,007 630,153 213 - 821,373
Accrued payroll…………………………………………………………… 17,909 14,706 1,369 2,897 36,881
Accrued interest………………………………………………………… 31,841 13,886 19,838 - 65,565
Compensated absences………………………………………………… 1,400 200 - - 1,600
Notes payable…………………………………………………………… 8,732,500 21,194,500 - - 29,927,000
Bonds payable…………………………………………………………… 1,194,832 375,851 200,000 - 1,770,683
Total current liabilities…………………………………………… 10,169,489 22,229,296 221,420 2,897 32,623,102
NONCURRENT:
Compensated absences………………………………………………… 36,700 30,800 - - 67,500
Net pension liability……………………………………………………… 881,359 590,479 - - 1,471,838
Net other postemployment benefits liability…………………………… 1,423,747 429,810 - - 1,853,557
Bonds payable…………………………………………………………… 4,354,861 1,433,300 1,710,000 - 7,498,161
Total noncurrent liabilities………………………………………… 6,696,667 2,484,389 1,710,000 - 10,891,056
TOTAL LIABILITIES………………………………………………………… 16,866,156 24,713,685 1,931,420 2,897 43,514,158
DEFERRED INFLOWS OF RESOURCES
Deferred inflows related to pensions…………………………………… 148,822 99,705 - - 248,527
Deferred inflows related to other postemployment benefits………… 171,212 51,687 - - 222,899
TOTAL DEFERRED INFLOWS OF RESOURCES……………………… 320,034 151,392 - - 471,426
NET POSITION
Net investment in capital assets………………………………..………… 25,465,446 19,116,535 1,053,494 - 45,635,475
Unrestricted…………………………………………………………………… 9,220,957 16,707,153 82,989 273,639 26,284,738
TOTAL NET POSITION…………………………………………………… $ 34,686,403 $ 35,823,688 $ 1,136,483 $ 273,639 $ 71,920,213
See notes to basic financial statements.
PROPRIETARY FUNDS
STATEMENT OF NET POSITION
JUNE 30, 2018
City of Somerville, Massachusetts 42 Comprehensive Annual Financial Report
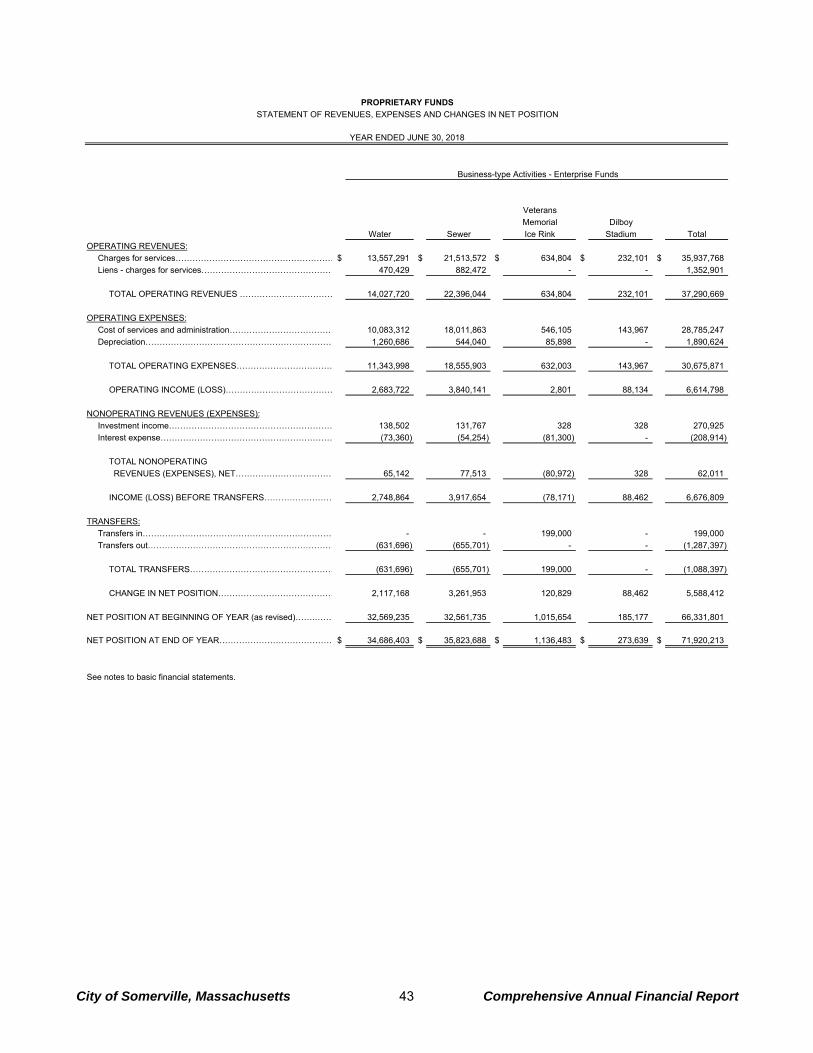
Business-type Activities - Enterprise Funds
Veterans
Memorial Dilboy
Water Sewer Ice Rink Stadium Total
OPERATING REVENUES:
Charges for services…………………………………………………$ 13,557,291 $ 21,513,572 $ 634,804 $ 232,101 $ 35,937,768
Liens - charges for services………………………………………… 470,429 882,472 - - 1,352,901
TOTAL OPERATING REVENUES …………………………… 14,027,720 22,396,044 634,804 232,101 37,290,669
OPERATING EXPENSES:
Cost of services and administration………………………………… 10,083,312 18,011,863 546,105 143,967 28,785,247
Depreciation…………………………………………………………… 1,260,686 544,040 85,898 - 1,890,624
TOTAL OPERATING EXPENSES……………………………… 11,343,998 18,555,903 632,003 143,967 30,675,871
OPERATING INCOME (LOSS)………………………………… 2,683,722 3,840,141 2,801 88,134 6,614,798
NONOPERATING REVENUES (EXPENSES):
Investment income…………………………………………………… 138,502 131,767 328 328 270,925
Interest expense……………………………………………………… (73,360) (54,254) (81,300) - (208,914)
TOTAL NONOPERATING
REVENUES (EXPENSES), NET……………………………… 65,142 77,513 (80,972) 328 62,011
INCOME (LOSS) BEFORE TRANSFERS…………………… 2,748,864 3,917,654 (78,171) 88,462 6,676,809
TRANSFERS:
Transfers in…………………………………………………………… - - 199,000 - 199,000
Transfers out………………………………………………………… (631,696) (655,701) - - (1,287,397)
TOTAL TRANSFERS…………………………………………… (631,696) (655,701) 199,000 - (1,088,397)
CHANGE IN NET POSITION…………………………………… 2,117,168 3,261,953 120,829 88,462 5,588,412
NET POSITION AT BEGINNING OF YEAR (as revised)…….…… 32,569,235 32,561,735 1,015,654 185,177 66,331,801
NET POSITION AT END OF YEAR…………………………………… $ 34,686,403 $ 35,823,688 $ 1,136,483 $ 273,639 $ 71,920,213
See notes to basic financial statements.
PROPRIETARY FUNDS
STATEMENT OF REVENUES, EXPENSES AND CHANGES IN NET POSITION
YEAR ENDED JUNE 30, 2018
City of Somerville, Massachusetts 43 Comprehensive Annual Financial Report

Business-type Activities - Enterprise Funds
VeteransMemorial Dilboy
Water Sewer Ice Rink Stadium Total
CASH FLOWS FROM OPERATING ACTIVITIES:Receipts from customers and users……………………………………………… $ 14,027,720 $ 22,130,632 $ 634,804 $ 232,101 $ 37,025,257 Payments to vendors………………………………………………………………… (9,248,847) (17,153,751) (334,965) (65,283) (26,802,846) Payments to employees……………………………………………………………… (971,217) (625,015) (213,062) (78,963) (1,888,257)
NET CASH FROM OPERATING ACTIVITIES……………………………………… 3,807,656 4,351,866 86,777 87,855 8,334,154
CASH FLOWS FROM NONCAPITAL FINANCING ACTIVITIES:Transfers in…………………………………………………………………………… - - 199,000 - 199,000 Transfers out………………………………………………………………………… (631,696) (655,701) - - (1,287,397)
NET CASH FROM NONCAPITAL FINANCING ACTIVITIES……………………… (631,696) (655,701) 199,000 - (1,088,397)
CASH FLOWS FROM CAPITAL AND RELATED FINANCING ACTIVITIES:Proceeds from the issuance of bonds and notes………………………………… 9,229,398 21,874,500 - - 31,103,898 Proceeds from the issuance of refunding bonds………………………………… 844,925 809,100 - - 1,654,025 Payment to Refunding Escrow Agent……………………………………………… (917,149) (865,804) - - (1,782,953) Premium from the issuance of refunding bonds………………………………… 72,224 56,704 - - 128,928 Acquisition and construction of capital assets…………………………………… (3,003,245) (3,624,617) - - (6,627,862) Principal payments on bonds and notes…………………………………………… (5,112,814) (5,550,951) (195,000) (10,858,765) Interest expense……………………………………………………………………… (130,007) (134,576) (83,250) - (347,833)
NET CASH FROM CAPITAL AND RELATED FINANCING ACTIVITIES………… 983,332 12,564,356 (278,250) - 13,269,438
CASH FLOWS FROM INVESTING ACTIVITIES:Investment income…………………………………………………………………… 138,502 131,767 328 328 270,925
NET CHANGE IN CASH AND CASH EQUIVALENTS……………………………… 4,297,794 16,392,288 7,855 88,183 20,786,120
CASH AND CASH EQUIVALENTS AT BEGINNING OF YEAR…………………… 9,853,049 11,150,440 96,554 188,353 21,288,396
CASH AND CASH EQUIVALENTS AT END OF YEAR…………………………… $ 14,150,843 $ 27,542,728 $ 104,409 $ 276,536 $ 42,074,516
RECONCILIATION OF OPERATING INCOME (LOSS) TO NET CASHFROM OPERATING ACTIVITIES:Operating income (loss)………………………………………………………………$ 2,683,722 $ 3,840,141 $ 2,801 $ 88,134 $ 6,614,798 Adjustments to reconcile operating income to net
cash from operating activities:Depreciation……………………………………………………………………… 1,260,686 544,040 85,898 - 1,890,624 Deferred (outflows)/inflows related to pensions……………………………… 206,723 90,580 - - 297,303 Deferred (outflows)/inflows related to other postemployment benefits……… 170,904 51,594 - - 222,498 Changes in assets and liabilities:
User charges…………………………………………………………………… (27,391) (265,412) - - (292,803) Other assets…………………………………………………………………… - 297,281 - - 297,281 Warrants payable……………………………………………………………… 47,889 (41,363) 184 - 6,710 Accrued payroll………………………………………………………………… (9,417) 1,715 (2,106) (279) (10,087) Compensated absences……………………………………………………… (10,600) 16,200 - - 5,600 Net pension liability…………………………………………………………… (336,839) 102,214 - - (234,625) Other postemployment benefits……………………………………………… (178,021) (285,124) - - (463,145)
Total adjustments………………………………………………………… 1,123,934 511,725 83,976 (279) 1,719,356
NET CASH FROM OPERATING ACTIVITIES……………………………………… $ 3,807,656 $ 4,351,866 $ 86,777 $ 87,855 $ 8,334,154
NONCASH INVESTING, CAPITAL, AND FINANCING ACTIVITIES:Change in the deferred loss on debt refunding…………………………………… $ 62,149 $ 10,804 $ - - $ 72,953
See notes to basic financial statements.
PROPRIETARY FUNDSSTATEMENT OF CASH FLOWS
YEAR ENDED JUNE 30, 2018
City of Somerville, Massachusetts 44 Comprehensive Annual Financial Report

Total Pension
and Other
Employee Private
Benefit Purpose Agency
Trust Funds Trust Funds Funds
ASSETS
Cash and cash equivalents………………………………………… $ 13,642,004 $ 99,283 $ 526,387
Investments:
Real estate and alternative investment mutual funds………… 21,209,628 - -
Bond mutual funds……………………………………………… 69,649,406 - -
Equity securities………………………………………………… 157,747,063 - -
Equity mutual funds……………………………………………… 24,463,082 - -
Receivables, net of allowance for uncollectibles: -
Departmental and other………………………………………… 14,283 - -
TOTAL ASSETS………………………………………………………… 286,725,466 99,283 526,387
LIABILITIES
Warrants payable…………………………………………………… 160,126 - -
Accrued payroll……………………………………………………… - - 83,181
Liabilities due depositors…………………………………………… - - 443,206
TOTAL LIABILITIES…………………………………………………… 160,126 - 526,387
NET POSITION
Restricted for pensions……………………………………………… 279,217,264 - -
Restricted for other postemployment benefits…………………… 7,348,076 - -
Held in trust for other purposes…………………………….……… - 99,283 -
TOTAL NET POSITION…………………………………………………$ 286,565,340 $ 99,283 $ -
See notes to basic financial statements.
FIDUCIARY FUNDS
STATEMENT OF FIDUCIARY NET POSITION
JUNE 30, 2018
City of Somerville, Massachusetts 45 Comprehensive Annual Financial Report

Total Pensionand OtherEmployee Private
Benefit PurposeTrust Funds Trust Funds
ADDITIONS:Contributions:
Employer contributions……………………………………………………… $ 5,665,857 $ - Employer contributions for other postemployment benefit payments…… 8,485,245 - Member contributions………………………………………………………… 22,636,081 - Retirement benefits - transfers from other systems……………………… 579,727 - Retirement benefits - workers compensation settlements……………… 12,150 - Retirement benefits - interest not refunded………………………………… 12,970 - Private donations……………………………………………………………… - 11,383 Intergovernmental…………………………………………………………… 72,227 -
Total contributions………………………………………………………… 37,464,257 11,383
Net investment income:Investment income…………………………………………………………… 6,598,122 284 Net change in fair value of investments…………………………………… 37,421,939 - Less: investment expense…………………………………………………… (1,300,930) -
Net investment income (loss)……………………………………………… 42,719,131 284
TOTAL ADDITIONS……………………………………………………… 80,183,388 11,667
DEDUCTIONS:Administration………………………………………………………………… 463,693 - Retirement benefits - transfers to other systems………………………… 894,233 - Retirement benefits - 3(8)c transfer to other systems…………………… 1,051,885 - Payment of benefits and refunds…………………………………………… 27,345,556 - OPEB Benefits………………………………………………………………… 8,485,245 - Educational scholarships…………………………………………………… - 7,500
TOTAL DEDUCTIONS…………………………………………………… 38,240,612 7,500
NET INCREASE (DECREASE) IN NET POSITION………………… 41,942,776 4,167
NET POSITION AT BEGINNING OF YEAR………………………………… 244,622,564 95,116
NET POSITION AT END OF YEAR……………………………………………$ 286,565,340 $ 99,283
See notes to basic financial statements.
FIDUCIARY FUNDSSTATEMENT OF CHANGES IN FIDUCIARY NET POSITION
YEAR ENDED JUNE 30, 2018
City of Somerville, Massachusetts 46 Comprehensive Annual Financial Report

Notes to Basic Financial Statements Year Ended June 30, 2018
City of Somerville, Massachusetts 47 Comprehensive Annual Financial Report
NOTE 1 - SUMMARY OF SIGNIFICANT ACCOUNTING POLICIES Notes to Basic Financial Statements The accompanying basic financial statements of the City of Somerville, Massachusetts (City) have been prepared in accordance with accounting principles generally accepted in the United States of America (GAAP). The Governmental Accounting Standards Board (GASB) is the recognized standard-setting body for establishing governmental accounting and financial reporting principles. The significant City accounting policies are described herein. A. Reporting Entity The City is a municipal corporation that is governed by an elected Mayor and an eleven member Board of Alderman (Board). For financial reporting purposes, the City has included all funds, organizations, agencies, boards, commissions and institutions. The City has also considered all potential component units for which it is financially accountable as well as other organizations for which the nature and significance of their relationship with the City are such that exclusion would cause the basic financial statements to be misleading or incomplete. As required by GAAP, these basic financial statements present the City (primary government) and its component units. One entity has been included as a component unit in the reporting entity, because of the significance of its operational and/or financial relationship. Component Unit Presented as a Fiduciary Fund – The following component unit is presented as a Fiduciary Fund of the primary government due to the nature and significance of relationship between the City and the component unit:
The Somerville Contributory Retirement System (System) was established to provide retirement benefits to City employees, the City Housing Authority employees, and their beneficiaries. The System is governed by a five-member board comprised of the City Auditor (ex-officio), two members elected by the System’s participants, one member appointed by the Mayor and one member appointed by the Board members. The System is presented using the accrual basis of accounting and is reported as a pension trust fund in the fiduciary fund financial statements.
Availability of Financial Information for Component Units The System did not issue a separate audited financial statement. The System issues a publicly available unaudited financial report in accordance with guidelines established by the Commonwealth of Massachusetts’ (Commonwealth) Public Employee Retirement Administration Commission (PERAC). That report may be obtained by contacting the System located at 50 Evergreen Avenue, Somerville, Massachusetts 02145. B. Government-Wide and Fund Financial Statements Government-Wide Financial Statements The government-wide financial statements (i.e., statement of net position and the statement of changes in net position) report information on all of the non-fiduciary activities of the primary government and its component units. Governmental activities are primarily supported by taxes and intergovernmental revenues. Fund Financial Statements Separate financial statements are provided for governmental funds, proprietary funds, and fiduciary funds, even though fiduciary funds are excluded from the government-wide financial statements. Major individual

Notes to Basic Financial Statements Year Ended June 30, 2018
City of Somerville, Massachusetts 48 Comprehensive Annual Financial Report
governmental funds are reported as separate columns in the fund financial statements. Non-major funds are aggregated and displayed in a single column. Major Fund Criteria Major funds must be reported if the following criteria are met:
If the total assets and deferred outflows, liabilities and deferred inflows, revenues, or expenditures/expenses of an individual governmental fund are at least 10 percent of the corresponding element (assets and deferred outflows, liabilities and deferred inflows, etc.) for all funds of that category or type (total governmental funds), and
If the total assets and deferred outflows, liabilities and deferred inflows, revenues, or
expenditures/expenses of the individual governmental funds are at least 5 percent of the corresponding element for all governmental funds combined.
Additionally, any other governmental fund that management believes is particularly significant to the basic financial statements may be reported as a major fund.
Internal service funds and fiduciary funds are reported by fund type. C. Measurement Focus, Basis of Accounting and Financial Statement Presentation Government-Wide Financial Statements The government-wide financial statements are reported using the economic resources measurement focus and the accrual basis of accounting. Under this method, revenues are recorded when earned and expenses are recorded when the liabilities are incurred. Real estate and personal property taxes are recognized as revenues in the year for which they are levied. Grants and similar items are recognized as revenue as soon as all eligibility requirements imposed by the provider have been met. The statement of activities demonstrates the degree to which the direct expenses of a particular function or segment are offset by program revenues. Direct expenses are those that are clearly identifiable with a specific function or segment. Program revenues include the following:
Charges to customers or applicants who purchase, use, or directly benefit from goods, services, or privileges provided by a given function or segment.
Grants and contributions that are restricted to meeting the operational requirements of a particular
function or segment.
Grants and contributions that are restricted to meeting the capital requirements of a particular function or segment.
Taxes and other items not identifiable as program revenues are reported as general revenues. For the most part, the effect of interfund activity has been removed from the government-wide financial statements. However, the net effect of interfund services provided and used between functions is not eliminated, as the elimination of these charges would distort the direct costs and program revenues reported for the functions affected.

Notes to Basic Financial Statements Year Ended June 30, 2018
City of Somerville, Massachusetts 49 Comprehensive Annual Financial Report
Fund Financial Statements Governmental fund financial statements are reported using the flow of current financial resources measurement focus and the modified accrual basis of accounting. Under the modified accrual basis of accounting, revenues are recognized when susceptible to accrual (i.e., measurable and available). Measurable means the amount of the transaction can be determined and available means collectible within the current period or soon enough thereafter to pay liabilities of the current period. Expenditures generally are recorded when a liability is incurred, as under accrual accounting. However, debt service expenditures, as well as expenditures related to compensated absences, and claims and judgments, are recorded only when payment is due. General capital asset acquisitions are reported as expenditures in governmental funds. Issuance of long-term debt and acquisitions under capital leases are reported as other financing sources. Real estate and personal property tax revenues are considered available if they are collected within 60 days after year-end. Investment income is susceptible to accrual. Other receipts and tax revenues become measurable and available when the cash is received and are recognized as revenue at that time. Entitlements and shared revenues are recorded at the time of receipt or earlier if the susceptible to accrual criteria is met. Expenditure driven grants recognize revenue when the qualifying expenditures are incurred and all other grant requirements are met. The following major governmental funds are reported: The general fund is the primary operating fund. It is used to account for all financial resources, except those that are required to be accounted for in another fund. The strategic planning and community development fund is used to account for grant activities of the Office of Strategic Planning and Community Development. The capital projects fund is used to account for activities associated with constructing and acquiring assets for both general city-wide and school construction projects. The nonmajor governmental funds consist of other special revenue, capital projects and permanent funds that are aggregated and presented in the nonmajor governmental funds column on the governmental funds financial statements. The following describes the general use of these fund types: The special revenue fund is used to account for and report the proceeds of specific revenue sources that are restricted or committed to expenditure for specified purposes other than permanent funds or capital projects. The capital projects fund is used to account for and report financial resources that are restricted, committed, or assigned to expenditure for capital outlays, including the acquisition or construction of capital facilities and other capital assets of the governmental funds. The permanent fund is used to account for and report financial resources that are legally restricted to the extent that only earnings, not principal, may be used for purposes that support the governmental programs. Proprietary fund financial statements are reported using the flow of economic resources measurement focus and use the accrual basis of accounting. Under this method, revenues are recorded when earned and expenses are recorded when the liabilities are incurred. Proprietary funds distinguish operating revenues and expenses from nonoperating items. Operating revenues and expenses generally result from providing services and producing and delivering goods in connection with the

Notes to Basic Financial Statements Year Ended June 30, 2018
City of Somerville, Massachusetts 50 Comprehensive Annual Financial Report
proprietary funds principal ongoing operations. All revenues and expenses not meeting this definition are reported as nonoperating revenues and expenses. The following major proprietary funds are reported: The water enterprise fund is used to account for financial activity that occurs as a result of the ongoing operations within the water department. The sewer enterprise fund is used to account for the financial activity that occurs as a result of the ongoing operations within the sewer department. The Veterans Memorial Ice Rink enterprise fund is used to account for financial activity that occurs as a result of the ongoing operation of the Veteran’s Memorial Ice Rink and the second auxiliary rink. The Dilboy Field enterprise fund is used to account for financial activity that occurs as a result of the ongoing operations of the Dilboy Stadium. Fiduciary fund financial statements are reported using the flow of economic resources measurement focus and use the accrual basis of accounting. Fiduciary funds are used to account for assets held in a trustee capacity for others that cannot be used to support the governmental programs. The following fiduciary fund types are reported: The pension trust fund is used to account for the activities of the System, which accumulates resources to provide pension benefits to eligible retirees and their beneficiaries. The other postemployment benefits trust fund is a fund being used to accumulate resources to provide funding for future other postemployment benefits (OPEB) liabilities. The private-purpose trust fund is used to account for trust arrangements that exclusively benefit individuals, private organizations, or other governments. Some of these trusts have donor restrictions and trustee policies that do not allow the endowment portion and any unrealized appreciation to be spent. The donor restrictions and trustee policies only allows the trustees to authorize spending of the realized investment earnings. The City’s educational scholarship trusts are accounted for in this fund. The agency fund is used to account for assets held in a purely custodial capacity. It is used to account for the City’s construction deposits, police detail activity and student activity accounts. D. Cash and Investments Government-Wide and Fund Financial Statements Cash and cash equivalents are considered to be cash on hand, demand deposits and short-term investments with an original maturity of three months or less from the date of acquisition. Investments are carried at fair value. E. Fair Value Measurements The City reports required types of financial instruments in accordance with the fair value standards. These standards require an entity to maximize the use of observable inputs (such as quoted prices in active markets) and minimize the use of unobservable inputs (such as appraisals or valuation techniques) to determine fair value. Fair value standards also require the government to classify these financial instruments into a three-level

Notes to Basic Financial Statements Year Ended June 30, 2018
City of Somerville, Massachusetts 51 Comprehensive Annual Financial Report
hierarchy, based on the priority of inputs to the valuation technique or in accordance with net asset value practical expedient rules, which allow for either Level 2 or Level 3 depending on lock up and notice periods associated with the underlying funds. Instruments measured and reported at fair value are classified and disclosed in one of the following categories: Level 1 – Quoted prices are available in active markets for identical instruments as of the reporting date. Instruments, which are generally included in this category, include actively traded equity and debt securities, U.S. government obligations, and mutual funds with quoted market prices in active markets. Level 2 – Pricing inputs are other than quoted in active markets, which are either directly or indirectly observable as of the reporting date, and fair value is determined through the use of models or other valuation methodologies. Certain fixed income securities, primarily corporate bonds, are classified as Level 2 because fair values are estimated using pricing models, matrix pricing, or discounted cash flows. Level 3 – Pricing inputs are unobservable for the instrument and include situations where there is little, if any, market activity for the instrument. The inputs into the determination of fair value require significant management judgment or estimation. In some instances the inputs used to measure fair value may fall into different levels of the fair value hierarchy and is based on the lowest level of input that is significant to the fair value measurement. Market price is affected by a number of factors, including the type of instrument and the characteristics specific to the instrument. Instruments with readily available active quoted prices generally will have a higher degree of market price observability and a lesser degree of judgment used in measuring fair value. It is reasonably possible that change in values of these instruments will occur in the near term and that such changes could materially affect amounts reported in these financial statements. For more information on the fair value of the City’s financial instruments, see Note 2 – Cash and Investments. F. Accounts Receivable Government-Wide and Fund Financial Statements The recognition of revenue related to accounts receivable reported in the government-wide financial statements and the fiduciary funds financial statements are reported under the accrual basis of accounting. The recognition of revenue related to accounts receivable reported in the governmental funds financial statements are reported under the modified accrual basis of accounting. Real Estate, Personal Property Taxes and Tax Liens Real estate and personal property taxes are levied and based on values assessed on January 1st of every year. Assessed values are established by the Board of Assessors for 100% of the estimated fair market value. Taxes are due on August 1st, November 1st, February 1st and May 1st and are subject to penalties and interest if they are not paid by the respective due date. Real estate and personal property taxes levied are recorded as receivables in the year of the levy. Real estate tax liens are processed six months after the close of the valuation year on delinquent properties and are recorded as receivables in the year they are processed.
Notes to Basic Financial Statements Year Ended June 30, 2018
City of Somerville, Massachusetts 52 Comprehensive Annual Financial Report
Real estate receivables are secured via the tax lien process and are considered 100% collectible. Accordingly, an allowance for uncollectibles is not reported. Personal property taxes cannot be secured through the lien process. The allowance of uncollectibles is estimated based on historical trends and specific account analysis. Motor Vehicle Excise Motor vehicle excise taxes are assessed annually for each vehicle registered in the City and are recorded as receivables in the year of the levy. The Commonwealth is responsible for reporting the number of vehicles registered and the fair values of those vehicles. The tax calculation is the fair value of the vehicle multiplied by $25 per $1,000 of value. The allowance for uncollectibles is estimated based on historical trends and specific account analysis. Water and Sewer User fees are levied monthly based on individual meter readings and are subject to penalties and interest if they are not paid by the respective due date. Water and Sewer liens are processed in December of every year and included as a lien on the property owner’s tax bill. Water and Sewer charges and liens are recorded as receivables in the year of the levy. Since the receivables are secured via the lien process, these accounts are considered 100% collectible and therefore do not report an allowance for uncollectibles. Departmental and Other Departmental and other receivables consist primarily of parking fines and are recorded as receivables in the year accrued. The allowance of uncollectibles is estimated based on historical trends and specific account analysis. Intergovernmental Various federal and state grants for operating and capital purposes are applied for and received annually. For non-expenditure driven grants, receivables are recorded as soon as all eligibility requirements imposed by the provider have been met. For expenditure driven grants, receivables are recorded when the qualifying expenditures are incurred and all other grant requirements are met. These receivables are considered 100% collectible and therefore do not report an allowance for uncollectibles. Loans The Office of Strategic Planning and Community Development administers loan programs that provide housing assistance to residents and capital needs assistance for small businesses. Upon issuance, a receivable is recorded for the principal amount of the loan. Loan receivables are secured via the lien process and are considered 100% collectible. Accordingly, an allowance for uncollectibles is not reported.
Notes to Basic Financial Statements Year Ended June 30, 2018
City of Somerville, Massachusetts 53 Comprehensive Annual Financial Report
G. Inventories Government-Wide and Fund Financial Statements Inventories are recorded as expenditures at the time of purchase. Such inventories are not material in total to the government-wide and fund financial statements, and therefore are not reported. H. Capital Assets Government-Wide Fund Financial Statements Capital assets, which include land, construction in progress, land improvements, books and periodicals, buildings and improvements, machinery and equipment, vehicles, and infrastructure (e.g., roads, water mains, sewer mains, and similar items), are reported in the applicable governmental activity column of the government-wide financial statements. Capital assets are recorded at historical cost, or at estimated historical cost, if actual historical cost is not available. Donated capital assets, donated works of art, historical treasurers and similar assets, and capital assets received in service concession arrangements are recorded at acquisition value. Construction period interest is capitalized on constructed capital assets except for the capital assets of the governmental activities column in the government-wide financial statements. All purchases and construction costs in excess of $50,000 are capitalized at the date of acquisition or construction, respectively, with expected useful lives of greater than one year. Capital assets (excluding land) are depreciated on a straight-line basis. The estimated useful lives of capital assets are as follows:
EstimatedUseful Life
Capital Asset Type (in years)
Land improvements………………………………………… 20-40Books and periodicals……………………………………… 10Buildings and improvements……………………………… 20-40Machinery and equipment………………………………… 5-10Vehicles……………………………………………………… 5-15Infrastructure………………………………………………… 10-50
The cost of normal maintenance and repairs that do not add to the value of the assets or materially extend asset lives are not capitalized and are treated as expenses when incurred. Improvements are capitalized. Governmental Fund Financial Statements Capital asset costs are recorded as expenditures in the acquiring fund in the year of the purchase. I. Deferred Outflows/Inflows of Resources Government-Wide Financial Statements (Net Position) In addition to assets, the statement of financial position will sometimes report a separate section for deferred outflows of resources. This separate financial statement element, deferred outflows of resources, represents a consumption of net position that applies to a future period(s) and so will not be recognized as an outflow of
Notes to Basic Financial Statements Year Ended June 30, 2018
City of Somerville, Massachusetts 54 Comprehensive Annual Financial Report
resources (expense/ expenditure) until then. The City reported deferred charges on refunding, deferred outflows related to other postemployment benefits and deferred outflows related to pensions in this category. In addition to liabilities, the statement of financial position will sometimes report a separate section for deferred inflows of resources. This separate financial statement element, deferred inflows of resources, represents an acquisition of net position that applies to a future period(s) and so will not be recognized as an inflow of resources (revenue) until that time. The City reported deferred inflows related to pensions and deferred inflows related to other postemployment benefits in this category. Governmental Fund Financial Statements In addition to liabilities, the governmental funds balance sheet will sometimes report a separate section for deferred inflows of resources. This separate financial statement element, deferred inflows of resources, represents assets that have been recorded in the governmental fund financial statements but the revenue is not available and so will not be recognized as an inflow of resources (revenue) until it becomes available. The City has recorded unavailable revenue as deferred inflows of resources in the governmental funds balance sheet. J. Unavailable Revenue Unavailable revenue at the governmental fund financial statement level represents billed receivables that do not meet the availability criterion in accordance with the current financial resources measurement focus and the modified accrual basis of accounting. Unavailable revenue is recognized as revenue in the conversion to the entity-wide (full accrual) financial statements. K. Interfund Receivables and Payables During the course of its operations, transactions occur between and within individual funds that may result in amounts owed between funds. Government-Wide Financial Statements Transactions of a buyer/seller nature between and within governmental funds and internal service funds are eliminated from the governmental activities in the statement of Net Position. Any residual balances outstanding between the governmental activities and business-type activities are reported in the statement of Net Position as “internal balances”. Fund Financial Statements Transactions of a buyer/seller nature between and within funds are not eliminated from the individual fund statements. Receivables and payables resulting from these transactions are classified as “Due from other funds” or “Due to other funds” on the balance sheet. L. Interfund Transfers During the course of its operations, resources are permanently reallocated between and within funds. These transactions are reported as operating transfers in and operating transfers out.

Notes to Basic Financial Statements Year Ended June 30, 2018
City of Somerville, Massachusetts 55 Comprehensive Annual Financial Report
Government-Wide Financial Statements Transfers between and within governmental funds are eliminated from the governmental activities in the statement of activities. Any residual balances outstanding between the governmental activities and business-type activities are reported in the statement of activities as “Transfers, net”. Fund Financial Statements Transfers between and within funds are not eliminated from the individual fund statements and are reported as operating transfers in and operating transfers out. M. Net Position and Fund Equity Government-Wide Financial Statements (Net Position) Net position reported as “net investment in capital assets” includes capital assets, net of accumulated depreciation, less the principal balance of outstanding debt used to acquire capital assets. Unspent proceeds of capital related debt are not considered to be capital assets. Outstanding debt related to future reimbursements from the state’s school building program is not considered to be capital related debt. Net position is reported as restricted when amounts that are not available for appropriation or are legally restricted by outside parties for a specific future use. Net position has been “restricted for” the following: “Streets” represents amounts committed by the Commonwealth for the repair and/or construction of streets. “Community Development” represents amounts committed by the Federal Department of Housing and Urban Development (HUD) for various community development projects. “Loans” represents community development outstanding loans receivable balances. “Permanent funds – nonexpendable” represents the endowment portion of donor restricted trusts that support governmental programs. “Permanent funds – expendable” represents the amount of realized and unrealized investment earnings of donor restricted trusts. The donor restrictions and trustee policies only allows the trustees to approve spending of the realized investment earnings that support governmental programs. “Gifts and Grants” represents restrictions placed on assets from outside parties, such as federal and state grants. “Community Preservation” represents financial resources raised through the tax levy to fund Community Preservation related projects. Sometimes the City will fund outlays for a particular purpose from both restricted (e.g., restricted bond or grant proceeds) and unrestricted resources. In order to calculate the amounts to report as restricted – net position and unrestricted – net position in the government-wide and proprietary fund financial statements, a flow assumption must be made about the order in which the resources are considered to be applied. It is the City’s policy to consider restricted – net position to have been depleted before unrestricted – net position is applied.
Notes to Basic Financial Statements Year Ended June 30, 2018
City of Somerville, Massachusetts 56 Comprehensive Annual Financial Report
Fund Financial Statements (Fund Balances) Governmental fund balances are classified as nonspendable, restricted, committed, assigned, or unassigned based on the extent to which the government is bound to honor constraints on the specific purposes for which amounts in those funds can be spent. The governmental fund balance classifications are as follows: “Nonspendable” fund balance includes amounts that cannot be spent because they are either not in spendable form or they are legally or contractually required to be maintained intact. “Restricted” fund balance includes amounts subject to constraints placed on the use of resources that is either externally imposed by creditors, grantors, contributors, or laws or regulations of other governments; or that are imposed by law through constitutional provisions or enabling legislation. “Committed” fund balance includes amounts that can only be used for specific purposes pursuant to constraints imposed by formal action of the government’s highest level of decision-making authority. Approval by the Board of Alderman is the highest level of decision-making authority for the government that can, by approval of a council order prior to the end of the year, commit fund balance. Once adopted, the limitation imposed by the order remains in place until a similar action is taken to remove or revise the limitation. “Assigned” fund balance includes amounts that are constrained by the City’s intent to be used for specific purposes, but are neither restricted nor committed. The City Finance Director has the authority to assign fund balance. Funds are assigned when the City has an obligation to purchase goods or services from the current years’ appropriation. Assignments generally only exist temporarily. Additional action does not have to be taken for the removal of an assignment. “Unassigned” fund balance includes the residual classification for the general fund. This classification represents fund balance that has not been assigned to other funds and that has not been restricted, committed, or assigned to specific purposes within the general fund. The general fund is the only fund that that can report a positive unassigned fund balance amount. The City’s spending policy is to spend restricted fund balance first, followed by committed, assigned and unassigned fund balance. Most governmental funds are designated for one purpose at the time of their creation. Therefore, any expenditure from the fund will be allocated to the applicable fund balance classifications in the order of the aforementioned spending policy. The general fund and certain other funds may have more than one purpose. N. Pensions For purposes of measuring the net pension liability, deferred outflows of resources and deferred inflows of resources related to pensions, and pension expense, information about the fiduciary net position of the Somerville Contributory Retirement System and the Massachusetts Teachers Retirement System and additions to/deductions from the Systems fiduciary net position have been determined on the same basis as they are reported by the Systems. For this purpose, benefit payments (including refunds of employee contributions) are recognized when due and payable in accordance with the benefit terms. Investments are reported at fair value.
Notes to Basic Financial Statements Year Ended June 30, 2018
City of Somerville, Massachusetts 57 Comprehensive Annual Financial Report
O. Long-term debt Government-Wide and Proprietary Fund Financial Statements Long-term debt is reported as a liability in the government-wide statement of Net Position. Material bond premiums and discounts are deferred and amortized over the life of the bonds using the effective interest method. Bonds payable are reported net of the applicable bond premium or discount. Governmental Fund Financial Statements The face amount of governmental funds long-term debt is reported as other financing sources. Bond premiums and discounts, as well as issuance costs, are recognized in the current period. Bond premiums are reported as other financing sources and bond discounts are reported as other financing uses. Issuance costs, whether or not withheld from the actual bond proceeds received, are reported as general government expenditures. P. Investment Income Excluding the permanent funds, investment income derived from major and nonmajor governmental funds is legally assigned to the general fund unless otherwise directed by Massachusetts General Law (MGL). Investment income of the proprietary funds is retained in the respective enterprise fund. Q. Compensated Absences Employees are granted vacation and sick leave in varying amounts based on collective bargaining agreements, state laws and executive policies. Government-Wide Financial Statements Vested or accumulated vacation and sick leave are reported as liabilities and expensed as incurred. Governmental Fund Financial Statements Vested or accumulated vacation and sick leave, which will be liquidated with expendable available financial resources, are reported as expenditures and fund liabilities. R. Use of Estimates Government-Wide and Fund Financial Statements The preparation of basic financial statements in conformity with GAAP requires management to make estimates and assumptions that affect the reported amounts of assets and liabilities and disclosure for contingent assets and liabilities at the date of the basic financial statements and the reported amounts of the revenues and expenditures/expenses during the year. Actual results could vary from estimates that were used. S. Individual Fund Deficits At June 30, 2018, the Capital Projects Fund reports a fund deficit of $31.0 million. This deficit will be funded with available funds and future bond proceeds.

Notes to Basic Financial Statements Year Ended June 30, 2018
City of Somerville, Massachusetts 58 Comprehensive Annual Financial Report
T. Total Column Government-Wide Financial Statements The total column presented on the government-wide financial statements represents consolidated financial information. Fund Financial Statements The total column on the fund financial statements is presented only to facilitate financial analysis. Data in this column is not the equivalent of consolidated financial information. NOTE 2 - CASH AND INVESTMENTS A cash and investment pool is maintained that is available for use by all funds. Each fund type's portion of this pool is displayed on the balance sheet as "Cash and Cash Equivalents". The deposits and investments of the trust funds are held separately from those of other funds. Statutes authorize the investment in obligations of the U.S. Treasury, agencies, and instrumentalities, certificates of deposit, repurchase agreements, money market accounts, bank deposits and the State Treasurer's Investment Pool (Pool). In addition, there are various restrictions limiting the amount and length of deposits and investments. The Pool meets the criteria of an external investment pool. The Pool is administered by the Massachusetts Municipal Depository Trust (MMDT), which was established by the Treasurer of the Commonwealth who serves as Trustee. The fair value of the position in the Pool is the same as the value of the Pool shares. The MMDT maintains a cash portfolio and a short-term bond fund with combined average maturities of approximately 3 months. The City Treasurer is the custodian of funds held in the Other Postemployment Benefit (OPEB) Trust Fund. As of June 30, 2018, $7.3 million of the OPEB Trust Fund is included within the City’s cash and investments. Custodial Credit Risk – Deposits In the case of deposits, this is the risk that in the event of a bank failure, the City of Somerville’s deposits may not be returned to it. The City’s investment policy states that safety, liquidity and yield are the most important attributes when deciding on which financial institutions to deposit funds with. These guidelines are intended to further the objective of securing the highest return that is consistent with the safety principal while meeting the daily cash requirements of the City. The Treasurer also subscribes to a bank rating service to assist in the determination of which banks to place deposits with. At year-end, the carrying amount of deposits totaled $200,600,423 and the bank balance totaled $209,148,707. Of the bank balance, $3,473,518 was covered by Federal Depository Insurance, $36,989,527 was covered by the Depositors Insurance Fund, $46,238,835 was covered by Share Insurance Fund, $94,985,827 was collateralized, and $27,461,000 was exposed to custodial credit risk because it was uninsured and uncollateralized. At December 31, 2017, carrying amount of deposits for the System totaled $4,911,041, and the bank balance totaled $5,067,451. The entire bank balance of the System was covered by Federal Depository Insurance and is collateralized.

Notes to Basic Financial Statements Year Ended June 30, 2018
City of Somerville, Massachusetts 59 Comprehensive Annual Financial Report
Investments
As of June 30, 2018, the City of Somerville had the following investments:
Other investments:MMDT - Cash portfolio……………………………… 6,136,869
As of December 31, 2017, the System had the following investments:
Investment Type Fair value Under 1 Year 1-5 Years 6-10 Years Over 10 Years Rating
Debt securities:(1) Loomis Sayles Fixed Income Fund…… $ 69,649,406 $ 25,561,332 $ 18,387,443 $ 14,904,973 $ 10,795,658 Aaa / NR
Other investments:Equity securities..................................... 157,747,063 Equity mutual funds……………………… 24,463,082 Real estate investment trust…………… 21,209,628 Money market mutual funds…………… 1,382,887
Total investments................................... $ 274,452,065
Maturities
(1) The maturities and ratings of the fixed income mutual funds are representative of the average maturities
of the underlying investments of each fund. Custodial Credit Risk – Investments For an investment, this is the risk that, in the event of a failure by the counterparty, the City will not be able to recover the value of its investments or collateral security that are in the possession of an outside party. The City does not have investments that are subject to custodial credit risk. The City’s investment policy states that no more than 20% of the City’s investments should be invested in a single financial institution with the exception of U.S. Treasuries or Agencies and the State Treasurer’s Investment Pool (MMDT). Of the System’s $157,747,063, in equity securities, the System has custodial credit risk exposure of $157,747,063, because the related securities are uninsured, unregistered and held by the counterparty. The System has not adopted a formal investment policy to manage custodial credit risk. Interest Rate Risk The City’s investment policy limits the maturities of investments in the following ways; up to one year from date of purchase for U.S. Treasuries or Agencies, Certificates of Deposit limited to one year terms, Repurchase Agreements not to exceed 90 days. These limits do not apply to fully insured deposits. The System does not have a formal investment policy that limits investment maturities as a means of managing its exposure to fair value losses arising from increasing interest rates.

Notes to Basic Financial Statements Year Ended June 30, 2018
City of Somerville, Massachusetts 60 Comprehensive Annual Financial Report
Credit Risk The City has not adopted a formal policy related to credit risk. The City does not have any debt securities as of June 30, 2018. The City’s investment in MMDT is unrated. The System has not adopted a formal policy related to credit risk. The System’s investment in Fixed Income Mutual Funds have ratings that range from Aaa to not rated and their Money Market Mutual Funds are not rated. Concentration of Credit Risk The City places no limit on the amount the government may invest in any one issuer. The System is not invested more than 5% in any one issuer. The System has not adopted a formal policy related to the amount that may be invested in any one issuer. Fair Value of Investments The City holds investments that are measured at fair value on a recurring basis. Because investing is not a core part of the City’s mission, the City determines that the disclosures related to these investments only need to be disaggregated by major type. The City chooses a narrative format for the fair value disclosures. The City categorizes its fair value measurements within the fair value hierarchy established by generally accepted accounting principles. The hierarchy is based on the valuation inputs used to measure the fair value of the asset. Level 1 inputs are quoted prices in active markets for identical assets; Level 2 inputs are significant other observable inputs; Level 3 inputs are significant unobservable inputs. The City has the following recurring fair value measurements as of June 30, 2018: MMDT investments of $6.1 million are valued at amortized cost. Under the amortized cost method, an investment is valued initially at its cost and adjusted for the amount of interest income accrued each day over the term of the investment to account for any difference between the initial cost and the amount payable at its maturity. If amortized cost is determined not to approximate fair value, the value of the portfolio securities will be determined under procedures established by the Advisor. Retirement System The retiree pension defined benefit plan holds significant amounts of investments that are measured at fair value on a recurring basis. Because investing is a key part of the plan’s activities, the plan shows greater disaggregation in its disclosures. The plan chooses a tabular format for disclosing the levels within the fair value hierarchy.

Notes to Basic Financial Statements Year Ended June 30, 2018
City of Somerville, Massachusetts 61 Comprehensive Annual Financial Report
The System categorizes its fair value measurements within the fair value hierarchy established by generally accepted accounting principles. The System has the following recurring fair value measurements as of December 31, 2017:
Quoted
Prices in
Active Significant
Markets for Other Significant
Identical Observable Unobservable
December 31, Assets Inputs Inputs
Investment Type 2017 (Level 1) (Level 2) (Level 3)
Investments measured at fair value:
Debt securities:
Fixed income mutual funds……………………… $ 69,649,406 $ 69,649,406 $ - $ -
Other investments:
Equity securities.................................................. 157,747,063 157,747,063 - -
Equity mutual funds………………………………… 24,463,082 24,463,082 - -
Real estate investment trust……………………… 21,209,628 - - 21,209,628
Money market mutual funds……………………… 1,382,887 1,382,887 - -
Total other investments...................................... 204,802,659 183,593,031 - 21,209,628
Total investments measured at fair value……………$ 274,452,065 $ 253,242,437 $ - $ 21,209,628
Fair Value Measurements Using
Fixed income mutual funds, equity securities, money market mutual funds, and equity mutual funds classified in Level 1 of the fair value hierarchy are valued using prices quoted in active markets for those securities. Real estate investment trusts are classified in Level 3 are valued using either a discounted cash flow or market comparable companies technique. NOTE 3 – RECEIVABLES At June 30, 2018, receivables for the individual major governmental funds and non-major funds in the aggregate, including the applicable allowances for uncollectible accounts, are as follows:
AllowanceGross for Net
Amount Uncollectibles AmountReceivables:
Real estate and personal property taxes…………$ 1,743,284 $ (87,082) $ 1,656,202 Tax liens……………………………………...……… 825,330 - 825,330 Community preservation fund surtax…………… 18,338 - 18,338 Motor vehicle and other excise taxes…………… 1,758,895 (1,033,208) 725,687 Departmental and other…………………………… 14,136,388 (11,286,393) 2,849,995 Intergovernmental - other………………………… 14,203,239 - 14,203,239 Community preservation state share…………… 233,552 - 233,552 Loans………………………………………………… 23,792,734 - 23,792,734
Total………………………………………………… $ 56,711,760 $ (12,406,683) $ 44,305,077

Notes to Basic Financial Statements Year Ended June 30, 2018
City of Somerville, Massachusetts 62 Comprehensive Annual Financial Report
At June 30, 2018, receivables for the enterprise funds, including the applicable allowances for uncollectible accounts, are as follows:
AllowanceGross for Net
Amount Uncollectibles AmountReceivables:
Water user charges…………… $ 4,279,445 $ - $ 4,279,445 Sewer user charges…………… 7,430,559 - 7,430,559
Total………………………………$ 11,710,004 $ - $ 11,710,004
Governmental funds report unavailable revenue in connection with receivables for revenues that are not considered to be available to liquidate liabilities of the current period. At the end of the current year, the various components of unavailable revenue reported in the governmental funds were as follows:
OtherGeneral Community Governmental
Fund Development Funds TotalReceivables:
Real estate and personal property taxes…………… $ 1,316,303 $ - $ - $ 1,316,303 Tax liens……………………………………...………… 825,330 - - 825,330 Motor vehicle and other excise taxes………………… 725,687 - - 725,687 Departmental and other……………………………… 2,805,547 - 258,643 3,064,190 Intergovernmental - highway improvements………… - - 2,060,220 2,060,220 Intergovernmental - School Building Authority……… 6,467,484 - - 6,467,484 Community development block grants……………… - 1,995,742 - 1,995,742
Total………………………………………………………$ 12,140,351 $ 1,995,742 $ 2,318,863 $ 16,454,956

Notes to Basic Financial Statements Year Ended June 30, 2018
City of Somerville, Massachusetts 63 Comprehensive Annual Financial Report
NOTE 4 – CAPITAL ASSETS Capital asset activity for the year ended June 30, 2018 was as follows:
Beginning EndingBalance Increases Decreases Balance
Governmental Activities:Capital assets not being depreciated:
Land…………………………………………………… $ 37,082,399 $ 1,520,000 $ - $ 38,602,399 Construction in progress……………………………… 16,309,469 39,746,918 (1,722,163) 54,334,224
Total capital assets not being depreciated……… 53,391,868 41,266,918 (1,722,163) 92,936,623
Capital assets being depreciated:
Land improvements…………………………………… 41,836,731 720,322 - 42,557,053 Books and periodicals………………………………… 2,626,489 - - 2,626,489 Buildings and improvements………………………… 202,310,153 644,050 - 202,954,203 Machinery and equipment……………………………… 10,467,187 1,230,773 (90,298) 11,607,662 Vehicles………………………………………………… 15,700,884 1,760,624 (874,760) 16,586,748 Infrastructure…………………………………………… 47,987,060 1,861,561 - 49,848,621
Total capital assets being depreciated………… 320,928,504 6,217,330 (965,058) 326,180,776
Less accumulated depreciation for:
Land improvements…………………………………… (16,039,542) (1,592,407) - (17,631,949) Books and periodicals………………………………… (2,562,854) (30,967) - (2,593,821) Buildings and improvements………………………… (76,428,761) (4,981,657) - (81,410,418) Machinery and equipment……………………………… (8,385,241) (526,702) 90,298 (8,821,645) Vehicles………………………………………………… (9,843,473) (911,461) 874,760 (9,880,174) Infrastructure…………………………………………… (28,743,673) (972,486) - (29,716,159)
Total accumulated depreciation………………… (142,003,544) (9,015,680) 965,058 (150,054,166)
Total capital assets being depreciated, net…………… 178,924,960 (2,798,350) - 176,126,610
Total governmental activities capital assets, net……… $ 232,316,828 $ 38,468,568 $ (1,722,163) $ 269,063,233

Notes to Basic Financial Statements Year Ended June 30, 2018
City of Somerville, Massachusetts 64 Comprehensive Annual Financial Report
Beginning EndingBalance Increases Decreases Balance
Water:Capital assets not being depreciated:
Construction in progress………………………… $ - $ 393,486 $ - $ 393,486
Capital assets being depreciated: Buildings………………………………….………… 16,087 - - 16,087 Machinery and equipment………………………… 5,267,964 - - 5,267,964 Vehicles……………………………………………… 462,918 - - 462,918 Infrastructure………………………………………… 38,786,999 2,732,648 - 41,519,647
Total capital assets being depreciated……… 44,533,968 2,732,648 - 47,266,616
Less accumulated depreciation for:
Buildings………………………………….………… (10,052) (806) - (10,858) Machinery and equipment………………………… (2,752,957) (360,049) - (3,113,006) Vehicles……………………………………………… (446,368) (16,550) - (462,918) Infrastructure………………………………………… (9,930,314) (883,281) - (10,813,595)
Total accumulated depreciation……………… (13,139,691) (1,260,686) - (14,400,377)
Total capital assets being depreciated, net………… 31,394,277 1,471,962 - 32,866,239
Total water activities capital assets, net………………$ 31,394,277 $ 1,865,448 $ - $ 33,259,725
Beginning EndingBalance Increases Decreases Balance
Sewer:Capital assets not being depreciated:
Construction in progress………………………………$ 22,244 $ 2,106,846 $ (22,244) $ 2,106,846
Capital assets being depreciated: Vehicles………………………………………………… 434,092 - - 434,092 Infrastructure…………………………………………… 35,997,048 2,074,424 - 38,071,472
Total capital assets being depreciated………… 36,431,140 2,074,424 - 38,505,564
Less accumulated depreciation for:
Vehicles………………………………………………… (258,489) (34,924) - (293,413) Infrastructure…………………………………………… (14,185,778) (509,116) - (14,694,894)
Total accumulated depreciation………………… (14,444,267) (544,040) - (14,988,307)
Total capital assets being depreciated, net…………… 21,986,873 1,530,384 - 23,517,257
Total sewer activities capital assets, net…………………$ 22,009,117 $ 3,637,230 $ (22,244) $ 25,624,103

Notes to Basic Financial Statements Year Ended June 30, 2018
City of Somerville, Massachusetts 65 Comprehensive Annual Financial Report
Beginning EndingBalance Increases Decreases Balance
Rink:Capital assets being depreciated:
Buildings and improvements………………$ 3,435,934 $ - $ - $ 3,435,934
Less accumulated depreciation for: Buildings and improvements……………… (386,542) (85,898) - (472,440)
Total rink activities capital assets, net………$ 3,049,392 $ (85,898) $ - $ 2,963,494
Depreciation expense was charged to functions/programs of the primary government as follows:
Governmental Activities:
General government……………………………………………………… $ 821,852 Public safety………………………………………………………………… 575,254
Education…………………………………………………………………… 4,673,494 Public works………………………………………………………………… 1,772,906 Culture and recreation……………………………………………………… 1,172,174
Total depreciation expense - governmental activities……………………… $ 9,015,680
Business-Type Activities:
Water…………………………………………………………………..…… $ 1,260,686 Sewer…………………………………………………………………..…… 544,040 Rink…………………………………………………………………..……… 85,898
Total depreciation expense - business-type activities………………………$ 1,890,624
NOTE 5 – INTERFUND RECEIVABLES, PAYABLES AND TRANSFERS The City’s interfund balances at June 30, 2018, consisted of $2,163,092 in balances within the nonmajor governmental funds which represent interfund borrowings for short-term cash flow needs. Interfund transfers for the year ended June 30, 2018, are summarized as follows:
StrategicPlanning & Capital Nonmajor Rink
General Community Projects governmental EnterpriseTransfers Out: fund Development fund funds fund Total
General fund………………………………………………$ - $ 29,891 $ - $ 1,572,148 $ 199,000 $ 1,801,039 (1) Capital Projects fund…………………………………… 6,419 - - - - 6,419 (2) Nonmajor governmental funds………………………… 2,640,761 - 20,055 - - 2,660,816 (3) Sewer enterprise fund…………………………………… 655,701 - - - - 655,701 (4) Water enterprise fund…………………………………… 631,696 - - - - 631,696 (4)
Total……………………………………………………… $ 3,934,577 $ 29,891 $ 20,055 $ 1,572,148 $ 199,000 $ 5,755,671
Transfers In:
(1) Represents budgeted transfers out of the general fund to various projects and nonmajor funds, a subsidy
transfer to the Veteran’s Memorial Ice Rink.
(2) Represents various transfers from capital projects to the general fund.

Notes to Basic Financial Statements Year Ended June 30, 2018
City of Somerville, Massachusetts 66 Comprehensive Annual Financial Report
(3) Represents transfers with various nonmajor projects.
(4) Represents the transfer of indirect costs to the general fund. NOTE 6 – OPERATING LEASES Operating Leases The City leases two police sub-stations under several noncancelable operating leases. The total cost of these leases for the year ended June 30, 2018, was approximately $14,400 and is reported as public safety expenditures in the basic financial statements. The Police substation leases were renewed through February of 2021 and June of 2021. Additionally the City entered a lease for a street sweeper under an operating lease. The total cost for the vehicle for the year ended June 30, 2018, was approximately $37,000 and is reported as public works expenditures in the basic financial statements. The lease terms go through September of 2021. NOTE 7 – SHORT-TERM FINANCING Short-term debt may be authorized and issued to fund the following:
Current operating costs prior to the collection of revenues through issuance of revenue or tax anticipation notes (RANS or TANS).
Capital project costs and other approved expenditures incurred prior to obtaining permanent financing
through issuance of bond anticipation notes (BANS) or grant anticipation notes (GANS).
Short-term loans are general obligations and carry maturity dates that are limited by statute. Interest expenditures and expenses for short-term borrowings are accounted for in the general fund and capital projects fund, respectively. Details related to the short-term debt activity for the year ended June 30, 2018, is as follows: Governmental Activities
Balance at Balance atRate June 30, Renewed/ Retired/ June 30,
Type Purpose (%) Due Date 2017 Issued Redeemed 2018
Governmental Funds:BAN Municipal Purpose……………………… 2.00% 06/08/18 $ 39,043,332 $ - $ (39,043,332) $ - BAN Municipal Purpose……………………… 3.00% 06/07/19 - 89,958,702 - 89,958,702
Total Governmental Funds…………………………………………………$ 39,043,332 $ 89,958,702 $ (39,043,332) $ 89,958,702

Notes to Basic Financial Statements Year Ended June 30, 2018
City of Somerville, Massachusetts 67 Comprehensive Annual Financial Report
Enterprise Activities
Balance at Balance atRate June 30, Renewed/ Retired/ June 30,
Type Purpose (%) Due Date 2017 Issued Redeemed 2018
Water Enterprise Fund:BAN Water Main Repairs……………………… 2.00% 06/08/18 $ 2,500,000 $ - $ (2,500,000) $ - BAN Cedar Street Water Repairs…………… 2.00% 06/08/18 1,300,000 - (1,300,000) - BAN Water Repairs…………………………… 3.00% 06/07/19 - 8,732,500 - 8,732,500
Total Water Enterprise Fund……………………………………………… $ 3,800,000 $ 8,732,500 $ (3,800,000) $ 8,732,500
Sewer Enterprise Fund:BAN Nunziato Field Stormwater Project…… 2.00% 06/08/18 $ 700,000 $ - $ (700,000) $ - BAN Sewer Main Repairs…………………… 2.00% 06/08/18 1,500,000 - (1,500,000) - BAN Cedar Street Sewer Repairs…………… 2.00% 06/08/18 3,000,000 - (3,000,000) - BAN Sewer Repairs…………………………… 3.00% 06/07/19 - 20,694,500 - 20,694,500 BAN Nunziato Field Stormwater Project…… 3.00% 06/07/19 - 500,000 - 500,000
Total Sewer Enterprise Fund………………………………………………$ 5,200,000 $ 21,194,500 $ (5,200,000) $ 21,194,500
Total Enterprise Funds………………………………………………………$ 9,000,000 $ 29,927,000 $ (9,000,000) $ 29,927,000
NOTE 8 - LONG-TERM DEBT Under the provisions of Chapter 44, Section 10, Municipal Law authorizes indebtedness up to a limit of 5% of the equalized valuation. Debt issued in accordance with this section of the law is designated as being "inside the debt limit". In addition, however, debt may be authorized in excess of that limit for specific purposes. Such debt, when issued, is designated as being "outside the debt limit". On December 7 and June 7 of the current year, the City issued $9,465,000 and $11,320,000, respectively, of general obligation bonds which were comprised of a $6,669,925 advance refunding, a $2,795,075 current refunding and $11,320,000 of new general obligation bonds. See below for a description of each issuance. In order to take advantage of favorable interest rates the City:
Issued $6,669,925 of general obligation refunding bonds. $6,905,000 of general obligation bonds were defeased by placing the proceeds of the refunding bonds in an irrevocable trust to provide for all future debt service payments on the refunded bonds. Accordingly, the trust account’s assets and liabilities for the defeased bonds are not included in the basic financial statements. The City has decreased its aggregate debt service by $579,271 and resulted in an economic gain of $417,827. At June 30, 2018, $6,050,000 of governmental and $855,000 of enterprise fund bonds outstanding from the advance refunding are considered defeased.
Issued $2,795,075 of general obligation refunding bonds. $2,945,000 of general obligation bonds were
callable and paid down as a result of this transaction. Accordingly, the called bonds are not included in the basic financial statements. The City has decreased its aggregate debt service by $231,690 and resulted in an economic gain of $211,225. At June 30, 2018, $2,090,000 of governmental and $855,000 of sewer enterprise fund bonds were called and are not included in the basic financial statements.
The City issued $11,320,000 of new general obligation bonds. The current year financial statements have recognized bond proceeds in the amount of $10,143,102 in the governmental funds, $496,898 in the water enterprise fund, and $680,000 in the sewer enterprise fund.

Notes to Basic Financial Statements Year Ended June 30, 2018
City of Somerville, Massachusetts 68 Comprehensive Annual Financial Report
Details related to the general obligation bonds outstanding at June 30, 2018, and the debt service requirements are as follows: Bonds Payable Schedule – Governmental Funds
Original Interest Outstanding
Maturities Loan Rate at June 30,
Project Through Amount (%) 2018
MSBA - February 12, 2008…………………………………… 2033 $ 7,282,102 7.1% - 8.0% $ 5,461,577
Municipal Purpose - February 1, 2009………………………… 2028 3,030,000 3.6% - 4.0% 200,000
Municipal Purpose - February 15, 2010………………..…… 2028 2,272,000 2.0% - 5.0% 312,000
Municipal Purpose - April 1, 2010 (Refunding)……………… 2022 13,407,000 2.0% - 5.0% 6,045,000
Municipal Purpose - June 15, 2010………………..………… 2029 6,705,000 2.0% - 5.0% 935,000
Municipal Purpose - February 23, 2011………………..…… 2025 5,020,000 2.0% - 5.0% 2,645,000
Municipal Purpose - May 17, 2013………………..…………… 2042 15,750,000 2.0% - 5.0% 14,310,000
Municipal Purpose - October 9, 2013………………..……… 2033 13,940,000 2.0% - 5.0% 9,165,000
MSBA - September 25, 2013…………………………………… 2043 6,250,000 0.02 5,387,928
Municipal Purpose - October 15, 2015………………..……… 2038 8,603,000 2.125% - 5.0% 8,010,000
Municipal Purpose - October 5, 2016………………..……… 2039 17,771,000 2.0 - 4.0% 17,260,000
Municipal Purpose - June 1, 2017………………..…………… 2042 1,235,000 3.0 - 5.0% 11,765,000
Municipal Purpose - June 7, 2018…………………………… 2023 500,000 2.125% 500,000
Municipal Purpose - June 7, 2018…………………………… 2046 9,643,102 3.0 - 4.0% 9,643,102
Municipal Purpose - December 7, 2017 - Refunding……… 2029 7,810,975 4.0% 7,810,975
99,450,582
Add: Unamortized premium on bonds…………………………………………………………………………………… 6,874,197
Total Bonds Payable, net…………….……………………………………………………………………………………$ 106,324,779

Notes to Basic Financial Statements Year Ended June 30, 2018
City of Somerville, Massachusetts 69 Comprehensive Annual Financial Report
Debt service requirements for principal and interest for Governmental and Enterprise bonds payable in future years are as follows: Governmental Funds
Year Principal Interest Total
2019……………………$ 6,812,925 $ 3,232,066 $ 10,044,991 2020…………………… 6,745,623 2,931,767 9,677,390 2021…………………… 7,119,622 2,507,638 9,627,260 2022…………………… 6,920,147 2,248,358 9,168,505 2023…………………… 5,394,622 1,987,571 7,382,193 2024…………………… 5,274,822 1,810,414 7,085,236 2025…………………… 5,154,622 1,327,422 6,482,044 2026…………………… 4,944,622 1,520,226 6,464,848 2027…………………… 4,844,622 1,367,592 6,212,214 2028…………………… 4,780,672 1,225,078 6,005,750 2029…………………… 4,164,622 1,101,717 5,266,339 2030…………………… 4,124,622 1,001,701 5,126,323 2031…………………… 3,599,622 905,863 4,505,485 2032…………………… 3,369,622 805,419 4,175,041 2033…………………… 3,469,624 706,642 4,176,266 2034…………………… 3,205,517 610,757 3,816,274 2035…………………… 2,535,517 533,906 3,069,423 2036…………………… 2,310,517 470,946 2,781,463 2037…………………… 2,375,517 405,216 2,780,733 2038…………………… 2,450,517 337,181 2,787,698 2039…………………… 2,100,517 273,797 2,374,314 2040…………………… 2,155,517 215,267 2,370,784 2041…………………… 2,220,517 154,963 2,375,480 2042 & thereafter…… 3,376,035 202,017 3,578,052
Total……………………$ 99,450,582 $ 27,883,519 $ 127,334,101
Bonds Payable Schedule – Enterprise Funds
Original Interest Outstanding
Maturities Loan Rate at June 30,
Project Through Amount (%) 2018
Municipal Purpose - December 15, 2009………………………… 2019 $ 4,400,000 2.0% $ 485,000
Municipal Purpose - February 15, 2010………………..………… 2030 1,910,000 2.0% - 5.0% 168,000
Municipal Purpose - April 1, 2010 (Refunding)………………..… 2022 262,000 2.0% - 5.0% 100,000
Municipal Purpose - February 23, 2013………………..………… 2020 424,000 2.0% - 5.0% 110,000
MWRA Notes………………………………………………………… 2022 1,336,000 0.0% 534,400
MWRA Notes………………………………………………………… 2025 875,000 0.0% 612,500
MWRA Notes………………………………………………………… 2023 1,242,340 0.0% 621,170
MWRA Notes………………………………………………………… 2021 138,000 0.0% 82,800
MWRA Notes………………………………………………………… 2027 1,660,000 0.0% 1,494,000
Municipal Purpose - June 7, 2018………………………………… 2046 496,898 3.0% - 4.0% 496,898
Municipal Purpose - December 7, 2017 - Refunding…………… 2030 844,925 4.0% 844,925
Total Water Enterprise………………………………………………………………………………………………… $ 5,549,693
Notes to Basic Financial Statements Year Ended June 30, 2018
City of Somerville, Massachusetts 70 Comprehensive Annual Financial Report
Original Interest Outstanding
Maturities Loan Rate at June 30,
Project Through Amount (%) 2018
Municipal Purpose - April 1, 2010 (Refunding)………………..… 2022 419,000 2.0% - 5.0% $ 160,000
MWRA Notes………………………………………………………… 2019 800,256 0.0% 160,051
Municipal Purpose - June 7, 2018………………………………… 2046 680,000 3.0% - 4.0% 680,000
Municipal Purpose - December 7, 2017 - Refunding…………… 2027 809,100 4.0% 809,100
Total Sewer Enterprise………………………………………………………...………………………………………………$ 1,809,151
Rink Enterprise Debt - October 9, 2013………………..………… 2027 13,940,000 2.0% - 5.0% $ 1,910,000
Total Business-type bonds payable, net…………….…………………………………………………………………$ 9,268,844
Enterprise Funds
Year Principal Interest Total
2019……………………… $ 1,770,683 $ 230,743 $ 2,001,426 2020……………………… 1,132,934 207,533 1,340,467 2021……………………… 1,088,934 149,937 1,238,871 2022……………………… 970,809 127,723 1,098,532 2023……………………… 777,734 106,784 884,518 2024……………………… 658,300 88,788 747,088 2025……………………… 678,500 70,042 748,542 2026……………………… 571,000 53,348 624,348 2027……………………… 576,000 38,953 614,953 2028……………………… 108,950 17,657 126,607 2029……………………… 130,000 15,206 145,206 2030……………………… 125,000 12,475 137,475 2031 & thereafter……… 680,000 197,449 877,449
Total……………………… $ 9,268,844 $ 1,316,635 $ 10,585,479
The Massachusetts Water Resource Authority (MWRA) operates an Infiltration/Inflow Financial Assistance Program for community owned collection systems. For each community approved for the project, financial assistance received from the MWRA consists of a non-interest bearing loan. At June 30, 2018, the outstanding principal amount of these loans totaled $3.5 million. The imputed interest on these loans is immaterial and has not been recognized by the City. The Commonwealth has approved school construction assistance. The assistance program, which is administered by the Massachusetts School Building Authority (MSBA), provides resources for future debt service of general obligation school bonds outstanding. During 2018, $2,673,000 of such assistance was received. Approximately $4,716,000 will be received in future years. Of this amount, approximately $1,198,000 represents reimbursement of long-term interest costs, and approximately $3,517,000 represents reimbursement of approved construction costs. Accordingly, a $3,517,000 intergovernmental receivable and corresponding unavailable revenue have been reported in governmental fund financial statements. The unavailable revenue has been recognized as revenue in the conversion to the government-wide financial statements.

Notes to Basic Financial Statements Year Ended June 30, 2018
City of Somerville, Massachusetts 71 Comprehensive Annual Financial Report
The Commonwealth changed the method for funding the school building assistance program. Under the new program, the assistance is paid to support construction costs and reduce the total debt service of the City. Through the end of 2018, the City has recorded capital grant proceeds totaling $13.8 million related to the East Somerville Community School, $16.9 million related to the Somerville High School project, and $938,000 related to the Winter Hill Community School, from the MSBA, which is equal to 80%, 75.29%, and 70.32%, respectively, of approved construction costs submitted for reimbursement. The City anticipates receiving an additional $1.4 million related to the East Somerville Community School project, $107.1 million related to the Somerville High School project, and $873,000 related to the Winter Hill Community School. Accordingly, a $4.8 million intergovernmental receivable and corresponding deferred inflow of resources - unavailable revenue has been reported in the governmental fund financial statements. This receivable relates to expenditures incurred during 2018 and submitted for reimbursement from the MSBA. The unavailable revenue has been recognized as revenue in the conversion to the government-wide financial statements. The City is subject to various debt limits by statute and may issue additional general obligation debt under the normal debt limit. At June 30, 2018, the City had the following authorized and unissued debt:
Purpose Amount
DPW Salt Shed……………………………………………………………… $ 19,000
High School Feasibility Study & Schematic Design……………………… 141,293
DPW Snow Removal Equipment…………………………………………… 9,425
LED Light Conversion………………………………………………………… 1,475,000
Union Square Water Mains………………………………………………… 85,000
Union Square Streetscape & Utility Early Action Project………………… 740,000
Union Square Traffic Signals and Lighting ………………………………… 375,000
Cedar Street Water Repairs………………………………………………… 1,727,500
Cedar Street Sewer Repairs………………………………………………… 4,697,500
Nunziato Field Stormwater Project………………………………………… 500,000
Lincoln Park Renovation…………………………………………………… 8,262,363
Sidewalk Improvements……………………………………………………… 3,350,000
Beacon Street Reconstruction……………………………………………… 1,500,000
East Broadway Streetscape………………………………………………… 175,000
West Branch Library Rehabilitation………………………………………… 2,500,000
Winter Hill Schoolyard & Nunziato Fields………………………………… 275,000
Sewer Main Rehabilitation & Replacement………………………………… 2,500,000
Water Main Rehabilitation & Replacement………………………………… 4,200,000
Fire Pumper…………………………………………………………………… 544,182
DPW Capital Equipment & Vehicles……………………………………… 1,245,340
MBTA Green Line Extension………………………………………………… 50,000,000
High School Feasibility Study……………………………………………… 192,000
U8 Winter Hill Community School Soccer Field…………………………… 375,000
Building Assesment/Preventative Maintenance Plan…………………… 410,000
ADA Accessibility Building Improvements………………………………… 500,000
High School Construction…………………………………………………… 244,538,155
Winter Hill Community Innovation School Repairs……………………… 3,826,747
Street, Sidewalks, and ADA Ramp Improvements……………………… 2,700,000
45 College Ave Property Acquisition……………………………………… 1,600,000
Somerville Ave Infrastructure Improvements- Water…………………… 63,000,000
Sewer Pump Station and Force Main (Poplar Street)…………………… 2,100,000
Spring Hill Sewer Separation Project Design Phase……………………… 1,500,000
DPW Street Sweepers (Two) & Trackless Vehicles……………………… 436,528
Sewer Main Rehabilitation and Replacement……………………………… 1,500,000
Bueno Vista Garage………………………………………………………… 2,000,000

Notes to Basic Financial Statements Year Ended June 30, 2018
City of Somerville, Massachusetts 72 Comprehensive Annual Financial Report
West Branch Library Renovation…………………………………………… 94,000
100 Homes Affordable Housing Project…………………………………… 6,000,000
Paving and Sidewalk Improvements……………………………………… 2,700,000
DPW Vehicles and Equipment……………………………………………… 1,002,291
ADA Building Improvements………………………………………………… 500,000
Total…………………………………………………………………………… $ 419,296,324
Changes in Long-term Liabilities During the year ended June 30, 2018, the following changes occurred in long-term liabilities:
Bonds and Bonds andBeginning Notes Notes Other Other Ending Due WithinBalance Issued Redeemed Increases Decreases Balance One Year
Governmental Activities:Long-term bonds payable……………………$ 96,738,128 $ 17,954,077 $ (15,241,623) $ - $ - $ 99,450,582 $ 6,812,925
Add: Unamortized premium on bonds…… 4,685,218 - - 2,697,949 (508,970) 6,874,197 679,300 Total bonds payable…………………………… 101,423,346 17,954,077 (15,241,623) 2,697,949 (508,970) 106,324,779 7,492,225 Compensated absences……………………… 3,764,200 - - 23,009 (159,509) 3,627,700 146,700 Workers' compensation……………………… 1,355,000 - - - (434,000) 921,000 230,250 Net pension liability…………………………… 138,459,928 - - - (24,744,952) 113,714,976 - Other postemployment benefits……………… 300,135,076 - - 13,264,291 (46,621,379) 266,777,988 -
Total governmental activitylong-term liabilities…………………………$ 545,137,550 $ 17,954,077 $ (15,241,623) $ 15,985,249 $ (72,468,810) $ 491,366,443 $ 7,869,175
Business-Type Activities:Long-term bonds payable……………………$ 9,950,711 $ 2,830,923 $ (3,512,790) $ - $ - $ 9,268,844 $ 1,770,683 Compensated absences……………………… 63,500 - - 7,300 (1,700) 69,100 1,600 Net pension liability…………………………… 1,706,463 - - - (234,625) 1,471,838 - Other postemployment benefits……………… 2,085,321 - - 92,159 (323,923) 1,853,557 -
Total business-type activitylong-term liabilities…………………………$ 13,805,995 $ 2,830,923 $ (3,512,790) $ 99,459 $ (560,248) $ 12,663,339 $ 1,772,283
The long-term liabilities will be liquidated in the future by the general fund and enterprise funds.

Notes to Basic Financial Statements Year Ended June 30, 2018
City of Somerville, Massachusetts 73 Comprehensive Annual Financial Report
NOTE 9 – GOVERNMENTAL FUND BALANCE CLASSIFICATIONS Massachusetts General Law Ch.40 §5B allows for the establishment of Stabilization funds for one or more different purposes. The creation of a fund requires a two-thirds vote of the legislative body and must clearly define the purpose of the fund. Any change to the purpose of the fund along with any additions to or appropriations from the fund requires a two-thirds vote of the legislative body. At year end the balance of the Rainy Day Stabilization fund if $4.1 million and reported as unassigned fund balance within the general fund. The City’s remaining stabilization funds are for specific purposes and have been reported as committed within the general fund. GASB 54 provides for two major types of fund balances, which are Nonspendable and Spendable. Nonspendable fund balances are balances that cannot be spent because they are not expected to be converted to cash or they are legally or contractually required to remain intact. Examples of this classification are prepaid items, inventories, and principal (corpus) of an endowment fund. The City has reported principal portions of endowment funds as Nonspendable. In addition to the Nonspendable fund balance, GASB 54 has provided a hierarchy of Spendable fund balances, based on a hierarchy of spending constraints.
Restricted: fund balances that are constrained by external parties, constitutional provisions, or enabling legislation.
Committed: fund balances that contain self-imposed constraints of the government from its highest level of decision making authority.
Assigned: fund balances that contain self-imposed constraints of the government to be used for a
particular purpose.
Unassigned: fund balance of the general fund that is not constrained for any particular purpose.

Notes to Basic Financial Statements Year Ended June 30, 2018
City of Somerville, Massachusetts 74 Comprehensive Annual Financial Report
As of June 30, 2018, the fund balances consisted of the following:
StrategicPlanning & Capital Nonmajor TotalCommunity Projects Governmental Governmental
General Development Funds Funds Funds
Fund Balances: Nonspendable:
Permanent fund principal…………………………………………$ - $ - $ - $ 433,126 $ 433,126 Restricted for:
Strategic planning & community development………………… - 16,520,928 - - 16,520,928 School special revenue funds…………………………………… - - - 884,157 884,157 School federal grants……………………………………………… - - - 173 173 School state & private grants…………………………………… - - - 2,103,902 2,103,902 City federal grant funds…………………………………………… - - - 3,409 3,409 City state grant funds……………………………………………… - - - 362,028 362,028 City revolving funds……………………………………………… - - - 198,801 198,801 City receipts reserved…………………………………………… - - - 5,167,134 5,167,134 City private grants………………………………………………… - - - 434,874 434,874 School lunch……………………………………………………… - - - 739,456 739,456 Community preservation………………………………………… - - - 10,957,885 10,957,885 Other special revenue funds……………………………………… - - - 9,384,787 9,384,787 Other permanent funds…………………………………………… - - - 161,034 161,034
Committed to: Health claims……………………………………………………… 11,461,343 - - - 11,461,343 Max-Pak stabilization fund……………………………………… 20,363 - - - 20,363 East Somerville stabilization fund……………………………… 103,961 - - - 103,961 Street Tree stabilization fund…………………………………… 12,910 - - - 12,910 Alpine Restaurant stabilization fund…………………………… 2,544 - - - 2,544 Rockwell Restaurant stabilization fund………………………… 9,169 - - - 9,169 Capital Projects stabilization fund……………………………… 4,860,262 - - - 4,860,262 Construction stabilization fund…………………………………… 1,574,181 - - - 1,574,181 Traffic Safety stabilization fund………………………………… 382,736 - - - 382,736 Mitigation stabilization fund……………………………………… 100,855 - - - 100,855 270 Cedar Street LLC stabilization fund………………………… 1,016 - - - 1,016 Workforce Training stabilization fund…………………………… 417 - - - 417 Bicycle stabilization fund………………………………………… 2,212 - - - 2,212 Linwood Street sidewalk improvement stabilization fund……… 11,906 - - - 11,906 Davis Square traffic and Sign stabilization fund……………… 288 - - - 288 Trash transfer station stabilization fund………………………… 50,287 - - - 50,287 Salary and wage stabilization fund……………………………… 8,743,426 - - - 8,743,426 Open space improvement stabilization fund…………………… 95,944 - - - 95,944 Union square revitalization stabilization fund…………………… 31,099 - - - 31,099 Facility construction & renovation stabilization fund…………… 4,483,388 - - - 4,483,388 Street reconstruction & resurfacing stabilization fund………… 1,519,216 - - - 1,519,216 Elmwood stabilization……………………………………………… 37,652 - - - 37,652 377 Broadway stabilization……………………………………… 4,346 - - - 4,346 Green Line extension stabilization……………………………… 4,458,829 - - - 4,458,829 Highland Ave stabilization………………………………………… 10,000 - - - 10,000 Medical marijuana stabilization………………………………… 88,440 - - - 88,440 Infiltration/ Inflow stabilization…………………………………… 497,508 - - - 497,508 Algonquin Mitigation stabilization fund………………………… 132,139 - - - 132,139 Boynton Yards stabilization fund………………………………… 60,000 - - - 60,000
Assigned to: General government……………………………………………… 738,060 - - - 738,060 Public safety……………………………………………………… 421,600 - - - 421,600 Education…………………………………………………………… 358,962 - - - 358,962 Public works……………………………………………………… 2,557,531 - - - 2,557,531 Culture and recreation…………………………………………… 4,497 - - - 4,497 Employee benefits………………………………………………… 900 - - - 900
Free cash used for subsequent year budget……………………… 1,750,000 - - - 1,750,000 Unassigned………………………………………………………………… 19,666,376 - (31,035,675) - (11,369,299)
Total Fund Balances…………….…………………………………………… $ 64,254,363 $ 16,520,928 $ (31,035,675) $ 30,830,766 $ 80,570,382

Notes to Basic Financial Statements Year Ended June 30, 2018
City of Somerville, Massachusetts 75 Comprehensive Annual Financial Report
NOTE 10 – RISK FINANCING The City is exposed to various risks of loss related to torts; theft of, damage to and destruction of assets; errors and omissions; and natural disasters for which the City carries commercial insurance. The City participates in premium-based health care plans for its active employees and retirees through the Group Insurance Commission. Claims have not exceeded insurance coverage for the last three years. The City is self-insured for its workers’ compensation activities. These activities are accounted for in the General Fund. Workers’ compensation claims are administered in house and are funded on a pay-as-you-go basis from annual appropriations. The estimated future workers’ compensation liability is based on history and injury type. At June 30, 2018, the amount of the liability for workers’ compensation claims totaled $921,000. Changes in the reported liability since July 1, 2016, are as follows:
Current YearBalance at Claims and
Beginning of Changes in Claims Balance at CurrentYear Estimate Payments Year-End Portion
2017…………………$ 1,264,000 $ 505,910 $ (414,910) $ 1,355,000 $ 338,750 2018………………… 1,355,000 386,225 (820,225) 921,000 230,250
NOTE 11 - PENSION PLAN Plan Descriptions The City is a member of the Somerville Contributory Retirement System (System), a cost-sharing multiple-employer defined benefit pension plan covering eligible employees of the 2 member units. The System is administered by five board members (Board) on behalf of all current employees and retirees except for current teachers and retired teachers. Chapter 32 of the MGL assigns authority to establish and amend benefit provisions of the plan. The System is a component unit and is reported as a pension trust fund in the fiduciary fund financial statements. See Note 1 for more information. The City is a member of the Massachusetts Teachers’ Retirement System (MTRS), a cost-sharing multi-employer defined benefit plan. MTRS is managed by the Commonwealth of Massachusetts (Commonwealth) on behalf of municipal teachers and municipal teacher retirees. The Commonwealth is a nonemployer contributor and is responsible for 100% of the contributions and future benefit requirements of the MTRS. The MTRS covers certified teachers in cities (except Boston), towns, regional school districts, charter schools, educational collaboratives and Quincy College. The MTRS is part of the Commonwealth’s reporting entity and the audited financial report may be obtained by visiting http://www.mass.gov/osc/publications-and-reports/financial-reports/. Special Funding Situation The Commonwealth is a nonemployer contributor and is required by statute to make 100% of all actuarially determined employer contributions on behalf of the City to the MTRS. Therefore, the City is considered to be in a special funding situation as defined by GASB Statement No. 68, Accounting and Financial Reporting for Pensions and the Commonwealth is a nonemployer contributor in MTRS. Since the City does not contribute directly to MTRS, there is no net pension liability to recognize. The total of the Commonwealth provided contributions have been allocated based on each employer’s covered payroll to the total covered payroll of employers in MTRS as of
Notes to Basic Financial Statements Year Ended June 30, 2018
City of Somerville, Massachusetts 76 Comprehensive Annual Financial Report
the measurement date of June 30, 2017. The City’s portion of the collective pension expense, contributed by the Commonwealth, of $15,799,215 is reported in the general fund as intergovernmental revenue and pension benefits in the current fiscal year. The portion of the Commonwealth’s collective net pension liability associated with the City is $151,372,752 as of the measurement date. Benefits Provided Both Systems provide retirement, disability, survivor and death benefits to plan members and beneficiaries. Massachusetts Contributory Retirement System benefits are, with certain minor exceptions, uniform from system to system. The Systems provide retirement allowance benefits up to a maximum of 80% of a member's highest three-year average annual rate of regular compensation. For persons who became members on or after April 2, 2012, average salary is the average annual rate of regular compensation received during the five consecutive years that produce the highest average, or, if greater, during the last five years (whether or not consecutive) preceding retirement. Benefit payments are based upon a member's age, length of creditable service, level of compensation, and group classification. Members become vested after ten years of creditable service. There were no reported changes in pension benefit terms that effect measurement of the total pension liability as of December 31, 2017. Employees who resign from service and who are not eligible to receive a retirement allowance or are under the age of 55 are entitled to request a refund of their accumulated total deductions. Survivor benefits are extended to eligible beneficiaries of members whose death occurs prior to or following retirement. Cost-of-living adjustments granted between 1981 and 1997 and any increase in other benefits imposed by the Commonwealth’s state law during those years are borne by the Commonwealth and are deposited into the pension fund. Cost-of-living adjustments granted after 1997 must be approved by the Board and are borne by the System. At December 31, 2017, the SCRS membership consists of the following:
Active members…………………………………………………… 1,195 Inactive members………………………………………………… 420 Disabled members………………………………………………… 129 Retirees and beneficiaries currently receiving benefits….…… 777
Total………………………………………………………………… 2,521
Contributions Chapter 32 of the MGL governs the contributions of plan members and member units. Active plan members are required to contribute at rates ranging from 5% to 9% of gross regular compensation with an additional 2% contribution required for compensation exceeding $30,000. The percentage rate is keyed to the date upon which an employee's membership commences. The member units are required to pay into the SCRS a legislatively mandated actuarial determined contribution that is apportioned among the employers based on active current payroll. The total member units’ contribution for the year ended December 31, 2017 was $14,805,336, 20.24% of covered payroll, actuarially determined as an amount that, when combined with plan member contributions, is expected to finance the costs of benefits earned by plan members during the year, with an additional amount to finance any unfunded accrued liability. The City’s proportionate share of the required contribution was $13,808,937 which equaled its actual contribution.

Notes to Basic Financial Statements Year Ended June 30, 2018
City of Somerville, Massachusetts 77 Comprehensive Annual Financial Report
Pension Liabilities The components of the net pension liability of the participating member units at June 30, 2018, were as follows:
Total pension liability………………………………………$ 402,269,188
Total pension plan's fiduciary net position……………… (279,217,264)
Total net pension liability…………………………………$ 123,051,924
The pension plan's fiduciary net position as
a percentage of the total pension liability…………… 69.41%
At June 30, 2018, the City reported a liability of $115,186,814 for its proportionate share of the net pension liability. The net pension liability was measured as of December 31, 2017, and the total pension liability used to calculate the net pension liability was determined by an actuarial valuation as of January 1, 2017. The City’s proportion of the net pension liability was based on a projection of the City’s long-term share of contributions to the pension plan relative to the projected contributions of all participating members. At December 31, 2017, the City’s proportion was 93.61%, which changed from its proportion measured at December 31, 2016, of 93.53%. Pension Expense For the year ended June 30, 2018, the City recognized a pension expense of $13,063,556. At June 30, 2018, the City reported deferred outflows of resources related to pensions of $1,588,414, and deferred inflows of resources related to pensions of $5,339,146. The balances of deferred outflows and inflows at June 30, 2018 consist of the following:
Deferred DeferredOutflows of Inflows of
Deferred Category Resources Resources Total
Differences between expected and actual experience…………………$ - $ (1,628,591) $ (1,628,591) Net asset gain (loss)……………………………………………………… - (3,566,464) (3,566,464) Changes in assumptions………………………………………………… 1,552,765 - 1,552,765 Changes in proportion and proportionate share of contributions……… 35,649 (144,091) (108,442)
Total deferred outflows/(inflows) of resources………………………… $ 1,588,414 $ (5,339,146) $ (3,750,732)
The deferred outflows of resources related to pensions will be recognized in pension expense as follows:
Year ended June 30:
2019…………………………………………………………… $ 2,197,753 2020…………………………………………………………… 1,041,544 2021…………………………………………………………… (2,581,905) 2022…………………………………………………………… (4,411,140) 2023…………………………………………………………… 3,016
$ (3,750,732)

Notes to Basic Financial Statements Year Ended June 30, 2018
City of Somerville, Massachusetts 78 Comprehensive Annual Financial Report
Actuarial Assumptions The total pension liability in the January 1, 2017, actuarial valuation was determined using the following actuarial assumptions:
Valuation date…………………………………… 1/1/2017
Actuarial cost method…………………………… Individual Entry Age Normal Cost Method.
Investment rate of return………………………
It is assumed that assets of the fund will accumulate at a compound annual rate of 8.00% per annum.
Value of Investments…………………………… Assets held by the fund are valued at market value as reported by the Public Employees' Retirement Administration Commission (PERAC).
Payroll growth…………………………………… 3.00% per year
Cost of living adjustments……………………… 2.50% of the lesser of the pension amount and $13,000 per year.
Mortality rates……………………………………
It is assumed that both pre-retirement mortality and beneficiary mortality is represented by the RP-2014 Blue Collar Mortality with Scale MO-2015, fully generational. Mortality for retires members for Group 1 and 2 is represented by the RP-2014 Blue Collar Mortality Table set forward five years for males and three years for females, fully generational. Mortality for retires members for Group 4 represented by the RP-2014 Blue Collar Mortality Table set forward three years for males and size years for females, fully generational. Mortality for disabled members for Group 1 and 2 is represented by the RP-2000 Mortality Table set forward six years. Mortality for disabled members for Group 4 is represented by the RP-2000 Mortality Table set forward two years. Generational adjusting is based on Scale MP-2015
Investment policy The pension plan’s policy in regard to the allocation of invested assets is established and may be amended by the Board. Plan assets are managed on a total return basis with a long-term objective of achieving and maintaining a fully funded status for the benefits provided through the pension plan.

Notes to Basic Financial Statements Year Ended June 30, 2018
City of Somerville, Massachusetts 79 Comprehensive Annual Financial Report
The long-term expected rate of return on pension plan investments was determined using a building-block method in which best-estimate ranges of expected future real rates of return (expected returns, net of pension plan investment expense and inflation) are developed for each major asset class. These ranges are combined to produce the long-term expected rate of return by weighting the expected future real rates of return by the target asset allocation percentage and by adding expected inflation. Best estimates of arithmetic real rates of return for each major asset class included in the pension plan’s target asset allocation as of January 1, 2017, are summarized in the following table:
Long-Term Expected Long-Term ExpectedAsset Class Asset Allocation Real Rate of Return
Cash………………………………………… 0%-10% 2.75%Large cap equities………………………… 45%-65% 9.00%Small cap equities………………………… 0%-10% 9.00%Multi cap equities…………………………… 0%-5% 9.00%Fixed income investment grade…………… 35%-45% 5.50%Fixed income below investment grade…… 3%-7% 6.00%Real estate…………………………………… 0%-15% 7.50%Venture capital……………………………… 0%-5% 9.00%International………………………………… 0%-15% 8.00%Emerging markets………………………… 0%-3% 9.00%Foreign bonds……………………………… 0%-1% 5.00%
Rate of return For the year ended December 31, 2017, the annual money-weighted rate of return on pension plan investments, net of pension plan investment expense, was 17.92%. The money-weighted rate of return expresses investment performance, net of investment expense, adjusted for the changing amounts actually invested. Discount rate The discount rate used to measure the total pension liability at June 30, 2018, was 8.00%, which changed from June 30, 2017. The projection of cash flows used to determine the discount rate assumed plan member contributions will be made at the current contribution rate and that contributions will be made at rates equal to the actuarially determined contribution rate. Based on those assumptions, the pension plan’s fiduciary net position was projected to be available to make all projected future benefit payments of current plan members. Therefore, the long-term expected rate of return on pension plan investments was applied to all periods of projected benefit payments to determine the total pension liability.

Notes to Basic Financial Statements Year Ended June 30, 2018
City of Somerville, Massachusetts 80 Comprehensive Annual Financial Report
Sensitivity of the net pension liability to changes in the discount rate The following presents the net pension liability, calculated using the discount rate of 8.00%, as well as what the net pension liability would be if it were calculated using a discount rate that is 1-percentage-point lower (7.00%) or 1-percentage-point higher (9.00%) than the current rate:
Current1% Decrease Discount 1% Increase
(7.00%) (8.00%) (9.00%)
The City's proportionate share of thenet pension liability………………………… $ 152,071,562 $ 115,186,814 $ 83,636,996
System total net pension liability……………… $ 162,455,183 $ 123,051,924 $ 89,347,826
December 31, 2017 Measurement Date
December 31, 2017 Measurement Date
Noncontributory Retirement Allowance – The City pays the entire retirement allowance for certain retirees who are eligible for noncontributory benefits and are not members of the System. The general fund expenditure for 2018 totaled $135,000. Changes in Assumptions
The discount rate has changed from 8.25% to 8.00%.
Annual rates of withdrawal prior to retirement have been adjusted based on experience, for both general employees and police and fire employees.
Annual rate of mortality tables used have been updated.
The assumed annual retirement rates for those hired prior to April 2, 2012, have been updated.
The assumed annual retirement rates for those hired on or after April 2, 2012, have been updated.
The assumed annual rates of disability for both general employees and police and fire employees have
been updated.
The annual amount of administrative expenses has been increased to $450,000, and is expected to increase at 4% per year.
Changes in Plan Provisions
The maximum amount of pension benefits subject to a cost of living increase has been raised from $12,000 to $13,000.
NOTE 12 – POSTEMPLOYMENT BENEFITS OTHER THAN PENSIONS Plan Description – The City of Somerville administers a single-employer defined benefit healthcare plan (“Plan”). The Plan provides health, dental and life insurance for eligible retirees and their spouses through a single-

Notes to Basic Financial Statements Year Ended June 30, 2018
City of Somerville, Massachusetts 81 Comprehensive Annual Financial Report
employer defined Other Postemployment Benefit (OPEB) plan. The Plan is administered through the Group Insurance Commission (GIC) as of January 1, 2012. The Plan provides lifetime healthcare and life insurance for eligible retirees and their spouses through the City’s group health, life and GIC health plans which covers both active and retired members. Chapter 32b, Section 19, of the MGL, and an agreement between the City and the Public Employee Committee (PEC) which is subject to renegotiation at the end of each contract period provides the authority to establish and amend benefit provisions of the Plan. The Plan does not issue a publicly available financial report. The employers share is based on the type of plan the employee/retiree is enrolled in. For all HMO and PPO plans, the employer contributes 80% of the premium and for all indemnity plans, the employer contributes 75% of the premium. Funding Policy – Contribution requirements are also negotiated between the City and the PEC. The required contribution is based on a pay-as-you-go financing requirement. The City contributes 80% of the premium for all HMO and PPO plans and 75% of the premium for all indemnity plans per the Chapter 32b, Section 19 PEC Agreement and the retiree’s will contribute the remaining 20% for all HMO and PPO plans and 25% for all indemnity plans. For 2018, the City’s benefit payments totaled $8,485,245, and the City contributed another $5.5 million to the OPEB Trust fund. For the year ended June 30, 2018, the City’s average contribution rate was 20.51% of covered-employee payroll. Plan members are not required to contribute to the Plan. The Commonwealth of Massachusetts passed special legislation that has allowed the City to establish a postemployment benefit trust fund and to enable the City to raise taxes necessary to begin pre-funding its OPEB liabilities. During 2018, the City pre-funded future OPEB liabilities by contributing $5,500,000 of funds to the Other Postemployment Benefit Fund in excess of the pay-as-you-go required contribution. These funds are reported within the Fiduciary Funds financial statements. As of June 30, 2018, the balance of this fund totaled $7.3 million. The annual money-weighted rate of return on OPEB plan investments was 1.18%. The money-weighted rate of return expresses investment performance, net of OPEB plan investment expense, adjusted for the changing amounts actually invested. Plan Membership – The following table represents the Plan’s membership at June 30, 2018:
Active members………………………………………………… 1,658
Retirees and beneficiaries……………………………………… 1,694
Total……………………………………………………………… 3,352
Components of OPEB Liability – The following table represents the components of the Plan’s OPEB liability as of June 30, 2018:
Total OPEB liability……………………………………$ 275,979,621 Less: OPEB plan's fiduciary net position…………… (7,348,076)
Net OPEB liability………………………………………$ 268,631,545
The OPEB plan's fiduciary net positionas a percentage of the total OPEB liability……… 2.66%

Notes to Basic Financial Statements Year Ended June 30, 2018
City of Somerville, Massachusetts 82 Comprehensive Annual Financial Report
Significant Actuarial Methods and Assumptions – The total OPEB liability in the June 30, 2018, actuarial valuation was determined by using the following actuarial assumptions, applied to all periods including the measurement date to be in accordance with GASB #74 and GASB #75.
Valuation date…………………………………… June 30, 2018
Actuarial cost method…………………………… Individual Entry Age Normal Cost Method.
Asset valuation method………………………… Market Value.
Discount rate…………………………………… 3.75%, based on June 30, long term high quality municipal bonds.
Healthcare cost trend rate………………………
5.5% decreasing by 0.5% each year to 4.5% for periods starting in 2020.
Participation………………………………………
95% of future retiree teachers are assumed to participate in the retiree medical plan, 95% of future non-teacher retirees are expected to participate in the retiree medical plan and 100% of future retirees are expected to elect life insurance.
Marital status……………………………………
60% of male employees and 50% of female are assumed to have a covered spouse at retirement. Wives are assumed to be three years younger than their husbands.
Pre-retirement mortality………………………… RP-2014 Blue Collar Mortality with MP-2015, fully generational.
Post-retirement mortality………………………
Group 1 and 2 is represented by the RP-2014 Blue Collar Mortality Table set forward 5 years for males and 3 years for females, fully generational. Group 4 is represented by the RP-2014 Blue Collar Mortality Table set forward 3 years for males and 6 years for females.
Disabled mortality………………………………
Group 1 and 2 is represented by the RP-2000 Mortality Table set forward 6 years. Group 4 is represented by the RP-2000 Mortality Table set forward 2 years.
Investment policy The City’s policy in regard to the allocation of invested assets is established and may be amended by the Board of Aldermen by a majority vote of its members. The OPEB plan’s assets are managed on a total return basis with a long-term objective of achieving and maintaining a fully funded status for the benefits provided through the OPEB plan. The long-term real rate of return on OPEB investments was determined using the City’s investment policy. The long-term expected rate of return on OPEB plan investments was determined using a building-block method in which best-estimate ranges of expected future real of returns (expected returns, net of pension plan investment expense and inflation) are developed for each major asset class. These ranges are combined to produce the long-term expected rate of return of by weighting the expected future real rates of return by the target asset allocation percentage and by adding expected inflation. Currently, the Plan is holding 100% of its trust fund

Notes to Basic Financial Statements Year Ended June 30, 2018
City of Somerville, Massachusetts 83 Comprehensive Annual Financial Report
assets in cash, which has an expected return of 0.8%. The City is expected to develop a long-term investment policy in the future. Discount Rate – The discount rate used to measure the total OPEB liability was 3.75% as of June 30, 2018, which did not change from June 30, 2017. The projection of cash flows used to determine the discount rate assumed that contributions will be made in accordance with the Plan’s funding policy. Based on those assumptions, the OPEB plan’s fiduciary net position was projected to be insufficient to make all projected benefit payments to current plan members. Therefore the long-term expected rate of return on the OPEB plan assets was based on a yield or index rate for 20 year, tax exempt general obligation municipal bonds with an average rate of AA/Aa or higher; which was selected from a range of indices including the Bond Buyer 20 – Bond Municipal Bond Index. Sensitivity of the net position liability to changes in the discount rate – The following table presents the net other postemployment benefit liability and service cost, calculated using the discount rate of 3.75%, as well as what the net other postemployment benefit liability and service cost would be if it were calculated using a discount rate that is 1-percentage-point lower 2.75% or 1-percentage-point higher 4.75% than the current rate.
Current
1% Decrease Discount Rate 1% Increase
(2.75%) (3.75%) (4.75%)
Net OPEB liability……………………………$ 318,595,998 $ 268,631,545 $ 229,633,388
Sensitivity of the net position liability to changes in the healthcare trend – The following table presents the net other postemployment benefit liability and service cost, calculated using the current healthcare trend rate of 6.00%, as well as what the net other postemployment benefit liability and service cost would be if it were calculated using a healthcare trend rate that is 1-percentage-point lower (4.50%) or 1-percentage-point higher (6.50%).
1% Decrease Current Trend 1% Increase
(4.50%) (5.50%) (6.50%)
Net OPEB liability……………………………$ 226,205,876 $ 268,631,545 $ 324,332,034
Changes in Assumptions and Plan Provisions The following assumptions were included in the June 30, 2018, actuarial valuation:
The healthcare cost trend rate was reduced from 6.0% to 5.5%.
There were no changes in plan provisions in the June 30, 2018 actuarial valuation. Summary of Significant Accounting Policies – For purposes of measuring the net OPEB liability, deferred outflows of resources and deferred inflows of resources related to OPEB, and OPEB expense, information about the fiduciary net position of the Plan and additions to/deductions from the Plan’s fiduciary net position have been determined on the same basis as they are reported by the Plan.

Notes to Basic Financial Statements Year Ended June 30, 2018
City of Somerville, Massachusetts 84 Comprehensive Annual Financial Report
For this purpose, the Plan recognizes benefit payments when due and payable in accordance with the benefit terms. Investments are reported at fair value, except for money market investments and participating interest-earning investment contracts (repurchase agreements) that have a maturity at the time of purchase of one year or less, which are reported at cost. Changes in the Net OPEB Liability
PlanTotal OPEB Fiduciary Net OPEB
Liability Net Position Liability(a) (b) (a) - (b)
Balances at June 30, 2017…………………………………………… $ 304,074,941 $ 1,821,275 $ 302,253,666
Changes for the year: Service cost………………………………………………………… 9,597,888 - 9,597,888 Interest……………………………………………………………… 11,592,912 26,801 11,566,111 Contributions - employer…………………………………………… - 13,985,245 (13,985,245) Differences between expected and actual experience………… (40,144,988) - (40,144,988) Benefit payments…………………………………………………… (9,141,132) (8,485,245) (655,887)
Net change……………………………………………………… (28,095,320) 5,526,801 (33,622,121)
Balances at June 30, 2018…………………………………………… $ 275,979,621 $ 7,348,076 $ 268,631,545
Increase (Decrease)
OPEB Expense and Deferred Outflows of Resources and Deferred Inflows of Resources Related to OPEB – For the year ended June 30, 2018, the City recognized an OPEB expense of $13,298,301. At June 30, 2018, the City reported deferred outflows of resources and deferred inflows of resources related to OPEB from the following sources:
Deferred Deferred
Outflows of Inflows of
Deferred Category Resources Resources Total
Differences between expected and actual experience…………………$ - $ (32,304,170) $ (32,304,170)
Difference between projected and actual earnings…………………… 58,149 - 58,149
Total deferred outflows/(inflows) of resources………………………… $ 58,149 $ (32,304,170) $ (32,246,021)
Amounts reported as deferred outflows of resources and deferred inflows of resources related to OPEB will be recognized in OPEB expense as follows:
Measurement date year ended June 30:
2019…………………………………………………………… $ (7,824,202)
2020…………………………………………………………… (7,824,202)
2021…………………………………………………………… (7,824,201)
2022…………………………………………………………… (7,832,518)
2023…………………………………………………………… (940,898)
$ (32,246,021)

Notes to Basic Financial Statements Year Ended June 30, 2018
City of Somerville, Massachusetts 85 Comprehensive Annual Financial Report
NOTE 13 – FINANCIAL STATEMENTS FOR INDIVIDUAL PENSION AND OTHER EMPLOYEE BENEFIT TRUST FUNDS GAAP requires that all Pension and Other Postemployment Trust Funds be combined and presented in one column in the Fiduciary Funds financial statements and that the individual financial statements for each trust fund plan are reported in the notes to the financial statements. Provided below are the individual financial statements for the pension and OPEB plans that are included in the Fiduciary Funds as Pension and Other Postemployment Benefit Trust Funds.
Total Pension
Pension Other and Other
Trust Fund Postemployment Employee
(as of December Benefit Benefit
31, 2017) Trust Fund Trust Funds
ASSETS
Cash and cash equivalents…………………………………………. $ 6,293,928 $ 7,348,076 $ 13,642,004
Investments:
Real estate and alternative investment mutual funds………… 21,209,628 - 21,209,628
Bond mutual funds………………………………………………… 69,649,406 - 69,649,406
Equity securities…………………………………………………… 157,747,063 - 157,747,063
Equity mutual funds……………………………………………… 24,463,082 - 24,463,082
Receivables, net of allowance for uncollectibles:
Departmental and other…………………………………………… 14,283 - 14,283
TOTAL ASSETS………………………………………………………… 279,377,390 7,348,076 286,725,466
LIABILITIES
Warrants payable……………………………………………………… 160,126 - 160,126
NET POSITION
Restricted for pensions……………………………………………… 279,217,264 - 279,217,264
Restricted for other postemployment benefits……………………… - 7,348,076 7,348,076
TOTAL NET POSITION………………………………………………… $ 279,217,264 $ 7,348,076 $ 286,565,340
Total Pension
Pension Other and Other
Trust Fund Postemployment Employee
(as of December Benefit Benefit
31, 2017) Trust Fund Trust Funds
ADDITIONS:
Contributions:
Employer contributions…………………………………………………………$ 165,857 $ 5,500,000 $ 5,665,857
Employer contributions for other postemployment benefit payments…… - 8,485,245 8,485,245
Member contributions………………………………………………………… 22,636,081 - 22,636,081
Retirement benefits - transfers from other systems………………………… 579,727 - 579,727
Retirement benefits - workers compensation settlements………………… 12,150 - 12,150
Retirement benefits - interest not refunded………………………………… 12,970 - 12,970
Intergovernmental……………………………………………………………… 72,227 - 72,227
Total contributions………………………………………………………… 23,479,012 13,985,245 37,464,257
Net investment income:
Investment income……………………………………………………………… 6,571,321 26,801 6,598,122
Net change in fair value of investments……………………………………… 37,421,939 - 37,421,939
Less: investment expense…………………………………………………… (1,300,930) - (1,300,930)
Net investment income (loss)………………………………………………… 42,692,330 26,801 42,719,131
TOTAL ADDITIONS………………………………………………………… 66,171,342 14,012,046 80,183,388
DEDUCTIONS:
Administration…………………………………………………………………… 463,693 - 463,693
Retirement benefits - transfers to other systems…………………………… 894,233 - 894,233
Retirement benefits - 3(8)c transfer to other systems……………………… 1,051,885 - 1,051,885
Retirement benefits and refunds……………………………………………… 27,345,556 - 27,345,556
Other postemployment benefit payments…………………………………… - 8,485,245 8,485,245
TOTAL DEDUCTIONS……………………………………………………… 29,755,367 8,485,245 38,240,612
NET INCREASE (DECREASE) IN NET POSITION…………………… 36,415,975 5,526,801 41,942,776
NET POSITION AT BEGINNING OF YEAR…………………………………… 242,801,289 1,821,275 244,622,564
NET POSITION AT END OF YEAR………………………………………………$ 279,217,264 $ 7,348,076 $ 286,565,340
Notes to Basic Financial Statements Year Ended June 30, 2018
City of Somerville, Massachusetts 86 Comprehensive Annual Financial Report
NOTE 14 - COMMITMENTS The City has entered into an agreement with Wheelabrator Saugus, Inc. to direct the acceptable waste it collects to a transfer station. The City is charged a flat rate per ton that is subject to increase annually equal to but not to exceed any average net increase in the Consumer Price Index for Urban Wage Earners. There are no minimum tonnage requirements that the City must comply with. The School Department has entered into an agreement with S. P. & R. Transportation, Inc. to provide for the transportation of its students. The contract bears an annual cost of approximately $2.3 million and expires on June 30, 2019. The City has entered into, or is planning to enter into, contracts totaling approximately $419.3 million. The Union Square streetscape and utility improvements, Somerville High School reconstruction, MBTA Green Line extension, and various street and sidewalk projects throughout the City are some of the major projects that the City will be completing. NOTE 15 - CONTINGENCIES
The City participates in a number of federal award programs. Although the grant programs have been audited in accordance with the provisions of Title 2 U.S. Code of Federal Regulations Part 200, Uniform Administrative Requirements, Cost Principles, and Audit Requirements for Federal Awards through June 30, 2018, these programs are still subject to financial and compliance audits. The amount, if any, of expenditures which may be disallowed by the granting agencies cannot be determined at this time, although it is expected such amounts, if any, to be immaterial.
Various legal actions and claims are pending. Litigation is subject to many uncertainties, and the outcome of individual litigated matters is not always predictable. Although the amount of liability, if any, at June 30, 2018, cannot be ascertained, management believes any resulting liability should not materially affect the financial position at June 30, 2018. NOTE 16 – SUBSEQUENT EVENTS Management has evaluated subsequent events through January 25, 2019, which is the date the financial statements were available to be issued. NOTE 17 – IMPLEMENTATION OF NEW GASB PRONOUNCEMENTS During 2018, the following GASB pronouncements were implemented:
GASB Statement #75, Accounting and Financial Reporting for Postemployment Benefits Other Than Pensions. The basic financial statements, related notes and required supplementary information were updated to be in compliance with this pronouncement.
GASB Statement #81, Irrevocable Split-Interest Agreements. This pronouncement did not impact the basic financial statements.
GASB Statement #85, Omnibus 2017. This pronouncement did not impact the basic financial statements.

Notes to Basic Financial Statements Year Ended June 30, 2018
City of Somerville, Massachusetts 87 Comprehensive Annual Financial Report
GASB Statement #86, Certain Debt Extinguishment Issues. This pronouncement did not impact the basic financial statements.
The following GASB pronouncements will be implemented in the future:
The GASB issued Statement #83, Certain Asset Retirement Obligations, which is required to be implemented in 2019.
The GASB issued Statement #84, Fiduciary Activities, which is required to be implemented in 2019.
The GASB issued Statement #87, Leases, which is required to be implemented in 2021.
The GASB issued Statement #88, Certain Disclosures Related to Debt, including Direct Borrowings and
Direct Placements, which is required to be implemented in 2019.
The GASB issued Statement #89, Accounting for Interest Cost Incurred before the End of a Construction Period, which is required to be implemented in 2021.
The GASB issued Statement #90, Majority Equity Interests – an amendment of GASB Statements #14 and #61, which is required to be implemented in 2020.
Management is currently assessing the impact the implementation of these pronouncements will have on the basic financial statements. NOTE 18 – REVISION OF NET POSITION The beginning net position of governmental and business-type activities has been revised to reflect the implementation of GASB Statement #75. To reflect this change, the City has recorded a net other postemployment liability, which has resulted in the revision of the June 30, 2017 balance of the governmental activities and business type activities by $173,502,189 and $1,999,048 respectively. Previously reported governmental activities negative net position of $11,112,780 has been revised to negative $184,614,969. Previously reported business-type activities net position of $68,330,849 has been revised to $66,331,801.
City of Somerville, Massachusetts 88 Comprehensive Annual Financial Report
Required Supplementary Information
Required Supplementary Information

GENERAL FUND
SCHEDULE OF REVENUES, EXPENDITURES AND CHANGES IN FUND BALANCE -
BUDGET AND ACTUAL
YEAR ENDED JUNE 30, 2018
Amounts Actual Amounts Variance
Carried Forward Original Final Budgetary Carried Forward to Final
From Prior Year Budget Budget Amounts To Next Year Budget
REVENUES:
Real estate and personal property taxes,
net of tax refunds…………………………………………… $ - $ 141,124,459 $ 141,962,349 $ 142,187,805 $ - $ 225,456
Tax liens…………………………………………..……………… - - - 192,533 - 192,533
Motor vehicle and other excise taxes………………………… - 9,474,672 9,760,840 9,484,191 - (276,649)
Penalties and interest on taxes……………………………… - 808,000 808,000 869,868 - 61,868
Payments in lieu of taxes……………………………………… - 1,344,840 1,344,840 1,327,790 - (17,050)
Intergovernmental - other……………………………………… - 49,874,378 50,032,227 49,452,074 - (580,153)
Departmental and other………………………………………… - 21,909,592 20,904,788 25,592,325 - 4,687,537
Investment income……………………………………………… - 275,000 302,397 925,494 - 623,097
Miscellaneous…………………………………………………… - 18,000 18,000 227,341 - 209,341
TOTAL REVENUES………………………………… - 224,828,941 225,133,441 230,259,421 - 5,125,980
EXPENDITURES:
GENERAL GOVERNMENT
Board of Alderman
Salaries…………………………………………………… - 456,906 456,894 456,906 - (12)
Expenses………………………………………………… - 40,660 40,658 38,125 1,200 1,333
TOTAL…………………………………………………… - 497,566 497,552 495,031 1,200 1,321
Clerk of Committees
Salaries…………………………………………………… - 76,659 87,659 87,659 - -
Expenses………………………………………………… - 1,000 1,000 - - 1,000
TOTAL…………………………………………………… - 77,659 88,659 87,659 - 1,000
Executive Office
Salaries…………………………………………………… - 3,318,359 3,318,359 3,245,505 - 72,854
Expenses………………………………………………… 118,946 802,214 812,946 669,242 56,560 87,144
Special items…………………………………………… 1,098 217,598 216,748 190,286 - 26,462
Capital…………………………………………………… 85,615 310,615 299,526 164,642 134,599 285
TOTAL…………………………………………………… 205,659 4,648,786 4,647,579 4,269,675 191,159 186,745
Auditor's Office
Salaries…………………………………………………… - 794,276 794,276 755,712 - 38,564
Expenses………………………………………………… 110,829 218,914 147,878 96,014 32,070 19,794
TOTAL…………………………………………………… 110,829 1,013,190 942,154 851,726 32,070 58,358
Grants Management
Salaries…………………………………………………… - 154,084 154,084 154,076 - 8
Expenses………………………………………………… - 5,760 5,760 4,661 - 1,099
TOTAL…………………………………………………… - 159,844 159,844 158,737 - 1,107
Purchasing
Salaries…………………………………………………… - 413,916 413,916 382,063 - 31,853
Expenses………………………………………………… - 30,100 30,100 21,857 - 8,243
TOTAL…………………………………………………… - 444,016 444,016 403,920 - 40,096
Assessing
Salaries…………………………………………………… - 567,611 567,611 561,012 - 6,599
Expenses………………………………………………… - 85,800 85,800 65,043 - 20,757
TOTAL…………………………………………………… - 653,411 653,411 626,055 - 27,356
Treasurer's/ Collector's Office
Salaries…………………………………………………… - 689,161 689,161 621,176 - 67,985
Expenses………………………………………………… 2,768 223,692 220,952 155,007 3,257 62,688
TOTAL…………………………………………………… 2,768 912,853 910,113 776,183 3,257 130,673
Law Department
Salaries…………………………………………………… - 799,499 799,499 798,403 - 1,096
Expenses………………………………………………… 43,023 223,998 722,688 622,447 87,890 12,351
TOTAL…………………………………………………… 43,023 1,023,497 1,522,187 1,420,850 87,890 13,447
Personnel Department
Salaries…………………………………………………… - 955,545 955,795 907,588 - 48,207
Expenses………………………………………………… 23,280 336,032 324,422 176,002 36,871 111,549
Special Items…………………………………………… - 61,000 61,000 27,481 - 33,519
TOTAL…………………………………………………… 23,280 1,352,577 1,341,217 1,111,071 36,871 193,275
(Continued)
Budgeted Amounts
City of Somerville, Massachusetts 89 Comprehensive Annual Financial Report

GENERAL FUND
SCHEDULE OF REVENUES, EXPENDITURES AND CHANGES IN FUND BALANCE -
BUDGET AND ACTUAL
YEAR ENDED JUNE 30, 2018
Amounts Actual Amounts Variance
Carried Forward Original Final Budgetary Carried Forward to Final
From Prior Year Budget Budget Amounts To Next Year Budget
Budgeted Amounts
Information Technology
Salaries…………………………………………………… - 796,426 796,426 774,268 - 22,158
Expenses………………………………………………… 268,435 2,059,906 2,028,856 1,723,879 238,488 66,489
TOTAL…………………………………………………… 268,435 2,856,332 2,825,282 2,498,147 238,488 88,647
Communications
Salaries…………………………………………………… - 712,801 729,051 715,372 - 13,679
Expenses………………………………………………… 2,079 187,726 197,727 140,785 - 56,942
TOTAL…………………………………………………… 2,079 900,527 926,778 856,157 - 70,621
City Clerk
Salaries…………………………………………………… - 449,775 449,775 444,986 - 4,789
Expenses………………………………………………… 13,522 183,259 182,495 121,559 40,097 20,839
TOTAL…………………………………………………… 13,522 633,034 632,270 566,545 40,097 25,628
Elections
Salaries…………………………………………………… - 389,259 389,259 351,982 - 37,277
Expenses………………………………………………… - 114,100 114,100 89,078 - 25,022
Capital…………………………………………………… 24,077 24,077 24,077 24,077 - -
TOTAL…………………………………………………… 24,077 527,436 527,436 465,137 - 62,299
Licensing Committee
Salaries…………………………………………………… - 11,310 11,310 8,130 - 3,180
Community Development
Salaries…………………………………………………… - 4,587,305 4,661,227 4,499,569 - 161,658
Expenses………………………………………………… 276,958 1,318,958 1,130,842 785,556 107,028 238,258
TOTAL…………………………………………………… 276,958 5,906,263 5,792,069 5,285,125 107,028 399,916
Veterans Benefits
Salaries…………………………………………………… - 131,229 131,229 130,462 - 767
Expenses………………………………………………… 90 634,425 623,335 439,955 - 183,380
TOTAL…………………………………………………… 90 765,654 754,564 570,417 - 184,147
Building Insurance
Expenses………………………………………………… - 430,000 430,000 380,275 - 49,725
Person and Property Insurance
Expenses………………………………………………… - 175,000 75,000 49,789 - 25,211
Contingency Account
Expenses………………………………………………… - 2,930,000 214,537 103,603 - 110,934
Total General Government…………………………………… 970,720 25,918,955 23,395,978 20,984,232 738,060 1,673,686
PUBLIC SAFETY
Police Department
Salaries…………………………………………………… - 16,211,694 16,039,682 15,507,626 - 532,056
Expenses………………………………………………… 67,952 681,568 681,900 526,697 94,314 60,889
Special items…………………………………………… - 51,314 51,314 44,600 - 6,714
TOTAL…………………………………………………… 67,952 16,944,576 16,772,896 16,078,923 94,314 599,659
Fire Department
Salaries…………………………………………………… 2,350 16,103,369 16,352,279 16,239,308 13,314 99,657
Expenses………………………………………………… 41,819 502,219 501,081 398,118 62,249 40,714
Special items…………………………………………… - 11,000 11,000 10,051 - 949
TOTAL…………………………………………………… 44,169 16,616,588 16,864,360 16,647,477 75,563 141,320
Emergency Management
Salaries…………………………………………………… - 20,667 20,667 20,667 - -
Expenses………………………………………………… - 10,390 10,390 8,105 1,585 700
TOTAL…………………………………………………… - 31,057 31,057 28,772 1,585 700
Animal Control
Salaries…………………………………………………… - 109,847 111,847 107,956 - 3,891
Expenses………………………………………………… 3,186 21,236 17,139 10,674 1,341 5,124
TOTAL…………………………………………………… 3,186 131,083 128,986 118,630 1,341 9,015
Traffic and Parking
Salaries…………………………………………………… - 2,633,080 2,633,080 2,513,217 - 119,863
Expenses………………………………………………… 92,618 1,691,243 1,638,143 1,262,872 155,589 219,682
Capital…………………………………………………… 50,629 50,629 49,729 49,729 - -
TOTAL…………………………………………………… 143,247 4,374,952 4,320,952 3,825,818 155,589 339,545
(Continued)
City of Somerville, Massachusetts 90 Comprehensive Annual Financial Report

GENERAL FUND
SCHEDULE OF REVENUES, EXPENDITURES AND CHANGES IN FUND BALANCE -
BUDGET AND ACTUAL
YEAR ENDED JUNE 30, 2018
Amounts Actual Amounts Variance
Carried Forward Original Final Budgetary Carried Forward to Final
From Prior Year Budget Budget Amounts To Next Year Budget
Budgeted Amounts
Board of Health
Salaries…………………………………………………… - 2,172,374 2,112,374 1,917,899 - 194,475
Expenses………………………………………………… 18,254 640,196 700,196 542,247 93,208 64,741
TOTAL…………………………………………………… 18,254 2,812,570 2,812,570 2,460,146 93,208 259,216
Total Public Safety…………………………………………… 276,808 40,910,826 40,930,821 39,159,766 421,600 1,349,455
EDUCATION
Operational……………………………………………… 674,470 69,248,650 69,214,226 68,799,420 358,962 55,844
PUBLIC WORKS
Administration
Salaries…………………………………………………… - 651,008 651,008 642,205 - 8,803
Expenses………………………………………………… 102,399 1,041,499 982,262 610,400 132,750 239,112
TOTAL…………………………………………………… 102,399 1,692,507 1,633,270 1,252,605 132,750 247,915
Electrical
Salaries…………………………………………………… - 341,820 341,820 359,976 - (18,156)
Expenses………………………………………………… 28,576 272,076 247,583 104,375 118,911 24,297
TOTAL…………………………………………………… 28,576 613,896 589,403 464,351 118,911 6,141
Engineering
Salaries…………………………………………………… - 192,248 232,055 166,358 - 65,697
Expenses………………………………………………… 86,585 389,385 368,683 185,552 152,739 30,392
TOTAL…………………………………………………… 86,585 581,633 600,738 351,910 152,739 96,089
Snow Removal
Expenses………………………………………………… - 1,298,860 3,036,064 3,029,790 6,245 29
Highway
Salaries…………………………………………………… - 2,648,755 2,648,755 2,516,378 - 132,377
Expenses………………………………………………… 113,526 1,364,121 1,294,092 944,888 181,992 167,212
TOTAL…………………………………………………… 113,526 4,012,876 3,942,847 3,461,266 181,992 299,589
Sanitation -
Expenses………………………………………………… 10,902 5,183,902 5,559,387 4,681,921 497,128 380,338
Building and Grounds
Salaries…………………………………………………… - 2,271,099 2,271,099 2,239,269 - 31,830
Expenses………………………………………………… 1,535,297 10,615,828 10,021,684 7,637,997 1,405,597 978,090
TOTAL…………………………………………………… 1,535,297 12,886,927 12,292,783 9,877,266 1,405,597 1,009,920
Fleet
Expenses………………………………………………… - 461,000 461,001 348,255 62,169 50,577
School Custodians
Salaries…………………………………………………… - 1,908,672 1,908,672 1,764,998 - 143,674
Expenses………………………………………………… - 906,272 906,272 905,662 - 610
TOTAL…………………………………………………… - 2,814,944 2,814,944 2,670,660 - 144,284
Total Public Works…………………………………………… 1,877,285 29,546,545 30,930,437 26,138,024 2,557,531 2,234,882
CULTURE AND RECREATION
Library
Salaries…………………………………………………… - 1,984,541 1,984,541 1,945,609 - 38,932
Expenses………………………………………………… - 361,800 361,801 357,405 - 4,396
TOTAL…………………………………………………… - 2,346,341 2,346,342 2,303,014 - 43,328
Recreation and Youth Programs
Salaries…………………………………………………… - 934,325 864,321 852,808 - 11,513
Expenses………………………………………………… 107,701 797,001 791,640 590,857 4,497 196,286
TOTAL…………………………………………………… 107,701 1,731,326 1,655,961 1,443,665 4,497 207,799
Total Culture and Recreation……………………………… 107,701 4,077,667 4,002,303 3,746,679 4,497 251,127
(Continued)
City of Somerville, Massachusetts 91 Comprehensive Annual Financial Report

GENERAL FUND
SCHEDULE OF REVENUES, EXPENDITURES AND CHANGES IN FUND BALANCE -
BUDGET AND ACTUAL
YEAR ENDED JUNE 30, 2018
Amounts Actual Amounts Variance
Carried Forward Original Final Budgetary Carried Forward to Final
From Prior Year Budget Budget Amounts To Next Year Budget
Budgeted Amounts
OTHER
Pension Benefits
Pension benefits………………………………………… - 13,857,795 13,847,195 13,808,937 - 38,258
Non-contributory pension……………………………… - 123,597 134,197 134,096 - 101
Total Pension Benefits……………………………………… - 13,981,392 13,981,392 13,943,033 - 38,359
Employee Benefits
Health and life insurance……………………………… 833 25,305,828 25,805,827 24,632,659 900 1,172,268
Worker's Compensation………………………………… - 833,032 833,032 806,065 - 26,967
Unemployment compensation………………………… - 125,000 125,000 16,362 - 108,638
Total Employee Benefits…………………………………… 833 26,263,860 26,763,859 25,455,086 900 1,307,873
Debt and Interest
Debt principal…………………………………………… - 6,873,624 7,111,623 7,101,623 - 10,000
Debt interest……………………………………………… - 3,699,171 4,068,452 4,170,752 - (102,300)
TOTAL…………………………………………………… - 10,572,795 11,180,075 11,272,375 - (92,300)
State and County Charges
State and county………………………………………… - 14,235,017 14,235,616 13,634,548 601,068
Total Other……………………………………………………… 833 65,053,064 66,160,942 64,305,042 900 1,855,000
TOTAL EXPENDITURES……………………………… 3,907,817 234,755,707 234,634,707 223,133,163 4,081,550 7,419,994
EXCESS (DEFICIENCY) OF REVENUES
OVER (UNDER) EXPENDITURES……………………… (3,907,817) (9,926,766) (9,501,266) 7,126,258 (4,081,550) 12,545,974
OTHER FINANCING SOURCES (USES):
Proceeds from the sale of capital assets……………… - - - 3,911 - 3,911
Transfers in……………………………………………… - 3,687,397 4,483,042 4,590,080 - 107,038
Transfers out…………………………………………… - (199,000) (8,774,011) (8,774,011) - -
TOTAL OTHER FINANCING
SOURCES (USES)…………………………… - 3,488,397 (4,290,969) (4,180,020) - 110,949
NET CHANGE IN FUND BALANCE…………………………… (3,907,817) (6,438,369) (13,792,235) 2,946,238 (4,081,550) 12,656,923
BUDGETARY FUND BALANCE, Beginning of year………… - 19,506,195 19,506,195 19,506,195 - -
BUDGETARY FUND BALANCE, End of year…………………$ (3,907,817) $ 13,067,826 $ 5,713,960 $ 22,452,433 $ (4,081,550) $ 12,656,923
(Concluded)
City of Somerville, Massachusetts 92 Comprehensive Annual Financial Report

City of Somerville, Massachusetts 93 Comprehensive Annual Financial Report
Pension Plan Schedules – Retirement System
Pension Plan Schedules – Retirement System The Pension Plan’s Schedule of Changes in the Net Pension Liability presents multi-year trend information on the net pension liability and related ratios. The Pension Plan’s Schedule of Contributions presents multi-year trend information on the required and actual contributions to the pension plan and related ratios. The Pension Plan’s Schedule of Investment Return presents multi-year trend information on the money-weighted investment return on retirement assets, net of investment expense. These schedules are intended to present information for ten years. Until a ten year trend is compiled, information is presented for those years for which information is available.

December 31, December 31, December 31, December 31,2014 2015 2016 2017
Total pension liability: Service cost………………………………………………………$ 7,699,763 $ 8,007,754 $ 8,007,754 $ 8,025,850 Interest…………………………………………………………… 29,232,338 31,265,848 30,159,556 30,905,512
Changes in benefit terms……………………………………… - - - - Differences between expected and actual experience……… - - (2,943,803) - Changes in assumptions……………………………………… - - 2,806,740 - Benefit payments……………………………………………… (24,693,645) (26,374,021) (28,179,587) (29,318,266) Interest on benefit payments……………………..…………… - (1,066,370) - -
Net change in total pension liability……………………………… 12,238,456 11,833,211 9,850,660 9,613,096
Total pension liability - beginning………………………………… 358,733,765 370,972,221 382,805,432 392,656,092
Total pension liability - ending (a)……………………………… $ 370,972,221 $ 382,805,432 $ 392,656,092 $ 402,269,188
Plan fiduciary net position:Employer contributions………………………………………… $ 13,812,101 $ 14,199,527 $ 14,659,434 $ 14,805,336 Member contributions…………………………………………… 6,233,959 7,044,521 7,560,253 7,910,511 Net investment income (loss)………………………………… 12,996,452 454,830 8,831,845 42,779,686 Administrative expenses……………………………………… (380,845) (397,417) (468,722) (500,849) Retirement benefits and refunds……………………………… (24,693,645) (24,855,194) (27,275,655) (29,318,266) Other receipts…………………………………………………… - - - 739,557
Net increase (decrease) in fiduciary net position……………… 7,968,022 (3,553,733) 3,307,155 36,415,975
Fiduciary net position - beginning of year……………………… 235,079,845 243,047,867 239,494,134 242,801,289
Fiduciary net position - end of year (b)………………………… $ 243,047,867 $ 239,494,134 $ 242,801,289 $ 279,217,264
Net pension liability - ending (a)-(b)………………………… $ 127,924,354 $ 143,311,298 $ 149,854,803 $ 123,051,924
Plan fiduciary net position as a percentage of thetotal pension liability…………………………………………… 65.52% 62.56% 61.84% 69.41%
Covered payroll…………………………………………………… $ 66,506,738 $ 69,167,008 $ 71,454,475 $ 72,883,565
Net pension liability as a percentage of covered payroll………………………………………………… 192.35% 207.20% 209.72% 168.83%
Note: this schedule is intended to present information for 10 years.Until a 10-year trend is compiled, information is presented for those years for which information is available.
See notes to required supplementary information.
SCHEDULE OF CHANGES IN THE NET PENSION LIABILITYAND RELATED RATIOS
SOMERVILLE CONTRIBUTORY RETIREMENT SYSTEM
City of Somerville, Massachusetts 94 Comprehensive Annual Financial Report

Contributions in
relation to the Contributions as
Actuarially actuarially Contribution a percentage of
determined determined deficiency Covered covered
Year contribution contribution (excess) payroll payroll
December 31, 2017……… $ 14,805,336 $ (14,805,336) $ - $ 72,883,565 20.31%
December 31, 2016……… 14,659,434 (14,659,434) - 71,454,475 20.52%
December 31, 2015……… 14,199,527 (14,199,527) - 69,167,008 20.53%
December 31, 2014……… 13,147,710 (13,147,710) - 66,506,738 19.77%
Note: this schedule is intended to present information for 10 years.
Until a 10-year trend is compiled, information is presented for those years for which information is available.
See notes to required supplementary information.
SCHEDULE OF CONTRIBUTIONSSOMERVILLE CONTRIBUTORY RETIREMENT SYSTEM
City of Somerville, Massachusetts 95 Comprehensive Annual Financial Report

Annual money-weighted
rate of return,
Year net of investment expense
December 31, 2017…………………… 17.92%
December 31, 2016…………………… 3.73%
December 31, 2015…………………… 1.04%
December 31, 2014…………………… 5.63%
Note: this schedule is intended to present information for 10 years.Until a 10-year trend is compiled, information is presented for those
years for which information is available.
See notes to required supplementary information.
SCHEDULE OF INVESTMENT RETURNSSOMERVILLE CONTRIBUTORY RETIREMENT SYSTEM
City of Somerville, Massachusetts 96 Comprehensive Annual Financial Report

City of Somerville, Massachusetts 97 Comprehensive Annual Financial Report
Pension Plan Schedules – City Pension Plan Schedules - City The Schedule of the City’s Proportionate Share of the Net Pension Liability presents multi-year trend information on the City’s net pension liability and related ratios. The Schedule of City Contributions presents multi-year trend information on the City’s required and actual contributions to the pension plan and related ratios. The Schedule of the Special Funding Amounts of the Net Pension Liability for the Massachusetts Teachers Contributory Retirement System presents multi-year trend information on the liability and expense assumed by the Commonwealth of Massachusetts on behalf of the City along with related ratios. These schedules are intended to present information for ten years. Until a ten year trend is compiled, information is presented for those years for which information is available.

Net pension Plan fiduciary
Proportionate liability as a net position as
Proportion of share of the percentage of a percentage of
the net pension net pension Covered covered the total
Year liability (asset) liability (asset) payroll payroll pension liability
December 31, 2017………… 93.61% $ 115,186,814 $ 66,887,331 172.21% 69.41%
December 31, 2016………… 93.53% 140,166,391 66,834,814 209.72% 61.84%
December 31, 2015………… 93.70% 134,275,794 62,344,746 215.38% 62.56%
December 31, 2014………… 93.74% 119,918,981 62,344,746 192.35% 65.52%
Note: this schedule is intended to present information for 10 years.
Until a 10-year trend is compiled, information is presented for those years for which information is available.
See notes to required supplementary information.
SCHEDULE OF THE CITY'S PROPORTIONATE SHARE
OF THE NET PENSION LIABILITYSOMERVILLE CONTRIBUTORY RETIREMENT SYSTEM
City of Somerville, Massachusetts 98 Comprehensive Annual Financial Report

Contributions in
relation to the Contributions as
Actuarially actuarially Contribution a percentage of
determined determined deficiency Covered covered
Year contribution contribution (excess) payroll payroll
June 30, 2018………………… $ 13,808,937 $ (13,808,937) $ - $ 68,225,078 20.24%
June 30, 2017………………… 13,711,675 (13,711,675) - 68,171,510 20.11%
June 30, 2016………………… 13,304,274 (13,304,274) - 63,591,641 20.92%
June 30, 2015………………… 12,324,940 (12,324,940) - 63,591,641 19.38%
Note: this schedule is intended to present information for 10 years.
Until a 10-year trend is compiled, information is presented for those years for which information is available.
See notes to required supplementary information.
SCHEDULE OF THE CITY'S CONTRIBUTIONSSOMERVILLE CONTRIBUTORY RETIREMENT SYSTEM
City of Somerville, Massachusetts 99 Comprehensive Annual Financial Report
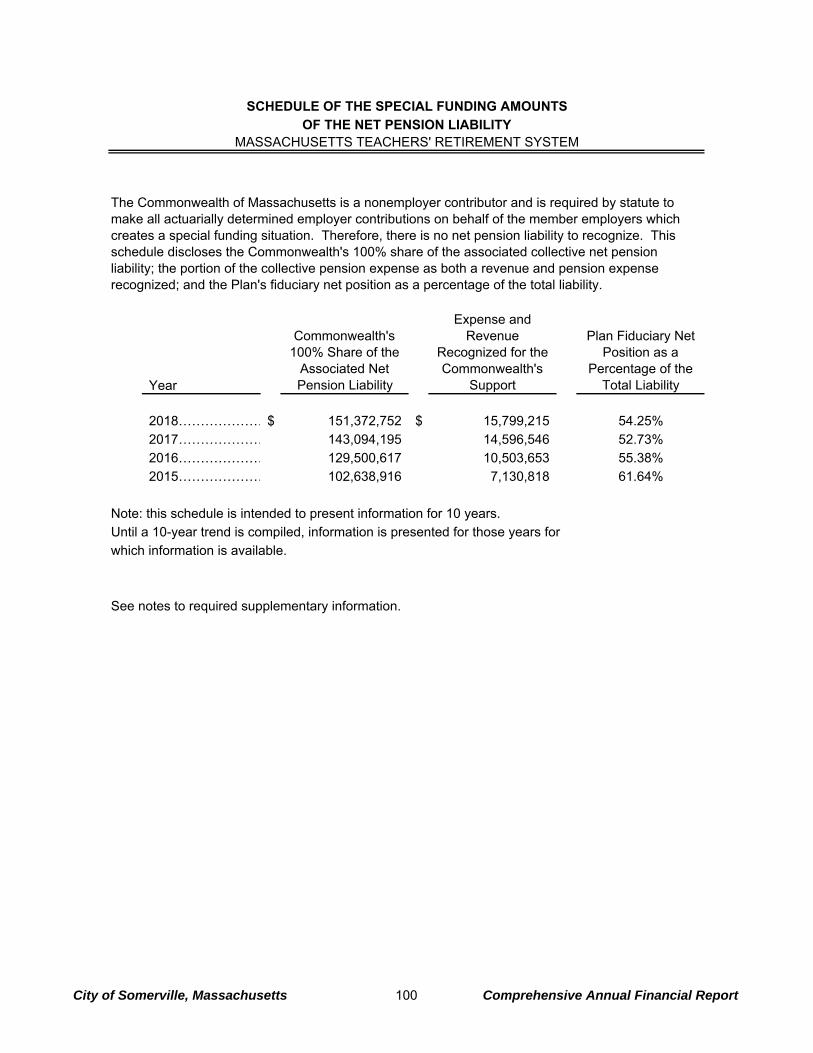
Year
Commonwealth's 100% Share of the
Associated Net Pension Liability
Expense and Revenue
Recognized for the Commonwealth's
Support
Plan Fiduciary Net Position as a
Percentage of the Total Liability
2018…………………$ 151,372,752 $ 15,799,215 54.25%
2017………………… 143,094,195 14,596,546 52.73%
2016………………… 129,500,617 10,503,653 55.38%
2015………………… 102,638,916 7,130,818 61.64%
Note: this schedule is intended to present information for 10 years.
Until a 10-year trend is compiled, information is presented for those years for
which information is available.
See notes to required supplementary information.
SCHEDULE OF THE SPECIAL FUNDING AMOUNTS
OF THE NET PENSION LIABILITYMASSACHUSETTS TEACHERS' RETIREMENT SYSTEM
The Commonwealth of Massachusetts is a nonemployer contributor and is required by statute to make all actuarially determined employer contributions on behalf of the member employers which creates a special funding situation. Therefore, there is no net pension liability to recognize. This schedule discloses the Commonwealth's 100% share of the associated collective net pension liability; the portion of the collective pension expense as both a revenue and pension expense recognized; and the Plan's fiduciary net position as a percentage of the total liability.
City of Somerville, Massachusetts 100 Comprehensive Annual Financial Report

City of Somerville, Massachusetts 101 Comprehensive Annual Financial Report
Other Postemployment Benefit Plan Schedules
Other Postemployment Benefits Plan Schedules The Schedule of Changes in the City’s Net Other Postemployment Benefit Liability and Related Ratios presents multi-year trend information on changes in the Plan’s total OPEB liability, changes in the Plan’s net position, and ending net OPEB liability. It also demonstrates the Plan’s net position as a percentage of the total liability and the Plan’s net other postemployment benefit liability as a percentage of covered employee payroll. The Schedule of the City’s Contributions presents multi-year trend information on the City’s actual contributions to the other postemployment benefit plan and related ratios. The Schedule of Investment Return presents multi-year trend information on the money-weighted investment return on the Plan’s other postemployment assets, net of investment expense.

June 30, June 30,2017 2018
Total OPEB LiabilityService Cost………………………………………………… $ 11,768,411 $ 9,597,889 Interest………………………………………………………… 11,159,516 11,592,912 Changes of benefit terms…………………………………… - - Differences between expected and actual experience…… - (40,800,875) Changes of assumptions…………………………………… - - Benefit payments…………………………………………… (9,258,566) (8,485,245)
Net change in total OPEB liability…………………………… 13,669,361 (28,095,319)
Total OPEB liability - beginning……………………………..… 290,405,580 304,074,941
Total OPEB liability - ending (a)……………………………… $ 304,074,941 $ 275,979,622
Plan fiduciary net position
Employer contributions……………………………..……… $ 10,258,566 $ 13,985,245 Employer contributions for OPEB payments……………… - - Net investment income………………………...…………… 7,508 26,801 Benefit payments……………………………...……………… (9,258,566) (8,485,245)
Net change in plan fiduciary net position…………………… 1,007,508 5,526,801
Plan fiduciary net position - beginning of year……………… 813,767 1,821,275
Plan fiduciary net position - end of year (b)………………… $ 1,821,275 $ 7,348,076
Net OPEB liability - ending (a)-(b)………………………… $ 302,253,666 $ 268,631,546
Plan fiduciary net position as a percentage of the total OPEB liability………………………..…………… 0.60% 2.66%
Covered-employee payroll………………………………..……$ 104,221,637 $ 107,444,987
Net OPEB liability as a percentage ofcovered-employee payroll…………………………..… 290.01% 250.02%
Note: this schedule is intended to present information for 10 years.Until a 10-year trend is compiled, information is presented for those years for which information is available.
See notes to required supplementary information.
SCHEDULE OF CHANGES IN THE CITY'S NET OPEB LIABILITY AND RELATED RATIOS
OTHER POSTEMPLOYMENT BENEFIT PLAN
City of Somerville, Massachusetts 102 Comprehensive Annual Financial Report
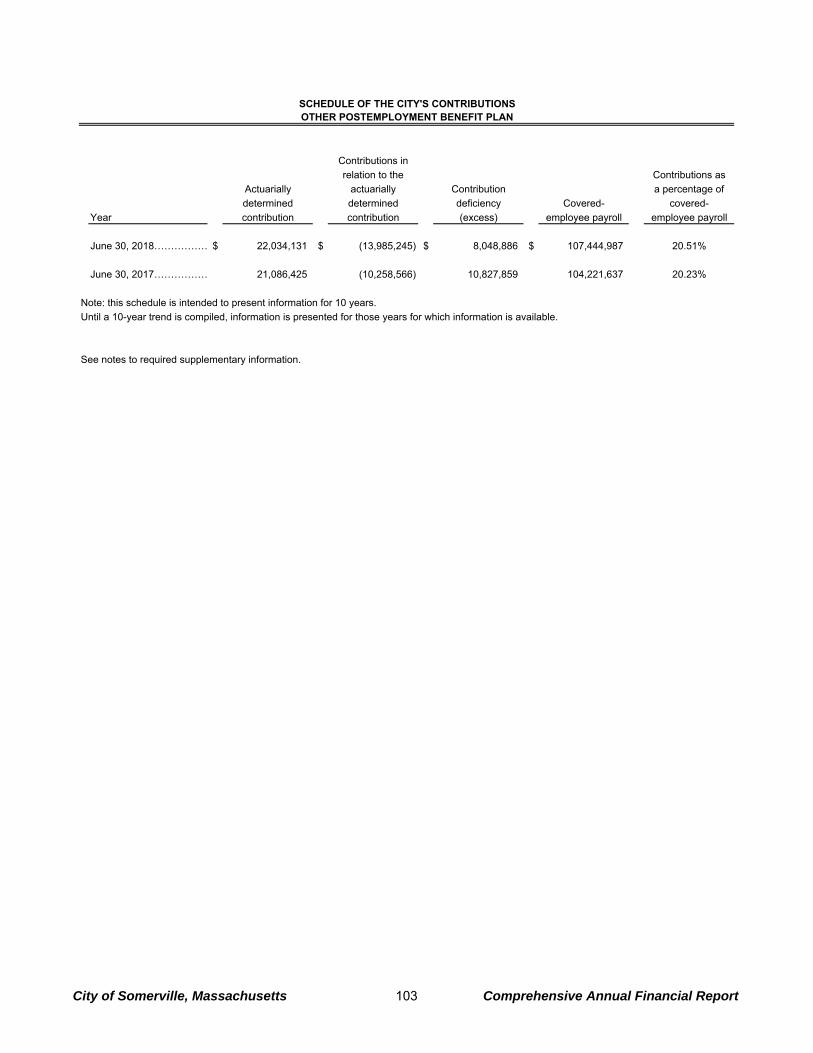
Contributions in
relation to the Contributions as
Actuarially actuarially Contribution a percentage of
determined determined deficiency Covered- covered-
Year contribution contribution (excess) employee payroll employee payroll
June 30, 2018………………$ 22,034,131 $ (13,985,245) $ 8,048,886 $ 107,444,987 20.51%
June 30, 2017……………… 21,086,425 (10,258,566) 10,827,859 104,221,637 20.23%
Note: this schedule is intended to present information for 10 years.
Until a 10-year trend is compiled, information is presented for those years for which information is available.
See notes to required supplementary information.
SCHEDULE OF THE CITY'S CONTRIBUTIONSOTHER POSTEMPLOYMENT BENEFIT PLAN
City of Somerville, Massachusetts 103 Comprehensive Annual Financial Report

Annual money-weighted
rate of return,
Year net of investment expense
June 30, 2018…………………………… 1.18%
June 30, 2017…………………………… 0.92%
Note: this schedule is intended to present information for 10 years.
Until a 10-year trend is compiled, information is presented for those
years for which information is available.
See notes to required supplementary information.
SCHEDULE OF INVESTMENT RETURNSOTHER POSTEMPLOYMENT BENEFIT PLAN
City of Somerville, Massachusetts 104 Comprehensive Annual Financial Report

Notes to Required Supplementary Information Year Ended June 30, 2018
City of Somerville, Massachusetts 105 Comprehensive Annual Financial Report
NOTE A - STEWARDSHIP, COMPLIANCE AND ACCOUNTABILITY Notes to Required Supplementary Information A. Budgetary Information Municipal Law requires the adoption of a balanced budget that is approved by the Mayor and the Board. The Mayor presents an annual budget to the Board, which includes estimates of revenues and other financing sources and recommendations of expenditures and other financing uses. The Board, which has full authority to amend and/or reject the budget or any line item, adopts the expenditure budget by majority vote. Increases or transfers between and within departments subsequent to the approval of the annual budget, requires majority Board approval via a supplemental appropriation or Board order. The majority of appropriations are non-continuing which lapse at the end of each year. Others are continuing appropriations for which the governing body has authorized that an unspent balance from a prior year be carried forward and made available for spending in the current year. These carry forwards are included as part of the subsequent year’s original budget. Generally, expenditures may not exceed the legal level of spending (salaries, expenses and capital) authorized for an appropriation account. However, the payment of debt service is statutorily required, regardless of whether such amounts are appropriated. Additionally, expenditures for disasters, natural or otherwise, and final judgments may exceed the level of spending authorized by two-thirds majority vote of the Board. An annual budget is adopted for the general fund in conformity with the guidelines described above. The original 2018 approved budget authorized $234.9 million in appropriations and other amounts to be raised. During 2018, the Board also increased appropriations by approximately $8.5 million. The City Auditor’s Office has the responsibility to ensure that budgetary control is maintained. Budgetary control is exercised through the accounting system. B. Budgetary - GAAP Reconciliation For budgetary financial reporting purposes, the Uniform Municipal Accounting System basis of accounting (established by the Commonwealth) is followed, which differs from the GAAP basis of accounting. A reconciliation of budgetary-basis to GAAP-basis results for the general fund for the year ended June 30, 2018, is depicted below:
Net change in fund balance - budgetary basis…………………………………$ 2,946,238
Perspective differences: Activity of the stabilization fund recorded in the
general fund for GAAP…………………………………………………… 6,139,075 Unemployment insurance trust recorded in the
general fund for GAAP…………………………………………………… (4,827,784)
Basis of accounting differences: Net change in recording tax refunds payable……………………………… (109,000) Net change in recording 60 day receipts…………………………………… (19,500) Net change in recording accrued expenditures…………………………… (510,545) Recognition of revenue for on-behalf payments………………………… 15,799,215 Recognition of expenditures for on-behalf payments…………………… (15,799,215)
Net change in fund balance - GAAP basis…………………………………… $ 3,618,484

Notes to Required Supplementary Information Year Ended June 30, 2018
City of Somerville, Massachusetts 106 Comprehensive Annual Financial Report
NOTE B – PENSION PLAN Pension Plan Schedules – Retirement System A. Schedule of Changes in the Net Pension Liability and Related Ratios The Schedule of Changes in the Net Pension Liability and Related Ratios includes the detailed changes in the systems total pension liability, changes in the systems net position, and the ending net pension liability. It also demonstrates the plan’s net position as a percentage of the total pension liability and the net pension liability as a percentage of covered payroll. B. Schedule of Contributions Governmental employers are required to pay an annual appropriation as established by PERAC. The total appropriation includes the amounts to pay the pension portion of each member’s retirement allowance, an amount to amortize the actuarially determined unfunded liability to zero in accordance with the system’s funding schedule, and additional appropriations in accordance with adopted early retirement incentive programs. The total appropriations are payable on July 1 and January 1. Employers may choose to pay the entire appropriation in July at a discounted rate. Accordingly, actual employer contributions may be less than the “total appropriation”. The pension fund appropriations are allocated amongst employers based on covered payroll. C. Schedule of Investment Return The money weighted rate of return is calculated as the internal rate of return on pension plan investments, net of pension plan investment expense. A money weighted rate of return expresses investment performance, net of pension plan investment expense, adjusted for the changing amounts actually invested. Inputs to the money weighted rate of return calculation are determined monthly. Pension Plan Schedules - City A. Schedule of the City’s Proportionate Share of the Net Pension Liability The Schedule of the City’s Proportionate Share of the Net Pension Liability details the allocated percentage of the net pension liability (asset), the proportionate share of the net pension liability, and the covered employee payroll. It also demonstrates the net position as a percentage of the pension liability and the net pension liability as a percentage of covered payroll. B. Schedule of City Contributions Governmental employers are required to pay an annual appropriation as established by PERAC. The appropriation includes the amounts to pay the pension portion of each member’s retirement allowance, an amount to amortize the actuarially determined unfunded liability to zero in accordance with the system’s funding schedule, and additional appropriations in accordance with adopted early retirement incentive programs. The appropriations are payable on July 1 and January 1. The City may choose to pay the entire appropriation in July at a discounted rate. Accordingly, actual contributions may be less than the “total appropriation”. The pension fund appropriation is allocated to the City based on covered payroll. C. Schedule of the Special Funding Amounts of the Net Pension Liability The Commonwealth of Massachusetts is a nonemployer contributor and is required by statute to make all actuarially determined employer contributions on behalf of the member employers which creates a special funding

Notes to Required Supplementary Information Year Ended June 30, 2018
City of Somerville, Massachusetts 107 Comprehensive Annual Financial Report
situation. Since the City does not contribute directly to MTRS, there is no net pension liability to recognize. This schedule discloses the Commonwealth's 100% share of the collective net pension liability that is associated with the City; the portion of the collective pension expense as both revenue and pension expense recognized by the City; and the Plan's fiduciary net position as a percentage of the total liability. D. Changes in Assumptions The discount rate has changed from 8.25% to 8.00%. Annual rates of withdrawal prior to retirement have been adjusted based on experience, for both general employees and police and fire employees. Annual rate of mortality tables used have been updated. The assumed annual retirement rates for those hired prior to April 2, 2012, have been updated. The assumed annual retirement rates for those hired on or after April 2, 2012, have been updated. The assumed annual rates of disability for both general employees and police and fire employees have been updated. The annual amount of administrative expenses has been increased to $450,000, and is expected to increase at 4% per year. E. Changes in Plan Provisions The maximum amount of pension benefits subject to a cost of living increase has been raised from $12,000 to $13,000. NOTE C - OTHER POSTEMPLOYMENT BENEFITS The City administers a single-employer defined benefit healthcare plan (“the Plan”). The plan provides lifetime healthcare and life insurance for eligible retirees and their spouses through the City’s health and life insurance plans, which covers both active and retired members, including teachers. The Other Postemployment Benefit Plan Schedule of Changes in the City’s Net Other Postemployment Benefit Liability and Related Ratios The Schedule of Changes in the City’s Net Other Postemployment Benefit Liability and Related Ratios presents multi-year trend information on changes in the Plan’s total OPEB liability, changes in the Plan’s net position, and ending net OPEB liability. It also demonstrates the Plan’s net position as a percentage of the total liability and the Plan’s net other postemployment benefit liability as a percentage of covered employee payroll. Schedule of the City’s Contributions The Schedule of the City’s Contributions includes the City’s annual required contribution to the Plan, along with the contribution made in relation to the actuarially determined contribution and the covered employee payroll. The City is not required to fully fund this contribution. It also demonstrates the contributions as a percentage of covered payroll.

Notes to Required Supplementary Information Year Ended June 30, 2018
City of Somerville, Massachusetts 108 Comprehensive Annual Financial Report
The total OPEB liability in the June 30, 2018, actuarial valuation was determined by using the following actuarial assumptions, applied to all periods including the measurement date to be in accordance with GASB #74.
Valuation date…………………………………… June 30, 2018
Actuarial cost method…………………………… Individual Entry Age Normal Cost Method.
Asset valuation method………………………… Market Value.
Discount rate…………………………………… 3.75%, based on June 30, long term high quality municipal bonds.
Healthcare cost trend rate………………………
5.5% decreasing by 0.5% each year to 4.5% for periods starting in 2020.
Participation………………………………………
95% of future retiree teachers are assumed to participate in the retiree medical plan, 95% of future non-teacher retirees are expected to participate in the retiree medical plan and 100% of future retirees are expected to elect life insurance.
Marital status……………………………………
60% of male employees and 50% of female are assumed to have a covered spouse at retirement. Wives are assumed to be three years younger than their husbands.
Pre-retirement mortality………………………… RP-2014 Blue Collar Mortality with MP-2015, fully generational.
Post-retirement mortality………………………
Group 1 and 2 is represented by the RP-2014 Blue Collar Mortality Table set forward 5 years for males and 3 years for females, fully generational. Group 4 is represented by the RP-2014 Blue Collar Mortality Table set forward 3 years for males and 6 years for females.
Disabled mortality………………………………
Group 1 and 2 is represented by the RP-2000 Mortality Table set forward 6 years. Group 4 is represented by the RP-2000 Mortality Table set forward 2 years.
Schedule of Investment Return The Schedule of Investment Return includes the money-weighted investment return on the Plan’s other postemployment assets, net of investment expense. Changes in Assumptions and Plan Provisions The following assumptions were included in the June 30, 2018 actuarial valuation:
The healthcare cost trend rate was reduced from 6.0% to 5.5%.
There were no changes in plan provisions in the June 30, 2018 actuarial valuation.

City of Somerville, Massachusetts 109 Comprehensive Annual Financial Report
Combining and Individual Fund Statements
Combining and Individual Fund Statements

City of Somerville, Massachusetts 110 Comprehensive Annual Financial Report
Nonmajor Governmental Funds Nonmajor Governmental Funds Special Revenue Funds Special revenue funds are used to account for specific revenues that are legally restricted to expenditure for particular purposes. School Special Revenue Funds – accounts for the activity of the school department’s revolving funds established in accordance with MGL Chapter 44, Section 53E ½. School Federal Grants – accounts for grant funds received from the federal government that are designated for specific education programs. School State & Private Grants – This fund is used to account for receipts from a specific revenue source that by law is accounted for separately from the general fund and must be spent by appropriation. City Federal Grants – accounts for grant funds received from the federal government that are designated for specific programs, excluding school education grants which are accounted for in the School Federal Grants Special Revenue Fund. City State Grants – accounts for grant funds received from the Commonwealth that are designated for specific programs, excluding school education grants which are accounted for in the School State Grants Special Revenue Fund. Highway Improvement Funds – accounts for construction, reconstruction and improvements to roadways, streets, and sidewalks. Funding is provided primarily by grants. City Revolving Funds – excluding the school department, accounts for the activity of revolving funds established in accordance with MGL Chapter 44, Section 53E ½. Receipts Reserved – accounts for receipts that are designated to fund and supplement specific operating budgets of departments. City Private Grants – accounts for non-school related activity financed by private grants designated for specific programs. School Lunch – accounts for the activity of the school lunch program. Revenues include State and Federal reimbursements for meals served. Other Special Revenue Funds – accounts for the activity of gifts received and miscellaneous departmental special revenue funds. Community Preservation Fund – accounts for funds held for uses restricted by law for community preservation purposes. These funds are attributable to the City’s acceptance of the Community Preservation Act, which allows the City to impose up to a 3% surcharge on property taxes and to receive matching state grant funds for specified uses related to the acquisition, creation, preservation and support of open space, historic resources, land for recreational use and community housing.
City of Somerville, Massachusetts 111 Comprehensive Annual Financial Report
Permanent Funds Permanent funds are used to report resources that are legally restricted to the extent that only earnings, not principal, may be used for purposes that support governmental programs. Permanent Funds Principal – This fund is used to account for the non-expendable portion of gifts, bequests and contributions for which only earnings may be expended to benefit the City. Expendable Permanent Funds – This fund is used to account for the spendable portion of gifts, bequests and contributions held for which only earnings may be expended for purposes specified by the donor.

School School School City City
Special Revenue Federal State & Private Federal Grant State Grant
Funds Grants Grants Funds Funds
ASSETS
Cash and cash equivalents……………………………$ 1,011,850 $ 7,121 $ 2,186,294 $ - $ -
Receivables, net of uncollectibles:
Tax liens……………………………………...……… - - - - -
Community preservation fund surtax……………… - - - - -
Intergovernmental - other………………………… - 42,657 - 7,904 1,152,426
Community preservation state share……………… - - - - -
Loans………………………………………………… - - - - -
TOTAL ASSETS……………………………………… $ 1,011,850 $ 49,778 $ 2,186,294 $ 7,904 $ 1,152,426
LIABILITIES
Warrants payable……………………………………$ 1,422 $ - $ 43,750 $ - $ -
Accrued payroll……………………………………… 126,271 49,605 38,642 1,177 9,691
Due to other funds………………………………… - - - 3,318 780,707
TOTAL LIABILITIES…………………………………… 127,693 49,605 82,392 4,495 790,398
DEFERRED INFLOWS OF RESOURCES
Unavailable revenue……………………………… - - - - -
FUND BALANCES
Nonspendable……………………………………… - - - - -
Restricted…………………………………………… 884,157 173 2,103,902 3,409 362,028
TOTAL FUND BALANCES…………………………… 884,157 173 2,103,902 3,409 362,028
TOTAL LIABILITIES, DEFERRED INFLOWS OF RESOURCES, AND FUND BALANCES………… $ 1,011,850 $ 49,778 $ 2,186,294 $ 7,904 $ 1,152,426
Special Revenue Funds
NONMAJOR GOVERNMENTAL FUNDS
COMBINING BALANCE SHEET
JUNE 30, 2018
City of Somerville, Massachusetts 112 Comprehensive Annual Financial Report
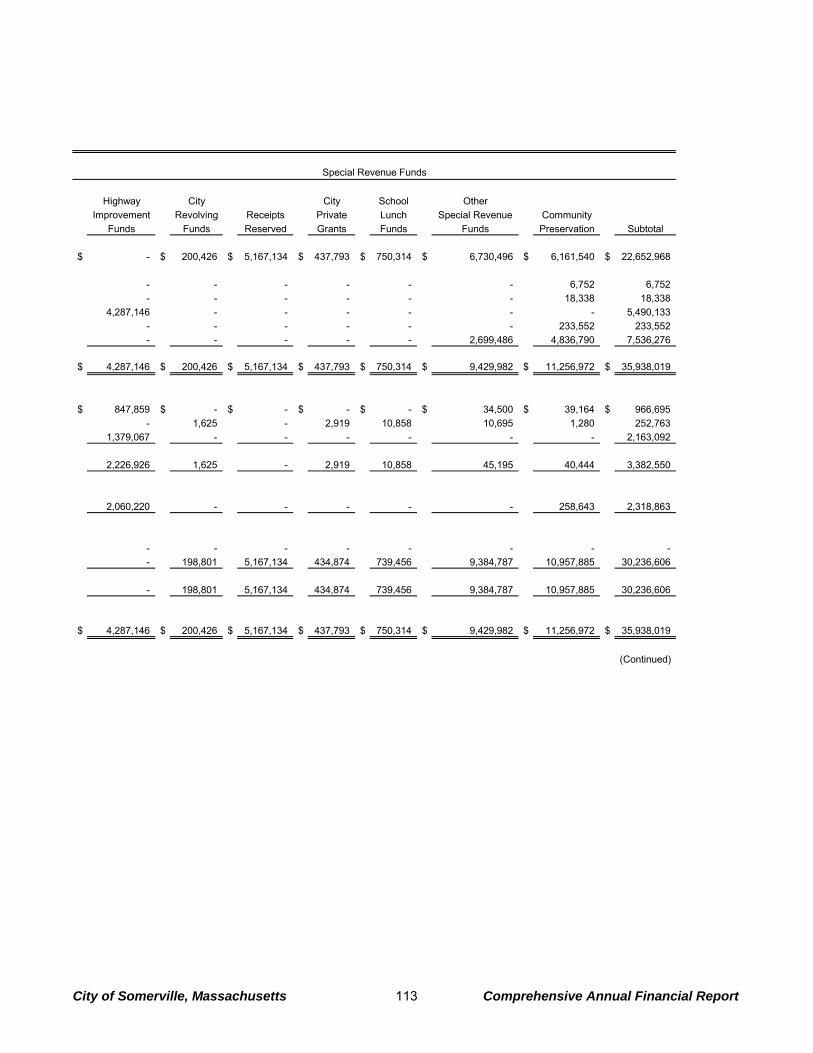
Highway City City School Other
Improvement Revolving Receipts Private Lunch Special Revenue Community
Funds Funds Reserved Grants Funds Funds Preservation Subtotal
$ - $ 200,426 $ 5,167,134 $ 437,793 $ 750,314 $ 6,730,496 $ 6,161,540 $ 22,652,968
- - - - - - 6,752 6,752
- - - - - - 18,338 18,338
4,287,146 - - - - - - 5,490,133
- - - - - - 233,552 233,552
- - - - - 2,699,486 4,836,790 7,536,276
$ 4,287,146 $ 200,426 $ 5,167,134 $ 437,793 $ 750,314 $ 9,429,982 $ 11,256,972 $ 35,938,019
$ 847,859 $ - $ - $ - $ - $ 34,500 $ 39,164 $ 966,695
- 1,625 - 2,919 10,858 10,695 1,280 252,763
1,379,067 - - - - - - 2,163,092
2,226,926 1,625 - 2,919 10,858 45,195 40,444 3,382,550
2,060,220 - - - - - 258,643 2,318,863
- - - - - - - -
- 198,801 5,167,134 434,874 739,456 9,384,787 10,957,885 30,236,606
- 198,801 5,167,134 434,874 739,456 9,384,787 10,957,885 30,236,606
$ 4,287,146 $ 200,426 $ 5,167,134 $ 437,793 $ 750,314 $ 9,429,982 $ 11,256,972 $ 35,938,019
(Continued)
Special Revenue Funds
City of Somerville, Massachusetts 113 Comprehensive Annual Financial Report

Total
Permanent Expendable Nonmajor
Funds Permanent Governmental
Principal Funds Subtotal Funds
ASSETS
Cash and cash equivalents……………………………$ 433,126 $ 161,034 $ 594,160 $ 23,247,128
Receivables, net of uncollectibles:
Tax liens……………………………………...…… - - - 6,752
Community preservation fund surtax…………… - - - 18,338
Intergovernmental - other………………………… - - - 5,490,133
Community preservation state share…………… - - - 233,552
Loans……………………………………………… - - - 7,536,276
TOTAL ASSETS……………………………………… $ 433,126 $ 161,034 $ 594,160 $ 36,532,179
LIABILITIES
Warrants payable………………………………… $ - $ - $ - $ 966,695
Accrued payroll…………………………………… - - - 252,763
Due to other funds………………………………… - - - 2,163,092
TOTAL LIABILITIES………………………………… - - - 3,382,550
DEFERRED INFLOWS OF RESOURCES
Unavailable revenue……………………………… - - - 2,318,863
FUND BALANCES
Nonspendable……………………………………… 433,126 - 433,126 433,126
Restricted…………………………………………… - 161,034 161,034 30,397,640
TOTAL FUND BALANCES…………………………… 433,126 161,034 594,160 30,830,766
TOTAL LIABILITIES, DEFERRED INFLOWS OF RESOURCES, AND FUND BALANCES………… $ 433,126 $ 161,034 $ 594,160 $ 36,532,179
(Concluded)
Permanent Funds
NONMAJOR GOVERNMENTAL FUNDS
COMBINING BALANCE SHEET
JUNE 30, 2018
City of Somerville, Massachusetts 114 Comprehensive Annual Financial Report

City of Somerville, Massachusetts 115 Comprehensive Annual Financial Report
This page intentionally left blank.

School School School City City
Special Revenue Federal State & Private Federal Grant State Grant
Funds Grants Grants Funds Funds
REVENUES:
Intergovernmental - other…………………………………………… $ - $ 3,719,952 $ 3,235,788 $ 618,181 $ 2,032,763
Departmental and other……………………………………………… 3,100,525 - - - 65,998
Community preservation taxes……………………………………… - - - - -
Community preservation state match……………………………… - - - - -
Contributions and donations………………………………………… 12,046 - - - 17,637
Investment income…………………………………………………… - - - - -
TOTAL REVENUES……………………………………………… 3,112,571 3,719,952 3,235,788 618,181 2,116,398
EXPENDITURES:
Current:
General government………………………………………………… - - - 250,480 1,393,710
Public safety………………………………………………………… - - - 134,004 597,783
Education…………………………………………………………… 2,954,650 3,826,318 3,966,363 - -
Public works………………………………………………………… - - - 13,932 7,809
Health and human services………………………………………… - - - 222,436 31,204
Culture and recreation……………………………………………… - - - - 36,615
Community preservation…………………………………………… - - - - -
TOTAL EXPENDITURES……………………………………… 2,954,650 3,826,318 3,966,363 620,852 2,067,121
EXCESS (DEFICIENCY) OF REVENUES
OVER (UNDER) EXPENDITURES………………………………… 157,921 (106,366) (730,575) (2,671) 49,277
OTHER FINANCING SOURCES (USES):
Premium from issuance of bonds…………………………………… - - - - -
Transfers in…………………………………………………………… - - - - -
Transfers out…………………………………………………………… - - (2,126) (27) (98,183)
TOTAL OTHER FINANCING SOURCES (USES)…………… - - (2,126) (27) (98,183)
NET CHANGE IN FUND BALANCES………………………………… 157,921 (106,366) (732,701) (2,698) (48,906)
FUND BALANCES AT BEGINNING OF YEAR……………………..… 726,236 106,539 2,836,603 6,107 410,934
FUND BALANCES AT END OF YEAR…………………………………$ 884,157 $ 173 $ 2,103,902 $ 3,409 $ 362,028
Special Revenue Funds
NONMAJOR GOVERNMENTAL FUNDS
COMBINING STATEMENT OF REVENUES, EXPENDITURES AND CHANGES IN FUND BALANCES
YEAR ENDED JUNE 30, 2018
City of Somerville, Massachusetts 116 Comprehensive Annual Financial Report

Highway City City School Other
Improvement Revolving Receipts Private Lunch Special Revenue Community
Funds Funds Reserved Grants Funds Funds Preservation Subtotal
$ 2,254,337 $ - $ 272,795 $ 307,179 $ 2,255,674 $ 1,147,673 $ 3,636,132 $ 19,480,474
- 400,680 2,498,115 - 585,696 1,648,075 - 8,299,089
- - - - - - 1,794,508 1,794,508
- - - - - - 370,465 370,465
- - - - - 275,798 - 305,481
- - - - - 39,020 17,564 56,584
2,254,337 400,680 2,770,910 307,179 2,841,370 3,110,566 5,818,669 30,306,601
- 194,687 - 64,442 - 2,131,602 - 4,034,921
- 7,874 - - - 197,772 - 937,433
- - - 102,930 2,973,108 10,626 - 13,833,995
2,254,337 3,378 - - - 56,191 - 2,335,647
- 571 - 1,962 - 20,131 - 276,304
- 110,386 - - - 103,537 - 250,538
- - - - - - 5,061,851 5,061,851
2,254,337 316,896 - 169,334 2,973,108 2,519,859 5,061,851 26,730,689
- 83,784 2,770,910 137,845 (131,738) 590,707 756,818 3,575,912
- - - - - 1,845,411 - 1,845,411
- - - - - 1,072,148 500,000 1,572,148
- - (2,540,151) - - (20,063) (266) (2,660,816)
- - (2,540,151) - - 2,897,496 499,734 756,743
- 83,784 230,759 137,845 (131,738) 3,488,203 1,256,552 4,332,655
- 115,017 4,936,375 297,029 871,194 5,896,584 9,701,333 25,903,951
$ - $ 198,801 $ 5,167,134 $ 434,874 $ 739,456 $ 9,384,787 $ 10,957,885 $ 30,236,606
(Continued)
Special Revenue Funds
City of Somerville, Massachusetts 117 Comprehensive Annual Financial Report

Total
Permanent Expendable Nonmajor
Funds Permanent Governmental
Principal Funds Subtotal Funds
REVENUES:
Intergovernmental - other……………………………………… $ - $ - $ - $ 19,480,474
Departmental and other………………………………………… - - - 8,299,089
Community preservation taxes………………………………… - - - 1,794,508
Community preservation state match………………………… - - - 370,465
Contributions and donations…………………………………… - - - 305,481
Investment income……………………………………………… - 2,333 2,333 58,917
TOTAL REVENUES………………………………………… - 2,333 2,333 30,308,934
EXPENDITURES:
Current:
General government…………………………………………… - - - 4,034,921
Public safety…………………………………………………… - - - 937,433
Education……………………………………………………… - 512 512 13,834,507
Public works…………………………………………………… - - - 2,335,647
Health and human services…………………………………… - - - 276,304
Culture and recreation………………………………………… - - - 250,538
Community preservation……………………………………… - - - 5,061,851
TOTAL EXPENDITURES…………………………………… - 512 512 26,731,201
EXCESS (DEFICIENCY) OF REVENUES
OVER (UNDER) EXPENDITURES…………………………… - 1,821 1,821 3,577,733
OTHER FINANCING SOURCES (USES):
Premium from issuance of bonds……………………………… - - - 1,845,411
Transfers in……………………………………………………… - - - 1,572,148
Transfers out……………………………………………………… - - - (2,660,816)
TOTAL OTHER FINANCING SOURCES (USES)……… - - - 756,743
NET CHANGE IN FUND BALANCES…………………………… - 1,821 1,821 4,334,476
FUND BALANCES AT BEGINNING OF YEAR………………… 433,126 159,213 592,339 26,496,290
FUND BALANCES AT END OF YEAR……………………………$ 433,126 $ 161,034 $ 594,160 $ 30,830,766
(Concluded)
YEAR ENDED JUNE 30, 2018
COMBINING STATEMENT OF REVENUES, EXPENDITURES AND CHANGES IN FUND BALANCES
NONMAJOR GOVERNMENTAL FUNDS
Permanent Funds
City of Somerville, Massachusetts 118 Comprehensive Annual Financial Report

City of Somerville, Massachusetts 119 Comprehensive Annual Financial Report
Agency Fund Agency Fund This fund is segregated from the general fund to account for assets held by the City in a trustee capacity or as an agent for individuals, private organizations, other governmental units, etc.

AGENCY FUND
STATEMENT OF CHANGES IN ASSETS AND LIABILITIES
YEAR ENDED JUNE 30, 2018
June 30, June 30,
2017 Additions Deletions 2018
CURRENT:Cash and cash equivalents……………………..………$ 637,342 $ 6,206,219 $ (6,317,174) $ 526,387
Liabilities due depositors……………………………… $ 564,656 $ 4,750,474 $ (4,871,924) $ 443,206
Accrued liabilities……………………………………… 72,686 1,455,745 (1,445,250) 83,181
TOTAL LIABILITIES……………………………………… $ 637,342 $ 6,206,219 $ (6,317,174) $ 526,387
ASSETS
LIABILITIES
City of Somerville, Massachusetts 120 Comprehensive Annual Financial Report

Statistical Section
Prospect Hill Park located adjacent to the Prospect Hill Memorial Flag Tower and Observatory at the corner of Munroe Street and Prospect Hill Parkway, is an important gem in Somerville’s park network. It was on
Prospect Hill that, on January 1, 1776, George Washington ordered the raising of the first true American flag, the Grand Union Flag. Rehabilitation of the park will begin in 2019.
Photo taken by Rie Lowenstein

City of Somerville, Massachusetts 121 Comprehensive Annual Financial Report
Statistical Section Statistical Section This part of the comprehensive annual financial report presents detailed information as a context for understanding what the information in the financial statements, note disclosures, and required supplementary information says about the City’s overall financial health.
Financial Trends
These schedules contain trend information to help the reader understand how the City’s financial performance and well-being have changed over time.
Revenue Capacity
These schedules contain information to help the reader assess the City’s most significant local revenue source, the property tax.
Debt Capacity
These schedules present information to help the reader assess the affordability of the City’s current levels of outstanding debt and the City’s ability to issue additional debt in the future.
Demographic and Economic Information
These schedules offer demographic and economic indicators to help the reader understand the environment within which the City’s financial activities take place.
Operating Information
These schedules contain service and infrastructure data to help the reader understand how the information in the City’s financial report relates to the City provided services and the activities it performs.
SOURCES: Unless otherwise noted, the information in these schedules is derived from the comprehensive annual financial reports for the relevant year.

2009 2010 2011 2012 2013 2014 (1) 2015 2016 2017 (2) 2018
Governmental activitiesNet investment in capital assets………………$ 114,071,426 $ 114,146,078 $ 117,701,275 $ 126,834,901 $ 136,813,615 $ 135,597,852 $ 132,766,621 $ 130,183,221 $ 128,346,108 $ 138,950,212 Restricted……………………………………… 19,464,156 24,114,249 25,126,498 22,775,093 24,157,523 23,001,973 25,063,900 26,765,034 26,765,236 43,189,284 Unrestricted…………………………………… 22,052,332 3,369,141 (1,130,225) (18,721,004) (23,786,300) (145,351,160) (149,966,003) (156,698,433) (339,726,313) (343,484,682)
Total governmental activities net assets…………… $ 155,587,914 $ 141,629,468 $ 141,697,548 $ 130,888,990 $ 137,184,838 $ 13,248,665 $ 7,864,518 $ 249,822 $ (184,614,969) $ (161,345,186)
Business-type activitiesNet investment in capital assets………………$ 7,539,882 $ 16,039,555 $ 20,025,113 $ 24,078,204 $ 29,794,495 $ 35,084,760 $ 39,855,221 $ 43,810,782 $ 46,081,442 $ 45,635,475 Unrestricted…………………………………… 20,821,058 19,409,168 21,059,957 23,647,858 21,220,544 19,069,553 17,231,368 17,715,352 20,250,359 26,284,738
Total business-type activities net assets……………$ 28,360,940 $ 35,448,723 $ 41,085,070 $ 47,726,062 $ 51,015,039 $ 54,154,313 $ 57,086,589 $ 61,526,134 $ 66,331,801 $ 71,920,213
Primary governmentNet investment in capital assets………………$ 121,611,308 $ 130,185,633 $ 137,726,388 $ 150,913,105 $ 166,608,110 $ 170,682,612 $ 172,621,842 $ 173,994,003 $ 174,427,550 $ 184,585,687 Restricted……………………………………… 19,464,156 24,114,249 25,126,498 22,775,093 24,157,523 23,001,973 25,063,900 26,765,034 26,765,236 43,189,284 Unrestricted…………………………………… 42,873,390 22,778,309 19,929,732 4,926,854 (2,565,756) (126,281,607) (132,734,635) (138,983,081) (319,475,954) (317,199,944)
Total primary government net position………………$ 183,948,854 $ 177,078,191 $ 182,782,618 $ 178,615,052 $ 188,199,877 $ 67,402,978 $ 64,951,107 $ 61,775,956 $ (118,283,168) $ (89,424,973)
Note: In 2008, the City reclassified capital assets related to the water and sewer enterprise funds from the governmental capital assets.(1) = Unrestricted net position has been revised to reflect the implementation of GASB Statements #67, #68, and #71.(2) = Unrestricted net position has been revised to reflect the implementation of GASB Statement #75.
Last Ten Years
Net Position By Component
City of Somerville, Massachusetts 122 Comprehensive Annual Financial Report

2009 2010 2011 2012 2013 2014 2015 2016 2017 2018ExpensesGovernmental activities:
General government……………………………………………………$ 23,220,232 $ 21,779,285 $ 21,655,742 $ 22,124,384 $ 25,892,120 $ 27,028,141 $ 30,201,124 $ 32,270,976 $ 34,076,945 $ 39,372,354 Public safety…………………………………………………………… 53,444,548 52,328,325 45,903,858 52,391,661 51,377,022 52,091,080 52,579,803 54,345,466 58,162,944 54,307,824 Education……………………………………………………………… 110,053,080 108,803,922 108,813,913 113,396,259 113,753,374 121,176,505 114,802,360 124,740,381 132,958,254 128,921,395 Public works…………………………………………………………… 27,101,081 24,973,616 23,346,672 23,631,860 25,203,877 26,974,196 33,520,992 28,957,827 31,017,581 30,766,736 Commmunity development…………………………………………… 9,504,292 6,014,349 7,491,176 5,225,117 5,092,521 5,399,251 5,730,544 5,177,605 9,696,020 4,556,946 Human services………………………………………………………… 122,641 18,802 9,560 316,137 288,766 227,030 229,633 178,570 244,417 279,442 Community preservation……………………………………………… - - - - - 56,770 77,672 347,016 1,522,282 4,207,687 Culture and recreation………………………………………………… 4,159,278 4,566,066 3,880,264 4,160,530 4,695,015 3,868,022 4,948,901 4,787,187 5,245,975 5,843,577 Interest…………………………………………………………………… 2,865,682 2,713,563 2,282,434 2,306,520 2,858,173 3,178,533 2,913,723 2,956,192 3,563,654 3,727,244
Total government activities expenses………………………………………… 230,470,834 221,197,928 213,383,619 223,552,468 229,160,868 239,999,528 245,004,752 253,761,220 276,488,072 271,983,205
Business-type activities: Water…………………………………...……………………………… 7,920,756 6,863,013 9,034,024 8,366,003 9,222,940 9,120,695 9,779,632 10,211,295 11,166,299 11,417,358 Sewer…………………………………………………………………… 12,979,914 13,245,282 14,185,999 14,803,664 15,303,668 15,811,901 16,312,337 17,099,159 18,106,483 18,610,157 Veteran's memorial ice rink…………………………………………… - - - 337,456 522,392 584,995 750,644 721,990 679,098 713,303 Dilboy stadium………………………………………………………… - - - 132,312 147,794 217,761 160,855 136,199 154,881 143,967
Total business-type activities expenses……………………………………… 20,900,670 20,108,295 23,220,023 23,639,435 25,196,794 25,735,352 27,003,468 28,168,643 30,106,761 30,884,785
Total primary government expenses……………………………………………$ 251,371,504 $ 241,306,223 $ 236,603,642 $ 247,191,903 $ 254,357,662 $ 265,734,880 $ 272,008,220 $ 281,929,863 $ 306,594,833 $ 302,867,990
Program RevenuesGovernmental activities:
General government charges for services……………………………$ 2,613,510 $ 3,929,772 $ 5,111,948 $ 5,645,000 $ 4,716,640 $ 6,078,676 $ 14,874,314 $ 9,341,536 $ 10,828,065 $ 17,374,072 Public safety charges for services…………………………………… 11,279,366 11,653,283 11,168,627 10,402,613 10,743,269 9,504,549 9,701,430 9,726,266 11,648,005 10,933,048 Education charges for services……………………………………… 1,289,836 1,523,386 2,773,301 2,888,195 2,620,430 2,744,125 2,854,004 3,025,441 3,251,770 3,689,821 Other charges for services…………………………………………… 1,638,308 1,511,902 2,464,581 2,318,541 2,009,294 1,234,865 1,200,251 1,280,431 1,231,044 1,417,770 General government operating grants and contributions…………… 1,065,242 1,142,773 2,190,637 2,241,945 2,208,949 2,275,935 3,306,728 2,318,143 3,611,794 6,351,895 Public safety operating grants and contributions…………………… 2,073,664 1,582,812 984,665 583,597 733,021 1,035,751 787,168 734,344 567,768 780,100 Education operating grants and contributions……………………… 48,503,731 47,963,393 46,517,454 46,478,286 47,121,192 49,332,811 38,046,566 41,967,740 46,466,462 46,045,575 Public works operating grants and contributions…………………… 865,255 816,657 20,000 149,243 1,201,182 1,030,318 1,151,440 932,462 2,059,979 389,071 Community development operating grants and contributions……… 7,104,189 9,596,234 6,754,407 5,677,368 6,544,448 5,331,152 7,445,467 5,244,967 6,297,670 7,619,395 Other operating grants and contributions…………………………… 1,173,232 1,101,023 1,375,021 1,012,441 991,642 1,028,356 957,692 861,352 888,955 900,158 Education capital grants and contributions…………………………… 1,021,427 - - - 12,653,757 1,686,711 9,685 2,212,282 1,598,709 12,072,086 Other capital grants and contributions………………………………… - - 1,300,151 1,014,340 951,439 365,429 991,751 2,090,371 440,747 2,152,819
Total government activities program revenues...……………………………… 78,627,760 80,821,235 80,660,792 78,411,569 92,495,263 81,648,678 81,326,496 79,735,335 88,890,968 109,725,810
Business-type activities:Water charges for services…………………………………………… 9,826,242 9,968,139 11,499,958 11,972,625 11,878,296 11,952,312 11,923,024 13,249,816 13,945,725 14,027,720 Sewer charges for services…………………………………………… 14,849,185 15,654,243 15,631,262 17,139,421 17,012,055 17,055,541 17,304,880 19,298,052 21,673,233 22,396,044 Veteran's memorial ice rink charges for services…………………… - - - 270,626 377,422 530,583 579,538 638,822 587,035 634,804 Dilboy stadium charges for services………………………………… - - - 90,527 147,000 110,200 181,942 227,234 200,074 232,101 Other capital grant and contributions………………………………… - - - 1,322,550 - 654,755 - - - -
Total business-type activities program revenues...…………………………… 24,675,427 25,622,382 27,131,220 30,795,749 29,414,773 30,303,391 29,989,384 33,413,924 36,406,067 37,290,669
Total primary government program revenues…………………………………$ 103,303,187 $ 106,443,617 $ 107,792,012 $ 109,207,318 $ 121,910,036 $ 111,952,069 $ 111,315,880 $ 113,149,259 $ 125,297,035 $ 147,016,479
Net (Expense)/Program RevenueGovernmental activities…………………………………………………………$ (151,843,074) $ (140,376,693) $ (132,722,827) $ (145,140,899) $ (136,665,605) $ (158,350,850) $ (163,678,256) $ (174,025,885) $ (187,597,104) $ (162,257,395) Business-type activities………………………………………………………… 3,774,757 5,514,087 3,911,197 7,156,314 4,217,979 4,568,039 2,985,916 5,245,281 6,299,306 6,405,884
Total primary government net (expense)/program revenue………………… $ (148,068,317) $ (134,862,606) $ (128,811,630) $ (137,984,585) $ (132,447,626) $ (153,782,811) $ (160,692,340) $ (168,780,604) $ (181,297,798) $ (155,851,511)
General Revenues and other Changes in Net PositionGovernmental activities:
Real estate and personal property taxes………………………………$ 91,192,133 $ 96,029,743 $ 100,266,040 $ 102,516,625 $ 109,373,661 $ 113,520,645 $ 120,408,453 $ 127,658,573 $ 135,251,425 $ 141,935,979 Tax and utility liens……………………………………………………… - - - - 465,853 968,105 416,809 297,772 201,283 159,603 Motor vehicle and other excise taxes………………………………… 4,190,680 4,414,024 5,067,456 6,773,737 7,299,012 7,639,442 8,609,432 9,288,744 9,316,095 10,032,977 Penalties and interest on taxes………………………………………… 695,914 982,668 1,266,600 860,457 1,070,330 1,121,504 858,956 801,173 729,944 869,868 Payments in lieu of taxes……………………………………………… 158,827 163,644 398,281 192,334 182,347 285,596 304,688 829,780 1,248,682 1,327,790 Community Preservation surtax……………………………………… - - - - - 1,323,320 1,430,721 1,545,198 1,664,815 1,794,508 Grants and contributions not restricted……………………………… 38,521,736 23,777,003 24,479,415 22,936,689 23,120,989 23,374,357 25,642,432 24,429,136 25,455,469 26,368,477 Unrestricted investment income……………………………………… 1,096,779 584,028 419,721 320,878 258,370 238,031 292,212 303,517 496,273 1,407,965 Gain on disposal of assets…………………………………………… 7,838 8,635 9,355 - - - 2,031,564 2,031,564 2,031,564 3,911 Miscellaneous…………………………………………………………… 2,019,017 458,502 884,039 61,023 115,049 278,074 113,230 308,206 184,008 537,703 Transfers, net…………………………………………………………… - - - 670,598 1,075,842 526,840 217,176 949,090 (345,056) 1,088,397
Total governmental activities…………………………………………………… 137,882,924 126,418,247 132,790,907 134,332,341 142,961,453 149,275,914 160,325,673 168,442,753 176,234,502 185,527,178
Business-type activities:
Tax and utility liens……………………………………………………… 1,609,372 1,413,910 1,562,666 - - - - - - - Unrestricted investment income……………………………..………… 322,087 159,786 162,484 155,276 146,840 152,624 163,536 142,354 160,353 270,925 Transfers………………………………………………………………… - - - (670,598) (1,075,842) (526,840) (217,176) (948,090) 345,056 (1,088,397)
Total business-type activities…………………………………………………… 1,931,459 1,573,696 1,725,150 (515,322) (929,002) (374,216) (53,640) (805,736) 505,409 (817,472)
Total primary government general revenues and other changes in net position…………………………………………………$ 139,814,383 $ 127,991,943 $ 134,516,057 $ 133,817,019 $ 142,032,451 $ 148,901,698 $ 160,272,033 $ 167,637,017 $ 176,739,911 $ 184,709,706
Changes in Net PositionGovernmental activities…………………………………………………………$ (13,960,150) $ (13,958,446) $ 68,080 $ (10,808,558) $ 6,295,848 $ (9,074,936) $ (3,352,583) $ (5,583,132) $ (11,362,602) $ 23,269,783 Business-type activities………………………………………………………… 5,706,216 7,087,783 5,636,347 6,640,992 3,288,977 4,193,823 2,932,276 4,439,545 6,804,715 5,588,412
Total primary government changes in net position……………………………$ (8,253,934) $ (6,870,663) $ 5,704,427 $ (4,167,566) $ 9,584,825 $ (4,881,113) $ (420,307) $ (1,143,587) $ (4,557,887) $ 28,858,195
Note: Prior to 2012, Veteran's Memorial Ice Rink and Dilboy Stadium activity was accounted for in a special revenue fund.
Changes in Net Position
Last Ten Years
City of Somerville, Massachusetts 123 Comprehensive Annual Financial Report

2009 2010 2011 2012 2013 2014 2015 2016 2017 2018
General FundReserved……………………………$ 14,740,399 $ 15,210,735 $ - $ - $ - $ - $ - $ - $ - $ - Unreserved………………..……… 11,952,907 12,687,703 - - - - - - - - Committed………………………… - - 18,712,499 21,929,103 24,171,167 25,038,098 30,065,350 33,354,136 34,533,997 38,756,437 Assigned…………………………… - - 10,242,471 5,948,451 5,890,549 5,976,724 6,460,233 5,823,265 5,907,817 5,831,550 Unassigned………………………… - - 11,745,190 13,735,197 17,005,198 15,520,425 13,692,118 15,507,488 20,194,053 19,666,376
Total general fund…………………… $ 26,693,306 $ 27,898,438 $ 40,700,160 $ 41,612,751 $ 47,066,914 $ 46,535,247 $ 50,217,701 $ 54,684,889 $ 60,635,867 $ 64,254,363
All Other Governmental FundsReserved……………………………$ 12,276,896 $ 13,423,104 $ - $ - $ - $ - $ - $ - $ - $Unreserved, reported in:
Special revenue funds……… 17,964,768 20,226,857 - - - - - - - Capital projects funds……… (59,498) 6,678,591 - - - - - - - Permanent funds…………… 217,881 163,066 - - - - - - -
Nonspendable…………………… - - 433,126 433,126 433,126 433,126 433,126 433,126 433,126 433,126 Restricted………………………… - - 32,172,936 23,955,913 24,039,762 29,105,031 32,953,447 36,444,641 40,328,168 46,918,568 Unassigned………………………… - - (42,349) (7,897,251) (8,830,687) (11,138,192) (15,052,796) (14,895,671) (11,385,014) (31,035,675)
Total all other governmental funds… $ 30,400,047 $ 40,491,618 $ 32,563,713 $ 16,491,788 $ 15,642,201 $ 18,399,965 $ 18,333,777 $ 21,982,096 $ 29,376,280 $ 16,316,019
Note: The City implemented GASB 54 in 2011, fund balances prior to 2011 have been reported in the pre-GASB 54 format.
Fund Balances, Governmental Funds
Last Ten Years
City of Somerville, Massachusetts 124 Comprehensive Annual Financial Report

2009 2010 2011 2012 2013 2014 2015 2016 2017 2018
Revenues:Real estate and personal property taxes………………… $ 89,398,919 $ 95,031,409 $ 98,921,096 $ 102,575,530 $ 109,391,564 $ 113,427,599 $ 120,742,247 $ 127,359,478 $ 134,759,721 $ 142,059,305 Tax liens……………………………………………………… 1,165,496 1,078,578 1,161,723 1,297,050 1,118,479 847,582 654,405 606,130 392,962 192,533 Motor vehicle and other excise taxes……………………… 4,531,602 4,563,267 4,894,601 6,762,048 7,206,904 7,759,040 8,596,756 9,345,084 9,297,090 9,484,191 Payments in lieu of taxes…………………………………… 158,827 163,644 398,281 192,334 182,347 285,596 304,688 829,780 1,248,682 1,327,790 Intergovernmental…………………………………………… 89,793,239 83,710,418 85,293,814 83,228,489 95,364,763 88,757,484 75,012,124 77,436,920 91,261,649 103,603,155 Departmental and other……………………………………… 22,282,936 23,300,994 23,946,046 23,732,924 22,579,819 22,368,780 31,314,092 26,795,775 29,238,662 34,761,282 Community preservation taxes………………………………… - - - - - 1,323,320 2,335,638 2,375,654 2,085,496 2,164,973 Contributions………………………………………………… 160,049 1,162,345 1,354,249 1,361,020 1,126,151 256,094 3,044,440 757,874 621,388 644,117 Investment income…………………………………………… 1,096,779 584,028 419,721 320,878 238,620 238,031 292,212 308,289 500,910 1,415,231 Miscellaneous………………………………………………… 12,270,901 312,803 229,144 71,679 102,500 268,687 113,209 205,935 134,582 537,703
Total Revenue………………………………………… 220,858,748 209,907,486 216,618,675 219,541,952 237,311,147 235,532,213 242,409,811 246,020,919 269,541,142 296,190,280
Expenditures: General government………………………………………… 12,284,477 11,345,329 12,623,157 12,679,343 16,705,382 17,643,136 19,760,973 21,121,725 22,099,097 26,581,937 Public safety………………………………………………… 31,952,078 31,850,195 30,938,872 36,463,494 37,408,954 37,020,112 38,187,360 38,861,329 41,113,649 40,521,432 Education……………………………………………………… 61,298,672 60,033,670 63,007,532 63,303,388 65,203,861 68,950,650 71,696,093 76,278,689 78,217,082 82,088,771 Public works………………………………………………… 20,701,397 19,162,374 19,461,296 19,831,102 21,203,002 23,213,680 30,173,419 24,285,794 26,189,372 26,404,859 Community development…………………………………… 9,503,292 6,015,349 5,142,819 5,225,117 5,092,521 5,399,251 6,731,292 4,752,888 8,904,122 4,556,946 Human services……………………………………………… 108,906 2,681 7,095 312,548 288,766 224,330 229,633 178,570 244,417 276,304 Culture and recreation……………………………………… 1,841,688 2,596,786 2,397,542 2,413,694 2,853,452 1,792,055 716,322 2,624,181 3,004,178 3,499,569 Pension benefits……………………………………………… 25,601,417 25,028,473 25,986,011 27,154,941 28,472,130 29,482,862 19,710,963 23,927,384 28,429,418 29,742,248 Employee benefits…………………………………………… 29,525,454 28,046,345 28,783,865 27,555,222 20,642,529 23,240,442 23,167,986 23,240,346 24,274,992 30,438,102 Claims and judgments…………………………………………… - - - 124,666 87,190 149,138 237,987 99,590 53,800 - Community preservation………………………………………… - - - - - 56,770 77,672 771,733 2,314,179 4,207,687 State and county charges…………………………………… 9,628,426 9,815,484 10,990,847 10,922,689 11,189,172 11,854,949 12,569,633 12,740,178 13,532,201 13,634,548 Capital outlay………………………………………………… 6,947,220 6,576,020 9,937,843 35,537,453 28,892,038 12,164,916 14,038,651 18,695,120 13,805,058 45,762,086 Debt service: Principal…………………………………………………… 5,003,735 6,048,976 6,799,951 7,473,552 6,921,187 6,971,599 7,968,384 7,110,623 7,455,123 7,101,623 Interest……………………………………………………… 2,615,224 2,802,736 2,404,731 2,494,542 2,871,080 2,890,706 3,016,183 2,866,743 3,639,566 4,112,187
Total Expenditures…………………………………… 217,011,986 209,324,418 218,481,561 251,491,751 247,831,264 241,054,596 248,282,551 257,554,893 273,276,254 318,928,299
Excess of revenues over (under) expenditures…………… 3,846,762 583,068 (1,862,886) (31,949,799) (10,520,117) (5,522,383) (5,872,740) (11,533,974) (3,735,112) (22,738,019)
Other Financing Sources (Uses)
Issuance of bonds and notes………………………..……… - 10,695,000 6,305,000 15,750,000 13,940,000 6,250,000 8,603,000 17,771,000 12,335,000 10,143,102 Issuance of refunding bonds……………………………… - 15,129,000 - - - - - - - 7,810,975 Premium from issuance of bonds…………………..……… - 10,000 422,348 353,483 96,302 962,253 - 930,391 2,970,178 2,119,409 Premium from issuance of refunding bonds.……………… - 682,609 - - - - - - - 578,540 Payments to refunded bond escrow agent………………… - (15,811,609) - - - - - - - (8,448,080) Sale of capital assets…………………………………………… 7,838 8,635 9,355 16,384 12,549 9,387 - - 2,120,152 3,911 Transfers in…………………………………………………… 2,211,567 3,295,179 5,278,835 12,298,802 4,599,007 5,578,902 4,828,239 3,753,592 5,536,920 5,556,671 Transfers out………………………………………………… (2,211,567) (3,295,179) (5,278,835) (11,628,204) (3,523,165) (5,052,062) (3,942,233) (2,805,502) (5,881,976) (4,468,274)
Total other financing sources (uses)……………… 7,838 10,713,635 6,736,703 16,790,465 15,124,693 7,748,480 9,489,006 19,649,481 17,080,274 13,296,254
Net change in fund balance…………………………………… $ 3,854,600 $ 11,296,703 $ 4,873,817 $ (15,159,334) $ 4,604,576 $ 2,226,097 $ 3,616,266 $ 8,115,507 $ 13,345,162 $ (9,441,765)
Debt service as a percentage of noncapital expenditures……… 3.63% 4.37% 4.41% 4.62% 4.47% 4.31% 4.69% 4.18% 4.28% 4.11%
Last Ten Years
Changes in Fund Balances, Governmental Funds
City of Somerville, Massachusetts 125 Comprehensive Annual Financial Report
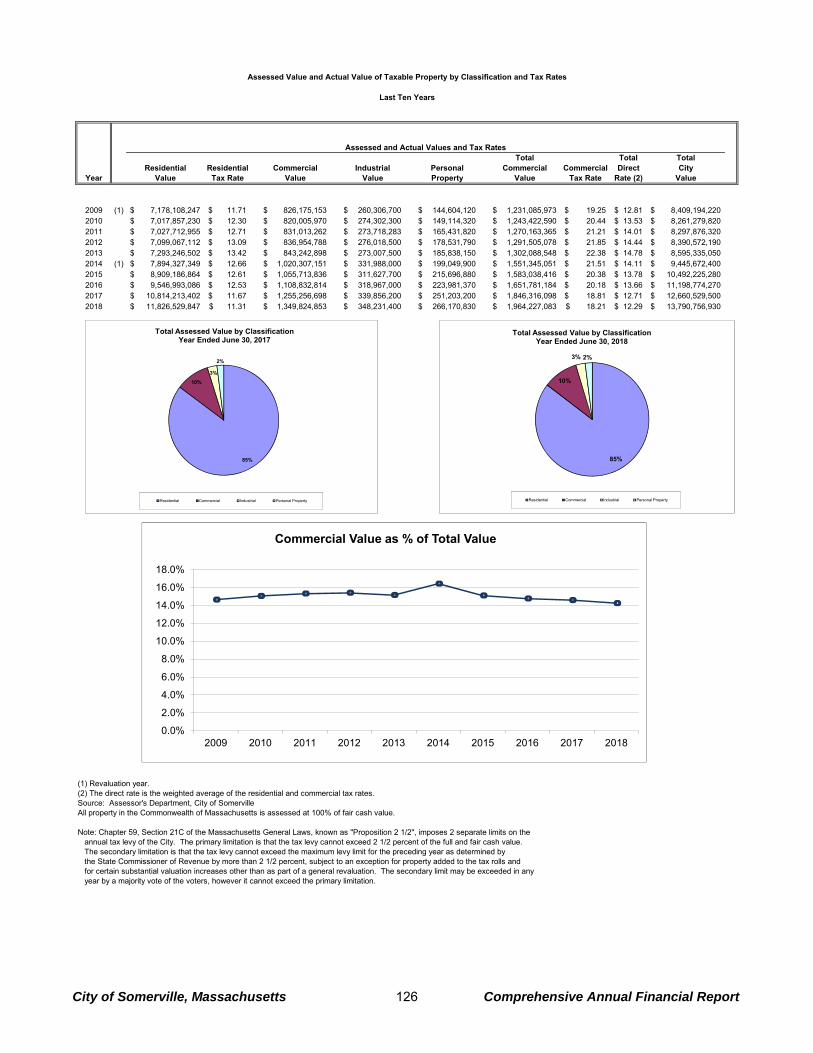
Assessed and Actual Values and Tax RatesTotal Total Total
Residential Residential Commercial Industrial Personal Commercial Commercial Direct CityYear Value Tax Rate Value Value Property Value Tax Rate Rate (2) Value
2009 (1) 7,178,108,247$ 11.71$ 826,175,153$ 260,306,700$ 144,604,120$ 1,231,085,973$ 19.25$ 12.81$ 8,409,194,220$ 2010 7,017,857,230$ 12.30$ 820,005,970$ 274,302,300$ 149,114,320$ 1,243,422,590$ 20.44$ 13.53$ 8,261,279,820$ 2011 7,027,712,955$ 12.71$ 831,013,262$ 273,718,283$ 165,431,820$ 1,270,163,365$ 21.21$ 14.01$ 8,297,876,320$ 2012 7,099,067,112$ 13.09$ 836,954,788$ 276,018,500$ 178,531,790$ 1,291,505,078$ 21.85$ 14.44$ 8,390,572,190$ 2013 7,293,246,502$ 13.42$ 843,242,898$ 273,007,500$ 185,838,150$ 1,302,088,548$ 22.38$ 14.78$ 8,595,335,050$ 2014 (1) 7,894,327,349$ 12.66$ 1,020,307,151$ 331,988,000$ 199,049,900$ 1,551,345,051$ 21.51$ 14.11$ 9,445,672,400$ 2015 8,909,186,864$ 12.61$ 1,055,713,836$ 311,627,700$ 215,696,880$ 1,583,038,416$ 20.38$ 13.78$ 10,492,225,280$ 2016 9,546,993,086$ 12.53$ 1,108,832,814$ 318,967,000$ 223,981,370$ 1,651,781,184$ 20.18$ 13.66$ 11,198,774,270$ 2017 10,814,213,402$ 11.67$ 1,255,256,698$ 339,856,200$ 251,203,200$ 1,846,316,098$ 18.81$ 12.71$ 12,660,529,500$ 2018 11,826,529,847$ 11.31$ 1,349,824,853$ 348,231,400$ 266,170,830$ 1,964,227,083$ 18.21$ 12.29$ 13,790,756,930$
(1) Revaluation year.(2) The direct rate is the weighted average of the residential and commercial tax rates.Source: Assessor's Department, City of SomervilleAll property in the Commonwealth of Massachusetts is assessed at 100% of fair cash value.
Note: Chapter 59, Section 21C of the Massachusetts General Laws, known as "Proposition 2 1/2", imposes 2 separate limits on the annual tax levy of the City. The primary limitation is that the tax levy cannot exceed 2 1/2 percent of the full and fair cash value. The secondary limitation is that the tax levy cannot exceed the maximum levy limit for the preceding year as determined by the State Commissioner of Revenue by more than 2 1/2 percent, subject to an exception for property added to the tax rolls and for certain substantial valuation increases other than as part of a general revaluation. The secondary limit may be exceeded in any year by a majority vote of the voters, however it cannot exceed the primary limitation.
Assessed Value and Actual Value of Taxable Property by Classification and Tax Rates
Last Ten Years
86%
10%
2% 2%
Total Assessed Value by ClassificationYear Ended June 30, 2018
Residential Commercial Industrial Personal Property
85%
10%
3% 2%
Total Assessed Value by ClassificationYear Ended June 30, 2017
Residential Commercial Industrial Personal Property
0.0%
2.0%
4.0%
6.0%
8.0%
10.0%
12.0%
14.0%
16.0%
18.0%
2009 2010 2011 2012 2013 2014 2015 2016 2017
Commercial Value as % of Total Value
85%
10%
3% 2%
Total Assessed Value by ClassificationYear Ended June 30, 2018
Residential Commercial Industrial Personal Property
85%
10%
3%
2%
Total Assessed Value by ClassificationYear Ended June 30, 2017
Residential Commercial Industrial Personal Property
0.0%
2.0%
4.0%
6.0%
8.0%
10.0%
12.0%
14.0%
16.0%
18.0%
2009 2010 2011 2012 2013 2014 2015 2016 2017 2018
Commercial Value as % of Total Value
City of Somerville, Massachusetts 126 Comprehensive Annual Financial Report

Percentage of Percentage ofTotal Taxable Total Taxable
Nature of Assessed Assessed Assessed AssessedName Business Valuation Rank Value Valuation Rank Value
Street Retail Inc Commercial 392,559,100$ 1 4.16% - - -
NSTAR Electric Co Electric Company 81,640,080$ 2 0.86% 54,794,010$ 3 0.64%
FR Assembly Square LLC Shopping Mall 78,066,700$ 3 0.83% 62,391,000$ 1 0.73%
Twin City Plaza LLC Retail Mall 52,838,300$ 4 0.56% 55,126,300$ 2 0.64%
NSTAR Gas Co Electric Company 45,267,680$ 5 0.48% - - -
I-93 Somerville LLC Retail 40,078,400$ 6 0.42% 37,000,000$ 4 0.43%
National Tax Search LLC Trustee Office Building 37,899,500$ 7 0.40% 24,658,800$ 8 0.29%
GAHC3 Somerville MOB LLC Professional Building 37,428,100$ 8 0.40% - - -
CRP 70 Inner Belt LLC Telecom 37,289,300$ 9 0.39% 30,684,700$ 6 0.36%
IMP Maxwell's Green LLC Residential 48,913,500$ 10 0.52% - - -
Kadima Medical Properties LLC Professional Building -$ - - 32,698,600$ 5 0.38%
IKEA Property Inc Commercial Land -$ - - 23,934,000$ 7 0.28%
FR Sturtevant Street LLC Retail -$ - - 19,668,400$ 9 0.23%
Clarendon Hills Towers Association Apartments -$ - - 31,787,100$ 10 0.37%
Totals $851,980,660 9.02% $372,742,910 4.34%
Source: Official Statement for Sale of Bonds
Principal Taxpayers
Current Year and Nine Years Ago
2018 2009
City of Somerville, Massachusetts 127 Comprehensive Annual Financial Report

(3)Percent of
(2) Less (2) First Year Percent of Delinquent Total Total TaxTotal Abatements & Net Current Net Levy Tax Tax Collections to
Year Tax Levy Exemptions Tax Levy Tax Collections Collected Collections Collections Net Tax Levy
2009 (1) 92,502,692$ 1,235,728$ 91,266,964$ 91,213,775$ 99.94% 56,154$ 91,269,929$ 100.00%2010 96,493,032$ 1,372,905$ 95,120,127$ 94,988,009$ 99.86% 128,204$ 95,116,213$ 100.00%2011 100,548,992$ 463,464$ 100,085,528$ 98,703,495$ 98.62% 1,377,979$ 100,081,474$ 100.00%2012 104,765,287$ 1,088,607$ 103,676,680$ 102,975,339$ 99.32% 696,871$ 103,672,210$ 100.00%2013 109,923,036$ 799,886$ 109,123,150$ 108,407,664$ 99.34% 711,174$ 109,118,838$ 100.00%2014 (1) 116,112,597$ 1,416,537$ 114,696,060$ 113,841,400$ 99.25% 860,377$ 114,701,777$ 100.00%2015 122,165,461$ 1,697,496$ 120,467,965$ 120,376,618$ 99.92% 814,136$ 121,190,754$ 100.60%2016 129,147,863$ 1,680,095$ 127,467,768$ 126,428,749$ 99.18% 558,205$ 126,986,954$ 99.62%2017 136,071,683$ 1,709,004$ 134,362,679$ 133,730,789$ 99.53% 948,287$ 134,679,076$ 100.24%2018 143,491,095$ 1,528,746$ 141,962,349$ 141,091,495$ 99.39% -$ 141,091,495$ 99.39%
(1) Revaluation year.(2) Includes tax liens.(3) If the actual abatements and exemptions are lower than the estimate the actual collections can exceed the net levy. Source: Assessor's Department, City of Somerville
Property Tax Levies and Collections
Last Ten Years
0
10,000,000
20,000,000
30,000,000
40,000,000
50,000,000
60,000,000
70,000,000
80,000,000
90,000,000
100,000,000
110,000,000
120,000,000
130,000,000
2009 2010 2011 2012 2013 2014 2015 2016 2017 2018
Mil
lio
ns
Real Estate Tax Levies vs. First Year CollectionsLast Ten Years
Real Estate Tax Levy First Year Current Tax Collections
City of Somerville, Massachusetts 128 Comprehensive Annual Financial Report

General Percentage PercentageU. S. Census Personal Assessed Obligation Capital Per of Personal of Assessed
Year Population Income Value Bonds Leases Capita Income Value
2009 75,656 2,136,347,437$ 8,409,194,220$ 63,807,780$ -$ 843$ 2.99% 0.76%2010 75,754 2,463,292,818$ 8,261,279,820$ 69,122,803$ -$ 912$ 2.81% 0.84%2011 75,965 2,519,556,983$ 8,297,876,320$ 68,627,852$ -$ 903$ 2.72% 0.83%2012 76,267 2,580,164,990$ 8,390,572,190$ 76,177,493$ -$ 999$ 2.95% 0.91%2013 76,589 2,642,879,641$ 8,595,335,050$ 84,360,426$ -$ 1,101$ 3.19% 0.98%2014 78,804 2,773,699,578$ 9,445,672,400$ 84,481,455$ -$ 1,072$ 3.05% 0.89%2015 78,901 2,832,656,005$ 10,492,225,280$ 82,313,356$ -$ 1,043$ 2.91% 0.78%2016 80,318 2,941,198,848$ 11,198,774,270$ 93,750,365$ -$ 1,167$ 3.19% 0.84%2017 81,322 3,037,524,044$ 12,660,529,500$ 101,423,345$ -$ 1,247$ 3.34% 0.80%2018 81,360 3,283,364,160$ 13,790,756,930$ -$ -$ 0.00% 0.00%
General Total Percentage PercentageObligation Capital Debt Per of Personal of Assessed
Year Bonds Leases Outstanding Capita Income Value
2009 15,380,835$ -$ 79,188,615$ 1,047$ 3.71% 0.94%2010 15,377,277$ -$ 84,500,080$ 1,115$ 3.43% 1.02%2011 13,343,849$ -$ 81,971,701$ 1,079$ 3.25% 0.99%2012 14,245,269$ -$ 90,422,762$ 1,186$ 3.50% 1.08%2013 13,258,968$ -$ 97,619,394$ 1,275$ 3.69% 1.14%2014 11,801,568$ -$ 96,283,023$ 1,222$ 3.47% 1.02%2015 12,838,188$ -$ 95,151,544$ 1,206$ 3.36% 0.91%2016 10,494,094$ -$ 104,244,459$ 1,298$ 3.54% 0.93%2017 9,950,711$ -$ 111,374,056$ 1,370$ 3.67% 0.88%2018 -$ -$ -$ -$ 0.00% 0.00%
(1) Prior to 2008, water and sewer enterprise long-term debt activity was accounted for in the general fund.Source: Audited Financial Statements, U. S. Census, Division of Local Services
Ratios of Outstanding Debt and General Bonded Debt
Last Ten Years
Governmental Activities
Business-type Activities (1) Total Primary Government
City of Somerville, Massachusetts 129 Comprehensive Annual Financial Report

2009 2010 2011 2012 2013 2014 2015 2016 2017 2018
Equalized Valuation…………………… 9,612,275,100$ 9,612,275,100$ 9,139,060,000$ 9,139,060,000$ 9,237,328,000$ 9,237,328,000$ 10,446,575,400$ 10,446,575,400$ 12,444,120,102$ 12,444,120,102$
Debt Limit -5% of Equalized Valuation 480,613,755$ 480,613,755$ 456,953,000$ 456,953,000$ 461,866,400$ 461,866,400$ 522,328,770$ 522,328,770$ 622,206,005$ 622,206,005$
Less: Outstanding debt applicable to limit… 31,599,202 39,044,961 41,567,791 37,839,168 34,360,463 44,912,764 40,816,987 45,884,806 53,465,081 59,559,553 Authorized and unissued debt……… 28,958,133 29,217,833 18,828,465 21,688,655 16,399,828 18,467,952 31,140,652 53,584,828 94,436,450 158,894,669
Legal debt margin……………………… 420,056,420$ 412,350,961$ 396,556,744$ 397,425,177$ 411,106,109$ 398,485,684$ 450,371,131$ 422,859,136$ 474,304,474$ 403,751,783$
Total debt applicable to the limit as a percentage of debt limit………… 12.60% 14.20% 13.22% 13.03% 10.99% 13.72% 13.78% 19.04% 23.77% 35.11%
Source: Official Statement for Sale of Bonds
Computation of Legal Debt Margin
Last Ten Years
City of Somerville, Massachusetts 130 Comprehensive Annual Financial Report

EstimatedEstimated Share of
Debt Percentage Overlapping City of Somerville, Massachusetts Outstanding Applicable Debt
Debt repaid with property taxesMWRA Water………………………………………………………………$ 2,057,635,000 3.27% $ 67,284,665 MWRA Sewer…………………………………………………………… 3,572,843,000 3.47% 123,977,652 Massachusetts Bay Transportation Authority………………………… 5,563,850,000 3.10% 172,479,350
Subtotal, overlapping debt………………………………………………………………………….…………………… 363,741,667
City direct debt…………………………………………………………………………………………………………… -
Total direct and overlapping debt……………………………………………………………………………………… $ 363,741,667
Source: City of Somerville, Auditing Department and related organizations.
Direct and Overlapping Governmental Activities Debt
As of June 30, 2018
Note: Overlapping governments are those that coincide, at least in part, with geographic boundaries of the City. This schedule estimates the portion of the outstanding debt of those overlapping governments that is borne by the taxpayers of City. This process recognizes that, when considering the government's ability to issue and repay long-term debt, the entire debt burden borne by the property taxpayers should be taken into account. However, this does not imply that every taxpayer is a resident, and therefore responsible for repaying the debt, of each overlapping government.
City of Somerville, Massachusetts 131 Comprehensive Annual Financial Report

PerCapita
Population Personal Personal Median UnemploymentYear Estimates Income Income Age Rate
2009 75,656 2,136,347,437$ 28,238$ 31.1 6.3%2010 75,754 2,463,292,818$ 32,517$ 31.4 6.4%2011 75,965 2,519,556,983$ 33,167$ 31.4 5.2%2012 76,267 2,580,164,990$ 33,831$ 31.4 4.9%2013 76,589 2,642,879,641$ 34,507$ 31.4 5.2%2014 78,804 2,773,699,578$ 35,197$ 31.3 3.7%2015 78,901 2,832,656,005$ 35,901$ 31.3 3.3%2016 80,318 2,941,198,848$ 36,619$ 31.3 2.4%2017 81,322 3,037,524,044$ 37,352$ 31.3 3.3%2018 81,360 3,283,364,160$ 40,356$ 31.6 3.5%
Source: U. S. Census, Division of Local Services, Executive Office of Labor and Workforce DevelopmentMedian age is based on most recent census data.
Demographic and Economic Statistics
Last Ten Years
City of Somerville, Massachusetts 132 Comprehensive Annual Financial Report

Nature Percentage of Percentage ofof Total City Total City
Employer Business Employees Rank Employment Employees Rank Employment
Partners Healthcare Health Care 3,700 1 13.3% - - -
ABM Industries Janitorial Services 2,000 2 7.2% 2,000 1 9.2%
Cambridge Health Alliance Health Care 1,014 3 3.7% 1,014 2 4.6%
J&S Electric Company Building Equipment 525 4 1.9% - - -
Somerville Hospital Health Care 500 5 1.8% - - -
Angelica Corp. Laundry 412 6 1.5% 546 3 2.5%
Royal Hospital Services Incorporated Office Supplies 380 7 1.4% - - -
Market Basket Grocery Store 372 8 1.3% - - -
FormLabs Scientific Research 300 9 1.1% - - -
Rogers Foam Corp. Foam Products 300 10 1.1% - - -
Van der Weil Engineering/Consulting - - - 300 4 1.4%
Gentle Giant Local Trucking - - - 250 5 1.1%
Harvard Vanguard Health Care - - - 225 6 1.0%
FISEVR Data Processing - - - 220 7 1.0%
Star Market / Shaw's Supermarkets Grocery - - - 217 8 1.0%
Home Depot Retail - - - 215 9 1.0%
Ames Safety Envelope Envelopes & Printing - - - 200 10 0.9%
Totals 9,503 34.3% 5,187 23.7%
Source: Massachusetts Department of Workforce Development
Principal Employers (Excluding City)
Current Year and Nine Years Ago
2018 2009
City of Somerville, Massachusetts 133 Comprehensive Annual Financial Report

2009 2010 2011 2012 2013 2014 2015 2016 2017 2018Full-Time Equivalents
City………………………………………… 712 708 670 675 696 714 729 736 755 772
School…………………………………… 853 823 843 845 892 908 923 929 937 932
Total ……………………………………… 1,564 1,531 1,513 1,520 1,587 1,622 1,652 1,665 1,692 1,704
Source: Finance Committee Report
Full-Time Equivalent City Employees
Last Ten Years
City of Somerville, Massachusetts 134 Comprehensive Annual Financial Report

2009 2010 2011 2012 2013 2014 2015 2016 2017 2018General Government:
Registered Voters……………………………… 42,759 42,937 43,633 45,987 47,484 47,454 45,655 51,319 51,362 54,672Births…………………………………………… 885 873 922 962 957 974 863 838 854 618**Marriages……………………………………… 602 586 553 503 591 548 513 590 606 438**Deaths…………………………………………… 393 459 441 420 410 517 589 561 427 519**Dogs licensed………………………………… 1,120 1,289 1,595 1,967 1,790 2,127 1,780 2,053 1,831 1,859**Business Certificates………………………… 471 466 445 451 425 483 318 307 274 218**
Fire: Total Fires……………………………………… 134 98 156 279 476 377 431 429 462 440*
Structure Fires………………………………… 59 42 44 60 107 56 258 321 354 311*Vehicle Fires………………………………… 17 16 16 15 24 14 24 14 21 20*Other Fires…………………………………… 58 40 96 204 345 307 149 94 87 110*
Civilian Deaths………………………………………… 0 0 3 1 0 0 0 0 0 0*Injuries………………………………………… 1 24 41 22 5 1 0 8 5 4*
Fire Service Deaths………………………………………… 0 0 0 0 0 0 0 0 0 0*Injuries………………………………………… 84 76 81 44 71 38 17 29 23 23*
Dollar Loss……………………………………… 2,211,115$ 2,258,000$ 3,019,600$ 2,438,000$ 5,850,000$ 1,559,364$ 663,875$ 3,601,500$ $3,666,101 $2,643,825*
Police: Violent crime total……………………………… 282 226 259 258 178 206 183 198 172 183
Murder and nonnegligent manslaughter…… 3 0 1 0 0 1 0 0 2 0*Forcible rape………………………………… 7 14 17 22 17 10 8 15 19 14*Robbery……………………………………… 104 77 90 84 51 58 40 48 39 42*Aggravated assault…………………………… 168 135 151 152 110 137 135 135 112 127*
Property crime total…………………………… 1,970 2,028 1,760 1,752 1,552 1,253 1,695 1,239 1,104 1,346 Burglary……………………………………… 493 514 416 349 430 192 305 207 171 228*Larceny-theft………………………………… 1,314 1,336 1,193 1,270 1,021 949 1,257 931 834 1,007*Motor vehicle theft…………………………… 163 178 151 133 101 112 133 101 99 111*
Traffic and Parking:
Tickets Issued…………………………………… 189,878 158,995 152,381 149,844 144,919 128,449 140,974 137,973 125,472 134,806*
Inspectional: Building Permit Count………………………… 1,507 1,736 1,627 1,682 1,775 1,775* 2,166 2,034 2,186 2,128*
Education:
Total enrollment………………………………… 4,877 4,842 4,855 4,877 4,922 4,940 4,987 4,931 4,950 4,956
Library:+ Total Circulation………………………………… 499,205 501,095 466,304 448,579 415,666 411,566 387,222 396,812 378,929 387,654*Total Holdings…………………………………… 185,611 183,791 185,930 192,229 194,451 200,522 205,045 211,941 215,289 210,758*Registered users……………………………… 27,939 27,663 27,826 27,934 28,017 29,611 29,351 33,500 34,395 32,415*
NA - Information not available+ Denotes fiscal year reporting schedule, * Denotes estimates based on prior year data, ** Denotes year-to-dateSource: Elections Dept, City Clerk, Fire Dept, Police Dept, T&P Dept, ISD, Mass DoE, MBoLC
Last Ten Years
Operating Indicators by Function/Program
City of Somerville, Massachusetts 135 Comprehensive Annual Financial Report
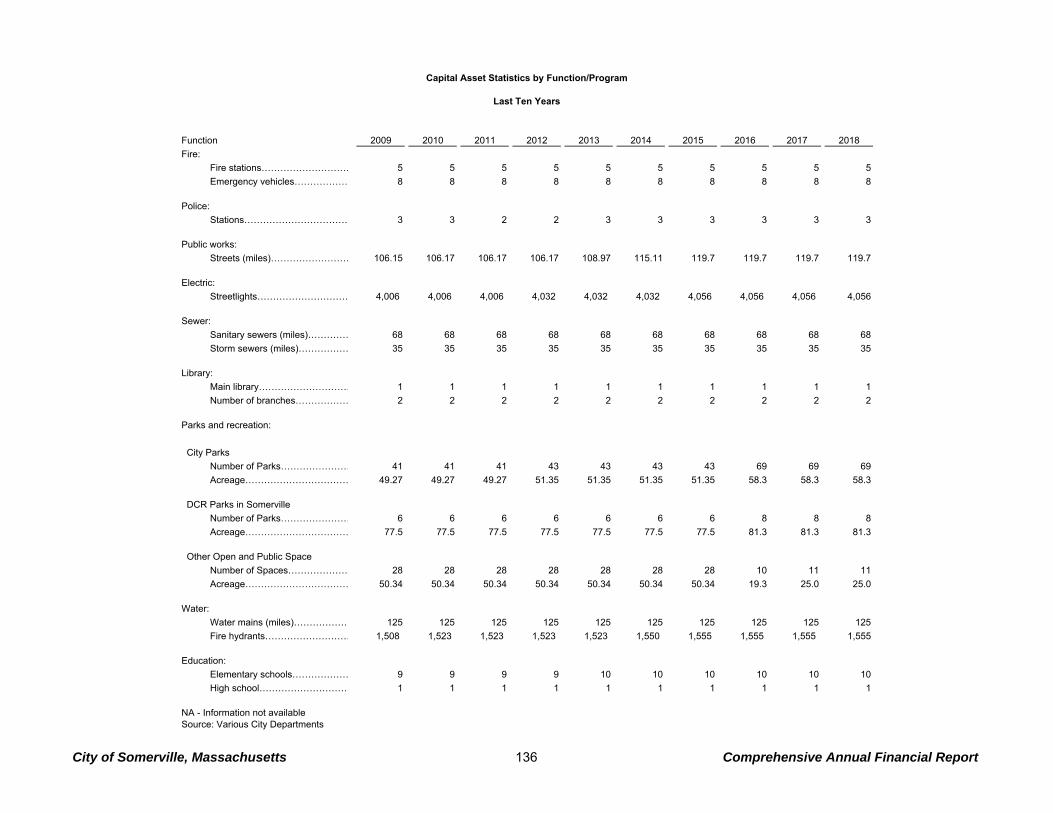
Function 2009 2010 2011 2012 2013 2014 2015 2016 2017 2018
Fire:
Fire stations………………………… 5 5 5 5 5 5 5 5 5 5
Emergency vehicles……………… 8 8 8 8 8 8 8 8 8 8
Police:
Stations…………………………… 3 3 2 2 3 3 3 3 3 3
Public works:
Streets (miles)……………………… 106.15 106.17 106.17 106.17 108.97 115.11 119.7 119.7 119.7 119.7
Electric:
Streetlights………………………… 4,006 4,006 4,006 4,032 4,032 4,032 4,056 4,056 4,056 4,056
Sewer:
Sanitary sewers (miles)…………… 68 68 68 68 68 68 68 68 68 68
Storm sewers (miles)……………… 35 35 35 35 35 35 35 35 35 35
Library:
Main library………………………… 1 1 1 1 1 1 1 1 1 1
Number of branches……………… 2 2 2 2 2 2 2 2 2 2
Parks and recreation:
City Parks
Number of Parks…………………… 41 41 41 43 43 43 43 69 69 69
Acreage…………………………… 49.27 49.27 49.27 51.35 51.35 51.35 51.35 58.3 58.3 58.3
DCR Parks in Somerville
Number of Parks…………………… 6 6 6 6 6 6 6 8 8 8
Acreage…………………………… 77.5 77.5 77.5 77.5 77.5 77.5 77.5 81.3 81.3 81.3
Other Open and Public Space
Number of Spaces………………… 28 28 28 28 28 28 28 10 11 11
Acreage…………………………… 50.34 50.34 50.34 50.34 50.34 50.34 50.34 19.3 25.0 25.0
Water:
Water mains (miles)……………… 125 125 125 125 125 125 125 125 125 125
Fire hydrants……………………… 1,508 1,523 1,523 1,523 1,523 1,550 1,555 1,555 1,555 1,555
Education:
Elementary schools……………… 9 9 9 9 10 10 10 10 10 10
High school………………………… 1 1 1 1 1 1 1 1 1 1
NA - Information not available Source: Various City Departments
Last Ten Years
Capital Asset Statistics by Function/Program
City of Somerville, Massachusetts 136 Comprehensive Annual Financial Report


