
Final Moldova Energy PSIA - World Bank
34
Europe and Central Asia Region THE WORLD BANK Environmentally and Socially Sustainable Development SHARING POWER Lessons Learned From the Reform and Privatization of Moldova’s Electricity Sector Poverty and Social Impact Analysis Nils Junge Taras Pushak Julian Lampietti Nora Dudwick Katelijn Van den Berg Public Disclosure Authorized Public Disclosure Authorized Public Disclosure Authorized Public Disclosure Authorized
Transcript of Final Moldova Energy PSIA - World Bank

Europe and Central Asia Region THE WORLD BANK Environmentally and Socially Sustainable Development
SHARING POWER
Lessons Learned From the Reform and Privatization of Moldova’s Electricity Sector
Poverty and Social Impact Analysis
Nils Junge Taras Pushak
Julian Lampietti Nora Dudwick Katelijn Van den Berg
Pub
lic D
iscl
osur
e A
utho
rized
Pub
lic D
iscl
osur
e A
utho
rized
Pub
lic D
iscl
osur
e A
utho
rized
Pub
lic D
iscl
osur
e A
utho
rized
Administrator
30376
Europe and Central Asia Region Environmentally and Socially Sustainable Development
SHARING POWER
Lessons Learned From the Reform and Privatization of Moldova’s Electricity Sector
Poverty and Social Impact Analysis
September 19, 2004 Nils Junge Taras Pushak
Julian Lampietti Nora Dudwick Katelijn Van den Berg
THE WORLD BANK

The International Bank for Reconstruction and Development / The World Bank 1818 H Street, N.W. Washington, D.C. 20433 All rights reserved. The findings, interpretations, and conclusions expressed in this report are those of the author(s) and do not necessarily reflect the views of the Board of Executive Directors of the World Bank or the governments they represent. Cover photo: Man installing light bulbs in Chisinau, Moldova. Photo by Alexandru Otel/ Moldova.

Currency Exchange Rate
Currency unit: Moldovan Leu 11.8 lei = $1
Abbreviations
ANRE National Energy Regulatory Agency GDP Gross Domestic Product GWh gigawatt hour IMF International Monetary Fund kWh kilowatts per hour LPG liquified petroleum gas MDL Moldovan leu NRED northern energy distribution network (state-owned distribution companies)NTC nominative targeted compensation RED energy distribution network
Vice President: Shigeo Katsu (ECAVP) Country Director: Luca Barbone (ECCU2)
Sector Director: Laura Tuck (ECSSD) Sector Manager: Alexandre Marc (ECSSD)
Task Team Leader: Julian Lampietti (ECSSD)
Contents Acknowledgements..............................................................................................................1 Executive Summary ............................................................................................................ 2 The Context of Reform and the Scope of the Report.......................................................... 4 How Did Moldova Weather the Transition to a Market Economy?................................... 5 Implementing Reform ........................................................................................................ 7 Methodology of the Study................................................................................................. 10 How Has Privatization Affected the Poor and the Nonpoor?............................................11 How Does Consumption by Union Fenosa and NRED Customers Differ?.......................16 Are Moldova’s Social Transfers Adequate to Mitigate the Impact of Higher Tariffs on the Poor? ................................................................................................................................. 22 References......................................................................................................................... 27 Tables Table 1. Per Capita Electricity Consumption in Selected Countries, 2002 .........................7 Table 2. Share of Electricity Expenditures by the Poor and Nonpoor, 1999 and 2003 ....12 Table 3. Change in Electricity Consumption and Expenditures, by Type of Area.............13 Table 4. Consumption, Payments, and Percentage of Income Spent on Electricity by Union Fenosa and NRED Customers, 2000–03...............................................................17 Table 5. Change in Electricity Consumption between 2000 and 2003, by Type of Provider and Area ..............................................................................................................18 Table 6. Electricity Losses by Union Fenosa and the NREDs, 1999–2002.......................19 Table 7. Net Sales at State-Run Electric Utilities and Union Fenosa, 1999–2002 .......... 20 Table 8. Debt for Imports of Energy, 2000–03.................................................................21 Table 9. Households Receiving Nominative Targeted Compensation for Electricity, by Income Quintile .................................................................................................................23 Figures Figure 1. Electricity consumption in Moldova plunged between 1992 and 2000.............. 4 Figure 2. Poverty has declined since 2000, although it remains high in small towns....... 6 Figure 3. Electricity is the most expensive source of energy in Moldova........................... 9 Figure 4. The gap in electricity consumption between the poor and the nonpoor is narrowing...........................................................................................................................11 Figure 5. The share of electricity expenditures in total expenditures has declined since 1999 - in cities, small towns, and rural areas.................................................................... 14 Boxes Box 1. Nominative Targeted Compensation Categories ................................................... 22 Annexes Annex 1. Demand Models ................................................................................................. 24 Annex 2. Privatization of Moldova’s Energy Sector.......................................................... 26

1
Acknowledgements This report was prepared by Nils Junge (Consultant), Taras Pushak (Consultant), Julian Lampietti (Senior Social Development Economist, ECSSD), Nora Dudwick (Lead Social Scientist), and Katelijn Van den Berg (Environmental Economist, ECSSD). Sandu Ghidirim (Consultant) advised on the energy sector and Tamara Ursu (Mission Coordinator) provided support from the Moldova Country Office. Natalia Otel (Junior Professional Associate, ECSSD) coordinated the finalization of the document.
We would like to acknowledge helpful comments from the peer reviewers Anders Zeijlon (WBIEE) and Reidar Kvam (SDV). Additional comments from Lawrence Bouton (ECSPE), Anush Bezhanyan (ECSHD), Ellen Hamilton (ECSIE), Dejan Ostojic (ECSIE), and Vlado Vucetic (SASEI) are greatly appreciated.
We are particularly grateful to the local stakeholders including the members of the Working Group who participated in consultative workshops and various discussions that helped guide the research. We would also like to thank the National Energy Regulatory Agency (ANRE), Union Fenosa, the Department of Statistics and Sociology, the Ministry of Labor and Social Assistance, the Ministry of Energy and the Ministry of Economy for their collaboration.
The study team is grateful to Agape, a local NGO that collected the qualitative data, for high quality documentation of focus groups and key informant interviews, as well as for flexibility in accommodating the ever changing needs of the study team. Many thanks to Cristina Vladu (Consultant) for training the local qualitative research team.

2
Executive Summary In 1997 Moldova launched a reform program, strongly supported by donors, to address urgent problems in the energy sector. Reforms resulted in substantial improvements in supply to consumers, but the dialogue in recent years has been accompanied by acrimonious debate by stakeholders. Much of the disagreement has centered on the private operator, Union Fenosa, which purchased almost two-thirds of the electricity distribution network in 2000. Since privatization, accusations, counteraccusations, and lawsuits have led to a climate of uncertainty for continued reform. One of the central complaints has been that privatization has adversely affected the poor. This study answers two questions about power sector reform in Moldova. First, did reform affect the poor and the nonpoor differently? Second, are household consumption patterns different for private and public distribution networks? The study concludes that reforms have not disproportionately affected the poor. The gap in electricity consumption between poor and nonpoor is closing, as a result of improvements in the supply of electricity, particularly in rural areas, and the significant growth in income over the past four years. These positive indicators notwithstanding, Moldova’s residential electricity consumption remains exceptionally low and is probably highly inelastic, especially for the very poor. This implies that unless they are accompanied by increases in income, future tariff increases could create large potential consumer welfare losses—as well as large revenue gains for the utility. It also implies that there may be room for substantial welfare gains by helping households better manage their electricity expenditures. Measures to do so could include introducing prepayment swipe cards for meters, in order to reduce both the costs and anxiety associated with disconnections; encouraging the poor to use more energy-efficient refrigeration and lighting technologies, through vouchers or other similar programs; and having the public sector defray the cost of extending access to clean, inexpensive gas in small towns where people rely on electricity for heating, if it can be done in a way that limits the financial liabilities for the government. The study finds that residential consumption patterns are the same for the private and state-owned electricity distribution networks. While the share of electricity expenditures in total expenditures fell more among households served by the state-owned distribution companies, it is similar (about 4 percent) for households served by both stated-owned and the privatized distribution companies. Across the country, service quality and collection rates have improved, and the share of income spent on electricity is lower than at any time since 2000. Privatization is correlated with positive developments in the sector, such as reduced government deficits and improved performance across the board in the sector. The presence of the private operator may have put pressure on the state operator to improve its performance, suggesting that the presence of a private operator in a chronically underperforming sector may have a significant positive

3
spillover effect. If this effect did indeed occur, there may be significant advantages to applying a partial privatization model to other underperforming sectors, such as district heating, water, and possibly gas. The analysis indicates that more could be done to direct assistance to the very poor. Efforts could include improving targeting strategies or alternatively promoting a lifeline tariff structure.

4
The Context of Reform and the Scope of the Report By the late 1990s Moldova was facing an energy crisis. Entirely dependent on imported energy, Moldova found itself unable to pay rapidly rising international fuel prices. Debt to foreign oil and gas suppliers ballooned, and per capita electricity consumption plunged to the lowest levels in Europe (figure 1). Per capita monthly electricity consumption in 2001 was 51 kWh—just a quarter of average consumption in the Europe and Central Asia Region.1 Residential energy tariffs remained low until 1998, and sector revenue no longer covered the cost of imports. The government subsidized tariffs and covered the debt, but consumers paid a price, too. Access was universal, but it was rationed, with many localities outside the capital receiving electricity just a few hours a day.2 Power was often interrupted without warning.
Stakeholders question the costs and benefits of reform. To address the urgent problems in the sector, in 1997 Moldova launched a reform program, with strong donor support. While there have been substantial improvements in supply to consumers, the dialogue in recent years has been accompanied by acrimonious debate by stakeholders. Much of the disagreement has centered on the private operator. In early 2000 the Spanish company Union Fenosa purchased almost two-thirds of the electricity distribution network, a highly visible privatization that made it the country’s largest foreign investor. Since then, accusations, counteraccusations, and lawsuits have led to a climate of uncertainty for continued reform. Union Fenosa electricity tariffs are about 10 percent higher than those of state companies, fueling concerns that the profit motive has left consumers, particularly the poor, worse off. Some opponents of reform claim that electricity is 1 International Energy Agency. 2003. “World Energy Statistics and Balances.” 2 Dodonu, Veaceslav. 1999. “Moldova’s Power Sector: Challenges and Opportunities.”
Figure 1. Electricity consumption in Moldova plunged between 1992 and 2000
(average total electricity consumption per year)
0
2,000
4,000
6,000
8,000
10,000
1992 1993 1994 1995 1996 1997 1998 1999 2000
GW
h p
er y
ear
AlbaniaArmeniaGeorgiaMoldovaTurkmenistan
Source: International Energy Agency.
5
a merit good and that the public sector should therefore provide it. Others claim that consumers are getting a bad deal from the private sector because the regulatory system is weak. Proponents of the privatization argue that it has made the electricity sector more efficient and financially stable. This report sets out to answer two questions about reform. First, did reform affect the poor and the nonpoor differently? Second, are household consumption patterns different within private and public distribution networks? To get at these issues, the report analyzes a range of household welfare indicators, including access to, consumption of, and expenditures on electricity. It also analyzes coping mechanisms, the roles played by the social assistance compensation system, and consumer perceptions. How Did Moldova Weather the Transition to a Market Economy? Formerly a middle-income member of the Commonwealth of Independent States, Moldova is now the poorest country in Europe. In 2003 per capita Gross Domestic Product (GDP) in Moldova was $543, among the lowest in the Europe and Central Asia Region.3 Over the past decade, in the face of decreasing opportunities and rising poverty, large numbers of Moldovans emigrated to find work abroad. Up to one quarter of the country’s 4.2 million are estimated to have left the country.4 Poor governance and conflict contributed to Moldova’s economic decline during the 1990s. Following a promising beginning in the early 1990s, poor governance took a heavy toll. Corruption had a corrosive effect on the economy. The war in Transnistria also contributed to economic decline. Although the conflict was brief, the central government, based in Chisinau, lost control over Transnistria, which now functions as a breakaway region, with its own government. A significant share of Moldova’s industrial and power generation sector is located in Transnistria.5 The economy has improved steadily since 2000. GDP expanded from $1.3 in 2000 to $1.9 billion in 2003,6 wages climbed, and inflation fell. Unemployment dropped from 11.1 percent in 1999 to 6.8 percent in 2002,7 although it continues to be a leading cause of emigration.8 Poverty has dropped significantly. This report builds on the recently completed poverty assessment Recession, Recovery, and Poverty in Moldova, 3 National Bank of Moldova. Online: http://www.bnm.md/english/index_en.html 4 World Bank. 2004. “Recession, Recovery and Poverty in Moldova.” 5 World Bank. 1996. “Staff Appraisal Report. Republic of Moldova.” 6 Economist Intelligence Unit. 2004. “Moldova Country Report. February 2004.” 7 ILO estimates, from Hensel and Gudim. 2004. “Moldova’s Economic Transition: Slow and Contradictory.” 8 World Bank. 2004. “Recession, Recovery and Poverty in Moldova.”

6
which reports a poverty headcount index of 71 percent in 2000.9 To facilitate a more complete analysis of postprivatization consumer behavior, this study adds 2003 data to the poverty assessment. It finds that the headcount index declined to 37 percent by the end of 2003. The rapid decline in poverty is consistent with other data that show a rapid rise in income and wages.1 0 It also suggests that a large share of the new nonpoor may be close to the poverty line. Location is a key determinant of welfare. One of the key findings of the poverty assessment is that there are significant differences in the incidence of poverty in large cities (Chisinau and Balti), small towns, and rural areas. In 2003 large cities had the lowest poverty rates (25 percent). Poverty was higher in rural areas (38 percent) and highest in small towns (52 percent) (figure 2). Economic growth in Moldova has been pro-poor in recent years,1 1 with poverty declining more rapidly in rural areas than in small cities since 1999.
Residential electricity consumption is very low. Monthly household electricity consumption in Moldova averaged 61 –84 kWh between 1997 and 2003.1 2 By contrast, in the United States the average household consumed 852 kWh per month.1 3 This level of consumption is extremely low, even compared with other relatively poor countries in the Europe and Central Asia Region for which similar data are available (table 1). Sixty kWh per month is only enough electricity to run a refrigerator for 5.5 hours a day and three 75-watt light bulbs for 4 hours a
9 World Bank. 2004. “Recession, Recovery and Poverty in Moldova.” 1 0 Moldovan Economic Trends. 2003. “Economic Trends Quarterly Issue. July –September 2003.” 1 1 World Bank. 2004. “Recession, Recovery and Poverty in Moldova.” 12 These figures are based on household-level data collected from the Household Budget Survey and Union Fenosa database. Figure 1 is different because its data is sourced first page of this report from the International Energy Agency and represents aggregate consumption (including residential and nonresidential) divided by total population. 13 Derived from U.S. Department of Energy, Energy Information Administration, Annual Energy Consumption Percentiles, 1997. Available at www.eia.doe.gov.
Figure 2. Poverty has declined since 2000, although it remains high in small towns
0%
20%
40%
60%
80%
100%
1997 1998 1999 2000 2001 2002 2003
Hea
dco
un
t in
dex
Large cities
Small towns
Rural
Total
Source: Moldova Household Budget Survey.

7
day. Many Moldovans, especially the poor, are thus extremely restricted in their electricity consumption.
Table 1. Per Capita Electricity Consumption in Selected Countries, 2002
Country
GDP per capita, PPP (current dollars)
Electricity consumption per
capita (kWh)
Average residential customer end-user price
Former international Soviet republics Armenia 3,120 1,059 4.32 Estonia 12,260 3,499 5.16 Georgia 2,260 1,694 4.81 Kazakhstan 5,870 4,106 2.86 Kyrgyz Republic 1,620 1,442 0.92 Latvia 9,210 2,201 6.31 Lithuania 10,320 2,120 7.25 Moldova 1,470 612 5.47 Eastern and Central Europe Albania 4,830 1,008 3.97 Bulgaria 7,130 2,675 4.56 Croatia 10,240 2,809 8.34 Czech Republic 15,780 5,249 8.10 Hungary 13,400 3,199 7.98 Poland 10,560 2,586 8.54 Romania 6,560 1,894 6.70 Slovak Republic 12,840 5,319 6.23 Sources: Energy Regulators Regional Association; World Bank. Public and private institutions, including schools, hospitals, and cultural centers, are unable to afford electricity. Despite significant improvements in supply, public areas remain dark. Communal areas in apartment blocks, such as stairwells, often remain unlit when money or trust is lacking for making collective payments, and there are reports of residents suffering injuries from navigating stairwells in the dark when elevators are not functioning. Safety at night is a concern, with many urban and rural residents afraid to leave their homes because the streets are dark. Implementing Reform The Soviet legacy left Moldova with a state-owned, vertically integrated, and highly centralized power infrastructure, designed to provide reliable electricity to all households at little or no cost to consumers. Overdeveloped infrastructure and poorly insulated housing led to high fuel inefficiencies. The costs for these inefficiencies must now be covered by the population, which is still coming to grips with the idea that services once provided by the state must now be paid for.

8
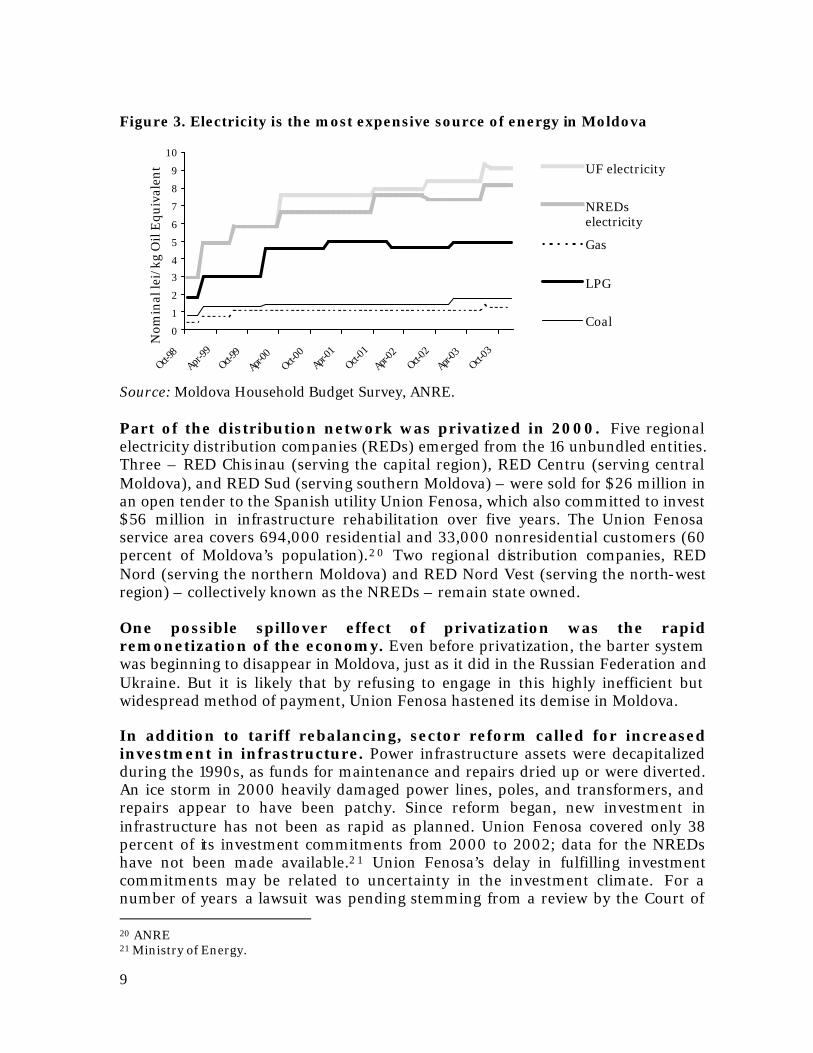
The fortunes of Moldova’s energy sector reflect those of the economy as a whole, embodying the same themes of decline, dependence, and renewal. Moldova is highly dependent on outside energy sources, importing more than 95 percent of its energy from the Russian Federation and Ukraine. It is thus highly exposed to changes in world prices. This means that the government cannot absorb costs without accumulating foreign debt. About 30 percent of electricity is imported, with the remainder generated from gas and oil purchased from the Russian Federation and Ukraine.1 4 The movement of previously low Russian and Ukrainian gas and oil prices toward international levels contributed to the rapid accumulation of large debts ($300 million by 1995) by Moldenergo, the state energy company.1 5 Cash flow problems led to neglect of maintenance and made Moldenergo vulnerable to supply shortages, resulting in regular power interruptions and reduced quality. Moldova launched a sector reform program in 1997, unbundling the state energy company into 16 different entities (generation, transmission, distribution, and debt- holding companies) . A legal and regulatory framework was implemented, covering state regulation of generation, transmission, dispatching, distribution, and supply of electricity.1 6 In 1998 an electricity law was passed and an independent regulator, the National Energy Regulatory Agency (ANRE), established to regulate gas and electricity. Debt was restructured and transferred to Moldtranselectro, a state-owned debt-holding company.1 7 In 2000 the government adopted a law on nominative targeted compensation (see box 1) for energy use. The cost of all energy products increased over the past decade, but electricity prices rose most rapidly (figure 3).1 8 Reform required rebalancing electricity tariffs to cost recovery levels, which laid the groundwork for eventual privatization of the distribution networks. Gas tariffs also rose, albeit not as rapidly as inflation. Access to piped gas is becoming more common, through a government-financed program to provide gas to every area of the country, a goal that is expected to be reached by 2010.1 9 District heating tariffs have increased even more than electricity, but it is unclear whether payment for this service is enforced, since the district heating system has collapsed in most towns: out of 36 urban centers that once had district heating, only 6 (including those in Chisinau and Balti) still have functioning systems, and service is not reliable.
14 This number excludes Transnistria. Together with Transnistria, Moldova imports 30 percent of its electricity, with the remainder produced by Moldova GRES, located in southern Transnistria. 1 5 World Bank. 2003. “Project Appraisal Document. Moldova Energy II.” 16 Electricity Law No. 137 -XIV, of 1998, cited in World Bank. 1996. “Implementation Completion Report.” Republic of Moldova Energy Project. 1 7 World Bank. 1996. “Implementation Completion Report.” Republic of Moldova Energy Project. 18 These figures do not reflect the full economic costs of the different types of energy, which may include transport, storage, and costs to health. These costs may apply much less to utilities than to nonnetworked energy sources. 19 Interview with Deputy Energy Minister Felix Varlan.
9
Part of the distribution network was privatized in 2000. Five regional electricity distribution companies (REDs) emerged from the 16 unbundled entities. Three – RED Chisinau (serving the capital region), RED Centru (serving central Moldova), and RED Sud (serving southern Moldova) – were sold for $26 million in an open tender to the Spanish utility Union Fenosa, which also committed to invest $56 million in infrastructure rehabilitation over five years. The Union Fenosa service area covers 694,000 residential and 33,000 nonresidential customers (60 percent of Moldova’s population).2 0 Two regional distribution companies, RED Nord (serving the northern Moldova) and RED Nord Vest (serving the north-west region) – collectively known as the NREDs – remain state owned. One possible spillover effect of privatization was the rapid remonetization of the economy. Even before privatization, the barter system was beginning to disappear in Moldova, just as it did in the Russian Federation and Ukraine. But it is likely that by refusing to engage in this highly inefficient but widespread method of payment, Union Fenosa hastened its demise in Moldova. In addition to tariff rebalancing, sector reform called for increased investment in infrastructure. Power infrastructure assets were decapitalized during the 1990s, as funds for maintenance and repairs dried up or were diverted. An ice storm in 2000 heavily damaged power lines, poles, and transformers, and repairs appear to have been patchy. Since reform began, new investment in infrastructure has not been as rapid as planned. Union Fenosa covered only 38 percent of its investment commitments from 2000 to 2002; data for the NREDs have not been made available.2 1 Union Fenosa’s delay in fulfilling investment commitments may be related to uncertainty in the investment climate. For a number of years a lawsuit was pending stemming from a review by the Court of 20 ANRE 21 Ministry of Energy.
Figure 3. Electricity is the most expensive source of energy in Moldova
0
1
2
3
4
5
6
7
8
9
10
Oct-98
Apr-99
Oct-99
Apr-00
Oct-00
Apr-01
Oct-01
Apr-02
Oct-02
Apr-03
Oct-03
Nom
inal
lei/
kg O
il E
quiv
alen
t UF electricity
NREDselectricity
Gas
LPG
Coal
Source: Moldova Household Budget Survey, ANRE.
10
Accounts alleging gross irregularities in the privatization procedure. Eventually the Court threw out the case, but the uncertainty may have discouraged capital investment. Methodology of the Study To determine if the impacts of reform were the same for poor and nonpoor, the study compares consumption, payment, and expenditure patterns. To determine how privatization affected consumers, it compares customers served by Union Fenosa and the NREDs. The report does not examine the impact on businesses. The quantitative analysis relies primarily on time series data from the Moldova Household Budget Surveys and records provided by Union Fenosa. The Household Budget Survey is a survey of more than 6,000 households conducted monthly since 1997. Data from the survey were compared with data provided by Union Fenosa to test the reliability of responses to questions about electricity consumption, billing, and payment. The two sets of data were highly correlated, increasing confidence in the Household Budget Survey data for NRED customers (only aggregate, not household utility data, were available for the NREDs). Relying on the Household Budget Survey also allowed to use the same definition of poverty as did the poverty assessment.2 2 Three quantitative welfare indicators were examined—electricity consumption, electricity expenditures (payments), and share of electricity expenditures in income (proxied by consumption expenditure). The Household Budget Survey data were used to estimate a household electricity demand function (annex 1). The qualitative analysis is based on focus group and key informant interviews conducted in the winter of 2003–04. Forty-three focus groups and 59 key informant interviews were held with poor and nonpoor people; people living in large cities, small towns, and rural areas; people with access to different sources of energy; and people living in areas served by Union Fenosa and the NREDs. Interviews were also held with distribution company managers, meter readers, postal workers, social assistance providers, and mayors. The analysis covers the four-year period between the beginning of 2000 and the end of 2003. There are four important caveats limiting the analysis to this period. First, although Union Fenosa took over control of part of the network in February 2000, reform began in 1997, and the largest tariff increases occurred before 2000. Thus the quantitative analysis does not capture the largest price effects on household welfare. Second, the psychological point of reference for most people is the early 1990s, when Moldova was relatively prosperous and reliable electricity was virtually free. This introduces bias in their responses to questions about the recent privatization, because they do not compare it to the mid-1990s, when the system was close to collapsing. Third, the recent growth in the economy coincides
22 The poverty line is 196.03 MDL per month (Three quarterly cpi were used in the calculation (food, non-food, services) with 4 quarters of 2001 being the base).

11
with privatization, confounding inferences about the impact of reform on households. Fourth, the high level of emigration that began during the 1990s also introduces an elements of uncertainty regarding aggregate consumption figures. It is possible that labor mobility has had a disproportionately large effect on the number and size of poor households. How Has Privatization Affected the Poor and the Nonpoor? The poor are closing the consumption gap with the nonpoor, and they have benefited disproportionately from the return to 24-hour service. On average the poor consume 26 percent less electricity than the nonpoor (figure 4). Since 2000 the poor increased monthly electricity consumption by 14.6 percent (from 48 to 55 kWh), while the nonpoor increased consumption by only 3.2 percent (from 62 to 64 kWh). Thus despite rising tariffs, the poor are catching up with the nonpoor. These findings are consistent with the household demand model, which shows that there is no difference in the price elasticity of demand (the rate at which a household changes its consumption of electricity in response to a change in price) between poor and nonpoor households. They are also consistent with qualitative findings that the majority of Moldovans are satisfied with improved service quality and reliable supply.2 3
Payment rates for the poor and nonpoor are similar, suggesting that the narrowing of the consumption gap between poor and nonpoor is not attributed to nonpayment by the poor. If consumption increases more among the poor than the nonpoor while payment rates reach the same levels (almost 100 percent by 2003), it follows that electricity expenditures will increase more rapidly for the poor than the nonpoor. This is exactly what is observed: in 2000 the poor spent 38 percent
23 There is no reason to believe that marginal increases in monthly kWh consumption will decrease. Average household electricity consumption in Moldova is far below that of its neighbors.
Figure 4. The gap in electricity consumption between the poor and the nonpoor is narrowing
0102030405060708090
100
1997 1998 1999 2000 2001 2002 2003
kW
h p
er m
on
th
0
0.1
0.2
0.3
0.4
0.5
0.6
0.7
0.8
MD
L
Nonpoor Poor Average tariff
Source: Moldova Household Budget Survey.

12
less than the nonpoor on electricity, but by 2003 they were spending only 18 percent less,2 4 even while payment rates were the same for both groups.2 5 These figures suggest that the poor are catching up to the nonpoor. The share of income spent on electricity declined for both poor and nonpoor. The poor continue to spend a larger share of their income on electricity than the nonpoor (4.7 percent versus 3.4 percent in 2003), but the gap is closing, as the share of income spent on electricity declines more rapidly for the poor (table 2).
Service availability improved. During the 1990s, system operators regularly interrupted electricity through rotating blackouts (load shedding and other measures to reduce consumption by disconnecting or reducing quality of power supply), primarily in small urban and rural areas. The areas outside Chisinau were hardest hit. Because a large number of poor people live in these areas, the poor were most likely disproportionately affected by the electricity supply crisis. That blackouts have now been dramatically reduced nationwide means that the poor have benefited disproportionately from improved service. Once daily occurrences, blackouts have become rare and are caused mostly by storms or scheduled repair work. The qualitative data found no difference in interruptions among poor and nonpoor households. Voltage levels and frequency fluctuations appear to have improved. Focus group discussions indicate that voltage levels are better than they were a few
24 Moldova Household Budget Survey. 25 Union Fenosa data reveal no statistically significant difference at 1 percent level between payment (or collection) rates for the poor and the nonpoor. 26 Electricity expenditures and electricity expenditures as a share of income by the poor and nonpoor are statistically different.
Table 2. Share of Electricity Expenditures by the Poor and Nonpoor, 1999 and 2003
(MDL per month)
Poor Nonpoor
Item 1999 2003 Percentage
change 1999 2003 Percentage
change
Electricity expenditures 28 40 42.9 33 47 42.4 Income 431 966 124.1 871 1,799 106.5 Share of electricity in income (percent) 7.4 4.7 n.a. 4.3 3.4 n.a. n.a. Not applicable Note: Gross household expenditures are used as a proxy for income. Percentage changes were computed using household-level data, not the aggregate data shown in the table. Source: Moldova Household Budget Survey.
13
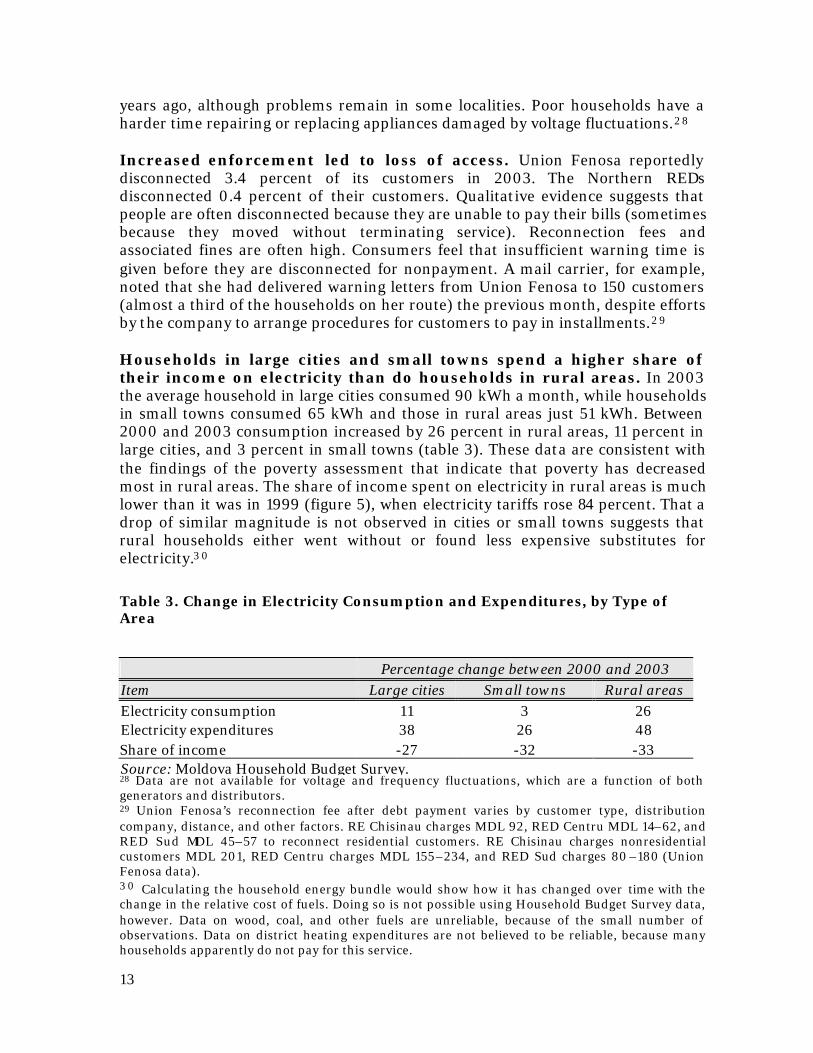
years ago, although problems remain in some localities. Poor households have a harder time repairing or replacing appliances damaged by voltage fluctuations.2 8 Increased enforcement led to loss of access. Union Fenosa reportedly disconnected 3.4 percent of its customers in 2003. The Northern REDs disconnected 0.4 percent of their customers. Qualitative evidence suggests that people are often disconnected because they are unable to pay their bills (sometimes because they moved without terminating service). Reconnection fees and associated fines are often high. Consumers feel that insufficient warning time is given before they are disconnected for nonpayment. A mail carrier, for example, noted that she had delivered warning letters from Union Fenosa to 150 customers (almost a third of the households on her route) the previous month, despite efforts by the company to arrange procedures for customers to pay in installments.2 9 Households in large cities and small towns spend a higher share of their income on electricity than do households in rural areas. In 2003 the average household in large cities consumed 90 kWh a month, while households in small towns consumed 65 kWh and those in rural areas just 51 kWh. Between 2000 and 2003 consumption increased by 26 percent in rural areas, 11 percent in large cities, and 3 percent in small towns (table 3). These data are consistent with the findings of the poverty assessment that indicate that poverty has decreased most in rural areas. The share of income spent on electricity in rural areas is much lower than it was in 1999 (figure 5), when electricity tariffs rose 84 percent. That a drop of similar magnitude is not observed in cities or small towns suggests that rural households either went without or found less expensive substitutes for electricity.3 0 Table 3. Change in Electricity Consumption and Expenditures, by Type of Area
28 Data are not available for voltage and frequency fluctuations, which are a function of both generators and distributors. 29 Union Fenosa’s reconnection fee after debt payment varies by customer type, distribution company, distance, and other factors. RE Chisinau charges MDL 92, RED Centru MDL 14–62, and RED Sud MDL 45–57 to reconnect residential customers. RE Chisinau charges nonresidential customers MDL 201, RED Centru charges MDL 155–234, and RED Sud charges 80 –180 (Union Fenosa data). 3 0 Calculating the household energy bundle would show how it has changed over time with the change in the relative cost of fuels. Doing so is not possible using Household Budget Survey data, however. Data on wood, coal, and other fuels are unreliable, because of the small number of observations. Data on district heating expenditures are not believed to be reliable, because many households apparently do not pay for this service.
Percentage change between 2000 and 2003 Item Large cities Small towns Rural areas Electricity consumption 11 3 26 Electricity expenditures 38 26 48 Share of income -27 -32 -33 Source: Moldova Household Budget Survey.

14
In addition to normal uses, in urban areas electricity is sometimes used as a supplement to poorly functioning district heating or as a substitute for nonfunctioning district heating. District heating serves 98 percent of households in large cities and 29 percent of households in small towns, according to the 2003 Household Budget Survey (rural areas do not have district heating systems). In areas with district heating, households report spending a larger share of income on district heating than on gas or electricity. It is not clear, however, if households are reporting the amount they are billed or the amount they actually pay and nonpayment for district heating is reported to be quite high. In small towns without district heating, gas is the heating fuel of choice if it is available, followed by electricity. This usage pattern implies that future network energy price increases are likely to hit people living in small towns hardest. The focus groups revealed that rural households rarely cook or heat with electricity, usually using wood, coal, or gas.3 1
The level of theft remains high and imposes significant costs on distribution companies. While quantitative data on theft are not available, the qualitative findings suggest that it is not related to income. Indeed, it helps to have means or connections to steal. Focus group and interview data indicate that the most likely to steal are wealthy consumers who bribe meter readers, invest in the technology used to circumvent the meter, or steal using other means; people who can afford theft devices or have the technical skills to set up an illegal hook-up; small, energy-intensive enterprises, which often steal from other consumers; and
31 The price of wood was MDL 220 per cubic meter in 2003, or about MDL 0.0012 kg Oil Equivalent. Wood use—which averaged about 0.5 –1.5 cubic meters in an average summer month and 2–3 cubic meters in an average winter month—cost households MDL 110–330 in the summer and MDL 440–660 in the winter.31 These figures are higher than those for gas: central gas expenditures were MDL 101 a month, and liquified petroleum gas expenditures averaged MDL 132 a month.
Figure 5. The share of electricity expenditures in total expenditures has declined since 1999 - in cities, small towns, and rural areas
0%
1%
2%
3%
4%
5%
6%
7%
8%
9%
1997 1998 1999 2000 2001 2002 2003
Large cities Small towns Rural
Source: Moldova Household Budget Survey.
15
poor households, which often steal only occasionally or because they were disconnected for failure to pay their bills. The very poor remain under stress. Income growth may not have reached the very poor in Moldova. In focus group discussions, the very poor indicated that they are still a long way from being able to raise electricity consumption to minimum basic needs. They unplug their refrigerators for days at a time, minimize the use of their television sets, and restrict themselves to low-wattage light bulbs. Despite improved electricity supply and quantitative evidence that suggests income growth has offset the impact of tariffs, focus group respondents expressed anxiety over future tariff increases. This result is consistent with a recent opinion poll, which found that Moldovans were becoming more pessimistic. One explanation is that people are comparing the current situation with that of the early 1990s, when electricity was inexpensive and plentiful, rather than with more recent conditions. Despite very positive macroeconomic indicators—GDP has risen by 21.6 percent and wages by more than 70 percent in the past three years—fewer respondents said they have a better life now than did a year ago (26 percent, down from 29 percent the previous year). Forty-three percent of respondents reported their family incomes are not sufficient to provide them with basic needs.3 2 Quantitative evidence suggest that the poor have not been adversely affected by reform. The gap in electricity consumption between poor and nonpoor is closing. The narrowing is not directly attributable to the design of reform but the result of improved electricity supply, particularly to rural areas, coupled with substantial income growth over the past four years. Despite this positive news, electricity consumption remains exceptionally low and inelastic, especially for the very poor. Consumers reduced consumption and paid more for the power they used, implying large potential consumer welfare losses associated with future tariff increases (as well as large revenue gains for the utility) unless they are accompanied by increases in income. It also implies that there may be room for substantial welfare gains by enabling households to better manage their electricity expenditures—by introducing prepayment swipe cards for meters in order to reduce both the costs and anxiety associated with disconnections, for example, or encouraging the poor to use more energy-efficient technologies for refrigeration and lighting by introducing vouchers or similar programs. The public sector could also help defray the cost of extending access to clean, inexpensive gas in small towns, where people must rely on electricity for heating. Of course, a prerequisite for any such plan would be a financially sustainable gas sector. Gender and ethnicity do not affect attitudes toward reform. Households headed by women do not view reform differently from households headed by men. Discussions with representatives of the Roma and Gagauz indicate that reform is related to income, not ethnicity.
32 Institute for Public Policy/CIVIS. 2004. “Barometer of Public Opinion April–May 2004. Public Opinion Poll Press Release.”

16
How Does Consumption by Union Fenosa and NRED Customers Differ? Union Fenosa’s residential tariffs increased more than NRED tariffs. Since privatization, the rates charged by Union Fenosa and those charged by the NREDs have differed. Nominal tariffs for Union Fenosa rose from MDL 0.50 in 1999 to MDL 0.78 in June 2004, while tariffs charged by the NREDs rose from MDL 0.50 to MDL 0.70. The increases represented real increases of 26 percent for Union Fenosa and 13 percent for the NREDs.3 3 The difference is explained largely by the fact that until January 2004 the methodology for setting Union Fenosa’s tariffs included a fixed return on investment. 3 4 Tariff methodologies are now the same for both companies and in the future will be strongly determined by the level of investment in infrastructure.3 5 Once other factors (tariff rates, income, household size, apartment size) are taken into account, consumption patterns of households served by Union Fenosa and households served by the NREDs are roughly similar.3 6 In areas served by Union Fenosa, average monthly household consumption increased from 55 kWh in 2000 to 62 kWh in 2003—a 12.7 percent increase. In areas served by the NREDs, consumption rose from 52 kWh to 60 kWh per household per month—an increase of 15.4 percent (table 4). The increase in payments was also very similar. That changes in consumption were similar despite an 11 percent difference in tariffs suggests that either demand is relatively price inelastic3 8 or the NREDs had higher collections, offsetting the effect of a lower tariff on consumption. The multivariate model in annex 1 reveals that factors other than the network service provider explain differences in consumption.
33 Derived from data from TACIS Moldovan Economic Trends. 34 ANRE. 2003. Report on National Agency for Regulation of Energy Activity During 2002. Chisinau. 35 Interview with ANRE director Nicolae Triboi, June 15, 2004. 36 Data cover only the period after electricity distribution was split into private and state-owned enterprises. 37 Income elasticity is 0.42 for the poor and 0.40 for the nonpoor (see annex 1). 38 The impact of tariff changes on the two networks differs. Households served by the NREDs have a lower elasticity than those served by Union Fenosa.

17
Differences in consumption are more closely linked to location than to the electricity provider. Electricity consumption is increasing in cities and small towns served by Union Fenosa and decreasing in cities and small towns served by the NREDs (table 5). The most significant difference is between Chisinau, which is served by Union Fenosa, and Balti, which is served by a NRED: consumption in Chisinau rose 16 percent, while consumption in Balti decreased 13 percent. The trend was driven by faster income growth in Chisinau. Household electricity consumption rose 31 percent in rural areas served by the NREDs and 21 percent in rural areas served by Union Fenosa.
Table 4. Consumption, Payments, and Percentage of Income Spent on Electricity by Union Fenosa and NRED Customers, 2000–03
Item 2000 2001 2002 2003
Percentage change between
2000 and 2003
Union Fenosa Average tariff (MDL) 0.62 0.66 0.7 0.75 21 Average monthly household consumption (kWh) 55 60 54 62 13 Average monthly household payment (MDL) 35 40 39 48 37 Average percent of income spent on electricity 5.3 5.3 4.2 3.9 -20 NRED Average tariff (MDL) 0.56 0.59 0.64 0.67 20 Average monthly household consumption (kWh) 52 52 56 60 15 Average monthly household payment (MDL ) 29 31 36 40 38 Average percent of income spent on electricity 5.7 4.9 4.5 3.6 -33 Source: Tariff data are from ANRE. Consumption data are from the Moldova Household Budget Survey.

18
Power losses remain high for both Union Fenosa and the NREDs. Power losses (electricity transmitted by distribution companies minus residential and nonresidential metered consumption) impose a significant cost on the sector. A concession for commercial and technical losses is included in the tariff methodology (17.7 percent for Union Fenosa, 18.0 percent for the NREDs in 2002), above which the cost is borne by the company.3 9 Between 1999 and 2002 commercial and technical losses as a percentage of total power decreased slightly (from 31 percent to 29 percent) (table 6).4 0 Union Fenosa losses (29 percent) fall between those of the two state-owned companies (24 percent for RED Nord, 35 percent for Red Nord-Vest). Fines for theft, which accounts for virtually all commercial losses, are large and appear to have had a significant effect on performance. Consumers are afraid of fines, which can reach MDL 10,000. Union Fenosa reports a 9.3 percent fall in theft,4 1 attributing the decline to a new program to install tamper-proof meters (by March 2004, 133,749 new meters had been installed).4 2 Focus groups and in-depth interviews indicate that enforcement has improved as meter readers are rotated more frequently and given a share of the fines they collect as a commission.
39 ANRE data. 40 ANRE data. 41 Union Fenosa data comparing first quarter 2004 with first quarter 2003. 42 Union Fenosa data.
Table 5. Change in Electricity Consumption between 2000 and 2003, by Type of Provider and Area
(percent)
Item Large cities Small towns Rural areas Average household electricity consumption Union Fenosa 16 8 21 NREDs -13 -3 31 Average share of income on electricity Union Fenosa -24 -32 -31 NREDs -39 -39 -36 Source: Moldova Household Budget Survey.

19
The quality of service provided by Union Fenosa and the NREDs is roughly similar. Service interruptions at Union Fenosa reportedly fell from 5,645 hours in 1997 to 52 hours in 2002.4 3 Data were not available for the NREDs or for other measures of service quality, such as customer complaints and billing flexibility and accuracy. However, focus group discussions and in-depth interviews with consumers served by both companies suggest that the number of interruptions and voltage oscillations are similar. The increase in sales by Union Fenosa and the NREDs is similar. Electricity sales in Moldova rose 47 percent between 1999 and 2002 (table 7). Differences across the individual companies that make up Union Fenosa and the NREDs make it difficult to identify differences between the private and state-run entities. Among the five companies, increases were lowest at RED Centru (Union Fenosa) (40 percent) and RED Nord-Vest (state) (37 percent).
43 Union Fenosa data.
Table 6. Electricity Losses by Union Fenosa and the NREDs, 1999–2002
Company 1999 2000 2001 2002 RED Nord Volume of losses (millions of kWhs) 251 155 155 138 Percent of revenues 38 28 28 24 RED Nord Vest Volume of losses (millions of kWhs) 133 98 120 115 Percent of revenues 36 36 40 35 Union Fenosa Volume of losses (millions of kWhs) 678 722 753 655 Percent of revenues 28 32 34 29 Total Volume of losses (millions of kWhs) 1,061 974 1,028 908 Percent of revenues 31 32 34 29 Source: ANRE.

20
Privatization appears to have had a positive effect on the budget. One of the objectives of reform was to reduce the amount of resources the government had to invest in the sector. Government expenditures on fuel and energy decreased from MDL 36.9 million in 1997 to just MDL 2.1 million in 2003.4 4 Debts for energy imports have steadily declined for private companies and increased for public ones, suggesting better performance by the private sector (table 8). Unfortunately, data that could show the impact on the quasi-fiscal deficit—and thus quantify the impact of turning a debt-laden public entity into a tax paying private company—are not available.4 5 In the future, it would be desirable for the government to maintain records in order to quantify the fiscal impact of privatization reforms.
44 Moldovan Economic Trends. 2003 “Quarterly Issue. July –September 2003.” Chisinau 45 Neither the government, the IMF, nor the World Bank were able to furnish these records.
Table 7. Net Sales at State-Run Electric Utilities and Union Fenosa, 1999–2002
(millions of MDL)
Company 1999 2000 2001 2002 Percentage change
between 1999 and 2002 NREDs 292 318 342 422 45
RED Nord 190 224 232 282 48 RED Nord-Vest 102 93 110 141 37
Union Fenosa 735 899 1,043 1,092 49 RED Chisinau 491 612 691 744 52 RED Centru 147 168 208 205 40 RED Sud 97 119 145 142 47
Total 1,027 1,216 1,385 1,515 48 Source: ANRE.

21
Note: Figures exclude penalties. Source: Moldovan authorities and IMF estimates. Privatization did not hurt the sector and may have improved performance by state-run companies. Household consumption and expenditure patterns of households receiving service from Union Fenosa are roughly similar to those of household served by the NREDs. While the share of electricity in income fell more for the NREDs, it is similar for all consumers and lower than at anytime since 2000. The private company had a significant positive impact on the government budget. Across the country service quality improved (now available 24 hours a day), and collection rates have risen to almost 100 percent. While the findings do not reveal significant differences between privatized and state-run companies, privatization is highly correlated with positive developments in the sector, such as reduced deficits. One hypothesis that may explain the improved performance across the board is that the presence of a private operator in the sector put pressure on the NREDs to improve their performance. If true, this would imply that, while not a necessary condition for improved sector performance, the presence of a private operator in a chronically underperforming sector may have a significant positive spillover effect. Such a spillover effect suggests that there may be significant advantages to applying a partial privatization model in other underperforming sectors, such as district heating, water, and possibly gas.
Table 8. Debt for Imports of Energy, 2000–03
(millions of dollars) Item 2000 2001 2002 2003
Percentage change between 2000 and 2003
Total debt energy debt 316 287 301 300 -5 Public enterprises and Moldovagaz 176 158 182 196
12
Private enterprises 142 129 120 104 -27 Type of fuel Gas 179 158 181 187 5
Moldovagaz 110 93 121 128 17 Private 69 65 61 59 -15
Fuel oil and coal 7 7 4 3 -57 Public enterprises (Tirex-Petrol, Moldenergo) 7 7 3 3
-57
Electricity 130 123 117 110 -16 Public enterprises (Moldenergo, RED Nord, RED NordVest) 58 58 58 64
12
Private enterprises 73 65 59 45 -38

22
Are Moldova’s Social Transfers Adequate to Mitigate the Impact of Higher Tariffs on the Poor? The nominative targeted compensation (NTC) system is not related to poverty and is not propoor. Certain groups of people in Moldova (box 1) receive NTC, which is available for electricity, gas, district heating, hot water, cold water, coal, and firewood.
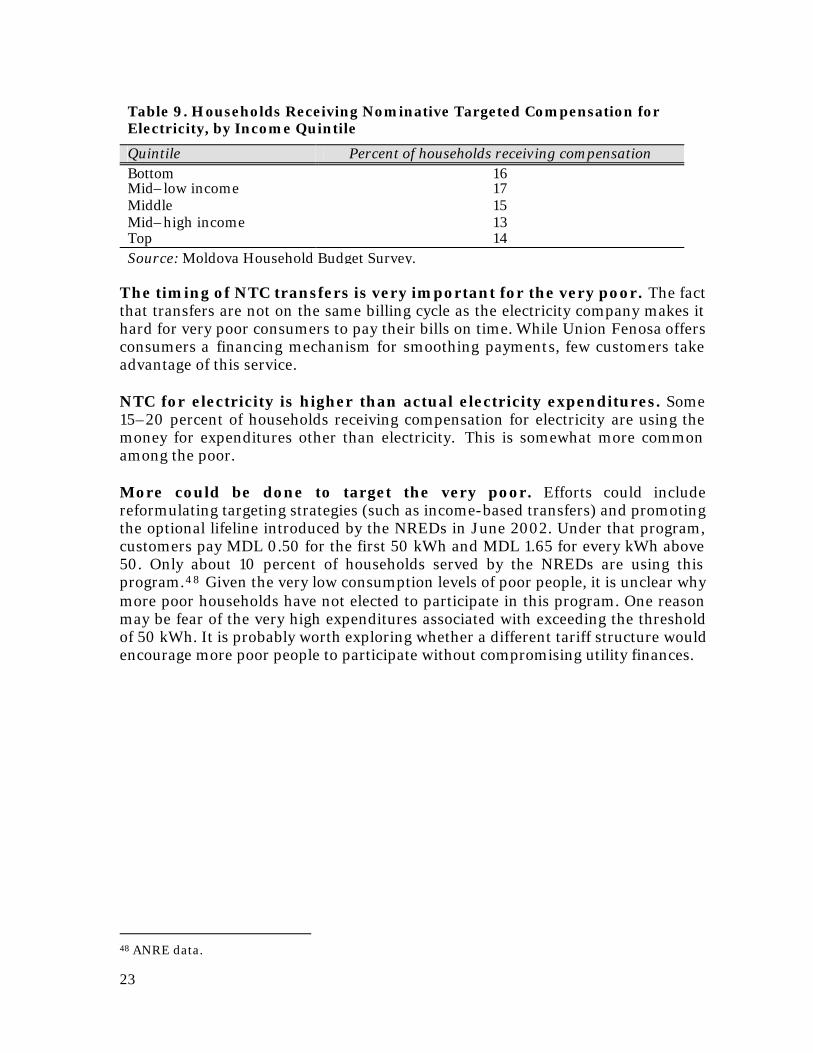
Source: Republic of Moldova. Ministry of Labor and Social Protection. 2003. Even following reform of the system—which reduced the number of categories from 37 to 114 6 —the correlation with poverty is weak: the proportion of households receiving NTC is only slightly higher for the bottom income quintile (16 percent) than for the top (14 percent) (table 9). Moreover, the bottom quintile receives the smallest share of NTC resources, while the top quintile receives the largest share.4 7 Reform of the NTC system is continuing. The World Bank’s Human Development sector is currently working with the government to improve social assistance targeting.
46 The change was effected by the Law on Special Social Protection of Some Categories of the Population No. 933 XIV, passed April 14, 2000. 47 Counterpart International Study, “Evaluation of Social Assistance to Populatio n through the Nominative Targeted Compensations Program to Population through the Nominative Targeted Compensations,” based on a different data set and showing that compensation is poorly targeted.
Box 1. Nominative Targeted Compensation Categories
In accordance with Government Decision No. 761, as of July 31, 2000, compensation is paid to the following categories of people: 1. Disabled people belong to groups I and II, regardless of the reason of their disability; 2. Disabled people belong to group III who are: a) labor veterans; b) recognized as disabled as a result of severe injuries, traumas, or wounds received
during execution of military duties; c) participants in military actions for defending the integrity and independence of the
Republic of Moldova; d) victims of political repressions between 1917 and 1990; e) former prisoners of concentration camps or ghettoes; 3. Disabled children under 16 years; 4. People disabled from childhood; 5. Participants in World War II and their spouses, depending on circumstances; 6. People whose status is equal to that of World War II veterans; 7. Parents, spouses who do not remarry, and the preadolescent children of people who were lost executing service duties or who died as a result of participation in attempts to control the accident at the Chernobyl Atomic Power Station; 8. Single pensioners; 9. Families with four or more children under 18; 10. People who supported the troops during World War II; 11. People who were in Leningrad during its blockade.
23
The timing of NTC transfers is very important for the very poor. The fact that transfers are not on the same billing cycle as the electricity company makes it hard for very poor consumers to pay their bills on time. While Union Fenosa offers consumers a financing mechanism for smoothing payments, few customers take advantage of this service. NTC for electricity is higher than actual electricity expenditures. Some 15–20 percent of households receiving compensation for electricity are using the money for expenditures other than electricity. This is somewhat more common among the poor. More could be done to target the very poor. Efforts could include reformulating targeting strategies (such as income-based transfers) and promoting the optional lifeline introduced by the NREDs in June 2002. Under that program, customers pay MDL 0.50 for the first 50 kWh and MDL 1.65 for every kWh above 50. Only about 10 percent of households served by the NREDs are using this program.4 8 Given the very low consumption levels of poor people, it is unclear why more poor households have not elected to participate in this program. One reason may be fear of the very high expenditures associated with exceeding the threshold of 50 kWh. It is probably worth exploring whether a different tariff structure would encourage more poor people to participate without compromising utility finances.
48 ANRE data.
Table 9. Households Receiving Nominative Targeted Compensation for Electricity, by Income Quintile
Quintile Percent of households receiving compensation Bottom 16 Mid–low income 17 Middle 15 Mid–high income 13 Top 14 Source: Moldova Household Budget Survey.
24
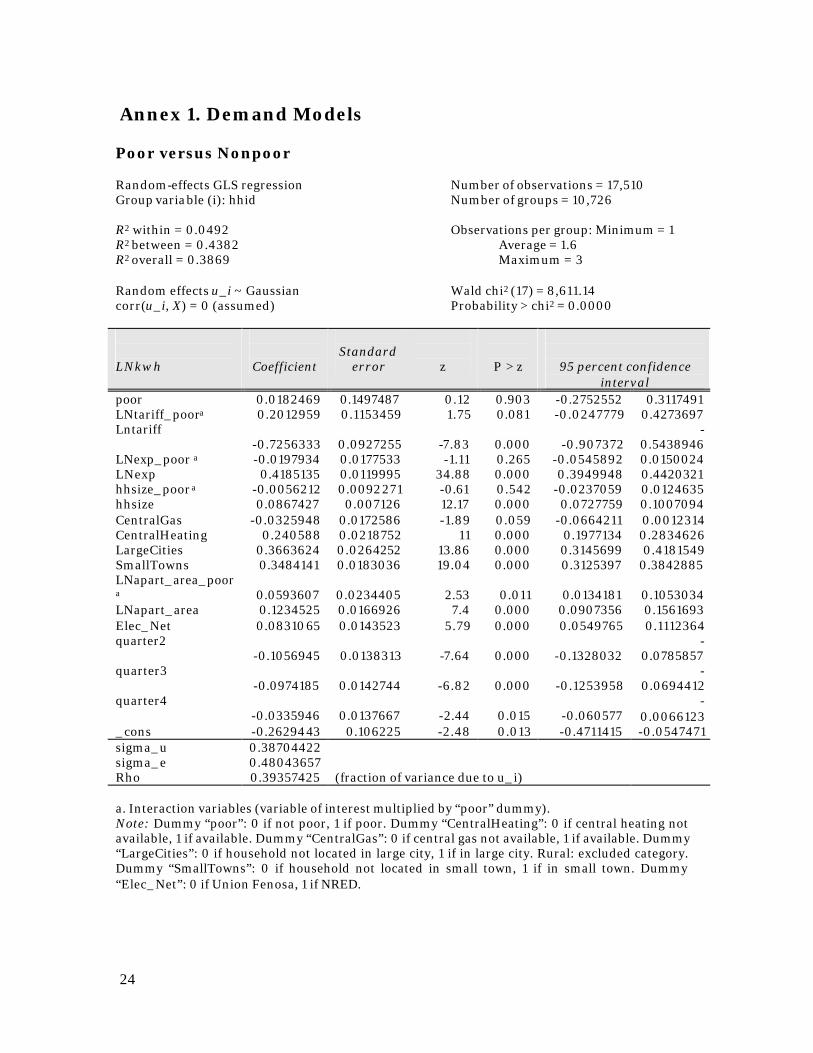
Annex 1. Demand Models
Poor versus Nonpoor Random-effects GLS regression Number of observations = 17,510 Group variable (i): hhid Number of groups = 10,726 R2 within = 0.0492 Observations per group: Minimum = 1 R2 between = 0.4382 Average = 1.6 R2 overall = 0.3869 Maximum = 3 Random effects u_i ~ Gaussian Wald chi2 (17) = 8,611.14 corr(u_i, X) = 0 (assumed) Probability > chi2 = 0.0000 LNkwh
Coefficient
Standard
error
z
P > z
95 percent confidence interval
poor 0.0182469 0.1497487 0.12 0.903 -0.2752552 0.3117491 LNtariff_poora 0.2012959 0.1153459 1.75 0.081 -0.0247779 0.4273697 Lntariff
-0.7256333 0.0927255 -7.83 0.000 -0.907372 -
0.5438946 LNexp_poor a -0.0197934 0.0177533 -1.11 0.265 -0.0545892 0.0150024 LNexp 0.4185135 0.0119995 34.88 0.000 0.3949948 0.4420321 hhsize_poor a -0.0056212 0.0092271 -0.61 0.542 -0.0237059 0.0124635 hhsize 0.0867427 0.007126 12.17 0.000 0.0727759 0.1007094 CentralGas -0.0325948 0.0172586 -1.89 0.059 -0.0664211 0.0012314 CentralHeating 0.240588 0.0218752 11 0.000 0.1977134 0.2834626 LargeCities 0.3663624 0.0264252 13.86 0.000 0.3145699 0.4181549 SmallTowns 0.3484141 0.0183036 19.04 0.000 0.3125397 0.3842885 LNapart_area_poor
a 0.0593607 0.0234405 2.53 0.011 0.0134181 0.1053034 LNapart_area 0.1234525 0.0166926 7.4 0.000 0.0907356 0.1561693 Elec_Net 0.0831065 0.0143523 5.79 0.000 0.0549765 0.1112364 quarter2
-0.1056945 0.0138313 -7.64 0.000 -0.1328032 -
0.0785857 quarter3
-0.0974185 0.0142744 -6.82 0.000 -0.1253958 -
0.0694412 quarter4
-0.0335946 0.0137667 -2.44 0.015 -0.060577 -
0.0066123 _cons -0.2629443 0.106225 -2.48 0.013 -0.4711415 -0.0547471 sigma_u 0.38704422 sigma_e 0.48043657 Rho 0.39357425 (fraction of variance due to u_i) a. Interaction variables (variable of interest multiplied by “poor” dummy). Note: Dummy “poor”: 0 if not poor, 1 if poor. Dummy “CentralHeating”: 0 if central heating not available, 1 if available. Dummy “CentralGas”: 0 if central gas not available, 1 if available. Dummy “LargeCities”: 0 if household not located in large city, 1 if in large city. Rural: excluded category. Dummy “SmallTowns”: 0 if household not located in small town, 1 if in small town. Dummy “Elec_Net”: 0 if Union Fenosa, 1 if NRED.
25
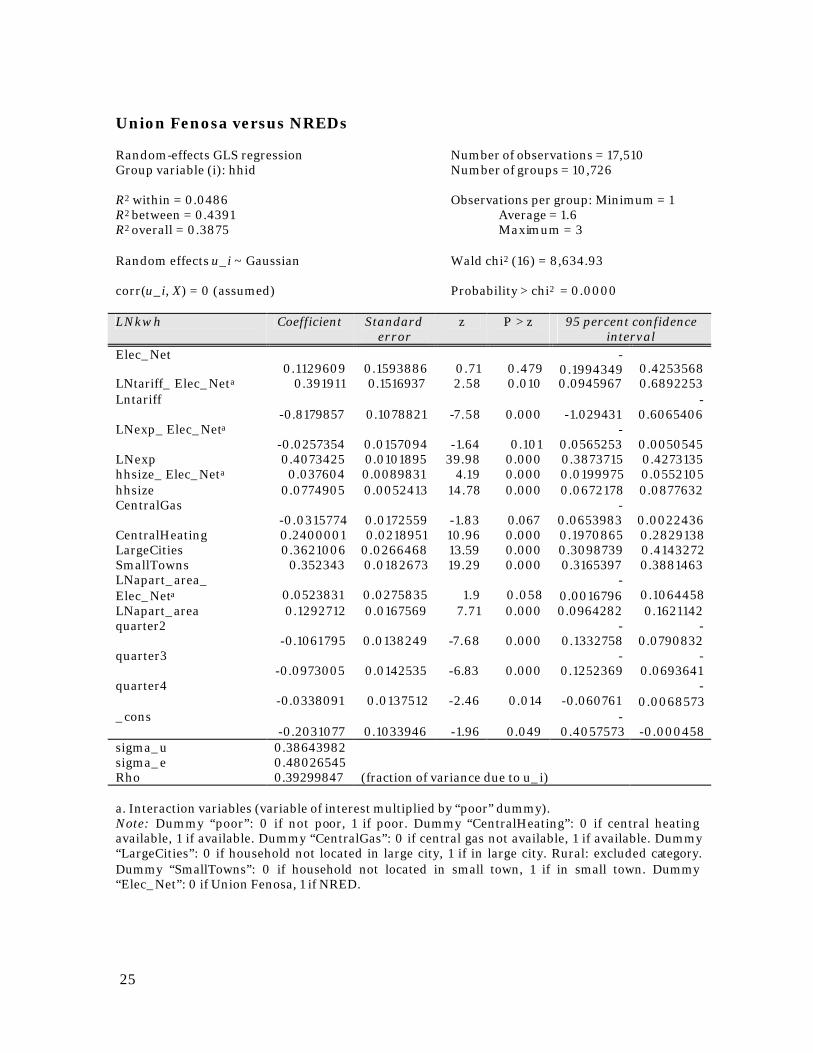
Union Fenosa versus NREDs Random-effects GLS regression Number of observations = 17,510 Group variable (i): hhid Number of groups = 10,726 R2 within = 0.0486 Observations per group: Minimum = 1 R2 between = 0.4391 Average = 1.6 R2 overall = 0.3875 Maximum = 3 Random effects u_i ~ Gaussian Wald chi2 (16) = 8,634.93 corr(u_i, X) = 0 (assumed) Probability > chi2 = 0.0000 LNkwh Coefficient Standard
error z P > z 95 percent confidence
interval Elec_Net
0.1129609 0.1593886 0.71 0.479 -
0.1994349 0.4253568 LNtariff_ Elec_Neta 0.391911 0.1516937 2.58 0.010 0.0945967 0.6892253 Lntariff
-0.8179857 0.1078821 -7.58 0.000 -1.029431 -
0.6065406 LNexp_ Elec_Neta
-0.0257354 0.0157094 -1.64 0.101 -
0.0565253 0.0050545 LNexp 0.4073425 0.0101895 39.98 0.000 0.3873715 0.4273135 hhsize_ Elec_Neta 0.037604 0.0089831 4.19 0.000 0.0199975 0.0552105 hhsize 0.0774905 0.0052413 14.78 0.000 0.0672178 0.0877632 CentralGas
-0.0315774 0.0172559 -1.83 0.067 -
0.0653983 0.0022436 CentralHeating 0.2400001 0.0218951 10.96 0.000 0.1970865 0.2829138 LargeCities 0.3621006 0.0266468 13.59 0.000 0.3098739 0.4143272 SmallTowns 0.352343 0.0182673 19.29 0.000 0.3165397 0.3881463 LNapart_area_ Elec_Neta 0.0523831 0.0275835 1.9 0.058
-0.0016796 0.1064458
LNapart_area 0.1292712 0.0167569 7.71 0.000 0.0964282 0.1621142 quarter2
-0.1061795 0.0138249 -7.68 0.000 -
0.1332758 -
0.0790832 quarter3
-0.0973005 0.0142535 -6.83 0.000 -
0.1252369 -
0.0693641 quarter4
-0.0338091 0.0137512 -2.46 0.014 -0.060761 -
0.0068573 _cons
-0.2031077 0.1033946 -1.96 0.049 -
0.4057573 -0.000458 sigma_u 0.38643982 sigma_e 0.48026545 Rho 0.39299847 (fraction of variance due to u_i) a. Interaction variables (variable of interest multiplied by “poor” dummy). Note: Dummy “poor”: 0 if not poor, 1 if poor. Dummy “CentralHeating”: 0 if central heating available, 1 if available. Dummy “CentralGas”: 0 if central gas not available, 1 if available. Dummy “LargeCities”: 0 if household not located in large city, 1 if in large city. Rural: excluded category. Dummy “SmallTowns”: 0 if household not located in small town, 1 if in small town. Dummy “Elec_Net”: 0 if Union Fenosa, 1 if NRED.

26
Annex 2. Privatization of Moldova’s Energy Sector4 9
The initial phase of Moldova’s power sector privatization program focused on the sale of the five regional power distribution companies. During the first tender the consultant to the government of Moldova was Crédit Commercial de France. The sale of all five REDs was launched in 1999, with more than 50 potential strategic investors invited to submit expressions of interest in the sale in three packages. At the time, the government of Moldova and the donor community promoted the view that competition should be encouraged in the distribution sector, so no single investor was permitted to purchase all five distribution companies. Any one investor could acquire only two packages of companies. (This law was subsequently changed to allow for ownership by a single company of all five distribution networks.) AES Silk Road Inc. (United States), ABB Energy Ventures (Russian Federation), ESB International (Ireland), Sauer/EdF (France), RAO UES (Russian Federation), Union Fenosa ACEX (Spain), and Luganskoblenergo (Ukraine) prequalified for the RED tender, but only RAO UES, Union Fenosa, and Luganskoblenergo submitted bids. Union Fenosa won the tender by offering both the highest cash value for the companies (about $26 million) and the highest volume of investment committed over the five-year period immediately following the privatization (about $56 million). The company submitted winning bids for all five REDs, but the law at the time of the privatization banned Union Fenosa from owning all five. In May 2000 another tender was launched, announcing privatization of the remaining two distribution companies and three power generation companies. After a short listing process, only Union Fenosa submitted a bid, of $15 million for the two NREDs. The tender thus led to direct negotiations, which failed to lead to a successful sale. The direct negotiation process was reopened in the spring of 2001, when Union Fenosa offered $5 million for both companies. The much lower bid reflected the drop in the companies’ value following a disastrous ice storm in the autumn of 2000, which severely damaged the networks. Union Fenosa’s offer was rejected. In July 2001 the government of Moldova announced a new international tender to privatize the two NREDs. The tender was closed soon after announcement as a result of very low international interest. A November 2002 survey on investor interest in the Moldova power sector revealed the need to reduce investment barriers. The government took steps to do so and launched a fourth international tender for privatization of the two NREDs in December 2000, with EPIC/Raiffeisen Investment serving as consultant . Two companies—AES Silk Road Inc. (United States) and RAO UES (Russian Federation)—expressed interest in the tender, but the tender was closed after only RAO UES submitted a bid.
49 Source: Ministry of Energy.
27
References ANRE (National Energy Regulatory Agency). 2002. Report on National Agency for
Regulation of Energy Activity During 2001. Chisinau. —. 2003. Report on National Agency for Regulation of Energy Activity During
2002. Chisinau. Castel, Paulette. “Moldova: Public and Private Safety Net.” In World Bank.
Forthcoming. Recession, Recovery and Poverty in Moldova. Vol. 2. Report No. 28024-MD. ECSPE. Washington, D.C.
Counterpart International/Center for Strategic Studies and Reforms (CISR). 2002.
“Evaluation of Social Assistance to Population through the Nominative Targeted Compensations.” Low-Income Energy and Social Assistance Project (LIESAP). Chisinau.
Department of Privatization of the Republic of Moldova.
http://www.privatization.md/privatization/privatization_companies/strategic_projects/wine_tobacco_energy/energy/
Dodonu, Veaceslav. 1999. “Moldova’s Power Sector: Challenges and
Opportunities.” www.bisnis.doc.gov/bisnis/bisdoc/000113power.htm Economist Intelligence Unit. 2004. “Moldova Country Report. February 2004.”
Available at www.eiu.com Institute for Public Policy/CIVIS. 2004. “Barometer of Public Opinion April–May
2004.” Public Opinion Poll Press Release. Chisinau, Moldova. International Energy Agency. 2003. “World Energy Statistics and Balances.”
Available at www.iea.org IPA Energy Consulting. 2003. “South East Europe Power Sector Affordability.”
November. Edinburgh, Scotland. Lovei, Laszlo, and Alastair McKechnie. 2000. “The Costs of Corruption for the
Poor.” In Energy Services for the World’s Poor, pp. 68–75. Washington, D.C.: World Bank.
Moldovan Economic Trends. 2003. “Economic Trends Quarterly Issue.” July –
September. Available at www.met.dnt.md Republic of Moldova. 2002. Annual Social Report 2001. Ministry of Labor and
Social Protection, Chisinau.
28
—. 2003. Annual Social Report 2002. Ministry of Labor and Social Protection, Chisinau.
Rio+10. 2001. “Report on the Rio+10 National Assessment Workshop Moldova,
Chisinau June 20, 2001. U.S. Department of Energy. 1997. “Annual Energy Consumption Percentiles, 1997.”
Energy Information Administration. Available at www.eia.doe.gov. World Bank. 1996. “Staff Appraisal Report. Republic of Moldova Energy Project.”
Report No. 14892-MD. Infrastructure Division. Country Department IV. Europe and Central Asia Region. Washington, D.C.
—. 2000. “Maintaining Utility Services for the Poor: Policies and Practices in
Central and Eastern Europe and the Former Soviet Union.” Washington, D.C.
—. 2002. “Implementation Completion Report. Republic of Moldova Energy
Project.” Report No. 24446-MD. ECSIE. Washington, D.C. —. Forthcoming. Recession, Recovery and Poverty in Moldova. Vols. I and II.
Report No. 28024-MD. ECSPE. Washington, D.C. —. 2004. “Public and Private Sector Roles in the Supply of Electricity Services.”
Washington, D.C.

29
The World Bank 1818 H Street, NW Washington, SC 20433 Telephone 1-2020-473-1000 Internet www.worldbank.org Email [email protected]


