FINAL LANDFILL GAS TO ENERGY FEASIBILITY REPORT
91
Prepared for City of Flagstaff 211 West Aspen Avenue Flagstaff, Arizona 86001 FINAL LANDFILL GAS TO ENERGY FEASIBILITY REPORT CINDER LAKE LANDFILL FLAGSTAFF, ARIZONA Prepared by: 1111 Broadway, Sixth Floor Oakland, CA 94607 Project Number: WG1651 June 2013
Transcript of FINAL LANDFILL GAS TO ENERGY FEASIBILITY REPORT

Prepared for
City of Flagstaff211 West Aspen AvenueFlagstaff, Arizona 86001
FINAL LANDFILL GAS TO ENERGYFEASIBILITY REPORT
CINDER LAKE LANDFILLFLAGSTAFF, ARIZONA
Prepared by:
1111 Broadway, Sixth Floor Oakland, CA 94607
Project Number: WG1651
June 2013

WG1651/CLL Feasibility Report-FINAL 21 Jun 13.docx i 6/21/2013
EXECUTIVE SUMMARY
The City of Flagstaff (City) is seeking beneficial uses for the landfill gas (LFG) produced at the City-owned Cinder Lake Landfill. This Landfill Gas to Energy Feasibility Report was prepared by Geosyntec to: (i) evaluate the energy potential from the LFG generated at the landfill; (ii) provide the City with a broad overview of the potential beneficial use options available; and (iii) analyze the technical and economic viability of various landfill gas to energy (LFGTE) options assuming a minimum project duration of 10 years. Four separate technologies were initially considered: (i) conversion of LFG to electricity; (ii) conversion of LFG to biogenic compressed natural gas (bio-CNG) for use in the City’s vehicle fleet; (iii) production of pipeline quality (high BTU) natural gas; and (iv) piping medium BTU gas off site for direct use by nearby end users. After initial review of the LFG generation potential of the landfill and the expected efficiency of LFG collection, two options were eliminated from further study early in the evaluation process. Converting LFG to electricity was quickly ruled out due to a lack of interest from the local utility, Arizona Public Service (APS), combined with insufficient power demands from the landfill to justify on-site production. Review of market conditions for renewable fuels at “green energy” prices, discussed in detail in this feasibility report, led to the conclusion that conversion of LFG to pipeline quality natural gas was also not currently feasible. The options to convert LFG to bio-CNG or deliver LFG to nearby end users for direct use were evaluated in further detail for a project duration of 15 years (due to the significant capital expenditure required for gas recovery and utilization, a 10-year project duration was insufficient to obtain positive returns on some of the options). The expected net present value (NPV), internal rate of return (IRR), and expected payback period for each project were used to compare the value of each option. For this study, commercial bio-CNG production systems that can handle raw LFG at intake flow of between 50, 100, 200, and 450 scfm were investigated (see Section 4.2). Two different bio-CNG project scales were evaluated based on whether the motivating

WG1651/CLL Feasibility Report-FINAL 21 Jun 13.docx ii 6/21/2013
assumption was for 100% offset of current fuel usage by 45 City-owned vehicles based at or that frequent the landfill and provide excess bio-CNG for retail sale (i.e., small-scale project primarily to meet the City’s needs and external sale of any excess bio-CNG), or optimal utilization of the available LFG over the project period (i.e., larger-scale project to meet the City’s needs of fuel usage by 407 vehicles, some of which are based at or that frequent the landfill and others located primarily in the City, and also provide excess bio-CNG for retail sale). Based on findings from this study, the capital investment for small-scale on-site production of bio-CNG is estimated at approximately $5.03 million, with expected annual fuel cost offsets and revenues of $926,000 (at 2012 diesel prices), a project payback period of 7.3 years, and a 15-year IRR of 10.6%. This project represents the lowest capital expenditure and exposure to market risk of all economically viable options. The capital investment for a larger-scale bio-CNG project is estimated at approximately $12.04 million, with a 9-year project payback period and a 15-year IRR of nearly 7.4%. This project option could result in combined annual cost offsets and revenues of $1.87 million (again, at 2012 fuel prices). Finally, three direct use options for pipeline distribution of medium BTU gas to nearby end users were evaluated. However, only the use of LFG by the City-owned Wildcat Hill Wastewater Treatment Plant (WWTP) was shown to be substantially economically viable, although this is subject to the assumption that the City decides to begin drying sludge generated by the WWTP and thereby significantly increasing its future rate of energy consumption, and that the natural gas costs at the WWTP will be approximately $7.63 per MMBTU. The WWTP option would require an estimated capital investment of approximately $7.03 million (including $4.06 million for pipeline construction), with an 8-year payback period and a 15-year IRR of over 10%.

WG1651/CLL Feasibility Report-FINAL 21 Jun 13.docx iii 6/21/2013
TABLE OF CONTENTS
1. INTRODUCTION ................................................................................................... 1
2. PAST AND FUTURE LANDFILL DEVELOPMENT ........................................ 3
3. LANDFILL GAS RECOVERY POTENTIAL ..................................................... 4
3.1 Landfill Gas Generation ................................................................................. 4
3.1.1 Waste Acceptance Rates ................................................................... 4
3.1.2 Waste Degradation Rate .................................................................... 5
3.1.3 Methane Generation Potential ........................................................... 5
3.1.4 Landfill Gas Generation Estimates at CLL ....................................... 6
3.2 Landfill Gas Collection ................................................................................... 7
3.2.1 Factors Affecting Landfill Gas Collection Efficiency ...................... 7
3.2.2 Assumed Cover Conditions at CLL .................................................. 8
3.2.3 Cell Closures at CLL ......................................................................... 8
4. LANDFILL GAS TO ENERGY DEVELOPMENT OPTIONS ....................... 10
4.1 On-site Electricity Generation ...................................................................... 10
4.2 Gas Conversion to Compressed Natural Gas ................................................ 10
4.3 Gas Conversion to Pipeline-Quality Natural Gas ......................................... 11
4.4 Direct Use ..................................................................................................... 13
5. ECONOMIC ANALYSIS ..................................................................................... 14
5.1 Overview of Main Assumptions ................................................................... 14
5.1.1 Assumed Capital Costs for Landfill Gas Collection ....................... 14
5.1.2 Assumptions Related to Landfill Gas Recovery ............................. 15
5.1.3 Assumptions Related to Gas Conversion to bio-CNG .................... 16
5.1.4 Assumptions Related to Direct Use Options ................................... 16

WG1651/CLL Feasibility Report-FINAL 21 Jun 13.docx iv 6/21/2013
5.1.5 Assumed Discount Rate .................................................................. 17
5.2 Conversion to Compressed Natural Gas ....................................................... 18
5.2.1 Costs ................................................................................................ 20
5.2.2 Revenues ......................................................................................... 21
5.3 Direct Use by SCA Tissue Facility or Nestle Purina .................................... 22
5.3.1 Costs ................................................................................................ 23
5.3.2 Revenues ......................................................................................... 23
5.4 Direct Use by Wildcat Hill Wastewater Treatment Facility ......................... 24
5.4.1 Costs ................................................................................................ 24
5.4.2 Revenues ......................................................................................... 25
6. SUMMARY AND RECOMMENDATIONS ...................................................... 26
7. REFERENCES ...................................................................................................... 29
LIST OF TABLES
Table 1 Cost Estimate for Construction of a Landfill Gas Collection System
Table 2 Economic Evaluation of LFGTE Project – Bio-CNG for On-Site Production (One 200 scfm Unit – City-Use Only)
Table 2a Economic Evaluation of LFGTE Project – Bio-CNG for On-Site Production (Two 200 scfm Units – City-Use and Sale to Third-Parties)
Table 3 LFG Pipeline Installation Cost Estimate for Direct Use Options
Table 4 Economic Evaluation of LFGTE Project – Direct Use of LFG at SCA Paper
Table 5 Economic Evaluation of LFGTE Project – Direct Use of LFG at Nestle Purina
Table 6 Economic Evaluation of LFGTE Project – Direct Use of LFG at Wildcat Wastewater Treatment Plan
WG1651/CLL Feasibility Report-FINAL 21 Jun 13.docx v 6/21/2013
Table 7 Comparison of LFGTE Options
LIST OF FIGURES
Figure 1 Vicinity Map
Figure 2 Site Plan with Proposed Cell Development and Fill Sequencing Plan
Figure 3 Landfill Gas Generation Curve
Figure 4 LFG Generation and Collection Projections
Figure 5 Pipeline Route from CLL to SCA Tissue Facility
Figure 6 Pipeline Route from CLL to Nestle Purina Facility
Figure 7 Pipeline Route from CLL to Wildcat WWTP
LIST OF APPENDICES
Appendix A Landfill Gas Generation Projections
Appendix B Assumed Waste Disposal Rates and Cell Closure Schedule
Appendix C Landfill Gas Collection Projections
Appendix D Annual Vehicle Fuel Consumption Estimates
Appendix E Vendor-Supplied bio-CNG Cost Information
Appendix F Cost Estimate Scenarios for Single and Dual Bio-CNG Units

WG1651/CLL Feasibility Report-FINAL 21 Jun 13.docx 1 6/21/2013
1. INTRODUCTION
The Cinder Lake Landfill (CLL) is owned and operated by the City of Flagstaff (City). The landfill is located approximately 12 miles northeast of Flagstaff, Arizona and approximately 2 miles east of U.S. Highway 89 in Coconino County (Figure 1). Although originally the landfill was located on land belonging to the United States Forest Service (USFS), in 1999 the City purchased the land. The landfill remains surrounded on all sides by lands belonging to the USFS. The landfill was opened in 1965 as a municipal solid waste facility, receiving approximately 14,000 tons of refuse per year. Over the last 45 years intake rates at the landfill have increased almost ten-fold, with average yearly intake rates of approximately 134,500 tons for the years between 2002 and 2011. In anticipation of future landfill space demands, in 1998 the City prepared all necessary documents in order to request a permit modification that would increase the size of their current landfill laterally. The permit modification was approved by the Arizona Department of Environmental Quality (ADEQ) in 1999. The permitted lateral expansion extends the life of the landfill through 2054, and the approved landfill footprint to approximately 247 acres. The landfill is currently generating landfill gas (LFG) comprised of approximately 50% methane, which is a potentially valuable energy resource. However, the site does not currently exceed the regulatory threshold value for non-methane organic compounds (NMOCs) of 50 Mg/year which would require the site to collect and treat the gas produced by the landfill (U.S. EPA, 1996). Based on the projected refuse intake rates, gas generation models, and site-specific emissions testing from the site’s most recent Tier 2 analysis, the site is not expected to trigger the regulatory threshold value soon (Hydro Geo Chem, Inc., 2008)1. As a result, the City does not currently operate a gas collection and control system (GCCS) at the landfill. Nevertheless, in anticipation of future gas generation rates at the site, the City included conceptual GCCS layout plans and details as part of their lateral expansion permitting submittal to the ADEQ in 1998.
1 The current Tier 2 report for the site estimates the NMOC concentration to be an average of 92 parts per million (ppm) as hexane.

WG1651/CLL Feasibility Report-FINAL 21 Jun 13.docx 2 6/21/2013
As part of the City’s sustainability program initiatives, the City recently decided to explore the best economic use of the LFG resource at CLL. In support of this effort, Geosyntec was retained in 2012 to perform a feasibility study on the technical and economic viability and advantages/disadvantages of extracting LFG from the landfill for conversion into energy using one of the following four technologies:
• Pipeline delivery to an off-site user for direct use as medium BTU gas in an industrial application (i.e., boilers, process heaters, kilns, furnaces);
• On-site processing of collected LFG into a high BTU grade fuel for injection into a natural gas pipeline via pipeline delivery;
• On-site processing of LFG into biogenic compressed natural gas (bio-CNG) to be used as an alternative vehicle fuel by the City; and
• Converting the LFG into electricity at an on-site power station interconnected to the local electrical utility, Arizona Public Service (APS).

WG1651/CLL Feasibility Report-FINAL 21 Jun 13.docx 3 6/21/2013
2. PAST AND FUTURE LANDFILL DEVELOPMENT
The CLL was opened in 1965 and has been receiving municipal solid waste (MSW) continuously since that time. The original landfill cells (Cells A, B, and C) pre-date the establishment of the modern landfill regulations that followed promulgation of the federal Subtitle D regulations (U.S. EPA, 1993). These cells, which encompass an approximate footprint of 110 acres, are unlined and contain no leachate collection system. Based on current estimates by the City, these cells have a combined capacity of 7.3 million cubic yards of refuse (assuming a 3 to 1 refuse to soil ratio), which should last through 2027. In 1998 the City permitted a lateral expansion of the landfill (Woodward-Clyde, 1998). The lateral expansion encompasses an additional 137 acres, for a total permitted landfill footprint of 247 acres. The permitted expansion will include Cells D and E, comprised of two sub-cells within Cell D and eight sub-cells within Cell E (Figure 2). Cells D and E will feature Subtitle D compliant liner and leachate collection systems. Currently, the existing Cells A, B, and C are expected to reach their maximum design capacity in 2027, at which point disposal will transition to the first phase of expansion Cells D and E. However, changes in future refuse intake rates, the desire to close some existing portions of the landfill earlier to maximize landfill gas extraction, as well as many other factors, might potentially modify the current landfill development schedule.

WG1651/CLL Feasibility Report-FINAL 21 Jun 13.docx 4 6/21/2013
3. LANDFILL GAS RECOVERY POTENTIAL
3.1 Landfill Gas Generation
Estimating current and future LFG generation is essential for evaluating the feasibility of energy generation. The LFG generation potential for the landfill was estimated using the U.S. EPA’s Landfill Gas Emissions Model (LandGEM), as coded into an Excel® spreadsheet (U.S. EPA, 2005). LandGEM is a first-order exponential decay model in which the quantity and quality of gas generated in any given year is dependent on the mass of waste in place in the landfill and the age of waste (i.e., waste acceptance rate), the methane generation potential of the waste (i.e., waste composition), and the waste decay rate.
The remainder of this section presents the background information and assumptions used in selecting these input parameters for modeling LFG generation at CLL. Additional details regarding the model and required input parameters and assumptions are provided in Appendix A.
3.1.1 Waste Acceptance Rates
The quantity of LFG generated in the landfill in any given year is directly related to the waste acceptance rate. Total gas generation is expected to peak approximately one year after cessation of waste placement (currently estimated to be 2055 by the City) and decline exponentially thereafter. For the purpose of this feasibility study, Geosyntec assumed the following waste acceptance rates:
• 1965 to 2008: values developed by Woodward-Clyde (1997b) for historic . evaluation and reporting (Table 1, Appendix B); and
• 2009 through 2055 (the expected closure date for the landfill): values provided by the City which were based on an assumed growth rate of 3% per year (Table 1, Appendix B).

WG1651/CLL Feasibility Report-FINAL 21 Jun 13.docx 5 6/21/2013
3.1.2 Waste Degradation Rate
The waste degradation decay constant (k) influences the estimate of the rate of landfill gas generation. Landfills with high k values tend to have high gas generation rates initially and exponentially lower generation rates as the waste gets older. Conversely, landfills with low k values have lower rates of initial gas production but less significant reductions in the gas production rate over time. An appropriate value of k should be selected by considering several factors, the most important of which are moisture content of the waste and presence of nutrients to accelerate biodegradation. Waste disposed in landfills in regions with relatively low rainfall is expected to have a low k value. The CLL receives an average of 17 inches of precipitation annually, which is considered an arid region under default assumptions for LandGEM. In support of this, moisture content reports for the site range from an average of 20% in the soil (Woodward-Clyde, 1997a) to 30% (R.W. Beck, 2010) in the pulp sludge. Based on these conditions, a k value of 0.02/year was selected based on guidelines from “AP-42, Fifth Edition, Compilation of Air Pollutant Emission Factors, Volume 1: Stationary Point and Area Sources, Section 2.4: Municipal Solid Waste Landfills.” (U.S. EPA, 1995).
In order to account for the paper sludge component of the waste stream, Geosyntec assumed that only 30% of the yearly sludge is expected to be fibers (the rest is inert material), and therefore only 30% of the total tonnage of paper sludge would be capable of producing methane during the decomposition process. The assumed 30% value is consistent with fiber estimates for paper sludge found in the literature (Staley & Barlaz, 2009).
3.1.3 Methane Generation Potential
Landfill gas is generated during the natural process of bacterial decomposition of organic material contained in MSW landfills. A number of factors (including the types and age of the waste buried in the landfill, the quantity and types of organic compounds in the waste, and the moisture content and temperature of the waste) influence the quantity of gas that a MSW landfill generates and the components of that gas. The most important of these factors is the quantity and types of organic compounds in the waste, since only degradable organics will contribute to methane generation. Degradable organics in MSW mainly comprise food waste, paper and cardboard, and/or yard waste (depending on local collection practices and ordinances on disposal methods for

WG1651/CLL Feasibility Report-FINAL 21 Jun 13.docx 6 6/21/2013
different materials). Currently, there is significant interest globally in the diversion of degradable organics from landfill disposal. The most common technology employed is aerobic composting after which the decomposed waste may be used as soil amendment. However, except under strictly supervised conditions, the value of waste-derived soil amendments is often questionable due to the high level of waste separation and control over digester input that is required to achieve an end product of sufficient quality for land application without entailing excessive costs in the process. (The inability to generate a consistent end product with perceived value to farmers and horticulturalists at sustainable cost is often the critical factor in the failure of composting projects.) Using life-cycle analysis, recent studies at North Carolina State University (e.g., Barlaz, 2010) have shown that recovery of methane from anaerobic digestion of degradable organics in well-controlled landfills with LFG recovery and utilization systems can be superior to aerobic processes in consideration of greenhouse gas (GHG) emissions and total energy yield. Additionally, it is important to realize that removal of the main degradable organics from the waste stream going to landfill will deprive the site of its primary methane generating mechanism, but will not prevent generation of gas containing VOCs, compounds of sulfur, and other trace contaminants. Control of this energy-poor gas will be problematic and expensive where the methane content is insufficient to sustain normal operation of a flare.
The methane generation potential (L0) depends mainly on the amount of organic material available for generating gas due to decomposition in the overall waste stream. Waste streams with high organic content are expected to have high L0 values. In the absence of site-specific data, the waste stream at CLL was assumed to be consistent with typical MSW generated in the United States. Therefore, an L0 value of 100 m3/Mg (1.61 ft3/lb) was selected, again based on guidance from U.S. EPA (1995).
The NMOC concentration used in the model for CLL, was the default value of 4,000 ppm as hexane. This value was used instead of the Tier 2 value of 92 ppm as hexane provided by the City, because it was outside the scope of this evaluation to review the prior Tier 2 report, performed by others. It should be noted that the NMOC value assumed does not impact the projected methane generation estimates.
3.1.4 Landfill Gas Generation Estimates at CLL
The results of the LandGEM model are provided in Appendix A. The model can only analyze data for a period of 80 years; therefore only recorded/projected MSW tonnages

WG1651/CLL Feasibility Report-FINAL 21 Jun 13.docx 7 6/21/2013
for the years between 1965 and 2044 were entered. Based on output from the model, the estimated total methane generation over this 80-year period is illustrated in Figure 3.
3.2 Landfill Gas Collection
3.2.1 Factors Affecting Landfill Gas Collection Efficiency
The energy potential of a LFG-based renewable energy project is dependent on the ability to collect LFG of sufficient quality (i.e., methane content) from the waste. LFG is extracted from the landfill by applying a vacuum to a network of LFG extraction wells and/or trenches located within the waste. The efficiency of this process depends on a number of factors, including, but not limited to: (i) the thickness of waste in the area of the LFG extraction well; (ii) the distribution of wells within the landfill; and (iii) the type of cover over the area where gas extraction is taking place.
There are basic industry guidelines for estimating the GCCS collection efficiency of any given area within a landfill. Although methods differ slightly from one another, each method generally takes into account the cover conditions, the volume of waste located in the area, and the amount of area influenced by the gas collection system. For example, the U.S. EPA assumes the following estimates for LFG collection efficiency at MSW landfills (U.S. EPA, 2009):
• 0% for areas without active gas collection;
• 60% for areas with daily cover (i.e., six-inch soil cover) and active gas collection;
• 75% for areas with intermediate cover (i.e., one-foot soil cover) and active gas collection; and
• 95% for areas with a final composite (soil and geomembrane) cover system and active gas collection.
These estimates are applied to all areas of the landfill based on their cover condition, and then a weighted average calculation is applied to the overall LFG generation curve developed for the site. The weighted average calculation takes into account the volume

WG1651/CLL Feasibility Report-FINAL 21 Jun 13.docx 8 6/21/2013
of waste influenced by the collection system by applying the area and average thickness of waste within each area of similar cover. Once gas field extraction tests are performed at the site, and real collection data is available, the assumed efficiency values may be modified if warranted by the data.
3.2.2 Assumed Cover Conditions at CLL
It is clear that that the above method for estimating collection efficiency under varying cap conditions is based on broad generalizations and may not be universally applicable at all landfills. For example, with reference to conditions at CLL, the estimated GCCS collection efficiency for areas with intermediate cover (i.e., one foot of soil cover) may be too high for an area with clay cover in arid conditions where significant cracks in the soil cover may develop. Such cracks can provide short-circuit conduits for gas to vent to the atmosphere and thus limit the efficiency of LFG recovery. Therefore, these estimates must be adjusted to more closely approximate the conditions of the site under study.
Based on the above, it is conservatively assumed that the arid conditions at CLL will result in lower than average collection rates in areas with only soil cover applied. To account for this, the following collection efficiencies are assumed for the various cover conditions anticipated at CLL:
• 50% for daily cover;
• 60% for intermediate cover; and
• 95% for final cover system.
Once gas field extraction tests are performed at the site, and real collection data is available, the assumed efficiency values may be modified to more accurately reflect the actual combined performance of the gas collection system and cover system.
3.2.3 Cell Closures at CLL
Assuming that the GCCS is properly designed and maintained, the simplest method for increasing the collection efficiency is to improve the cover condition (e.g., by installing a final cover system). However, based on capacity analysis provided by the City, Cells

WG1651/CLL Feasibility Report-FINAL 21 Jun 13.docx 9 6/21/2013
A, B, and C are not expected to reach full capacity until the year 2027. Based on this estimate, it is assumed that the final cover system will be installed in 2028, the final year of the 15-year feasibility study period. Therefore, it is assumed that an intermediate cover condition will be in place for Cells A, B, and C for all but the last year of the study period, with final cover conditions assumed for the last year, 2028. 3.2.4 Landfill Gas Collection Estimates at CLL
In this study, it is assumed for practical purposes that the 15-year project period extends from 2014 (year 1) through 2028 (year 15). This allows time for project initiation and GCCS installation in 2013 (year 0). LFG recovery is assumed to begin at the start of 2014. Based on the collection efficiencies discussed in Section 3.2.2, a design LFG recovery rate was developed for application to the economic portion of the feasibility study. Upper and lower limits were also calculated to provide a conceptual understanding of the potential range of LFG recovery at the site. The upper limit is simply based on the total LFG generation rate of the landfill. The lower limit, 40 percent of the total LFG generation for the site, is based on Geosyntec’s experience with similar landfills. Spreadsheet calculations for the LFG recovery rates are provided in Appendix C, Table 1. Results are illustrated in Figure 4.
Based on the assumptions above, the expected LFG collection rates at years 1, 5, 10, and 15 are estimated as follows: 463 scfm in 2014, 503 scfm in 2018, 563 scfm in 2023, and 1,009 scfm in 2028.

WG1651/CLL Feasibility Report-FINAL 21 Jun 13.docx 10 6/21/2013
4. LANDFILL GAS TO ENERGY DEVELOPMENT OPTIONS
4.1 On-site Electricity Generation
This option involves the process of electric power production in which, in simplest terms, LFG will be ignited and the heat converted to electricity at a small on-site power station utilizing internal combustion engines or turbines. Electric power produced would be used on site (estimates provided by the City via email indicate an approximate annual use of 75,000 kWh of electricity at the landfill, which would correspond to a very small percentage of the total produced from the LFG) with the unused portion wheeled to the nearest APS tie-in location (about 2 miles away) and sold to the utility at avoided cost. However, after conversations with authorized APS personnel (Scott Davis, a sub-consultant to Geosyntec’s Phoenix office and a former APS employee, spoke to Eran Mahrer, the Director of Renewables at APS in February 2012. It is Geosyntec’s understanding that Mr. Mahrer is no longer with APS.), they did not express any interest in purchasing the small amount of electricity that could potentially be generated from the expected LFG flow rate of less than 600 scfm and not used by the landfill. As a general rule of thumb, this gas flow rate would be expected to sustain electricity production of about one megawatt (MW). Due to the capital intensive nature of on-site electricity production, and with no committed buyer for the electricity produced, Geosyntec eliminated this option from further consideration as economically unfeasible. Given the current very small on-site electrical usage of the CLL, and no requirement to install a GCCS, there would not be an economic benefit to collect LFG and generate electricity for onsite use only. Consequently, that option was not evaluated. 4.2 Gas Conversion to Compressed Natural Gas
This option includes treatment, compression and transport of bio-CNG to one or more fueling stations for use by City vehicles. Converting LFG to bio-CNG for vehicle use requires processing raw LFG through a train of gas treatment, conditioning, compression, and cooling systems where moisture, carbon dioxide, hydrogen sulfide, volatile organic compounds (VOCs), and trace impurities, including siloxanes, are removed. Based on information from the two bio-CNG process vendors contacted for this study (Cornerstone Environmental Group LLC and FirmGreen, Inc.), typical bio-CNG production processes include compression of the raw LFG feed, cooling to about

WG1651/CLL Feasibility Report-FINAL 21 Jun 13.docx 11 6/21/2013
40°F to remove moisture through condensation, and then various conditioning stages to remove waste gases and impurities. At the end of the cleanup process, the system produces two streams of gases; (i) a dry cleaned high methane content gas delivered at 90 psig to a bio-CNG compression station; and (ii) a low-pressure, low methane content (<40% methane) tail gas fuel stream to be destroyed through flaring or used in a secondary LFGTE technology if feasible. After all processing is completed the resulting bio-CNG will be a dry gas stream with up to 96% methane content and a high heat value of approximately 900 to 960 BTU per cubic foot. A number of small pre-fabricated, modular technologies are available in the market at a range of economically viable scales to convert raw LFG into a bio-CNG product that can meet vehicle fuel specifications. For this study, commercial bio-CNG production systems that can handle raw LFG at intake flows of between 50, 100, 200, and 450 scfm were considered during the evaluation process; the 200 and 450 scfm units were selected as viable options for CLL. The flow capacity of the smaller units was too small to warrant further quotations and analysis in the report. The design capacity of 50 scfm and 100 scfm units at 58,500 DGE/yr and 117,000 DGE/yr respectively was much smaller than the initial potential of the landfill (543,000 DGE/yr), and the cost of multiple smaller units put together is considered to be higher than the cost of a single equivalent large unit. 4.3 Gas Conversion to Pipeline-Quality Natural Gas
This option includes treatment, compression, and transmission of LFG into the nearest natural gas pipeline. LFG cleanup for high BTU pipeline quality natural gas includes processing/conditioning of raw LFG by removing moisture, carbon dioxide, nitrogen, hydrogen sulfide, VOCs, and trace impurities, including siloxanes, in order to achieve high gas quality specifications. The final product gas must meet strict quality standards before it may be injected into utility company pipelines for mixing with natural gas and distributed and sold to gas customers. Examples of the strict quality standards required by companies such as El Paso Natural Gas Company (EPNGC) are provided in the table below:

WG1651/CLL Feasibility Report-FINAL 21 Jun 13.docx 12 6/21/2013
Geosyntec investigated the potential of processing LFG into high-BTU gas for injection into the EPNGC natural gas pipeline. However the current low cost of natural gas, relatively depressed outlook for national natural gas prices due to abundant supply from several shale gas fields, and the high cost of processing LFG to achieve pipeline quality meant that Geosyntec eliminated this option from further consideration as economically unfeasible in Arizona. Geosyntec also contacted Janechek & Associates (Janechek), a firm that specializes in the development of cogeneration facilities utilizing biomethane in the State of California, to investigate the potential of wheeling natural gas to California to be used in their California RPS certified electrical generation plants. However, Janechek advised that the biomethane market is on indefinite hold because the California Energy Commission (CEC) has suspended the Renewable Portfolio Standard with respect to the
Pipeline Gas General Specifications (1)
Parameter Specification
Liquids Free of water and hydrocarbons in liquid for at the temperature and pressure at which the gas is received. Water vapor < 7 lbs per mcf.
Hydrocarbon dew point < 20oF at normal pipeline operating pressures
Total sulfur
<5 grains of total sulfur per 100 scf, which includes hydrogen sulfide, carbonyl sulfide, carbon disulfide, mercaptans and mono-di- and poly sulfides. Hydrogen sulfide shall not exceed .25 grain per 100 cf. Mercaptan sulfur shall not exceed 0.75 grain per 100 cf. Organic sulfur shall not exceed 1.25 grains per 100 cf.
Oxygen <0.2% by volume
Carbon dioxide <0.2% by volume
Diluents < 3% by volume Dust, gums, and solid matter
commercially free
Heating value > 967 Btu
Temperature > 50oF < 120oF
Deleterious substances Shall not contain deleterious substances in concentrations that are hazardous to health, injurious to pipeline facilities, or adversely affect merchantability
Note: (1) Reference: FERC Gas Tariff, Third Revised Volume No. 1A Version 3.0.0, Part IV: GT&C, Section 3 – Quality
WG1651/CLL Feasibility Report-FINAL 21 Jun 13.docx 13 6/21/2013
use of biomethane to produce “green energy.” The CEC is currently reviewing their requirements for approving the use of biomethane obtained from in- and out-of-state sources to produce energy within the state of California, and as a consequence, all potential energy credits have also been suspended until CEC decides to lift the suspension, if indeed they do. Based on this situation, wheeling pipeline quality biomethane to California was assumed to be an unreliable option of uncertain availability and not investigated further. 4.4 Direct Use
The simplest and often most cost-effective use of LFG is as a medium-BTU fuel for direct use. This requires simple compression of raw LFG and transmission in a low-pressure pipeline to a local end user such as an industrial or institutional facility with heat demands for boilers, heaters, kilns, furnaces, etc. The main advantages of this option are that it involves little, if any, gas treatment beyond compression (which will also result in removal of moisture) and does not require a costly high-pressure pipeline application. Boilers and heaters operated by an end user typically require simple and relatively inexpensive modifications to allow burning of LFG as a supplemental or replacement fuel to natural gas. However, equipment that was originally designed to function on natural gas may operate at reduced efficiency due to the lower heating content per unit volume of LFG (approximately 50% that of natural gas assuming 50% methane content in LFG). For this reason, LFG cannot be expected to offset pipeline natural gas at cost parity per BTU, but rather should be expected to be attractive to a gas user at about 60% of the cost per BTU of natural gas supplied.
As part of this feasibility study, Geosyntec performed a desk review of medium- to large-scale natural gas users in the local vicinity of CLL. Based on this, Geosyntec contacted five potential end-users in the area to gauge interest in using LFG methane as “green energy” at their facilities. This outreach effort yielded three potential candidates, all of which showed great interest in the possibility of using LFG from CLL at their facilities. The economic feasibility of delivering LFG to these three interested parties is evaluated in detail in Sections 5.3 and 5.4.

WG1651/CLL Feasibility Report-FINAL 21 Jun 13.docx 14 6/21/2013
5. ECONOMIC ANALYSIS
5.1 Overview of Main Assumptions
The information provided in this report is intended to provide a reasonable estimate of the magnitude of the net cash flows that would result from each LFGTE option over an assumed 15-year project period. The decision to evaluate project feasibility over a 15- rather than 10-year period was made due to the significant capital expenditure required for gas recovery and utilization, which renders a 10-year project duration insufficient to obtain desirable returns in all but the most optimal of circumstances. Also, all projects were evaluated based on the assumption that they will be fully owned and operated by the City. Based on Geosyntec’s experience with similar projects, any potential LFTGE project with a payback period greater than five years will not attract private developers. The information presented is not meant to represent a best case or a worst case investment strategy, but rather a reasonable estimate of expected costs and returns under defined input conditions and assumptions. As with all cost computations, a number of uncertainties are inherent in the analyses. For this reason, the basis of assumptions that have the potential to have a significant effect on the overall financial performance and success of a project are identified and discussed in this section. However, it is important to note that this is not an exhaustive listing of the potential uncertainties surrounding a future LFGTE project. As discussed in the review of potential LFGTE technologies in Section 4, only onsite conversion of LFG to bio-CNG and piping medium BTU gas for direct use by an offsite end user were considered viable and worthy of detailed further evaluation. Assumptions made by Geosyntec in estimating LFG recovery from the landfill and preparing the financial pro-forma for each LFGTE option are listed in the subsections below.
5.1.1 Assumed Capital Costs for Landfill Gas Collection
All LFGTE options will require an initial investment in a GCCS for the recovery of LFG. A typical GCCS is comprised of a network of pipes and extraction wells/trenches located within the waste, a blower system for application of vacuum to the pipe network, and a backup gas destruction device (i.e., flare) for the control of unused LFG. The installation of a GCCS may be performed under a single contract, or may be constructed in stages as the landfill cells are filled. For the purpose of this analysis,

WG1651/CLL Feasibility Report-FINAL 21 Jun 13.docx 15 6/21/2013
GCCS construction is assumed to take place in the first year of the project, and will include a sufficient number of wells (assumed as one well per acre of landfill, per industry standards) to influence all of the waste in Cells A, B, and C. This approach maximizes the amount of gas assumed to be available in the early stages of a LFGTE project. It is also conservative in terms of net present value (NPV) analysis as it assumes higher capital expenditure in the immediate term. Geosyntec prepared a cost estimate for the installation of the GCCS for use in subsequent economic analyses (Table 1). The construction costs for the extraction wells and pipe networks are based on unit rates from actual bids from contractors for a similar 2010 construction project at a landfill in Florida. Using the unit price schedule for the high, low, and winning bids from that project, the expected range of costs for installing a GCCS at CLL for this project is shown in Table 1. The “winning bid” of about $2.5 million in Table 1 is the cost assumed in all subsequent pro forma prepared for this study. The cost of the flare/blower system and compressor is based on Geosyntec’s experience with similar projects. Other assumptions are listed in the table. 5.1.2 Assumptions Related to Landfill Gas Recovery
Assumptions made by Geosyntec in estimating the rate and cost of LFG recovery from the landfill are provided below.
1. The cost of engineering design and construction quality assurance (CQA) services associated with installation of the GCCS is approximately 10% of the total construction cost, based on Geosyntec’s experience with similar projects.
2. The amount of LFG collected is based on estimated efficiencies that are conservatively less than those assumed by the U.S. EPA for similar pre-closure landfill configurations. These estimates were reduced from those provided by the EPA due to the arid conditions at landfills located in the southwestern U.S., which cause cracking of the interim soil covers and consequently lower collection efficiency. If warranted, collection efficiency values may be adjusted in the future based on results from on-site gas field extraction tests.
3. The annual capacity factor – the percentage of time the GCCS will be operational – is assumed to be 95%, based on typical industry achievement.

WG1651/CLL Feasibility Report-FINAL 21 Jun 13.docx 16 6/21/2013
4. Annual operation and maintenance (O&M) costs for the GCCS are assumed to be $3,400 per month ($40,800 per year), based on an assumed two days per month of wellfield balancing at $1,200 per day, plus $1,000 per month for power supply to the flare/blower and compressor.
The capital cost of cover installation is not included as a cost related to GCCS installation, as this expenditure would be incurred by the City regardless of whether a LFGTE project was constructed. 5.1.3 Assumptions Related to Gas Conversion to bio-CNG
Data from the Energy Information Administration (EIA) is used to assign the current per gallon cost of diesel, which is used as the basis for calculating the value of bio-CNG in terms of diesel gallon equivalents. Fluctuations in the price of diesel are difficult to predict; therefore, for the basis of comparison, this price is kept constant throughout the feasibility study period despite the fact that fuel prices are historically volatile and may change dramatically over time. Nevertheless, this assumption is conservative in calculating the avoided cost to the City of replacing diesel with bio-CNG over the 15-year study period, as it is unlikely that downward pressure on diesel prices will occur during this time. No additional engineering or CQA costs are associated with the installation of a bio-CNG processing facility or fueling stations as these are package plants provided under a turnkey cost basis. 5.1.4 Assumptions Related to Direct Use Options
Assumptions made by Geosyntec in developing the financial pro formas for direct use of LFG are described below.
1. The cost per million BTU (MMBTU) from natural gas applied to the pro formas for the SCA, Purina, and WWTP facilities is based on the most recent cost data reported by the Purina facility ($7.63 per MMBTU; Geosyntec has not yet been able to obtain the price paid by SCA, and the WWTP was negotiating a lower rate that was anticipated to be similar to the Purina rate). It is assumed that this cost includes all associated fees for gas delivery.
2. Easements for each of the pipeline alignments to transport the LFG to the potential end users are assumed to be obtainable and costs associated with
WG1651/CLL Feasibility Report-FINAL 21 Jun 13.docx 17 6/21/2013
obtaining these easements are within the range assumed in the pro formas. If for any reason any of these easements cannot be obtained, the actual cost may vary significantly from the initial estimate – either due to more costly easements or through an increase in the total pipeline length.
3. The cost of engineering design and CQA services associated with installation of a pipeline is approximately 5% of the total construction cost and is based on Geosyntec’s experience with similar projects. These costs are typically lower than those encountered for a GCCS project due to the reduced complexity.
Note that fluctuations in the price of natural gas are difficult to predict; therefore, for the basis of comparison, the price of gas supply to all end users is kept constant throughout the feasibility study period. Given that upward price volatility is more likely than downward price pressure, this assumption is conservative in terms of calculating the value of LFG over the 15-year study period.
5.1.5 Assumed Discount Rate
The assumed inflation-adjusted discount rate used in all pro formas is 0.47%. Because the projected costs and revenues were estimated based on 2012 dollars, the effect of inflation needs to be included in the discount rate. The inflation-adjusted discount rate (r′a) was estimated based on the following equation:
(Campbell, 2001)
Where r′n is the cost of capital provided by the City of 3%, and i is the average inflation rate assumed for the project of 2.52%2. As shown by the equation, inflation reduces the discount rate. The expected rate of return for the City in a LFGTE project at CLL should thus be greater than would be obtained from investing the same amount in U.S. Treasury Bonds, since these are considered to yield a risk-free return. For an investor such as the City, for which management of costs is assumed to take precedent over revenue
2 The inflation rate estimate of 2.52% was based on the CPI from the Bureau of Labor Statistics from 1991 to 2012.
11
1 '' −
++
=i
rr n
a

WG1651/CLL Feasibility Report-FINAL 21 Jun 13.docx 18 6/21/2013
potential in any decision to proceed with a project, a low discount rate is conservative because it reduces the risk of over-discounting the effect of costs incurred towards the end of the project period. 5.2 Conversion to Compressed Natural Gas
Based on information made available to Geosyntec, the City currently owns and operates 36 medium and light vehicles and nine heavy-duty vehicles that are based at or near the CLL. The bulk of annual fuel consumption of City vehicles is due to the light weight vehicles (136,300 DGE/year) with a smaller proportion by heavy duty vehicles (48,600 DGE/yr). The heavy duty vehicles above 10 liter engine size operate typically on a dual fuel system of CNG and diesel. Geosyntec assumes a conservative 100% CNG usage by heavy duty vehicles as the impact on the outcome of the financial pro forma is insignificant. The total annual fuel usage of these vehicles is about 185,000 diesel gallon equivalents (DGE) (see Appendix D), which equates to a total fuel demand of about 593 DGE per day based on a 6 day/week operation. A DGE refers to the volume of fuel (for example bio-CNG or gasoline) containing the same amount of energy content as one gallon of diesel (the energy content of diesel is 128,400 BTU/gallon). Geosyntec understands that the City does not currently operate any CNG-powered vehicles. Therefore, in developing the pro forma for a bio-CNG project at CLL, it is assumed that the City will convert all diesel and gasoline vehicles to run on bio-CNG. The minimum required output from a bio-CNG project is therefore 593 DGE per day. The City provided at later date additional vehicle information of 382 vehicles that are mostly based in the City of Flagstaff (20 hybrid, and 362 non-hybrid vehicles) for bio-CNG consideration. The total annual diesel usage of the additional 362 non-hybrid vehicles (neglecting the 20 hybrids) is 196,832 DGE (see Appendix D). Overall, there are a total of 407 vehicles (45 mostly based in CLL and 362 based in the City) with annual diesel equivalent fuel consumption of approximately 382,000 DGE. Based on initial order of magnitude estimates of DGE demand, Geosyntec obtained turnkey estimates for installation and maintenance of two alternative bio-CNG facilities: (i) a 200-scfm unit supplied by Cornerstone Environmental Group LLC (CEG); and (ii) a 450-scfm unit supplied by FirmGreen, Inc. Details regarding component systems for each unit are provided in Appendix E. The 450-scfm FirmGreen unit will be too large

WG1651/CLL Feasibility Report-FINAL 21 Jun 13.docx 19 6/21/2013
for this project. The 200-scfm CEG unit can produce about 750 DGE per day (based on an assumption of 50% methane content) and represents the smallest single bio-CNG unit that can be installed to meet the City’s DGE demand (the next smaller unit – 100 scfm – cannot meet demand). However, the projected LFG recovery rate at CLL ranges from 463 scfm in 2014 to 1009 scfm in 2028. In other words, the landfill is expected to produce significantly more LFG than is needed to meet the City’s demand for DGE. To boost output, combinations of different sized bio-CNG units can be assembled to meet specific LFG availability and DGE demand; therefore, in this feasibility study the following two set-ups were investigated:
• A single 200-scfm CEG unit, which will allow about 40% (i.e., 200 scfm corresponds to approximately 43% of the design curve flow in the short term) of the expected total LFG recovery available in the short-intermediate term to be used; and
• Two parallel 200-scfm CEG units, which will allow about 86% of the expected total LFG recovery available in the short-intermediate term to be used.
These two set-ups were evaluated to provide an illustration of the relative economic attractiveness of developing a bio-CNG project based on whether the motivating assumption is for 100% offset of current diesel usage by City-owned vehicles (i.e., 200-scfm project to meet the City’s DGE demand with little external sale of bio-CNG) or for optimal utilization of the available LFG over the project period (i.e., 400-scfm project to meet the City’s needs and provide excess bio-CNG for external sale). It is assumed that bio-CNG will be compressed and stored in an on-site storage tank from where it will be routed to one of two automated fast fueling stations: (i) a static on-site bio-CNG fueling station constructed in a convenient location at CLL; and (ii) tube trailers for pressurized transportation to an off-site bio-CNG fueling station installed at a convenient location in the City of Flagstaff to better serve vehicles not based at the landfill. This remote location will also serve as the retail outlet for excess bio-CNG. The on-site fueling station will include a compressor to compress bio-CNG before delivering to vehicles, a gas dryer, and a fast fill two-hose dispenser with credit card reader. The off-site fueling station will include two tube trailers to transport bio-CNG, a dedicated compressor located at CLL to fill the tube trailers, a fast filling

WG1651/CLL Feasibility Report-FINAL 21 Jun 13.docx 20 6/21/2013
station with a storage tank, a compressor and dryer, and a fast fill two-hose dispenser with credit card reader. 5.2.1 Costs
Geosyntec included the following costs for installing a bio-CNG project in accordance with the two scenarios listed above (i.e., single 200-scfm unit and dual 200-scfm units). CEG provided a turnkey estimate for installation and O&M of the 200-scfm units and fueling stations. Details are provided in Appendix E. The total estimated capital cost for a single unit set-up is $2.28 million and for a dual unit set-up is $3.18 million. Cost breakdowns for the two set ups are provided in Appendix F. Nominal O&M costs for each set-up are estimated at about $220,000 per year if operating at full load, based on vendor-supplied information on typical O&M costs per gallon of DGE output. It is assumed that all of the City’s current fleet of 45 vehicles that are mostly based at CLL or 407 vehicles that are based at CLL and the City will be converted to run on CNG at an average cost of $15,000 per vehicle3. This equates to a $675,000 capital expense for CLL based vehicles, or $6.1 million capital expense for CLL and city based vehicles in year 1 of the project. As shown in the pro formas presented as Table 2 (single 200-scfm unit) and Table 2a (two 200-scfm units), these costs are in addition to the cost of GCCS construction and O&M, “soft” costs for installation of the GCCS, and annual federal and state road excise taxes of $0.21/DGE and $0.22/DGE, respectively. Note that because the quantity of LFG that can be recovered from the landfill is significantly in excess of that required to meet bio-CNG production capacity if only a single 200-scfm unit is installed, it is assumed in this scenario that the GCCS will be installed to cover only half the total acreage of Cells A through C. However, the cost savings realized are not directly scalable due to fixed costs associated with installation of header pipes, blower/flare station, and compressor. Based on Geosyntec’s experience, it is assumed that the capital cost of a half-size GCCS will be about 75% of the cost of a full-size GCCS. This cost reduction is reflected in Table 2.
Finally, for the 200-scfm single unit and 200-scfm dual unit set-up with sale of excess bio-CNG, the transportation and distribution costs (i.e., transport of CNG from CLL to
3 The cost of $15,000 per vehicle is an average estimate for light and heavy duty vehicles based on discussion with three sources including: Landi Rendo USA/Baytech, Torrance CA; American Power Group, Inc., Algona, IA; and Go Natural CNG, Woods Cross, UT.

WG1651/CLL Feasibility Report-FINAL 21 Jun 13.docx 21 6/21/2013
the city station, operation and maintenance of a dedicated tractor trailer, labor costs for driver, and truck fuel costs) are assumed to be 10% of the retail value of bio-CNG sold over the life of the project at $2.98/DGE which is approximately $0.30/DGE (Tables 2 and 2a). The O&M assumes all volume greater than that consumed at CLL (184,933 DGE/year) will be transported to the city station.
5.2.2 Revenues
The potential cost benefits of the bio-CNG options are the reduction in costs associated with: (i) offsetting fuel consumption by converting all diesel and gasoline vehicles to CNG-powered vehicles; and (ii) selling excess bio-CNG to non-City customers. As discussed previously, systems for converting LFG to bio-CNG are available in discrete production capacities; once the capacity of a given unit is reached, additional or larger units are required to produce more bio-CNG, despite the availability of additional LFG. This limitation limits the revenue stream to a step function and adds to the importance of accurate and conservative estimation of the collectable LFG for the feasibility study period. It is important to balance the initial capital cost with the expected LFG supply. For this reason, two different scenarios were investigated in which the bio-CNG production capacity was based on handling either 200 scfm or 400 scfm of LFG. Both are conservatively below the maximum potential production capacity based on the estimated LFG recovery rate. Excess LFG would be flared by the City in a candlestick flare. The cost of the flare is included in the GCCS cost estimate. Based on the projected production of bio-CNG from a 200-scfm unit (Table 2), the City would be able to produce over 234,000 DGE per year, more than sufficient to replace the approximately 185,000 gallons of DGE diesel per year currently consumed by the City’s vehicle fleet that are mostly based at CLL, with approximately an additional 50,000 DGE available for sale. At an assumed direct diesel cost of $4.21 per gallon and retail value of $2.98 per gallon for CNG (based on current data for Arizona), this results in annual cost offsets and revenues (mostly cost offsets) of approximately $926,000, with an additional $141,000 in revenues realized under the Renewable Identification Number (RIN) system over the first three years. The revenue potential for this option is high: the 15-year NPV is $4.55 million on capital expenditure of $5 million, the payback period is about 7.3 years, and the IRR is 10.6%.

WG1651/CLL Feasibility Report-FINAL 21 Jun 13.docx 22 6/21/2013
Based on the projected production of bio-CNG from dual 200-scfm units (Table 2a), the City would be able to produce nearly 470,000 DGE per year, again more than sufficient to replace approximately 382,000 gallons of DGE per year currently consumed by the City’s 407 vehicle fleet with an additional 88,000 gallons available for sale. At an assumed direct diesel cost of $4.21 per gallon and retail value of $2.98 per gallon for CNG (based on current data for Arizona), this results in combined annual cost offsets and revenues of approximately $1.87 million, with an additional $282,000 in RIN revenues generated during the first three years. The revenue potential for this option is moderate: the 15-year NPV is $7.12 million on capital expenditure of $12 million, the payback period is about 9 years, and the IRR is 7.4%. 5.3 Direct Use by SCA Tissue Facility or Nestle Purina
Two commercial third-party end users with potential interest in using LFG to supplement energy demands were identified for further analysis: (i) SCA Tissue (SCA); and (ii) Nestle Purina (Purina). The contacts that Geosyntec talked to at these facilities were Suzanne Rainwater and Doug Holderman at SCA and Douglas Lehrer at Purina. These end users were identified as viable candidates for the direct use option based on their interest in diversifying their energy resources, proximity to CLL, and their ability to accept all the LFG recovered from CLL on a continual 24-hour basis with only minor modifications to their respective facilities. Both SCA and Purina indicated that their potential interest in the LFG would be for use in their boilers. This use would likely require modifications to the burners and influent gas controls, and installation of additional piping, metering, and valves to allow the LFG to be added to the boiler feed gas. Each end user has the capacity to use all of the LFG projected for the life of the project. Also, each facility was asked if they had interest in converting the LFG to electricity at their location, and both declined interest in that option. The following sections discuss the costs and revenues associated with each end user. The SCA and Purina facilities currently purchase natural gas from a local distributor for use in boilers. Both of these potential end users have expressed interest in the use of medium BTU gas from CLL and indicate they have sufficient energy demands to purchase all of the LFG that could be supplied to their facilities. The key difference between these end users relates to the cost of supply of LFG based on the alignment and length of the low-pressure pipeline required to deliver the LFG. Potential pipeline
WG1651/CLL Feasibility Report-FINAL 21 Jun 13.docx 23 6/21/2013
routes for SCA and Purina are shown in Figures 5 and 6, respectively. SCA is located approximately 10.8 miles from CLL while the Purina facility is approximately 8.5 miles from CLL (all distances are measured along the length of the pipeline route shown in the figures). 5.3.1 Costs
Implementation of the direct use option would entail the construction of a low-pressure pipeline for conveyance of LFG from CLL to the end user. As shown in the figures, the prospective route of the pipeline is identical until it reaches the turning point to reach the Purina facility. Therefore, the distinguishing component of each of these end user options is the extra pipeline required to reach the SCA facility (approximately 2.4 miles). Geosyntec prepared a cost estimate for the construction of each of the pipeline alignments required for each end user (Table 3). It is assumed that the lump sum cost for obtaining pipeline easements would be $200,000 for both options. As shown in the table, the additional length of pipeline required to reach the SCA facility increases the initial project cost for SCA by nearly one million dollars relative to Purina. These costs are in addition to the cost of GCCS construction and O&M, as well as “soft” costs discussed in Section 5.1. The total capital cost for a project to deliver LFG to SCA is $8.26 million (Table 4), and for delivery of LFG to Purina is $7.26 million (Table 5). The cost of the pipeline installation represents 63% and 59% of the total capital cost for the SCA and Purina projects, respectively. 5.3.2 Revenues
The revenue analysis for both the SCA and Purina projects is based on the average price of $7.63 per MMBTU reportedly paid by Purina in 2011. The financial pro forma for SCA is presented as Table 4 and that for Purina is presented as Table 5. It is assumed in the financial pro forma for each facility that the City would be able to negotiate a sale price per MMBTU from LFG fixed at a rate of 60% of their current cost per MMBTU from natural gas. This reduced rate is based on Geosyntec’s experience with similar projects and accounts for the risk that the end user must take to accept relatively impure, medium BTU gas from a non-utility supplier.

WG1651/CLL Feasibility Report-FINAL 21 Jun 13.docx 24 6/21/2013
Based on the above assumptions, the annual revenue for both the SCA and Purina projects would range from approximately $529,000 to $1,150,000 through the 15-year project period, with the annual increase due to the increased gas supply each year as the landfill expands and the total quantity of LFG collected increases. The 15-year NPV for the SCA project is slightly positive at $342,000 (IRR = 0.9%) (Table 4), while the 15-year NPV for the Purina project is moderately positive at $1,484,000 (IRR = 2.7%) (Table 5).
5.4 Direct Use by Wildcat Hill Wastewater Treatment Facility
The Wildcat Hill Wastewater Treatment Plant (WWTP) was identified as a viable non-commercial candidate for the direct use option based on proximity to CLL and ability to accept the all the LFG recovered from CLL on a continual 24-hour basis over the life of the project. Geosyntec understands that the WWTP is not currently a large consumer of natural gas, but that interest has been expressed in using LFG from CLL as a source of energy for drying sludge. Based on Geosyntec’s conversations with WWTP personnel, if the facility was to implement plans to dry sludge to increase the solids content to at least 20%, their annual energy demand would be on the order of 200,000 to 250,000 MMBTU/year, sufficient to consume all of the LFG collected at the landfill over the 15-year project period. The target solids content of 20% is use because at that concentration the sludge acts as a solid for transport and disposal. The energy demand to dry the sludge was calculated by Mike Hayes of Geosyntec, a wastewater treatment expert. Based on the energy demand described above, it is assumed that the WWTP can consume all LFG potentially supplied by a direct use project. The following sections discuss the costs and revenues associated with supplying LFG to the WWTP as an end user. 5.4.1 Costs
The WWTP option will require installation of approximately 8.4 miles of low-pressure pipeline (Figure 7). It is assumed that the lump sum cost for obtaining pipeline easements along this alignment would be $200,000. The total capital cost for a project to deliver LFG to the WWTP is $7.03 million (Table 6). This cost is in addition to the costs for the GCCS construction and O&M, as well as “soft” capital costs discussed in Section 5.1. The cost of pipeline installation represents 58% of the total capital cost of the project.

WG1651/CLL Feasibility Report-FINAL 21 Jun 13.docx 25 6/21/2013
5.4.2 Revenues
In the case of the WWTP plant, which is owned and operated by the City, the benefits of the project would be realized through the avoided cost of purchasing natural gas for future sludge drying operations. At the time of preparation of this report, the WWTP was paying $11.90 per MMBTU for natural gas supply, but was negotiating a lower rate that was anticipated to be similar to the rate that Purina was paying, which was $7.63 per MMBTU. This lower rate was used in the financial analysis. Assuming that the facility decided to install a sludge drying system of sufficient size that, at a minimum, would utilize 100% of the LFG produced by CLL, the WWTP (i.e., the City) would realize annual savings of $0.88 million to $1.92 million per year over the 15-year project period. The pro forma for this option (Table 6) shows the following:
• the project would be capable of recouping the initial capital investment after eight years;
• the 15-year NPV is $7.79 million; and
• the 15-year IRR is estimated at 10.7%.

WG1651/CLL Feasibility Report-FINAL 21 Jun 13.docx 26 6/21/2013
6. SUMMARY AND RECOMMENDATIONS
This report provides: (i) an evaluation of the energy potential from the LFG expected to be generated and that could be collected at the CLL if the City elects to install a GCCS; (ii) a broad overview of the potential LFGTE options that are considered to be technically and economically viable for the site; and (iii) an analysis of the technical and economic viability of various LFGTE options. Initially, four separate technologies were considered. However, two options were quickly eliminated from serious consideration early in the evaluation process. Converting LFG to electricity was ruled out due to a lack of interest from APS, combined with insufficient power demands from the landfill to justify on-site production. Review of market conditions for renewable fuels at “green energy” prices, coupled with the high costs for cleaning up LFG to pipeline quality (high BTU) led to the conclusion that this option was also not feasible. Based on the above, Geosyntec focused this feasibility study on the following options: (i) production of bio-CNG at the landfill site for use in the City’s vehicle fleet, with sale of excess bio-CNG produced; (ii) direct use by two alternative third-party end users; and (iii) direct use for sludge drying by the City’s WWTP. The economic feasibility of each option was evaluated based on cost information from the City, end users, third-party vendors, published sources, and Geosyntec’s experience with similar projects. However, it must be recognized that several factors that may affect the overall accuracy of the feasibility study may change in the future. As with all cost computations, a number of uncertainties are inherent in the analyses. A 15-year study period was selected due to the significant capital expenditure required for gas recovery and utilization, which render a 10-year project duration insufficient to obtain positive returns in some cases. Pro formas were developed for each option which provided the expected capital and annual O&M costs as well as revenues under different use scenarios. This enabled a15-year NPV, IRR, and project payback period to be calculated for each option, as summarized in Table 7. A low inflation-adjusted discount rate of 0.47% was assumed for all pro formas. For an investor such as the City, for which management of costs is assumed to take precedent over revenue potential in any decision to proceed with a project, a low discount rate is conservative because it reduces the risk of over-discounting the effect of costs incurred toward the end of the project period. Overall, the information presented in this report is not meant to represent a best- or a worst-case investment strategy, but rather a reasonable estimate

WG1651/CLL Feasibility Report-FINAL 21 Jun 13.docx 27 6/21/2013
of expected costs and returns under defined input conditions and assumptions for the different project options evaluated. The summary data in Table 7 shows that for the projects involving direct use of LFG, the SCA project would not be expected to be economically viable, and the Purina project would at best be marginally viable. The distance of these facilities from the landfill is a significant factor as pipeline installations would represent about 60% of the total project development costs. Any project with a commercial end user also incurs an inherent market risk as even a firm commitment to buy all LFG at a guaranteed price cannot be enforced in the event of insolvency. As a result, such projects would need to be significantly positive in terms of short-term NPV and IRR before a recommendation to incur the high capital costs of development could be made. In conclusion, the study findings suggest that any attempt to develop a commercial medium BTU project is unlikely to be successful. Three project options are economically viable and merit consideration by the City if the decision to develop a LFGTE project is made (Table 7). Firstly, development of a small-scale 200-scfm bio-CNG project to offset 100% fuel usage by City vehicles that are based at or frequent the CLL and sale of excess bio-CNG to third-party consumers represents the low capital risk for a positive 15-year NPV and requires a relatively shorter expected project payback period of approximately 7.3 years. Overall, it is estimated that this project option could generate annually $926,000 from offsets and direct sale (at 2012 diesel prices), and is one of the most economically viable options with an IRR at 10.6%. This project assumes installation of the GCCS is restricted to half the area of Cells A through C. In terms of environmental performance and greenhouse gas control, therefore, this project would perform less well than the other economically viable options. In addition, part of the revenue of this project is linked to consumption of bio-CNG by third-party consumers and thus incurs some market risk. Secondly, development of a larger-scale 400-scfm bio-CNG project to offset 100% fuel usage by City vehicles both based at the CLL and the city, and generate excess bio-CNG for retail sale represents a 7.4% IRR with a 9 year payback period. The monetary benefit of offsetting fuel purchases for the additional 362 City based vehicles included in this 400-scfm option just offsets the cost of CNG-vehicle conversion; therefore the IRR at 7.4% is lower than the smaller bio-CNG option at 10.6%. This is because the 45 vehicles based at or that frequent the CLL consume approximately 4,110

WG1651/CLL Feasibility Report-FINAL 21 Jun 13.docx 28 6/21/2013
DGE/yr/vehicle while the combined fleet of 407 vehicles consume approximately 938 DGE/yr/vehicle; therefore with the smaller option, the City realizes higher fuel offsets for a much lower cost of vehicle conversion. This project has the highest capital cost, adding additional risk. In addition, part of the revenue of this project is linked to consumption of bio-CNG by third-party consumers and thus incurs some market risk. The City would be required to operate (or contract operation) of fueling stations which may distract from core responsibilities. Finally, development of a direct use project in which medium BTU gas is supplied to the City-owned Wildcat Hill WWTP provides a positive 15-year NPV and IRR, and has a project payback period of 8 years. As with the other two direct use options, about 60% of the total capital cost of the project is incurred for pipeline installation. In addition, the benefits of the project would be realized only through the avoided cost of purchasing natural gas for future sludge drying operations, something that the WWTP could elect is not in the financial interests of the City. The pro forma is also based on the assumption that the City will be successful in negotiating a lower price for natural gas ($7.63 per MMBTU). Assuming that the WWTP decided to install a sludge drying system of sufficient size to utilize 100% of the LFG produced by the landfill, the City would realize annual savings of up to $1.92 million per year over the 15-year project period.

WG1651/CLL Feasibility Report-FINAL 21 Jun 13.docx 29 6/21/2013
7. REFERENCES
Barlaz, M.A. (2010-2011), Kappe Lecture Tour. “Development of a Carbon Footprint Model for Landfill Disposal of Solid Waste” and “The Use of Life-Cycle Analysis for the Study of Alternatives for End of Life Materials Management.”
Campbell, John M. Jr., Campbell, John M. Sr. and Campbell, Robert A. (2001) Analyzing and Managing Risky Investments, April.
Hydro Geo Chem, Inc. (2008) Non-Methane Organic Compound Emissions Report, Tier 2 Protocol, Cinder Lake Landfill, Flagstaff, Arizona, December 23.
R.W. Beck, Inc. (2010) Gas Generation Evaluation Review – Cinder Lake Landfill, October.
Staley, B.F. and Barlaz, M.A. (2009). Composition of Municipal Solid Waste in the United States and Implications for Carbon Sequestration and Methane Yield, Journal of Environmental Engineering, Vol. 135, No. 10, October.
U.S. Energy Information Administration (2012). Gasoline and Diesel Fuel Update, http://www.eia.gov/petroleum/gasdiesel/, last accessed October 2012.
U.S. Environmental Protection Agency (1993). Solid Waste Disposal Facility Criteria: Technical Manual, EPA530-R-93-017, USEPA Office of Solid Waste, Washington, DC, November 1993 (revised 13 April 1998).
U.S. Environmental Protection Agency (1995). AP-42, Fifth Edition, Compilation of Air Pollutant Emission Factors, Volume 1: Stationary Point and Area Sources, Section 2.4: Municipal Solid Waste Landfills, Office of Air Quality Planning and Standards, Research Triangle Park, NC, January 1995, Supplement E (November 1998), update in review (October 2008).
U.S. Environmental Protection Agency (1996). Standards of Performance for New Stationary Sources, Federal Register, 40 CFR Part 60.
U.S. Environmental Protection Agency (2005). LandGEM – Landfill Gas Emissions Model, Version 3.02, May.
U.S. Environmental Protection Agency (2009). Mandatory Reporting of Greenhouse Gases Rule: 40 CFR Part 98, Subpart HH, October.
Woodward-Clyde Consultants (1997). Geotechnical Investigation- Cinder Lake Landfill Expansion, February.
WG1651/CLL Feasibility Report-FINAL 21 Jun 13.docx 30 6/21/2013
Woodward-Clyde Consultants (1997b) Initial Design Capacity Report and Non-Methane Organic Compounds (NMOC) Emission Rate Analysis for the Cinder Lake Landfill, Flagstaff, Arizona, June 1997.
Woodward-Clyde Consultants (1998) Facility Plan - Cinder Lake Landfill, May 1998.

TABLES

Geosyntec Consultants
Item No. UnitsEstimated Quantity
Unit Cost Total Cost Unit Cost Total Cost Unit Cost Total Cost
1 Lump Sum 1 $ 265,550.00 $ 250,000.00 $ 200,000.00 2 Lump Sum 1 $ 79,100.00 $ 169,044.00 130,000.00$ 3 Lump Sum 1 $ 225,096.00 $ 343,610.00 250,000.00$ 4 Engineering Design(2) Lump Sum 1 $ 212,852.12 $ 251,085.40 $ 302,090.00
5A. 18-in. HDPE SDR 17 header (0'-4') feet 3,000 51.20$ 153,600.00$ 54.00$ 162,000.00$ 78.00$ 234,000.00$ B. 12-in. HDPE SDR 17 header (0'-4') feet 5,000 38.70$ 193,500.00$ 32.00$ 160,000.00$ 50.00$ 250,000.00$
C.6-in. HDPE SDR 11 horizontal collector gas extraction trench (6' - 8') feet 18,700 26.20$ 489,940.00$ 36.00$ 673,200.00$ 42.00$ 785,400.00$
6A 12" valve each 4 4,407.00$ 17,628.00$ $ 4,200.00 16,800.00$ 8,000.00$ 32,000.00$ B. 18" valve each 4 8,701.00$ 34,804.00$ $ 13,500.00 54,000.00$ 22,000.00$ 88,000.00$
7A. Drilling 36" Dia. Bore with well completion (8" SC feet 5,500 78.50$ 431,750.00$ 75.00$ 412,500.00$ 125.00$ 687,500.00$ B. 2" Wellheads (WM standard) each 110 356.20$ 39,182.00$ 670.00$ 73,700.00$ 1,200.00$ 132,000.00$
8A. 8-in. dia. SDR 17 Condensate Sump with Pump each 6 16,395.20$ 98,371.20$ 16,000.00$ 96,000.00$ 22,000.00$ 132,000.00$
9 each 1 100,000.00$ 100,000.00$ 100,000.00$
( $ 2,128,521.20 ) ( $ 2,510,854.00 ) ( $ 3,020,900.00 )
Notes:
4. The cost of the flare/blower system is based on Geosyntec's experience with similar projects, and it includes the cost of installation.
3. Gas collection system quantities are based on the following assumptions: (i) a header loop will be constructed around the perimeter of Cells A, B, and C; (ii) wells will be installed at a frequency of approximately one well per acre; (iii) the average length of lateral pipe per well is approximately 160 feet; and (iv) the average well depth is approximately 50 feet.
Work Description/Item
1. Cost estimates for items 1-3 and 5-9 are based on actual bids from a similar project located in Florida that was constructed in 2010. Minimum and maximum bids are based on the total lump sum estimate, and do not always represent the lowest unit cost per work item. The most probable cost estimate is based on the estimate provided by the contractor that was awarded the contract for that project (with the exceptions of items 2 and 9 as described below).
Flare/Blower System(4)
2. The cost of engineering design services is assumed to be equal to 10% of the construction costs.
Table 1: Cost Estimate for Construction of a Landfill Gas Collection SystemCinder Lake Landfill
Flagstaff, Arizona
TOTAL (LUMP SUM FIXED FEE)
Extraction Wells(3)
Liquid Collection
Mobilization and DemobilizationSurveyingSite Preparation
GCCS Construction (1)
HDPE Piping (w/ excavation and backfill)(3)
Isolation Valves
General Site Preparation (1)
Minimum Most Probable Maximum
WG1651 4/17/2013

Geosyntec Consultants
50%
$1,883,141$2,281,000$4,164,141 $188,314
Cost of Conversion to CNG Vehicle(10) = $675,000$5,027,455
$4.21$2.98
Cost of Capital = 3.0%Inflation Rate(5) = 2.52%
0.47% 15-year IRR = 10.6%
ProjectYear
Calendar Year
Potential Gas Production Rate (scfm)
Potential Annual CNG Production
Rate (DGE)(8)
BioCNG Design DGE/year
Number of CNG Vehicles
Average Diesel Usage per
Vehicle (DGE/year)
Annual BioCNG Consumption
by Client(DGE)
Annual BioCNG Sales to End-
User(DGE)
Price of Diesel Fuel
($/DGE)(4)
Price of CNG
($/DGE)(4)
Savings from Grant or Tax
Credits($)
RIN Value Savings($/DGE)
Likely Savings from
RIN Value
Revenue from BioCNG Sales
($)
Capital Costs($)
GCCS O&M
Cost(7)
($)
BioCNG O&M
Cost(9)
($)
Transportation
O&M Cost(13)
($)
Federal Excise
Tax(11)
($)
State Road/
Excise Tax(12)
($)
Total Costs ($)
(Revenues - Costs)($)
Net Present Value
($)
0 2013 --- --- --- --- --- --- --- --- --- --- --- --- $5,027,455 $0 $0 $0 $0 $0 $5,027,455 -$5,027,455 -$5,027,455
1 2014 463 543,181 234,437 45 4,110 184,933 49,504 $4.21 $2.98 $75,000 $0.60 $141,101 $1,142,192 $0 $40,800 $220,371 $14,851 $10,396 $10,891 $297,309 $844,883 -$4,186,509
2 2015 473 553,859 234,437 45 4,110 184,933 49,504 $4.21 $2.98 $0 $0.60 $141,101 $1,067,192 $0 $40,800 $220,371 $14,851 $10,396 $10,891 $297,309 $769,883 -$3,423,786
3 2016 482 565,077 234,437 45 4,110 184,933 49,504 $4.21 $2.98 $0 $0.60 $141,101 $1,067,192 $0 $40,800 $220,371 $14,851 $10,396 $10,891 $297,309 $769,883 -$2,664,617
4 2017 492 576,847 234,437 45 4,110 184,933 49,504 $4.21 $2.98 $0 $0 $926,091 $0 $40,800 $220,371 $14,851 $10,396 $10,891 $297,309 $628,782 -$2,047,474
5 2018 503 589,183 234,437 45 4,110 184,933 49,504 $4.21 $2.98 $0 $0 $926,091 $0 $40,800 $220,371 $14,851 $10,396 $10,891 $297,309 $628,782 -$1,433,207
6 2019 514 602,096 234,437 45 4,110 184,933 49,504 $4.21 $2.98 $0 $0 $926,091 $0 $40,800 $220,371 $14,851 $10,396 $10,891 $297,309 $628,782 -$821,803
7 2020 525 615,601 234,437 45 4,110 184,933 49,504 $4.21 $2.98 $0 $0 $926,091 $0 $40,800 $220,371 $14,851 $10,396 $10,891 $297,309 $628,782 -$213,249
8 2021 537 629,710 234,437 45 4,110 184,933 49,504 $4.21 $2.98 $0 $0 $926,091 $0 $40,800 $220,371 $14,851 $10,396 $10,891 $297,309 $628,782 $392,470
9 2022 550 644,438 234,437 45 4,110 184,933 49,504 $4.21 $2.98 $0 $0 $926,091 $0 $40,800 $220,371 $14,851 $10,396 $10,891 $297,309 $628,782 $995,366
10 2023 563 659,799 234,437 45 4,110 184,933 49,504 $4.21 $2.98 $0 $0 $926,091 $0 $40,800 $220,371 $14,851 $10,396 $10,891 $297,309 $628,782 $1,595,452
11 2024 577 675,809 234,437 45 4,110 184,933 49,504 $4.21 $2.98 $0 $0 $926,091 $0 $40,800 $220,371 $14,851 $10,396 $10,891 $297,309 $628,782 $2,192,742
12 2025 591 692,484 234,437 45 4,110 184,933 49,504 $4.21 $2.98 $0 $0 $926,091 $0 $40,800 $220,371 $14,851 $10,396 $10,891 $297,309 $628,782 $2,787,248
13 2026 606 709,839 234,437 45 4,110 184,933 49,504 $4.21 $2.98 $0 $0 $926,091 $0 $40,800 $220,371 $14,851 $10,396 $10,891 $297,309 $628,782 $3,378,984
14 2027 621 727,892 234,437 45 4,110 184,933 49,504 $4.21 $2.98 $0 $0 $926,091 $0 $40,800 $220,371 $14,851 $10,396 $10,891 $297,309 $628,782 $3,967,962
15 2028 1009 1,182,737 234,437 45 4,110 184,933 49,504 $4.21 $2.98 $0 $0 $926,091 $0 $40,800 $220,371 $14,851 $10,396 $10,891 $297,309 $628,782 $4,554,196
Notes:
13. The transportation O&M cost includes transport of CNG from CLL to the city station and is assumed to be 10% of the retail value of bio-CNG at $2.98/DGE which is approximately $0.30/DGE. The O&M assumes all volume greater than that consumed at CLL (184,933 DGE/year) will be transported to the city station (49,504 DGE/year).
10. Cost of conversion to CNG vehicle is assumed at $15,000 per vehicle.11. The federal excise tax is 0.184/GGE (0.21/DGE). Information available at: http://www.api.org/oil-and-natural-gas-overview/industry-economics/~/media/files/statistics/gasoline-diesel-summary.ashxConversion info: Diesel at 128,400 BTU/gal; Gasoline at 112,000 BTU/gal. Use 1.145 (128,400/112,000) to convert GGE to DGE.
12. State Road/Excise Tax the state of Arizona is $0.19/GGE ($0.22/DGE). State Gasoline tax information is available at: http://taxfoundation.org/article/state-gasoline-tax-rates-january-1-2012Conversion info: Diesel at 128,400 BTU/gal; Gasoline at 112,000 BTU/gal. Use 1.145 (128,400/112,000) to convert GGE to DGE.
9. O&M costs for the bio-CNG facility are based on estimates provided by Cornerstone Environmental Group.
8. Potential Annual BioCNG Production from Landfill if all available LFG is utilized.
7. O&M costs for the gas collection system are based on Geosyntec's experience with similar projects.
Inflation-Adjusted Discount Rate(6) =
Current Price of CNG Fuel(4)=
1. The cost of the gas collection system is based on actual bid information from a similar construction project located in Florida and constructed in 2010. This scenario assumes that the GCCS will be installed to cover only half the total acreage of Cells A through C and the capital cost of a half-size GCCS will be about 75% of the cost of a full-size GCCS.
3. "Soft" capital costs include costs for engineering design, permitting, and construction quality assurance related to the gas collection system. The cost is assumed to be equal to 10% of the construction cost.
6. The inflation-adjusted discount rate accounts for the cumulative effects of the general inflation rate and the cost of borrowing capital.
4. The cost of diesel fuel is based on the U.S. Energy Information Administration data released on October 1, 2012 for the "West Coast less California" region (PADD5). Site link: http://www.eia.gov/dnav/pet/pet_pri_gnd_dcus_r50_w.htmThe cost of CNG fuel is based on average retail cost in Arizona area. When Client uses CNG, revenue is realized at a rate of $4.21/DGE. When CNG is sold to end-user, revenue is realized at a market retail rate of $2.98/DGE.
REVENUES COSTS
2. Turnkey cost estimate for bio-CNG facility is based on estimates provided by Cornerstone Environmental Group (see Appendix E and F).
FUEL PRODUCTION
5. The inflation rate estimate was estimated based on the CPI from the Bureau of Labor Statistics from 1991 to 2012.
SUMMARY
Project Data
Discount Rate
Current Price of Diesel Fuel(4) =
Table 2: Economic Evaluation of Landfill Gas-to-Energy ProjectBio-CNG for On-Site Production (One 200 scfm Unit – City-Use and Sale to Third-Parties)
Cinder Lake LandfillFlagstaff, Arizona
Design LFG Methane Content =
Gas Collection System(1) = Capital Costs
Price Information
Initial Capital Costs for BioCNG(2) = Initial Capital Costs - Hard =
Total Capital Costs - Soft(3) =
Initial Capital Cost =
WG1651 6/21/2013

Geosyntec Consultants
50%
$2,510,854$3,178,000$5,688,854 $251,085
Cost of Conversion to CNG Vehicle (10) = $6,105,000$12,044,939
$4.21$2.98
Cost of Capital = 3.0%Inflation Rate(5) = 2.5%
0.47% 15-year IRR = 7.4%
ProjectYear
Calendar Year
Potential Gas Production Rate
(scfm)
Potential Annual CNG Production
Rate (DGE)(8)
BioCNG Design DGE/year
Number of CNG Vehicles
Average Diesel Usage per
Vehicle (DGE/year)
Annual BioCNG
Consumption by Client
(DGE)
Annual BioCNG Sales to End-User
(DGE)
Price of Diesel Fuel
($/DGE)(4)
Price of CNG
($/DGE)(4)
Savings from Grant or Tax
Credits($)
RIN Value Savings($/DGE)
Likely Savings from
RIN Value
Revenue from BioCNG Sales
($)
Capital Costs($)
GCCS O&M
Cost(7)
($)
BioCNG O&M
Cost(9)
($)
Transportation
O&M Cost(13)
($)
Federal
Excise Tax(11)
($)
State Road/
Excise Tax(12)
($)
Total Costs ($)
(Revenues - Costs)($)
Net Present Value($)
0 2013 --- --- --- --- --- --- --- --- --- --- --- $12,044,939 --- --- --- --- --- $12,044,939 -$12,044,939 -$12,044,939
1 2014 463 543,181 468,875 407 938 381,765 87,110 $4.21 $2.98 $75,000 $0.60 $282,201 $2,224,019 $0 $40,800 $440,742 $85,182 $18,293 $19,164 $604,182 $1,619,836 -$10,432,652
2 2015 473 553,859 468,875 407 938 381,765 87,110 $4.21 $2.98 $0 $0.60 $282,201 $2,149,019 $0 $40,800 $440,742 $85,182 $18,293 $19,164 $604,182 $1,544,836 -$8,902,180
3 2016 482 565,077 468,875 407 938 381,765 87,110 $4.21 $2.98 $0 $0.60 $282,201 $2,149,019 $0 $40,800 $440,742 $85,182 $18,293 $19,164 $604,182 $1,544,836 -$7,378,841
4 2017 492 576,847 468,875 407 938 381,765 87,110 $4.21 $2.98 $0 $0 $1,866,817 $0 $40,800 $440,742 $85,182 $18,293 $19,164 $604,182 $1,262,635 -$6,139,578
5 2018 503 589,183 468,875 407 938 381,765 87,110 $4.21 $2.98 $0 $0 $1,866,817 $0 $40,800 $440,742 $85,182 $18,293 $19,164 $604,182 $1,262,635 -$4,906,091
6 2019 514 602,096 468,875 407 938 381,765 87,110 $4.21 $2.98 $0 $0 $1,866,817 $0 $40,800 $440,742 $85,182 $18,293 $19,164 $604,182 $1,262,635 -$3,678,352
7 2020 525 615,601 468,875 407 938 381,765 87,110 $4.21 $2.98 $0 $0 $1,866,817 $0 $40,800 $440,742 $85,182 $18,293 $19,164 $604,182 $1,262,635 -$2,456,334
8 2021 537 629,710 468,875 407 938 381,765 87,110 $4.21 $2.98 $0 $0 $1,866,817 $0 $40,800 $440,742 $85,182 $18,293 $19,164 $604,182 $1,262,635 -$1,240,011
9 2022 550 644,438 468,875 407 938 381,765 87,110 $4.21 $2.98 $0 $0 $1,866,817 $0 $40,800 $440,742 $85,182 $18,293 $19,164 $604,182 $1,262,635 -$29,356
10 2023 563 659,799 468,875 407 938 381,765 87,110 $4.21 $2.98 $0 $0 $1,866,817 $0 $40,800 $440,742 $85,182 $18,293 $19,164 $604,182 $1,262,635 $1,175,656
11 2024 577 675,809 468,875 407 938 381,765 87,110 $4.21 $2.98 $0 $0 $1,866,817 $0 $40,800 $440,742 $85,182 $18,293 $19,164 $604,182 $1,262,635 $2,375,053
12 2025 591 692,484 468,875 407 938 381,765 87,110 $4.21 $2.98 $0 $0 $1,866,817 $0 $40,800 $440,742 $85,182 $18,293 $19,164 $604,182 $1,262,635 $3,568,861
13 2026 606 709,839 468,875 407 938 381,765 87,110 $4.21 $2.98 $0 $0 $1,866,817 $0 $40,800 $440,742 $85,182 $18,293 $19,164 $604,182 $1,262,635 $4,757,105
14 2027 621 727,892 468,875 407 938 381,765 87,110 $4.21 $2.98 $0 $0 $1,866,817 $0 $40,800 $440,742 $85,182 $18,293 $19,164 $604,182 $1,262,635 $5,939,812
15 2028 1009 1,182,737 468,875 407 938 381,765 87,110 $4.21 $2.98 $0 $0 $1,866,817 $0 $40,800 $440,742 $85,182 $18,293 $19,164 $604,182 $1,262,635 $7,117,007
Notes:
13. The transportation O&M cost includes transport of CNG from CLL to the city station and is assumed to be 10% of the retail value of bio-CNG at $2.98/DGE which is approximately $0.30/DGE. The O&M assumes all volume greater than that consumed at CLL (184,933 DGE/year) will be transported to the city station (283,942 DGE/year).
11. The federal excise tax is 0.184/GGE (0.21/DGE). Information available at: http://www.api.org/oil-and-natural-gas-overview/industry-economics/~/media/files/statistics/gasoline-diesel-summary.ashxConversion info: Diesel at 128,400 BTU/gal; Gasoline at 112,000 BTU/gal. Use 1.145 (128,400/112,000) to convert GGE to DGE.
12. State Road/Excise Tax the state of Arizona is $0.19/GGE ($0.22/DGE). State Gasoline tax information is available at: http://taxfoundation.org/article/state-gasoline-tax-rates-january-1-2012Conversion info: Diesel at 128,400 BTU/gal; Gasoline at 112,000 BTU/gal. Use 1.145 (128,400/112,000) to convert GGE to DGE.
COSTS SUMMARY
1. The cost of the gas collection system is based on actual bid information from a similar construction project located in Florida and constructed in 2010.
2. Turnkey cost estimate for bio-CNG facility is based on estimates provided by Cornerstone Environmental Group (see Appendix E and F).
3. "Soft" capital costs include costs for engineering design, permitting, and construction quality assurance related to the gas collection system. The cost is assumed to be equal to 10% of the construction cost.4. The cost of diesel fuel is based on the U.S. Energy Information Administration data released on October 1, 2012 for the "West Coast less California" region (PADD5). Site link: http://www.eia.gov/dnav/pet/pet_pri_gnd_dcus_r50_w.htm. The cost of CNG fuel is based on average retail cost in Arizona area. When Client uses CNG, revenue is realized at a rate of $4.21/DGE. When CNG is sold to end-user, revenue is realized at a market retail rate of $2.98/DGE.
6. The inflation-adjusted discount rate accounts for the cumulative effects of the general inflation rate and the cost of borrowing capital.7. O&M costs for the gas collection system are based on Geosyntec's experience with similar projects.
9. O&M costs for the bio-CNG facility are based on estimates provided by Cornerstone Environmental Group.10. Cost of conversion to CNG vehicle is assumed at $15,000 per vehicle.
8. Potential Annual BioCNG Production from Landfill if all available LFG is utilized.
5. The inflation rate estimate was estimated based on the CPI from the Bureau of Labor Statistics from 1991 to 2012.
Table 2a: Economic Evaluation of Landfill Gas-to-Energy ProjectBio-CNG for On-Site Production (Two 200 scfm Units – City-Use and Sale to Third-Parties)
Cinder Lake LandfillFlagstaff, Arizona
Discount Rate
Inflation-Adjusted Discount Rate (6) =
FUEL PRODUCTION REVENUES
Current Price of CNG Fuel(4) =
Initial Capital Costs for BioCNG(2) =
Project DataDesign LFG Methane Content =
Capital Costs
Gas Collection System(1) =
Initial Capital Costs - Hard =Total Capital Costs - Soft (3) =
Initial Capital Cost =Price Information
Current Price of Diesel Fuel(4) =
WG1651 6/21/2013

Geosyntec Consultants
Bid Item Description Units Unit Price
SCA Purina WWTP SCA Purina WWTP1 Mobilization/Demobilization 1 1 1 LS 22,500.00$ 22,500.00$ 22,500.00$ 22,500.00$ 2 6" DR17 HDPE Pipe Purchase 56,496 43,824 41,184 LF 3.50$ 197,736.00$ 153,384.00$ 144,144.00$ 3 6" DR17 HDPE Elbows & Fittings 27 21 19 EA 200.00$ 5,400.00$ 4,200.00$ 3,800.00$ 4 Freight for HDPE Pipe to Flagstaff 1 1 1 LS 13,200.00$ 13,200.00$ 13,200.00$ 13,200.00$ 5 Butt Fusion Welding of 6" DR17 HDPE Pipe 56,496 43,824 41,184 LF 8.78$ 496,034.88$ 384,774.72$ 361,595.52$ 6 Trenching for HDPE LFG Pipeline 56,496 43,824 41,184 LF 28.00$ 1,581,888.00$ 1,227,072.00$ 1,153,152.00$ 7 Directional Boring to install gas line underneath BSNF alignment 0 300 0 LF 48.50$ -$ 14,550.00$ -$ 8 Rock Excavation 1,994 1,547 1,454 CY 120.00$ 239,280.00$ 185,640.00$ 174,480.00$ 9 Survey, Layout, As-Builts 1 1 1 LS 34,800.00$ 34,800.00$ 34,800.00$ 34,800.00$ 10 Backfill & Compaction 56,496 43,824 41,184 LF 15.00$ 847,440.00$ 657,360.00$ 617,760.00$ 11 Slurry Backfill 2,328 1,806 1,697 CY 94.00$ 218,832.00$ 169,764.00$ 159,518.00$ 12 Pavement Replacement for Trench Patching 1,728 1,340 1,260 SY 141.00$ 243,648.00$ 188,940.00$ 177,660.00$ 13 Traffic Signal Loop Replacements at Signaled Intersections 1 1 1 LS 33,780.00$ 33,780.00$ 33,780.00$ 33,780.00$ 14 Striping 1 1 1 LS 3,500.00$ 3,500.00$ 3,500.00$ 3,500.00$ 15 Quality Control Testing 1 1 1 LS 45,000.00$ 45,000.00$ 45,000.00$ 45,000.00$ 16 Concrete Replacements (Sidewalk, Curb & Gutter, Concrete Drives) 1 1 1 LS 38,100.00$ 38,100.00$ 38,100.00$ 38,100.00$ 17 Landscape Replacement 1 1 1 LS 18,370.00$ 18,370.00$ 18,370.00$ 18,370.00$ 18 Hydroseeding 33 26 24 Acres 3,750.00$ 123,750.00$ 97,500.00$ 90,000.00$ 19 SWPPP Measures 1 1 1 LS 47,500.00$ 47,500.00$ 47,500.00$ 47,500.00$ 20 Dust Control for Project 1 1 1 LS 80,375.00$ 80,375.00$ 80,375.00$ 80,375.00$ 21 Project Signage 1 1 1 LS 3,000.00$ 3,000.00$ 3,000.00$ 3,000.00$ 22 Traffic Control 1 1 1 LS 55,000.00$ 55,000.00$ 55,000.00$ 55,000.00$ 23 Compressor 1 1 1 LS 250,000.00$ 250,000.00$ 250,000.00$ 250,000.00$ 24 Easements 1 1 1 LS 200,000.00$ 200,000.00$ 200,000.00$ 200,000.00$
Subtotal 4,799,133.88$ 3,928,309.72$ 3,727,234.52$ Bond (1.5%) 71,987.01$ 58,924.65$ 55,908.52$
Insurance (1.25%) 59,989.17$ 49,103.87$ 46,590.43$ Sales Tax 302,825.35$ 247,876.34$ 235,188.50$
Total 5,233,935.41$ 4,284,214.58$ 4,064,921.97$ Excludes: ADOT/Flagstaff Permit FeesEngineering or Engineered DrawingsTree Removals/ReplacementsPlacement of Pipe in I-89 Highway AsphaltCoordination with Businesses and Residents affected by constructionPrevailing Wage RatesInspection Fees
Includes:HDPE Fusion of 6" DR17 LFG PipelineTrenching, Excavation, Backfill & Compaction (Located in I-89 East shoulder behind the curb/sidewalk)Pavement ReplacementConcrete Sidewalk, Drives and C&G ReplacementsLandscape Replacement at business and residential areas.Traffic ControlQC TestingDust ControlSWPPPSurvey/Layout, As-BuiltsHydroseedingProject SignageTraffic Signal Loop Replacement at Road CrossingsStripingFreight cost for HDPE PipeMobilization/DemobilizationEstimated 5300 LF of trenching in asphalt for streets and driveways
Notes: Unit price estimates provided by B&F Contracting, Inc.LS = lump sum; LF = linear feet; EA = each; CY = cubic yard; SY = square yard.Includes Rock Excavation for 1500 CY's. Assumes LFG pipeline is on the shoulder of Cinder Lake Landfill Rd.
Quantity Amount
Table 3: LFG Pipeline Installation Cost Estimate for Direct Use OptionsLandfill Gas to Energy Feasibility Study
Cinder Lake LandfillFlagstaff, Arizona
WG1651 4/17/2013

Geosyntec Consultants
50%95%
$2,510,854$5,233,935$7,744,789$512,782$8,257,572
$7.6360%
Cost of Capital = 3.00%Inflation Rate(5)= 2.52%
0.47% 15-year IRR = 0.9%
ProjectYear
Calendar YearDesign Gas
Collection Rate(scfm)
Heat Flow (MMBTU/hr)
Price per MMBTU(4)
($)Revenue
($)Capital Costs
($)
GCCS O&M
Cost(7)
($)
Pipeline O&M
Cost(8)
($)
(Revenues - Costs)($)
Net Present Value($)
0 2013 --- --- --- --- $8,257,572 --- --- -$8,257,572 -$8,257,572
1 2014 463 13 $4.58 $529,630.28 $0 $40,800 $10,000 $478,830 -$7,780,973
2 2015 473 13 $4.58 $540,041 $0 $40,800 $10,000 $489,241 -$7,296,281
3 2016 482 14 $4.58 $550,979 $0 $40,800 $10,000 $500,179 -$6,803,062
4 2017 492 14 $4.58 $562,456 $0 $40,800 $10,000 $511,656 -$6,300,877
5 2018 503 14 $4.58 $574,484 $0 $40,800 $10,000 $523,684 -$5,789,282
6 2019 514 15 $4.58 $587,076 $0 $40,800 $10,000 $536,276 -$5,267,827
7 2020 525 15 $4.58 $600,243 $0 $40,800 $10,000 $549,443 -$4,736,059
8 2021 537 15 $4.58 $614,000 $0 $40,800 $10,000 $563,200 -$4,193,517
9 2022 550 16 $4.58 $628,360 $0 $40,800 $10,000 $577,560 -$3,639,734
10 2023 563 16 $4.58 $643,339 $0 $40,800 $10,000 $592,539 -$3,074,237
11 2024 577 16 $4.58 $658,949 $0 $40,800 $10,000 $608,149 -$2,496,546
12 2025 591 17 $4.58 $675,208 $0 $40,800 $10,000 $624,408 -$1,906,175
13 2026 606 17 $4.58 $692,130 $0 $40,800 $10,000 $641,330 -$1,302,630
14 2027 621 18 $4.58 $709,733 $0 $40,800 $10,000 $658,933 -$685,410
15 2028 1009 29 $4.58 $1,153,230 $0 $40,800 $10,000 $1,102,430 $342,421
Notes:
Current Price per MMBTU from Natural Gas(4) =Percentage of per MMBTU Cost from NG(4) =
Inflation-adjusted discount rate(6) =
Discount Rate
COSTS
Price Information
Gas Collection System(1) = Pipeline Installation(2) =
Initial Capital Costs - Hard =Total Capital Costs - Soft(3) =
Initial Capital Cost =
Table 4: Economic Evaluation of Landfill Gas-to-Energy ProjectDirect Use of LFG at SCA Paper
Cinder Lake LandfillFlagstaff, Arizona
Project DataDesign LFG Methane Content =
Annual Capacity Factor =Capital Costs
3. "Soft" capital costs include costs for engineering design, permitting, and construction quality assurance related to the gas collection system and the pipeline. The cost is assumed to be equal to 10% of the construction cost of the GCCS and 5% of the construction cost of the pipeline.4. The cost per MMBTU from natural gas is based on average 2011 cost provided by Nestle Purina. The revenue estimate is based on the assumption that SCA will purchase the LFG at a rate equal to 60% of their current cost per MMBTU.
7. O&M costs for the gas collection system and pipeline are based on Geosyntec's experience with similar projects.8. Pipeline O&M costs are based on Geosyntec's experience with similar projects.
HEAT FLOW DATA
5. The inflation rate estimate was estimated based on the CPI from the Bureau of Labor Statistics from 1991 to 2012.6. The inflation-adjusted discount rate accounts for the cumulative effects of the general inflation rate and the cost of borrowing capital.
REVENUES SUMMARY
1. The cost of the gas collection system is based on actual bid information from a similar construction project locted in Florida and constructed in 2010.2. Cost information for the pipeline installation are provided in Table 3.
WG1651 4/17/2013
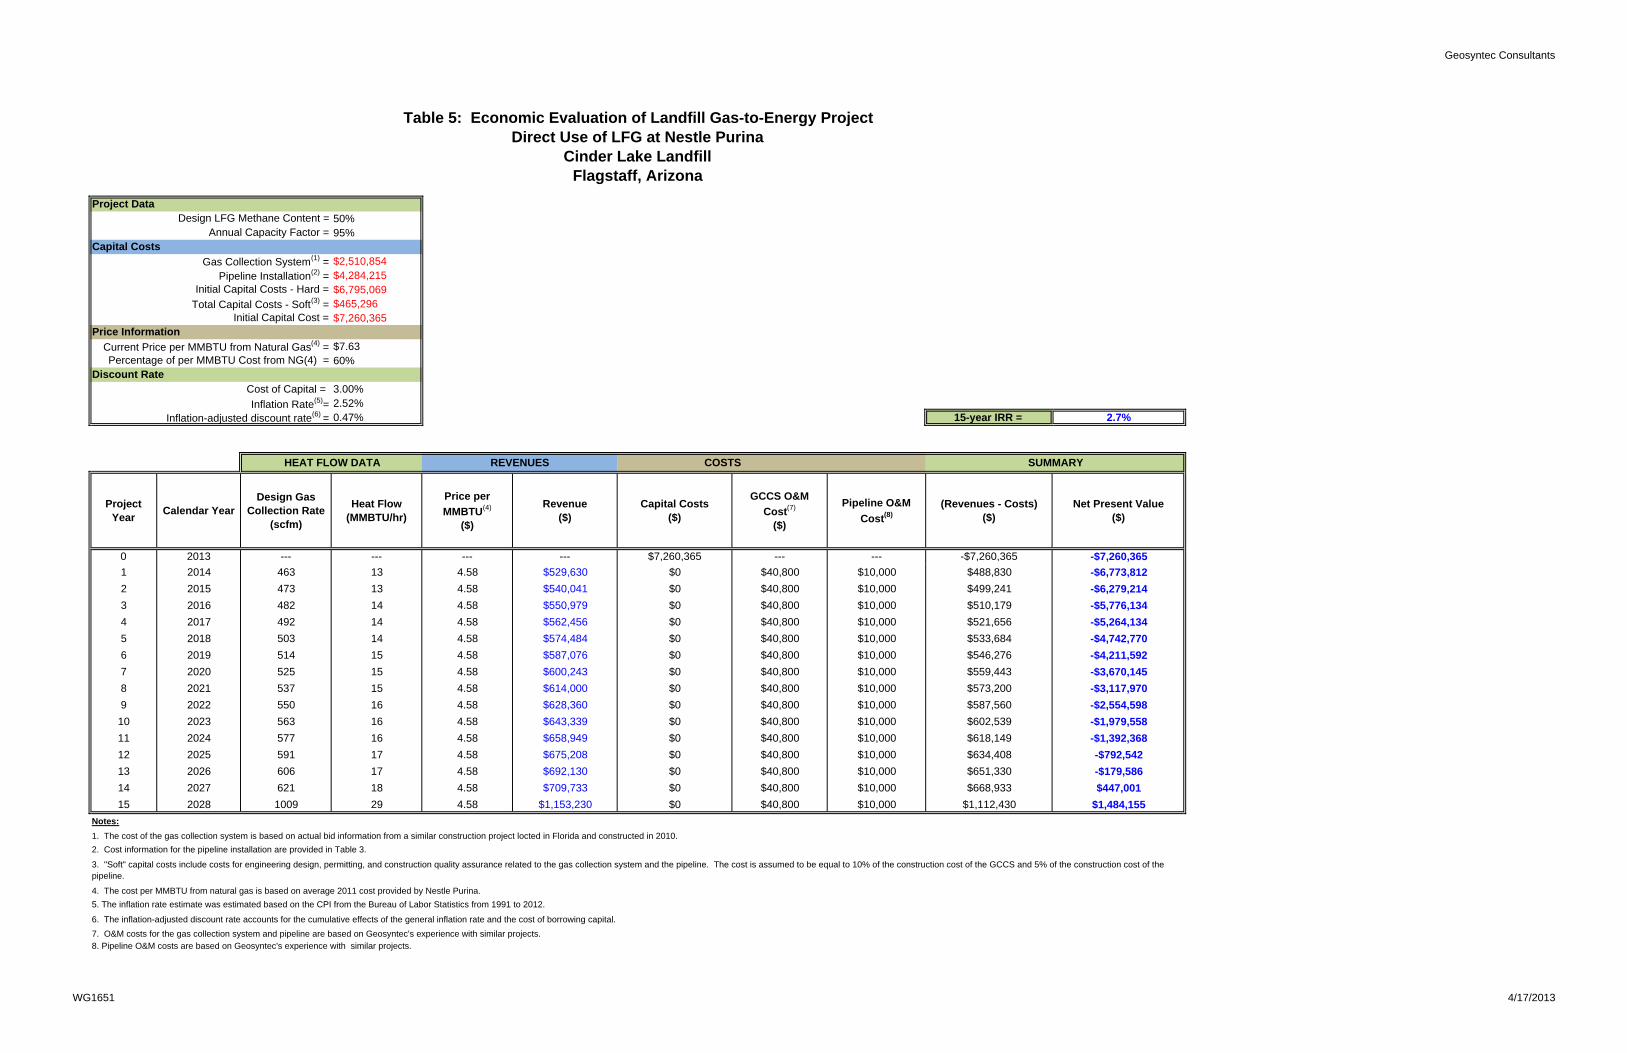
Geosyntec Consultants
50%95%
$2,510,854$4,284,215$6,795,069$465,296$7,260,365
$7.6360%
Cost of Capital = 3.00%Inflation Rate(5)= 2.52%
0.47% 15-year IRR = 2.7%
ProjectYear
Calendar YearDesign Gas
Collection Rate(scfm)
Heat Flow (MMBTU/hr)
Price per
MMBTU(4)
($)
Revenue ($)
Capital Costs($)
GCCS O&M
Cost(7)
($)
Pipeline O&M
Cost(8)(Revenues - Costs)
($)Net Present Value
($)
0 2013 --- --- --- --- $7,260,365 --- --- -$7,260,365 -$7,260,365
1 2014 463 13 4.58 $529,630 $0 $40,800 $10,000 $488,830 -$6,773,812
2 2015 473 13 4.58 $540,041 $0 $40,800 $10,000 $499,241 -$6,279,214
3 2016 482 14 4.58 $550,979 $0 $40,800 $10,000 $510,179 -$5,776,134
4 2017 492 14 4.58 $562,456 $0 $40,800 $10,000 $521,656 -$5,264,134
5 2018 503 14 4.58 $574,484 $0 $40,800 $10,000 $533,684 -$4,742,770
6 2019 514 15 4.58 $587,076 $0 $40,800 $10,000 $546,276 -$4,211,592
7 2020 525 15 4.58 $600,243 $0 $40,800 $10,000 $559,443 -$3,670,145
8 2021 537 15 4.58 $614,000 $0 $40,800 $10,000 $573,200 -$3,117,970
9 2022 550 16 4.58 $628,360 $0 $40,800 $10,000 $587,560 -$2,554,598
10 2023 563 16 4.58 $643,339 $0 $40,800 $10,000 $602,539 -$1,979,558
11 2024 577 16 4.58 $658,949 $0 $40,800 $10,000 $618,149 -$1,392,368
12 2025 591 17 4.58 $675,208 $0 $40,800 $10,000 $634,408 -$792,542
13 2026 606 17 4.58 $692,130 $0 $40,800 $10,000 $651,330 -$179,586
14 2027 621 18 4.58 $709,733 $0 $40,800 $10,000 $668,933 $447,001
15 2028 1009 29 4.58 $1,153,230 $0 $40,800 $10,000 $1,112,430 $1,484,155
Notes:
Price Information
Current Price per MMBTU from Natural Gas(4) =
Table 5: Economic Evaluation of Landfill Gas-to-Energy ProjectDirect Use of LFG at Nestle Purina
Cinder Lake LandfillFlagstaff, Arizona
Project DataDesign LFG Methane Content =
Annual Capacity Factor =Capital Costs
Gas Collection System(1) = Pipeline Installation(2) =
Initial Capital Costs - Hard =Total Capital Costs - Soft(3) =
Initial Capital Cost =
Percentage of per MMBTU Cost from NG(4) =Discount Rate
Inflation-adjusted discount rate(6) =
HEAT FLOW DATA REVENUES
7. O&M costs for the gas collection system and pipeline are based on Geosyntec's experience with similar projects.8. Pipeline O&M costs are based on Geosyntec's experience with similar projects.
COSTS SUMMARY
1. The cost of the gas collection system is based on actual bid information from a similar construction project locted in Florida and constructed in 2010.2. Cost information for the pipeline installation are provided in Table 3.
3. "Soft" capital costs include costs for engineering design, permitting, and construction quality assurance related to the gas collection system and the pipeline. The cost is assumed to be equal to 10% of the construction cost of the GCCS and 5% of the construction cost of the pipeline.
4. The cost per MMBTU from natural gas is based on average 2011 cost provided by Nestle Purina.
6. The inflation-adjusted discount rate accounts for the cumulative effects of the general inflation rate and the cost of borrowing capital.
5. The inflation rate estimate was estimated based on the CPI from the Bureau of Labor Statistics from 1991 to 2012.
WG1651 4/17/2013

Geosyntec Consultants
50%95%
$2,510,854$4,064,922$6,575,776$454,331$7,030,107
$7.63
Cost of Capital = 3.00%Inflation Rate(5)= 2.52%
0.47% 15-year IRR = 10.7%
ProjectYear
Calendar YearDesign Gas
Collection Rate(scfm)
Heat Flow (MMBTU/hr)
Price per
MMBTU(4)
($)
Revenue ($)
Capital Costs($)
GCCS O&M Cost(7)
($)
Pipeline O&M
Cost(8)
($)
(Revenues - Costs)($)
Net Present Value($)
0 2013 --- --- --- 0 $7,030,107.47 --- --- -$7,030,107 -$7,030,107
1 2014 463 13 7.63 $882,717 $0 $40,800 $10,000 $831,917 -$6,202,067
2 2015 473 13 7.63 $900,069 $0 $40,800 $10,000 $849,269 -$5,360,696
3 2016 482 14 7.63 $918,299 $0 $40,800 $10,000 $867,499 -$4,505,269
4 2017 492 14 7.63 $937,427 $0 $40,800 $10,000 $886,627 -$3,635,054
5 2018 503 14 7.63 $957,474 $0 $40,800 $10,000 $906,674 -$2,749,310
6 2019 514 15 7.63 $978,459 $0 $40,800 $10,000 $927,659 -$1,847,289
7 2020 525 15 7.63 $1,000,405 $0 $40,800 $10,000 $949,605 -$928,232
8 2021 537 15 7.63 $1,023,333 $0 $40,800 $10,000 $972,533 $8,630
9 2022 550 16 7.63 $1,047,267 $0 $40,800 $10,000 $996,467 $964,074
10 2023 563 16 7.63 $1,072,231 $0 $40,800 $10,000 $1,021,431 $1,938,890
11 2024 577 16 7.63 $1,098,249 $0 $40,800 $10,000 $1,047,449 $2,933,879
12 2025 591 17 7.63 $1,125,346 $0 $40,800 $10,000 $1,074,546 $3,949,850
13 2026 606 17 7.63 $1,153,550 $0 $40,800 $10,000 $1,102,750 $4,987,630
14 2027 621 18 7.63 $1,182,888 $0 $40,800 $10,000 $1,132,088 $6,048,054
15(9) 2028 1009 29 7.63 $1,922,050 $0 $40,800 $10,000 $1,871,250 $7,792,680Notes:
7. O&M costs for the gas collection system and pipeline are based on Geosyntec's experience with similar projects.
9. Based on estimates of energy required for drying of sludge, provided by the WWTP, the maximum energy demand is assumed to be equal to 22.9 MMBTU/hr. Therefore, revenues for year 15 are recognized only for sale of 22.9 MMBTU per hour.
1. The cost of the gas collection system is based on actual bid information from a similar construction project locted in Florida and constructed in 2010.2. Cost information for the pipeline installation are provided in Table 3.
3. "Soft" capital costs include costs for engineering design, permitting, and construction quality assurance related to the gas collection system and the pipeline. The cost is assumed to be equal to 10% of the construction cost of the GCCS and 5% of the construction cost of the pipeline.
4. The cost per MMBTU from natural gas is based on average 2011 cost provided by Nestle Purina.
8. Pipeline O&M costs are based on Geosyntec's experience with similar projects.
6. The inflation-adjusted discount rate accounts for the cumulative effects of the general inflation rate and the cost of borrowing capital.5. The inflation rate estimate was estimated based on the CPI from the Bureau of Labor Statistics from 1991 to 2012.
HEAT FLOW DATA REVENUES COSTS SUMMARY
Discount Rate
Inflation-adjusted discount rate(6) =
Current Price per MMBTU from Natural Gas(4) =
Table 6: Economic Evaluation of Landfill Gas-to-Energy ProjectDirect Use of LFG at the Wildcat Wastewater Treatment Plant
Cinder Lake LandfillFlagstaff, Arizona
Project DataDesign LFG Methane Content =
Annual Capacity Factor =Capital Costs
Gas Collection System(1) = Pipeline Installation(2) =
Initial Capital Costs - Hard =Total Capital Costs - Soft(3) =
Initial Capital Cost =Price Information
WG1651 4/17/2013

Geosyntec Consultants
On-site bio-CNG (200 scfm system) $5,027,455 $4,554,196 10.6% 7.4On-site bio-CNG (400 scfm system) $12,044,939 $7,117,007 7.4% 9.0
SCA Tissue $8,257,572 $342,421 0.9% 14.7Nestle Purina $7,260,365 $1,484,155 2.7% 13.3
Wildcat WWTP $7,030,107 $7,792,680 10.7% 8.0
Table 7: Comparison of LFGTE OptionsLandfill Gas to Energy Feasibility Study
Cinder Lake LandfillFlagstaff, Arizona
LFGTE OptionInitial Capital Cost
($)15-year NPV
($)15-year IRR
(%)Payback Period
(years)
WG1651 6/21/2013

FIGURES


APadovani
Text Box
WG1651
APadovani
Text Box
APadovani
Text Box
Figure 2
APadovani
Text Box
Site Plan with Proposed Site Development and Fill Sequencing Plan (Provided by City of Flagstaff)

Geosyntec Consultants
WG1651 4/15/2013
-
200.00
400.00
600.00
800.00
1,000.00
1,200.00
1,400.00
1,600.00
1,800.00
1960 1980 2000 2020 2040 2060 2080 2100 2120
Land
fill G
as G
ener
atio
n Ra
te (s
cfm
)
Year
Figure 3: Landfill Gas Generation and Collection CurveCinder Lake Landfill
Flagstaff, Arizona
Total Landfill Gas Generation
Methane Generation
Feasibility Study Period

0
200
400
600
800
1,000
1,200
1,400
1,600
2010 2015 2020 2025 2030
Land
fill G
as G
ener
atio
n/Co
llect
ion
Rate
(sta
ndar
d cu
bic f
eet p
er m
inut
e)
Figure 4: LFG Generation and Collection ProjectionsCinder Lake Landfill
Flagstaff, Arizona
Total LFG Generation Rate
LFG Collection Rate
Lower Bound Collection Rate (40% for all areas)
Year
Feasibility Study Period
Increase in Gas Collection Efficiency Corresponds with
Closure of Cells A, B, and C in 2028


APPENDIX A

Written by: Wade Tyner Date: 04.13.2013
Approved by: Jeremy Morris Date: 04.13.2013
Client: Flagstaff Project: Cinder Lake Landfill Project No.: WG1651 Task No.: 3
WG1651/Appendix A - LFG Generation.doc Page 1
APPENDIX A
LANDFILL GAS GENERATION ESTIMATE LANDFILL GAS TO ENERGY FEASIBILITY STUDY
CINDER LAKE LANDFILL FLAGSTAFF, ARIZONA
INTRODUCTION The LFG generation potential for the landfill was estimated using the U.S. EPA’s Landfill Gas Emissions Model (LandGEM), as coded into an Excel® spreadsheet (U.S. EPA, 2005). The Landfill Air Emissions Estimation Model is described by the following equation:
Vi = Σ k L0 Mi exp (-kti) where:
Vi = volume of methane generated in year i (cubic feet, cf)
k = waste degradation decay constant (1/year)
L0 = methane generation potential (cf/lb)
Mi = mass of waste placed in year i (lb)
ti = age of waste (years)
The above equation is used to estimate methane generation and not the total landfill gas generation. The total volume of landfill gas generated in a given year is estimated as twice the volume of methane generated in that year (i.e., VLFG = 2 x VMethane). This assumption is valid because landfill gas is typically approximately 50% methane. INPUTS Waste Acceptance Rates Geosyntec assumed the following waste acceptance rates:
• 1965 to 2008: values developed by Woodward-Clyde (1997b) for historic NMOC evaluation and reporting (Table 1, Appendix B); and

Written by: Wade Tyner Date: 04.13.2013
Approved by: Jeremy Morris Date: 04.13.2013
Client: Flagstaff Project: Cinder Lake Landfill Project No.: WG1651 Task No.: 3
WG1651/Appendix A - LFG Generation.doc Page 2
• 2009 through 2055 (the expected closure date for the landfill): values provided by the City which were based on an assumed growth rate of 3% per year (Table 1, Appendix B).
Waste Degradation Rate The waste degradation decay constant (k) influences the estimate of the rate of landfill gas generation. Landfills with high k values tend to have high gas generation rates initially and exponentially lower generation rates as the waste gets older. Conversely, landfills with low k values have lower rates of initial gas production but less significant reductions in the gas production rate over time. An appropriate value of k should be selected by considering several factors, the most important of which are moisture content of the waste and presence of nutrients to accelerate biodegradation. Waste disposed in landfills in regions with relatively low rainfall is expected to have a low k value. The CCL receives an average of 17 inches of precipitation annually, which is considered an arid region under default assumptions for LandGEM. In support of this, moisture content reports for the site range from an average of 20% in the soil (Woodward-Clyde, 1997a) to 30% (R.W. Beck, 2010) in the pulp sludge. Based on these conditions, a k value of 0.02/year was selected based on guidelines from “AP-42, Fifth Edition, Compilation of Air Pollutant Emission Factors, Volume 1: Stationary Point and Area Sources, Section 2.4: Municipal Solid Waste Landfills.” (U.S. EPA, 1995).
Methane Generation Potential The methane generation potential (L0) depends mainly on the amount of organic material available for generating gas due to decomposition in the overall waste stream. Waste streams with high organic content are expected to have high L0 values. In the absence of site-specific data, the waste stream at CLL was assumed to be consistent with typical MSW generated in the United States. Therefore, an L0 value of 100 m3/Mg (1.61 ft3/lb) was selected, again based on guidance from U.S. EPA (1995). RESULTS The output of the gas generation model is provided in Attachment 1.
Written by: Wade Tyner Date: 04.13.2013
Approved by: Jeremy Morris Date: 04.13.2013
Client: Flagstaff Project: Cinder Lake Landfill Project No.: WG1651 Task No.: 3
WG1651/Appendix A - LFG Generation.doc Page 3
REFERENCES
U.S. Environmental Protection Agency (1995) AP-42, Fifth Edition, Compilation of Air Pollutant Emission Factors, Volume 1: Stationary Point and Area Sources, Section 2.4: Municipal Solid Waste Landfills, Office of Air Quality Planning and Standards, Research Triangle Park, NC, January 1995, Supplement E (November 1998), update in review (October 2008).
U.S. Environmental Protection Agency (2005) LandGEM – Landfill Gas Emissions Model,
Version 3.02, May 2005.
Woodward-Clyde Consultants (1997b) Initial Design Capacity Report and Non-Methane
Organic Compounds (NMOC) Emission Rate Analysis for the Cinder Lake Landfill, Flagstaff, Arizona, June 1997.

Written by: Wade Tyner Date: 04.13.2013
Approved by: Jeremy Morris Date: 04.13.2013
Client: Flagstaff Project: Cinder Lake Landfill Project No.: WG1651 Task No.: 3
WG1651/Appendix A - LFG Generation.doc Page 4
ATTACHMENT 1
LANDGEM MODEL REPORT

landgem-v302 (Cinder Lake Landfill)_RTC.xls 4/3/2013
Summary Report
Landfill Name or Identifier: Cinder Lake Landfill, Flagstaff, Arizona
Date:
First-Order Decomposition Rate Equation:
Where,QCH4 = annual methane generation in the year of the calculation (m 3 /year )i = 1-year time increment Mi = mass of waste accepted in the ith year (Mg ) n = (year of the calculation) - (initial year of waste acceptance)j = 0.1-year time incrementk = methane generation rate (year -1 )Lo = potential methane generation capacity (m 3 /Mg )
tij = age of the jth section of waste mass Mi accepted in the ith year (decimal years , e.g., 3.2 years)
LandGEM is considered a screening tool — the better the input data, the better the estimates. Often, there are limitations with the available data regarding waste quantity and composition, variation in design and operating practices over time, and changes occurring over time that impact the emissions potential. Changes to landfill operation, such as operating under wet conditions through leachate recirculation or other liquid additions, will result in generating more gas at a faster rate. Defaults for estimating emissions for this type of operation are being developed to include in LandGEM along with defaults for convential landfills (no leachate or liquid additions) for developing emission inventories and determining CAA applicability. Refer to the Web site identified above for future updates.
Wednesday, April 03, 2013
LandGEM is based on a first-order decomposition rate equation for quantifying emissions from the decomposition of landfilled waste in municipal solid waste (MSW) landfills. The software provides a relatively simple approach to estimating landfill gas emissions. Model defaults are based on empirical data from U.S. landfills. Field test data can also be used in place of model defaults when available. Further guidance on EPA test methods, Clean Air Act (CAA) regulations, and other guidance regarding landfill gas emissions and control technology requirements can be found at http://www.epa.gov/ttnatw01/landfill/landflpg.html.
Description/Comments:Tonnages from 1965 to 2009 taken from Woodward & Clyde's table of "Estimated In-Place MSW". Tonnage for 2010 taken from Beck's estimate (120,000). Values from 2011 to 2044 taken from the City's estimate table (Table 2, Estimate of Landfill Life for Cells A through E), which assumes a 3% growth rate. Only 30% of the total pulp tonnage was accounted for in this model. Values assumed to be Disposal Tonnage minus 70% of the pulp sludge tonnage.
About LandGEM:
REPORT - 1

landgem-v302 (Cinder Lake Landfill)_RTC.xls 4/3/2013
Input Review
LANDFILL CHARACTERISTICSLandfill Open Year 1965Landfill Closure Year (with 80-year limit) 2044Actual Closure Year (without limit) 2054Have Model Calculate Closure Year? NoWaste Design Capacity short tons
MODEL PARAMETERSMethane Generation Rate, k 0.020 year -1
Potential Methane Generation Capacity, Lo 100 m 3 /MgNMOC Concentration 4,000 ppmv as hexaneMethane Content 50 % by volume
GASES / POLLUTANTS SELECTEDGas / Pollutant #1: Total landfill gasGas / Pollutant #2: MethaneGas / Pollutant #3: Hydrogen sulfideGas / Pollutant #4: NMOC
WASTE ACCEPTANCE RATES
(Mg/year) (short tons/year) (Mg) (short tons)1965 12,976 14,274 0 01966 15,781 17,359 12,976 14,2741967 18,626 20,489 28,757 31,6331968 21,515 23,666 47,384 52,1221969 24,447 26,892 68,898 75,7881970 27,425 30,168 93,345 102,6801971 30,165 33,182 120,771 132,8481972 32,936 36,230 150,936 166,0301973 35,739 39,313 183,873 202,2601974 38,575 42,432 219,612 241,5731975 41,443 45,587 258,186 284,0051976 47,115 51,826 299,629 329,5921977 52,821 58,103 346,744 381,4181978 58,564 64,420 399,565 439,5211979 64,345 70,779 458,128 503,9411980 70,187 77,206 522,473 574,7201981 76,007 83,608 592,660 651,9261982 81,865 90,052 668,667 735,5341983 87,764 96,540 750,533 825,5861984 93,703 103,073 838,296 922,1261985 102,006 112,207 931,999 1,025,1991986 134,135 147,549 1,034,005 1,137,4061987 102,182 112,400 1,168,141 1,284,9551988 105,853 116,438 1,270,323 1,397,3551989 107,013 117,714 1,376,175 1,513,7931990 116,026 127,629 1,483,188 1,631,5071991 135,455 149,000 1,599,215 1,759,1361992 155,407 170,948 1,734,669 1,908,1361993 69,014 75,915 1,890,076 2,079,0841994 114,222 125,644 1,959,090 2,154,9991995 108,284 119,112 2,073,312 2,280,6431996 135,665 149,232 2,181,595 2,399,7551997 120,230 132,253 2,317,261 2,548,9871998 126,797 139,477 2,437,491 2,681,2401999 108,289 119,118 2,564,288 2,820,7172000 87,466 96,213 2,672,577 2,939,8352001 80,410 88,451 2,760,043 3,036,0472002 95,696 105,266 2,840,453 3,124,4982003 87,723 96,496 2,936,149 3,229,7642004 102,712 112,983 3,023,872 3,326,260
YearWaste Accepted Waste-In-Place
Landfill Closure Year entered exceeds the 80-year waste acceptance limit. See Section 2.6 of the User's Manual.
REPORT - 2

landgem-v302 (Cinder Lake Landfill)_RTC.xls 4/3/2013
WASTE ACCEPTANCE RATES (Continued)
(Mg/year) (short tons/year) (Mg) (short tons)2005 118,003 129,804 3,126,584 3,439,2422006 118,954 130,850 3,244,587 3,569,0462007 123,658 136,024 3,363,541 3,699,8962008 121,896 134,086 3,487,199 3,835,9192009 96,005 105,606 3,609,095 3,970,0052010 103,434 113,778 3,705,101 4,075,6112011 103,053 113,359 3,808,535 4,189,3882012 106,728 117,401 3,911,588 4,302,7472013 110,513 121,565 4,018,316 4,420,1482014 114,412 125,853 4,128,830 4,541,7132015 118,427 130,270 4,243,242 4,667,5662016 122,563 134,820 4,361,669 4,797,8362017 126,824 139,506 4,484,232 4,932,6562018 131,211 144,333 4,611,056 5,072,1612019 135,731 149,304 4,742,267 5,216,4942020 140,386 154,425 4,877,998 5,365,7982021 145,181 159,699 5,018,384 5,520,2232022 150,120 165,132 5,163,565 5,679,9222023 155,206 170,727 5,313,685 5,845,0532024 160,446 176,490 5,468,891 6,015,7802025 165,842 182,427 5,629,337 6,192,2712026 171,401 188,541 5,795,179 6,374,6972027 177,126 194,839 5,966,580 6,563,2382028 183,023 201,325 6,143,706 6,758,0772029 189,097 208,007 6,326,729 6,959,4022030 195,353 214,888 6,515,826 7,167,4092031 201,797 221,977 6,711,179 7,382,2972032 208,434 229,277 6,912,976 7,604,2742033 215,270 236,797 7,121,410 7,833,5512034 222,312 244,543 7,336,680 8,070,3482035 229,564 252,520 7,558,992 8,314,8912036 237,034 260,738 7,788,556 8,567,4122037 244,728 269,201 8,025,590 8,828,1492038 252,653 277,919 8,270,319 9,097,3502039 260,816 286,898 8,522,972 9,375,2692040 269,224 296,146 8,783,788 9,662,1672041 277,884 305,672 9,053,012 9,958,3142042 286,804 315,484 9,330,896 10,263,9862043 295,991 325,590 9,617,700 10,579,4702044 305,454 335,999 9,913,691 10,905,060
YearWaste Accepted Waste-In-Place
REPORT - 3

landgem-v302 (Cinder Lake Landfill)_RTC.xls 4/3/2013
Pollutant Parameters
Concentration ConcentrationCompound (ppmv ) Molecular Weight (ppmv ) Molecular Weight
Total landfill gas 0.00Methane 16.04Carbon dioxide 44.01NMOC 4,000 86.181,1,1-Trichloroethane (methyl chloroform) - HAP 0.48 133.411,1,2,2-Tetrachloroethane - HAP/VOC 1.1 167.851,1-Dichloroethane (ethylidene dichloride) - HAP/VOC 2.4 98.971,1-Dichloroethene (vinylidene chloride) - HAP/VOC 0.20 96.941,2-Dichloroethane (ethylene dichloride) - HAP/VOC 0.41 98.961,2-Dichloropropane (propylene dichloride) - HAP/VOC 0.18 112.992-Propanol (isopropyl alcohol) - VOC 50 60.11Acetone 7.0 58.08Acrylonitrile - HAP/VOC 6.3 53.06Benzene - No or Unknown Co-disposal - HAP/VOC 1.9 78.11Benzene - Co-disposal - HAP/VOC 11 78.11Bromodichloromethane - VOC 3.1 163.83Butane - VOC 5.0 58.12Carbon disulfide - HAP/VOC 0.58 76.13Carbon monoxide 140 28.01Carbon tetrachloride - HAP/VOC 4.0E-03 153.84Carbonyl sulfide - HAP/VOC 0.49 60.07Chlorobenzene - HAP/VOC 0.25 112.56Chlorodifluoromethane 1.3 86.47Chloroethane (ethyl chloride) - HAP/VOC 1.3 64.52Chloroform - HAP/VOC 0.03 119.39Chloromethane - VOC 1.2 50.49
Dichlorobenzene - (HAP for para isomer/VOC) 0.21 147Dichlorodifluoromethane 16 120.91Dichlorofluoromethane - VOC 2.6 102.92Dichloromethane (methylene chloride) - HAP 14 84.94Dimethyl sulfide (methyl sulfide) - VOC 7.8 62.13Ethane 890 30.07Ethanol - VOC 27 46.08
Gas / Pollutant Default Parameters:
Po
llu
tan
ts
User-specified Pollutant Parameters:
Gas
es
REPORT - 4

landgem-v302 (Cinder Lake Landfill)_RTC.xls 4/3/2013
Pollutant Parameters (Continued)
Concentration ConcentrationCompound (ppmv ) Molecular Weight (ppmv ) Molecular Weight
Ethyl mercaptan (ethanethiol) - VOC 2.3 62.13Ethylbenzene - HAP/VOC 4.6 106.16Ethylene dibromide - HAP/VOC 1.0E-03 187.88Fluorotrichloromethane - VOC 0.76 137.38Hexane - HAP/VOC 6.6 86.18Hydrogen sulfide 36 34.08Mercury (total) - HAP 2.9E-04 200.61Methyl ethyl ketone - HAP/VOC 7.1 72.11Methyl isobutyl ketone - HAP/VOC 1.9 100.16
Methyl mercaptan - VOC 2.5 48.11Pentane - VOC 3.3 72.15Perchloroethylene (tetrachloroethylene) - HAP 3.7 165.83Propane - VOC 11 44.09t-1,2-Dichloroethene - VOC 2.8 96.94Toluene - No or Unknown Co-disposal - HAP/VOC 39 92.13Toluene - Co-disposal - HAP/VOC 170 92.13Trichloroethylene (trichloroethene) - HAP/VOC 2.8 131.40Vinyl chloride - HAP/VOC 7.3 62.50Xylenes - HAP/VOC 12 106.16
User-specified Pollutant Parameters:Gas / Pollutant Default Parameters:
Po
llu
tan
ts
REPORT - 5

landgem-v302 (Cinder Lake Landfill)_RTC.xls 4/3/2013
Graphs
0.000E+00
5.000E+03
1.000E+04
1.500E+04
2.000E+04
2.500E+04
3.000E+04
Em
issi
on
s
Year
Megagrams Per Year
Total landfill gas Methane Hydrogen sulfide NMOC
0.000E+00
5.000E+06
1.000E+07
1.500E+07
2.000E+07
2.500E+07
Em
issi
on
s
Year
Cubic Meters Per Year
Total landfill gas Methane Hydrogen sulfide NMOC
0.000E+00
2.000E+02
4.000E+02
6.000E+02
8.000E+02
1.000E+03
1.200E+03
1.400E+03
1.600E+03
Em
issi
on
s
Year
User-specified Unit (units shown in legend below)
Total landfill gas (av ft^3/min) Methane (av ft^3/min) Hydrogen sulfide (av ft^3/min) NMOC (av ft^3/min)
REPORT - 6

landgem-v302 (Cinder Lake Landfill)_RTC.xls 4/3/2013
Results
(Mg/year) (m 3 /year) (av ft^3/min) (Mg/year) (m 3 /year) (av ft^3/min)1965 0 0 0 0 0 01966 6.424E+01 5.144E+04 3.456E+00 1.716E+01 2.572E+04 1.728E+001967 1.411E+02 1.130E+05 7.591E+00 3.769E+01 5.649E+04 3.796E+001968 2.305E+02 1.846E+05 1.240E+01 6.157E+01 9.229E+04 6.201E+001969 3.325E+02 2.662E+05 1.789E+01 8.880E+01 1.331E+05 8.944E+001970 4.469E+02 3.579E+05 2.404E+01 1.194E+02 1.789E+05 1.202E+011971 5.738E+02 4.595E+05 3.087E+01 1.533E+02 2.297E+05 1.544E+011972 7.118E+02 5.700E+05 3.830E+01 1.901E+02 2.850E+05 1.915E+011973 8.608E+02 6.893E+05 4.631E+01 2.299E+02 3.446E+05 2.316E+011974 1.021E+03 8.173E+05 5.491E+01 2.726E+02 4.086E+05 2.746E+011975 1.191E+03 9.540E+05 6.410E+01 3.182E+02 4.770E+05 3.205E+011976 1.373E+03 1.099E+06 7.387E+01 3.667E+02 5.497E+05 3.694E+011977 1.579E+03 1.264E+06 8.496E+01 4.218E+02 6.322E+05 4.248E+011978 1.809E+03 1.449E+06 9.734E+01 4.833E+02 7.244E+05 4.867E+011979 2.063E+03 1.652E+06 1.110E+02 5.511E+02 8.261E+05 5.551E+011980 2.341E+03 1.875E+06 1.260E+02 6.253E+02 9.373E+05 6.298E+011981 2.642E+03 2.116E+06 1.422E+02 7.058E+02 1.058E+06 7.108E+011982 2.966E+03 2.375E+06 1.596E+02 7.923E+02 1.188E+06 7.979E+011983 3.313E+03 2.653E+06 1.782E+02 8.849E+02 1.326E+06 8.912E+011984 3.682E+03 2.948E+06 1.981E+02 9.834E+02 1.474E+06 9.904E+011985 4.073E+03 3.261E+06 2.191E+02 1.088E+03 1.631E+06 1.096E+021986 4.497E+03 3.601E+06 2.419E+02 1.201E+03 1.800E+06 1.210E+021987 5.072E+03 4.061E+06 2.729E+02 1.355E+03 2.031E+06 1.364E+021988 5.477E+03 4.386E+06 2.947E+02 1.463E+03 2.193E+06 1.473E+021989 5.893E+03 4.719E+06 3.171E+02 1.574E+03 2.359E+06 1.585E+021990 6.306E+03 5.050E+06 3.393E+02 1.684E+03 2.525E+06 1.696E+021991 6.756E+03 5.410E+06 3.635E+02 1.804E+03 2.705E+06 1.817E+021992 7.292E+03 5.839E+06 3.923E+02 1.948E+03 2.920E+06 1.962E+021993 7.917E+03 6.340E+06 4.260E+02 2.115E+03 3.170E+06 2.130E+021994 8.102E+03 6.488E+06 4.359E+02 2.164E+03 3.244E+06 2.180E+021995 8.507E+03 6.812E+06 4.577E+02 2.272E+03 3.406E+06 2.289E+021996 8.875E+03 7.107E+06 4.775E+02 2.371E+03 3.553E+06 2.387E+021997 9.371E+03 7.504E+06 5.042E+02 2.503E+03 3.752E+06 2.521E+021998 9.780E+03 7.832E+06 5.262E+02 2.612E+03 3.916E+06 2.631E+021999 1.021E+04 8.179E+06 5.496E+02 2.728E+03 4.090E+06 2.748E+022000 1.055E+04 8.447E+06 5.675E+02 2.818E+03 4.223E+06 2.838E+022001 1.077E+04 8.626E+06 5.796E+02 2.877E+03 4.313E+06 2.898E+022002 1.096E+04 8.774E+06 5.895E+02 2.927E+03 4.387E+06 2.948E+022003 1.121E+04 8.980E+06 6.033E+02 2.995E+03 4.490E+06 3.017E+022004 1.143E+04 9.150E+06 6.148E+02 3.052E+03 4.575E+06 3.074E+022005 1.171E+04 9.376E+06 6.299E+02 3.127E+03 4.688E+06 3.150E+022006 1.206E+04 9.658E+06 6.489E+02 3.222E+03 4.829E+06 3.245E+022007 1.241E+04 9.938E+06 6.677E+02 3.315E+03 4.969E+06 3.339E+022008 1.278E+04 1.023E+07 6.875E+02 3.413E+03 5.116E+06 3.437E+022009 1.313E+04 1.051E+07 7.063E+02 3.507E+03 5.256E+06 3.532E+022010 1.334E+04 1.068E+07 7.179E+02 3.564E+03 5.342E+06 3.589E+022011 1.359E+04 1.088E+07 7.312E+02 3.630E+03 5.442E+06 3.656E+022012 1.383E+04 1.108E+07 7.442E+02 3.695E+03 5.538E+06 3.721E+022013 1.409E+04 1.128E+07 7.579E+02 3.763E+03 5.640E+06 3.789E+022014 1.435E+04 1.149E+07 7.723E+02 3.834E+03 5.747E+06 3.862E+02
YearTotal landfill gas Methane
REPORT - 7

landgem-v302 (Cinder Lake Landfill)_RTC.xls 4/3/2013
Results (Continued)
(Mg/year) (m 3 /year) (av ft^3/min) (Mg/year) (m 3 /year) (av ft^3/min)2015 1.464E+04 1.172E+07 7.875E+02 3.910E+03 5.860E+06 3.938E+022016 1.493E+04 1.196E+07 8.035E+02 3.989E+03 5.979E+06 4.017E+022017 1.524E+04 1.221E+07 8.202E+02 4.072E+03 6.104E+06 4.101E+022018 1.557E+04 1.247E+07 8.377E+02 4.159E+03 6.234E+06 4.189E+022019 1.591E+04 1.274E+07 8.561E+02 4.250E+03 6.371E+06 4.280E+022020 1.627E+04 1.303E+07 8.753E+02 4.345E+03 6.514E+06 4.376E+022021 1.664E+04 1.333E+07 8.953E+02 4.445E+03 6.663E+06 4.477E+022022 1.703E+04 1.364E+07 9.163E+02 4.549E+03 6.819E+06 4.581E+022023 1.744E+04 1.396E+07 9.381E+02 4.657E+03 6.981E+06 4.691E+022024 1.786E+04 1.430E+07 9.609E+02 4.771E+03 7.151E+06 4.804E+022025 1.830E+04 1.465E+07 9.846E+02 4.888E+03 7.327E+06 4.923E+022026 1.876E+04 1.502E+07 1.009E+03 5.011E+03 7.511E+06 5.046E+022027 1.924E+04 1.540E+07 1.035E+03 5.138E+03 7.702E+06 5.175E+022028 1.973E+04 1.580E+07 1.062E+03 5.271E+03 7.900E+06 5.308E+022029 2.025E+04 1.621E+07 1.089E+03 5.408E+03 8.107E+06 5.447E+022030 2.078E+04 1.664E+07 1.118E+03 5.551E+03 8.321E+06 5.591E+022031 2.134E+04 1.709E+07 1.148E+03 5.700E+03 8.543E+06 5.740E+022032 2.191E+04 1.755E+07 1.179E+03 5.854E+03 8.774E+06 5.895E+022033 2.251E+04 1.803E+07 1.211E+03 6.013E+03 9.014E+06 6.056E+022034 2.313E+04 1.852E+07 1.245E+03 6.179E+03 9.262E+06 6.223E+022035 2.378E+04 1.904E+07 1.279E+03 6.351E+03 9.519E+06 6.396E+022036 2.444E+04 1.957E+07 1.315E+03 6.528E+03 9.786E+06 6.575E+022037 2.513E+04 2.012E+07 1.352E+03 6.713E+03 1.006E+07 6.760E+022038 2.584E+04 2.069E+07 1.390E+03 6.903E+03 1.035E+07 6.952E+022039 2.658E+04 2.129E+07 1.430E+03 7.101E+03 1.064E+07 7.151E+022040 2.735E+04 2.190E+07 1.471E+03 7.305E+03 1.095E+07 7.357E+022041 2.814E+04 2.253E+07 1.514E+03 7.516E+03 1.127E+07 7.570E+022042 2.896E+04 2.319E+07 1.558E+03 7.735E+03 1.159E+07 7.790E+022043 2.980E+04 2.387E+07 1.604E+03 7.961E+03 1.193E+07 8.018E+022044 3.068E+04 2.457E+07 1.651E+03 8.195E+03 1.228E+07 8.253E+022045 3.158E+04 2.529E+07 1.699E+03 8.436E+03 1.265E+07 8.497E+022046 3.096E+04 2.479E+07 1.666E+03 8.269E+03 1.240E+07 8.328E+022047 3.035E+04 2.430E+07 1.633E+03 8.106E+03 1.215E+07 8.163E+022048 2.974E+04 2.382E+07 1.600E+03 7.945E+03 1.191E+07 8.002E+022049 2.916E+04 2.335E+07 1.569E+03 7.788E+03 1.167E+07 7.843E+022050 2.858E+04 2.288E+07 1.538E+03 7.634E+03 1.144E+07 7.688E+022051 2.801E+04 2.243E+07 1.507E+03 7.482E+03 1.122E+07 7.536E+022052 2.746E+04 2.199E+07 1.477E+03 7.334E+03 1.099E+07 7.387E+022053 2.691E+04 2.155E+07 1.448E+03 7.189E+03 1.078E+07 7.240E+022054 2.638E+04 2.112E+07 1.419E+03 7.047E+03 1.056E+07 7.097E+022055 2.586E+04 2.071E+07 1.391E+03 6.907E+03 1.035E+07 6.956E+022056 2.535E+04 2.030E+07 1.364E+03 6.770E+03 1.015E+07 6.819E+022057 2.485E+04 1.989E+07 1.337E+03 6.636E+03 9.947E+06 6.684E+022058 2.435E+04 1.950E+07 1.310E+03 6.505E+03 9.750E+06 6.551E+022059 2.387E+04 1.911E+07 1.284E+03 6.376E+03 9.557E+06 6.422E+022060 2.340E+04 1.874E+07 1.259E+03 6.250E+03 9.368E+06 6.294E+022061 2.293E+04 1.837E+07 1.234E+03 6.126E+03 9.183E+06 6.170E+022062 2.248E+04 1.800E+07 1.210E+03 6.005E+03 9.001E+06 6.048E+022063 2.204E+04 1.765E+07 1.186E+03 5.886E+03 8.823E+06 5.928E+022064 2.160E+04 1.730E+07 1.162E+03 5.769E+03 8.648E+06 5.810E+022065 2.117E+04 1.695E+07 1.139E+03 5.655E+03 8.477E+06 5.695E+02
Total landfill gas MethaneYear
REPORT - 8

landgem-v302 (Cinder Lake Landfill)_RTC.xls 4/3/2013
Results (Continued)
(Mg/year) (m 3 /year) (av ft^3/min) (Mg/year) (m 3 /year) (av ft^3/min)2066 2.075E+04 1.662E+07 1.117E+03 5.543E+03 8.309E+06 5.583E+022067 2.034E+04 1.629E+07 1.094E+03 5.433E+03 8.144E+06 5.472E+022068 1.994E+04 1.597E+07 1.073E+03 5.326E+03 7.983E+06 5.364E+022069 1.954E+04 1.565E+07 1.052E+03 5.220E+03 7.825E+06 5.258E+022070 1.916E+04 1.534E+07 1.031E+03 5.117E+03 7.670E+06 5.153E+022071 1.878E+04 1.504E+07 1.010E+03 5.016E+03 7.518E+06 5.051E+022072 1.841E+04 1.474E+07 9.903E+02 4.916E+03 7.369E+06 4.951E+022073 1.804E+04 1.445E+07 9.707E+02 4.819E+03 7.223E+06 4.853E+022074 1.768E+04 1.416E+07 9.514E+02 4.724E+03 7.080E+06 4.757E+022075 1.733E+04 1.388E+07 9.326E+02 4.630E+03 6.940E+06 4.663E+022076 1.699E+04 1.361E+07 9.141E+02 4.538E+03 6.803E+06 4.571E+022077 1.665E+04 1.334E+07 8.960E+02 4.448E+03 6.668E+06 4.480E+022078 1.632E+04 1.307E+07 8.783E+02 4.360E+03 6.536E+06 4.391E+022079 1.600E+04 1.281E+07 8.609E+02 4.274E+03 6.406E+06 4.305E+022080 1.568E+04 1.256E+07 8.439E+02 4.189E+03 6.280E+06 4.219E+022081 1.537E+04 1.231E+07 8.271E+02 4.106E+03 6.155E+06 4.136E+022082 1.507E+04 1.207E+07 8.108E+02 4.025E+03 6.033E+06 4.054E+022083 1.477E+04 1.183E+07 7.947E+02 3.945E+03 5.914E+06 3.974E+022084 1.448E+04 1.159E+07 7.790E+02 3.867E+03 5.797E+06 3.895E+022085 1.419E+04 1.136E+07 7.636E+02 3.791E+03 5.682E+06 3.818E+022086 1.391E+04 1.114E+07 7.484E+02 3.716E+03 5.570E+06 3.742E+022087 1.364E+04 1.092E+07 7.336E+02 3.642E+03 5.459E+06 3.668E+022088 1.337E+04 1.070E+07 7.191E+02 3.570E+03 5.351E+06 3.595E+022089 1.310E+04 1.049E+07 7.048E+02 3.499E+03 5.245E+06 3.524E+022090 1.284E+04 1.028E+07 6.909E+02 3.430E+03 5.141E+06 3.454E+022091 1.259E+04 1.008E+07 6.772E+02 3.362E+03 5.040E+06 3.386E+022092 1.234E+04 9.879E+06 6.638E+02 3.296E+03 4.940E+06 3.319E+022093 1.209E+04 9.684E+06 6.507E+02 3.230E+03 4.842E+06 3.253E+022094 1.185E+04 9.492E+06 6.378E+02 3.166E+03 4.746E+06 3.189E+022095 1.162E+04 9.304E+06 6.251E+02 3.104E+03 4.652E+06 3.126E+022096 1.139E+04 9.120E+06 6.128E+02 3.042E+03 4.560E+06 3.064E+022097 1.116E+04 8.939E+06 6.006E+02 2.982E+03 4.470E+06 3.003E+022098 1.094E+04 8.762E+06 5.887E+02 2.923E+03 4.381E+06 2.944E+022099 1.073E+04 8.589E+06 5.771E+02 2.865E+03 4.294E+06 2.885E+022100 1.051E+04 8.419E+06 5.657E+02 2.808E+03 4.209E+06 2.828E+022101 1.031E+04 8.252E+06 5.545E+02 2.753E+03 4.126E+06 2.772E+022102 1.010E+04 8.089E+06 5.435E+02 2.698E+03 4.044E+06 2.717E+022103 9.901E+03 7.928E+06 5.327E+02 2.645E+03 3.964E+06 2.664E+022104 9.705E+03 7.771E+06 5.222E+02 2.592E+03 3.886E+06 2.611E+022105 9.513E+03 7.618E+06 5.118E+02 2.541E+03 3.809E+06 2.559E+02
YearTotal landfill gas Methane
REPORT - 9

landgem-v302 (Cinder Lake Landfill)_RTC.xls 4/3/2013
Results (Continued)
Year
(Mg/year) (m 3 /year) (av ft^3/min) (Mg/year) (m 3 /year) (av ft^3/min)1965 0 0 0 0 0 01966 2.625E-03 1.852E+00 1.244E-04 7.376E-01 2.058E+02 1.383E-021967 5.765E-03 4.067E+00 2.733E-04 1.620E+00 4.519E+02 3.036E-021968 9.419E-03 6.645E+00 4.465E-04 2.647E+00 7.383E+02 4.961E-021969 1.358E-02 9.584E+00 6.439E-04 3.817E+00 1.065E+03 7.155E-021970 1.826E-02 1.288E+01 8.656E-04 5.131E+00 1.431E+03 9.618E-021971 2.345E-02 1.654E+01 1.111E-03 6.588E+00 1.838E+03 1.235E-011972 2.909E-02 2.052E+01 1.379E-03 8.172E+00 2.280E+03 1.532E-011973 3.517E-02 2.481E+01 1.667E-03 9.883E+00 2.757E+03 1.852E-011974 4.171E-02 2.942E+01 1.977E-03 1.172E+01 3.269E+03 2.197E-011975 4.868E-02 3.434E+01 2.308E-03 1.368E+01 3.816E+03 2.564E-011976 5.610E-02 3.958E+01 2.659E-03 1.576E+01 4.398E+03 2.955E-011977 6.452E-02 4.552E+01 3.058E-03 1.813E+01 5.058E+03 3.398E-011978 7.393E-02 5.216E+01 3.504E-03 2.077E+01 5.795E+03 3.894E-011979 8.431E-02 5.948E+01 3.997E-03 2.369E+01 6.609E+03 4.441E-011980 9.566E-02 6.749E+01 4.534E-03 2.688E+01 7.498E+03 5.038E-011981 1.080E-01 7.617E+01 5.118E-03 3.034E+01 8.463E+03 5.686E-011982 1.212E-01 8.551E+01 5.745E-03 3.405E+01 9.501E+03 6.383E-011983 1.354E-01 9.550E+01 6.416E-03 3.803E+01 1.061E+04 7.129E-011984 1.504E-01 1.061E+02 7.131E-03 4.227E+01 1.179E+04 7.923E-011985 1.664E-01 1.174E+02 7.888E-03 4.676E+01 1.304E+04 8.765E-011986 1.838E-01 1.296E+02 8.710E-03 5.163E+01 1.440E+04 9.678E-011987 2.072E-01 1.462E+02 9.824E-03 5.823E+01 1.625E+04 1.092E+001988 2.238E-01 1.579E+02 1.061E-02 6.289E+01 1.754E+04 1.179E+001989 2.408E-01 1.699E+02 1.141E-02 6.766E+01 1.888E+04 1.268E+001990 2.577E-01 1.818E+02 1.221E-02 7.240E+01 2.020E+04 1.357E+001991 2.760E-01 1.947E+02 1.308E-02 7.756E+01 2.164E+04 1.454E+001992 2.980E-01 2.102E+02 1.412E-02 8.372E+01 2.336E+04 1.569E+001993 3.235E-01 2.282E+02 1.534E-02 9.090E+01 2.536E+04 1.704E+001994 3.311E-01 2.336E+02 1.569E-02 9.302E+01 2.595E+04 1.744E+001995 3.476E-01 2.452E+02 1.648E-02 9.767E+01 2.725E+04 1.831E+001996 3.626E-01 2.558E+02 1.719E-02 1.019E+02 2.843E+04 1.910E+001997 3.829E-01 2.701E+02 1.815E-02 1.076E+02 3.001E+04 2.017E+001998 3.996E-01 2.819E+02 1.894E-02 1.123E+02 3.133E+04 2.105E+001999 4.174E-01 2.945E+02 1.978E-02 1.173E+02 3.272E+04 2.198E+002000 4.310E-01 3.041E+02 2.043E-02 1.211E+02 3.379E+04 2.270E+002001 4.402E-01 3.105E+02 2.087E-02 1.237E+02 3.450E+04 2.318E+002002 4.477E-01 3.159E+02 2.122E-02 1.258E+02 3.510E+04 2.358E+002003 4.582E-01 3.233E+02 2.172E-02 1.287E+02 3.592E+04 2.413E+002004 4.669E-01 3.294E+02 2.213E-02 1.312E+02 3.660E+04 2.459E+002005 4.784E-01 3.375E+02 2.268E-02 1.344E+02 3.750E+04 2.520E+002006 4.928E-01 3.477E+02 2.336E-02 1.385E+02 3.863E+04 2.596E+002007 5.071E-01 3.578E+02 2.404E-02 1.425E+02 3.975E+04 2.671E+002008 5.221E-01 3.683E+02 2.475E-02 1.467E+02 4.093E+04 2.750E+002009 5.364E-01 3.784E+02 2.543E-02 1.507E+02 4.205E+04 2.825E+002010 5.452E-01 3.846E+02 2.584E-02 1.532E+02 4.274E+04 2.872E+002011 5.554E-01 3.918E+02 2.632E-02 1.560E+02 4.353E+04 2.925E+002012 5.652E-01 3.987E+02 2.679E-02 1.588E+02 4.430E+04 2.977E+002013 5.756E-01 4.061E+02 2.728E-02 1.617E+02 4.512E+04 3.032E+002014 5.866E-01 4.138E+02 2.780E-02 1.648E+02 4.598E+04 3.089E+00
Hydrogen sulfide NMOC
REPORT - 10

landgem-v302 (Cinder Lake Landfill)_RTC.xls 4/3/2013
Results (Continued)
(Mg/year) (m 3 /year) (av ft^3/min) (Mg/year) (m 3 /year) (av ft^3/min)2015 5.981E-01 4.219E+02 2.835E-02 1.680E+02 4.688E+04 3.150E+002016 6.102E-01 4.305E+02 2.892E-02 1.715E+02 4.783E+04 3.214E+002017 6.229E-01 4.395E+02 2.953E-02 1.750E+02 4.883E+04 3.281E+002018 6.362E-01 4.488E+02 3.016E-02 1.788E+02 4.987E+04 3.351E+002019 6.502E-01 4.587E+02 3.082E-02 1.827E+02 5.097E+04 3.424E+002020 6.648E-01 4.690E+02 3.151E-02 1.868E+02 5.211E+04 3.501E+002021 6.800E-01 4.797E+02 3.223E-02 1.911E+02 5.330E+04 3.581E+002022 6.959E-01 4.909E+02 3.299E-02 1.955E+02 5.455E+04 3.665E+002023 7.125E-01 5.026E+02 3.377E-02 2.002E+02 5.585E+04 3.753E+002024 7.298E-01 5.148E+02 3.459E-02 2.050E+02 5.720E+04 3.844E+002025 7.478E-01 5.275E+02 3.545E-02 2.101E+02 5.862E+04 3.938E+002026 7.665E-01 5.408E+02 3.633E-02 2.154E+02 6.009E+04 4.037E+002027 7.860E-01 5.545E+02 3.726E-02 2.209E+02 6.161E+04 4.140E+002028 8.063E-01 5.688E+02 3.822E-02 2.265E+02 6.320E+04 4.247E+002029 8.273E-01 5.837E+02 3.922E-02 2.325E+02 6.485E+04 4.357E+002030 8.492E-01 5.991E+02 4.025E-02 2.386E+02 6.657E+04 4.473E+002031 8.719E-01 6.151E+02 4.133E-02 2.450E+02 6.835E+04 4.592E+002032 8.955E-01 6.317E+02 4.245E-02 2.516E+02 7.019E+04 4.716E+002033 9.199E-01 6.490E+02 4.360E-02 2.585E+02 7.211E+04 4.845E+002034 9.452E-01 6.668E+02 4.481E-02 2.656E+02 7.409E+04 4.978E+002035 9.715E-01 6.854E+02 4.605E-02 2.730E+02 7.615E+04 5.117E+002036 9.987E-01 7.046E+02 4.734E-02 2.806E+02 7.828E+04 5.260E+002037 1.027E+00 7.244E+02 4.867E-02 2.885E+02 8.049E+04 5.408E+002038 1.056E+00 7.450E+02 5.006E-02 2.967E+02 8.278E+04 5.562E+002039 1.086E+00 7.663E+02 5.149E-02 3.052E+02 8.515E+04 5.721E+002040 1.117E+00 7.884E+02 5.297E-02 3.140E+02 8.760E+04 5.886E+002041 1.150E+00 8.112E+02 5.450E-02 3.231E+02 9.013E+04 6.056E+002042 1.183E+00 8.348E+02 5.609E-02 3.325E+02 9.275E+04 6.232E+002043 1.218E+00 8.592E+02 5.773E-02 3.422E+02 9.546E+04 6.414E+002044 1.254E+00 8.844E+02 5.942E-02 3.522E+02 9.827E+04 6.603E+002045 1.291E+00 9.105E+02 6.118E-02 3.626E+02 1.012E+05 6.797E+002046 1.265E+00 8.925E+02 5.996E-02 3.554E+02 9.916E+04 6.663E+002047 1.240E+00 8.748E+02 5.878E-02 3.484E+02 9.720E+04 6.531E+002048 1.215E+00 8.575E+02 5.761E-02 3.415E+02 9.527E+04 6.401E+002049 1.191E+00 8.405E+02 5.647E-02 3.347E+02 9.339E+04 6.275E+002050 1.168E+00 8.238E+02 5.535E-02 3.281E+02 9.154E+04 6.150E+002051 1.145E+00 8.075E+02 5.426E-02 3.216E+02 8.973E+04 6.029E+002052 1.122E+00 7.915E+02 5.318E-02 3.152E+02 8.795E+04 5.909E+002053 1.100E+00 7.759E+02 5.213E-02 3.090E+02 8.621E+04 5.792E+002054 1.078E+00 7.605E+02 5.110E-02 3.029E+02 8.450E+04 5.678E+002055 1.057E+00 7.454E+02 5.009E-02 2.969E+02 8.283E+04 5.565E+002056 1.036E+00 7.307E+02 4.909E-02 2.910E+02 8.119E+04 5.455E+002057 1.015E+00 7.162E+02 4.812E-02 2.852E+02 7.958E+04 5.347E+002058 9.951E-01 7.020E+02 4.717E-02 2.796E+02 7.800E+04 5.241E+002059 9.754E-01 6.881E+02 4.624E-02 2.741E+02 7.646E+04 5.137E+002060 9.561E-01 6.745E+02 4.532E-02 2.686E+02 7.494E+04 5.036E+002061 9.372E-01 6.611E+02 4.442E-02 2.633E+02 7.346E+04 4.936E+002062 9.186E-01 6.481E+02 4.354E-02 2.581E+02 7.201E+04 4.838E+002063 9.004E-01 6.352E+02 4.268E-02 2.530E+02 7.058E+04 4.742E+002064 8.826E-01 6.226E+02 4.184E-02 2.480E+02 6.918E+04 4.648E+002065 8.651E-01 6.103E+02 4.101E-02 2.431E+02 6.781E+04 4.556E+00
NMOCHydrogen sulfideYear
REPORT - 11

landgem-v302 (Cinder Lake Landfill)_RTC.xls 4/3/2013
Results (Continued)
(Mg/year) (m 3 /year) (av ft^3/min) (Mg/year) (m 3 /year) (av ft^3/min)2066 8.480E-01 5.982E+02 4.019E-02 2.383E+02 6.647E+04 4.466E+002067 8.312E-01 5.864E+02 3.940E-02 2.335E+02 6.515E+04 4.378E+002068 8.147E-01 5.748E+02 3.862E-02 2.289E+02 6.386E+04 4.291E+002069 7.986E-01 5.634E+02 3.785E-02 2.244E+02 6.260E+04 4.206E+002070 7.828E-01 5.522E+02 3.710E-02 2.199E+02 6.136E+04 4.123E+002071 7.673E-01 5.413E+02 3.637E-02 2.156E+02 6.014E+04 4.041E+002072 7.521E-01 5.306E+02 3.565E-02 2.113E+02 5.895E+04 3.961E+002073 7.372E-01 5.201E+02 3.494E-02 2.071E+02 5.779E+04 3.883E+002074 7.226E-01 5.098E+02 3.425E-02 2.030E+02 5.664E+04 3.806E+002075 7.083E-01 4.997E+02 3.357E-02 1.990E+02 5.552E+04 3.730E+002076 6.943E-01 4.898E+02 3.291E-02 1.951E+02 5.442E+04 3.657E+002077 6.805E-01 4.801E+02 3.226E-02 1.912E+02 5.334E+04 3.584E+002078 6.670E-01 4.706E+02 3.162E-02 1.874E+02 5.229E+04 3.513E+002079 6.538E-01 4.613E+02 3.099E-02 1.837E+02 5.125E+04 3.444E+002080 6.409E-01 4.521E+02 3.038E-02 1.801E+02 5.024E+04 3.375E+002081 6.282E-01 4.432E+02 2.978E-02 1.765E+02 4.924E+04 3.309E+002082 6.158E-01 4.344E+02 2.919E-02 1.730E+02 4.827E+04 3.243E+002083 6.036E-01 4.258E+02 2.861E-02 1.696E+02 4.731E+04 3.179E+002084 5.916E-01 4.174E+02 2.804E-02 1.662E+02 4.637E+04 3.116E+002085 5.799E-01 4.091E+02 2.749E-02 1.629E+02 4.546E+04 3.054E+002086 5.684E-01 4.010E+02 2.694E-02 1.597E+02 4.456E+04 2.994E+002087 5.572E-01 3.931E+02 2.641E-02 1.565E+02 4.367E+04 2.934E+002088 5.461E-01 3.853E+02 2.589E-02 1.534E+02 4.281E+04 2.876E+002089 5.353E-01 3.777E+02 2.537E-02 1.504E+02 4.196E+04 2.819E+002090 5.247E-01 3.702E+02 2.487E-02 1.474E+02 4.113E+04 2.764E+002091 5.143E-01 3.628E+02 2.438E-02 1.445E+02 4.032E+04 2.709E+002092 5.041E-01 3.557E+02 2.390E-02 1.417E+02 3.952E+04 2.655E+002093 4.942E-01 3.486E+02 2.342E-02 1.388E+02 3.874E+04 2.603E+002094 4.844E-01 3.417E+02 2.296E-02 1.361E+02 3.797E+04 2.551E+002095 4.748E-01 3.349E+02 2.251E-02 1.334E+02 3.722E+04 2.501E+002096 4.654E-01 3.283E+02 2.206E-02 1.308E+02 3.648E+04 2.451E+002097 4.562E-01 3.218E+02 2.162E-02 1.282E+02 3.576E+04 2.403E+002098 4.471E-01 3.154E+02 2.119E-02 1.256E+02 3.505E+04 2.355E+002099 4.383E-01 3.092E+02 2.077E-02 1.231E+02 3.436E+04 2.308E+002100 4.296E-01 3.031E+02 2.036E-02 1.207E+02 3.367E+04 2.263E+002101 4.211E-01 2.971E+02 1.996E-02 1.183E+02 3.301E+04 2.218E+002102 4.128E-01 2.912E+02 1.957E-02 1.160E+02 3.235E+04 2.174E+002103 4.046E-01 2.854E+02 1.918E-02 1.137E+02 3.171E+04 2.131E+002104 3.966E-01 2.798E+02 1.880E-02 1.114E+02 3.109E+04 2.089E+002105 3.887E-01 2.742E+02 1.843E-02 1.092E+02 3.047E+04 2.047E+00
Hydrogen sulfide NMOCYear
REPORT - 12

APPENDIX B
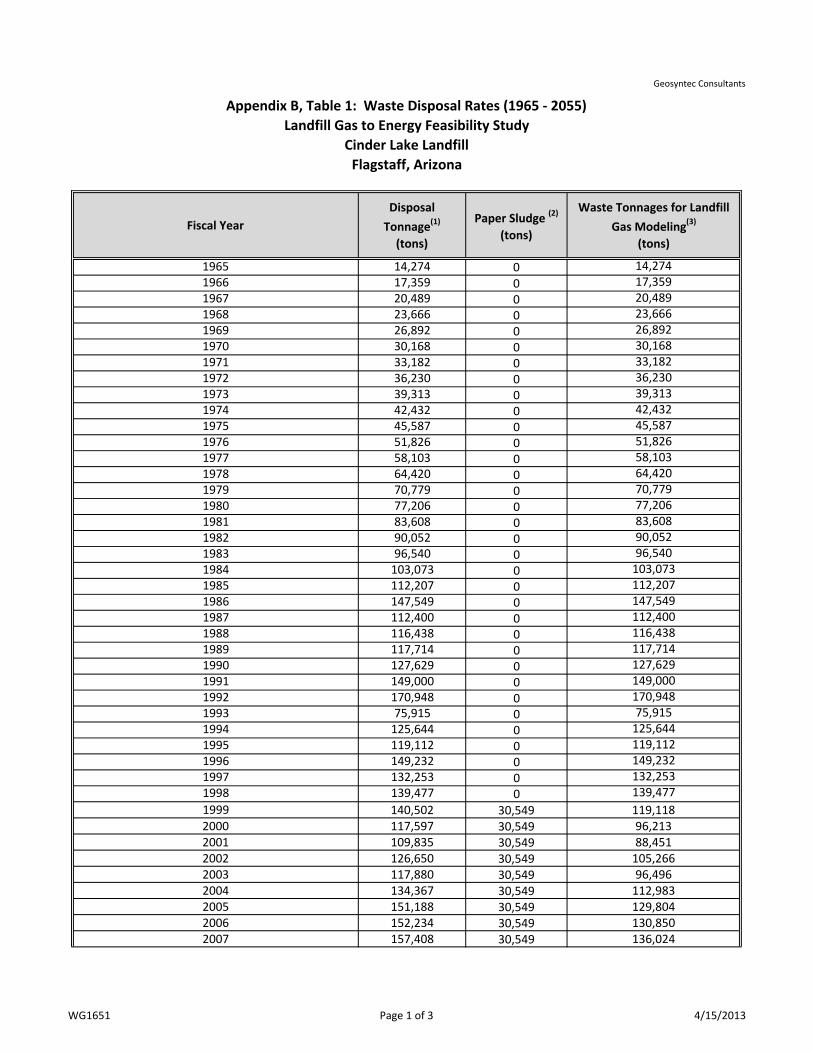
Appendix B, Table 1: Waste Disposal Rates (1965 - 2055) Landfill Gas to Energy Feasibility Study
Cinder Lake LandfillFlagstaff, Arizona
Geosyntec Consultants
Fiscal YearDisposal
Tonnage(1)
(tons)
Paper Sludge (2)
(tons)
Waste Tonnages for Landfill Gas Modeling(3)
(tons)
1965 14,274 0 14,2741966 17,359 0 17,3591967 20,489 0 20,4891968 23,666 0 23,6661969 26,892 0 26,8921970 30,168 0 30,1681971 33,182 0 33,1821972 36,230 0 36,2301973 39,313 0 39,3131974 42,432 0 42,4321975 45,587 0 45,5871976 51,826 0 51,8261977 58,103 0 58,1031978 64,420 0 64,4201979 70,779 0 70,7791980 77,206 0 77,2061981 83,608 0 83,6081982 90,052 0 90,0521983 96,540 0 96,5401984 103,073 0 103,0731985 112,207 0 112,2071986 147,549 0 147,5491987 112,400 0 112,4001988 116,438 0 116,4381989 117,714 0 117,7141990 127,629 0 127,6291991 149,000 0 149,0001992 170,948 0 170,9481993 75,915 0 75,9151994 125,644 0 125,6441995 119,112 0 119,1121996 149,232 0 149,2321997 132,253 0 132,2531998 139,477 0 139,4771999 140,502 30,549 119,1182000 117,597 30,549 96,2132001 109,835 30,549 88,4512002 126,650 30,549 105,2662003 117,880 30,549 96,4962004 134,367 30,549 112,9832005 151,188 30,549 129,8042006 152,234 30,549 130,8502007 157,408 30,549 136,024
WG1651 Page 1 of 3 4/15/2013

Appendix B, Table 1: Waste Disposal Rates (1965 - 2055) Landfill Gas to Energy Feasibility Study
Cinder Lake LandfillFlagstaff, Arizona
Geosyntec Consultants
Fiscal YearDisposal
Tonnage(1)
(tons)
Paper Sludge (2)
(tons)
Waste Tonnages for Landfill Gas Modeling(3)
(tons)
2008 155,470 30,549 134,0862009 126,990 30,549 105,6062010 135,162 30,549 113,7782011 134,743 30,549 113,3592012 138,785 30,549 117,4012013 142,949 30,549 121,5652014 147,237 30,549 125,8532015 151,654 30,549 130,2702016 156,204 30,549 134,8202017 160,890 30,549 139,5062018 165,717 30,549 144,3332019 170,688 30,549 149,3042020 175,809 30,549 154,4252021 181,083 30,549 159,6992022 186,516 30,549 165,1322023 192,111 30,549 170,7272024 197,875 30,549 176,4902025 203,811 30,549 182,4272026 209,925 30,549 188,541
2027 (4) 216,223 30,549 194,8392028 222,710 30,549 201,3252029 229,391 30,549 208,0072030 236,273 30,549 214,8882031 243,361 30,549 221,9772032 250,662 30,549 229,2772033 258,182 30,549 236,7972034 265,927 30,549 244,5432035 273,905 30,549 252,5202036 282,122 30,549 260,7382037 290,586 30,549 269,2012038 299,303 30,549 277,9192039 308,282 30,549 286,8982040 317,531 30,549 296,1462041 327,057 30,549 305,6722042 336,868 30,549 315,4842043 346,974 30,549 325,5902044 357,384 30,549 335,9992045 368,105 30,549 346,7212046 379,148 30,549 357,7642047 390,523 30,549 369,1382048 402,238 30,549 380,8542049 414,306 30,549 392,9212050 426,735 30,549 405,350
WG1651 Page 2 of 3 4/15/2013

Appendix B, Table 1: Waste Disposal Rates (1965 - 2055) Landfill Gas to Energy Feasibility Study
Cinder Lake LandfillFlagstaff, Arizona
Geosyntec Consultants
Fiscal YearDisposal
Tonnage(1)
(tons)
Paper Sludge (2)
(tons)
Waste Tonnages for Landfill Gas Modeling(3)
(tons)
2051 439,537 30,549 418,1522052 452,723 30,549 431,3392053 466,305 30,549 444,9202054 480,294 30,549 Entire Landfill at Capacity2055 494,702 30,549 Entire Landfill at Capacity
NOTES:
(3) Waste disposal rates for the landfill gas model assume that 70% of the sludge is inert and will not produce methane gas.(4) Cells A, B, and C are expected to reach full capacity in 2027.
(1) Waste disposal rates from 2009 to 2055 (the expected closure date for the landfill) provided by the City of Flagstaff; waste disposal rates for the years between 1965 and 2008 obtained from the NMOC report prepared by Woodward-Clyde [1997]. The rates provided by the City incorporate a 3% increase per year in waste rates. In order to account for the paper sludge component of the waste stream, Geosyntec assumed that only 30% of the yearly sludge is expected to be fibers (the rest is inert material), and therefore only 30% of the total tonnage would be capable of producing methane during the decomposition process. The assumed 30% value is consistent with fiber estimates for paper sludge found in the literature (Staley & Barlaz, 2009). This table shows the calculated yearly refuse intake rates for the landfill, reduced by an amount equal to 70% of the sludge tonnage.(2) Sludge disposal rate of 30,549 tons is representative of the years 1999 through 2006. This tonnage is projected forward for the remainder of the predicted site life.
WG1651 Page 3 of 3 4/15/2013

APPENDIX C

Written by: Wade Tyner Date: 04.13.2013
Approved by: Jeremy Morris Date: 04.13.2013
Client: Flagstaff Project: Cinder Lake Landfill Project No.: WG1651 Task No.: 3
WG1651/Appendix C - LFG Collection.doc Page 1
APPENDIX C
LANDFILL GAS COLLECTION ESTIMATE LANDFILL GAS TO ENERGY FEASIBILITY STUDY
CINDER LAKE LANDFILL FLAGSTAFF, ARIZONA
INTRODUCTION This document describes the methodology used for the estimation of landfill gas (LFG) collection efficiency of the proposed gas collection and control system (GCCS) as part of the landfill gas to energy (LFGTE) feasibility study. METHODOLOGY There are basic industry guidelines for estimating the GCCS collection efficiency of any given area within a landfill. Although methods differ slightly from one another, each method generally takes into account the cover conditions, the volume of waste located in the area, and the amount of area influenced by the gas collection system. For example, the U.S. EPA assumes the following estimates for LFG collection efficiency at municipal solid waste (MSW) landfills (U.S. EPA, 2009):
• 0% for areas without active gas collection;
• 60% for areas with daily cover (i.e., six-inch soil cover) and active gas collection;
• 75% for areas with intermediate cover (i.e., one-foot soil cover) and active gas collection; and
• 95% for areas with a final soil and geomembrane cover system and active gas collection.
These estimates are applied to all areas of the landfill based on their cover condition, and then a weighted average calculation is applied to the overall LFG generation curve developed for the site. The calculation for the weighted average takes into account the volume of waste influenced by the collection system by applying the area and average thickness of waste within each area of similar cover. Assumed Cover Conditions at CLL
It is clear that that the above method for estimating collection efficiency under varying cap conditions is based on broad generalizations and may not be universally applicable at all landfills. For example, with reference to conditions at CLL, the estimated GCCS collection efficiency for areas with intermediate cover (i.e., one foot of soil cover) may be too high for a

Written by: Wade Tyner Date: 04.13.2013
Approved by: Jeremy Morris Date: 04.13.2013
Client: Flagstaff Project: Cinder Lake Landfill Project No.: WG1651 Task No.: 3
WG1651/Appendix C - LFG Collection.doc Page 2
soil cover in arid conditions where significant cracks in the soil cover may develop. Such cracks can provide short-circuit conduits for gas to vent to the atmosphere and thus limit the efficiency of LFG recovery. Therefore, these estimates must be adjusted to more closely approximate the conditions of the site under study.
Based on the above, it is conservatively assumed that the arid conditions at CLL will result in lower than average collection rates in areas with only soil cover applied. To account for this, the following collection efficiencies are assumed for the various cover conditions:
• 50% for daily cover;
• 60% for intermediate cover; and
• 95% for final cover system. RESULTS The results of the LFG collection efficiency analysis are provided in Table 1. REFERENCES
United States Environmental Protection Agency (U.S. EPA), 2009, “Mandatory Reporting of Greenhouse Gases Rule: 40 CFR Part 98, Subpart HH”, Washington D.C., October 2009.
Written by: Wade Tyner Date: 04.13.2013
Approved by: Jeremy Morris Date: 04.13.2013
Client: Flagstaff Project: Cinder Lake Landfill Project No.: WG1651 Task No.: 3
WG1651/Appendix C - LFG Collection.doc Page 3
TABLE
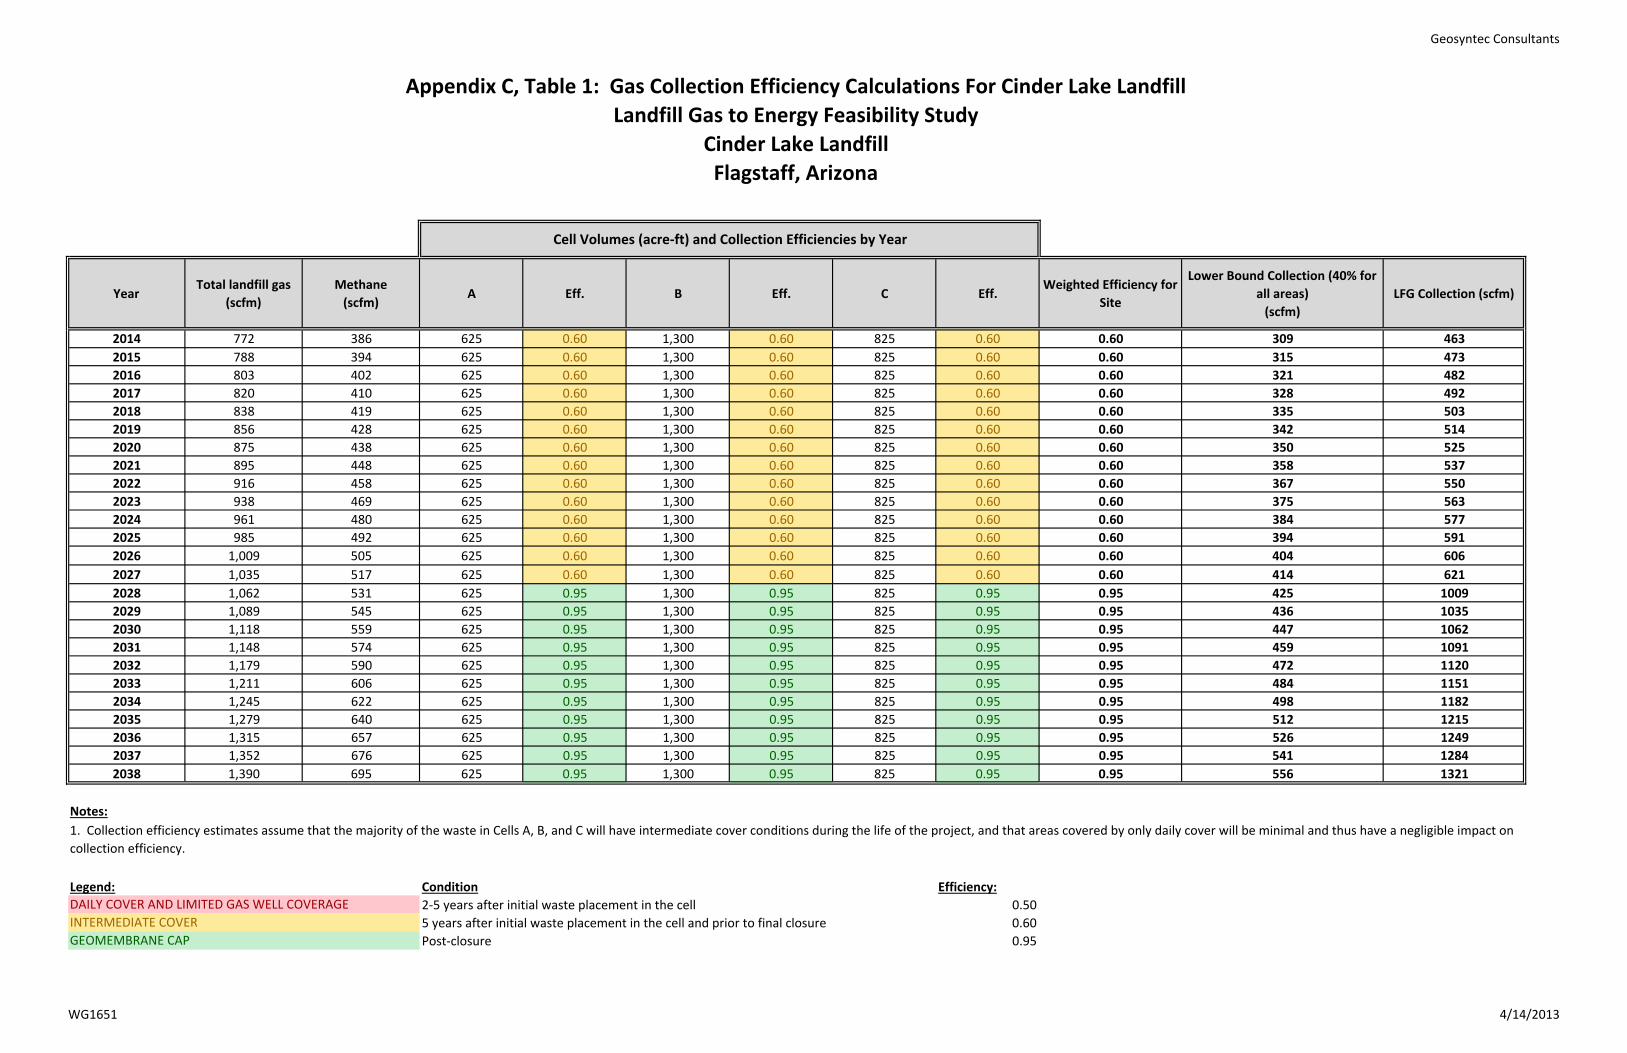
Geosyntec Consultants
YearTotal landfill gas
(scfm)Methane
(scfm)A Eff. B Eff. C Eff.
Weighted Efficiency for Site
Lower Bound Collection (40% for all areas)
(scfm)LFG Collection (scfm)
2014 772 386 625 0.60 1,300 0.60 825 0.60 0.60 309 4632015 788 394 625 0.60 1,300 0.60 825 0.60 0.60 315 4732016 803 402 625 0.60 1,300 0.60 825 0.60 0.60 321 4822017 820 410 625 0.60 1,300 0.60 825 0.60 0.60 328 4922018 838 419 625 0.60 1,300 0.60 825 0.60 0.60 335 5032019 856 428 625 0.60 1,300 0.60 825 0.60 0.60 342 5142020 875 438 625 0.60 1,300 0.60 825 0.60 0.60 350 5252021 895 448 625 0.60 1,300 0.60 825 0.60 0.60 358 5372022 916 458 625 0.60 1,300 0.60 825 0.60 0.60 367 5502023 938 469 625 0.60 1,300 0.60 825 0.60 0.60 375 5632024 961 480 625 0.60 1,300 0.60 825 0.60 0.60 384 5772025 985 492 625 0.60 1,300 0.60 825 0.60 0.60 394 5912026 1,009 505 625 0.60 1,300 0.60 825 0.60 0.60 404 6062027 1,035 517 625 0.60 1,300 0.60 825 0.60 0.60 414 6212028 1,062 531 625 0.95 1,300 0.95 825 0.95 0.95 425 10092029 1,089 545 625 0.95 1,300 0.95 825 0.95 0.95 436 10352030 1,118 559 625 0.95 1,300 0.95 825 0.95 0.95 447 10622031 1,148 574 625 0.95 1,300 0.95 825 0.95 0.95 459 10912032 1,179 590 625 0.95 1,300 0.95 825 0.95 0.95 472 11202033 1,211 606 625 0.95 1,300 0.95 825 0.95 0.95 484 11512034 1,245 622 625 0.95 1,300 0.95 825 0.95 0.95 498 11822035 1,279 640 625 0.95 1,300 0.95 825 0.95 0.95 512 12152036 1,315 657 625 0.95 1,300 0.95 825 0.95 0.95 526 12492037 1,352 676 625 0.95 1,300 0.95 825 0.95 0.95 541 12842038 1,390 695 625 0.95 1,300 0.95 825 0.95 0.95 556 1321
Notes:
Legend: Condition Efficiency:2-5 years after initial waste placement in the cell 0.505 years after initial waste placement in the cell and prior to final closure 0.60Post-closure 0.95
INTERMEDIATE COVERGEOMEMBRANE CAP
Cell Volumes (acre-ft) and Collection Efficiencies by Year
Appendix C, Table 1: Gas Collection Efficiency Calculations For Cinder Lake LandfillLandfill Gas to Energy Feasibility Study
Cinder Lake LandfillFlagstaff, Arizona
1. Collection efficiency estimates assume that the majority of the waste in Cells A, B, and C will have intermediate cover conditions during the life of the project, and that areas covered by only daily cover will be minimal and thus have a negligible impact on collection efficiency.
DAILY COVER AND LIMITED GAS WELL COVERAGE
WG1651 4/14/2013

APPENDIX D
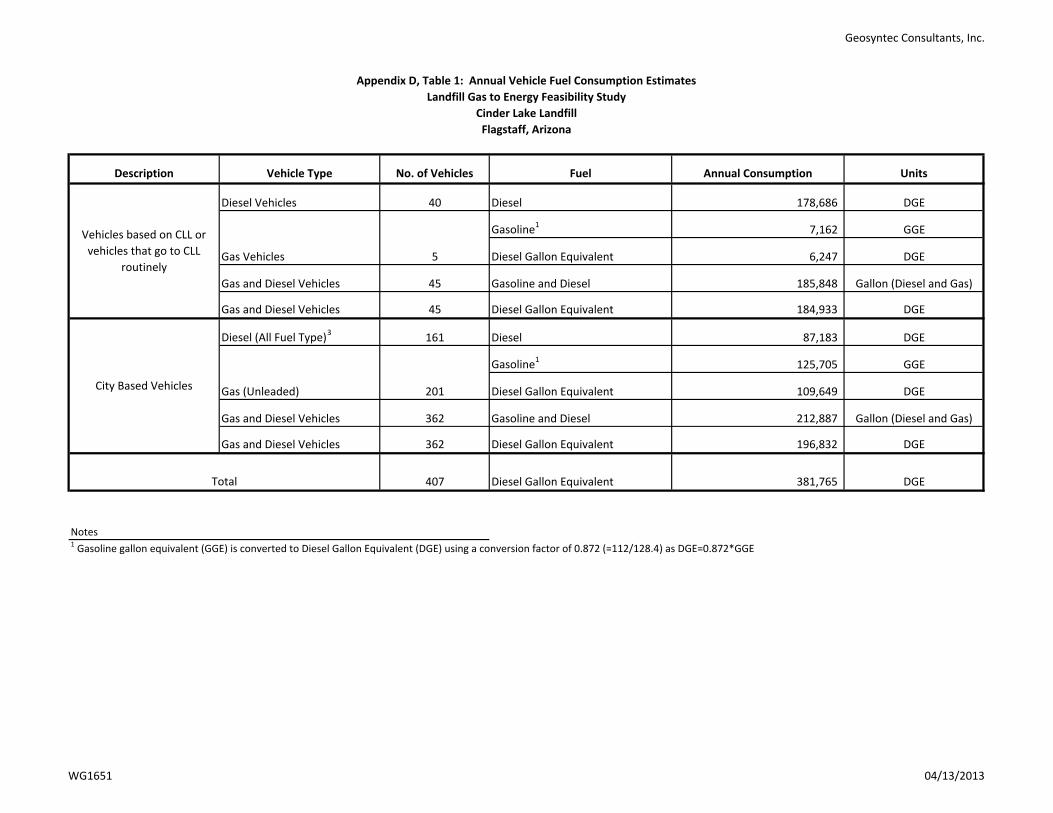
Geosyntec Consultants, Inc.
Appendix D, Table 1: Annual Vehicle Fuel Consumption Estimates
Cinder Lake LandfillFlagstaff, Arizona
Description Vehicle Type No. of Vehicles Fuel Annual Consumption Units
Diesel Vehicles 40 Diesel 178,686 DGE
Gasoline1 7,162 GGE
Diesel Gallon Equivalent 6,247 DGE
Gas and Diesel Vehicles 45 Gasoline and Diesel 185,848 Gallon (Diesel and Gas)
Gas and Diesel Vehicles 45 Diesel Gallon Equivalent 184,933 DGE
Diesel (All Fuel Type)3 161 Diesel 87,183 DGE
Gasoline1 125,705 GGE
Diesel Gallon Equivalent 109,649 DGE
Gas and Diesel Vehicles 362 Gasoline and Diesel 212,887 Gallon (Diesel and Gas)
Gas and Diesel Vehicles 362 Diesel Gallon Equivalent 196,832 DGE
407 Diesel Gallon Equivalent 381,765 DGE
Notes1 Gasoline gallon equivalent (GGE) is converted to Diesel Gallon Equivalent (DGE) using a conversion factor of 0.872 (=112/128.4) as DGE=0.872*GGE
Landfill Gas to Energy Feasibility Study
Total
Gas Vehicles 5
Vehicles based on CLL or vehicles that go to CLL
routinely
Gas (Unleaded) 201City Based Vehicles
WG1651 04/13/2013
APPENDIX E

BioCNG Cleanup Equipment Size: 200Date: 7/12/2012
Client/Site InformationGeosyntec Consultants
Methane concentration of your raw biogas: 54.0% Aklilu TesfamichaelSize BioCNG system would you like to analyze: 200 10875 Rancho Bernardo RdCost for electricity ($/kWh) to operate equipment at your site: $0.070 suite 200Does the ambient air temperature at your site fall below 32°F for more than 3 nights per year?
yes San Diego
Would you like your analysis to be in diesel or gasoline units? GGE CA92127
Would you like BioCNG to also provide a Fueling Station? yes [email protected] of fueling station: Fast PhoenixVolume of BioCNG fuel storage desired on-site (% of daily production):
50% Arizona
How many dual hose, fast fill dispensers would you like included? 1How many dual hose, slow fill posts would you like? N/A
Hours per day in operation: 24Days of Operation/week: 6Weeks per year: 52
Desired finance period (months): 120Cost to purchase biogas from owner ($ per MMBTU): $0.00Annual Interest on CapX: 4.0%
Result: 1.00$ per GGE (during the finance & RIN period)
EquipmentCap X $ Notes
BioCNG 200: 792,000$
Winterization: 105,000$
Fast Filling Station: 170,000$ Fast Fill Dispenser with Credit Card Reader(s): 62,500$
Slow Fill Post(s): -$ Storage at Fueling Station: 460,000$ 4 Banks of Storage Included 420 GGE of total storage capacity
Total Equipment CapX 1,589,500$
Grant or State Tax Credits:
Total Equipment CapX (less tax credits and grants) 1,589,500$ Link to Grant or State Tax Credit Information:
Note: CapX is firm for 30 days and subject to change thereafter.
Services from CornerstoneDescription $
Site Design/Layout: 22,000$ Installation of BioCNG Skid: 115,000$
Installation of Fast Fueling Station: 65,000$ Installation of Slow Fueling Station: -$
Permitting: 16,000$ Startup Services & Training: 41,000$
Total 259,000$
BioCNG - O&M EstimateCost Item $
Media and Equipment Replacements: 0.48$ Parasitic Electrical Load for BioCNG and Fueling Station: 0.27$
O&M Total 0.76$ O&M (total monthly cost) 18,492$
Preliminary Financial AnalysisAssumptions Value
Assumed Methane Concentration of Raw Biogas: 54.0%39.0 GGE937 GGE
5,622 GGE24,363 GGE
292,355 GGEEquipment Cap X (from above): 1,589,500$
Cumulative Interest on Equipment CapX: 341,650$ Services (from above): 259,000$
Total CapX 2,190,150$ Waste Gas:
(expected flow to be destructed in a microturbine, flare, or other device)128 scfm
Assumptions:1) BioCNG Fuel Production Assumes 67% Conversion Efficiency.2) Diesel at 128,400 BTU/gal; Gasoline at 112,000 BTU/gal.
RIN's for this operating scenario will amount to approximately:(after broker fees & 3rd Party Verification costs)
201,266$ per Year
RIN value 0.69$ RIN Information:
Link to One Potential Broker:
Cost of Raw BiogasAmount of biogas purchased per year (excludes methane returned to the flare or other destruction device):
32,510
-$ -$
Cost to Operate and Maintain BioCNG and Fueling Station: 0.76$ Cost to Finance: 0.75$
Subtotal 1.51$ Federal Excise Tax: 0.184$
State Road/Excise Tax: -$ Cost to Purchase Raw Biogas: -$
Value of RIN's: (0.69)$ Total 1.00$ per GGE (during the finance & RIN period)
Link to State Road/Excise Tax Information: Assumptions:1) Project is exempt from all sales tax, fees, etc. If not exempt, purchaser agrees these costs will be paid by purchaser.2) CapX and Services pricing are valid for 30 days.3) Does not include shipping.
BioCNG System - Turnkey Estimate
Assumptions For This Estimate
BioCNG Fuel Production:
Renewable Fuel Credits
BioCNG Information:
Fueling Station Information:
Operational Information:
Financing Information:
Biogas Cleanup Equipment:
Fueling Station Equipment:
Gas compression to 100 psig; gas chilled to 40°F; H2S reduction for 1,000 ppm; Si/VOC reduction for 1,500 ppb.Heat tracing & insulation of H2S vessel; heated and insulated structure over other equipment.
per Hourper Day
per GGE
Summary
Cost of biogas purchased from the owner:
Includes one compressor, priority panel for cascade filling, & one gas dryerNote: 2 hoses per dispenser.Note: 2 hoses per post.
50% due upon written P.O.; 40% due upon delivery of equipment on-site; 10% due within 30 days after startup.Research by following the link provided below (grants listed here are not a guarantee that you will qualify, nor that you will receive funds).Used in the proforma below.
Notesper GGE. Refer to the attached O&M cost estimateper GGEper GGE
http://www.afdc.energy.gov/afdc/laws/state_summary/AZ
Notes
NotesBudgetary costs below will be finalized after this task. Assumes Seismic Zone 0 for design and equipment.Budgetary - Skid Mounted Chiller & Electrical Panel with I-beam to connect to BioCNG Skid, Mechanical, Electrical and Crane.
Budgetary - Connect BioCNG within 100 feet.N/ABudgetary - Fire, Building, and Site Permits.Budgetary - 3 days on-site.To be billed T&M on a monthly basis.
per Weekper Monthper Year
Waste Gas will have 30 to 40% CH 4 concentration. Costs for supplying microturbine or modifying a flare are not included.
http://taxfoundation.org/article/state-gasoline-tax-rates-january-1-2012
http://www.epa.gov/otaq/fuels/renewablefuels/compliancehelp/rfs2-aq.htmhttp://www.carbonsolutionsgroup.com/bf.html
per GGEper GGE (includes Finance Charge, CapX and Services)per GGE (during the finance period)per GGEper GGE (confirm value by checking the State-specific Dept. of Revenue and web site link provided below)per GGEper GGE
MMBTU at methane content & operational hours listed above
per yearper GGE
This estimate provided with no guarantee. Confirm with a broker for an actual quote. One example broker's web link is provided below.
Note: BioCNG produced from landfills, farm digesters, and WWTP digesters are qualified to receive Renewable Fuel Standard Credits via RIN's.

Change Out / Replacment IntervalBioCNG 50, 100 and 200 BioCNG 50 BioCNG 100 BioCNG 200 BioCNG 50 BioCNG 100 BioCNG 200
Hydrogen Sulfide Media 6 months 5,750$ 11,500$ 23,000$ 11,500$ 23,000$ 46,000$ VOC/Siloxane Media 2 months 2,300$ 4,600$ 9,200$ 13,800$ 27,600$ 55,200$ Carbon Dioxide Removal 7 years 25,350$ 66,950$ 100,425$ 3,621$ 9,564$ 14,346$ Gas Compressor 5 years 5,800$ 8,200$ 8,200$ 1,160$ 1,640$ 1,640$ Modulating Valve 5 years 2,360$ 2,360$ 2,360$ 472$ 472$ 472$ Chiller Compressor 5 years 1,500$ 2,000$ 4,000$ 300$ 400$ 800$
30,853$ 62,676$ 118,458$ Hourly Rate
Labor $75 100 125 210 7,500$ 9,375$ 15,750$ Management $150 30 40 50 4,500$ 6,000$ 7,500$
12,000$ 15,375$ 23,250$ 42,853$ 78,051$ 141,708$
Average BioCNG Fuel Production GGE per year - - 292,355Average Media O&M Cost per GGE - - 0.48$
Notes:(1) Hydrogen sulfide changeout rate based on 1000 ppmv sulfur content at maximum flow rate.(2) VOC/Siloxane changeout rate based on typical biogas and may vary from site to site.(3) Labor requirements for changeout of hydrogen sulfide and VOC media: 2 staff members, 8 hours.(4) All piping, tanks, and vessels are assumed to have a 20 year life span.(5) General operations will require approximately 2 hours of labor per week.(6) These costs do not incude fueling station O&M.
Labor Hours per year Labor Costs per yearsubtotal
subtotalTOTAL
BioCNG Media and Replacement Cost Estimate
Maintenance ItemEach Change Out / Replacement Cost Annualized Change Out / Replacement Cost

July 18, 2012 Aklilu Tesfamichael" <[email protected]> Geosyntec Consultants 10875 Rancho Bernardo Road, Suite 200 San Diego, California 92127 USA Via Email Subject: FirmGreen 450scfm PSA System Dear Aklilu: Below please find design for 450SCFM of biogas. Note we let the H2S in the feed and removed in the tail gas. Some of the H2S is removed in the PSA cleaning process. Depending on the amount in the feedgas, this post-treatment may be required but we are assuming there is no need thus it is not included in this quote. Regardless of the size the process steps are as follows:
(1) Feed compression to 100 psig with an electric drive oil flooded screw compressor. The compression results in sour water condensation.
(2) Feed flow measurement and control at the compressor discharge followed by PSA treatment to remove H2S, water vapor and CO2 to 2%.
(3) Assumption for inlet Nitrogen was 5% resulting in 9% product gas, which put it on the border of acceptable CNG BTU value. Therefore, a Nitrogen removal system has been quoted for consideration. (4) Dry cleaned gas is delivered at 90 psig to CNG compression station.
In the separation the system produces two streams:
- A sales gas stream with a flow indicated in the material balances - A low-pressure tail gas fuel stream.
The fuel stream is low quality and we assume flared. Note we designed for a tail gas stream of low methane such that a thermal oxidizer would be used. Alternately we would use a lower recovery design and allow the use of a lower cost candlestick flare. The flare is not included.

PSA & Nitrogen Removal Biogas Cleaning System:
Feed, SCFM 450
Product, SCFM 255
CO2 in feed, % 37
CO2 in sales gas, % 2
FirmGreen PSA Cost FOB USA shop, $ $ 1,050,625
Nitrogen removal, $ $ 200,000
Estimated installation cost, $ 25% of Capital
Tail gas flare, $ By Customer
Note: H2S is removed into the tail gas.
CNG Compressor and Fueling budgetary cost:
Stationary Price Compressor, mounted on skid, 4500psi, PLC, gas detector, low voltage starter
$222,000
Dual Fastfill Dispenser, metered, card & reader management system
$75,000
Buffer tanks, 37,000scf $ 125,000 All-in-One Portable Unit Price Compressor, 4500psi, PLC, gas detector, low voltage starter, Dual Fastfill Dispenser, metered, card & reader management system
$266,000
Buffer tanks (off-skid), 37,000scf $ 125,000 Note: Time-based version would be less expensive because there would not be a need for buffer tanks and fast-fill features. Not included in the cost:
• Shipping, installation, foundation design, and EPC are not included.

FG PSA
System
FEED TAIL GAS 3 psig
PRODUCT 2% CO2
100 psig
90 psig 600 psig
FirmGreen PSA Design Material Balance Feed Sales Gas Waste Gas Flow, SCFM 450 255 189 Pressure, psig 100 90 3 Temperature, F 120+ 120+ 150 CH4 62.50 98.00 14.67 CO2 37.00 2.00 84.16 H2S (est.) 0.50 < 4 ppm 1.17 H2O Saturated Dry By Difference HHV BTU/FT3 631 *990 148
The system is very flexible to a range of feed compositions. * Above assumes no Nitrogen. Percentage of Nitrogen present in product gas will decrease resulting CH4 and HHV BTU accordingly.
Process The FirmGreen PSA system uses PSA technology and is designed for unattended operation. We would expect a visit to the unit each day to review the operation is all that is normally required. The system can be adjusted for changes in the feed rate and is very flexible to a range of feed compositions or product purity requirements. We view the ease of operation, production of high-pressure sales gas product and the ability to remove H2O/H2S/CO2 in a single step as features of the FirmGreen PSA process. In the FirmGreen PSA H2O/H2S/CO2 are adsorbed from the feed while methane passes through the fixed bed of adsorbent at near feed pressure.
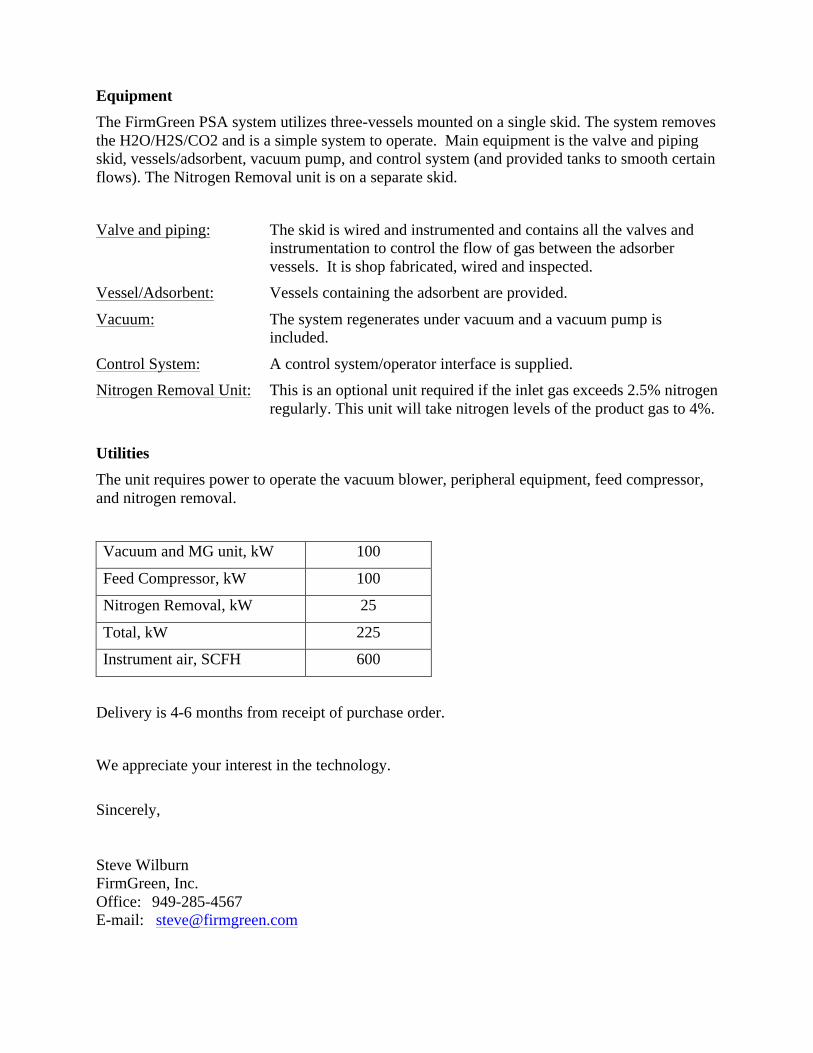
Equipment The FirmGreen PSA system utilizes three-vessels mounted on a single skid. The system removes the H2O/H2S/CO2 and is a simple system to operate. Main equipment is the valve and piping skid, vessels/adsorbent, vacuum pump, and control system (and provided tanks to smooth certain flows). The Nitrogen Removal unit is on a separate skid.
Valve and piping: The skid is wired and instrumented and contains all the valves and instrumentation to control the flow of gas between the adsorber vessels. It is shop fabricated, wired and inspected.
Vessel/Adsorbent: Vessels containing the adsorbent are provided.
Vacuum: The system regenerates under vacuum and a vacuum pump is included.
Control System: A control system/operator interface is supplied. Nitrogen Removal Unit: This is an optional unit required if the inlet gas exceeds 2.5% nitrogen
regularly. This unit will take nitrogen levels of the product gas to 4%. Utilities The unit requires power to operate the vacuum blower, peripheral equipment, feed compressor, and nitrogen removal.
Vacuum and MG unit, kW 100
Feed Compressor, kW 100
Nitrogen Removal, kW 25
Total, kW 225
Instrument air, SCFH 600
Delivery is 4-6 months from receipt of purchase order.
We appreciate your interest in the technology.
Sincerely, Steve Wilburn FirmGreen, Inc. Office: 949-285-4567 E-mail: [email protected]

PSA skid:
Foot print (Approximate)

APPENDIX F

Geosyntec Consultants, Inc.
Appendix F, Table 1: Cost Estimate Scenarios for Single and Dual Bio-CNG Units
Cinder Lake LandfillFlagstaff, Arizona
Description Unit Unit Cost Qty Total
Bio-CNG 200 = ea. $792,000 1 $792,000Winterization = ea. $105,000 1 $105,000
$897,000
Fast Filling Station = ea. $170,000 2 $340,000Fast Fill Dispenser with Credit Card Reader(s)= ea. $62,500 2 $125,000
Tube Trailer = ea. $125,000 2 $250,000Compressor to fill tubes = ea. $65,000 1 $65,000
3 Bank Storage tubes at City Location = ea. $115,000 1 $115,000Storage at Fueling Station at LF = ea. $230,000 1 $230,000
$1,125,000
Site Design/Layout = LS $22,000 1 $22,000Installation of BioCNG Skid = LS $115,000 1 $115,000
Installation of Fast Fueling Station = LS $65,000 1 $65,000Permitting = LS $16,000 1 $16,000
Startup Services & Training = LS $41,000 1 $41,000$259,000
$2,281,000
Description Unit Unit Cost Qty Total
Bio-CNG 200 = ea. $792,000 2 $1,584,000Winterization = ea. $105,000 2 $210,000
$1,794,000
Fast Filling Station = ea. $170,000 2 $340,000Fast Fill Dispenser with Credit Card Reader(s)= ea. $62,500 2 $125,000
Tube Trailer = ea. $125,000 2 $250,000Compressor to fill tubes = ea. $65,000 1 $65,000
3 Bank Storage tubes at City Location = ea. $115,000 1 $115,000Storage at Fueling Station at LF = ea. $230,000 1 $230,000
$1,125,000
Site Design/Layout = LS $22,000 1 $22,000Installation of BioCNG Skid = LS $115,000 1 $115,000
Installation of Fast Fueling Station = LS $65,000 1 $65,000Permitting = LS $16,000 1 $16,000
Startup Services & Training = LS $41,000 1 $41,000$259,000
$3,178,000
Notes1 Cost estimate scenarios for single and dual 200 scfm units are based on discussion with Cornerstone Environmental.
Landfill Gas to Energy Feasilibility Study
Single 200 scfm Bio-CNG Unit1
Dual 200 scfm Bio-CNG Units1
Fueling Station Subtotal =
Fueling Station Subtotal =
Biogas Cleanup Equipment
Biogas Cleanup Equipment Subtotal =Fueling Station Equipment
Engineering Design and Permitting & Installation
Engineering Design and Permitting & Installation
Engineering Design and Permitting Subtotal =
Initial BioCNG Capital Cost =
Initial BioCNG Capital Cost =
Engineering Design and Permitting Subtotal =
Biogas Cleanup Equipment
Biogas Cleanup Equipment Subtotal =Fueling Station Equipment
WG1651 04/13/2013