Final Ecological-Risk Assessment for Operable Unit 1 · Refine the COPEC List This step was...
113
FINAL ECOLOGICAL RISK ASSESSMENT FOR OPERABLE UNIT 1 OF THE SMURFIT-STONE/FRENCHTOWN MILL SITE LOCATED IN MISSOULA COUNTY, MONTANA March 2017 Prepared by: U.S. Environmental Protection Agency Region 8 1595 Wynkoop Street Denver, CO 80202 With technical assistance from: SRC, Inc. 999 18th Street, Suite 1380 Denver, Colorado 80202
Transcript of Final Ecological-Risk Assessment for Operable Unit 1 · Refine the COPEC List This step was...

FINAL
ECOLOGICAL RISK ASSESSMENT FOR OPERABLE UNIT 1 OF THE
SMURFIT-STONE/FRENCHTOWN MILL SITE LOCATED IN MISSOULA COUNTY, MONTANA
March 2017
Prepared by: U.S. Environmental Protection Agency
Region 8 1595 Wynkoop Street
Denver, CO 80202
With technical assistance from: SRC, Inc.
999 18th Street, Suite 1380 Denver, Colorado 80202

FINAL
This page intentionally left blank to facilitate double-sided printing

FINAL
iii
Document Revision History Revision Date Change 01 03/09/17 Section 2.1; removal of permitting language and
effluent containment language

FINAL
iv
TABLE OF CONTENTS
1.0 INTRODUCTION............................................................................................................. 5
1.1 PURPOSE OF THIS DOCUMENT .......................................................................................... 5 1.2 OVERVIEW OF THE EIGHT-STEP ECOLOGICAL RISK ASSESSMENT PROCESS ..................... 5 1.3 DOCUMENT ORGANIZATION ............................................................................................ 5
2.0 SCREENING LEVEL PROBLEM FORMULATION ................................................. 7 2.1 SITE OVERVIEW ............................................................................................................... 7 2.2 ENVIRONMENTAL SETTING .............................................................................................. 8 2.3 CONTAMINANTS KNOWN OR SUSPECTED TO BE PRESENT AT THE SITE .......................... 10 2.4 CONTAMINANT FATE AND TRANSPORT PROCESSES ....................................................... 12 2.5 POTENTIAL EXPOSURE PATHWAYS AND RECEPTORS OF CONCERN ................................ 13 2.6 ASSESSMENT AND MEASUREMENT ENDPOINTS ............................................................. 14
3.0 IDENTIFICATION OF COPECS................................................................................. 15 3.1 METHODOLOGY ............................................................................................................. 15 3.2 COPEC RESULTS ........................................................................................................... 16
4.0 COPEC REFINEMENT ................................................................................................ 17 4.1 REFINEMENT METHODOLOGY ........................................................................................ 17 4.2 COPEC REFINEMENT RESULTS ..................................................................................... 18
5.0 RISK CHARACTERIZATION ..................................................................................... 19 5.1 METHODOLOGY ............................................................................................................. 19 5.2 RESULTS ........................................................................................................................ 20
6.0 UNCERTAINTY ASSESSMENT ................................................................................. 22 6.1 REPRESENTATIVENESS OF ENVIRONMENTAL DATA ....................................................... 22 6.2 UNCERTAINTIES FROM CONTAMINANTS NOT EVALUATED ............................................ 22 6.3 UNCERTAINTIES IN BENCHMARKS ................................................................................. 23 6.4 UNCERTAINTIES IN BACKGROUND COMPARISONS ......................................................... 23
7.0 REFERENCES ................................................................................................................ 24
APPENDICES
Appendix A MTNHP Map Viewer Species Output Appendix B OU1 Data Appendix C Toxicity Benchmarks for Ecological Receptors Appendix D ProUCL Output

FINAL
v
LIST OF TABLES Table 2-1 Endangered, Threatened, Proposed and Candidate Species in Missoula County,
Montana Table 2-2 Data Summary Table 2-3 OU1 Surface Soil Summary Statistics Table 2-4 OU1 Surface Water Summary Statistics Table 2-5 OU1 Sediment Summary Statistics Table 3-1 Surface Soil COPEC Screen Table 3-2 Surface Water COPEC Screen Table 3-3 Sediment COPEC Screen Table 4-1 Background Samples Table 4-2 Background Soil Summary Statistics Table 4-3 Background Surface Water Summary Statistics Table 4-4 Background Sediment Summary Statistics Table 5-1 Hazard Quotients for Birds and Mammals Exposed to Copper and Selenium in
OU1 Soils

FINAL
vi
LIST OF FIGURES Figure 1-1 Eight-Step Ecological Risk Assessment Process Figure 2-1 Site Map Figure 2-2 Map with Operable Units Figure 2-3 Surface Water and Sediment Sampling Locations Figure 2-4 Conceptual Site Model for Ecological Exposures at OU1-Agricultural Area Soils Figure 3-1 COPEC Selection Procedure Figure 4-1 Site versus Background Surface Water TEQ (ND=MDL/2) Concentrations Figure 5-1 Hazard Quotients for Plants and Soil Invertebrates Exposed to Copper in OU1
Soils Figure 5-2 Hazard Quotients for Plants and Soil Invertebrates Exposed to Selenium in OU1
Soils

FINAL
vii
LIST OF ACRONYMS AND ABBREVIATIONS
95UCL Upper 95 percent Confidence Limit CERCLA Comprehensive Environmental Response, Compensation, and Liability Act CFR Clark Fork River COPEC Contaminants of Potential Ecological Concern CSM Conceptual Site Model DL Detection Limit EC20 Effective concentration at which 20% of the population is affected ERA Ecological Risk Assessment FSP Field Sampling Plan HQ Hazard Quotient LOAEL Lowest Observed Adverse Effect Level LOEC Lowest Observed Effect Concentration MDEQ Montana Department of Environmental Quality MDL Method Detection Limit MFISH Montana Fisheries Information System MTNHP Montana Natural Heritage Program ND Non-detect NOAEL No Observed Adverse Effect Level NOEC No-observed Effect Concentration NPL National Priorities List NWPPC Northwest Power Planning Council OU Operable Unit PCDD Polychlorinated dibenzodioxin PCDF Polychlorinated dibenzofuran PRP Potentially Responsible Party QAPP Quality Assurance Project Plan RI Remedial Investigation RIWP Remedial Investigation Work Plan SI Site Investigation SOC Species of Concern SVOC Semi-volatile Organic Compound TCDD 2,3,7,8-tetrachlorodibenzodioxin TEF Toxicity Equivalence Factor TEQ TCDD Toxicity Equivalent value TRV Toxicity Reference Value USEPA United States Environmental Protection Agency USGS United States Geological Survey WCT Westslope Cutthroat Trout WMW Wilcoxon-Mann-Whitney
FINAL
FINAL Ecological Risk Assessment Smurfit-Stone Frenchtown Mill Operable Unit 1 1
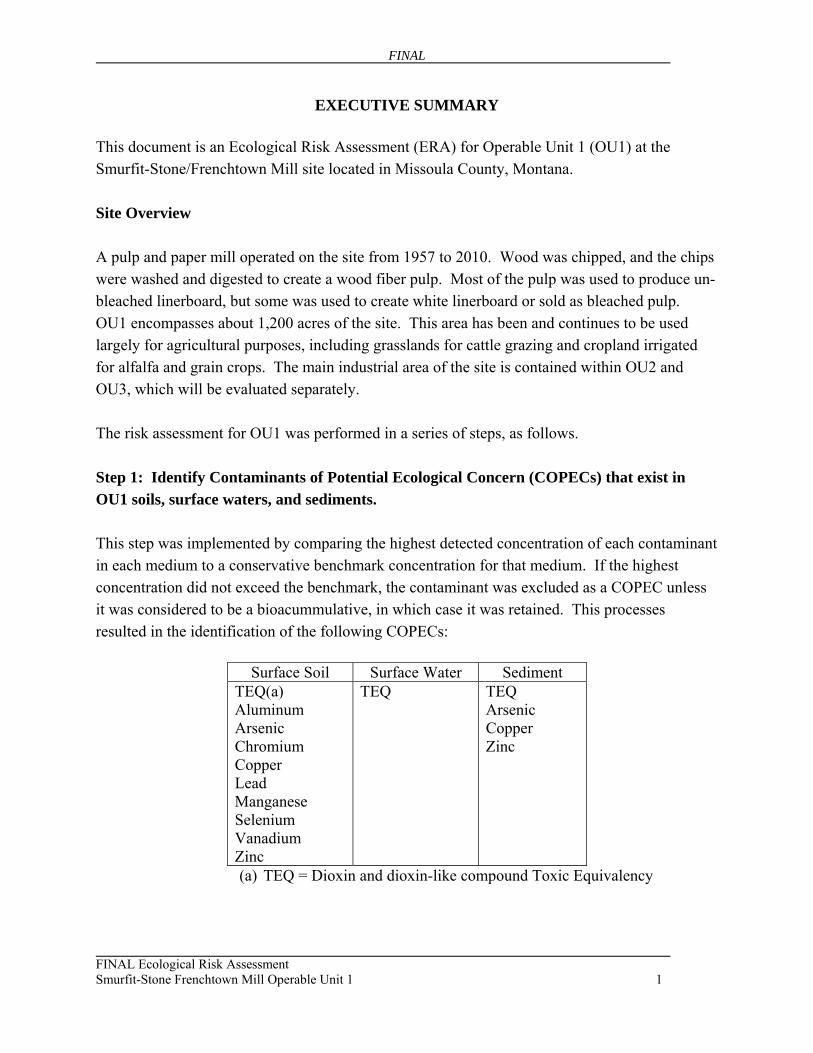
EXECUTIVE SUMMARY This document is an Ecological Risk Assessment (ERA) for Operable Unit 1 (OU1) at the Smurfit-Stone/Frenchtown Mill site located in Missoula County, Montana.
Site Overview A pulp and paper mill operated on the site from 1957 to 2010. Wood was chipped, and the chips were washed and digested to create a wood fiber pulp. Most of the pulp was used to produce un-bleached linerboard, but some was used to create white linerboard or sold as bleached pulp. OU1 encompasses about 1,200 acres of the site. This area has been and continues to be used largely for agricultural purposes, including grasslands for cattle grazing and cropland irrigated for alfalfa and grain crops. The main industrial area of the site is contained within OU2 and OU3, which will be evaluated separately. The risk assessment for OU1 was performed in a series of steps, as follows.
Step 1: Identify Contaminants of Potential Ecological Concern (COPECs) that exist in OU1 soils, surface waters, and sediments. This step was implemented by comparing the highest detected concentration of each contaminant in each medium to a conservative benchmark concentration for that medium. If the highest concentration did not exceed the benchmark, the contaminant was excluded as a COPEC unless it was considered to be a bioacummulative, in which case it was retained. This processes resulted in the identification of the following COPECs:
Surface Soil Surface Water Sediment TEQ(a) Aluminum Arsenic Chromium Copper Lead Manganese Selenium Vanadium Zinc
TEQ TEQ Arsenic Copper Zinc
(a) TEQ = Dioxin and dioxin-like compound Toxic Equivalency

FINAL
FINAL Ecological Risk Assessment Smurfit-Stone Frenchtown Mill Operable Unit 1 2
Step 2. Refine the COPEC List This step was implemented for each COPEC in each medium by performing a statistical test to compare the available site data to a relevant background data set. COPECs that were not higher than background were eliminated. This processes resulted in the exclusion of all COPECs except for copper and selenium in soil.
Step 3. Characterize Hazard to Ecological Receptors form Copper and Selenium in Soil This step was implemented using different strategies for mobile and sessile receptors, as follows.
Step 3a. Mobile Receptors (Birds and Mammals) For birds and mammals, hazard was characterized by computing the 95% upper confidence limit on the average concentration in OU1 soil and comparing that value to the receptor-specific no-observed effect concentration (NOEC) and the lowest-observed-effect concentration (LOEC) values: Hazard Quotient (HQ) = 95% UCL / (LOEC or NOEC)
If the HQ value is below 1 based on the NOEC benchmark, it is believed that potential risks are minimal. If the HQ is above 1 based on the NOEC but is equal to or less than 1 based on the LOEC benchmark, it is considered possible that some adverse effects may occur in some individuals, but that the likelihood of a population level effect is likely to be low. If the HQ based on the LOEC exceeds 1, then adverse effects are potentially significant, with the magnitude of the hazard increasing as the HQ increases.
Step 3b: Sessile Receptors (Plants and Soil Invertebrates) Because plants and soil invertebrates do not move around the site, hazard for this type of receptor was evaluated by computing LOEC-based and NOEC-based HQ values for every sample (rather than the 95% UCL of the samples), and evaluating the frequency and the magnitude of HQ values above 1. As above, if all or most NOEC-based HQs for individuals in a population of receptors are below 1, the hazard is considered to be minimal. Conversely, if many or all of the LOEC-based HQs are above 1, then unacceptable effects on the exposed population may occur, especially if the HQ values are large. If only a small portion of the exposed population has LOEC-based HQ values that exceed 1, some individuals may be impacted, but the hazard of population-level effects is low.

FINAL
FINAL Ecological Risk Assessment Smurfit-Stone Frenchtown Mill Operable Unit 1 3
Results of this step are summarized below:
Receptor Hazard from Copper Hazard from Selenium
Birds Minimal Minimal
Mammals Minimal Low
Plants Minimal Low
Soil Invertebrates Minimal Minimal
Step 4: Identify Uncertainties Most of the steps used to evaluate hazard are intentionally conservative. That is, confidence is high that things found to be pose minimal hazard are not of significant ecological concern. With regard to the low hazard that selenium may pose to mammals and plants, there are several sources of uncertainty that limit confidence, including:
The benchmark values for selenium are uncertain and are more likely to be low than high, especially for plants. Consequently, the HQ values are more likely to be high than low.
The Missoula Valley is known to have large phosphate formations which are associated with elevated levels of selenium. The state-wide background soil data may not have high enough resolution to properly represent local background conditions at the site. Indeed, the range of selenium in site soil (0.3-1.8 mg/kg) and background soil (0.2-1.6 mg/kg) are similar. Thus, confidence that selenium in OU1 surface soil is authentically or meaningfully higher than background is low.

FINAL
FINAL Ecological Risk Assessment Smurfit-Stone Frenchtown Mill Operable Unit 1 4
This page intentionally left blank to facilitate double-sided printing

FINAL
FINAL Ecological Risk Assessment Smurfit-Stone Frenchtown Mill Operable Unit 1 5
1.0 INTRODUCTION
1.1 Purpose of this Document This document is an Ecological Risk Assessment (ERA) for Operable Unit 1 (OU1) at the Smurfit-Stone/Frenchtown Mill site located in Missoula County, Montana, hereafter referred to as the “OU1 site”. The purpose of this document is to identify contaminants of potential ecological concern (COPECs) in OU1 soils, surface waters and sediments, to determine which of these COPECs are site-related, and to characterize the risks to ecological receptors from site-related COPECs. This information, along with other relevant site information, will be used by risk managers to make decisions on whether any additional investigations are required at OU1 to further characterize the nature and magnitude of risks to ecological receptors from site-related contaminants, and whether any actions may be needed to protect ecological receptors in OU1.
1.2 Overview of the Eight-Step Ecological Risk Assessment Process The United States Environmental Protection Agency (USEPA) has developed specific methods and procedures for completing ecological risk assessments (USEPA 1992; 1997; 1998; 2001). Figure 1-1 shows the eight-step process that is recommended for ecological risk assessments completed at Superfund sites under the Comprehensive Environmental Response, Compensation and Liability Act (CERCLA). The eight steps shown in Figure 1-1 are not intended to represent a linear sequence of mandatory tasks. Rather, some tasks may proceed in parallel, some tasks may be performed in a phased or iterative fashion, and some tasks may be judged to be unnecessary at certain sites.
1.3 Document Organization In addition to this introduction, this report is organized into the following sections: Section 2. This section presents the screening level problem formulation, including a site overview, the environmental setting, contaminants known or suspected to occur at the site, studies that provide data about contaminants in environmental media, fate and transport processes that may be occurring, types of ecological receptors likely to occur at the site, and exposure pathways that are likely to be complete. Section 3. This section describes the process of identifying COPECs at the site. Section 4. This section describes the process of refining the list of COPECs at the site.

FINAL
FINAL Ecological Risk Assessment Smurfit-Stone Frenchtown Mill Operable Unit 1 6
Section 5. This section characterizes the ecological hazards from COPECs that were not eliminated in the refinement step. Section 6. This section discusses uncertainties in the findings and conclusions of the ecological risk assessment. Section 7. This section provides references for all documents referred to in the text.
All tables, figures, and appendices cited in the text are provided at the end of the report.

FINAL
FINAL Ecological Risk Assessment Smurfit-Stone Frenchtown Mill Operable Unit 1 7
2.0 SCREENING LEVEL PROBLEM FORMULATION Problem formulation is a systematic planning step that identifies the major concerns and issues considered in the ERA, and provides a description of the basic approach used to identify the potential risks that may exist (USEPA 1997). A screening level problem formulation represents Step 1 of the eight step ERA process (Figure 1-1) and results in a conceptual site model (CSM) that identifies sources of contaminant release to the environment, the fate and transport of contaminants in the environment, and exposure pathways of potential concern for ecological receptors. Detailed information on site background and characteristics are included in the Remedial Investigation Work Plan (RIWP) (Newfields 2015). This report also provides a detailed discussion on the environmental setting for the Smurfit Stone/Frenchtown Mill site. Site information is also provided on USEPA’s Superfund Page for the site1. Pertinent information from these sources is summarized briefly in the following subsections.
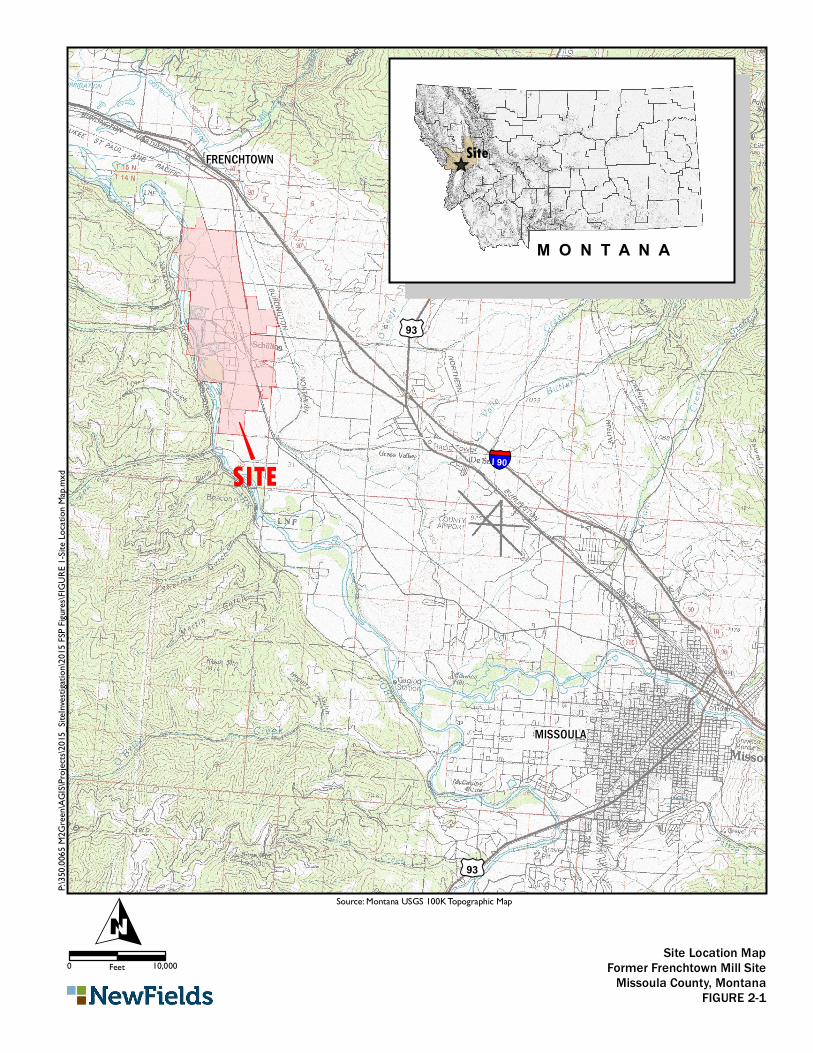
2.1 Site Overview The Smurfit-Stone/Frenchtown Mill site is in Missoula County, Montana and is located 11 miles northwest of Missoula, Montana (Figure 2-1). The entire site encompasses approximately 3,150 acres. Historically, a pulp and paper mill operated on site from 1957 to 2010. Wood was chipped, and the chips were washed and digested to create a wood fiber pulp. Beginning in 1990, pulp was also created from recycling old corrugated containers at a recycled fiber plant on site. Waste bark and wood (hog fuel) generated as part of the on-site chipping of logs was conveyed to a storage yard on site and burned in a boiler. Most of the pulp was used to produce un-bleached linerboard, but some of the total pulp produced from 1960-1999 was used to create white linerboard or sold as bleached pulp. The core industrial footprint of the site includes the former mill, recycling plant, a wood chipping staging area, the hog fuel area, and various equipment storage areas. During the pulp and paper production, high usage of water and energy resulted in large amounts of waste generation like wastewater, solid waste (e.g., treatment sludges, boiler ash, wood processing residuals, lime kiln grits, inert materials, and general refuse) and air emissions. The paper making process at the site was designed to recover and recycle contaminants utilized in the
1 Smurfit-Stone Mill Frenchtown, Missoula, MT webpage: https://cumulis.epa.gov/supercpad/cursites/csitinfo.cfm?id=0802850

FINAL
FINAL Ecological Risk Assessment Smurfit-Stone Frenchtown Mill Operable Unit 1 8
washing and digesting processes. Stack emissions from recovery boilers, power boilers, and lime kilns were controlled and monitored. The mill included a wastewater treatment system that consisted of a clarifier and settling ponds (primary treatment), sludge dewatering plant, aeration basins (secondary treatment), polishing ponds, a color removal plant (tertiary treatment) and a series of unlined holding ponds used to store treated effluent prior to discharge. When holding ponds were at capacity, treated wastewater was moved to infiltration basins and infiltrated to groundwater. Effluent from the mill was discharged to the Clark Fork River (CFR) throughout the life of the mill when river flow and temperature conditions were within permit limits. For assessment and management purposes, the USEPA, Montana Department of Environmental Quality (MDEQ) and the Respondents have agreed to divide the site into three operable units (OUs) based on historic use and the nature of the potential environmental concerns, as follows (Figure 2-2):
OU1 encompasses about 1,200 acres of the site. This area has been and continues to be used largely for agricultural purposes, including grasslands for cattle grazing and cropland irrigated for alfalfa and grain crops. OU2 encompasses approximately 255 acres of the site and includes the former industrial area. This area includes the former buildings and process areas for the Mill. OU3 encompasses approximately 1,700 acres of the site and includes areas of the site where solid and liquid wastes were treated and stored. This area includes the wastewater treatment system (settling ponds, aeration basins, polishing ponds, solid waste basins, spoils basins, holding ponds, and infiltration basins).
This ERA focuses on OU1. For the purposes of the remedial investigation (RI), OU1 was subdivided to support sampling needs as shown in Figure 2-2 to include 12 subareas. Nine of these (AG1-AG9) are used for farming, ranching, equipment storage, and production well fields (water supply), one is used as an office for a few employees of the current property owners (M2Green), and two are native forest located west of the CFR (WR1 and WR2). Portions of two subareas (AG8 and AG9) include floodplain upstream of the treated water holding ponds.
2.2 Environmental Setting The Smurfit-Stone/Frenchtown Mill site is located within the northwestern portion of the Missoula Valley. The valley elevation ranges from approximately 3,000 to 3,200 feet above sea level, with surrounding mountain ranges, including the Sapphire Range to the east, the Bitterroot
FINAL
FINAL Ecological Risk Assessment Smurfit-Stone Frenchtown Mill Operable Unit 1 9
Range to the south, the Rattlesnake Range to the north, and the Ninemile Divide to the west, rising to elevations ranging from 5,000 to 8,000 feet.
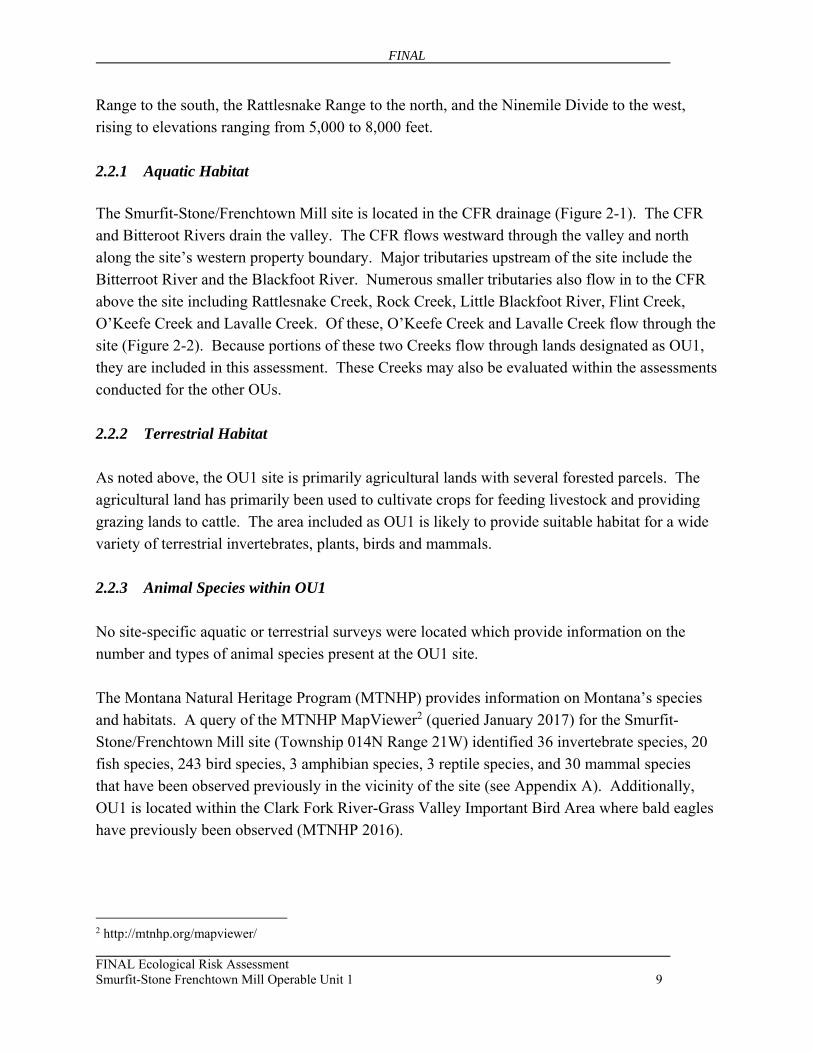
2.2.1 Aquatic Habitat The Smurfit-Stone/Frenchtown Mill site is located in the CFR drainage (Figure 2-1). The CFR and Bitteroot Rivers drain the valley. The CFR flows westward through the valley and north along the site’s western property boundary. Major tributaries upstream of the site include the Bitterroot River and the Blackfoot River. Numerous smaller tributaries also flow in to the CFR above the site including Rattlesnake Creek, Rock Creek, Little Blackfoot River, Flint Creek, O’Keefe Creek and Lavalle Creek. Of these, O’Keefe Creek and Lavalle Creek flow through the site (Figure 2-2). Because portions of these two Creeks flow through lands designated as OU1, they are included in this assessment. These Creeks may also be evaluated within the assessments conducted for the other OUs.
2.2.2 Terrestrial Habitat As noted above, the OU1 site is primarily agricultural lands with several forested parcels. The agricultural land has primarily been used to cultivate crops for feeding livestock and providing grazing lands to cattle. The area included as OU1 is likely to provide suitable habitat for a wide variety of terrestrial invertebrates, plants, birds and mammals.
2.2.3 Animal Species within OU1 No site-specific aquatic or terrestrial surveys were located which provide information on the number and types of animal species present at the OU1 site. The Montana Natural Heritage Program (MTNHP) provides information on Montana’s species and habitats. A query of the MTNHP MapViewer2 (queried January 2017) for the Smurfit-Stone/Frenchtown Mill site (Township 014N Range 21W) identified 36 invertebrate species, 20 fish species, 243 bird species, 3 amphibian species, 3 reptile species, and 30 mammal species that have been observed previously in the vicinity of the site (see Appendix A). Additionally, OU1 is located within the Clark Fork River-Grass Valley Important Bird Area where bald eagles have previously been observed (MTNHP 2016).
2 http://mtnhp.org/mapviewer/
FINAL
FINAL Ecological Risk Assessment Smurfit-Stone Frenchtown Mill Operable Unit 1 10
The online database for the Montana Fisheries Information System (MFISH) lists O’Keefe Creek as a Northwest Power Planning Council (NWPPC) Fishery and Wildlife Protected Area on the basis of Westslope Cutthroat Trout (WCT) presence and bald eagle nesting territory within 2.5 miles of O’Keefe Creek. However, the MFISH database indicates that no fish surveys have been conducted in either O’Keefe or Lavalle Creeks, and WCT abundance is listed as “rare” in O’Keefe based on professional judgment (MFISH 2016). No aquatic surveys were located which provide information on the numbers and types of aquatic invertebrate species present in O’Keefe or Lavalle Creeks. However, the attributes of these streams are similar to other coldwater streams in the northern plains of Montana, suggesting that benthic invertebrate populations are likely similar.
2.2.4 Sensitive Species that May Occur in the General Area of OU1 The U.S. Fish and Wildlife Service has identified six threatened, one proposed, and one candidate species that are likely to occur in Missoula County (see Table 2-1; USFWS 2016). A query of the MTNHP Species of Concern report3 (queried January 2017) for the Smurfit-Stone/Frenchtown Mill site (Township 014N Range 21W) identified that the proposed wolverine and threatened bull trout included in Table 2-1 are known or expected to occur in the vicinity of the site.
2.3 Contaminants Known or Suspected to be Present at the Site Mill operations (predominantly the pulping and bleaching processes) used or produced various hazardous contaminants on site, including semi-volatile organic compounds (SVOCs), heavy metals, and bleaching chemicals. The use of chlorine for the bleaching of pulp produces chlorinated organic compounds, including dioxins and furans. Site activities and waste disposal practices may have contaminated soil, sediment, surface water and groundwater. Studies that provide data on the actual occurrence of these types of contaminants in site media are described below.
2.3.1 Site Investigations Numerous environmental studies and compliance monitoring events have been conducted at the site (Newfields 2015). The USEPA conducted a site investigation (SI) in 2011 to support evaluation of the site for possible National Priorities List (NPL) listing (USEPA 2012). This investigation was focused on the former wastewater treatment and storage area (currently
3 http://mtnhp.org/SpeciesOfConcern/?AorP=a

FINAL
FINAL Ecological Risk Assessment Smurfit-Stone Frenchtown Mill Operable Unit 1 11
designated as OU3), O’Keefe Creek, and the CFR. However, there are data quality concerns with regard to adherence to sampling guidance with the 2011 sampling event. In April 2014, the Potential Responsible Party (PRP) for the site commissioned the collection of environmental samples from areas that were not investigated by the USEPA in 2011. Follow-up sampling was conducted in accordance with the USEPA approved RIWP, associated Field Sampling Plan (FSP) and Quality Assurance Project Plan (QAPP) (Newfields 2015) in November and December 2015. For this assessment, attention was focused on data collected from 2014 and 2015 because more recent data are likely to be more representative of current site conditions than older data.
2.3.2 Environmental Data Available environmental data for the OU1 site include surface soil samples collected throughout OU1, and sediment and surface water samples collected from O’Keefe and Lavalle Creeks during the 2014 and 2015 site investigations (see Table 2-2). All of these data have been validated and are considered to be appropriate for use in this assessment. Because polychlorinated dibenzodioxin (PCDD) and furan (PCDF) congeners all act by the same mechanism as 2,3,7,8-tetrachlorodibenzodioxin (TCDD), data for the PCDD and PCDF congeners was converted to a TCDD toxicity equivalent value (TEQ) by computing the sum across congeners of the product of congener-specific concentration and relative Toxicity Equivalence Factor (TEF): TEQ = ∑ (Ci x TEFi) TEFs for mammals were based on USEPA (2010). TEFs for birds were based on van Den Berg et al. (1998). Three alternative values were computed, differing in the numeric concentration values assigned to non-detect (ND) congers evaluated using the method detection limit (MDL) as: ND = 0, ND = MDL/2, and ND = MDL. The calculated TEQ concentrations were considered ND if all of the individual congeners used in the calculation were reported as ND. If any individual congener was reported as detected, the calculated TEQ concentration was considered detected. Excel files containing the data are provided in electronic format in Appendix B, and summary statistics are provided in Tables 2-3 to 2-5.

FINAL
FINAL Ecological Risk Assessment Smurfit-Stone Frenchtown Mill Operable Unit 1 12
Data on concentrations in surface water for OU1 are limited to two samples, one collected in Lavalle Creek (SW9-LV) and one collected in O’Keefe Creek (SW10-OK). As shown in Figure 2-3, SW10-OK is located upstream of the mill site boundary. In the absence of additional data, this sample is included in the OU1 site dataset for surface water along with the co-located sediment sample (SE21-OK-SA).
2.4 Contaminant Fate and Transport Processes Contaminants that may have been associated with historic mill operations may migrate in the environment by several processes:
Wind transport of contaminated soil. Fine-grained soil particulates may be transported by air as a consequence either of wind erosion and/or human disturbances. In 2014, the USEPA identified the potential for the migration of dust from the wastewater treatment system ponds to OU1 (Newfields 2015). Transport of contaminants emitted to the air from boiler emissions can also result in direct deposition of contaminants in OU1 surface soils.
Vaporization. Direct vaporization from soil can result in contaminants being transported as vapors in air. Such releases are generally rapidly dispersed by wind and are normally of low ecological concern.
Runoff. Rain or snowmelt flowing over surface soils into area streams may result in contamination of both surface water and stream sediments. However, site data suggest that there is limited potential for runoff into O’Keefe and Lavalle Creeks (Newfields 2015).
Leaching. Contaminants in soil may be dissolved by water (rain or snowmelt) and infiltrate into subsurface soils and downward into groundwater. Based on hydrogeology, the potential for subsurface soil migration is considered limited at this site (Newfields 2015).
Tissue uptake. Plants can take up contaminants from the soil, and terrestrial vertebrates and invertebrates can ingest soil indirectly while feeding. Terrestrial fauna can also take up contaminants by ingesting terrestrial food items. Aquatic organisms experience similar uptake from contact with surface water or sediment and ingestion of aquatic food items.

FINAL
FINAL Ecological Risk Assessment Smurfit-Stone Frenchtown Mill Operable Unit 1 13
2.5 Potential Exposure Pathways and Receptors of Concern Based on the information presented above, Figure 2-4 presents the screening-level ecological CSM for the OU1 site. This figure identifies the main categories of ecological receptors that are likely to be present, and the most important exposure pathways for each.. This CSM is discussed in greater detail below.
Aquatic Receptors The aquatic communities in O’Keefe and Lavalle Creeks are assumed to be made up of fish, benthic invertebrates, phytoplankton, zooplankton, and amphibians. Therefore, for the purposes of this ERA, sediment and surface water benchmarks that address the aquatic and benthic communities are used as measures of effect. Fish and benthic macroinvertebrate communities in O’Keefe and Lavalle Creeks may also serve as a food source for fish and other receptors. USEPA has established standard methods for the assessment of these groups, and it is considered likely that these groups can serve as an indicator for aquatic receptors in general. For fish, the primary exposure route of concern is direct contact with surface water that is impacted by site releases. For benthic invertebrates, the primary route of concern is direct contact with surface water and sediment. Fish and aquatic macroinvertebrates may also be exposed to contaminants via ingestion of prey and sediment. However, exposures to fish and benthic invertebrates via ingestion are usually believed to be minor compared to risks from direct contact with surface water and sediment. Terrestrial Plants and Soil Organisms The structure and function of the terrestrial plant and invertebrate community are important because plants provides a significant portion of the energy, organic matter, and nutrient inputs for terrestrial systems as well as habitat and forage for wildlife. Terrestrial plants and soil organisms are good indicators of soil condition because they reside directly in the soil and are sessile or nearly sessile. The primary exposure route for both terrestrial plants and soil organisms is direct contact with contaminated soils. For terrestrial plants, exposure may also occur due to deposition of dust on foliar (leaf) surfaces, but this pathway is believed to be minor compared to root exposures in surface soils.

FINAL
FINAL Ecological Risk Assessment Smurfit-Stone Frenchtown Mill Operable Unit 1 14
Birds and Mammals Birds and mammals may be exposed to site-related contaminants by ingestion of three types of environmental media: 1) ingestion of contaminants in or on prey items, 2) incidental ingestion of soil and/or sediment while feeding, grooming, or burrowing, and 3) ingestion of contaminated water. Direct contact (i.e., dermal exposure) of birds and mammals to soils is considered to be minimal because the skin of these animals is protected by feathers and fur. Inhalation exposure to airborne dusts or vapors in air are possible for all birds and mammals, but these exposures are considered to be minor in comparison to exposures from ingestion (USEPA, 2003), and meaningful toxicity information for wildlife is generally not available for use in the interpretation of such exposures.
2.6 Assessment and Measurement Endpoints Assessment Endpoints Assessment endpoints are explicit statements of the characteristics of the ecological system that are to be protected. Selection of appropriate assessment endpoints helps ensure that the risk assessment will evaluate the ecological attributes that are of primary importance to risk managers. In most cases, assessment endpoints focus on growth, survival and reproduction of exposed receptors, since these endpoints are indicative of the probability that an exposed receptor population will be healthy and self-sustaining. Measurement Endpoints Measurement endpoints represent quantifiable measures of exposure and/or effects. Ideally, selected measures of exposure and effect are directly related to the valued ecological components chosen as the assessment endpoints (USEPA 1992, 1997). Conceptually, a wide range of different types of measurement endpoints may be useful in ecological risk assessments, including direct observations of population density and diversity, and direct tests of the effects of site media on growth, reproduction and/or survival in exposed receptors. At the OU1 site, no data are presently available to support these assessment endpoints, so the measurement endpoint selected for use is the concentration of contaminants measured in site media. These measured concentration values are compared to “benchmark” or “reference” concentration values (usually derived from non-site-specific toxicity studies) to draw inferences about the hazard of adverse effects in the exposed receptors.

FINAL
FINAL Ecological Risk Assessment Smurfit-Stone Frenchtown Mill Operable Unit 1 15
3.0 IDENTIFICATION OF COPECs 3.1 Methodology Figure 3-1 shows the approach used to evaluate the available environmental data from OU1 to identify COPECs for the evaluation of risks to ecological receptors from contaminated environmental media (soil, surface water, and sediment). This COPEC selection approach is intended to be conservative. That is, it is expected that some contaminants may be identified as COPECs that are actually of little or no concern, but that no contaminants of authentic concern will be overlooked. The first step in the screening assessment for OU1 is to review available toxicity data to determine if an appropriate benchmark value is available for each contaminant. A benchmark is a concentration value in a medium that is expected to be without significant risk of adverse effects in ecological receptors exposed to that medium. Toxicity benchmark values for the protection of ecological receptors are available from numerous sources. Appendix C identifies the sources that were reviewed for this effort, and the hierarchy used to select the most relevant and appropriate values for each medium (soil, sediment, water) and each receptor class (birds, mammals, plants, soil invertebrates). The lowest value for each medium was used for COPEC screening. Values that were selected are consistent with ecological assessments conducted at other sites in USEPA Region 8. If a contaminant was detected in 5% or more of the site samples, the maximum detected concentration is compared to the available benchmark. If the maximum detected concentration does not exceed the benchmark, the contaminant is judged to be of negligible concern and is excluded as a COPEC. If the maximum detected concentration exceeds the benchmark, the contaminant is retained for evaluation in the second step of the screen. If a contaminant was detected in fewer than 5% of the site samples, then the detection limit is evaluated. If the detection limit is lower than the relevant benchmark, then it is very unlikely that the contaminant will pose a significant ecological risk and may be excluded as a COPEC. However, if the detection limit is above the benchmark, this is identified as a source of uncertainty. For this assessment, contaminants detected in 5% or more of the site samples that are considered to be bioaccumulative are identified as COPECs without regard to whether the maximum value does or does not exceed the benchmark. This is because many benchmark values are derived in a way that may not adequately account for food web exposure of contaminants that tend to

FINAL
FINAL Ecological Risk Assessment Smurfit-Stone Frenchtown Mill Operable Unit 1 16
biomagnify in the food web. A contaminant was considered to be bioaccumulative in accordance with USEPA (1995). If a contaminant lacks a benchmark value, then it is not possible to make a judgement whether the contaminant may or may not pose significant ecological risk. In order to judge whether this is a significant source of uncertainty that might require further evaluation or data collection, available information was reviewed to determine if the contaminant is likely to have been released from the site. If it does not appear that a release of the contaminant is likely, the contaminant is excluded from further consideration. If the data suggest that a release is likely to have occurred, then the lack of toxicity data for the contaminant is identified as a data gap and options for collecting information needed for assessing the potential risk from the contaminant are considered.
3.2 COPEC Results Tables 3-1 to 3-3 present the application of the COPEC selection process described above. Contaminants that were identified as being bioaccumulative, or were detected in 5% or more of the available samples, and where the maximum detected concentrations exceeded a conservative benchmark value include the following:
Surface Soil Surface Water Sediment TEQ(a) Aluminum Barium Chromium Copper Lead Manganese Selenium Vanadium Zinc
TEQ TEQ Arsenic Copper Zinc
(a) TEQ = Dioxin and dioxin-like compound Toxic Equivalency

FINAL
FINAL Ecological Risk Assessment Smurfit-Stone Frenchtown Mill Operable Unit 1 17
4.0 COPEC REFINEMENT
4.1 Refinement Methodology Because the COPEC selection process is inherently conservative, it is sometimes useful to refine the COPEC list prior to further assessment efforts (USEPA 2001). One strategy for COPEC refinement that may be useful is a comparison of site data to an appropriate “background” data set. This is because USEPA does not require remedial action or further investigation of contaminants that are not elevated above background (non-site related) levels (USEPA 2002). Accordingly, a statistical comparison of OU1 data to background data was performed for any contaminant that was identified as a COPEC in Section 3.2. If a COPEC is present in OU1 site media at concentrations that are not statistically higher than the level that would be expected for that contaminant based on background levels, then it may be concluded that the site-related contribution for that contaminant is sufficiently minor that further quantitative evaluation is not needed. If the contaminant is observed to be present at a level higher than would otherwise be expected based on background data, then it is appropriate to retain that contaminant for further assessment. For the purposes of this assessment, USEPA’s ProUCL Software (v 5.0) was used to compare available site data to available background data (USEPA 2013). This was done using the Wilcoxon-Mann-Whitney (WMW) two sample hypothesis test in ProUCL for the null hypothesis site >= background (Form 2) at a confidence coefficient of 95%. This form of the hypothesis guards against declaring the site is not higher than background when it actually is. If ProUCL concludes that the Form 2 null hypothesis cannot be rejected, the WMW two sample hypothesis test is conducted for the null hypothesis site = background at a confidence coefficient of 95%. The Gehan test was used when multiple detection limits are present as prompted by the ProUCL output based on the WMW test. Background soil data considered in this assessment were collected and reported by the MDEQ for dioxins/furans and inorganics (Hydrometrics, 2011; 2013). Background data for sediment and surface water include data collected during RI sampling from areas un-impacted by site activities as well as data from select U.S. Geological Survey (USGS) monitoring stations (Table 4-1). Tables 4-2, 4-3, 4-4 present summary statistics for background concentrations in surface soil, surface water, and sediment, respectively.

FINAL
FINAL Ecological Risk Assessment Smurfit-Stone Frenchtown Mill Operable Unit 1 18
4.2 COPEC Refinement Results Data were adequate for performing statistical background comparisons for COPECs identified in the risk-based screen as being present in OU1 soil and sediment at maximum concentrations above relevant benchmarks. Appendix D includes the ProUCL output. The statistical comparisons between site and background soils indicated that copper and selenium are present in OU1 soils at concentrations significantly above background concentrations. No COPECs in OU1 sediment were found to be present at concentrations significantly above background. For surface water, TEQ was identified as a COPEC because of its potential to bioaccumulate. As described in Section 2.3.2, TEQ concentrations were calculated following the TEF approach described in USEPA (2010). The available background surface water TEQ data consists of five samples, three detected concentrations and two non-detect concentrations. The calculated TEQ concentrations for those samples qualified as non-detect are higher than the concentrations for those samples qualified as detected when non-detects are evaluated as MDL/2 or at the MDL. Coupled with the relatively small dataset, the surface water TEQ data are considered inadequate for performing a meaningful statistical comparison between site TEQ and background TEQ. Although a statistical test comparing OU1 and background levels of TEQ cannot be conducted, it is apparent that distribution and range of site and background concentrations of TEQ are similar, as shown in Figure 4-1 and summarized below:
Analyte
OU1 Surface Water (ug/L)
Background Surface Water (ug/L)
N DF(%) Mean ± SD Range N DF(%) Mean ± SD Range Mammal TEQ (ND=1/2 MDL)
2 100 3.9E-07 ± 3.7E-08
3.6E-07 – 4.2E-07
5 60 3.3E-07 ± 1.7E-08
3.3E-07 – 3.6E-07
Based on this, only copper and selenium measured in OU1 surface soils were found to be present at concentrations that may be statistically higher than background. The following section presents a more detailed evaluation of risks from these two contaminants.

FINAL
FINAL Ecological Risk Assessment Smurfit-Stone Frenchtown Mill Operable Unit 1 19
5.0 RISK CHARACTERIZATION
5.1 Methodology Risk characterization for COPECs that are retained after the COPEC refinement step was performed using the Hazard Quotient (HQ) approach. In this approach, the estimated exposure from the site is compared to a reference or benchmark concentration in order to draw inferences about hazard: HQ = Exposure / Benchmark Mobile Receptors For ecological receptors that are mobile and move about the site, EPA recommends that the upper 95% confidence limit (95UCL) of the arithmetic mean of the contaminant concentrations be used to estimate exposure (USEPA 1992). This approach minimizes the probability of underestimating the level of hazard due to random variations in the available data set. The best method for computing a 95UCL depends on the nature of the data set. USEPA’s ProUCL Software (v 5.0) calculates a range of alternative 95UCL values and recommends a value for use in risk assessment (USEPA 2013). Accordingly, all 95UCL values were derived from ProUCL. HQ values were calculated for two types of toxicity benchmarks: No Observed Effect Concentration (NOEC) and Lowest Observed Effect Concentration (LOEC). If the HQ value is below 1 based on the NOEC benchmark, it is believed that potential risks are minimal. If the HQ is above 1 based on the NOEC but is equal to or less than 1 based on the LOEC benchmark, it is considered possible that some adverse effects may occur in some individuals, but that the likelihood of a population level effect is low. If the HQ based on the LOEC exceeds 1, then adverse effects are potentially significant, with the magnitude of the hazard increasing as the HQ increases. For this assessment, LOEC-based benchmarks for wildlife were calculated based on the ratio between available dose-based wildlife no-observed adverse effect level (NOAEL)-based and lowest observed adverse effect level (LOAEL)-based Toxicity Reference Values (TRVs) obtained from other ecological risk assessments in Region 8 (Booz Allen Hamilton 2012): LOEC benchmark = NOEC benchmark x (TRVLOAEL / TRVNOAEL)

FINAL
FINAL Ecological Risk Assessment Smurfit-Stone Frenchtown Mill Operable Unit 1 20
Sessile Receptors For sessile or nearly sessile receptors (plants, soil invertebrates), any given individual is exposed to the local concentration where that receptor exists, as opposed to being exposed to a site-wide average. For this reason, hazard for this type of receptor is best characterized as a distribution of HQ values, with each value representing one particular sampling location. Hazard is evaluated by considering the frequency and magnitude of the HQ values that exceed 1.0. As above, if most NOEC-based HQs for individuals in a population of receptors are below 1, it is very unlikely that unacceptable effects will occur in the exposed population. Conversely, if many or all of the LOEC-based HQs are above 1, then unacceptable effects on the exposed population may occur, especially if the HQ values are large. If only a small portion of the exposed population has LOEC-based HQ values that exceed 1, some individuals may be impacted, but population-level effects are less likely to occur. As the fraction of the population with LOEC-based HQ values above 1 increases, and as the magnitude of the exceedances increases, risk that a population-level effect will occur also increases. For this evaluation, LOEC-based benchmarks for plants and soil invertebrates were not available. In the absence of these values, risks to plants and soil invertebrates were only evaluated based on the available NOEC-based benchmarks.
5.2 Results Mobile Receptors (Birds, Mammals) Table 5-1 shows the calculated NOEC-based and LOEC-based HQ values for birds and mammals exposed to copper and selenium in OU1 soil. For copper, all HQ values (both NOEC and LOEC-based) are below 1, indicating that hazard is minimal. For selenium, both HQ values are below 1 for birds, but for mammals both HQs slightly exceed 1. This indicates that risks to mammals from selenium may exist, but the hazard is likely to be low.
Sessile Receptors (Plants, Soil invertebrates) Figure 5-1 shows the sample-specific NOEC-based and LOEC-based HQ values for plants and soil invertebrates exposed to copper in OU1 soil. NOEC-based values based on background soils are shown for comparison. As seen, all HQ values in site soils are below one, and the NOEC-based values in site soils are very similar to NOEC-HQ values in background soils. This indicates that copper in OU1 soils is likely to pose minimal risk to plants and soil invertebrates.

FINAL
FINAL Ecological Risk Assessment Smurfit-Stone Frenchtown Mill Operable Unit 1 21
Figure 5-2 shows the sample-specific NOEC-based and LOEC-based HQ values for plants and soil invertebrates exposed to selenium in OU1 soil. NOEC-based values based on background soils are shown for comparison. For soil invertebrates (bottom panel), both NOEC- and LOEC-based HQ values in site soils are below one, indicating that selenium in OU1 soils is likely to pose minimal risk to soil invertebrates. For plants (upper panel), most NOEC-based HQ values for selenium are above 1, but the highest HQ values is relatively small (about 3). Assuming the LOEC is at least 3-times higher than the NOEC, this means that almost all LOEC-based HQ values for selenium are below 1. As discussed above, this pattern indicates that selenium in site soils may pose a hazard to plants, but the magnitude of the hazard is likely to be low.
Summary Based on the risk assessment process described above, risks to ecological receptors are considered to be below a level of concern and/or not greater than background for all contaminants in all media except copper and selenium in OU1 soil. The level of hazard from these two COPECs is summarized below.
Receptor Hazard from Copper Hazard from Selenium Birds Minimal Minimal Mammals Minimal Low Plants Minimal Low Soil Invertebrates Minimal Minimal

FINAL
FINAL Ecological Risk Assessment Smurfit-Stone Frenchtown Mill Operable Unit 1 22
6.0 UNCERTAINTY ASSESSMENT Quantitative evaluation of exposures and risks to ecological receptors from environmental contamination is frequently limited by uncertainties in the representativeness of the environmental data and in the toxicological benchmarks used to identify and evaluate COPECs. The following sections discuss the most important sources of uncertainty in this assessment.
6.1 Representativeness of Environmental Data As noted above, no COPECs were identified in surface water for O’Keefe and Lavalle Creeks. However, data from these two creeks are limited in number and in time (samples were all collected on one day). Consequently, there is some uncertainty as to whether a more extensive set of surface water data would have yielded a different finding. However, this is considered to be unlikely, since fate and transport processes that may cause movement of site-related contaminants into O’Keefe and Lavalle Creeks is considered to be limited (Newfield, 2015).
6.2 Uncertainties from Contaminants Not Evaluated As described above, contaminants were screened only if a relevant benchmark was available. In the absence of an available benchmark, no conclusions can be drawn regarding if a contaminant without a benchmark should be identified as a COPEC. Additionally, contaminants detected at less than 5% were not identified as COPECs. In some cases, the average detection limit is higher than the available benchmark. This indicates that the detection limit for measuring that contaminant was not sensitive enough to determine if that contaminant was present at the site at concentrations below the benchmark. Such contaminants may contribute a small amount of added risk, but the contribution is expected to be small and this is not considered a significant source of uncertainty. TEQ in surface water was identified as a COPEC because of its potential to bioaccumulate. A robust comparison of TEQ concentrations in O’Keefe and Lavalle Creeks to background surface water could not be conducted due to data limitations. However, as described in Section 4.2, observed concentrations were similar in water samples from site locations and background locations. Therefore, although it is unknown if TEQ is elevated in OU1 surface waters, any authentic elevation above background concentrations appears to be small and is therefore likely to be of minimal ecological concern.

FINAL
FINAL Ecological Risk Assessment Smurfit-Stone Frenchtown Mill Operable Unit 1 23
6.3 Uncertainties in Benchmarks The benchmarks used in this assessment generally do not account for the wide variety of differences between site media and the test systems used to establish the toxicity benchmarks. Laboratory tests generally do not account for site-specific factors that influence toxicity in site media (e.g., hardness in surface water, pH and total organic content in soil). Additionally, laboratory tests may not utilize test species that are likely to occur at the OU1 site. For example, there is some question as to whether the plant benchmark of 0.52 mg/kg for selenium is appropriate to apply to plants in OU1. This benchmark value is based on toxicological studies of agricultural species, which are more sensitive to selenium than other plant species (USEPA 2007). In addition, the form of selenium and amount of sulfate in the soil are known to impact selenium effects on plant growth. The NOECs listed by USEPA (2007) were reported for tests using sandy soils with low sulfate and the most toxic form of selenium tested, which would also drive the NOEC down (USEPA 2007). The geometric mean of NOECs, reported by USEPA (2007) to be 0.52 mg/kg, is driven by a single study which reports growth effects for 20% of the population (EC20) at concentrations below the mean for three species. However in this same study, when species were tested in soils with high organic matter content, the EC20s were 1 mg/kg or greater. Given these considerations, it is considered likely that HQ values computed based on this benchmark are probably an overestimate of hazard to plants growing in OU1.
6.4 Uncertainties in Background Comparisons Background data for surface soils for statistical comparisons were derived from a statewide dataset (Hydrometrics, 2013) which may not accurately represent the geochemistry of soils in the Missoula Valley. This region is known to have large phosphoria formations which are also associated with elevated levels of selenium (Sheldon 1957). In the Missoula Valley in particular, there are known areas of high phosphate concentrations that occur upstream of the site on the CFR (Pardee 1917). Natural geologic conditions are therefore a likely contributor to the selenium concentrations noted in OU1, and the state-wide background soil data may not have high enough resolution to properly represent local background conditions at the site. Although the statistical tests comparing OU1 and background levels of copper and selenium indicated that OU1 levels appear to be higher, it is nevertheless apparent that distribution and range of site and background concentrations of these contaminants are actually rather similar, as shown below:

FINAL
FINAL Ecological Risk Assessment Smurfit-Stone Frenchtown Mill Operable Unit 1 24
Analyte
OU1 Surface Soil (mg/kg)
Background Surface Soil (mg/kg)
N Mean ± SD Range N Mean ± SD Range
Copper 96 19 ± 7.3 0.33 - 34 112 18 ± 10 3.8 – 71
Selenium 18 0.89 ± 0.49 0.28 – 1.8 112 0.38 ± 0.24 0.2 – 1.6
Mean and standard deviation were calculated with non-detects at ½ the method detection limit.
Thus, confidence that either copper or selenium in OU1 surface soil is authentically or meaningfully higher than background is low.
7.0 REFERENCES Booz Allen Hamilton. 2012. Derivation of Mammalian and Avian Dose-Based Toxicity Reference Values and Soil Screening Levels for Selected Chemicals. Prepared for U.S. Environmental Protection Agency Region 8. December. Hydrometrics. 2011. Montana Dioxin Background Investigation Report. Montana Department of Environmental Quality. April 2011. Hydrometrics. 2013. Background Concentrations of Inorganic Constituents in Montana Surface Soils. Montana Department of Environmental Quality. September 2013. MFISH. 2016. Montana Fisheries Information System. Available online at http://fwp.mt.gov/fishing/mFish/. MTNHP. 2017. Montana Animal Species of Concern Report. Montana Natural Heritage Program and Montana Fish, Wildlife and Parks. Retrieved on 1/2017 from http://mtnhp.org/SpeciesOfConcern/?AorP=a. Newfields. 2015. Remedial Investigation Work Plan. Smurfit Stone/Frenchtown Mill Missoula County, Montana. November. Pardee, JT. 1917. The Garrison and Phillipsburg Phosphate Fields, Montana. USGS Bulletin 640: 195-208. Sheldon, Richard Porter. 1957. Physical stratigraphy of the Phosphoria Formation in northwestern Wyoming. School of Mineral Sciences. No. 1042.

FINAL
FINAL Ecological Risk Assessment Smurfit-Stone Frenchtown Mill Operable Unit 1 25
USEPA. 1992. Framework for Ecological Risk Assessment. U.S. Environmental Protection Agency Risk Assessment Forum. EPA/630/R-92/001. USEPA. 1995. Final Water Quality Guidance for the Great Lakes System. 40 CFR 9, 122, 123, 131, and 132. Part III. USEPA. 1997. Ecological Risk Assessment Guidance for Superfund: Process for Designing and Conducting Ecological Risk Assessments. Interim Final. EPA 540-R-97-006, OSWER 9285.7-25, PB97-963211. June. USEPA. 1998. Guidelines for Ecological Risk Assessment. EPA/630/R-95/002F. April. USEPA. 2001. The Role of Screening-Level Risk Assessments and Refining Contaminants of Concern in Baseline Ecological Risk Assessments. EPA 540/F-01/014. June. USEPA. 2002. Role of Background in the CERCLA Cleanup Program. OSWER 9285.6-07P. April. USEPA. 2003. Guidance for Deriving Ecological Soil Screening Levels (Eco-SSLs). Draft. February. USEPA. 2007. Ecological Soil Screening Levels for Selenium. Interim Final. USEPA, Office of Solid Waste and Emergency Response. July. USEPA. 2010. Recommended Toxicity Equivalence Factors (TEFs) for Human Health Risk Assessments of 2,3,7,8-Tetrachlorodibenzo-p-dioxin and Dioxin-Like Compounds. EPA/100/R 10/005. December. USEPA. 2012. Analytical Results Report for a Combined Site Inspection and Removal Assessment. Smurfit-Stone Mill, near Missoula, Missoula County, MT. USEPA-START. (TDD No. 1105-09 and 1109-07). USEPA. 2013. ProUCL Version 5.0.00 User Guide. Statistical Software for Environmental Applications for Data Sets with and without Nondetect Observations. U.S. Environmental Protection Agency, Office of Research and Development. EPA/600/R-07/041.September. USFWS. 2016. Endangered, Threatened, Proposed and Candidate Species, Montana Counties. Endangered Species Act. USDOI, Fish and Wildlife Service, Ecological Services, Montana Field Office. November.

FINAL
FINAL Ecological Risk Assessment Smurfit-Stone Frenchtown Mill Operable Unit 1 26
Van den Berg, M., Birnbaum, L, Vosveld AT., et al. 1998. Toxic equivalency factors (TEFs) for PCBs, PCDDs, PCDFs for humans and wildlife. Environ Health Perspect 106(12): 775-792.

FIGURES

Fig 1-1 ERAGs.doc
STEP 1: SCREENING LEVEL Site Visit Problem Formulation Toxicity Evaluation
STEP 2: SCREENING LEVEL Exposure Estimate Risk Characterization C
ompi
le E
xist
ing
Info
rmat
ion
STEP 3: PROBLEM FORMULATION
STEP 4: STUDY DESIGN AND DQO PROCESS
Lines of Evidence Measurement Endpoints
Work Plan and Sampling and Analysis Plan
STEP 5: VERIFICATION OF FIELD SAMPLING DESIGN
STEP 6: SITE INVESTIGATION AND DATA ANALYSIS
STEP 7: RISK CHARACTERIZATION
STEP 8: RISK MANAGEMENT
Dat
a C
olle
ctio
n
SMDP
Risk Assessor and Risk Manager
Agreement
SMDP
SMDP
SMDP
SMDP
SMDP
Toxicity Evaluation
Questions/Hypotheses
Assessment Endpoints
Conceptual Model Exposure Pathways
Figure 1-1. Eight Step Process for Ecological Risk Assessment at Superfund Sites
Source: USEPA 1997 SMDP = Scientific/Management Decision Point
~----~H.________.
§̈¦I 90
£¤93
15N14N
T14N
T14N
T15N
T15N
0 10,000FeetSite Location Map
Former Frenchtown Mill SiteMissoula County, Montana
FIGURE 2-1
P:\35
0.006
5 M2G
reen\A
GIS\P
roject
s\201
5_Sit
eInves
tigati
on\20
15 FS
P Figu
res\FI
GURE
1-Sit
e Loc
ation
Map.
mxd SITE
£¤93
MISSOULA
Source: Montana USGS 100K Topographic Map
_̂
M O N T A N A
Site
O
FRENCHTOWN
· : Newfields

Color RemovalPlant
CL
SWB F
SWB G
SWB Cb
SPP
SB20
AB3
AB1
AB2
SWB A
P8dc
SWB6
NPP
SWB Ca
P8
HP2
P3
P17
P5
P4
HP13a
HP11HP10
HP1a
HP7
HP12
HP9
HP1
HP13
C l a r k F o r k R i v e r
INTERSTATE 90
MULLAN ROAD
Parcel Soldin 2012
AG7
AG8
AG9
AG6
AG5
AG4
AG3
AG2
AG1
WR2
WR1
IN
IB J
HP18
HP16
FP
IB K
CRPB
LF
SB19
Rail Spur Line
PetersonRanch
Office/Farmhouse
O0 1,600Feet
Site Plan and Operable UnitsFormer Frenchtown Mill Site
Missoula County, Montana FIGURE 2-2
P:\350.0065 M2Green\AGIS\Projects\2015_SiteInvestigation\2015 RIWP Figures\FIGURE 2 - Site Plan and Operable Units.mxd Revised 10/8/2015
Mill Site Boundary
100-Year Floodplain*
Operable Units
OU1 - Agricultural Lands
OU2 - Industrial Area
OU3 - Wastewater Treatment and Storage Areas,
Aerial Photo Source: NAIP 2011
*Floodplain Source:As defined by the Federal EmergencyManagement Agency (FEMA) 2013Digital Flood Insurance Rate Map(DFIRM). (NFIP 2013)
NotesAG - Agricultural LandAB - Aeration Stabilization BasinCFR - Clark Fork RiverCRPB - Color Removal Plant BasinCL - ClarifierFP - Floodplain AreaHP - Holding or Storage PondIB - Rapid Infiltration Basin
LF - Land farmIN - Industrial AreaNPP - North Polishing PondOU - Operable UnitP - Settling PondSB - Spoils BasinSPP - South Polishing PondSWB - Solid Waste BasinWR - West of the Clark Fork River
_̂
M O N T A N A
Site
O ' K e e f e C r e e k
LEGEND
L a Valle Cre ek
L aVall e Creek
Site-wide Groundwater and CFR**
**Where Contaminant of PotentialConcern from the Site have cometo be located in the CFR
•: Newfields

! !
!
!
!
!
!
!
!
!
!
!
!
!
!
!
!!
!
!!
!
( (
(
(
(
(
(
(
(
(
(
(
(
(
(
(
((
(
((
(
#
##
#
#
#
#
#
#
#
#
*
**
*
*
*
*
*
*
*
*
!
!
!
!
!
!
!
!
!
!
I N T E R S T A T E 9 0
M I S S O U L AB i
t t er r o
o t R i v e r
Gr a n t
C r e e k
Ra t
t l e s n a k e C r e e k
B l a c k f o o t R i v e rC l a r k
F o r kR i v e r
C l a r k F o r k R i v e r
B u t l e r C r e e k
L a V a l l e C r e e k
O ' Ke e
f eC r
e ek
SE21-OK-SASE20-OK-SA
SE1-CFR-SA
SE19-LV-SASE18-LV-SA
SE17-LV-SA
SE16-BR-SA
SE9-CFR-SA
SE8-CFR-SA
SE7-CFR-SA
SE5-CFR-SA
SE4-CFR-SA
SE3-CFR-SA
SE33-BR-FF
SE2-CFR-SA
SE27-CFR-FF
SE26-CFR-FF
SE25-CFR-FF
SE23-CFR-FF
SE22-CFR-SA
SE15-CFR-SA
SE14-CFR-SASE13-CFR-SA
SE12-CFR-SA
SE11-CFR-SA
SE10-CFR-SA
SE32-CFR-FF
SE31-CFR-FFSE30-CFR-FFSE29-CFR-FF
SE28-CFR-FF
SE6-CFR-SA
SE24-CFR-FF
SW8-BR
SW7-CFR
SW6-CFR
SW5-CFR
SW4-CFR
SW3-CFR
SW2-CFR
SW10-OK
SW9-LV
SW1-CFR
O0 12,000Feet
P:\350
.0065
M2Gre
en\AG
IS\Pro
jects\2
015_S
iteInve
stigatio
n\2015
Prelim
Summ
aryRp
t\PDS
R_Fig
ures\F
IGURE
8 - Su
rface a
nd Se
diment
Samp
ling Lo
cation
.mxd R
evised
6/27/2
016
! Surface Water Sample#* Flood Fringe Sediment Sample!( Bed Sediment Sample
Mill Site Boundary
LEGEND
Service Layer Credits: Source: Esri, DigitalGlobe, GeoEye, i-cubed, USDA,USGS, AEX, Getmapping, Aerogrid, IGN, IGP, swisstopo, and the GIS UserCommunity
Surface Water and SedimentSampling Locations
Former Frenchtown Mill SiteMissoula County, Montana
FIGURE 2-3•: Newfields

Dust in Air Inhalation
Ingestion
Direct Contact
Ingestion
IngestionDirect Contact
Groundwater Ingestion
Ingestion Direct Contact
Ingestion
Direct Contact
LEGEND
Pathway is complete and might be significant. Pathway is complete, but is relatively minor.
Pathway is not complete.
Notes:[1] O'Keefe and Lavalle Creeks.
Historic Mill Operations
Contamination Sources
Exposure Route
Benthic Organisms
Surface Soil
Vapors in Air Inhalation
Aquatic Receptors [1] Terrestrial Receptors
Terrestrial Food Items (Plants, Invertebrates,
Mammals)
Figure 2-4. Conceptual Site Model for Ecological Exposure at OU1 - Agricultural Area Soils
Wildlife Receptors (Birds &
Mammals)
Sediment
Subsurface Soil
Aquatic Food Items (Fish, Aquatic
Invertebrates & Plants)Ingestion
Soil InvertebratesPlants
Surface Water
Fish
Potentially Impacted Media and Release Mechanisms
uptake into tissues
wind disturbance
Direct deposition
Leaching
vaporization from soil
sedimentation, dissolution
runoff
uptake into tissues
Smurfit_OU1_Draft Eco CSM_v3.xlsx
I I
I I
I 7 I I I I I I
~ ---1 I I I I I I
I I I I I I I I
I I
I I I I I I I I I
~ ~
~ I I I I I I
I I I I I I I I

List of ChemicalsAnalyzed
Is Chemical a Bioaccumulative?
Does Compound have a benchmark?
Is maximum detected concentration > benchmark? Not a COPEC
COPEC
Figure 3-1. COPEC Selection Procedure
Source of Uncertainty
Was DL>benchmark?
Was chemical detected ≥ 5%?
yes
no
yes
no
yes
nono
yes
no
yes
Figure 3-1.xls
-~
.. ,,
-~
, I I -~
L..o ,~

Figure 4-1. Site versus Background Surface Water TEQ (ND=MDL/2) Concentrations
0.0E+00
1.0E‐07
2.0E‐07
3.0E‐07
4.0E‐07
5.0E‐07
6.0E‐07
Detects
Non‐detects
OU1 SITE BACKGROUND
OU1 SW Site and Background Check.xlsx
·~---• 0 0 • • •

Exposed to Copper in OU1 SoilsFigure 5-1. Hazard Quotients for Plants and Soil Invertebrates
0.001
0.01
0.1
1
10
HQ
Plants
Detect Non-detect
OU1 SITE SOIL MDEQ BACKGROUND SOIL
LOEC-adjusted HQs NOEC-based HQs
0.001
0.01
0.1
1
10
HQ
Soil Invertebrates
Detect Non-detect
OU1 SITE SOIL MDEQ BACKGROUND SOIL
LOEC-adjusted HQs NOEC-based HQs
0.001
0.01
0.1
1
10
HQ
Plants
Detect Non-detect
OU1 SITE SOIL MDEQ BACKGROUND SOIL
LOEC-adjusted HQs NOEC-based HQs
OU1 Soil_Screen_with HQ Calcs.xlsx
I • 0 I
............................................. . .............................. ,,,,. . . . ...............................
·1.· .,.-,·. • ••• •a. I .. ~- •~•t•-J•
., . . . . . .,. , .. ~:--~--~ • •tl • .. ·1· ••• 4'-. •• :..• 'I •1•,, • :. .,_, I • • • . . , .• ,. • t •••• • '1f.,• •• I
• •• • • •
• • • •
• • 0 0
Oo
l I
I • 0 I
.............................................. . .............................. • llf •••••••••••••• ,,,,. . . •
·1.· ., • .,-. ··~.,, I .. ~- •~•t•-J•
., . . . . . .,. , .. ~:--~--~ • =~- . , ·1· 'I •1•,, • :. .,_, I
••• 4'-. •• :..•
. . ,,.,. • t •••• • '1f.,• •• I
•• • • •
• • • •
• • 0 0
Oo
I I

Exposed to Selenium in OU1 SoilsFigure 5-2. Hazard Quotients for Plants and Soil Invertebrates
0.1
1
10
HQ
Plants
Detect Non-detect
OU1 SITE SOIL MDEQ BACKGROUND SOIL
LOEC-adjusted HQs NOEC-based HQs
0.01
0.1
1
10
HQ
Soil Invertebrates
Detect Non-detect
OU1 SITE SOIL MDEQ BACKGROUND SOIL
LOEC-adjusted HQs NOEC-based HQs
0.1
1
10
HQ
Plants
Detect Non-detect
OU1 SITE SOIL MDEQ BACKGROUND SOIL
LOEC-adjusted HQs NOEC-based HQs
OU1 Soil_Screen_with HQ Calcs.xlsx
I • 0
• • • • • • • • • • • •
• • •• • • • • . . .. . .. . - .. ...... ····················•······················•········································ ...................................... . . . . . . .... -·· . . • • •• .. -- -·· • • • • • OIi:> CD 0 Ooa::x:D O <D
• 0 • 0
I • 0 I
............................................... ............................................... ..............................................
• • • • .: • • • • • • • • • • • • • • • •• • •• • - • • • • -• • • - • • ' • • • •••• -·· • • • Q, •• .. -- -·· • • • • • OIi) CD 0 Ooa::x:D 0 (D
• 0 • 0
I

TABLES

Scientific Name Common Name Status
Ursus arctos horribilis Grizzly Bear LT
Howellia aquatilis Water Howellia LT
Lynx canadensis Canada Lynx LT, CH
Salvelinus confluentus Bull Trout LT, CH
Coccyzus americanus Yellow-billed cuckoo (western pop.) LT
Calidris canutus rufa Red Knot LT
Gulo gulo luscus Wolverine P
Pinus albicaulis Whitebark Pine C
Notes:C = CandidateLT = Listed ThreatenedP = ProposedCH = Designated Critical Habitat
Table 2-1. Endangered, Threatened, Proposed and Candidate Species in Missoula County, Montana
Source: U.S. Fish and Wildlife Service, Montana Field Office. November 25, 2016 (https://www.fws.gov/montanafieldoffice/Endangered_Species/Listed_Species/countylist.pdf)
Revised OU1 ERA Tables.xlsx

Media Sample Date Sample Description Analysis
Apr-14 Surface (0-2.4 inches) soil samples were collected from 18 locations (n=18). TAL metals, dioxins and furans.
Nov-15Surface soil samples were collected from 0-2 inch and 5-7 inch depth intervals at 39 locations (n=78).
TAL metals, PAHs, dioxins and furans.
Sediment Nov-15Sediment samples were collected from 0-0.34 feet at three locations in Lavalle Creek and two locations on O’Keefe Creek.
Aroclors, TAL metals, dioxins and furans.
Surface water Nov-15Two surface water samples were collected; one from Lavalle Creek and one from O’Keefe Creek.
Aroclors, total and dissolved TAL metals, SVOCs, dioxins and furans.
Table 2-2. Data Summary
Soil

Analysis AnalyteNumber of
Samples
Number of Detected Samples
Detection Frequency
(%)
Average
Concentrationa
(mg/kg)
Standard Deviation
Maximum Detected
Concentration (mg/kg)
Average MDL
(mg/kg)
Avian TEQ (ND=0) 96 96 100 1.0E-07 2.1E-07 1.2E-06 --Avian TEQ (ND=1/2MDL) 96 96 100 1.5E-07 2.0E-07 1.2E-06 --Avian TEQ (ND=MDL) 96 96 100 2.0E-07 2.0E-07 1.3E-06 --Mammalian TEQ (ND=0) 96 96 100 1.7E-07 2.3E-07 1.2E-06 --Mammalian TEQ (ND=1/2MDL) 96 96 100 2.0E-07 2.3E-07 1.2E-06 --Mammalian TEQ (ND=MDL) 96 96 100 2.4E-07 2.2E-07 1.3E-06 --Aluminum 96 96 100 1.3E+04 6.4E+03 3.1E+04 5.7E+00Antimony 18 14 78 1.3E-01 5.8E-02 2.4E-01 9.3E-02Arsenic 96 96 100 4.2E+00 1.5E+00 7.9E+00 1.3E-01Barium 96 96 100 2.0E+02 8.6E+01 4.3E+02 8.7E-02Beryllium 18 18 100 7.4E-01 3.5E-01 1.2E+00 8.4E-02Cadmium 96 91 95 1.5E-01 6.0E-02 2.8E-01 3.1E-02Calcium 18 18 100 1.8E+04 5.0E+04 2.2E+05 4.2E+01Chromium 96 91 95 1.0E+01 4.2E+00 1.9E+01 2.1E-01Cobalt 96 96 100 5.5E+00 2.2E+00 1.0E+01 2.5E-01Copper 96 94 98 1.9E+01 7.3E+00 3.4E+01 3.7E-01Iron 96 96 100 1.3E+04 4.9E+03 2.2E+04 2.8E+01Lead 96 96 100 1.0E+01 3.4E+00 2.1E+01 5.6E-02Magnesium 18 18 100 1.3E+04 2.6E+04 1.2E+05 1.5E+01Manganese 96 96 100 3.3E+02 1.4E+02 7.3E+02 2.3E-01Mercury 96 21 22 9.3E-03 1.3E-02 8.0E-02 8.0E-03Nickel 96 92 96 9.3E+00 4.0E+00 1.6E+01 1.5E-01Potassium 18 18 100 3.0E+03 1.2E+03 4.9E+03 8.3E+01Selenium 18 16 89 8.9E-01 4.9E-01 1.8E+00 3.0E-01Silver 96 0 0 7.4E-02 3.7E-02 -- 1.5E-01Sodium 18 18 100 9.4E+01 4.0E+01 1.7E+02 2.9E+01Thallium 96 86 90 1.4E-01 5.7E-02 2.6E-01 3.8E-02Vanadium 96 96 100 1.4E+01 4.1E+00 2.2E+01 2.6E-01Zinc 96 96 100 5.3E+01 1.8E+01 9.1E+01 1.3E+00Acenaphthene 78 0 0 2.3E-04 1.6E-05 -- 4.5E-04Acenaphthylene 78 0 0 2.1E-04 1.5E-05 -- 4.3E-04Anthracene 78 0 0 1.9E-04 1.3E-05 -- 3.9E-04Benzo(a)anthracene 78 0 0 1.2E-04 7.9E-06 -- 2.3E-04Benzo(a)pyrene 78 0 0 1.2E-04 8.8E-06 -- 2.5E-04Benzo(b)fluoranthene 78 1 1 3.8E-04 1.4E-03 1.3E-02 4.4E-04Benzo(g,h,i)perylene 78 0 0 2.2E-04 1.5E-05 -- 4.5E-04Benzo(k)fluoranthene 78 0 0 2.5E-04 1.7E-05 -- 5.1E-04Chrysene 78 0 0 1.6E-04 1.1E-05 -- 3.1E-04Dibenzo(a,h)anthracene 78 0 0 2.7E-04 1.9E-05 -- 5.4E-04Fluoranthene 78 1 1 5.1E-04 3.2E-03 2.9E-02 2.8E-04Fluorene 78 0 0 2.0E-04 1.3E-05 -- 3.9E-04Indeno(1,2,3-cd)pyrene 78 0 0 2.4E-04 1.7E-05 -- 4.9E-04Naphthalene 78 0 0 2.3E-04 1.6E-05 -- 4.7E-04Phenanthrene 78 1 1 3.3E-04 1.5E-03 1.4E-02 3.1E-04Pyrene 78 1 1 4.5E-04 2.7E-03 2.4E-02 3.0E-04
MDL = method detection limit; ND = non-detects; TEQ = Toxicity Equivalencea Non-detects evaluated at 1/2 the MDL.
Table 2-3. OU1 Surface Soil Summary Statistics
TEQb
Metals
SVOCs
bTEQ values were calculated using TEFs for mammals from USEPA (2010) and using TEFs for birds from van Den Berg et al. (1998).

Analysis AnalyteNumber
of Samples
Number of Detected Samples
Detection Frequency
(%)
Average
Concentrationa
(ug/L)
Standard
Deviationa
(ug/L)
Maximum Detected
Concentration (ug/L)
Average MDL (ug/L)
Aroclor-1016 2 0 0 2.3E-02 3.5E-04 -- 4.6E-02Aroclor-1221 2 0 0 9.8E-03 3.5E-04 -- 2.0E-02Aroclor-1232 2 0 0 1.8E-02 3.5E-04 -- 3.7E-02Aroclor-1242 2 0 0 1.4E-02 0.0E+00 -- 2.8E-02Aroclor-1248 2 0 0 6.3E-03 3.5E-04 -- 1.3E-02Aroclor-1254 2 0 0 7.8E-03 3.5E-04 -- 1.6E-02Aroclor-1260 2 0 0 7.3E-03 3.5E-04 -- 1.5E-02Aroclor-1262 2 0 0 2.1E-02 3.5E-04 -- 4.2E-02Aroclor-1268 2 0 0 1.1E-02 3.5E-04 -- 2.3E-02Avian TEQ (ND=0) 2 2 100 2.1E-08 2.2E-08 3.6E-08 --Avian TEQ (ND=1/2MDL) 2 2 100 4.4E-07 2.1E-08 4.6E-07 --Avian TEQ (ND=MDL) 2 2 100 8.6E-07 2.0E-08 8.8E-07 --Mammalian TEQ (ND=0) 2 2 100 6.6E-08 3.7E-08 9.2E-08 --Mammalian TEQ (ND=1/2MDL) 2 2 100 3.9E-07 3.7E-08 4.2E-07 --Mammalian TEQ (ND=MDL) 2 2 100 7.1E-07 3.6E-08 7.4E-07 --
Aluminum 2 2 100 8.0E+02 7.4E+02 1.3E+03 3.0E+00Arsenic 2 2 100 1.7E+00 7.1E-02 1.7E+00 1.1E-01Barium 2 2 100 2.6E+02 8.5E+00 2.6E+02 8.1E-02Cadmium 2 0 0 1.2E-02 0.0E+00 -- 2.4E-02Chromium 2 1 50 6.4E-01 7.9E-01 1.2E+00 1.7E-01Cobalt 2 1 50 2.3E-01 2.4E-01 4.0E-01 1.3E-01Copper 2 0 0 1.1E-01 0.0E+00 -- 2.1E-01Iron 2 2 100 6.4E+02 5.3E+02 1.0E+03 1.4E+01Lead 2 2 100 5.0E-01 2.2E-01 6.5E-01 4.6E-02Manganese 2 2 100 1.4E+01 8.9E+00 2.0E+01 2.4E-01Mercury 2 0 0 1.1E-02 0.0E+00 -- 2.2E-02Nickel 2 0 0 8.0E-02 0.0E+00 -- 1.6E-01Silver 2 0 0 7.5E-02 0.0E+00 -- 1.5E-01Thallium 2 0 0 7.5E-03 0.0E+00 -- 1.5E-02Vanadium 2 2 100 1.4E+00 2.1E-01 1.5E+00 2.8E-01Zinc 2 1 50 3.1E+00 2.7E+00 5.0E+00 2.4E+00
Aluminum 2 1 50 2.2E+01 2.9E+01 4.2E+01 3.0E+00Arsenic 2 2 100 1.4E+00 7.1E-02 1.4E+00 1.1E-01Barium 2 2 100 2.3E+02 1.8E+01 2.4E+02 8.1E-02Cadmium 2 0 0 1.2E-02 0.0E+00 -- 2.4E-02Calcium 2 2 100 4.1E+04 1.7E+04 5.2E+04 6.7E+01Chromium 2 0 0 8.5E-02 0.0E+00 -- 1.7E-01Cobalt 2 1 50 4.9E-01 6.0E-01 9.2E-01 1.3E-01Copper 2 0 0 1.1E-01 0.0E+00 -- 2.1E-01Iron 2 0 0 6.9E+00 0.0E+00 -- 1.4E+01Lead 2 0 0 2.3E-02 0.0E+00 -- 4.6E-02Magnesium 2 2 100 1.8E+04 6.2E+03 2.2E+04 2.0E+01Manganese 2 2 100 8.4E+00 3.1E+00 1.1E+01 2.4E-01Nickel 2 0 0 8.0E-02 0.0E+00 -- 1.6E-01Potassium 2 0 0 6.3E+01 0.0E+00 -- 1.3E+02Silver 2 0 0 7.5E-02 0.0E+00 -- 1.5E-01Sodium 2 2 100 1.6E+04 1.0E+04 2.3E+04 3.3E+01Thallium 2 0 0 7.5E-03 0.0E+00 -- 1.5E-02Vanadium 2 0 0 1.4E-01 0.0E+00 -- 2.8E-01Zinc 2 0 0 1.2E+00 0.0E+00 -- 2.4E+001,2,4-Trichlorobenzene 2 0 0 9.5E-01 0.0E+00 -- 1.9E+001,2-Dichlorobenzene 2 0 0 9.5E-01 0.0E+00 -- 1.9E+001,2-Diphenylhydrazine 2 0 0 1.3E+00 0.0E+00 -- 2.5E+001,3-Dichlorobenzene 2 0 0 8.3E-01 3.5E-02 -- 1.7E+001,4-Dichlorobenzene 2 0 0 9.5E-01 0.0E+00 -- 1.9E+001-Methylnaphthalene 2 0 0 1.1E+00 0.0E+00 -- 2.1E+002,4,5-Trichlorophenol 2 0 0 1.1E+00 0.0E+00 -- 2.2E+002,4,6-Trichlorophenol 2 0 0 1.1E+00 0.0E+00 -- 2.2E+002,4-Dichlorophenol 2 0 0 1.2E+00 0.0E+00 -- 2.3E+002,4-Dimethylphenol 2 0 0 3.4E+00 3.5E-02 -- 6.9E+002,4-Dinitrophenol 2 0 0 1.4E+00 0.0E+00 -- 2.8E+002,4-Dinitrotoluene 2 0 0 1.1E+00 3.5E-02 -- 2.2E+002,6-Dinitrotoluene 2 0 0 1.2E+00 0.0E+00 -- 2.3E+002-Chloronaphthalene 2 0 0 1.1E+00 3.5E-02 -- 2.3E+002-Chlorophenol 2 0 0 1.1E+00 0.0E+00 -- 2.2E+002-Methylnaphthalene 2 0 0 1.1E+00 0.0E+00 -- 2.1E+002-Nitroaniline 2 0 0 1.4E+00 0.0E+00 -- 2.8E+00
Table 2-4. OU1 Surface Water Summary Statistics
Aroclors
Total Metals
DissolvedMetals
SVOCs
TEQb

Analysis AnalyteNumber
of Samples
Number of Detected Samples
Detection Frequency
(%)
Average
Concentrationa
(ug/L)
Standard
Deviationa
(ug/L)
Maximum Detected
Concentration (ug/L)
Average MDL (ug/L)
Table 2-4. OU1 Surface Water Summary Statistics
2-Nitrophenol 2 0 0 1.1E+00 3.5E-02 -- 2.3E+003,3`-Dichlorobenzidine 2 0 0 2.5E+00 3.5E-02 -- 5.0E+003-Nitroaniline 2 0 0 2.5E+00 3.5E-02 -- 5.1E+004,6-Dinitro-o-cresol 2 0 0 1.8E+00 3.5E-02 -- 3.6E+004-Bromophenyl phenyl ether 2 0 0 1.2E+00 0.0E+00 -- 2.4E+004-Chloro-3-methylphenol 2 0 0 8.0E-01 0.0E+00 -- 1.6E+004-Chlorophenyl phenyl ether 2 0 0 7.0E-01 0.0E+00 -- 1.4E+004-Nitroaniline 2 0 0 2.2E+00 0.0E+00 -- 4.4E+004-Nitrophenol 2 0 0 1.7E+00 0.0E+00 -- 3.4E+00Acenaphthene 2 0 0 8.3E-01 3.5E-02 -- 1.7E+00Acenaphthylene 2 0 0 1.1E+00 3.5E-02 -- 2.3E+00Anthracene 2 0 0 1.3E+00 0.0E+00 -- 2.5E+00Benzo(a)anthracene 2 0 0 2.6E+00 0.0E+00 -- 5.1E+00Benzo(a)pyrene 2 0 0 1.2E+00 0.0E+00 -- 2.4E+00Benzo(b)fluoranthene 2 0 0 1.3E+00 0.0E+00 -- 2.5E+00Benzo(g,h,i)perylene 2 0 0 1.3E+00 0.0E+00 -- 2.5E+00Benzo(k)fluoranthene 2 0 0 1.4E+00 0.0E+00 -- 2.8E+00bis(2-chloroethoxy)methane 2 0 0 7.8E-01 3.5E-02 -- 1.6E+00bis(2-chloroethyl)ether 2 0 0 1.2E+00 0.0E+00 -- 2.3E+00Bis(2-chloroisopropyl)ether 2 0 0 1.2E+00 0.0E+00 -- 2.3E+00Bis(2-ethylhexyl)phthalate 2 0 0 1.2E+00 0.0E+00 -- 2.4E+00Butyl benzyl phthalate 2 0 0 9.5E-01 0.0E+00 -- 1.9E+00Carbazole 2 0 0 1.4E+00 0.0E+00 -- 2.7E+00Chrysene 2 0 0 1.2E+00 0.0E+00 -- 2.3E+00Dibenzo(a,h)anthracene 2 0 0 9.0E-01 0.0E+00 -- 1.8E+00Dibenzofuran 2 0 0 1.2E+00 0.0E+00 -- 2.3E+00Dibutyl phthalate 2 0 0 1.2E+00 3.5E-02 -- 2.5E+00Diethyl phthalate 2 0 0 1.3E+00 0.0E+00 -- 2.5E+00Dimethyl phthalate 2 0 0 1.2E+00 3.5E-02 -- 2.4E+00Di-n-octyl phthalate 2 0 0 8.5E-01 0.0E+00 -- 1.7E+00Fluoranthene 2 0 0 1.3E+00 0.0E+00 -- 2.5E+00Fluorene 2 0 0 1.2E+00 0.0E+00 -- 2.4E+00Hexachlorobenzene 2 0 0 1.3E+00 0.0E+00 -- 2.6E+00Hexachlorobutadiene 2 0 0 8.5E-01 0.0E+00 -- 1.7E+00Hexachloroethane 2 0 0 8.5E-01 0.0E+00 -- 1.7E+00Indeno(1,2,3-cd)pyrene 2 0 0 9.0E-01 0.0E+00 -- 1.8E+00Isophorone 2 0 0 8.0E-01 0.0E+00 -- 1.6E+00m & p-cresols 2 0 0 1.2E+00 0.0E+00 -- 2.3E+00Naphthalene 2 0 0 1.0E+00 0.0E+00 -- 2.0E+00Nitrobenzene 2 0 0 1.3E+00 0.0E+00 -- 2.5E+00N-Nitrosodimethylamine 2 0 0 1.2E+00 0.0E+00 -- 2.3E+00N-Nitrosodi-n-propylamine 2 0 0 1.2E+00 0.0E+00 -- 2.3E+00N-Nitrosodiphenylamine 2 0 0 2.0E+00 3.5E-02 -- 4.0E+00o-Cresol 2 0 0 1.0E+00 0.0E+00 -- 2.0E+00p-Chloroaniline 2 0 0 1.8E+00 3.5E-02 -- 3.7E+00Pentachlorophenol 2 0 0 1.1E+00 0.0E+00 -- 2.2E+00Phenanthrene 2 0 0 1.3E+00 3.5E-02 -- 2.6E+00Phenol 2 0 0 1.1E+00 3.5E-02 -- 2.3E+00Pyrene 2 0 0 1.3E+00 0.0E+00 -- 2.5E+00
MDL = method detection limit; ND = non-detects; TEQ = Toxicity EquivalenceaNon-detects evaluated at 1/2 the MDL.bTEQ values were calculated using TEFs for mammals from USEPA (2010) and using TEFs for birds from van Den Berg et al. (1998).
SVOCs

Analysis AnalyteNumber of
Samples
Number of Detected Samples
Detection Frequency
(%)
Average
Concentrationa
(mg/kg)
Standard Deviation
Maximum Detected
Concentration (mg/kg)
Average MDL
(mg/kg)
Aroclor-1016 5 0 0 6.8E-03 3.0E-03 -- 1.4E-02Aroclor-1221 5 0 0 1.6E-02 7.1E-03 -- 3.2E-02Aroclor-1232 5 0 0 7.0E-03 3.2E-03 -- 1.4E-02Aroclor-1242 5 0 0 1.8E-02 8.1E-03 -- 3.6E-02Aroclor-1248 5 0 0 1.2E-02 5.2E-03 -- 2.3E-02Aroclor-1254 5 0 0 4.4E-03 2.0E-03 -- 8.8E-03Aroclor-1260 5 0 0 4.5E-03 2.0E-03 -- 9.0E-03Aroclor-1262 5 0 0 5.9E-03 2.7E-03 -- 1.2E-02Aroclor-1268 5 0 0 4.1E-03 1.8E-03 -- 8.2E-03Avian TEQ (ND=0) 5 5 100 8.9E-07 1.5E-06 3.6E-06 --Avian TEQ (ND=1/2MDL) 5 5 100 9.2E-07 1.5E-06 3.6E-06 --Avian TEQ (ND=MDL) 5 5 100 9.5E-07 1.5E-06 3.6E-06 --Mammalian TEQ (ND=0) 5 5 100 9.8E-07 1.2E-06 3.1E-06 --Mammalian TEQ (ND=1/2MDL) 5 5 100 1.0E-06 1.2E-06 3.1E-06 --Mammalian TEQ (ND=MDL) 5 5 100 1.0E-06 1.2E-06 3.1E-06 --Aluminum 5 5 100 9.8E+03 3.2E+03 1.4E+04 7.8E+00Arsenic 5 5 100 7.4E+00 5.0E+00 1.3E+01 2.3E-01Barium 5 5 100 2.1E+02 7.9E+01 3.2E+02 1.5E-01Cadmium 5 2 40 2.0E-01 2.9E-01 6.8E-01 5.2E-02Chromium 5 5 100 1.1E+01 2.5E+00 1.4E+01 3.6E-01Cobalt 5 5 100 7.2E+00 3.8E+00 1.3E+01 4.6E-01Copper 5 5 100 4.6E+01 4.2E+01 1.2E+02 6.2E-01Iron 5 5 100 1.4E+04 6.4E+03 2.5E+04 4.7E+01Lead 5 5 100 1.7E+01 6.4E+00 2.3E+01 8.1E-02Manganese 5 5 100 2.6E+02 1.7E+02 4.8E+02 2.6E-01Mercury 5 1 20 3.6E-02 6.4E-02 1.5E-01 1.5E-02Nickel 5 5 100 1.0E+01 3.1E+00 1.5E+01 2.9E-01Silver 5 0 0 1.1E-01 4.7E-02 -- 2.2E-01Thallium 5 0 0 4.1E-02 1.7E-02 -- 8.1E-02Vanadium 5 5 100 1.6E+01 3.5E+00 2.1E+01 5.2E-01Zinc 5 5 100 9.7E+01 8.7E+01 2.5E+02 2.5E+001,2,4-Trichlorobenzene 5 0 0 6.4E-02 2.9E-02 -- 1.3E-011,2-Dichlorobenzene 5 0 0 2.5E-02 1.1E-02 -- 5.0E-021,2-Diphenylhydrazine 5 0 0 1.9E-01 8.7E-02 -- 3.9E-011,3-Dichlorobenzene 5 0 0 2.4E-02 1.1E-02 -- 4.9E-021,4-Dichlorobenzene 5 0 0 2.6E-02 1.2E-02 -- 5.1E-021-Methylnaphthalene 5 0 0 6.7E-02 3.0E-02 -- 1.3E-012,4,5-Trichlorophenol 5 0 0 4.6E-02 2.1E-02 -- 9.2E-022,4,6-Trichlorophenol 5 0 0 5.0E-02 2.3E-02 -- 9.9E-022,4-Dichlorophenol 5 0 0 7.3E-02 3.3E-02 -- 1.5E-012,4-Dimethylphenol 5 0 0 7.2E-02 3.3E-02 -- 1.4E-012,4-Dinitrophenol 5 0 0 1.9E-01 8.7E-02 -- 3.9E-012,4-Dinitrotoluene 5 0 0 1.9E-01 8.7E-02 -- 3.9E-012,6-Dinitrotoluene 5 0 0 3.3E-02 1.5E-02 -- 6.6E-022-Chloronaphthalene 5 0 0 6.0E-02 2.7E-02 -- 1.2E-012-Chlorophenol 5 0 0 9.0E-02 4.1E-02 -- 1.8E-012-Methylnaphthalene 5 0 0 6.9E-02 3.1E-02 -- 1.4E-012-Nitroaniline 5 0 0 4.2E-02 1.9E-02 -- 8.4E-022-Nitrophenol 5 0 0 6.6E-02 3.0E-02 -- 1.3E-013,3`-Dichlorobenzidine 5 0 0 5.4E-02 2.4E-02 -- 1.1E-013-Nitroaniline 5 0 0 3.9E-02 1.8E-02 -- 7.9E-024,6-Dinitro-o-cresol 5 0 0 7.7E-02 3.5E-02 -- 1.5E-014-Bromophenyl phenyl ether 5 0 0 4.1E-02 1.9E-02 -- 8.2E-024-Chloro-3-methylphenol 5 0 0 1.9E-01 8.7E-02 -- 3.9E-014-Chlorophenyl phenyl ether 5 0 0 4.4E-02 2.0E-02 -- 8.9E-024-Nitroaniline 5 0 0 3.4E-02 1.5E-02 -- 6.8E-024-Nitrophenol 5 0 0 4.1E-02 1.8E-02 -- 8.1E-02Acenaphthene 5 0 0 4.5E-02 2.0E-02 -- 8.9E-02Acenaphthylene 5 0 0 5.1E-02 2.3E-02 -- 1.0E-01Anthracene 5 0 0 1.9E-01 8.7E-02 -- 3.9E-01Benzo(a)anthracene 5 0 0 1.9E-01 8.7E-02 -- 3.9E-01Benzo(a)pyrene 5 0 0 1.9E-01 8.7E-02 -- 3.9E-01Benzo(b)fluoranthene 5 0 0 4.9E-02 2.2E-02 -- 9.8E-02Benzo(g,h,i)perylene 5 0 0 4.7E-02 2.1E-02 -- 9.4E-02Benzo(k)fluoranthene 5 0 0 4.9E-02 2.2E-02 -- 9.9E-02bis(2-chloroethoxy)methane 5 0 0 7.5E-02 3.4E-02 -- 1.5E-01bis(2-chloroethyl)ether 5 0 0 2.7E-02 1.2E-02 -- 5.4E-02
Table 2-5. OU1 Sediment Summary Statistics
Aroclors
TEQb
Metals
SVOCs

Analysis AnalyteNumber of
Samples
Number of Detected Samples
Detection Frequency
(%)
Average
Concentrationa
(mg/kg)
Standard Deviation
Maximum Detected
Concentration (mg/kg)
Average MDL
(mg/kg)
Table 2-5. OU1 Sediment Summary Statistics
Bis(2-chloroisopropyl)ether 5 0 0 8.9E-02 4.0E-02 -- 1.8E-01Bis(2-ethylhexyl)phthalate 5 0 0 6.6E-02 3.0E-02 -- 1.3E-01Butyl benzyl phthalate 5 0 0 1.9E-01 8.7E-02 -- 3.9E-01Carbazole 5 0 0 1.9E-01 8.7E-02 -- 3.9E-01Chrysene 5 0 0 5.2E-02 2.3E-02 -- 1.0E-01Dibenzo(a,h)anthracene 5 0 0 1.9E-01 8.7E-02 -- 3.9E-01Dibenzofuran 5 0 0 1.9E-01 8.7E-02 -- 3.9E-01Dibutyl phthalate 5 0 0 5.4E-02 2.4E-02 -- 1.1E-01Diethyl phthalate 5 0 0 1.9E-01 8.7E-02 -- 3.9E-01Dimethyl phthalate 5 0 0 1.9E-01 8.7E-02 -- 3.9E-01Di-n-octyl phthalate 5 0 0 1.9E-01 8.7E-02 -- 3.9E-01Fluoranthene 5 0 0 1.9E-01 8.7E-02 -- 3.9E-01Fluorene 5 0 0 1.9E-01 8.7E-02 -- 3.9E-01Hexachlorobenzene 5 0 0 5.1E-02 2.3E-02 -- 1.0E-01Hexachlorobutadiene 5 0 0 3.2E-02 1.5E-02 -- 6.5E-02Hexachloroethane 5 0 0 2.5E-02 1.1E-02 -- 4.9E-02Indeno(1,2,3-cd)pyrene 5 0 0 1.9E-01 8.7E-02 -- 3.9E-01Isophorone 5 0 0 6.2E-02 2.8E-02 -- 1.2E-01m & p-cresols 5 0 0 7.7E-02 3.5E-02 -- 1.5E-01Naphthalene 5 0 0 7.2E-02 3.3E-02 -- 1.4E-01Nitrobenzene 5 0 0 7.8E-02 3.5E-02 -- 1.6E-01N-Nitrosodimethylamine 5 0 0 1.9E-01 8.7E-02 -- 3.9E-01N-Nitrosodi-n-propylamine 5 0 0 5.3E-02 2.4E-02 -- 1.1E-01N-Nitrosodiphenylamine 5 0 0 1.9E-01 8.7E-02 -- 3.9E-01o-Cresol 5 0 0 8.4E-02 3.8E-02 -- 1.7E-01p-Chloroaniline 5 0 0 5.9E-02 2.7E-02 -- 1.2E-01Pentachlorophenol 5 0 0 1.9E-01 8.7E-02 -- 3.9E-01Phenanthrene 5 0 0 5.5E-02 2.5E-02 -- 1.1E-01Phenol 5 0 0 8.4E-02 3.8E-02 -- 1.7E-01Pyrene 5 0 0 4.9E-02 2.2E-02 -- 9.7E-02
MDL = method detection limit; ND = non-detects; TEQ = Toxicity EquivalenceaNon-detects evaluated at 1/2 the MDL.
SVOCs
bTEQ values were calculated using TEFs for mammals from USEPA (2010) and using TEFs for birds from van Den Berg et al. (1998).

Does chemical have a
benchmark?
Is chemical detected ≥5%?
Is Max Detect > benchmark?
Is MDL > benchmark?
Avian TEQ ND=0 100% 1.2E-06 -- XAvian TEQ ND=1/2MDL 100% 1.2E-06 -- XAvian TEQ ND=MDL 100% 1.3E-06 -- XMammalian TEQ ND=0 100% 1.2E-06 -- XMammalian TEQ ND=1/2MDL 100% 1.2E-06 -- XMammalian TEQ ND=MDL 100% 1.3E-06 -- XAluminum 100% 3.1E+04 5.7E+00 5.0E+01 yes yes yes XAntimony 78% 2.4E-01 9.3E-02 2.7E-01 yes yes no XArsenic 100% 7.9E+00 1.3E-01 1.0E+01 yes yes no XBarium 100% 4.3E+02 8.7E-02 3.3E+02 yes yes yes XBeryllium 100% 1.2E+00 8.4E-02 1.0E+01 yes yes no XCadmium 95% 2.8E-01 3.1E-02 3.6E-01 yes yes no XCalcium 100% 2.2E+05 4.2E+01 NV no yes XChromium 95% 1.9E+01 2.1E-01 4.0E-01 yes yes yes XCobalt 100% 1.0E+01 2.5E-01 1.3E+01 yes yes no XCopper 98% 3.4E+01 3.7E-01 2.8E+01 yes yes yes XIron 100% 2.2E+04 2.8E+01 NV no yes XLead 100% 2.1E+01 5.6E-02 1.1E+01 yes yes yes XMagnesium 100% 1.2E+05 1.5E+01 NV no yes XManganese 100% 7.3E+02 2.3E-01 2.2E+02 yes yes yes XMercury 22% 8.0E-02 8.0E-03 1.0E-01 yes yes no XNickel 96% 1.6E+01 1.5E-01 3.0E+01 yes yes no XPotassium 100% 4.9E+03 8.3E+01 NV no yes XSelenium 89% 1.8E+00 3.0E-01 5.2E-01 yes yes yes XSilver 0% -- 1.5E-01 2.0E+00 yes no no XSodium 100% 1.7E+02 2.9E+01 NV no yes XThallium 90% 2.6E-01 3.8E-02 1.0E+00 yes yes no XVanadium 100% 2.2E+01 2.6E-01 2.0E+00 yes yes yes XZinc 100% 9.1E+01 1.3E+00 4.6E+01 yes yes yes X
HMW PAHs 1% 6.8E-02 3.8E-03 1.1E+00 yes no no no X
LMW PAHs 1% 1.6E-02 2.4E-03 2.9E+01 yes no no no X
Polycyclic AromaticHydrocarbons
(PAHs)a
TEQ = Toxicity equivalence; MDL = method detection limit; PAH = polyaromatic hydrocarbon; HMW = high-molecular weight; LMW = low molecular weight; NV = no value
COPECNot a
COPECSource of
Uncertainty
Dioxins/Furans TEQ identified as a bioaacumulative and is retained as a COPEC.
Metals
Table 3-1. OU1 Surface Soil COPEC Screen
Analysis AnalyteDetection
Frequency (%)
Maximum Detected
Concentration (mg/kg)
Average MDL
(mg/kg)
Soil Benchmark (mg/kg)
COPEC SELECTION STEPS OU1 SOIL COPECs
Revised OU1 ERA Tables.xlsx
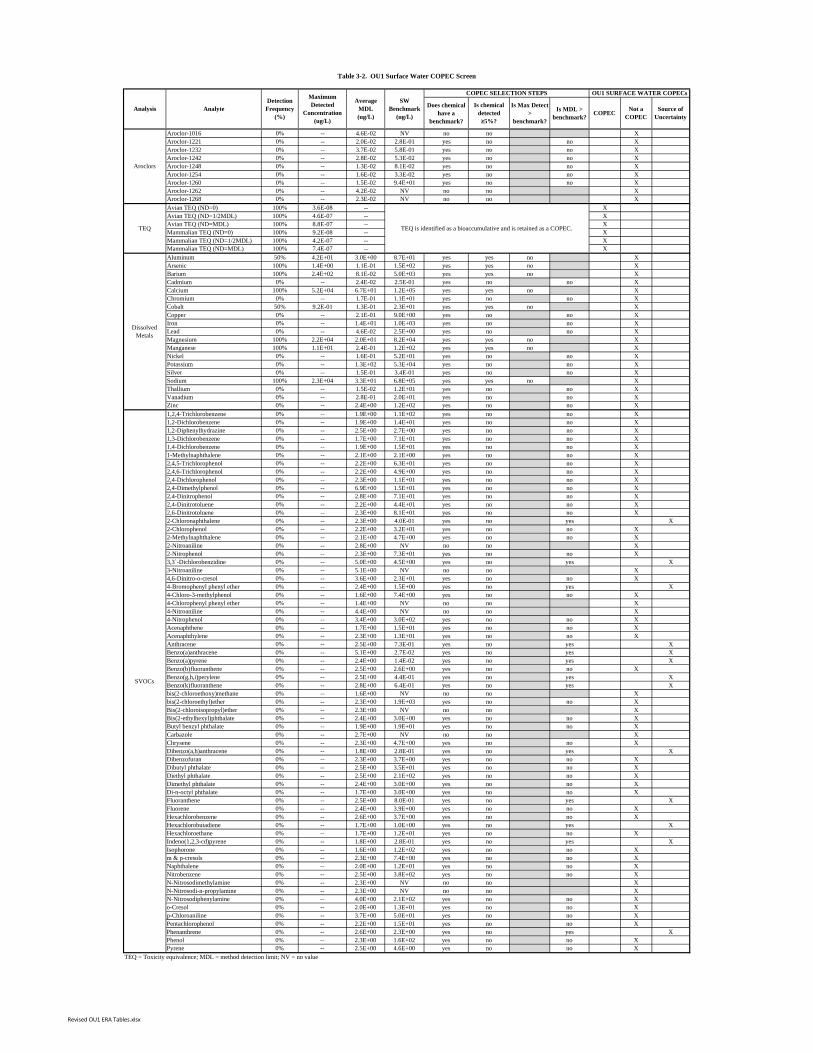
Does chemical have a
benchmark?
Is chemical detected ≥5%?
Is Max Detect >
benchmark?
Is MDL > benchmark?
Aroclor-1016 0% -- 4.6E-02 NV no no XAroclor-1221 0% -- 2.0E-02 2.8E-01 yes no no XAroclor-1232 0% -- 3.7E-02 5.8E-01 yes no no XAroclor-1242 0% -- 2.8E-02 5.3E-02 yes no no XAroclor-1248 0% -- 1.3E-02 8.1E-02 yes no no XAroclor-1254 0% -- 1.6E-02 3.3E-02 yes no no XAroclor-1260 0% -- 1.5E-02 9.4E+01 yes no no XAroclor-1262 0% -- 4.2E-02 NV no no XAroclor-1268 0% -- 2.3E-02 NV no no XAvian TEQ (ND=0) 100% 3.6E-08 -- XAvian TEQ (ND=1/2MDL) 100% 4.6E-07 -- XAvian TEQ (ND=MDL) 100% 8.8E-07 -- XMammalian TEQ (ND=0) 100% 9.2E-08 -- XMammalian TEQ (ND=1/2MDL) 100% 4.2E-07 -- XMammalian TEQ (ND=MDL) 100% 7.4E-07 -- XAluminum 50% 4.2E+01 3.0E+00 8.7E+01 yes yes no XArsenic 100% 1.4E+00 1.1E-01 1.5E+02 yes yes no XBarium 100% 2.4E+02 8.1E-02 5.0E+03 yes yes no XCadmium 0% -- 2.4E-02 2.5E-01 yes no no XCalcium 100% 5.2E+04 6.7E+01 1.2E+05 yes yes no XChromium 0% -- 1.7E-01 1.1E+01 yes no no XCobalt 50% 9.2E-01 1.3E-01 2.3E+01 yes yes no XCopper 0% -- 2.1E-01 9.0E+00 yes no no XIron 0% -- 1.4E+01 1.0E+03 yes no no XLead 0% -- 4.6E-02 2.5E+00 yes no no XMagnesium 100% 2.2E+04 2.0E+01 8.2E+04 yes yes no XManganese 100% 1.1E+01 2.4E-01 1.2E+02 yes yes no XNickel 0% -- 1.6E-01 5.2E+01 yes no no XPotassium 0% -- 1.3E+02 5.3E+04 yes no no XSilver 0% -- 1.5E-01 3.4E-01 yes no no XSodium 100% 2.3E+04 3.3E+01 6.8E+05 yes yes no XThallium 0% -- 1.5E-02 1.2E+01 yes no no XVanadium 0% -- 2.8E-01 2.0E+01 yes no no XZinc 0% -- 2.4E+00 1.2E+02 yes no no X1,2,4-Trichlorobenzene 0% -- 1.9E+00 1.1E+02 yes no no X1,2-Dichlorobenzene 0% -- 1.9E+00 1.4E+01 yes no no X1,2-Diphenylhydrazine 0% -- 2.5E+00 2.7E+00 yes no no X1,3-Dichlorobenzene 0% -- 1.7E+00 7.1E+01 yes no no X1,4-Dichlorobenzene 0% -- 1.9E+00 1.5E+01 yes no no X1-Methylnaphthalene 0% -- 2.1E+00 2.1E+00 yes no no X2,4,5-Trichlorophenol 0% -- 2.2E+00 6.3E+01 yes no no X2,4,6-Trichlorophenol 0% -- 2.2E+00 4.9E+00 yes no no X2,4-Dichlorophenol 0% -- 2.3E+00 1.1E+01 yes no no X2,4-Dimethylphenol 0% -- 6.9E+00 1.5E+01 yes no no X2,4-Dinitrophenol 0% -- 2.8E+00 7.1E+01 yes no no X2,4-Dinitrotoluene 0% -- 2.2E+00 4.4E+01 yes no no X2,6-Dinitrotoluene 0% -- 2.3E+00 8.1E+01 yes no no X2-Chloronaphthalene 0% -- 2.3E+00 4.0E-01 yes no yes X2-Chlorophenol 0% -- 2.2E+00 3.2E+01 yes no no X2-Methylnaphthalene 0% -- 2.1E+00 4.7E+00 yes no no X2-Nitroaniline 0% -- 2.8E+00 NV no no X2-Nitrophenol 0% -- 2.3E+00 7.3E+01 yes no no X3,3`-Dichlorobenzidine 0% -- 5.0E+00 4.5E+00 yes no yes X3-Nitroaniline 0% -- 5.1E+00 NV no no X4,6-Dinitro-o-cresol 0% -- 3.6E+00 2.3E+01 yes no no X4-Bromophenyl phenyl ether 0% -- 2.4E+00 1.5E+00 yes no yes X4-Chloro-3-methylphenol 0% -- 1.6E+00 7.4E+00 yes no no X4-Chlorophenyl phenyl ether 0% -- 1.4E+00 NV no no X4-Nitroaniline 0% -- 4.4E+00 NV no no X4-Nitrophenol 0% -- 3.4E+00 3.0E+02 yes no no XAcenaphthene 0% -- 1.7E+00 1.5E+01 yes no no XAcenaphthylene 0% -- 2.3E+00 1.3E+01 yes no no XAnthracene 0% -- 2.5E+00 7.3E-01 yes no yes XBenzo(a)anthracene 0% -- 5.1E+00 2.7E-02 yes no yes XBenzo(a)pyrene 0% -- 2.4E+00 1.4E-02 yes no yes XBenzo(b)fluoranthene 0% -- 2.5E+00 2.6E+00 yes no no XBenzo(g,h,i)perylene 0% -- 2.5E+00 4.4E-01 yes no yes XBenzo(k)fluoranthene 0% -- 2.8E+00 6.4E-01 yes no yes Xbis(2-chloroethoxy)methane 0% -- 1.6E+00 NV no no Xbis(2-chloroethyl)ether 0% -- 2.3E+00 1.9E+03 yes no no XBis(2-chloroisopropyl)ether 0% -- 2.3E+00 NV no no XBis(2-ethylhexyl)phthalate 0% -- 2.4E+00 3.0E+00 yes no no XButyl benzyl phthalate 0% -- 1.9E+00 1.9E+01 yes no no XCarbazole 0% -- 2.7E+00 NV no no XChrysene 0% -- 2.3E+00 4.7E+00 yes no no XDibenzo(a,h)anthracene 0% -- 1.8E+00 2.8E-01 yes no yes XDibenzofuran 0% -- 2.3E+00 3.7E+00 yes no no XDibutyl phthalate 0% -- 2.5E+00 3.5E+01 yes no no XDiethyl phthalate 0% -- 2.5E+00 2.1E+02 yes no no XDimethyl phthalate 0% -- 2.4E+00 3.0E+00 yes no no XDi-n-octyl phthalate 0% -- 1.7E+00 3.0E+00 yes no no XFluoranthene 0% -- 2.5E+00 8.0E-01 yes no yes XFluorene 0% -- 2.4E+00 3.9E+00 yes no no XHexachlorobenzene 0% -- 2.6E+00 3.7E+00 yes no no XHexachlorobutadiene 0% -- 1.7E+00 1.0E+00 yes no yes XHexachloroethane 0% -- 1.7E+00 1.2E+01 yes no no XIndeno(1,2,3-cd)pyrene 0% -- 1.8E+00 2.8E-01 yes no yes XIsophorone 0% -- 1.6E+00 1.2E+02 yes no no Xm & p-cresols 0% -- 2.3E+00 7.4E+00 yes no no XNaphthalene 0% -- 2.0E+00 1.2E+01 yes no no XNitrobenzene 0% -- 2.5E+00 3.8E+02 yes no no XN-Nitrosodimethylamine 0% -- 2.3E+00 NV no no XN-Nitrosodi-n-propylamine 0% -- 2.3E+00 NV no no XN-Nitrosodiphenylamine 0% -- 4.0E+00 2.1E+02 yes no no Xo-Cresol 0% -- 2.0E+00 1.3E+01 yes no no Xp-Chloroaniline 0% -- 3.7E+00 5.0E+01 yes no no XPentachlorophenol 0% -- 2.2E+00 1.5E+01 yes no no XPhenanthrene 0% -- 2.6E+00 2.3E+00 yes no yes XPhenol 0% -- 2.3E+00 1.6E+02 yes no no XPyrene 0% -- 2.5E+00 4.6E+00 yes no no X
TEQ = Toxicity equivalence; MDL = method detection limit; NV = no value
Dissolved Metals
SVOCs
COPECNot a
COPECSource of
Uncertainty
Aroclors
TEQ TEQ is identified as a bioaccumulative and is retained as a COPEC.
Table 3-2. OU1 Surface Water COPEC Screen
Analysis AnalyteDetection
Frequency (%)
Maximum Detected
Concentration (ug/L)
Average MDL (ug/L)
SW Benchmark
(ug/L)
COPEC SELECTION STEPS OU1 SURFACE WATER COPECs
Revised OU1 ERA Tables.xlsx

Does chemical have a
benchmark?
Is chemical detected ≥5%?
Is Max Detect > benchmark?
Is MDL > benchmark?
COPECNot a
COPECSource of
Uncertainty
Aroclor-1016 0% -- 1.4E-02 NV no no XAroclor-1221 0% -- 3.2E-02 NV no no XAroclor-1232 0% -- 1.4E-02 NV no no XAroclor-1242 0% -- 3.6E-02 NV no no XAroclor-1248 0% -- 2.3E-02 NV no no XAroclor-1254 0% -- 8.8E-03 NV no no XAroclor-1260 0% -- 9.0E-03 NV no no XAroclor-1262 0% -- 1.2E-02 NV no no XAroclor-1268 0% -- 8.2E-03 NV no no XAvian TEQ ND=0 100% 3E-06 -- XAvian TEQ ND=1/2MDL 100% 3E-06 -- XAvian TEQ ND=MDL 100% 3E-06 -- XMammalian TEQ ND=0 100% 3E-06 -- XMammalian TEQ ND=1/2MDL 100% 3E-06 -- XMammalian TEQ ND=MDL 100% 3E-06 -- XAluminum 100% 1.4E+04 7.8E+00 2.6E+04 yes yes no XArsenic 100% 1.3E+01 2.3E-01 9.8E+00 yes yes yes XBarium 100% 3.2E+02 1.5E-01 NV no yes XCadmium 40% 6.8E-01 5.2E-02 9.9E-01 yes yes no XChromium 100% 1.4E+01 3.6E-01 4.3E+01 yes yes no XCobalt 100% 1.3E+01 4.6E-01 NV no yes XCopper 100% 1.2E+02 6.2E-01 3.2E+01 yes yes yes XIron 100% 2.5E+04 4.7E+01 1.9E+05 yes yes no XLead 100% 2.3E+01 8.1E-02 3.6E+01 yes yes no XManganese 100% 4.8E+02 2.6E-01 6.3E+02 yes yes no XMercury 20% 1.5E-01 1.5E-02 1.8E-01 yes yes no XNickel 100% 1.5E+01 2.9E-01 2.3E+01 yes yes no XSilver 0% -- 2.2E-01 1.0E+00 yes no no XThallium 0% -- 8.1E-02 NV no no XVanadium 100% 2.1E+01 5.2E-01 NV no yes XZinc 100% 2.5E+02 2.5E+00 1.2E+02 yes yes yes XHMW PAHs 0% -- 2.4E+00 1.9E-01 yes no yes XLMW PAHs 0% -- 1.9E+00 7.6E-02 yes no yes X1,2,4-Trichlorobenzene 0% -- 1.3E-01 2.1E+00 yes no no X1,2-Dichlorobenzene 0% -- 5.0E-02 1.7E-02 yes no yes X1,2-Diphenylhydrazine 0% -- 3.9E-01 NV no no X1,3-Dichlorobenzene 0% -- 4.9E-02 4.4E+00 yes no no X1,4-Dichlorobenzene 0% -- 5.1E-02 6.0E-01 yes no no X2,4,5-Trichlorophenol 0% -- 9.2E-02 NV no no X2,4,6-Trichlorophenol 0% -- 9.9E-02 2.1E-01 yes no no X2,4-Dichlorophenol 0% -- 1.5E-01 1.2E-01 yes no yes X2,4-Dimethylphenol 0% -- 1.4E-01 2.9E-02 yes no yes X2,4-Dinitrophenol 0% -- 3.9E-01 NV no no X2,4-Dinitrotoluene 0% -- 3.9E-01 4.2E-02 yes no yes X2,6-Dinitrotoluene 0% -- 6.6E-02 NV no no X2-Chloronaphthalene 0% -- 1.2E-01 NV no no X2-Chlorophenol 0% -- 1.8E-01 3.1E-02 yes no yes X2-Nitroaniline 0% -- 8.4E-02 NV no no X2-Nitrophenol 0% -- 1.3E-01 NV no no X3,3`-Dichlorobenzidine 0% -- 1.1E-01 1.3E-01 yes no no X3-Nitroaniline 0% -- 7.9E-02 NV no no X4,6-Dinitro-o-cresol 0% -- 1.5E-01 NV no no X4-Bromophenyl phenyl ether 0% -- 8.2E-02 1.2E+00 yes no no X4-Chloro-3-methylphenol 0% -- 3.9E-01 NV no no X4-Chlorophenyl phenyl ether 0% -- 8.9E-02 NV no no X4-Nitroaniline 0% -- 6.8E-02 NV no no X4-Nitrophenol 0% -- 8.1E-02 NV no no Xbis(2-chloroethoxy)methane 0% -- 1.5E-01 NV no no Xbis(2-chloroethyl)ether 0% -- 5.4E-02 NV no no XBis(2-chloroisopropyl)ether 0% -- 1.8E-01 NV no no XBis(2-ethylhexyl)phthalate 0% -- 1.3E-01 1.8E-01 yes no no XButyl benzyl phthalate 0% -- 3.9E-01 1.1E+01 yes no no XCarbazole 0% -- 3.9E-01 NV no no XDibutyl phthalate 0% -- 1.1E-01 6.5E+00 yes no no XDiethyl phthalate 0% -- 3.9E-01 6.0E-01 yes no no XDimethyl phthalate 0% -- 3.9E-01 NV no no XDi-n-octyl phthalate 0% -- 3.9E-01 NV no no XHexachlorobenzene 0% -- 1.0E-01 2.0E-02 yes no yes XHexachlorobutadiene 0% -- 6.5E-02 NV no no XHexachloroethane 0% -- 4.9E-02 1.0E+00 yes no no XIsophorone 0% -- 1.2E-01 NV no no Xm & p-cresols 0% -- 1.5E-01 6.7E-01 yes no no XNitrobenzene 0% -- 1.6E-01 NV no no XN-Nitrosodimethylamine 0% -- 3.9E-01 NV no no XN-Nitrosodi-n-propylamine 0% -- 1.1E-01 NV no no XN-Nitrosodiphenylamine 0% -- 3.9E-01 2.7E+00 yes no no Xo-Cresol 0% -- 1.7E-01 NV no no Xp-Chloroaniline 0% -- 1.2E-01 NV no no XPentachlorophenol 0% -- 3.9E-01 5.0E-01 yes no no XPhenol 0% -- 1.7E-01 4.2E-01 yes no no X
TEQ = Toxicity equivalence; MDL = method detection limit; PAH = polyaromatic hydrocarbon; HMW = high-molecular weight; LMW = low molecular weight; NV = no value
Metals
PAHs
SVOCs
SVOCs
Aroclors
TEQ TEQ is identified as a bioaccumulative and retained as a COPEC.
Table 3-3. OU1 Sediment COPEC Screen
Analysis AnalyteDetection Frequency
(%)
Maximum Detected
Concentration (mg/kg)
Average MDL
(mg/kg)
Sediment Benchmark
(mg/kg)
COPEC SELECTION STEPS OU1 SEDIMENT COPECs
Revised OU1 ERA Tables.xlsx
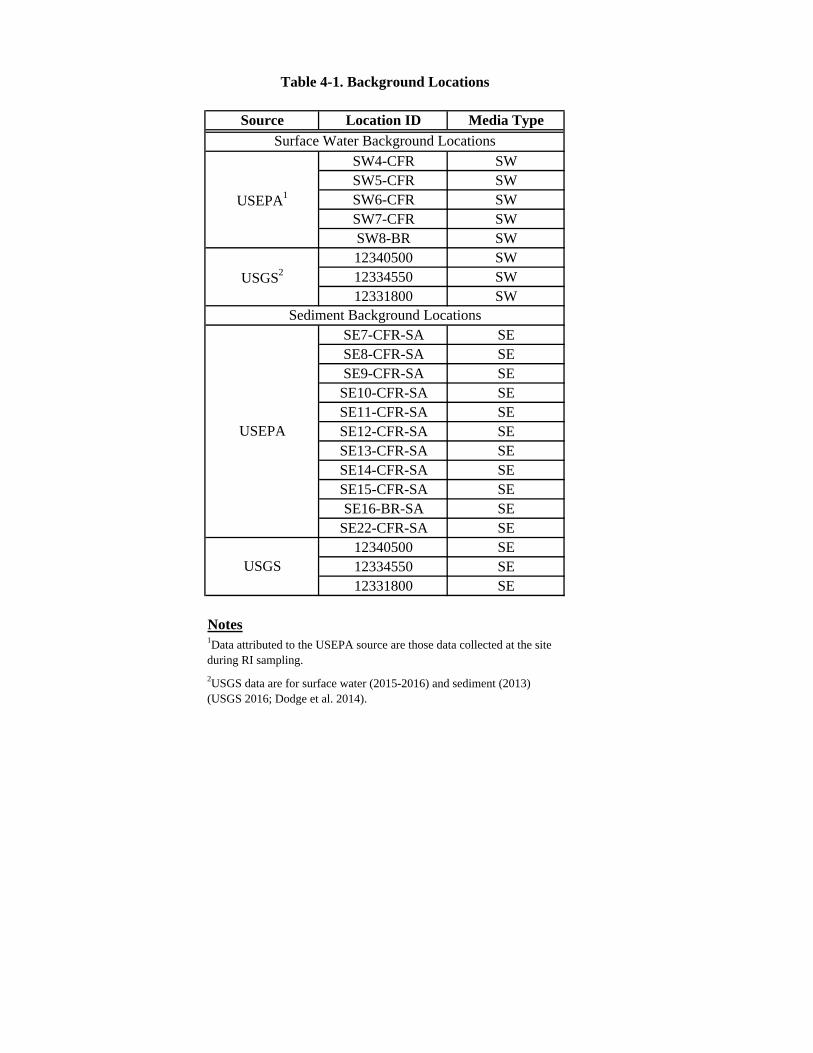
Source Location ID Media Type
SW4-CFR SWSW5-CFR SWSW6-CFR SWSW7-CFR SWSW8-BR SW12340500 SW12334550 SW12331800 SW
SE7-CFR-SA SESE8-CFR-SA SESE9-CFR-SA SESE10-CFR-SA SESE11-CFR-SA SESE12-CFR-SA SESE13-CFR-SA SESE14-CFR-SA SESE15-CFR-SA SESE16-BR-SA SE
SE22-CFR-SA SE12340500 SE12334550 SE12331800 SE
Notes
USGS
1Data attributed to the USEPA source are those data collected at the site during RI sampling.2USGS data are for surface water (2015-2016) and sediment (2013) (USGS 2016; Dodge et al. 2014).
Table 4-1. Background Locations
Surface Water Background Locations
USEPA1
USGS2
Sediment Background Locations
USEPA

Analysis AnalyteNumber of
Samples
Number of Detected Samples
Detection Frequency
(%)
Average
Concentrationa
(mg/kg)
Standard Deviation
Maximum Detected
Concentration (mg/kg)
Average DL
(mg/kg)
Avian TEQ (ND=0) 64 62 97 2.3E-07 3.1E-07 1.6E-06 --Avian TEQ (ND=1/2MDL) 64 62 97 9.5E-07 5.6E-07 2.1E-06 --Avian TEQ (ND=MDL) 64 62 97 1.7E-06 1.1E-06 3.5E-06 --Mammalian TEQ (ND=0) 64 62 97 1.8E-07 2.6E-07 1.6E-06 --Mammalian TEQ (ND=1/2MDL) 64 62 97 7.2E-07 4.6E-07 1.9E-06 --Mammalian TEQ (ND=MDL) 64 62 97 1.3E-06 8.7E-07 2.9E-06 --Aluminum 112 112 100 1.6E+04 5.8E+03 3.4E+04 --Antimony 112 89 79 2.0E-01 1.9E-01 1.2E+00 1.0E-01Arsenic 112 112 100 1.1E+01 1.2E+01 8.2E+01 --Barium 112 112 100 2.0E+02 1.1E+02 5.8E+02 --Beryllium 112 112 100 6.8E-01 2.5E-01 1.4E+00 --Cadmium 112 97 87 2.9E-01 2.0E-01 1.1E+00 1.0E-01Chromium 112 112 100 2.0E+01 1.2E+01 1.3E+02 --Chromium (III) 112 111 99 1.9E+01 1.2E+01 1.3E+02 5.0E+00Chromium (VI) 112 14 13 2.1E-01 1.9E-01 1.2E+00 2.9E-01Cobalt 112 112 100 7.3E+00 2.8E+00 1.6E+01 --Copper 112 112 100 1.8E+01 1.0E+01 7.1E+01 --Iron 112 112 100 1.8E+04 6.8E+03 5.9E+04 --Lead 112 112 100 1.5E+01 6.4E+00 3.7E+01 --Manganese 112 112 100 5.1E+02 3.7E+02 2.9E+03 --Mercury 112 1 1 2.5E-02 4.1E-03 6.8E-02 5.0E-02Nickel 112 112 100 1.7E+01 9.5E+00 8.2E+01 --Selenium 112 88 79 3.8E-01 2.4E-01 1.6E+00 2.0E-01Silver 112 30 27 1.1E-01 8.1E-02 5.0E-01 1.7E-01Thallium 112 112 100 2.5E-01 1.1E-01 8.4E-01 --Vanadium 112 112 100 3.1E+01 1.3E+01 9.2E+01 --Zinc 112 112 100 6.1E+01 2.3E+01 1.5E+02 --
DL = detection limit; ND = non-detects; TEQ = Toxicity Equivalencea Non-detects evaluated at 1/2 the DL.bTEQ values were calculated from data used in the Montana Dioxin Background Investigation Report (MDEQ, 2011).
Table 4-2. Background Surface Soil Summary Statistics
TEQb
Metalsc
cMetals data presented in this table are from Project Report: Background Concentrations of Inorganic Constituents in Montana Surface Soils (Hydrometrics, 2013).

Analysis AnalyteNumber
of Samples
Number of Detected Samples
Detection Frequency
(%)
Average
Concentrationa
(ug/L)
Standard Deviation
Maximum Detected
Concentration (ug/L)
Average MDL (ug/L)
Aroclor-1016 2 0 0 2.3E-02 0.0E+00 -- 4.5E-02Aroclor-1221 2 1 50 7.5E-02 9.2E-02 1.4E-01 2.0E-02Aroclor-1232 2 0 0 1.8E-02 3.5E-04 -- 3.7E-02Aroclor-1242 2 0 0 1.4E-02 0.0E+00 -- 2.8E-02Aroclor-1248 2 0 0 6.0E-03 0.0E+00 -- 1.2E-02Aroclor-1254 2 0 0 7.8E-03 3.5E-04 -- 1.6E-02Aroclor-1260 2 0 0 7.5E-03 0.0E+00 -- 1.5E-02Aroclor-1262 2 0 0 2.1E-02 0.0E+00 -- 4.2E-02Aroclor-1268 2 0 0 1.2E-02 0.0E+00 -- 2.3E-02Avian TEQ (ND=0) 5 3 60 6.4E-10 8.5E-10 2.1E-09 --Avian TEQ (ND=1/2MDL) 5 3 60 4.4E-07 2.2E-08 4.2E-07 --Avian TEQ (ND=MDL) 5 3 60 8.8E-07 4.5E-08 8.5E-07 --Mammalian TEQ (ND=0) 5 3 60 4.1E-09 7.3E-09 1.7E-08 --Mammalian TEQ (ND=1/2MDL) 5 3 60 3.5E-07 1.7E-08 3.4E-07 --Mammalian TEQ (ND=MDL) 5 3 60 6.9E-07 3.7E-08 6.7E-07 --
Aluminum 5 2 40 1.5E+01 1.8E+01 3.6E+01 3.0E+00Arsenic 41 41 100 6.9E+00 4.6E+00 2.0E+01 1.1E-01Barium 5 5 100 1.3E+02 7.4E+01 2.5E+02 8.1E-02Cadmium 41 28 68 7.8E-02 8.2E-02 3.9E-01 2.8E-02Chromium 5 0 0 8.5E-02 0.0E+00 -- 1.7E-01Cobalt 5 0 0 6.5E-02 0.0E+00 -- 1.3E-01Copper 41 39 95 1.4E+01 1.7E+01 8.3E+01 2.1E-01Iron 41 39 95 3.6E+02 3.7E+02 1.8E+03 1.4E+01Lead 41 39 95 2.1E+00 2.5E+00 1.2E+01 4.6E-02Manganese 41 41 100 4.8E+01 4.0E+01 1.9E+02 2.4E-01Mercury 5 0 0 1.1E-02 1.6E-10 -- 2.2E-02Nickel 5 3 60 1.5E-01 6.6E-02 2.3E-01 1.6E-01Silver 5 0 0 7.5E-02 0.0E+00 -- 1.5E-01Thallium 5 0 0 7.5E-03 0.0E+00 -- 1.5E-02Vanadium 5 1 20 2.1E-01 1.7E-01 5.1E-01 2.8E-01Zinc 41 37 90 1.7E+01 1.7E+01 8.2E+01 2.4E+00
Aluminum 5 0 0 1.5E+00 0.0E+00 -- 3.0E+00Arsenic 41 39 95 5.5E+00 3.4E+00 1.3E+01 1.1E-01Barium 5 5 100 1.3E+02 7.8E+01 2.6E+02 8.1E-02Cadmium 41 14 34 2.4E-02 1.6E-02 8.3E-02 2.9E-02Calcium 41 41 100 3.7E+04 1.3E+04 7.2E+04 --Chromium 5 0 0 8.5E-02 0.0E+00 -- 1.7E-01Cobalt 5 3 60 4.8E-01 4.0E-01 8.8E-01 1.3E-01Copper 41 38 93 3.4E+00 3.2E+00 1.8E+01 2.1E-01Iron 41 36 88 2.5E+01 5.5E+01 3.6E+02 1.4E+01Lead 41 30 73 1.6E-01 4.3E-01 2.8E+00 4.3E-02Magnesium 41 41 100 1.0E+04 3.1E+03 1.9E+04 --Manganese 41 41 100 9.5E+00 8.5E+00 4.9E+01 2.4E-01Nickel 5 0 0 8.0E-02 0.0E+00 -- 1.6E-01Potassium 5 1 20 5.6E+02 1.1E+03 2.5E+03 1.3E+02Silver 5 0 0 7.5E-02 0.0E+00 -- 1.5E-01Sodium 5 5 100 6.8E+03 3.7E+03 1.3E+04 3.3E+01Thallium 5 0 0 7.5E-03 0.0E+00 -- 1.5E-02Vanadium 5 0 0 1.4E-01 0.0E+00 -- 2.8E-01Zinc 41 23 56 2.8E+00 2.8E+00 1.7E+01 2.1E+001,2,4-Trichlorobenzene-SVOC 2 0 0 9.5E-01 0.0E+00 -- 1.9E+001,2-Dichlorobenzene-SVOC 2 0 0 9.5E-01 0.0E+00 -- 1.9E+001,2-Diphenylhydrazine 2 0 0 1.2E+00 3.5E-02 -- 2.5E+001,3-Dichlorobenzene-SVOC 2 0 0 8.3E-01 3.5E-02 -- 1.7E+001,4-Dichlorobenzene-SVOC 2 0 0 9.5E-01 0.0E+00 -- 1.9E+001-Methylnaphthalene 2 0 0 1.1E+00 0.0E+00 -- 2.1E+002,4,5-Trichlorophenol 2 0 0 1.1E+00 3.5E-02 -- 2.2E+002,4,6-Trichlorophenol 2 0 0 1.1E+00 0.0E+00 -- 2.2E+002,4-Dichlorophenol 2 0 0 1.2E+00 0.0E+00 -- 2.3E+002,4-Dimethylphenol 2 0 0 3.4E+00 7.1E-02 -- 6.8E+002,4-Dinitrophenol 2 0 0 1.4E+00 3.5E-02 -- 2.8E+002,4-Dinitrotoluene 2 0 0 1.1E+00 3.5E-02 -- 2.2E+002,6-Dinitrotoluene 2 0 0 1.2E+00 0.0E+00 -- 2.3E+002-Chloronaphthalene 2 0 0 1.1E+00 3.5E-02 -- 2.3E+002-Chlorophenol 2 0 0 1.1E+00 0.0E+00 -- 2.2E+002-Methylnaphthalene 2 0 0 1.1E+00 0.0E+00 -- 2.1E+002-Nitroaniline 2 0 0 1.4E+00 0.0E+00 -- 2.8E+00
Table 4-3. Background Surface Water Summary Statistics
Aroclors
TEQ
Total Metals
DissolvedMetals
SVOCs

Analysis AnalyteNumber
of Samples
Number of Detected Samples
Detection Frequency
(%)
Average
Concentrationa
(ug/L)
Standard Deviation
Maximum Detected
Concentration (ug/L)
Average MDL (ug/L)
Table 4-3. Background Surface Water Summary Statistics
2-Nitrophenol 2 0 0 1.1E+00 3.5E-02 -- 2.3E+003,3`-Dichlorobenzidine 2 0 0 2.5E+00 3.5E-02 -- 5.0E+003-Nitroaniline 2 0 0 2.5E+00 3.5E-02 -- 5.1E+004,6-Dinitro-o-cresol 2 0 0 1.8E+00 3.5E-02 -- 3.6E+004-Bromophenyl phenyl ether 2 0 0 1.2E+00 0.0E+00 -- 2.4E+004-Chloro-3-methylphenol 2 0 0 8.0E-01 0.0E+00 -- 1.6E+004-Chlorophenyl phenyl ether 2 0 0 7.0E-01 0.0E+00 -- 1.4E+004-Nitroaniline 2 0 0 2.2E+00 3.5E-02 -- 4.4E+004-Nitrophenol 2 0 0 1.7E+00 0.0E+00 -- 3.4E+00Acenaphthene 2 0 0 8.3E-01 3.5E-02 -- 1.7E+00Acenaphthylene 2 0 0 1.1E+00 3.5E-02 -- 2.3E+00Anthracene 2 0 0 1.2E+00 3.5E-02 -- 2.5E+00Benzo(a)anthracene 2 0 0 2.5E+00 3.5E-02 -- 5.1E+00Benzo(a)pyrene 2 0 0 1.2E+00 0.0E+00 -- 2.4E+00Benzo(b)fluoranthene 2 0 0 1.3E+00 0.0E+00 -- 2.5E+00Benzo(g,h,i)perylene 2 0 0 1.3E+00 0.0E+00 -- 2.5E+00Benzo(k)fluoranthene 2 0 0 1.4E+00 0.0E+00 -- 2.8E+00bis(2-chloroethoxy)methane 2 0 0 7.8E-01 3.5E-02 -- 1.6E+00bis(2-chloroethyl)ether 2 0 0 1.2E+00 0.0E+00 -- 2.3E+00Bis(2-chloroisopropyl)ether 2 0 0 1.1E+00 3.5E-02 -- 2.3E+00Bis(2-ethylhexyl)phthalate 2 0 0 1.2E+00 3.5E-02 -- 2.4E+00Butyl benzyl phthalate 2 0 0 9.5E-01 0.0E+00 -- 1.9E+00Carbazole 2 0 0 1.3E+00 3.5E-02 -- 2.7E+00Chrysene 2 0 0 1.2E+00 0.0E+00 -- 2.3E+00Dibenzo(a,h)anthracene 2 0 0 9.0E-01 0.0E+00 -- 1.8E+00Dibenzofuran 2 0 0 1.2E+00 0.0E+00 -- 2.3E+00Dibutyl phthalate 2 0 0 1.2E+00 3.5E-02 -- 2.5E+00Diethyl phthalate 2 0 0 1.2E+00 3.5E-02 -- 2.5E+00Dimethyl phthalate 2 0 0 1.2E+00 3.5E-02 -- 2.4E+00Di-n-octyl phthalate 2 0 0 8.5E-01 0.0E+00 -- 1.7E+00Fluoranthene 2 0 0 1.3E+00 0.0E+00 -- 2.5E+00Fluorene 2 0 0 1.2E+00 3.5E-02 -- 2.4E+00Hexachlorobenzene 2 0 0 1.3E+00 0.0E+00 -- 2.6E+00Hexachlorobutadiene-SVOC 2 0 0 8.5E-01 0.0E+00 -- 1.7E+00Hexachloroethane 2 0 0 8.3E-01 3.5E-02 -- 1.7E+00Indeno(1,2,3-cd)pyrene 2 0 0 9.0E-01 0.0E+00 -- 1.8E+00Isophorone 2 0 0 8.0E-01 0.0E+00 -- 1.6E+00m & p-cresols 2 0 0 1.1E+00 3.5E-02 -- 2.3E+00Naphthalene-SVOC 2 0 0 1.0E+00 0.0E+00 -- 2.0E+00Nitrobenzene 2 0 0 1.3E+00 0.0E+00 -- 2.5E+00N-Nitrosodimethylamine 2 0 0 1.2E+00 0.0E+00 -- 2.3E+00N-Nitrosodi-n-propylamine 2 0 0 1.2E+00 0.0E+00 -- 2.3E+00N-Nitrosodiphenylamine 2 0 0 2.0E+00 3.5E-02 -- 4.0E+00o-Cresol 2 0 0 1.0E+00 0.0E+00 -- 2.0E+00p-Chloroaniline 2 0 0 1.8E+00 3.5E-02 -- 3.7E+00Pentachlorophenol 2 0 0 1.1E+00 0.0E+00 -- 2.2E+00Phenanthrene 2 0 0 1.3E+00 3.5E-02 -- 2.6E+00Phenol 2 0 0 1.1E+00 3.5E-02 -- 2.3E+00Pyrene 2 0 0 1.2E+00 3.5E-02 -- 2.5E+00
MDL = method detection limit; ND = non-detects; TEQ = Toxicity EquivalenceaNon-detects evaluated at 1/2 the MDL
SVOCs

Analysis AnalyteNumber of
Samples
Number of Detected Samples
Detection Frequency
(%)
Average
Concentrationa
(mg/kg)
Standard Deviation
Maximum Detected
Concentration (mg/kg)
Average MDL
(mg/kg)
Aroclor-1016 2 0 0 5.7E-03 2.5E-03 -- 1.1E-02Aroclor-1221 2 0 0 1.3E-02 6.0E-03 -- 2.6E-02Aroclor-1232 2 0 0 5.9E-03 2.7E-03 -- 1.2E-02Aroclor-1242 2 0 0 1.5E-02 6.8E-03 -- 3.0E-02Aroclor-1248 2 0 0 9.7E-03 4.4E-03 -- 1.9E-02Aroclor-1254 2 0 0 3.7E-03 1.7E-03 -- 7.4E-03Aroclor-1260 2 0 0 3.8E-03 1.7E-03 -- 7.5E-03Aroclor-1262 2 0 0 5.0E-03 2.3E-03 -- 9.9E-03Aroclor-1268 2 0 0 3.4E-03 1.6E-03 -- 6.8E-03Avian TEQ (ND=0) 11 11 100 3.1E-07 5.1E-07 1.5E-06 --Avian TEQ (ND=1/2MDL) 11 11 100 3.6E-07 5.0E-07 1.5E-06 --Avian TEQ (ND=MDL) 11 11 100 4.0E-07 4.9E-07 1.6E-06 --Mammalian TEQ (ND=0) 11 11 100 4.3E-07 4.5E-07 1.2E-06 --Mammalian TEQ (ND=1/2MDL) 11 11 100 4.6E-07 4.4E-07 1.3E-06 --Mammalian TEQ (ND=MDL) 11 11 100 4.9E-07 4.3E-07 1.3E-06 --Aluminum 11 11 100 6.6E+03 2.6E+03 1.2E+04 7.0E+00Arsenic 20 20 100 1.2E+01 5.8E+00 2.1E+01 2.0E-01Barium 11 11 100 1.7E+02 7.7E+01 2.8E+02 1.3E-01Cadmium 20 19 95 1.1E+00 6.6E-01 2.4E+00 4.6E-02Chromium 20 20 100 1.1E+01 5.0E+00 2.2E+01 3.2E-01Cobalt 11 11 100 4.3E+00 1.4E+00 6.0E+00 4.1E-01Copper 20 20 100 1.4E+02 6.9E+01 2.3E+02 5.5E-01Iron 20 20 100 1.2E+04 4.1E+03 2.1E+04 4.1E+01Lead 20 20 100 2.5E+01 1.1E+01 4.2E+01 7.3E-02Manganese 20 20 100 5.9E+02 4.9E+02 1.8E+03 2.3E-01Mercury 11 10 91 1.9E-01 1.5E-01 4.6E-01 1.4E-02Nickel 20 20 100 7.5E+00 2.4E+00 1.0E+01 2.6E-01Silver 11 1 9 1.8E-01 2.7E-01 9.9E-01 2.0E-01Thallium 11 2 18 5.9E-02 4.8E-02 1.7E-01 7.3E-02Vanadium 11 11 100 1.5E+01 4.5E+00 2.0E+01 4.6E-01Zinc 20 20 100 3.1E+02 1.3E+02 4.8E+02 3.4E+001,2,4-Trichlorobenzene-SVOC 2 0 0 5.3E-02 2.4E-02 -- 1.1E-011,2-Dichlorobenzene-SVOC 2 0 0 2.1E-02 9.4E-03 -- 4.2E-021,2-Diphenylhydrazine 2 0 0 1.6E-01 7.3E-02 -- 3.2E-011,3-Dichlorobenzene-SVOC 2 0 0 2.0E-02 9.2E-03 -- 4.1E-021,4-Dichlorobenzene-SVOC 2 0 0 2.2E-02 9.7E-03 -- 4.3E-021-Methylnaphthalene 2 0 0 5.6E-02 2.5E-02 -- 1.1E-012,4,5-Trichlorophenol 2 0 0 3.9E-02 1.8E-02 -- 7.7E-022,4,6-Trichlorophenol 2 0 0 4.2E-02 1.9E-02 -- 8.3E-022,4-Dichlorophenol 2 0 0 6.1E-02 2.7E-02 -- 1.2E-012,4-Dimethylphenol 2 0 0 6.1E-02 2.8E-02 -- 1.2E-012,4-Dinitrophenol 2 0 0 1.6E-01 7.3E-02 -- 3.2E-012,4-Dinitrotoluene 2 0 0 1.6E-01 7.3E-02 -- 3.2E-012,6-Dinitrotoluene 2 0 0 2.8E-02 1.2E-02 -- 5.5E-022-Chloronaphthalene 2 0 0 5.1E-02 2.3E-02 -- 1.0E-012-Chlorophenol 2 0 0 7.5E-02 3.4E-02 -- 1.5E-012-Methylnaphthalene 2 0 0 5.8E-02 2.6E-02 -- 1.2E-012-Nitroaniline 2 0 0 3.5E-02 1.6E-02 -- 7.0E-022-Nitrophenol 2 0 0 5.5E-02 2.5E-02 -- 1.1E-013,3`-Dichlorobenzidine 2 0 0 4.5E-02 2.0E-02 -- 9.0E-023-Nitroaniline 2 0 0 3.3E-02 1.5E-02 -- 6.6E-024,6-Dinitro-o-cresol 2 0 0 6.4E-02 2.9E-02 -- 1.3E-014-Bromophenyl phenyl ether 2 0 0 3.4E-02 1.6E-02 -- 6.9E-024-Chloro-3-methylphenol 2 0 0 1.6E-01 7.3E-02 -- 3.2E-014-Chlorophenyl phenyl ether 2 0 0 3.7E-02 1.7E-02 -- 7.4E-024-Nitroaniline 2 0 0 2.8E-02 1.3E-02 -- 5.7E-024-Nitrophenol 2 0 0 3.4E-02 1.5E-02 -- 6.8E-02Acenaphthene 2 0 0 3.7E-02 1.7E-02 -- 7.5E-02Acenaphthylene 2 0 0 4.2E-02 1.9E-02 -- 8.5E-02Anthracene 2 0 0 1.6E-01 7.3E-02 -- 3.2E-01Benzo(a)anthracene 2 0 0 1.6E-01 7.3E-02 -- 3.2E-01Benzo(a)pyrene 2 0 0 1.6E-01 7.3E-02 -- 3.2E-01Benzo(b)fluoranthene 2 0 0 4.1E-02 1.9E-02 -- 8.2E-02Benzo(g,h,i)perylene 2 0 0 3.9E-02 1.8E-02 -- 7.9E-02Benzo(k)fluoranthene 2 0 0 4.1E-02 1.9E-02 -- 8.3E-02bis(2-chloroethoxy)methane 2 0 0 6.3E-02 2.9E-02 -- 1.3E-01bis(2-chloroethyl)ether 2 0 0 2.3E-02 1.0E-02 -- 4.5E-02
Table 4-4. Background Sediment Summary Statistics
Aroclors
TEQ
Metals
SVOCs

Analysis AnalyteNumber of
Samples
Number of Detected Samples
Detection Frequency
(%)
Average
Concentrationa
(mg/kg)
Standard Deviation
Maximum Detected
Concentration (mg/kg)
Average MDL
(mg/kg)
Table 4-4. Background Sediment Summary Statistics
Bis(2-chloroisopropyl)ether 2 0 0 7.5E-02 3.4E-02 -- 1.5E-01Bis(2-ethylhexyl)phthalate 2 0 0 5.5E-02 2.5E-02 -- 1.1E-01Butyl benzyl phthalate 2 0 0 1.6E-01 7.3E-02 -- 3.2E-01Carbazole 2 0 0 1.6E-01 7.3E-02 -- 3.2E-01Chrysene 2 0 0 4.3E-02 1.9E-02 -- 8.7E-02Dibenzo(a,h)anthracene 2 0 0 1.6E-01 7.3E-02 -- 3.2E-01Dibenzofuran 2 0 0 1.6E-01 7.3E-02 -- 3.2E-01Dibutyl phthalate 2 0 0 4.5E-02 2.0E-02 -- 9.0E-02Diethyl phthalate 2 0 0 1.6E-01 7.3E-02 -- 3.2E-01Dimethyl phthalate 2 0 0 1.6E-01 7.3E-02 -- 3.2E-01Di-n-octyl phthalate 2 0 0 1.6E-01 7.3E-02 -- 3.2E-01Fluoranthene 2 0 0 1.6E-01 7.3E-02 -- 3.2E-01Fluorene 2 0 0 1.6E-01 7.3E-02 -- 3.2E-01Hexachlorobenzene 2 0 0 4.2E-02 1.9E-02 -- 8.5E-02Hexachlorobutadiene-SVOC 2 0 0 2.7E-02 1.2E-02 -- 5.4E-02Hexachloroethane 2 0 0 2.1E-02 9.3E-03 -- 4.1E-02Indeno(1,2,3-cd)pyrene 2 0 0 1.6E-01 7.3E-02 -- 3.2E-01Isophorone 2 0 0 5.2E-02 2.3E-02 -- 1.0E-01m & p-cresols 2 0 0 6.4E-02 2.9E-02 -- 1.3E-01Naphthalene-SVOC 2 0 0 6.1E-02 2.8E-02 -- 1.2E-01Nitrobenzene 2 0 0 6.5E-02 2.9E-02 -- 1.3E-01N-Nitrosodimethylamine 2 0 0 1.6E-01 7.3E-02 -- 3.2E-01N-Nitrosodi-n-propylamine 2 0 0 4.4E-02 2.0E-02 -- 8.8E-02N-Nitrosodiphenylamine 2 0 0 1.6E-01 7.3E-02 -- 3.2E-01o-Cresol 2 0 0 7.0E-02 3.1E-02 -- 1.4E-01p-Chloroaniline 2 0 0 5.0E-02 2.3E-02 -- 9.9E-02Pentachlorophenol 2 0 0 1.6E-01 7.3E-02 -- 3.2E-01Phenanthrene 2 0 0 4.6E-02 2.1E-02 -- 9.2E-02Phenol 2 0 0 7.1E-02 3.2E-02 -- 1.4E-01Pyrene 2 0 0 4.1E-02 1.8E-02 -- 8.1E-02
MDL = method detection limit; ND = non-detects; TEQ = Toxicity EquivalenceaNon-detects evaluated at 1/2 the MDL
SVOCs

NOEC LOEC NOEC LOEC NOEC-based HQ LOEC-based HQ NOEC-based HQ LOEC-based
HQ
Copper 19.9 28 134 49 55 0.7 0.1 0.4 0.4
Selenium 1.098 1.2 1.2 0.63 0.95 0.9 0.9 1.7 1.2
Soil EPC = 95UCL calculated using ProUCL (see Appendix D).
Birds Mammals
(a) Based on the ratio of bird LOAEL/NOAEL TRVs (19.4/4.05 for copper; 0.29/0.29 for selenium) based on Booz Allen Hamilton (2012).(b) Based on the ratio of mammal LOAEL/NOAEL TRVs (6.26/5.6 for copper; 0.215/0.143 for selenium) based on Booz Allen Hamilton (2012).
Table 5-1. Hazard Quotient Values for Birds and Mammals Exposed to Copper and Selenium in OU1 Soils
ContaminantSoil EPC(mg/kg)
Benchmarks (mg/kg) Hazard Quotients (HQs)Birds (a) Mammals (b)
Revised OU1 ERA Tables.xlsx

APPENDIX A
MTNHP Map Viewer Species Output
[See Smurfit OU1 ERA Appendix A.xlsx]

APPENDIX B
OU1 Data
[See Smurfit OU1 ERA Appendix B.xlsx]

APPENDIX C
Toxicity Benchmarks for Ecological Receptors
C-1
APPENDIX C
Toxicity Benchmarks for Ecological Receptors
Overview ........................................................................................................................................ 2 Aquatic Receptors (Fish & Benthic Macroinvertebrates) ........................................................ 3
C-1 Benchmarks for Direct Contact with Surface Water ........................................................ 3 C-2 Benchmarks for Direct Contact with Sediment ................................................................ 7
Terrestrial Receptors .................................................................................................................. 12 C-3 Benchmarks for Direct Contact with Surface Soils ....................................................... 12

C-2
Overview The purpose of the screening level risk assessment is to identify COPECs based on comparison of site-related concentrations to appropriate benchmarks of toxicity. The benchmarks identified for this assessment are concentration-based (e.g., the concentration in soil, sediment, or surface water). Each benchmark is contaminant-specific, receptor-specific and is usually medium-specific. For this SLERA, all toxicity benchmarks are based on values developed by various regulatory agencies and published in the literature. For this assessment, values were chosen to be consistent with other recent and/or ongoing regional ecological risk assessments. This appendix describes the various sources of benchmark values reviewed for this risk assessment, and identifies the hierarchy used to prioritize values when more than one value was available. This appendix is organized into the following sections:
Aquatic Receptors
C-1 Benchmarks for Direct Contact with Surface Water C-2 Benchmarks for Direct Contact with Sediment
Terrestrial Receptors
C-3 Benchmarks for Direct Contact with Surface Soils

C-3
Aquatic Receptors (Fish & Benthic Macroinvertebrates) C-1 Benchmarks for Direct Contact with Surface Water C-1a Aquatic Receptors Toxicity values used in this risk assessment were chosen to be consistent with other recent regional ecological risk assessments. Toxicity values for the protection of aquatic life from contaminants in surface water are available from several sources. Each of these sources is described briefly below. National Ambient Water Quality Criteria
The USEPA has established acute and chronic National Ambient Water Quality Criteria (NAWQC) values for surface waters for the protection of aquatic communities (USEPA 2002a). The Criteria Maximum Concentration (CMC) is an estimate of the highest concentration of a material in surface water to which an aquatic community can be exposed briefly without resulting in an unacceptable effect. The Criterion Continuous Concentration (CCC) is an estimate of the highest concentration of a material in surface water to which an aquatic community can be exposed indefinitely without resulting in an unacceptable effect on growth, reproduction, or survival. The NAWQC values are not species-specific, but are designed to protect 95% of the aquatic species for which toxicity data are available (USEPA 1985).
Great Lake Water Quality Initiative Tier II Values
The approach used for the derivation of Great Lake Water Quality Initiative (GLWQI) Tier II secondary acute values (SAVs) and secondary chronic values (SCVs) is similar to that used to derive NAWQC. USEPA (1995) describes how to calculate the GLWQI Tier II values. Data and detailed methods and are described in Appendix B of Suter and Tsao (1996). In brief, a secondary acute value is derived by taking the lowest genus mean acute value (GMAV) and dividing it by the Final Acute Value Factor (FAVF). The FAVF is based on the number of studies and types of species used to derive the FAV. Once an SAV is calculated, the geometric mean of each of the secondary acute-chronic ratios (SACR) is found. The SCV is calculated by dividing the SAV by the SACR.
USEPA Region 4 Screening Values Screening level freshwater benchmarks are also available from USEPA Region 4 (USEPA, 2002b). The Region 4 acute and chronic screening values are equal to the lowest effect level (LEL) divided by 10 to protect for sensitive species. If no chronic LEL is available, the chronic screening value is equal to the lowest acute median lethal concentration (LC50) or median effective concentration (EC50) divided by 10.

C-4
USEPA Region 5 Ecological Screening Levels
The USEPA Region 5 has derived ecological screening levels (ESLs) for RCRA Appendix IX Hazardous Constituents in soil, surface water, sediment, and air (USEPA 2003). The surface water ESL is based on either an aquatic benchmark, which is protective of direct contact exposures, or a wildlife receptor-specific benchmark, which is protective of ingestion exposures in the mink and belted kingfisher. Canadian Water Quality Guidelines
The Canadian Council of Ministers of the Environment (CCME) have established water quality guidelines (WQG) for the protection of aquatic life in Canadian waters (CCME, 1991, 2001). The protocol for deriving water quality guidelines is similar to the NAWQC procedure. Protocol details are available on the CCME WQG website. In brief, the guideline is equal to the most sensitive lowest observed effect level (LOEL) from a chronic exposure study divided by a safety factor of 10. If a chronic LOEL is not available, the WQG is equal to the acute LC50 divided by the acute/chronic ratio (ACR). The CCME WQG is designed to be protective of "100% of the aquatic life species, 100% of the time".
Oak Ridge National Laboratory Lowest Chronic Values and EC20 Values
Oak Ridge National Laboratory (ORNL) has compiled summary tables of the lowest chronic values (LCVs) in surface water for fish, daphnids, non-daphnid invertebrates, aquatic plants, and aquatic populations (Suter and Tsao, 1996). In some instances, the LCVs were extrapolated from LC50 and EC50 data using fish and daphnid-specific equations. ORNL also summarized EC20 data for fish, daphnids, sensitive species, and aquatic populations. The EC20s are based on a level of biological effect; they are benchmarks derived by using mathematical models to evaluate a dose-response relationship, such as a concentration estimated to correspond to a 20% reduction in fish production (Suter and Tsao, 1996).
Office of Solid Waste and Emergency Response (OSWER) Ecotox Thresholds
The OSWER Ecotox Thresholds (ETs) were presented in a USEPA ECO Update Bulletin (USEPA, 1996). The bulletin provided an overview of the development and use of ecological benchmarks for surface water and sediment. For surface water, the ET is based on either the chronic NAWQC or the GLWQI Tier II value.
The OSWER ETs were excluded because they are based on primary sources (NAWQC, GLWQI Tier II) that had been previously reviewed. For the remaining sources, selection of the surface water toxicity benchmarks for aquatic receptors was based on the following hierarchy:
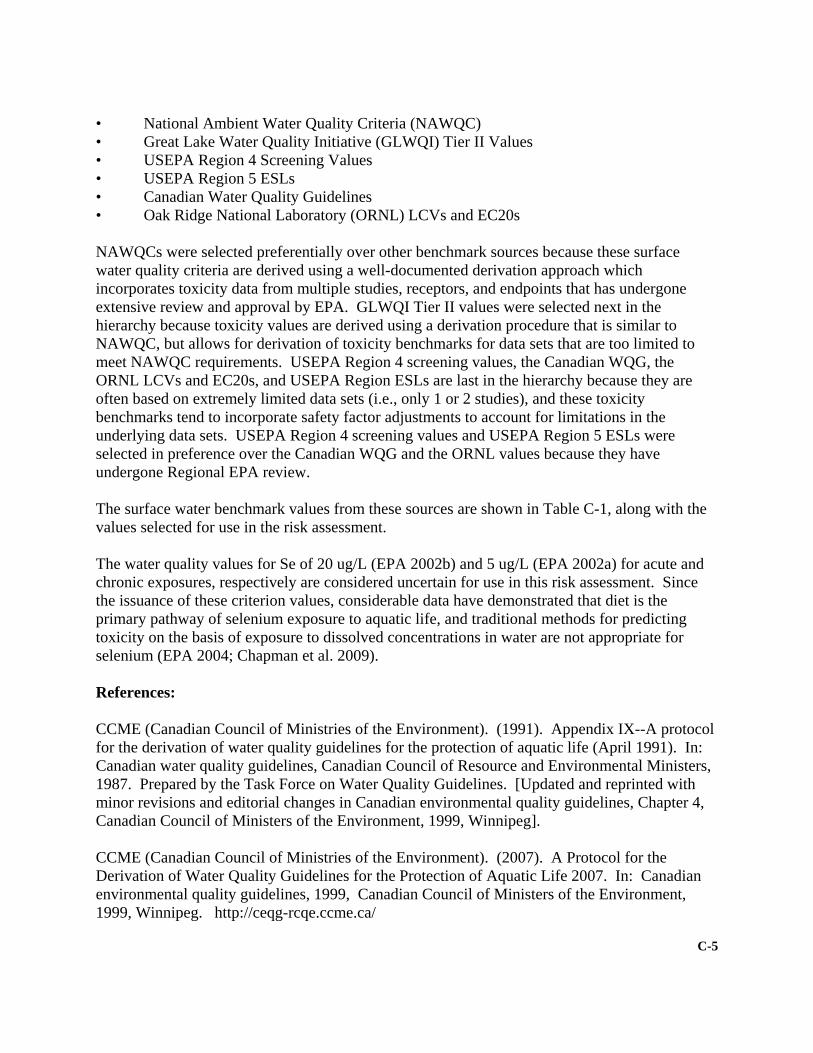
C-5
• National Ambient Water Quality Criteria (NAWQC) • Great Lake Water Quality Initiative (GLWQI) Tier II Values • USEPA Region 4 Screening Values • USEPA Region 5 ESLs • Canadian Water Quality Guidelines • Oak Ridge National Laboratory (ORNL) LCVs and EC20s NAWQCs were selected preferentially over other benchmark sources because these surface water quality criteria are derived using a well-documented derivation approach which incorporates toxicity data from multiple studies, receptors, and endpoints that has undergone extensive review and approval by EPA. GLWQI Tier II values were selected next in the hierarchy because toxicity values are derived using a derivation procedure that is similar to NAWQC, but allows for derivation of toxicity benchmarks for data sets that are too limited to meet NAWQC requirements. USEPA Region 4 screening values, the Canadian WQG, the ORNL LCVs and EC20s, and USEPA Region ESLs are last in the hierarchy because they are often based on extremely limited data sets (i.e., only 1 or 2 studies), and these toxicity benchmarks tend to incorporate safety factor adjustments to account for limitations in the underlying data sets. USEPA Region 4 screening values and USEPA Region 5 ESLs were selected in preference over the Canadian WQG and the ORNL values because they have undergone Regional EPA review. The surface water benchmark values from these sources are shown in Table C-1, along with the values selected for use in the risk assessment. The water quality values for Se of 20 ug/L (EPA 2002b) and 5 ug/L (EPA 2002a) for acute and chronic exposures, respectively are considered uncertain for use in this risk assessment. Since the issuance of these criterion values, considerable data have demonstrated that diet is the primary pathway of selenium exposure to aquatic life, and traditional methods for predicting toxicity on the basis of exposure to dissolved concentrations in water are not appropriate for selenium (EPA 2004; Chapman et al. 2009). References: CCME (Canadian Council of Ministries of the Environment). (1991). Appendix IX--A protocol for the derivation of water quality guidelines for the protection of aquatic life (April 1991). In: Canadian water quality guidelines, Canadian Council of Resource and Environmental Ministers, 1987. Prepared by the Task Force on Water Quality Guidelines. [Updated and reprinted with minor revisions and editorial changes in Canadian environmental quality guidelines, Chapter 4, Canadian Council of Ministers of the Environment, 1999, Winnipeg]. CCME (Canadian Council of Ministries of the Environment). (2007). A Protocol for the Derivation of Water Quality Guidelines for the Protection of Aquatic Life 2007. In: Canadian environmental quality guidelines, 1999, Canadian Council of Ministers of the Environment, 1999, Winnipeg. http://ceqg-rcqe.ccme.ca/

C-6
Chapman PM, Adams WJ, Brooks ML et al. 2009. Summary of the SETAC Pellston Workshop on Ecological Assessment of Selenium in the Aquatic Environment. February 2009, Pensacola, FL, USA. Pauli BD, Perrault JA, Money SL. 2000. RATL: A Database of Reptile and Amphibian Toxicology Literature. Technical Report Series No. 357.Canadian Wildlife Service, Headquarters, Hull, Québec, Canada. Stephan CE, Mount DI, Hansen DJ, Gentile JH, Chapman GA, Brungs WA. 1985. Guidelines for Deriving National Water Quality Criteria for the Protection of Aquatic Organisms and their Uses. U.S Environmental Protection Agency, Office of Research and Development, Environmental Research Laboratories, Duluth Minnesota. PB85-227049. Suter II, GW and CL Tsao. 1996. Toxicological Benchmarks for Screening Potential Contaminants of Concern for Effects on Aquatic Biota: 1996 Revision. Oak Ridge National Laboratory.Document # ES/ER/TM-96/R2. June 1996. US Environmental Protection Agency (USEPA). 1985. Guidelines for Deriving Numerical National Water Quality Criteria for the Protection of Aquatic Organisms and Their Uses. NTIS Document Number PB85-227049.US Environmental Protection Agency, Office of Research and Development. US Environmental Protection Agency (USEPA). 1995. Final Water Quality Guidance for the Great Lakes System. 40CFR Parts 9, 122, 123, 131 and 132. March 1995. 15366-15425. US Environmental Protection Agency (USEPA). 1996. ECO Update: Ecotox Thresholds. Intermittent Bulletin. Volume 3, Number 2, January 1996. EPA 540/F-95/038. US Environmental Protection Agency (USEPA). 2002a. National Recommended Water Quality Criteria: 2002.United States Environmental Protection Agency, Office of Water, Office of Science and Technology. November 2002. EPA-822-R-02-047. US Environmental Protection Agency (USEPA). 2002b. Region 4 Ecological Risk Assessment Bulletins - Supplement to RAGS. Downloaded on July 15, 2002 from website: http://www.epa.gov/region04/waste/ots/ecolbul.htm US Environmental Protection Agency (USEPA). 2003. Region 5 Ecological Screening Levels for RCRA Appendix IX Hazardous Constituents. United States Environmental Protection Agency, Region 5. August. US Environmental Protection Agency (USEPA). 2004. Draft Aquatic Life Water Quality Criteria for Selenium – 2004. United States Environmental Protection Agency, Office of Water. November 2004. EPA-822-D-04-001.
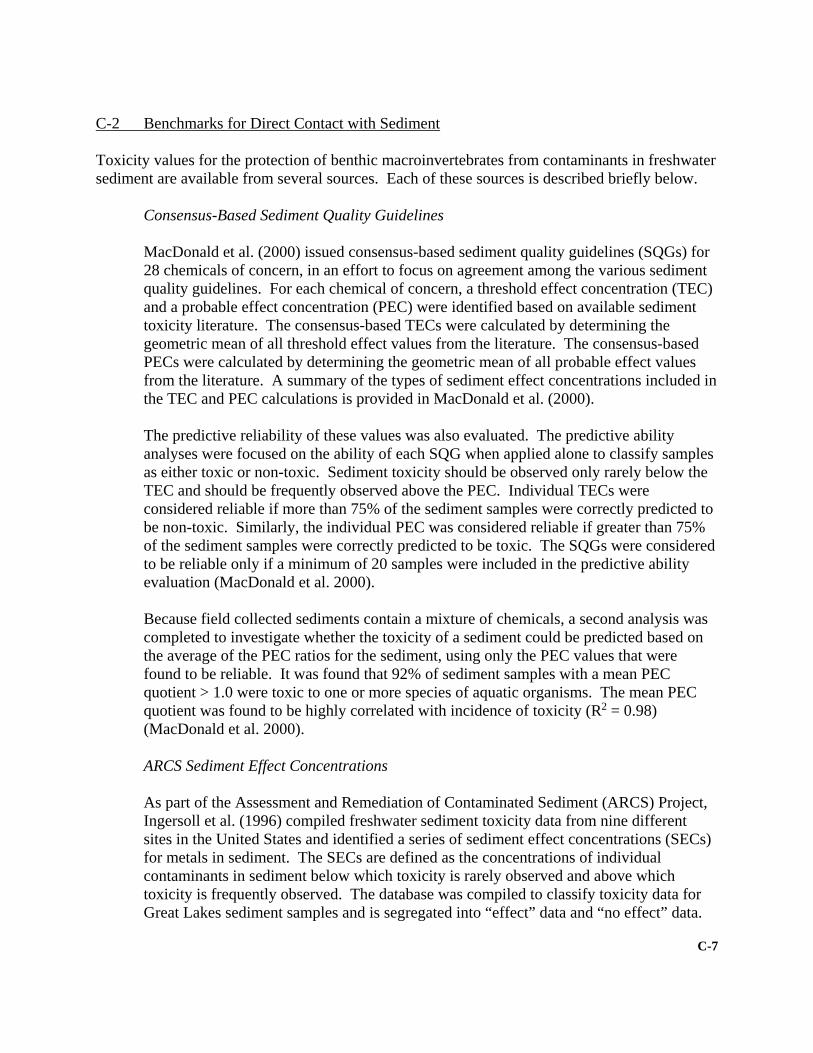
C-7
C-2 Benchmarks for Direct Contact with Sediment Toxicity values for the protection of benthic macroinvertebrates from contaminants in freshwater sediment are available from several sources. Each of these sources is described briefly below.
Consensus-Based Sediment Quality Guidelines
MacDonald et al. (2000) issued consensus-based sediment quality guidelines (SQGs) for 28 chemicals of concern, in an effort to focus on agreement among the various sediment quality guidelines. For each chemical of concern, a threshold effect concentration (TEC) and a probable effect concentration (PEC) were identified based on available sediment toxicity literature. The consensus-based TECs were calculated by determining the geometric mean of all threshold effect values from the literature. The consensus-based PECs were calculated by determining the geometric mean of all probable effect values from the literature. A summary of the types of sediment effect concentrations included in the TEC and PEC calculations is provided in MacDonald et al. (2000).
The predictive reliability of these values was also evaluated. The predictive ability analyses were focused on the ability of each SQG when applied alone to classify samples as either toxic or non-toxic. Sediment toxicity should be observed only rarely below the TEC and should be frequently observed above the PEC. Individual TECs were considered reliable if more than 75% of the sediment samples were correctly predicted to be non-toxic. Similarly, the individual PEC was considered reliable if greater than 75% of the sediment samples were correctly predicted to be toxic. The SQGs were considered to be reliable only if a minimum of 20 samples were included in the predictive ability evaluation (MacDonald et al. 2000).
Because field collected sediments contain a mixture of chemicals, a second analysis was completed to investigate whether the toxicity of a sediment could be predicted based on the average of the PEC ratios for the sediment, using only the PEC values that were found to be reliable. It was found that 92% of sediment samples with a mean PEC quotient > 1.0 were toxic to one or more species of aquatic organisms. The mean PEC quotient was found to be highly correlated with incidence of toxicity (R2 = 0.98) (MacDonald et al. 2000).
ARCS Sediment Effect Concentrations
As part of the Assessment and Remediation of Contaminated Sediment (ARCS) Project, Ingersoll et al. (1996) compiled freshwater sediment toxicity data from nine different sites in the United States and identified a series of sediment effect concentrations (SECs) for metals in sediment. The SECs are defined as the concentrations of individual contaminants in sediment below which toxicity is rarely observed and above which toxicity is frequently observed. The database was compiled to classify toxicity data for Great Lakes sediment samples and is segregated into “effect” data and “no effect” data.
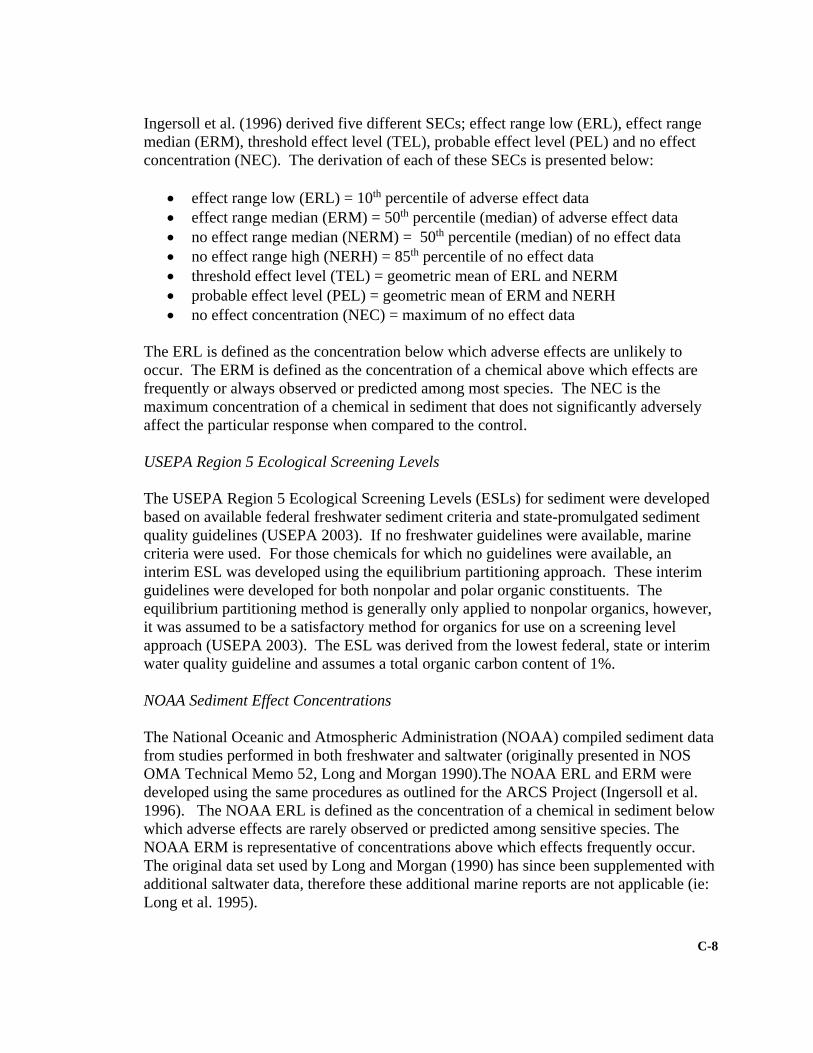
C-8
Ingersoll et al. (1996) derived five different SECs; effect range low (ERL), effect range median (ERM), threshold effect level (TEL), probable effect level (PEL) and no effect concentration (NEC). The derivation of each of these SECs is presented below:
effect range low (ERL) = 10th percentile of adverse effect data effect range median (ERM) = 50th percentile (median) of adverse effect data no effect range median (NERM) = 50th percentile (median) of no effect data no effect range high (NERH) = 85th percentile of no effect data threshold effect level (TEL) = geometric mean of ERL and NERM probable effect level (PEL) = geometric mean of ERM and NERH no effect concentration (NEC) = maximum of no effect data
The ERL is defined as the concentration below which adverse effects are unlikely to occur. The ERM is defined as the concentration of a chemical above which effects are frequently or always observed or predicted among most species. The NEC is the maximum concentration of a chemical in sediment that does not significantly adversely affect the particular response when compared to the control.
USEPA Region 5 Ecological Screening Levels
The USEPA Region 5 Ecological Screening Levels (ESLs) for sediment were developed based on available federal freshwater sediment criteria and state-promulgated sediment quality guidelines (USEPA 2003). If no freshwater guidelines were available, marine criteria were used. For those chemicals for which no guidelines were available, an interim ESL was developed using the equilibrium partitioning approach. These interim guidelines were developed for both nonpolar and polar organic constituents. The equilibrium partitioning method is generally only applied to nonpolar organics, however, it was assumed to be a satisfactory method for organics for use on a screening level approach (USEPA 2003). The ESL was derived from the lowest federal, state or interim water quality guideline and assumes a total organic carbon content of 1%.
NOAA Sediment Effect Concentrations
The National Oceanic and Atmospheric Administration (NOAA) compiled sediment data from studies performed in both freshwater and saltwater (originally presented in NOS OMA Technical Memo 52, Long and Morgan 1990).The NOAA ERL and ERM were developed using the same procedures as outlined for the ARCS Project (Ingersoll et al. 1996). The NOAA ERL is defined as the concentration of a chemical in sediment below which adverse effects are rarely observed or predicted among sensitive species. The NOAA ERM is representative of concentrations above which effects frequently occur. The original data set used by Long and Morgan (1990) has since been supplemented with additional saltwater data, therefore these additional marine reports are not applicable (ie: Long et al. 1995).

C-9
USEPA Region 4 Screening Levels
The USEPA Region 4 Screening Levels are derived from three different sediment effects data sets including NOAA freshwater and marine data from Long and Morgan (1990), additional NOAA marine data from Long et al. (1995), and Florida State Department of Environmental Protection marine data from MacDonald et al. (1996). The sediment effect level is based on the reported ERL from each study. In instances when the USEPA Contract Laboratory Program (CLP) practical quantitation limit (PQL) is above the effect level, the screening value is equal to the CLP PQL (USEPA 2002).
CCME Sediment Quality Guidelines
The Canadian Council of Ministers of the Environment (CCME) derived sediment quality guidelines to support protection and management strategies for freshwater, estuarine, and marine ecosystems (CCME 1995). Guideline derivation protocols are detailed in CCME (1995) and are similar to the procedures described previously for the ARCS Project (Ingersoll et al. 1996). Separate guidelines were derived for freshwater and marine sediments (CCME 2001). The freshwater interim sediment quality guideline (ISQG) was equal to the TEL and is representative of the concentration below which adverse effects are not anticipated for aquatic life associated with bed sediments (CCME 1995). A PEL was also calculated to establish concentrations above which adverse effects are likely to occur. Ontario Sediment Effect Levels
Persaud et al. (1993) derived sediment effect levels for the protection of aquatic organisms in Ontario, Canada. Three types of sediment quality guidelines were developed; a No Effect Level (NEL; no toxic effects), a Low Effect Level (LEL; tolerable by benthic species), and a Severe Effect Level (SEL; detrimental to most benthic species). A summary and review of the available approaches to sediment guideline development and the protocol for the derivation of the Ontario values is described in detail in Persaud et al. (1993). Briefly, the NEL is obtained through a chemical equilibrium approach using water quality standards. Because the equilibrium partitioning approach is only predictive for nonpolar organics, a No Effect Level is not derived for metals and polar organics. The LEL and SEL are based on the 5th and 95th percentiles of all effects data for bulk sediment analysis, respectively. For non-polar organics these concentrations were normalized for total organic carbon. U.S. EPA Region 3 Screening Benchmarks
The Region 3 screening benchmarks were derived based on the following hierarchy:
Preference was given to benchmarks based on chronic direct exposure, non-lethal endpoint studies designed to be protective of sensitive species.

C-10
Values derived by statistical or consensus-based evaluation of multiple studies were given first priority. Equilibrium partitioning values were selected for contaminants with 2.0 < log Kow< 6.0 if empirical values based on multiple studies were not available. Absent consensus or equilibrium partitioning values, single study toxicity values were selected.
Marine values were used for freshwater only if a suitable freshwater value was not available. Of these sources, the following are excluded from use in this risk assessment due to inadequate documentation of derivation methodology, use of site-specific assumptions, use of marine or estuarine sediments, use of inappropriate receptors, or errors in benchmark derivation. USEPA Region 5 Screening Levels USEPA Region 4 Screening Levels CCME Sediment Quality Guidelines (ISQG/PEL) Ontario Sediment Effect Levels (Low/Severe) ORNL EqP Guidelines Of the remaining sources, a benchmark selection hierarchy is established as follows: Consensus-based TEC (MacDonald et al., 2000) ARCs TEL (Ingersoll et al., 1996) NOAA ERL (Long and Morgan, 1990) U.S. EPA Region 3 Screening Benchmarks The consensus-based SQGs presented in MacDonald et al. (2000) were selected as the first preference in the hierarchy because they utilized a derivation procedure that incorporated toxicity data from numerous sources. ARCs TEL (Ingersoll et al. 1996) and NOAA ERL (Long and Morgan 1990) rank after the consensus-based SQGs because they are derived from toxicity data from a limited number of studies (i.e., only 1-2 studies). The ARCs TELs and NOAA ERLs were both developed using similar derivation procedures. ARCs TELs were selected in preference to NOAA ERLs because the ARCs data set included only freshwater studies, while the NOAA data set included both freshwater and saltwater studies. A summary of all selected sediment toxicity benchmarks is shown in Table C-2. References: Canadian Council of Ministers of the Environment (CCME). 1995. Protocol for the Derivation of Canadian Sediment Quality Guidelines for the Protection of Aquatic Life. CCME EPC-98E.Prepared by Environment Canada, Guidelines Division, Technical Secretariat of the CCME Task Group on Water Quality Guidelines, Ottawa.[Reprinted in Canadian Environmental Quality Guidelines, Chapter 6, CCME, 1999, Winnipeg.]

C-11
Canadian Council of Ministers of the Environment (CCME). 2001. Canadian Sediment Quality Guidelines for the Protection of Aquatic Life: Summary Tables - Updated. In: Canadian Environmental Quality Guidelines, CCME, 1999, Winnipeg. Jones, DS, GW Suter II, RN Hull. 1997. Toxicological Benchmarks for Screening Contaminants of Potential Concern for Effects on Sediment-Dwelling Biota: 1997 Revision. Oak Ridge National Laboratory. Document # ES/ER/TM-95/R4. Long, ER and LG Morgan. 1990. The Potential for Biological Effects of Sediment-Sorbed Contaminants Tested in the National Status and Trends Program. National Oceanic and Atmospheric Administration Publication. Technical Memorandum NOS OMA 52. March 1990. Long, ER, DD MacDonald, SL Smith, FD Calder. 1995. Incidence of Adverse Biological Effects Within Ranges of Chemical Concentrations in Marine and Estuarine Sediments. Environmental Management 19(1):81-97. Ingersoll, CG, MacDonald, DD, RS Carr, FD Calder, ER Long. 1996. Development and Evaluation of Sediment Quality Guidelines for Florida Coastal Waters. Ecotoxicology 5:253-278. MacDonald, DD, CG Ingersoll and TA Berger. 2000. Development and Evaluation of Consensus-Based Sediment Quality Guidelines for Freshwater Ecosystems. Archives of Environmental Contamination and Toxicology 39:20-31. Persaud, D, R Jaagumagi, H Hayton. 1993. Guidelines for the Protection and Management of Aquatic Sediment Quality in Ontario. Ontario Ministry of the Environment, Waster Resources Branch, Toronto. August 1993. ISBN 0-7729-9248-7. US Environmental Protection Agency (USEPA). 2002. Region 4 Ecological Risk Assessment Bulletins - Supplement to RAGS. Downloaded on July 15, 2002 from website: http://www.epa.gov/region04/waste/ots/ecolbul.htm US Environmental Protection Agency (USEPA). 2003. Region 5 Ecological Screening Levels for RCRA Appendix IX Hazardous Constituents. United States Environmental Protection Agency, Region 5. August.

C-12
Terrestrial Receptors C-3 Benchmarks for Direct Contact with Surface Soils Toxicity values for the protection of terrestrial plants, soil invertebrates and wildlife from contaminants in surface soils are available from several sources. Each of these sources is described briefly below.
Ecological Soil Screening Levels (Eco-SSLs). Eco-SSLs are concentrations of contaminants in soils that are protective of ecological receptors that commonly come into contact with soil or ingest biota that live in or on soil. The Eco-SSLs are screening values that can be used routinely to identify those contaminants of potential concern (COPCs) in soils requiring further evaluation in a baseline ecological risk assessment (ERA). Eco-SSLs are derived separately for four groups of ecological receptors, plants, soil invertebrates, birds and mammals. As such, these values are presumed to provide adequate protection of terrestrial ecosystems. The lower of the values for plants and soil invertebrates is used preferentially as the soil screening benchmark.
The Eco-SSL derivation process represents a three year collaborative effort of a multi-stakeholder workgroup consisting of federal, state, consulting, industry and academic participants led by the USEPA, Office of Emergency and Remedial Response (OERR) (USEPA, 2002b). The USEPA issued the final guidance for Eco-SSLs and interim final Eco-SSL values for several contaminants in 2003.
Oak Ridge National Laboratory Plants/Soil Organisms/Microbes
Oak Ridge National Laboratory (ORNL) reviewed data on the toxicity of contaminants in soil on a wide range of plants, soil organisms, and microbes, and determined the lowest observed effect concentration (LOEC) (Efroymson et al. 1997a,b). The LOEC is defined as the lowest applied concentration of the chemical causing a greater than 20% reduction in the measured response. In some cases, the LOEC is the lowest concentration tested or the only concentration reported (EC50 or ED50 data). The LOECs for a series of different plants and soil organisms are rank ordered and a value selected that approximated the 10th percentile. When a benchmark is based on a lethality endpoint, the benchmark value is divided by 5 to approximate an effects concentration for growth and reproduction. The factor is selected based on the author’s judgement (Efroymson et al. 1997a,b). The benchmark values are then rounded to one significant figure.
Dutch Target and Intervention Values
The Dutch Target and Intervention Values are derived from available data on ecotoxicological effects of contaminants in soil to terrestrial species and soil microbial processes (Swartjes 1999). The Target Values for soil are related to negligible risk for soil ecosystems (95% protection). The Intervention Values are defined as the hazardous

C-13
concentration for 50% of the soil ecosystem population and are not protective of sensitive species. The Dutch benchmarks are developed by reviewing available literature to determine the lowest no observed effect concentration (NOEC). When there is a LOEC but no NOEC, the NOEC is estimated from the LOEC according to the effect level observed at the LOEC, as follows:
LOEC Effect Range NOEC
10% - 20% LOEC / 2
20% - 50% LOEC / 3
50% - 80% LOEC / 10
The ecotoxicological data are selected according to the criteria established in Crommenentujin et al. (1994) and are normalized for soil characteristics such as organic matter and clay content. If not enough data is available for terrestrial species and microbial processes, aquatic data (adjusted by an uncertainty factor of 10) are used to derive the benchmark values (Swartjes 1999).
CCME Soil Quality Guidelines
The Canadian Council of Ministers of the Environment (CCME) established effects-based environmental soil quality guidelines (SQGE) designed to be clean-up goals to protect ecological receptors from direct contact and ingestion exposures to soil-based contaminants. From the available soil toxicity literature, CCME compiled an adverse effect data set and a no effect data set. Several SQGEs are calculated based on land use types (agricultural-A, residential/parkland-R/P, commercial/industrial-C/I). Based on the amount of toxicity data available, different derivation methods are used to calculate the land use SQGE. Each of these methods are detailed in CCME (1999) and described briefly below.
Weight-of Evidence Method A, R/P Land Uses = threshold effects concentration (TEC), 25th percentile of effect and no effect data sets divided by an uncertainty factor C/I Land Use = effects concentration low (ECL), 25th percentile of effect data set
Lowest-Observed-Effect Concentration (LOEC) Method A, R/P Land Uses = lowest available LOEC divided by an uncertainty factor C/I Land Use = geometric mean of available LOEC data
Median Effects Method A, R/P Land Uses = lowest available EC50 or LC50 divided by an uncertainty factor
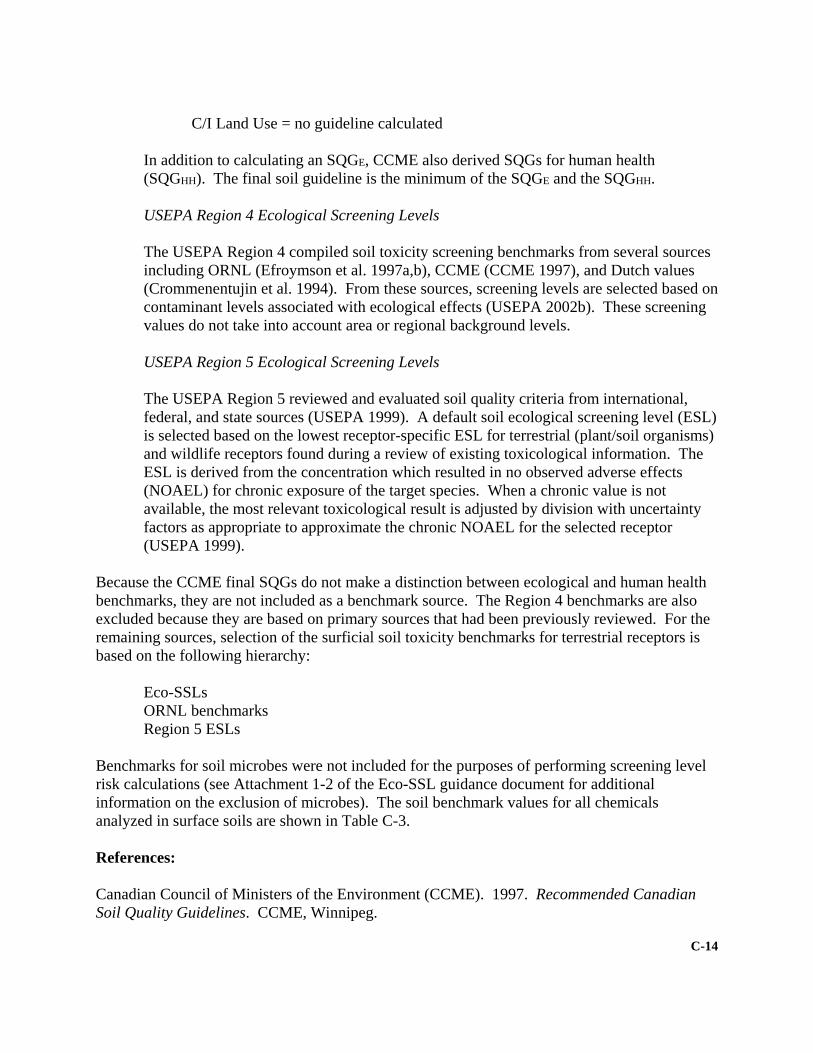
C-14
C/I Land Use = no guideline calculated
In addition to calculating an SQGE, CCME also derived SQGs for human health (SQGHH). The final soil guideline is the minimum of the SQGE and the SQGHH.
USEPA Region 4 Ecological Screening Levels
The USEPA Region 4 compiled soil toxicity screening benchmarks from several sources including ORNL (Efroymson et al. 1997a,b), CCME (CCME 1997), and Dutch values (Crommenentujin et al. 1994). From these sources, screening levels are selected based on contaminant levels associated with ecological effects (USEPA 2002b). These screening values do not take into account area or regional background levels.
USEPA Region 5 Ecological Screening Levels
The USEPA Region 5 reviewed and evaluated soil quality criteria from international, federal, and state sources (USEPA 1999). A default soil ecological screening level (ESL) is selected based on the lowest receptor-specific ESL for terrestrial (plant/soil organisms) and wildlife receptors found during a review of existing toxicological information. The ESL is derived from the concentration which resulted in no observed adverse effects (NOAEL) for chronic exposure of the target species. When a chronic value is not available, the most relevant toxicological result is adjusted by division with uncertainty factors as appropriate to approximate the chronic NOAEL for the selected receptor (USEPA 1999).
Because the CCME final SQGs do not make a distinction between ecological and human health benchmarks, they are not included as a benchmark source. The Region 4 benchmarks are also excluded because they are based on primary sources that had been previously reviewed. For the remaining sources, selection of the surficial soil toxicity benchmarks for terrestrial receptors is based on the following hierarchy: Eco-SSLs ORNL benchmarks Region 5 ESLs Benchmarks for soil microbes were not included for the purposes of performing screening level risk calculations (see Attachment 1-2 of the Eco-SSL guidance document for additional information on the exclusion of microbes). The soil benchmark values for all chemicals analyzed in surface soils are shown in Table C-3. References: Canadian Council of Ministers of the Environment (CCME). 1997. Recommended Canadian Soil Quality Guidelines. CCME, Winnipeg.

C-15
Canadian Council of Ministers of the Environment (CCME). 1999. Canadian Soil Quality Guidelines for the Protection of Environmental and Human Health: Summary of the Protocol for the Derivation of Environmental and Human Health Soil Quality Guidelines. In: Canadian Environmental Quality Guidelines, Chapter 7, CCME, 1999, Winnipeg. Crommentuijin, GH, EJ Van der Plassche and JH Canton. 1994. Guidance Document on the Derivation of Ecotoxicological Criteria for Serious Soil Contamination in View of the Intervention Value for Soil Clean-up. RIVM report 950011003. RIVM, Bilthoven, The Netherlands. Efroymson, R.A., M.E. Will, G.W. Suter II, and A.C. Wooten. 1997a. Toxicological Benchmarks for Screening Contaminants of Potential Concern for Effects on Terrestrial Plants: 1997 Revision. Prepared for the U.S. Department of Energy, Office of Environmental Management by Lockheed Martin Energy Systems, Inc. managing the Oak Ridge National Laboratory (ORNL).ORNL publication. ES/ER/TM-85/R3, November 1997. Efroymson, R.A., M.E. Will and G.W. Suter II. 1997b. Toxicological Benchmarks for Contaminants of Potential Concern for Effects on Soil and Litter Invertebrates and Heterotrophic Process: 1997 Revision. Prepared for the U.S. Department of Energy, Office of Environmental Management by Lockheed Martin Energy Systems, Inc. managing the Oak Ridge National Laboratory (ORNL).ORNL publication. ES/ER/TM-126/R2, November 1997. Swartjes, FA. 1999. Risk-Based Assessment of Soil and Groundwater Quality in the Netherlands: Standards and Remediation Urgency. Risk Analysis 19(6):1235-1249. US Environmental Protection Agency (USEPA). 1999b. Region 5 Ecological Screening Levels for RCRA Appendix IX Hazardous Constituents. Working Draft 1999. United States Environmental Protection Agency, Region 5. US Environmental Protection Agency (USEPA). 2002. Region 4 Ecological Risk Assessment Bulletins - Supplement to RAGS. Soil Screening Values. From: Friday, GP. 1998. Ecological Screening Values for Surface Water, Sediment, and Soil. Westinghouse Savannah River Company, Savannah River Technology Center. Report ID WSRC-TR-98-00110. Downloaded on July 15, 2002 from website: http://www.epa.gov/region04/waste/ots/ecolbul.htm United States Environmental Protection Agency (USEPA). 2007. Ecological Soil Screening Levels (Eco-SSLs). Website. http://www.epa.gov/ecotox/ecossl/. Accessed 12/20/2007.

C-16
Table C-1. Surface Water Toxicity Benchmarks
Analyte Type Analyte
NAWQC - Chronic
(ug/L)
GLWQI Tier II SCV
(ug/L)
USEPA R4 -
Chronic (ug/L)
USEPA R5
(ug/L) Other (ug/L)
Surface Water
Chronic Benchmark
(ug/L)
Inor
gani
cs
Aluminum 87 -- 87 -- 75 EC20 Sensitive Species 87
Arsenic 150 -- 190 148 5 CCME WQG 150
Barium 5,000 a 4 -- 220 -- 5,000
Cadmium 0.25 b -- 1.13 -- -- 0.25
Calcium -- -- 116,000 -- 116,000 LCV Daphnids 116,000
Chromium III 74 b -- 207 -- -- 74
Chromium VI 11 b -- 11 -- -- 11
Cobalt -- 23 -- 24 -- 23
Copper 9 b -- 11.8 1.58 -- 9
Iron 1,000 -- 1,000 -- 300 CCME WQG 1,000
Lead 2.5 b -- 3.18 1.17 -- 2.5
Magnesium -- -- 82,000 -- 82,000 LCV Daphnids 82,000
Manganese -- 120 -- -- -- 120
Mercury 0.65 1.3 0.012 0.0013 -- 0.65
Nickel 52 b -- 158 28.9 -- 52
Potassium -- -- 53,000 -- 53,000 LCV Daphnids 53,000
Silver 0.3 a 0.36 0.012 0.12 -- 0.3
Sodium -- -- 680,000 -- 680,000 LCV Daphnids 680,000
Thallium -- 12 4 10 -- 12
Vanadium -- 20 -- 12 -- 20
Zinc 118 b -- 106 65.7 -- 118
Aro
clor
s
Aroclor-1016 -- -- -- -- -- no benchmark
Aroclor-1221 -- 0.28 -- -- 60 LCV Fish 0.3
Aroclor-1232 -- 0.58 -- -- 124 LCV Fish 0.58
Aroclor-1242 -- 0.053 -- -- 2.9 EC20 Fish 0.05
Aroclor-1248 -- 0.081 -- -- 0.4 EC20 Fish 0.08
Aroclor-1254 -- 0.033 -- -- 0.1 LCV Aquatic Plants 0.03
Aroclor-1260 -- 94 -- -- 1.3 LCV Fish 94
Aroclor-1262 -- -- -- -- -- no benchmark
Aroclor-1268 -- -- -- -- -- no benchmark
SVO
Cs 1,2,4-Trichlorobenzene -- 110 130 30 24 CCME WQG 110
1,2-Dichlorobenzene -- 14 23 14 1 CCME WQG 14
1,2-Diphenylhydrazine 3 -- 1 -- -- -- 3

C-17
1,3-Dichlorobenzene -- 71 22 38 150 CCME WQG 71
1,4-Dichlorobenzene -- 15 9 9 26 CCME WQG 15
1-Methylnaphthalene -- 2 2 -- 500 EC20 Fish 2
2,4,5-Trichlorophenol 63 -- 2 -- -- -- 63
2,4,6-Trichlorophenol -- -- 5 5 -- -- 5
2,4-Dichlorophenol -- -- 11 11 -- -- 11
2,4-Dimethylphenol -- -- 15 100 -- -- 15
2,4-Dinitrophenol -- -- 71 19 -- -- 71
2,4-Dinitrotoluene -- -- 44 44 -- -- 44
2,6-Dinitrotoluene -- -- 81 81 -- -- 81
2-Chloronaphthalene -- -- -- 0.4 -- -- 0.4
2-Chlorophenol -- -- 32 24 -- -- 32
2-Methylnaphthalene -- -- 5 330 -- -- 5
2-Nitroaniline -- -- -- -- -- -- no benchmark
2-Nitrophenol -- -- 73 -- -- -- 73
3,3`-Dichlorobenzidine -- -- 5 5 -- -- 5
3-Nitroaniline -- -- -- -- -- -- no benchmark
4,6-Dinitro-o-cresol -- -- -- 23 -- -- 23 4-Bromophenyl phenyl ether -- 2 2 2 -- -- 2
4-Chloro-3-methylphenol -- -- 7.4 35 -- -- 7.4
4-Chlorophenyl phenyl ether -- -- -- -- -- -- no
benchmark
4-Nitroaniline -- -- -- -- -- -- no benchmark
4-Nitrophenol -- 300 58 60 464 EC20 Fish 300
Acenaphthene -- -- 15 38 6 CCME WQG 15
Acenaphthylene -- -- 13 4840 -- -- 13
Anthracene -- 0.73 0 0.04 0.01 CCME WQG 0.73
Benzo(a)anthracene -- 0.03 5 0.03 0.02 CCME WQG 0.03
Benzo(a)pyrene -- 0.01 0 0.01 0.02 CCME WQG 0.01
Benzo(b)fluoranthene -- -- 3 9 -- -- 3
Benzo(g,h,i)perylene -- -- 0.44 8 -- -- 0.44
Benzo(k)fluoranthene -- -- 0.64 -- -- -- 0.6 bis(2-chloroethoxy)methane -- -- -- -- -- -- no
benchmark bis(2-chloroethyl)ether -- -- -- 1900 -- -- 1,900 Bis(2-chloroisopropyl)ether -- -- -- -- -- -- no
benchmark Bis(2-ethylhexyl)phthalate -- 3 3.0 0.3 16 CCME WQG 3
Butyl benzyl phthalate -- 19 23 23 -- -- 19
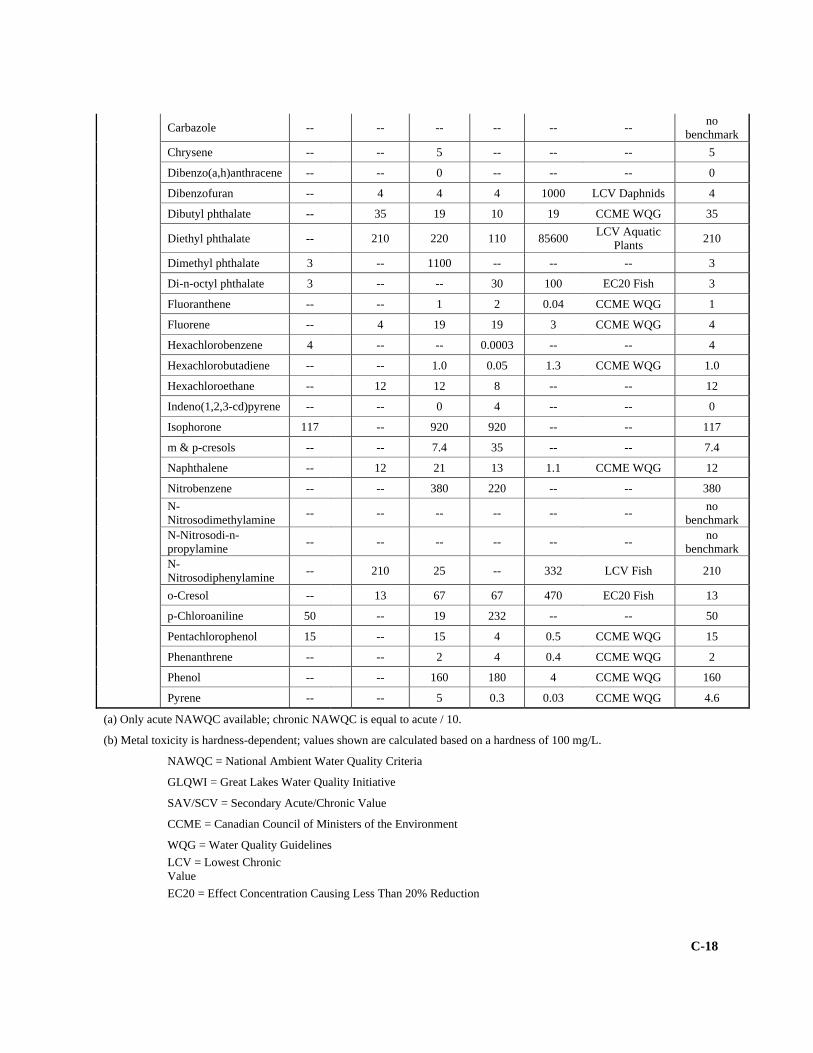
C-18
Carbazole -- -- -- -- -- -- no benchmark
Chrysene -- -- 5 -- -- -- 5
Dibenzo(a,h)anthracene -- -- 0 -- -- -- 0
Dibenzofuran -- 4 4 4 1000 LCV Daphnids 4
Dibutyl phthalate -- 35 19 10 19 CCME WQG 35
Diethyl phthalate -- 210 220 110 85600 LCV Aquatic Plants 210
Dimethyl phthalate 3 -- 1100 -- -- -- 3
Di-n-octyl phthalate 3 -- -- 30 100 EC20 Fish 3
Fluoranthene -- -- 1 2 0.04 CCME WQG 1
Fluorene -- 4 19 19 3 CCME WQG 4
Hexachlorobenzene 4 -- -- 0.0003 -- -- 4
Hexachlorobutadiene -- -- 1.0 0.05 1.3 CCME WQG 1.0
Hexachloroethane -- 12 12 8 -- -- 12
Indeno(1,2,3-cd)pyrene -- -- 0 4 -- -- 0
Isophorone 117 -- 920 920 -- -- 117
m & p-cresols -- -- 7.4 35 -- -- 7.4
Naphthalene -- 12 21 13 1.1 CCME WQG 12
Nitrobenzene -- -- 380 220 -- -- 380 N-Nitrosodimethylamine -- -- -- -- -- -- no
benchmark N-Nitrosodi-n-propylamine -- -- -- -- -- -- no
benchmark N-Nitrosodiphenylamine -- 210 25 -- 332 LCV Fish 210
o-Cresol -- 13 67 67 470 EC20 Fish 13
p-Chloroaniline 50 -- 19 232 -- -- 50
Pentachlorophenol 15 -- 15 4 0.5 CCME WQG 15
Phenanthrene -- -- 2 4 0.4 CCME WQG 2
Phenol -- -- 160 180 4 CCME WQG 160
Pyrene -- -- 5 0.3 0.03 CCME WQG 4.6
(a) Only acute NAWQC available; chronic NAWQC is equal to acute / 10.
(b) Metal toxicity is hardness-dependent; values shown are calculated based on a hardness of 100 mg/L.
NAWQC = National Ambient Water Quality Criteria
GLQWI = Great Lakes Water Quality Initiative
SAV/SCV = Secondary Acute/Chronic Value
CCME = Canadian Council of Ministers of the Environment
WQG = Water Quality Guidelines
LCV = Lowest Chronic Value
EC20 = Effect Concentration Causing Less Than 20% Reduction

C-19
Table C-2. Sediment Toxicity Benchmarks
Threshold Effect Concentrations (TEC)1
Analyte Analyte Consensus-Based TEC (mg/kg) a
ARCS TEL
(mg/kg) b Other (mg/kg)
Sediment Screening
Benchmark (mg/kg)
Met
als
Aluminum -- 25,519 -- 25,519 Arsenic 9.8 11 -- 9.8 Barium -- -- -- no benchmark Cadmium 0.99 0.58 -- 0.99 Chromium 43 36 -- 43 Cobalt -- -- -- no benchmark Copper 32 28 -- 32 Iron -- 188,400 -- 188,400 Lead 36 37 -- 36 Manganese -- 631 -- 631 Mercury 0.18 -- -- 0.18 Nickel 23 20 -- 23
Silver -- -- 1.0 NOAA ERL c 1
Thallium -- -- -- no benchmark Vanadium -- -- -- no benchmark Zinc 121 98 -- 121
PAH
s HMW PAHs -- 0.19 -- 0.19
LMW PAHs -- 0.08 -- 0.08
Aro
clor
s
Aroclor-1016 -- -- -- no benchmark
Aroclor-1221 -- -- -- no benchmark
Aroclor-1232 -- -- -- no benchmark
Aroclor-1242 -- -- -- no benchmark
Aroclor-1248 -- -- -- no benchmark
Aroclor-1254 -- -- -- no benchmark
Aroclor-1260 -- -- -- no benchmark
Aroclor-1262 -- -- -- no benchmark
Aroclor-1268 -- -- -- no benchmark
SVO
Cs 1,2,4-Trichlorobenzene -- -- 2.1 USEPA Region 3 d 2
1,2-Dichlorobenzene -- -- 0.02 USEPA Region 3 0.02
1,2-Diphenylhydrazine -- -- -- no benchmark
1,3-Dichlorobenzene -- -- 4.4 USEPA Region 3 4

C-20
1,4-Dichlorobenzene -- -- 0.6 USEPA Region 3 0.6
2,4,5-Trichlorophenol -- -- -- no benchmark
2,4,6-Trichlorophenol -- -- 0.21 USEPA Region 3 0.21
2,4-Dichlorophenol -- -- 0.12 USEPA Region 3 0.12
2,4-Dimethylphenol -- -- 0.03 USEPA Region 3 0.03
2,4-Dinitrophenol -- -- -- no benchmark
2,4-Dinitrotoluene -- -- 0.04 USEPA Region 3 0.04
2,6-Dinitrotoluene -- -- -- no benchmark
2-Chloronaphthalene -- -- -- no benchmark
2-Chlorophenol -- -- 0.03 USEPA Region 3 0.03
2-Nitroaniline -- -- -- no benchmark
2-Nitrophenol -- -- -- no benchmark
3,3`-Dichlorobenzidine -- -- 0.13 USEPA Region 3 0.13
3-Nitroaniline -- -- -- no benchmark
4,6-Dinitro-o-cresol -- -- -- no benchmark 4-Bromophenyl phenyl ether -- -- 1.2 USEPA Region 3 1.2
4-Chloro-3-methylphenol -- -- -- no benchmark
4-Chlorophenyl phenyl ether -- -- -- no benchmark
4-Nitroaniline -- -- -- no benchmark
4-Nitrophenol -- -- -- no benchmark bis(2-chloroethoxy)methane -- -- -- no benchmark
bis(2-chloroethyl)ether -- -- -- no benchmark Bis(2-chloroisopropyl)ether -- -- -- no benchmark
Bis(2-ethylhexyl)phthalate -- -- 0.18 USEPA Region 3 0.18
Butyl benzyl phthalate -- -- 10.9 USEPA Region 3 11
Carbazole -- -- -- no benchmark
Dibutyl phthalate -- -- 6.5 USEPA Region 3 6.5
Diethyl phthalate -- -- 0.6 USEPA Region 3 0.6
Dimethyl phthalate -- -- -- no benchmark
Di-n-octyl phthalate -- -- -- no benchmark
Hexachlorobenzene -- -- 0.02 USEPA Region 3 0.02
Hexachlorobutadiene -- -- -- no benchmark
Hexachloroethane -- -- 1.0 USEPA Region 3 1.0
Isophorone -- -- -- no benchmark
m & p-cresols -- -- -- no benchmark
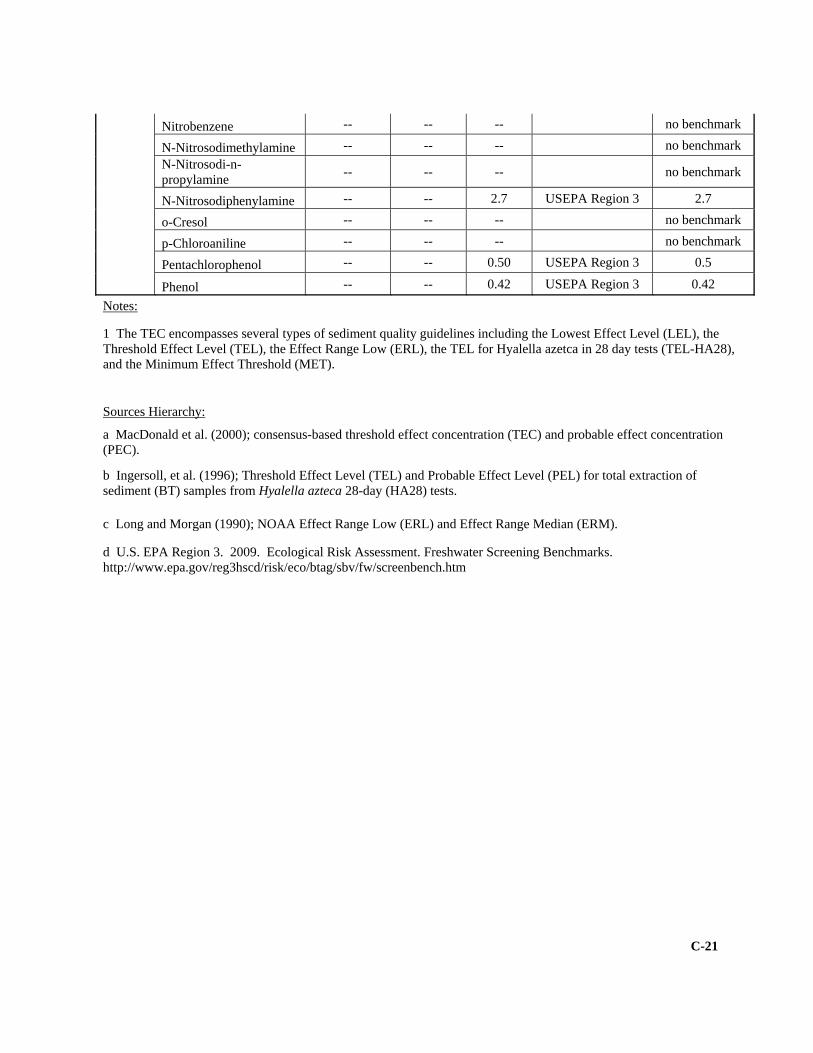
C-21
Nitrobenzene -- -- -- no benchmark
N-Nitrosodimethylamine -- -- -- no benchmark N-Nitrosodi-n-propylamine -- -- -- no benchmark
N-Nitrosodiphenylamine -- -- 2.7 USEPA Region 3 2.7
o-Cresol -- -- -- no benchmark
p-Chloroaniline -- -- -- no benchmark
Pentachlorophenol -- -- 0.50 USEPA Region 3 0.5
Phenol -- -- 0.42 USEPA Region 3 0.42 Notes:
1 The TEC encompasses several types of sediment quality guidelines including the Lowest Effect Level (LEL), the Threshold Effect Level (TEL), the Effect Range Low (ERL), the TEL for Hyalella azetca in 28 day tests (TEL-HA28), and the Minimum Effect Threshold (MET).
Sources Hierarchy:
a MacDonald et al. (2000); consensus-based threshold effect concentration (TEC) and probable effect concentration (PEC).
b Ingersoll, et al. (1996); Threshold Effect Level (TEL) and Probable Effect Level (PEL) for total extraction of sediment (BT) samples from Hyalella azteca 28-day (HA28) tests.
c Long and Morgan (1990); NOAA Effect Range Low (ERL) and Effect Range Median (ERM).
d U.S. EPA Region 3. 2009. Ecological Risk Assessment. Freshwater Screening Benchmarks. http://www.epa.gov/reg3hscd/risk/eco/btag/sbv/fw/screenbench.htm
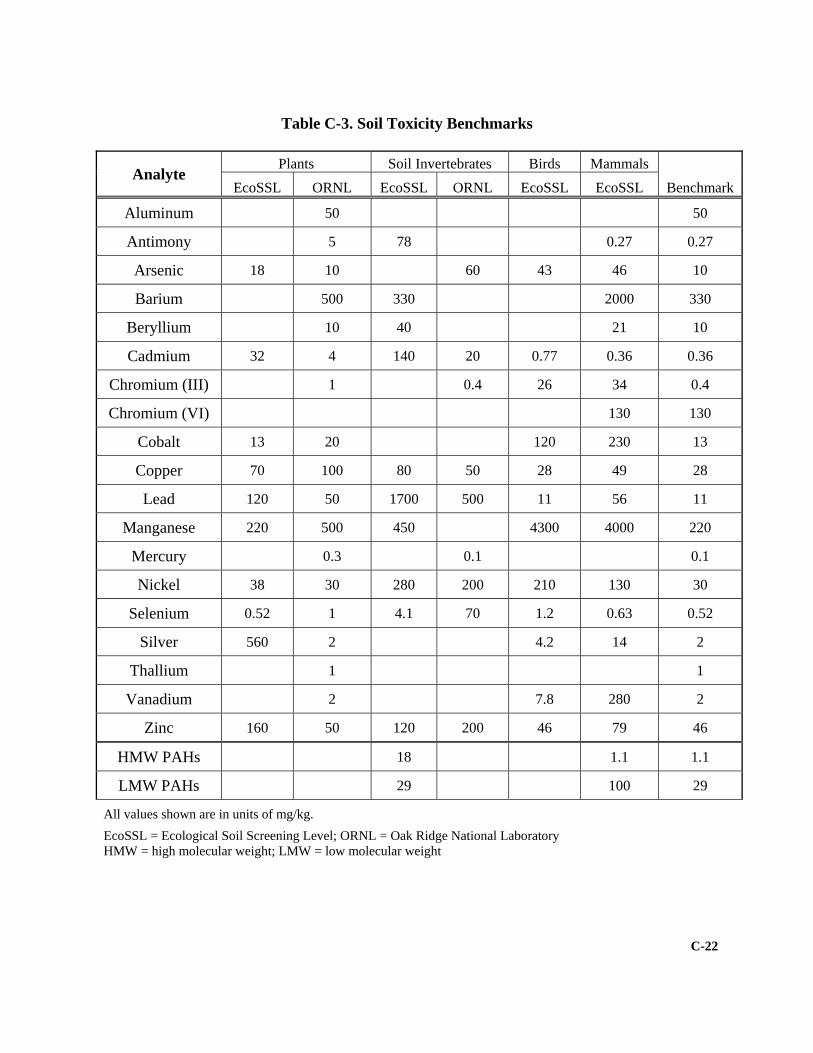
C-22
Table C-3. Soil Toxicity Benchmarks
Analyte Plants Soil Invertebrates Birds Mammals
Benchmark EcoSSL ORNL EcoSSL ORNL EcoSSL EcoSSL
Aluminum 50 50
Antimony 5 78 0.27 0.27
Arsenic 18 10 60 43 46 10
Barium 500 330 2000 330
Beryllium 10 40 21 10
Cadmium 32 4 140 20 0.77 0.36 0.36
Chromium (III) 1 0.4 26 34 0.4
Chromium (VI) 130 130
Cobalt 13 20 120 230 13
Copper 70 100 80 50 28 49 28
Lead 120 50 1700 500 11 56 11
Manganese 220 500 450 4300 4000 220
Mercury 0.3 0.1 0.1
Nickel 38 30 280 200 210 130 30
Selenium 0.52 1 4.1 70 1.2 0.63 0.52
Silver 560 2 4.2 14 2
Thallium 1 1
Vanadium 2 7.8 280 2
Zinc 160 50 120 200 46 79 46
HMW PAHs 18 1.1 1.1
LMW PAHs 29 100 29
All values shown are in units of mg/kg. EcoSSL = Ecological Soil Screening Level; ORNL = Oak Ridge National Laboratory HMW = high molecular weight; LMW = low molecular weight

APPENDIX D
ProUCL Output

Wilcoxon‐Mann‐Whitney Sample 1 vs Sample 2 Comparison Test for Data Sets with Non‐DetectsFull Precision OFF
Confidence Coefficient 95%
Selected Null Hypothesis Sample 1 Mean/Median >= Sample 2 Mean/Median (Form 2)Alternative Hypothesis Sample 1 Mean/Median < Sample 2 Mean/Median
ALUMINUM
Sample 1 Data: SiteAl
Sample 2 Data: BkgAl
Raw Statistics
Sample 1 Sample 2
Number of Valid Data 96 112
Number of Non‐Detects 0 0
Number of Detect Data 96 112
Minimum Non‐Detect N/A N/A
Maximum Non‐Detect N/A N/A
Percent Non‐detects 0.00% 0.00%
Minimum Detect 1190 4150
Maximum Detect 30700 33700
Mean of Detects 12686 15522
Median of Detects 12150 15000
SD of Detects 6388 5758
Wilcoxon‐Mann‐Whitney (WMW) Test
H0: Mean/Median of Sample 1 >= Mean/Median of Sample 2
Sample 1 Rank Sum W‐Stat 8675
Standardized WMW U‐Stat ‐3.137
Mean (U) 5376
SD(U) ‐ Adj ties 432.7
Approximate U‐Stat Critical Value (0.05) ‐1.645
P‐Value (Adjusted for Ties) 8.53E‐04
Conclusion with Alpha = 0.05 Reject H0, Conclude Sample 1 < Sample 2 P‐Value < alpha (0.05)
OU1 SOIL VERSUS BACKGROUND SOIL
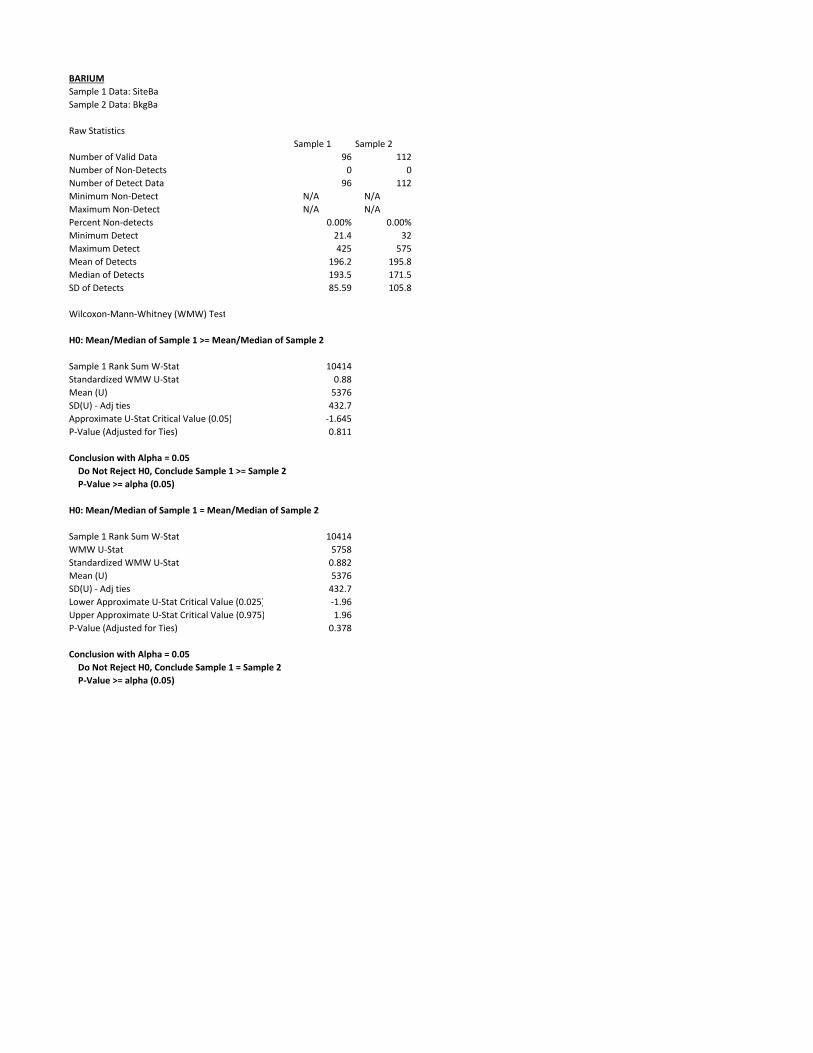
BARIUM
Sample 1 Data: SiteBa
Sample 2 Data: BkgBa
Raw Statistics
Sample 1 Sample 2
Number of Valid Data 96 112
Number of Non‐Detects 0 0
Number of Detect Data 96 112
Minimum Non‐Detect N/A N/A
Maximum Non‐Detect N/A N/A
Percent Non‐detects 0.00% 0.00%
Minimum Detect 21.4 32
Maximum Detect 425 575
Mean of Detects 196.2 195.8
Median of Detects 193.5 171.5
SD of Detects 85.59 105.8
Wilcoxon‐Mann‐Whitney (WMW) Test
H0: Mean/Median of Sample 1 >= Mean/Median of Sample 2
Sample 1 Rank Sum W‐Stat 10414
Standardized WMW U‐Stat 0.88
Mean (U) 5376
SD(U) ‐ Adj ties 432.7
Approximate U‐Stat Critical Value (0.05) ‐1.645
P‐Value (Adjusted for Ties) 0.811
Conclusion with Alpha = 0.05 Do Not Reject H0, Conclude Sample 1 >= Sample 2 P‐Value >= alpha (0.05)
H0: Mean/Median of Sample 1 = Mean/Median of Sample 2
Sample 1 Rank Sum W‐Stat 10414
WMW U‐Stat 5758
Standardized WMW U‐Stat 0.882
Mean (U) 5376
SD(U) ‐ Adj ties 432.7
Lower Approximate U‐Stat Critical Value (0.025) ‐1.96
Upper Approximate U‐Stat Critical Value (0.975) 1.96
P‐Value (Adjusted for Ties) 0.378
Conclusion with Alpha = 0.05 Do Not Reject H0, Conclude Sample 1 = Sample 2 P‐Value >= alpha (0.05)
----

CHROMIUM
Sample 1 Data: SiteCr
Sample 2 Data: BkgCr
Raw Statistics
Sample 1 Sample 2
Number of Valid Data 96 112
Number of Non‐Detects 5 0
Number of Detect Data 91 112
Minimum Non‐Detect 0.16 N/A
Maximum Non‐Detect 0.21 N/A
Percent Non‐detects 5.21% 0.00%
Minimum Detect 1.2 3.2
Maximum Detect 18.5 130
Mean of Detects 10.84 19.6
Median of Detects 10.7 18.05
SD of Detects 3.562 12.22
Wilcoxon‐Mann‐Whitney (WMW) Test
H0: Mean/Median of Sample 1 >= Mean/Median of Sample 2
Sample 1 Rank Sum W‐Stat 5991
Standardized WMW U‐Stat ‐9.341
Mean (U) 5376
SD(U) ‐ Adj ties 432.7
Approximate U‐Stat Critical Value (0.05) ‐1.645
P‐Value (Adjusted for Ties) 4.77E‐21
Conclusion with Alpha = 0.05 Reject H0, Conclude Sample 1 < Sample 2 P‐Value < alpha (0.05)

COPPER
Sample 1 Data: SiteCu
Sample 2 Data: BkgCu
Raw Statistics
Sample 1 Sample 2
Number of Valid Data 96 112
Number of Non‐Detects 2 0
Number of Detect Data 94 112
Minimum Non‐Detect 0.33 N/A
Maximum Non‐Detect 0.36 N/A
Percent Non‐detects 2.08% 0.00%
Minimum Detect 2.8 3.8
Maximum Detect 33.9 70.7
Mean of Detects 19.08 17.62
Median of Detects 18.85 15.75
SD of Detects 6.801 10.1
Wilcoxon‐Mann‐Whitney (WMW) Test
H0: Mean/Median of Sample 1 >= Mean/Median of Sample 2
Sample 1 Rank Sum W‐Stat 10991
Standardized WMW U‐Stat 2.214
Mean (U) 5376
SD(U) ‐ Adj ties 432.7
Approximate U‐Stat Critical Value (0.05) ‐1.645
P‐Value (Adjusted for Ties) 0.987
Conclusion with Alpha = 0.05 Do Not Reject H0, Conclude Sample 1 >= Sample 2 P‐Value >= alpha (0.05)
H0: Mean/Median of Sample 1 = Mean/Median of Sample 2
Sample 1 Rank Sum W‐Stat 10991
WMW U‐Stat 6335
Standardized WMW U‐Stat 2.215
Mean (U) 5376
SD(U) ‐ Adj ties 432.7
Lower Approximate U‐Stat Critical Value (0.025) ‐1.96
Upper Approximate U‐Stat Critical Value (0.975) 1.96
P‐Value (Adjusted for Ties) 0.0268
Conclusion with Alpha = 0.05 Reject H0, Conclude Sample 1 <> Sample 2 P‐Value < alpha (0.05)
---

LEAD
Sample 1 Data: SitePb
Sample 2 Data: BkgPb
Raw Statistics
Sample 1 Sample 2
Number of Valid Data 96 112
Number of Non‐Detects 0 0
Number of Detect Data 96 112
Minimum Non‐Detect N/A N/A
Maximum Non‐Detect N/A N/A
Percent Non‐detects 0.00% 0.00%
Minimum Detect 2.6 3
Maximum Detect 20.5 36.9
Mean of Detects 10.2 15.28
Median of Detects 10.45 14.5
SD of Detects 3.386 6.374
Wilcoxon‐Mann‐Whitney (WMW) Test
H0: Mean/Median of Sample 1 >= Mean/Median of Sample 2
Sample 1 Rank Sum W‐Stat 7415
Standardized WMW U‐Stat ‐6.05
Mean (U) 5376
SD(U) ‐ Adj ties 432.7
Approximate U‐Stat Critical Value (0.05) ‐1.645
P‐Value (Adjusted for Ties) 7.22E‐10
Conclusion with Alpha = 0.05 Reject H0, Conclude Sample 1 < Sample 2 P‐Value < alpha (0.05)
--

MANGANESE
Sample 1 Data: SiteMn
Sample 2 Data: BkgMn
Raw Statistics
Sample 1 Sample 2
Number of Valid Data 96 112
Number of Non‐Detects 0 0
Number of Detect Data 96 112
Minimum Non‐Detect N/A N/A
Maximum Non‐Detect N/A N/A
Percent Non‐detects 0.00% 0.00%
Minimum Detect 91.7 74
Maximum Detect 726 2920
Mean of Detects 329.6 508.4
Median of Detects 318.5 425
SD of Detects 144.4 369.2
Wilcoxon‐Mann‐Whitney (WMW) Test
H0: Mean/Median of Sample 1 >= Mean/Median of Sample 2
Sample 1 Rank Sum W‐Stat 7998
Standardized WMW U‐Stat ‐4.702
Mean (U) 5376
SD(U) ‐ Adj ties 432.7
Approximate U‐Stat Critical Value (0.05) ‐1.645
P‐Value (Adjusted for Ties) 1.29E‐06
Conclusion with Alpha = 0.05 Reject H0, Conclude Sample 1 < Sample 2 P‐Value < alpha (0.05)

SELENIUM
Sample 1 Data: SiteSe
Sample 2 Data: BkgSe
Raw Statistics
Sample 1 Sample 2
Number of Valid Data 18 112
Number of Non‐Detects 2 24
Number of Detect Data 16 88
Minimum Non‐Detect 0.28 0.2
Maximum Non‐Detect 0.3 0.2
Percent Non‐detects 11.11% 21.43%
Minimum Detect 0.27 0.2
Maximum Detect 1.8 1.6
Mean of Detects 0.986 0.46
Median of Detects 1.03 0.4
SD of Detects 0.43 0.218
WMW test is meant for a Single Detection Limit Case
Use of Gehan or T‐W test is suggested when multiple detection limits are presentAll observations <= 0.3 (Max DL) are ranked the same
Wilcoxon‐Mann‐Whitney (WMW) Test
H0: Mean/Median of Sample 1 >= Mean/Median of Sample 2
Sample 1 Rank Sum W‐Stat 1817
Standardized WMW U‐Stat 4.487
Mean (U) 1008
SD(U) ‐ Adj ties 147.7
Approximate U‐Stat Critical Value (0.05) ‐1.645
P‐Value (Adjusted for Ties) 1
Conclusion with Alpha = 0.05 Do Not Reject H0, Conclude Sample 1 >= Sample 2 P‐Value >= alpha (0.05)
Sample 1 vs Sample 2 Gehan Test
H0: Mean of Sample 1 >= Mean of background
Gehan z Test Value 4.192
Critical z (0.05) ‐1.645
P‐Value 1
Conclusion with Alpha = 0.05 Do Not Reject H0, Conclude Sample 1 >= Sample 2 P‐Value >= alpha (0.05)
Sample 1 vs Sample 2 Gehan Test
H0: Mean of Sample 1 = Mean of background
Gehan z Test Value 4.192
Lower Critical z (0.025) ‐1.96
Upper Critical z (0.975) 1.96
P‐Value 2.77E‐05
Conclusion with Alpha = 0.05 Reject H0, Conclude Sample 1 <> Sample 2 P‐Value < alpha (0.05)

VANADIUM
Sample 1 Data: SiteV
Sample 2 Data: BkgV
Raw Statistics
Sample 1 Sample 2
Number of Valid Data 96 112
Number of Non‐Detects 0 0
Number of Detect Data 96 112
Minimum Non‐Detect N/A N/A
Maximum Non‐Detect N/A N/A
Percent Non‐detects 0.00% 0.00%
Minimum Detect 3.9 6.7
Maximum Detect 21.9 92.2
Mean of Detects 13.59 30.94
Median of Detects 13.55 29.6
SD of Detects 4.147 13.48
Wilcoxon‐Mann‐Whitney (WMW) Test
H0: Mean/Median of Sample 1 >= Mean/Median of Sample 2
Sample 1 Rank Sum W‐Stat 5339
Standardized WMW U‐Stat ‐10.85
Mean (U) 5376
SD(U) ‐ Adj ties 432.7
Approximate U‐Stat Critical Value (0.05) ‐1.645
P‐Value (Adjusted for Ties) 1.04E‐27
Conclusion with Alpha = 0.05 Reject H0, Conclude Sample 1 < Sample 2 P‐Value < alpha (0.05)
ZINC
Sample 1 Data: SiteZn
Sample 2 Data: BkgZn
Raw Statistics
Sample 1 Sample 2
Number of Valid Data 96 112
Number of Non‐Detects 0 0
Number of Detect Data 96 112
Minimum Non‐Detect N/A N/A
Maximum Non‐Detect N/A N/A
Percent Non‐detects 0.00% 0.00%
Minimum Detect 10.6 16
Maximum Detect 90.6 147
Mean of Detects 53.49 60.51
Median of Detects 54.45 56.5
SD of Detects 17.83 23.26
Wilcoxon‐Mann‐Whitney (WMW) Test
H0: Mean/Median of Sample 1 >= Mean/Median of Sample 2
Sample 1 Rank Sum W‐Stat 9259
Standardized WMW U‐Stat ‐1.788
Mean (U) 5376
SD(U) ‐ Adj ties 432.7
Approximate U‐Stat Critical Value (0.05) ‐1.645
P‐Value (Adjusted for Ties) 0.0369
Conclusion with Alpha = 0.05 Reject H0, Conclude Sample 1 < Sample 2 P‐Value < alpha (0.05)

TEQ MAMMAL ND=0Sample 1 Data: SiteMammalND0
Sample 2 Data: BkgMammalND0
Raw Statistics
Sample 1 Sample 2
Number of Valid Data 96 64
Number of Non‐Detects 0 2
Number of Detect Data 96 62
Minimum Non‐Detect N/A 0
Maximum Non‐Detect N/A 0
Percent Non‐detects 0.00% 3.13%
Minimum Detect 5.53E‐09 7.20E‐10
Maximum Detect 1.23E‐06 1.56E‐06
Mean of Detects 1.67E‐07 1.81E‐07
Median of Detects 6.60E‐08 8.14E‐08
SD of Detects 2.28E‐07 2.67E‐07
Wilcoxon‐Mann‐Whitney (WMW) Test
H0: Mean/Median of Sample 1 >= Mean/Median of Sample 2
Sample 1 Rank Sum W‐Stat 7640
Standardized WMW U‐Stat ‐0.308
Mean (U) 3072
SD(U) ‐ Adj ties 287.1
Approximate U‐Stat Critical Value (0.05) ‐1.645
P‐Value (Adjusted for Ties) 0.379
Conclusion with Alpha = 0.05 Do Not Reject H0, Conclude Sample 1 >= Sample 2 P‐Value >= alpha (0.05)
Wilcoxon‐Mann‐Whitney (WMW) Test
H0: Mean/Median of Sample 1 = Mean/Median of Sample 2
Sample 1 Rank Sum W‐Stat 7640
WMW U‐Stat 2984
Standardized WMW U‐Stat ‐0.307
Mean (U) 3072
SD(U) ‐ Adj ties 287.1
Lower Approximate U‐Stat Critical Value (0.025) ‐1.96
Upper Approximate U‐Stat Critical Value (0.975) 1.96
P‐Value (Adjusted for Ties) 0.759
Conclusion with Alpha = 0.05 Do Not Reject H0, Conclude Sample 1 = Sample 2 P‐Value >= alpha (0.05)

TEQ AVIAN ND=0Sample 1 Data: SiteBirdND0
Sample 2 Data: BkgBirdND0
Raw Statistics
Sample 1 Sample 2
Number of Valid Data 96 64
Number of Non‐Detects 0 2
Number of Detect Data 96 62
Minimum Non‐Detect N/A 0
Maximum Non‐Detect N/A 0
Percent Non‐detects 0.00% 3.13%
Minimum Detect 6.98E‐10 2.40E‐10
Maximum Detect 1.22E‐06 1.65E‐06
Mean of Detects 1.03E‐07 2.41E‐07
Median of Detects 2.03E‐08 1.42E‐07
SD of Detects 2.08E‐07 3.15E‐07
Wilcoxon‐Mann‐Whitney (WMW) Test
H0: Mean/Median of Sample 1 >= Mean/Median of Sample 2
Sample 1 Rank Sum W‐Stat 6838
Standardized WMW U‐Stat ‐3.102
Mean (U) 3072
SD(U) ‐ Adj ties 287.1
Approximate U‐Stat Critical Value (0.05) ‐1.645
P‐Value (Adjusted for Ties) 9.62E‐04
Conclusion with Alpha = 0.05 Reject H0, Conclude Sample 1 < Sample 2 P‐Value < alpha (0.05)

TEQ MAMMAL ND=1/2 MDL (SITE); 1/2 RL (BKGD)Sample 1 Data: SiteMammalNDhalfMDL
Sample 2 Data: BkgMammalNDhalfRL
Raw Statistics
Sample 1 Sample 2
Number of Valid Data 96 64
Number of Non‐Detects 0 2
Number of Detect Data 96 62
Minimum Non‐Detect N/A 1.03E‐06
Maximum Non‐Detect N/A 1.10E‐06
Percent Non‐detects 0.00% 3.13%
Minimum Detect 3.78E‐08 1.32E‐07
Maximum Detect 1.24E‐06 1.85E‐06
Mean of Detects 2.02E‐07 7.05E‐07
Median of Detects 1.02E‐07 6.11E‐07
SD of Detects 2.25E‐07 4.65E‐07
WMW test is meant for a Single Detection Limit Case
Use of Gehan or T‐W test is suggested when multiple detection limits are presentAll observations <= 1.0986E‐6 (Max DL) are ranked the same
Wilcoxon‐Mann‐Whitney (WMW) Test
H0: Mean/Median of Sample 1 >= Mean/Median of Sample 2
Sample 1 Rank Sum W‐Stat 6803
Standardized WMW U‐Stat ‐5.493
Mean (U) 3072
SD(U) ‐ Adj ties 287.1
Approximate U‐Stat Critical Value (0.05) ‐1.645
P‐Value (Adjusted for Ties) 1.97E‐08
Conclusion with Alpha = 0.05 Reject H0, Conclude Sample 1 < Sample 2 P‐Value < alpha (0.05)
Sample 1 vs Sample 2 Gehan Test
H0: Mean of Sample 1 >= Mean of background
Gehan z Test Value ‐7.946
Critical z (0.05) ‐1.645
P‐Value 9.64E‐16
Conclusion with Alpha = 0.05 Reject H0, Conclude Sample 1 < Sample 2 P‐Value < alpha (0.05)

TEQ AVIAN ND=1/2 MDL (SITE); 1/2 RL (BKGD)Sample 1 Data: SiteBirdNDhalfMDL
Sample 2 Data: BkgBirdNDhalfRL
Raw Statistics
Sample 1 Sample 2
Number of Valid Data 96 64
Number of Non‐Detects 0 2
Number of Detect Data 96 62
Minimum Non‐Detect N/A 1.39E‐06
Maximum Non‐Detect N/A 1.48E‐06
Percent Non‐detects 0.00% 3.13%
Minimum Detect 4.25E‐08 2.09E‐07
Maximum Detect 1.24E‐06 2.13E‐06
Mean of Detects 1.52E‐07 9.39E‐07
Median of Detects 7.36E‐08 7.53E‐07
SD of Detects 2.03E‐07 5.66E‐07
WMW test is meant for a Single Detection Limit Case
Use of Gehan or T‐W test is suggested when multiple detection limits are presentAll observations <= 1.4787E‐6 (Max DL) are ranked the same
Wilcoxon‐Mann‐Whitney (WMW) Test
H0: Mean/Median of Sample 1 >= Mean/Median of Sample 2All observations are identical in at least one groupNo analysis will be performed
Sample 1 vs Sample 2 Gehan Test
H0: Mean of Sample 1 >= Mean of background
Gehan z Test Value ‐9.456
Critical z (0.05) ‐1.645
P‐Value 1.59E‐21
Conclusion with Alpha = 0.05 Reject H0, Conclude Sample 1 < Sample 2 P‐Value < alpha (0.05)

TEQ MAMMAL ND=MDL (SITE); RL (BKGD)Sample 1 Data: SiteMammalNDMDL
Sample 2 Data: BkgMammalNDRL
Raw Statistics
Sample 1 Sample 2
Number of Valid Data 96 64
Number of Non‐Detects 0 2
Number of Detect Data 96 62
Minimum Non‐Detect N/A 2.05E‐06
Maximum Non‐Detect N/A 2.20E‐06
Percent Non‐detects 0.00% 3.13%
Minimum Detect 7.00E‐08 2.24E‐07
Maximum Detect 1.25E‐06 2.94E‐06
Mean of Detects 2.38E‐07 1.23E‐06
Median of Detects 1.37E‐07 1.08E‐06
SD of Detects 2.23E‐07 8.73E‐07
WMW test is meant for a Single Detection Limit Case
Use of Gehan or T‐W test is suggested when multiple detection limits are presentAll observations <= 2.1971E‐6 (Max DL) are ranked the same
Wilcoxon‐Mann‐Whitney (WMW) Test
H0: Mean/Median of Sample 1 >= Mean/Median of Sample 2All observations are identical in at least one groupNo analysis will be performed
Sample 1 vs Sample 2 Gehan Test
H0: Mean of Sample 1 >= Mean of background
Gehan z Test Value ‐8.677
Critical z (0.05) ‐1.645
P‐Value 2.03E‐18
Conclusion with Alpha = 0.05 Reject H0, Conclude Sample 1 < Sample 2 P‐Value < alpha (0.05)

TEQ AVIAN ND=MDL (SITE); RL (BKGD)Sample 1 Data: SiteBirdNDMDL
Sample 2 Data: BkgBirdNDRL
Raw Statistics
Sample 1 Sample 2
Number of Valid Data 96 64
Number of Non‐Detects 0 2
Number of Detect Data 96 62
Minimum Non‐Detect N/A 2.77E‐06
Maximum Non‐Detect N/A 2.96E‐06
Percent Non‐detects 0.00% 3.13%
Minimum Detect 8.43E‐08 2.89E‐07
Maximum Detect 1.25E‐06 3.50E‐06
Mean of Detects 2.01E‐07 1.64E‐06
Median of Detects 1.26E‐07 1.47E‐06
SD of Detects 1.99E‐07 1.13E‐06
WMW test is meant for a Single Detection Limit Case
Use of Gehan or T‐W test is suggested when multiple detection limits are presentAll observations <= 2.9573E‐6 (Max DL) are ranked the same
Wilcoxon‐Mann‐Whitney (WMW) Test
H0: Mean/Median of Sample 1 >= Mean/Median of Sample 2All observations are identical in at least one groupNo analysis will be performed
Sample 1 vs Sample 2 Gehan Test
H0: Mean of Sample 1 >= Mean of background
Gehan z Test Value ‐9.821
Critical z (0.05) ‐1.645
P‐Value 4.59E‐23
Conclusion with Alpha = 0.05 Reject H0, Conclude Sample 1 < Sample 2 P‐Value < alpha (0.05)

Wilcoxon‐Mann‐Whitney Sample 1 vs Sample 2 Comparison Test for Data Sets with Non‐Detects
User Selected OptionsFrom File ProUCL_IN_OU1_Sed.xls
Full Precision OFF
Confidence Coefficient 95%
Selected Null Hypothesis Sample 1 Mean/Median >= Sample 2 Mean/Median (Form 2)Alternative Hypothesis Sample 1 Mean/Median < Sample 2 Mean/Median
ARSENIC
Sample 1 Data: SiteAs
Sample 2 Data: BGAs
Raw Statistics
Sample 1 Sample 2
Number of Valid Data 6 20
Number of Non‐Detects 0 0
Number of Detect Data 6 20
Minimum Non‐Detect N/A N/A
Maximum Non‐Detect N/A N/A
Percent Non‐detects 0.00% 0.00%
Minimum Detect 2.7 1.2
Maximum Detect 13.4 21.43
Mean of Detects 6.983 12.32
Median of Detects 4.8 13.11
SD of Detects 4.588 5.799
Wilcoxon‐Mann‐Whitney (WMW) Test
H0: Mean/Median of Sample 1 >= Mean/Median of Sample 2
Sample 1 Rank Sum W‐Stat 49.5
WMW U‐Stat 28.5
Mean (U) 60
SD(U) ‐ Adj ties 16.43
WMW U‐Stat Critical Value (0.05) 33
Standardized WMW U‐Stat ‐1.948
Approximate P‐Value 0.0257
Conclusion with Alpha = 0.05 Reject H0, Conclude Sample 1 < Sample 2
OU1 SEDIMENT VERSUS BACKGROUND SEDIMENT
Appendix D_ProUCL Output_V2.xlsx

COPPER
Sample 1 Data: SiteCu
Sample 2 Data: BGCu
Raw Statistics
Sample 1 Sample 2
Number of Valid Data 6 20
Number of Non‐Detects 0 0
Number of Detect Data 6 20
Minimum Non‐Detect N/A N/A
Maximum Non‐Detect N/A N/A
Percent Non‐detects 0.00% 0.00%
Minimum Detect 14.4 6.6
Maximum Detect 118 234.3
Mean of Detects 45.53 137.9
Median of Detects 35.25 146.5
SD of Detects 37.34 69.49
Wilcoxon‐Mann‐Whitney (WMW) Test
H0: Mean/Median of Sample 1 >= Mean/Median of Sample 2
Sample 1 Rank Sum W‐Stat 38
WMW U‐Stat 17
Mean (U) 60
SD(U) ‐ Adj ties 16.43
WMW U‐Stat Critical Value (0.05) 33
Standardized WMW U‐Stat ‐2.647
Approximate P‐Value 0.00406
Conclusion with Alpha = 0.05 Reject H0, Conclude Sample 1 < Sample 2
Appendix D_ProUCL Output_V2.xlsx
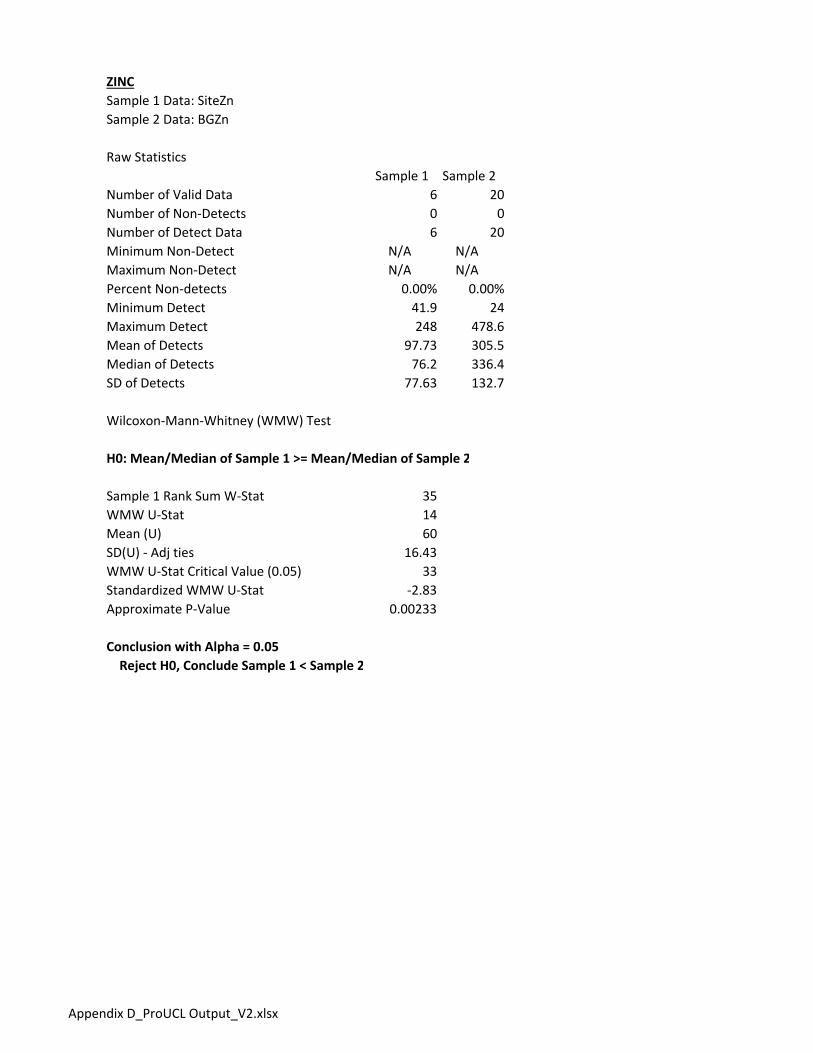
ZINC
Sample 1 Data: SiteZn
Sample 2 Data: BGZn
Raw Statistics
Sample 1 Sample 2
Number of Valid Data 6 20
Number of Non‐Detects 0 0
Number of Detect Data 6 20
Minimum Non‐Detect N/A N/A
Maximum Non‐Detect N/A N/A
Percent Non‐detects 0.00% 0.00%
Minimum Detect 41.9 24
Maximum Detect 248 478.6
Mean of Detects 97.73 305.5
Median of Detects 76.2 336.4
SD of Detects 77.63 132.7
Wilcoxon‐Mann‐Whitney (WMW) Test
H0: Mean/Median of Sample 1 >= Mean/Median of Sample 2
Sample 1 Rank Sum W‐Stat 35
WMW U‐Stat 14
Mean (U) 60
SD(U) ‐ Adj ties 16.43
WMW U‐Stat Critical Value (0.05) 33
Standardized WMW U‐Stat ‐2.83
Approximate P‐Value 0.00233
Conclusion with Alpha = 0.05 Reject H0, Conclude Sample 1 < Sample 2
Appendix D_ProUCL Output_V2.xlsx
---

TEQ MAMMAL ND=0Sample 1 Data: SiteMammalND0
Sample 2 Data: BkgMammalND0
Raw Statistics
Sample 1 Sample 2
Number of Valid Data 5 11
Number of Non‐Detects 0 0
Number of Detect Data 5 11
Minimum Non‐Detect N/A N/A
Maximum Non‐Detect N/A N/A
Percent Non‐detects 0.00% 0.00%
Minimum Detect 2.46E‐07 5.14E‐08
Maximum Detect 3.08E‐06 1.24E‐06
Mean of Detects 9.83E‐07 4.31E‐07
Median of Detects 5.11E‐07 3.00E‐07
SD of Detects 1.18E‐06 4.47E‐07
Wilcoxon‐Mann‐Whitney (WMW) Test
H0: Mean/Median of Sample 1 >= Mean/Median of Sample 2
Sample 1 Rank Sum W‐Stat 55
WMW U‐Stat 40
Mean (U) 27.5
SD(U) ‐ Adj ties 8.827
WMW U‐Stat Critical Value (0.05) 13
Standardized WMW U‐Stat 1.359
Approximate P‐Value 0.913
Conclusion with Alpha = 0.05 Do Not Reject H0, Conclude Sample 1 >= Sample 2
H0: Mean/Median of Sample 1 = Mean/Median of Sample 2
Sample 1 Rank Sum W‐Stat 55
WMW U‐Stat 40
Mean (U) 27.5
SD(U) ‐ Adj ties 8.827
Lower U‐Stat Critical Value (0.025) 10
Upper U‐Stat Critical Value (0.975) 45
Standardized WMW U‐Stat 1.359
Approximate P‐Value 0.174
Conclusion with Alpha = 0.05 Do Not Reject H0, Conclude Sample 1 = Sample 2
Appendix D_ProUCL Output_V2.xlsx

TEQ AVIAN ND=0Sample 1 Data: SiteBirdND0
Sample 2 Data: BkgBirdND0
Raw Statistics
Sample 1 Sample 2
Number of Valid Data 5 11
Number of Non‐Detects 0 0
Number of Detect Data 5 11
Minimum Non‐Detect N/A N/A
Maximum Non‐Detect N/A N/A
Percent Non‐detects 0.00% 0.00%
Minimum Detect 8.84E‐08 1.76E‐08
Maximum Detect 3.60E‐06 1.52E‐06
Mean of Detects 8.88E‐07 3.14E‐07
Median of Detects 2.85E‐07 7.21E‐08
SD of Detects 1.52E‐06 5.10E‐07
Wilcoxon‐Mann‐Whitney (WMW) Test
H0: Mean/Median of Sample 1 >= Mean/Median of Sample 2
Sample 1 Rank Sum W‐Stat 55
WMW U‐Stat 40
Mean (U) 27.5
SD(U) ‐ Adj ties 8.827
WMW U‐Stat Critical Value (0.05) 13
Standardized WMW U‐Stat 1.359
Approximate P‐Value 0.913
Conclusion with Alpha = 0.05 Do Not Reject H0, Conclude Sample 1 >= Sample 2
H0: Mean/Median of Sample 1 = Mean/Median of Sample 2
Sample 1 Rank Sum W‐Stat 55
WMW U‐Stat 40
Mean (U) 27.5
SD(U) ‐ Adj ties 8.827
Lower U‐Stat Critical Value (0.025) 10
Upper U‐Stat Critical Value (0.975) 45
Standardized WMW U‐Stat 1.359
Approximate P‐Value 0.174
Conclusion with Alpha = 0.05 Do Not Reject H0, Conclude Sample 1 = Sample 2
Appendix D_ProUCL Output_V2.xlsx

TEQ MAMMAL ND=1/2 MDL (SITE); 1/2 RL (BKGD)Sample 1 Data: SiteMammalNDhalfMDL
Sample 2 Data: BkgMammalNDhalfMDL
Raw Statistics
Sample 1 Sample 2
Number of Valid Data 5 11
Number of Non‐Detects 0 0
Number of Detect Data 5 11
Minimum Non‐Detect N/A N/A
Maximum Non‐Detect N/A N/A
Percent Non‐detects 0.00% 0.00%
Minimum Detect 2.75E‐07 8.35E‐08
Maximum Detect 3.09E‐06 1.26E‐06
Mean of Detects 1.01E‐06 4.62E‐07
Median of Detects 5.38E‐07 3.37E‐07
SD of Detects 1.17E‐06 4.41E‐07
Wilcoxon‐Mann‐Whitney (WMW) Test
H0: Mean/Median of Sample 1 >= Mean/Median of Sample 2
Sample 1 Rank Sum W‐Stat 55
WMW U‐Stat 40
Mean (U) 27.5
SD(U) ‐ Adj ties 8.827
WMW U‐Stat Critical Value (0.05) 13
Standardized WMW U‐Stat 1.359
Approximate P‐Value 0.913
Conclusion with Alpha = 0.05 Do Not Reject H0, Conclude Sample 1 >= Sample 2
H0: Mean/Median of Sample 1 = Mean/Median of Sample 2
Sample 1 Rank Sum W‐Stat 55
WMW U‐Stat 40
Mean (U) 27.5
SD(U) ‐ Adj ties 8.827
Lower U‐Stat Critical Value (0.025) 10
Upper U‐Stat Critical Value (0.975) 45
Standardized WMW U‐Stat 1.359
Approximate P‐Value 0.174
Conclusion with Alpha = 0.05 Do Not Reject H0, Conclude Sample 1 = Sample 2
Appendix D_ProUCL Output_V2.xlsx
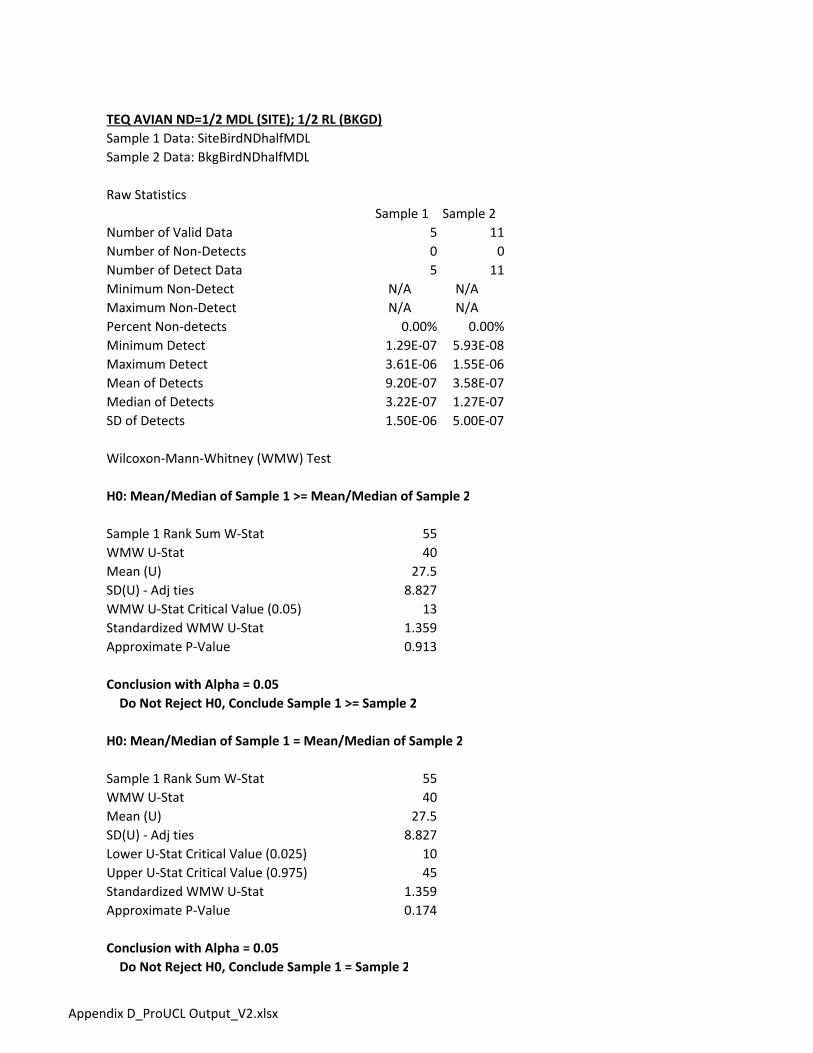
TEQ AVIAN ND=1/2 MDL (SITE); 1/2 RL (BKGD)Sample 1 Data: SiteBirdNDhalfMDL
Sample 2 Data: BkgBirdNDhalfMDL
Raw Statistics
Sample 1 Sample 2
Number of Valid Data 5 11
Number of Non‐Detects 0 0
Number of Detect Data 5 11
Minimum Non‐Detect N/A N/A
Maximum Non‐Detect N/A N/A
Percent Non‐detects 0.00% 0.00%
Minimum Detect 1.29E‐07 5.93E‐08
Maximum Detect 3.61E‐06 1.55E‐06
Mean of Detects 9.20E‐07 3.58E‐07
Median of Detects 3.22E‐07 1.27E‐07
SD of Detects 1.50E‐06 5.00E‐07
Wilcoxon‐Mann‐Whitney (WMW) Test
H0: Mean/Median of Sample 1 >= Mean/Median of Sample 2
Sample 1 Rank Sum W‐Stat 55
WMW U‐Stat 40
Mean (U) 27.5
SD(U) ‐ Adj ties 8.827
WMW U‐Stat Critical Value (0.05) 13
Standardized WMW U‐Stat 1.359
Approximate P‐Value 0.913
Conclusion with Alpha = 0.05 Do Not Reject H0, Conclude Sample 1 >= Sample 2
H0: Mean/Median of Sample 1 = Mean/Median of Sample 2
Sample 1 Rank Sum W‐Stat 55
WMW U‐Stat 40
Mean (U) 27.5
SD(U) ‐ Adj ties 8.827
Lower U‐Stat Critical Value (0.025) 10
Upper U‐Stat Critical Value (0.975) 45
Standardized WMW U‐Stat 1.359
Approximate P‐Value 0.174
Conclusion with Alpha = 0.05 Do Not Reject H0, Conclude Sample 1 = Sample 2
Appendix D_ProUCL Output_V2.xlsx

TEQ MAMMAL ND=MDL (SITE); RL (BKGD)Sample 1 Data: SiteMammalNDMDL
Sample 2 Data: BkgMammalNDMDL
Raw Statistics
Sample 1 Sample 2
Number of Valid Data 5 11
Number of Non‐Detects 0 0
Number of Detect Data 5 11
Minimum Non‐Detect N/A N/A
Maximum Non‐Detect N/A N/A
Percent Non‐detects 0.00% 0.00%
Minimum Detect 3.04E‐07 1.16E‐07
Maximum Detect 3.09E‐06 1.28E‐06
Mean of Detects 1.03E‐06 4.93E‐07
Median of Detects 5.64E‐07 3.73E‐07
SD of Detects 1.16E‐06 4.34E‐07
Wilcoxon‐Mann‐Whitney (WMW) Test
H0: Mean/Median of Sample 1 >= Mean/Median of Sample 2
Sample 1 Rank Sum W‐Stat 54
WMW U‐Stat 39
Mean (U) 27.5
SD(U) ‐ Adj ties 8.827
WMW U‐Stat Critical Value (0.05) 13
Standardized WMW U‐Stat 1.246
Approximate P‐Value 0.894
Conclusion with Alpha = 0.05 Do Not Reject H0, Conclude Sample 1 >= Sample 2
H0: Mean/Median of Sample 1 = Mean/Median of Sample 2
Sample 1 Rank Sum W‐Stat 54
WMW U‐Stat 39
Mean (U) 27.5
SD(U) ‐ Adj ties 8.827
Lower U‐Stat Critical Value (0.025) 10
Upper U‐Stat Critical Value (0.975) 45
Standardized WMW U‐Stat 1.246
Approximate P‐Value 0.213
Conclusion with Alpha = 0.05 Do Not Reject H0, Conclude Sample 1 = Sample 2
Appendix D_ProUCL Output_V2.xlsx

TEQ AVIAN ND=MDL (SITE); RL (BKGD)Sample 1 Data: SiteBirdNDMDL
Sample 2 Data: BkgBirdNDMDL
Raw Statistics
Sample 1 Sample 2
Number of Valid Data 5 11
Number of Non‐Detects 0 0
Number of Detect Data 5 11
Minimum Non‐Detect N/A N/A
Maximum Non‐Detect N/A N/A
Percent Non‐detects 0.00% 0.00%
Minimum Detect 1.69E‐07 1.01E‐07
Maximum Detect 3.61E‐06 1.57E‐06
Mean of Detects 9.52E‐07 4.02E‐07
Median of Detects 3.58E‐07 1.82E‐07
SD of Detects 1.49E‐06 4.90E‐07
Wilcoxon‐Mann‐Whitney (WMW) Test
H0: Mean/Median of Sample 1 >= Mean/Median of Sample 2
Sample 1 Rank Sum W‐Stat 54
WMW U‐Stat 39
Mean (U) 27.5
SD(U) ‐ Adj ties 8.827
WMW U‐Stat Critical Value (0.05) 13
Standardized WMW U‐Stat 1.246
Approximate P‐Value 0.894
Conclusion with Alpha = 0.05 Do Not Reject H0, Conclude Sample 1 >= Sample 2
H0: Mean/Median of Sample 1 = Mean/Median of Sample 2
Sample 1 Rank Sum W‐Stat 54
WMW U‐Stat 39
Mean (U) 27.5
SD(U) ‐ Adj ties 8.827
Lower U‐Stat Critical Value (0.025) 10
Upper U‐Stat Critical Value (0.975) 45
Standardized WMW U‐Stat 1.246
Approximate P‐Value 0.213
Conclusion with Alpha = 0.05 Do Not Reject H0, Conclude Sample 1 = Sample 2
Appendix D_ProUCL Output_V2.xlsx

SiteCu D_SiteCu SiteSe D_SiteSe
9.1 1 0.57 1
12 1 0.63 1
9.8 1 0.58 1
21.4 1 0.28 0
18.3 1 1.2 1
22.1 1 1.8 1
17.3 1 1.1 1
18.7 1 1.2 1
22.7 1 1.7 1
19 1 1.4 1
16.3 1 1.1 1
16.2 1 0.96 1
8.5 1 0.47 1
4.1 1 0.27 1
18.6 1 0.76 1
33.9 1 1.1 1
13.2 1 0.3 0
28.7 1 0.94 1
24.7 1
23.4 1
23.5 1
26.3 1
24.9 1
20 1
20.7 1
20.7 1
7.9 1
20.8 1
17.8 1
16.6 1
17.2 1
13.9 1
24.4 1
25.2 1
22.9 1
24.1 1
26 1
7.2 1
25.2 1
25.4 1
26.8 1
24.5 1
23.3 1
24.4 1
18.2 1
25.7 1
27.7 1
26.6 1
14.8 1
25.6 1
23.2 1
24.6 1
13 1
14 1
30.3 1
28.4 1
26.6 1
27 1
24 1
15.8 1
24.2 1
26.3 1
24.6 1
27.3 1
28.9 1
18.7 1
21 1
20.3 1
17 1
11.4 1
15.2 1
15.7 1
11.1 1
11.7 1
15.1 1
11.4 1
12.9 1
13.9 1
0.36 0
13.3 1
8.3 1
15.2 1
9.6 1
9.8 1
13.3 1
17.4 1
27.6 1
27.9 1
28.7 1
0.33 0
12.4 1
10.4 1
9.1 1
12.6 1
2.8 1
15.4 1
ProUCL Input for Copper and Selenium
Appendix D_ProUCL Output_V2.xlsx

UCL Statistics for Data Sets with Non‐Detects
User Selected Options
From File ProUCL_IN_OU1 Soil_v2.xls
Full Precision OFF
Confidence Coefficient 95%
Number of Bootstrap Operations 2000
COPPER
General Statistics
Total Number of Observations 96 Number of Distinct Observations 82
Number of Detects 94 Number of Non‐Detects 2
Number of Distinct Detects 80 Number of Distinct Non‐Detects 2
Minimum Detect 2.8 Minimum Non‐Detect 0.33
Maximum Detect 33.9 Maximum Non‐Detect 0.36
Variance Detects 46.25 Percent Non‐Detects 2.08%
Mean Detects 19.08 SD Detects 6.801
Median Detects 18.85 CV Detects 0.356
Skewness Detects ‐0.212 Kurtosis Detects ‐0.845
Mean of Logged Detects 2.867 SD of Logged Detects 0.443
Normal GOF Test on Detects Only
Shapiro Wilk Test Statistic 0.959 Normal GOF Test on Detected Observations Only
5% Shapiro Wilk P Value 0.0238 Detected Data Not Normal at 5% Significance Level
Lilliefors Test Statistic 0.111 Lilliefors GOF Test
5% Lilliefors Critical Value 0.0914 Detected Data Not Normal at 5% Significance Level
Detected Data Not Normal at 5% Significance Level
Kaplan‐Meier (KM) Statistics using Normal Critical Values and other Nonparametric UCLs
Mean 18.69 Standard Error of Mean 0.74
SD 7.209 95% KM (BCA) UCL 19.86
95% KM (t) UCL 19.92 95% KM (Percentile Bootstrap) UCL 19.84
95% KM (z) UCL 19.91 95% KM Bootstrap t UCL 19.92
90% KM Chebyshev UCL 20.91 95% KM Chebyshev UCL 21.92
97.5% KM Chebyshev UCL 23.31 99% KM Chebyshev UCL 26.05
Gamma GOF Tests on Detected Observations Only
A‐D Test Statistic 1.617 Anderson‐Darling GOF Test
5% A‐D Critical Value 0.754 Detected Data Not Gamma Distributed at 5% Significance Level
K‐S Test Statistic 0.123 Kolmogrov‐Smirnoff GOF
5% K‐S Critical Value 0.0924 Detected Data Not Gamma Distributed at 5% Significance Level
Detected Data Not Gamma Distributed at 5% Significance Level
Gamma Statistics on Detected Data Only
k hat (MLE) 6.307 k star (bias corrected MLE) 6.113
Theta hat (MLE) 3.025 Theta star (bias corrected MLE) 3.122
nu hat (MLE) 1186 nu star (bias corrected) 1149
MLE Mean (bias corrected) 19.08 MLE Sd (bias corrected) 7.718
Gamma Kaplan‐Meier (KM) Statistics
k hat (KM) 6.722 nu hat (KM) 1291
Approximate Chi Square Value (N/A, α) 1208 Adjusted Chi Square Value (N/A, β) 1207
95% Gamma Approximate KM‐UCL (use when n>=50) 19.97 95% Gamma Adjusted KM‐UCL (use when n<50) 19.99
Gamma ROS Statistics using Imputed Non‐Detects
GROS may not be used when data set has > 50% NDs with many tied observations at multiple DLs
GROS may not be used when kstar of detected data is small such as < 0.1
For such situations, GROS method tends to yield inflated values of UCLs and BTVs
For gamma distributed detected data, BTVs and UCLs may be computed using gamma distribution on KM estimates
Minimum 2.8 Mean 18.83
Maximum 33.9 Median 18.7
SD 6.953 CV 0.369
k hat (MLE) 5.874 k star (bias corrected MLE) 5.697
Theta hat (MLE) 3.205 Theta star (bias corrected MLE) 3.305
nu hat (MLE) 1128 nu star (bias corrected) 1094
MLE Mean (bias corrected) 18.83 MLE Sd (bias corrected) 7.888
Adjusted Level of Significance (β) 0.0475
Approximate Chi Square Value (N/A, α) 1018 Adjusted Chi Square Value (N/A, β) 1017
95% Gamma Approximate UCL (use when n>=50) 20.23 95% Gamma Adjusted UCL (use when n<50) 20.25
Lognormal GOF Test on Detected Observations Only
Lilliefors Test Statistic 0.122 Lilliefors GOF Test
5% Lilliefors Critical Value 0.0914 Detected Data Not Lognormal at 5% Significance Level
Detected Data Not Lognormal at 5% Significance Level
Lognormal ROS Statistics Using Imputed Non‐Detects
Mean in Original Scale 18.81 Mean in Log Scale 2.845
SD in Original Scale 6.981 SD in Log Scale 0.464
95% t UCL (assumes normality of ROS data) 20 95% Percentile Bootstrap UCL 19.94
95% BCA Bootstrap UCL 19.94 95% Bootstrap t UCL 19.95
95% H‐UCL (Log ROS) 20.91
DL/2 Statistics
DL/2 Normal DL/2 Log‐Transformed
Mean in Original Scale 18.69 Mean in Log Scale 2.771
SD in Original Scale 7.256 SD in Log Scale 0.796
95% t UCL (Assumes normality) 19.92 95% H‐Stat UCL 25.96
DL/2 is not a recommended method, provided for comparisons and historical reasons
Nonparametric Distribution Free UCL Statistics
Data do not follow a Discernible Distribution at 5% Significance Level
Suggested UCL to Use95% KM (BCA) UCL 19.86
Note: Suggestions regarding the selection of a 95% UCL are provided to help the user to select the most appropriate 95% UCL.
Recommendations are based upon data size, data distribution, and skewness.
These recommendations are based upon the results of the simulation studies summarized in Singh, Maichle, and Lee (2006).
However, simulations results will not cover all Real World data sets; for additional insight the user may want to consult a statistician.
ProUCL Output for Copper and Selenium in OU1 Soil
Appendix D_ProUCL Output_V2.xlsx
--

SELENIUM
General Statistics
Total Number of Observations 18 Number of Distinct Observations 15
Number of Detects 16 Number of Non‐Detects 2
Number of Distinct Detects 13 Number of Distinct Non‐Detects 2
Minimum Detect 0.27 Minimum Non‐Detect 0.28
Maximum Detect 1.8 Maximum Non‐Detect 0.3
Variance Detects 0.185 Percent Non‐Detects 11.11%
Mean Detects 0.986 SD Detects 0.43
Median Detects 1.03 CV Detects 0.436
Skewness Detects 0.284 Kurtosis Detects ‐0.376
Mean of Logged Detects ‐0.119 SD of Logged Detects 0.503
Normal GOF Test on Detects Only
Shapiro Wilk Test Statistic 0.966 Shapiro Wilk GOF Test
5% Shapiro Wilk Critical Value 0.887 Detected Data appear Normal at 5% Significance Level
Lilliefors Test Statistic 0.122 Lilliefors GOF Test
5% Lilliefors Critical Value 0.222 Detected Data appear Normal at 5% Significance Level
Detected Data appear Normal at 5% Significance Level
Kaplan‐Meier (KM) Statistics using Normal Critical Values and other Nonparametric UCLs
Mean 0.907 Standard Error of Mean 0.11
SD 0.452 95% KM (BCA) UCL 1.103
95% KM (t) UCL 1.098 95% KM (Percentile Bootstrap) UCL 1.084
95% KM (z) UCL 1.088 95% KM Bootstrap t UCL 1.101
90% KM Chebyshev UCL 1.237 95% KM Chebyshev UCL 1.387
97.5% KM Chebyshev UCL 1.594 99% KM Chebyshev UCL 2.002
Gamma GOF Tests on Detected Observations Only
A‐D Test Statistic 0.285 Anderson‐Darling GOF Test
5% A‐D Critical Value 0.741 Detected data appear Gamma Distributed at 5% Significance Level
K‐S Test Statistic 0.154 Kolmogrov‐Smirnoff GOF
5% K‐S Critical Value 0.216 Detected data appear Gamma Distributed at 5% Significance Level
Detected data appear Gamma Distributed at 5% Significance Level
Gamma Statistics on Detected Data Only
k hat (MLE) 4.913 k star (bias corrected MLE) 4.033
Theta hat (MLE) 0.201 Theta star (bias corrected MLE) 0.245
nu hat (MLE) 157.2 nu star (bias corrected) 129.1
MLE Mean (bias corrected) 0.986 MLE Sd (bias corrected) 0.491
Gamma Kaplan‐Meier (KM) Statistics
k hat (KM) 4.017 nu hat (KM) 144.6
Approximate Chi Square Value (144.60, α) 117.8 Adjusted Chi Square Value (144.60, β) 115.5
95% Gamma Approximate KM‐UCL (use when n>=50) 1.113 95% Gamma Adjusted KM‐UCL (use when n<50) 1.135
Gamma ROS Statistics using Imputed Non‐Detects
GROS may not be used when data set has > 50% NDs with many tied observations at multiple DLs
GROS may not be used when kstar of detected data is small such as < 0.1
For such situations, GROS method tends to yield inflated values of UCLs and BTVs
For gamma distributed detected data, BTVs and UCLs may be computed using gamma distribution on KM estimates
Minimum 0.27 Mean 0.911
Maximum 1.8 Median 0.95
SD 0.46 CV 0.505
k hat (MLE) 3.634 k star (bias corrected MLE) 3.065
Theta hat (MLE) 0.251 Theta star (bias corrected MLE) 0.297
nu hat (MLE) 130.8 nu star (bias corrected) 110.3
MLE Mean (bias corrected) 0.911 MLE Sd (bias corrected) 0.52
Adjusted Level of Significance (β) 0.0357
Approximate Chi Square Value (110.35, α) 87.1 Adjusted Chi Square Value (110.35, β) 85.12
95% Gamma Approximate UCL (use when n>=50) 1.154 95% Gamma Adjusted UCL (use when n<50) 1.181
Lognormal GOF Test on Detected Observations Only
Shapiro Wilk Test Statistic 0.942 Shapiro Wilk GOF Test
5% Shapiro Wilk Critical Value 0.887 Detected Data appear Lognormal at 5% Significance Level
Lilliefors Test Statistic 0.17 Lilliefors GOF Test
5% Lilliefors Critical Value 0.222 Detected Data appear Lognormal at 5% Significance Level
Detected Data appear Lognormal at 5% Significance Level
Lognormal ROS Statistics Using Imputed Non‐Detects
Mean in Original Scale 0.915 Mean in Log Scale ‐0.225
SD in Original Scale 0.454 SD in Log Scale 0.564
95% t UCL (assumes normality of ROS data) 1.101 95% Percentile Bootstrap UCL 1.094
95% BCA Bootstrap UCL 1.08 95% Bootstrap t UCL 1.113
95% H‐UCL (Log ROS) 1.246
UCLs using Lognormal Distribution and KM Estimates when Detected data are Lognormally Distributed
KM Mean (logged) ‐0.251 95% H‐UCL (KM ‐Log) 1.256
KM SD (logged) 0.592 95% Critical H Value (KM‐Log) 2.116
KM Standard Error of Mean (logged) 0.144
DL/2 Statistics
DL/2 Normal DL/2 Log‐Transformed
Mean in Original Scale 0.893 Mean in Log Scale ‐0.32
SD in Original Scale 0.487 SD in Log Scale 0.753
95% t UCL (Assumes normality) 1.092 95% H‐Stat UCL 1.468
DL/2 is not a recommended method, provided for comparisons and historical reasons
Nonparametric Distribution Free UCL Statistics
Detected Data appear Normal Distributed at 5% Significance Level
Suggested UCL to Use95% KM (t) UCL 1.098 95% KM (Percentile Bootstrap) UCL 1.084
Note: Suggestions regarding the selection of a 95% UCL are provided to help the user to select the most appropriate 95% UCL.
Recommendations are based upon data size, data distribution, and skewness.
These recommendations are based upon the results of the simulation studies summarized in Singh, Maichle, and Lee (2006).
However, simulations results will not cover all Real World data sets; for additional insight the user may want to consult a statistician.
Appendix D_ProUCL Output_V2.xlsx
---