Final Design Review of Light Measurement System
15
The Optical Revolver: Final Design Review Team Orange Griffin Beemiller Mate 340.360 Dr. Savage & Dr. London 12/3/10
-
Upload
griffin-beemiller -
Category
Documents
-
view
225 -
download
0
Transcript of Final Design Review of Light Measurement System
8/3/2019 Final Design Review of Light Measurement System
http://slidepdf.com/reader/full/final-design-review-of-light-measurement-system 1/15
The Optical Revolver: Final Design Review
Team Orange
Griffin Beemiller
Mate 340.360
Dr. Savage & Dr. London
12/3/10
8/3/2019 Final Design Review of Light Measurement System
http://slidepdf.com/reader/full/final-design-review-of-light-measurement-system 2/15
1
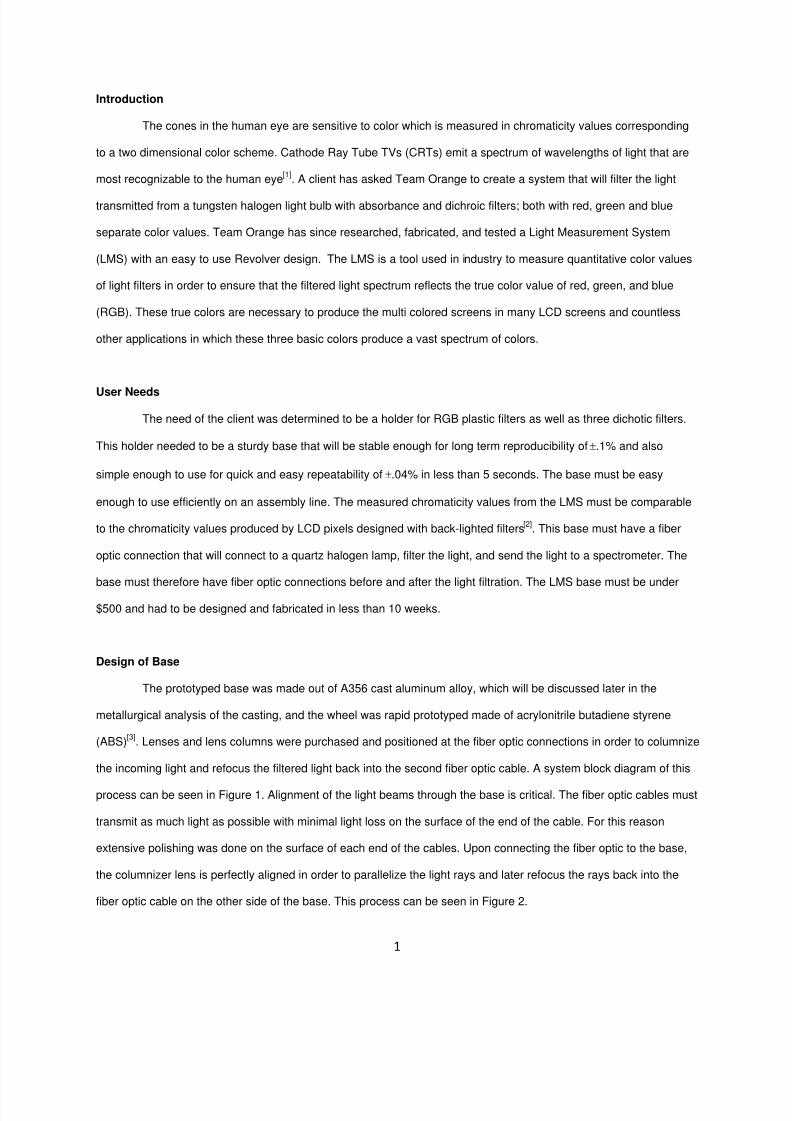
Introduction
The cones in the human eye are sensitive to color which is measured in chromaticity values corresponding
to a two dimensional color scheme. Cathode Ray Tube TVs (CRTs) emit a spectrum of wavelengths of light that are
most recognizable to the human eye[1]
. A client has asked Team Orange to create a system that will filter the light
transmitted from a tungsten halogen light bulb with absorbance and dichroic filters; both with red, green and blue
separate color values. Team Orange has since researched, fabricated, and tested a Light Measurement System
(LMS) with an easy to use Revolver design. The LMS is a tool used in industry to measure quantitative color values
of light filters in order to ensure that the filtered light spectrum reflects the true color value of red, green, and blue
(RGB). These true colors are necessary to produce the multi colored screens in many LCD screens and countless
other applications in which these three basic colors produce a vast spectrum of colors.
User Needs
The need of the client was determined to be a holder for RGB plastic filters as well as three dichotic filters.
This holder needed to be a sturdy base that will be stable enough for long term reproducibility of.1% and also
simple enough to use for quick and easy repeatability of.04% in less than 5 seconds. The base must be easy
enough to use efficiently on an assembly line. The measured chromaticity values from the LMS must be comparable
to the chromaticity values produced by LCD pixels designed with back-lighted filters[2]
. This base must have a fiber
optic connection that will connect to a quartz halogen lamp, filter the light, and send the light to a spectrometer. The
base must therefore have fiber optic connections before and after the light filtration. The LMS base must be under
$500 and had to be designed and fabricated in less than 10 weeks.
Design of Base
The prototyped base was made out of A356 cast aluminum alloy, which will be discussed later in the
metallurgical analysis of the casting, and the wheel was rapid prototyped made of acrylonitrile butadiene styrene
(ABS)[3]
. Lenses and lens columns were purchased and positioned at the fiber optic connections in order to columnize
the incoming light and refocus the filtered light back into the second fiber optic cable. A system block diagram of this
process can be seen in Figure 1. Alignment of the light beams through the base is critical. The fiber optic cables must
transmit as much light as possible with minimal light loss on the surface of the end of the cable. For this reason
extensive polishing was done on the surface of each end of the cables. Upon connecting the fiber optic to the base,
the columnizer lens is perfectly aligned in order to parallelize the light rays and later refocus the rays back into the
fiber optic cable on the other side of the base. This process can be seen in Figure 2.
8/3/2019 Final Design Review of Light Measurement System
http://slidepdf.com/reader/full/final-design-review-of-light-measurement-system 3/15
2
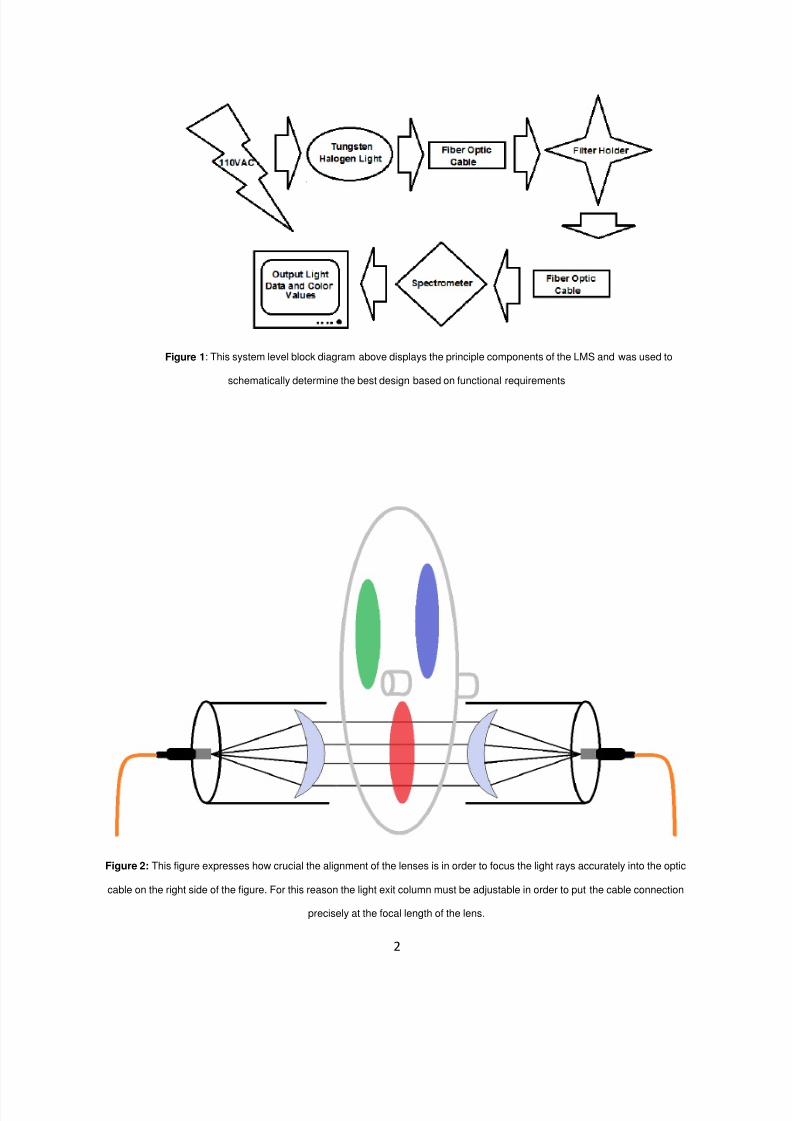
Figure 1: This system level block diagram above displays the principle components of the LMS and was used to
schematically determine the best design based on functional requirements
Figure 2: This figure expresses how crucial the alignment of the lenses is in order to focus the light rays accurately into the optic
cable on the right side of the figure. For this reason the light exit column must be adjustable in order to put the cable connection
precisely at the focal length of the lens.

8/3/2019 Final Design Review of Light Measurement System
http://slidepdf.com/reader/full/final-design-review-of-light-measurement-system 4/15
3
Our decision came down to choosing between two simple bases. One design shown in Figure 3 is the Drop-
In design where different the different filters would be simply dropped in through the top of the base. The slot would
be just big enough for the holder with a tolerance of 0.1 under the assumption that any extra space would run the risk
of light loss. Our other design shown in Figure 4 involves a rotating wheel that holds the three plastic filters so that the
change in color filtration can be done simply and easily. The original design involved the wheel spinning freely with 3
notches on the edge of the wheel to catch a small piece of spring steel and hold it in place. Upon fabrication of the
components it was realized that the friction between the A356 base and the ABS wheel is high enough for the wheel
to be stuck in place without spin. This friction fit increases stability of the design allowing for minimal movement when
obtaining color values.
(Hand drawn sketch)
Figure 3: The sketch above shows the top view of the basic
design for the Drop-In Filter Holder. They cylindrical filter
holder would be simply dropped into place from the top of
the base.
(Hand drawn sketch)
Figure 4: The sketch above shows the top view of the
Revolver Filter Holder. This design requires only the spin of
a wheel to change to a different colored filter, and the
replacement of the wheel to filter with dichroic filters.

8/3/2019 Final Design Review of Light Measurement System
http://slidepdf.com/reader/full/final-design-review-of-light-measurement-system 5/15
4
Design Solution – Choosing Revolver
Given the functional requirements of the LMS and the components of the system, the decision
matrix between the two designs was determined using weighting factors[4]
for each attribute which can be
seen in Table I. The table shows the different attributes considered in the design of the LMS base and
their respective weighting factors and the collaborative score that each design received from Team
Orange. The respective values were added up and totaled at the bottom of the table. Note that the Drop-
In Design won by a value of only 0.4
A sensitivity analysis was conducted by changing the weighting factors yet the Drop-In base still
won indicating insensitive results. Although the drop in design scored higher in the decision matrix, the
decision was made to fabricate the revolver design for the following reasons.
1. Team Orange would become more familiar with the ABS rapid prototyper
2. The revolver better meets the loading and measuring time requirements
3. The design is more user friendly and ergonomic
4. Reduces possible operator errors that may occur
5. Reduces the chance of damaging the lens from mishandling
The revolver design solution meets and exceeds the expectations of the client in that the light
sources gets filtered with any of the six filters with a high ease of use. The revolving filter mechanism
allows only fractions of a second to change the filter color between single chromatic filters and less than
30 seconds to switch in the dichroic filter wheel. A disadvantage of the revolver is that it requires more
ABS parts which cost more money, but it was later realized that the ABS parts were not of too high cost.
Table I: Conceptual Design Decision Matrix
Drop-In LMS Revolver LMS
Attribute/Criteria Measureable Objectives Score Weight Value Score Weight Value
Operation No light loss; maintain calibration; easy loading 8.7 0.15 1.31 9.2 0.15 1.38
Stability Rpt. .4; Repro. ±0.1 against RGB filters 9 0.3 2.7 8.7 0.3 2.61
Ergonomics Compact as Possible 8.2 0.05 0.41 9.3 0.05 0.47
Safety Shielded power supply; non toxic materials 10 0.05 0.5 9.7 0.05 0.49
Manufacturability Prototypability; must be cast 9.5 0.1 0.95 8.3 0.1 0.83
Cost $500 9 0.15 1.35 7.7 0.15 1.16
Schedule 10 weeks 9.8 0.2 1.96 9.3 0.2 1.86
9.2 8.8

8/3/2019 Final Design Review of Light Measurement System
http://slidepdf.com/reader/full/final-design-review-of-light-measurement-system 6/15
5
Problems and Solutions
The original design concept involved one wheel, and the removal of the three plastic filters and
their holders to place the dichroic filters holders in the wheel with a friction fit. When a problem arose with
a CAD dimensioning mistake for the rapid prototyped wheel, the decision was made to friction fit the
filters in the wheel without the filter holders, shown in Figure 5, (saving us money at $17 dollars each
filter) and make another ABS wheel with larger diameter holes to hold the diachronic filter holders. What
was at first design problem turned out to lower our overall cost of the prototype and make our device
more user friendly by having two separate wheels for plastic and for dichroic filters.
Another problem that was determined was crucial alignment of the lens columns. This problem
was solved with 5 set screws for one column with low stability, and 2 for the other, slightly more stable
column. The set screws worked perfectly with low cost and high effectiveness. The final design can be
seen in Figure 6 A and B and the drawings for these parts can be seen at the end of the report.
Figure 5: The picture on the left shows the single wavelength filter
wheel and the red green and blue plastic filters that are placed in the wheel
flush with the flat surface with a friction fit. The revolver is made of ABS
(acrylonitrile butadiene styrene) and will be placed in the aluminum base and
held in place by its cylindrical spokes. The second ABS wheel for the
dichroic filters will have larger diameter holes for the dichroic lens holders.

8/3/2019 Final Design Review of Light Measurement System
http://slidepdf.com/reader/full/final-design-review-of-light-measurement-system 7/15
6
Figure 6A: This computer generated picture depics the
LMS base in an exploded view. Positioning of the filter
holder and lens columns are evident in this picture
Figure 6B: This picture shows a view of the completed LMS
base. A set screw can be seen on top of the base holding
one of the lens columns in position.
Detailed Design Specs
- Light Source
o Spectrum: 360 to 1100 nm
Visual spectrum: 380-680 nm
o SMA 905 fiber optic connector
o 1 mW/cm2
@ 550 nm
- Filter Holder
o Utilize ThorLabs SM05 holders
o Hold 0.5’’ (12 mm diameter) lens
Edmund Optics NT43-936/930/942
ThorLabs FD1A
o 4 x 4 x 4 max. dimensions

8/3/2019 Final Design Review of Light Measurement System
http://slidepdf.com/reader/full/final-design-review-of-light-measurement-system 8/15
7
- Wavelength Sorting/Light Detection
o CCD imaging detector 100 photons/count @ 550 nm
o 600 g/mm grating
o 350-1000 nm spectral range
o 25 µm entrance slit
o Resolution: 1.5 nm FWHM
- Spectral Analysis
o Utilize SpectraSuite
Plots “Counts vs. Wavelength” & “% Transmission vs. Wavelength”
Integration time of 4 ms
Export data to Excel Spreadsheet
Testing Prototype
The standard operating procedures of Team Orange’s LMS require the system to be assembled
carefully following the SOPs. Once the system is set up properly, it’s then calibrated with 100%
transmission and with 0% transmission[5]
. The color values of each filter were then obtained with a
software program called SpectraSuite used with a calibrated spectrometer. When collecting data, Team
Orange took five measurements over a period of one hour to obtain specs on the LMS’s repeatability as
well as five measurements per day over a period of 5 days to test the reproducibility of the system.
Results and Color Analysis
The results of the testing of the repeatability and reproducibility of the system were used in a one
sample t test comparing our measured color values against the standard[6]
CRT phosphors values. These
values failed the test indicating that the colors of the absorbance filters did not match those of the CRT
phosphors. Although the dichroic color values obtained did match those of the 2009 dichroic values, all
but one of Team Orange’s dichroic chromaticity values did not match the dichroic standard values. Table
II shows the standard deviation of the absorbance filter’s chromaticity values against their standard color
values. The table shows an extremely low standard deviation for both Team Orange’s repeatability and
reproducibility. This data depicts the good precision of Team Orange’s system, though the accuracy of

8/3/2019 Final Design Review of Light Measurement System
http://slidepdf.com/reader/full/final-design-review-of-light-measurement-system 9/15
8
the system is not as good as desired. This lack of accuracy can be attributed to one of many things
including calibration of the filter and spectrometer.
Table II: Standard Deviation of Measured Chromaticity Values
Repeatability
(1 Hr) Std
Dev
Reproducability
(5 day) Std Dev
Blue Avg 0.0016167 0.00145
Green Avg 0.001235 0.0017
Red Avg 0.0055 0.0034
Total Avg 0.00275 0.00215
Client requirement <.04 <.1
Project Plan and Cost Analysis
The tasks that have been completed can be seen in Table III. This table depicts the total number
of man hours that were required to complete each task. These hours are totaled at the bottom to 93
hours. These hours equate to $9,300 of labor required to complete the LMS. The tasks have approximate
start and finish dates and dependencies on other tasks. A Gantt chart of the tasks can be seen in Figure
7. As you can see from the chart, the production of the LMS was effectively completed in less than 10
weeks. The bill of materials can be seen in Table IV and it should be noted that Team Orange remained
well under the $500 budget
Table III: Total Man Hours for Completion
Task Description Man Hours Name Dependency
1 Finish all models in SolidWorks 7 Ian
2 Updated parts list 2 Charlie
3 Purchase parts 1 Charlie
4 RPT mold 1 Griffin FS 1
5 Pour metal into mold 6 All FS 4
6 Heat Treating 9 W,C,I FS 5
7 Check specifications on Al base 1 Will FS 5
8 ABS wheel 1 Griffin FS 1
9 Make fiber optic cables 12 M,W,C,J FS 3
10 Assemble system 18 All FS 6, 7, 8, 9
11 Testing 35 All FS 10
Total Man Hours 93

8/3/2019 Final Design Review of Light Measurement System
http://slidepdf.com/reader/full/final-design-review-of-light-measurement-system 10/15
9
Figure 7: The Gantt Chart above depicts relative time for each task to be completed in days. Note that all tasks are complete within
the 10 week period
Table IV: Bill of Materials: Parts List
Part Price ($) Quantity Total ($)
ABS Rapid Prototyping 10 1.52 15.2
Al 356, Casting Alloy 4.1 0.635 2.6035
Zcast 501 Powder/Binder 0.15 968.8 145.32
Multimode AMP 905 Connector 9.95 4 39.8
Polishing Pads 1 1 1
Epoxy for Fiber Optic Connections 3.75 2 7.5
SMA Bulkhead Adapter 15 0 0
3 cc Epoxy Syringe 1.25 2 2.5
UV/VISmulti-mode optical fiber 7 2 14
Furcation tubing (orange) 1.5 2 3
Lenses (BK7) Plano-convex 22.5 2 45
SMA-ST Fiber Optic Cable 165 0 0
Lens Holder, .5" 15.3 2 30.6
Adjustable Lens Holder, ,5" 28.6 0 0
Retaining Ring, .5" 5.1 4 20.4
ST to SMO5 Adaptor 24 2 48
1" Filter Holder 12.16 0 0
Retaining Ring, 1" 5.3 0 0
$374.9235
13-Sep 23-Sep 3-Oct 13-Oct 23-Oct 2-Nov 12-Nov 22-Nov 2-Dec
Finish all models in SolidWorksUpdated parts list
Purchase partsRPT mold
Pour metal into moldHeat Treating
Check specifications on Al baseABS wheel
Make fiber optic cablesAssemble system
Testing

8/3/2019 Final Design Review of Light Measurement System
http://slidepdf.com/reader/full/final-design-review-of-light-measurement-system 11/15

8/3/2019 Final Design Review of Light Measurement System
http://slidepdf.com/reader/full/final-design-review-of-light-measurement-system 12/15
11
Eutectic
Comp.
Pro-
eutectic
(Al)
Eute
Si ph
Eut
Proeute
(Al)
the risers of our casting should have had a larger diameter to prevent quick solidification in the
risers. This resulted in the bottom of our casting, but the top of our LMS base, to have some
shrinkage. Luckily this shrinkage played no part in the mechanical performance of our LMS
base. The as cast microstructure of one riser can be seen in Figure 8 A and B at a magnification
of 100x and 500x respectively.
Figure 8A: The 50 micron bar seen in the bottom
right of this unetched microstructure expresses the
low magnification of the picture. In this as cast
microstructure, the proeutectic (Al) phase can be
seen in the lighter areas, where the darker areas are
made up of eutectic composition of (Al) and an
unidentified Si phase.[8]
Figure 8B: In this higher magnification unetched
microstructure the proeutectic (Al) phase is much
more evident. The darker regions are a combination
of two eutectic phases. These eutectic phases do not
follow a lamellar structure since the casting was not
equilibrium cooled.[8]
Heat treatment (T6)
The aluminum base underwent a T6 heat treatment in which the aluminum alloy was
solutionized at a temperature of 540°C
for 12 hours. At this point of the heat treatment process the
aluminum phase becomes supersaturated with Silicon particles. The casting was then removed from
the furnace and quenched immediately into room temperature water. This quench trapped the
supersaturated solid solution at room temperature, keeping the composition of vacancies which isn’t
8/3/2019 Final Design Review of Light Measurement System
http://slidepdf.com/reader/full/final-design-review-of-light-measurement-system 13/15
12
(Si)
(Al)
(Al)
(Si)
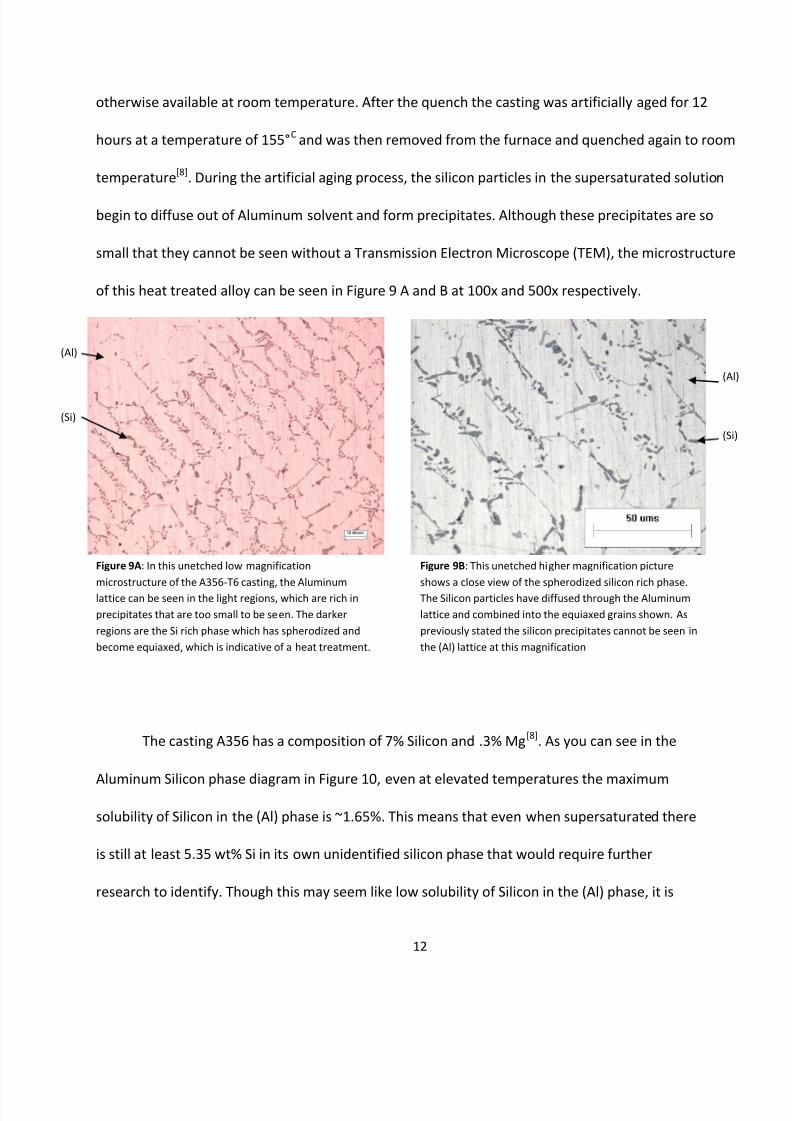
otherwise available at room temperature. After the quench the casting was artificially aged for 12
hours at a temperature of 155°C
and was then removed from the furnace and quenched again to room
temperature[8]
. During the artificial aging process, the silicon particles in the supersaturated solution
begin to diffuse out of Aluminum solvent and form precipitates. Although these precipitates are so
small that they cannot be seen without a Transmission Electron Microscope (TEM), the microstructure
of this heat treated alloy can be seen in Figure 9 A and B at 100x and 500x respectively.
Figure 9A: In this unetched low magnification
microstructure of the A356-T6 casting, the Aluminum
lattice can be seen in the light regions, which are rich in
precipitates that are too small to be seen. The darker
regions are the Si rich phase which has spherodized and
become equiaxed, which is indicative of a heat treatment.
Figure 9B: This unetched higher magnification picture
shows a close view of the spherodized silicon rich phase.
The Silicon particles have diffused through the Aluminum
lattice and combined into the equiaxed grains shown. As
previously stated the silicon precipitates cannot be seen in
the (Al) lattice at this magnification
The casting A356 has a composition of 7% Silicon and .3% Mg[8]
. As you can see in the
Aluminum Silicon phase diagram in Figure 10, even at elevated temperatures the maximum
solubility of Silicon in the (Al) phase is ~1.65%. This means that even when supersaturated there
is still at least 5.35 wt% Si in its own unidentified silicon phase that would require further
research to identify. Though this may seem like low solubility of Silicon in the (Al) phase, it is

8/3/2019 Final Design Review of Light Measurement System
http://slidepdf.com/reader/full/final-design-review-of-light-measurement-system 14/15
13
much more than that soluble at room temperature, since there is a decreasing solubility of Si in
(Al) with decreasing temperature. During the heat treatment, at high temperatures this silicon
phase becomes spherodized.
Figure 10: In the phase diagram to the
right, the red line is representative of 7
wt% Silicon, the composition of A356. The
.3 wt% Mg is negligible, therefore this
phase diagram can be considered. Notice
should be taken to the decreasing
solubility of Si in (Al) with decreasing
temperature. This is what allows
precipitation hardening to occur.
After the heat treatment process, the hardness of the as-cast riser and the heat treated
riser were compared in order to determine quantitatively if the heat treatment process
produced an increase in strength. The HRB scale was used when measuring the hardness of the
precipitation hardened alloy, but the average of these values was later converted to the HRE
scale, which was used for the as-cast sample; a scale for softer metals. The comparison of these
values can be seen in Table V. Though the heat treatment has a higher standard deviation, it is
evident by the average hardness value that the hardness of the casting doubled after the T6
heat treatment. Since hardness is the resistance to plastic deformation, it can be concluded
that through the heat treatment our casting had a large increase in strength.

8/3/2019 Final Design Review of Light Measurement System
http://slidepdf.com/reader/full/final-design-review-of-light-measurement-system 15/15
14
Table V: As-Cast Hardness vs T6 Heat Treatment
As Cast T6 Heat treatment
(HRE) (HRE) (HRB)
Average 43.85 88 51.9
Range 36.2-51.3 N/A 34.2-81.6
Std Dev 6.6 N/A 14.3
References
1. "Cathode Ray Tube." Wikipedia, the Free Encyclopedia. Web. 06 Dec. 2010.
<http://en.wikipedia.org/wiki/Cathode_ray_tube>.
2. Edmund Cast Plastic Color Filters, Blackboard
3. Uprint Specifications, Blackboard
4. Conceptual Design Decision Matrix (nps46E2.tmp)
5. Diffraction Gratings: Technical information, Blackboard
6. ASTM E308 “Standard Practice for Computing the Colors of Objects by Using the CIE System ”
(npsE8FB.tmp)
7. Z-cast 501 Direct Metal Casting. Design Guide, Blackboard
8. ASM Handbook. Cal Poly Library
<http://products.asminternational.org.ezproxy.lib.calpoly.edu/matinfo/index.jsp>


![Measurement of light-by-light scattering in ATLAS · 2017. 4. 21. · Positron Production in Multiphoton Light-by-Light Scattering [Physical Review Letters 79, 1626 (1997)] 95% CL](https://static.fdocuments.us/doc/165x107/60ae209bba62942f260547ad/measurement-of-light-by-light-scattering-in-2017-4-21-positron-production-in.jpg)


