Final CORRIDOR PLANNING REPORT – Executive Summary
76
VESTAL CORRIDOR STUDY Final CORRIDOR PLANNING REPORT – Executive Summary November, 2003 Prepared For: New York State Department Of Transportation, Region 9 44 Hawley Street Binghamton, NY 13901 DOT Contract No. D0104064 DOT PIN No. 9038.19.121 Fed. Aid No. Q76-9038-010 SBG Project No. 16860 85 Metro Park, Rochester, New York, 14623 in association with Eng-Wong, Taub & Associates 585.475.1440 / www.searbrown.com and Howard/Stein-Hudson Associates
Transcript of Final CORRIDOR PLANNING REPORT – Executive Summary

VESTAL CORRIDOR STUDY
Final CORRIDOR PLANNING REPORT –
Executive Summary November, 2003 Prepared For: New York State Department Of Transportation, Region 9 44 Hawley Street Binghamton, NY 13901 DOT Contract No. D0104064 DOT PIN No. 9038.19.121 Fed. Aid No. Q76-9038-010 SBG Project No. 16860
85 Metro Park, Rochester, New York, 14623 in association with Eng-Wong, Taub & Associates 585.475.1440 / www.searbrown.com and Howard/Stein-Hudson Associates

TABLE OF CONTENTS
I. INTRODUCTION ............................................................................................................1 II. EXISTING TRAFFIC VOLUMES ..................................................................................1 III. EXISTING SPEEDS AND DELAY ................................................................................3 IV. TRUCK LICENSE PLATE SURVEY ...........................................................................16 V. EXISTING LEVEL OF SERVICE.................................................................................17 VI. QUEUING ......................................................................................................................19 VII. SAFETY CONSIDERATIONS, ACCIDENT HISTORY AND ANALYSIS...............20 VIII. PROVISIONS FOR PEDESTRIANS AND BICYCLISTS...........................................22 IX. TRANSIT PROVISIONS ...............................................................................................22 X. PERCEIVED ISSUES FROM THE PUBLIC................................................................23 XI. EXISTING CONDITIONS – ENGINEERING CONSIDERATIONS..........................25 XII. STUDY AREA NEEDS .................................................................................................25 XIII. LAND USE ANALYSIS ...............................................................................................28 XIV. EXISTING LAND USE .................................................................................................30 XV. ESTIMATE OF EXPECTED LAND USE.....................................................................30 XVI. ESTIMATION OF FUTURE TRAFFIC VOLUMES ...................................................34 XVII. EXPECTED TRAFFIC OPERATION...........................................................................34 XVIII. SAFETY CONSIDERATIONS......................................................................................35 XIX. GOALS AND OBJECTIVES.........................................................................................36 XX. TRANSPORTATION PROBLEMS AND NEEDS IDENTIFICATION ......................37 XXI. DEVELOPMENT OF ALTERNATIVES .....................................................................48 XXII. LIST OF POTENTIAL ALTERNATIVES....................................................................49 XXIII. EVALUATION PROCESS ............................................................................................62 XXIV. EVALUATION OF ALTERNATIVES .........................................................................67 XXV. RECOMMENDATIONS................................................................................................70

LIST OF TABLES TABLE PAGE 1. Deficient Levels of Service......................................................................................................18
2. Deficient Queue Lengths .........................................................................................................19
3. Locations With Accident Rates Above the Statewide Average...............................................21
4. User Comments........................................................................................................................24
5. Bridge Ratings .........................................................................................................................26
6. Non-Conforming Side Streets..................................................................................................27
7. Non-Standard and Undesirable Features .................................................................................27
8. 2001 Existing Land Use...........................................................................................................30
9. 2006 Projected Increases from Existing Conditions................................................................32
10. 2026 Projected Increases from Existing Conditions................................................................32
11. Land Use Summary..................................................................................................................33
12. Excessive Vehicle Hours of Delay ..........................................................................................35
13. Safety Deficiencies ..................................................................................................................38
14. Overall Intersection Level of Service “E” ...............................................................................39
15. Overall Intersection Level of Service “F” ...............................................................................41
16. Individual Intersection Movements at Level of Service “E” ...................................................41
17. Individual Intersection Movements at Level of Service “F” ...................................................43
18. Alternatives and Needs Addressed ..........................................................................................66
19. Evaluation Matrix ....................................................................................................................68
20. Evaluation Matrix for Sub-Alternatives...................................................................................69

LIST OF FIGURES
FIGURE PAGE 1. Study Area Map ..........................................................................................................................2
2. a-c Existing Morning Balanced Traffic Volumes................................................................ 4-6
3. a-c Existing Noon Balanced Traffic Volumes ..................................................................... 7-9
4. a-c Existing Evening Balanced Traffic Volumes............................................................. 10-12
5. a-c Existing Saturday Balanced Traffic Volumes............................................................ 13-15
6. Transportation Analysis Zones (TAZ Boundary Map)............................................................29
7. Existing Land Use Map ...........................................................................................................31
8. Safety and Capacity Deficiencies ............................................................................................40
9. Pavement and Structural Deficiencies .....................................................................................46
10. Pedestrian and Bicycle Deficiencies........................................................................................47
11. Vestal Parkway Widening........................................................................................................51
12. Binghamton University Exit Drive Alternatives – Sub-Alternative A ....................................52
13. Binghamton University Exit Drive Alternatives – Sub-Alternative B ....................................53
14. Binghamton University Exit Drive Alternatives – Sub-Alternative C ....................................54
15. Sidewalk Alternatives ..............................................................................................................63
16. Pedestrian Sidewalk Alternatives – Sub-Alt. A.......................................................................64
17. Pedestrian Sidewalk Alternatives – Sub-Alt. B .......................................................................65

Vestal Corridor Study Final Report – Executive Summary Sear-Brown
EXECUTIVE SUMMARY I. INTRODUCTION The New York State Department of Transportation (NYSDOT) has contracted with the consultant team, Sear Brown, Eng-Wong, Taub & Associates, and Howard/Stein-Hudson to initiate a Department study to address current and forecasted capacity and mobility needs and Transportation Infrastructure Improvements in the Vestal Corridor. The study area includes Route 434, from Vestal Avenue west to North Main Street (Vestal Four Corners), and Vestal Road (County Route 44) from Route 434 to North Main Street, as shown in Figure 1. The general goals of the study are:
• to identify transportation needs in the Problem Area (“needs assessment”);
• to develop plans that describe capital, Transportation Systems Management (TSM), and operational projects, to be executed in future years, that are consistent with local and regional Long Range Plans; and,
• to select the preferred investment strategy. This final report executive summary combines the five Technical Memorandums prepared for this project and provides final recommendations. The Technical Memorandums included:
• Technical Memorandum #1, Current Operating Conditions (May, 2001) • Technical Memorandum #2, Current Issues and Problems (May, 2001) • Technical Memorandum #3, Land Use and Development (August, 2001) • Technical Memorandum #4, Future Transportation Needs (November, 2001) • Technical Memorandum #5, Evaluation of Alternatives (January, 2003) II. EXISTING TRAFFIC VOLUMES Average Daily Traffic (ADT) Automatic traffic recorders (ATR’s) were used to collect bi-directional traffic volumes, divided into 15-minute intervals, for 20 locations within the study area. Heavy Truck Traffic The heavy truck percentage (3 or more axles) is approximately 5% on Vestal Parkway and approximately 6% on Vestal Road. Peak Hours The peak hours in the study area occur from 7:30 – 8:30 am, 12:15 pm – 1:15 pm, 4:30 – 5:30 pm, during weekdays, and 12:15 – 1:15 pm on Saturday. These peak hours were used for analysis purposes.
1

##
# ##
# #
#
#
# # #
#
# #
###
#
# # ### # #
# # ## ##
# ##
JENS
EN R
D
GATE
S RD
SYCAMORE ST
CLUB
HOU
SE R
D
CLAYTON AVE
MAIN ST
Legend:
Study area# Study intersection
Water
Vestal Corridor StudyFigure - 1
NYSDOT Region 9Study Area Map

Vestal Corridor Study Final Report – Executive Summary Sear-Brown
Turning Movement Counts Turning movement counts were collected at 15 intersections within the study area, during the morning, midday, evening, and Saturday peak travel periods, to supplement 20 intersection counts provided by the NYSDOT and Binghamton Metropolitan Transportation Study (BMTS). The turning movement counts were collected during the months of October 1999 and February 2001. Additionally, turning movement counts were performed at five locations for a holiday peak period (a Saturday between Thanksgiving and Christmas, December 2000). The holiday counts were collected at the following locations:
• Vestal Road at African Road (ID #24) • Vestal Parkway at Glenn G. Bartle Drive (ID #5) • Vestal Parkway at Parkway Plaza (ID #11) • Vestal Parkway at Town Square Mall (ID #13) • Vestal Parkway at Main Street (ID #20) The highest traffic volumes along Vestal Parkway occur during the evening peak travel hour. The Saturday holiday counts were similar (+/- 10%) to the Saturday counts except for notable increases at the shopping plazas (12-30%) and a 50% decrease in the traffic entering and exiting the Binghamton University. Figures 2 (a-c) through 5 (a-c) detail the turning movement counts for the four time periods noted above. Mid-Block Pedestrian and Bicycle Movements Bicycle and pedestrian counts were collected at three locations along Vestal Parkway for morning, midday, evening, and Saturday peak periods. These counts were performed on October 19-21, 2000, before the winter season began. The counts were conducted at the following locations:
• Vestal Parkway between Clayton Avenue and NYS Route 26 ramps • Vestal Parkway between African Road and Town Square Mall entrance • Vestal Parkway between Martha Road and Bunn Hill Road The Saturday peak period for all three locations experienced the most pedestrian traffic with 7 to 27 people. The higher pedestrian volumes occurred between Clayton Avenue and NYS Route 26 Ramps, in the vicinity of the Vestal Library and the Vestal High School, and between Martha Road and Bunn Hill Road in the vicinity of Binghamton University. In general, the number of bicyclists observed was in the range of 0-4 per peak period. III. EXISTING SPEEDS AND DELAY Vehicle speed and delay data was collected on the following routes within the study area, during the peak travel periods:
• Vestal Parkway (from Main Street to Binghamton City Line) • Vestal Road (from Main Street to Vestal Parkway) • Main Street (between Vestal Parkway and Vestal Road)
3


Vestal Corridor Study Final Report – Executive Summary Sear-Brown
These studies provide information regarding the average travel speed, average running speed, and associated delays at various locations in the corridor. Average travel speed is based on the average travel time, defined as the total time to traverse given highway segment. Average running speed is based on the average running time, defined as the total time during which the vehicle is in motion while traversing a given highway segment. The running speed does not include stopped delay, while the travel speed does.
• Travel speeds vary greatly along the length of the Vestal Parkway. The running speed in the area of Campus Plaza to Jensen Road is slightly over the speed limit (45 mph) at 45 to 50 miles per hour, while from Jensen Road to Sycamore Road/Rano Boulevard the running speed is 10 to 20 miles per hour below the speed limit. In general, the running speed of Vestal Parkway is 10 to 15 miles per hour below the posted speed limit.
• The running travel speeds along Vestal Road are generally at or above the posted speed limit of 30 miles per hour. The section between Gates Road and the Railroad Overpass was 5 to 10 miles per hour below the speed limit while the section from the Railroad Overpass to Sycamore Road were 10 to 15 miles per hour above the speed limit.
IV. TRUCK LICENSE PLATE SURVEY A truck license plate survey was conducted on Vestal Road during the peak periods at nine entry/exit points. The license plate survey was conducted to determine the travel patterns of the truck traffic that travels within the study area. Trucks were classified as a vehicle with six or more tires or had three or more axles, buses were not included in this survey. The license plate data was entered into a database to match entry and exit points for the trucks. The primary entry points into the Vestal Road corridor, in order of their truck volumes, are:
• Route 201 Southbound ramp (25%) • Westbound on Vestal Road west of Murray Hill Road (20%) • African Road and Sycamore Road (15% each)
Similarly, the primary exit points from the study corridor are:
• Route 201 Northbound ramp (30%) • On-Ramp to Westbound Route 17 (18%) • Eastbound on Vestal Road west of Murray Hill Road (15%)
Some of the truck travel trends identified from the license plate survey include:
• Trucks arriving to the study area from the east use Vestal Parkway to Vestal Road and then return to the east via Murray Hill Road to Vestal Parkway.
• Several trucks arriving from the north use the Route 201 ramps to enter and then exit the Vestal Road area.
• Trucks arriving from the west use Vestal Parkway to Sycamore or African Roads and then exit by traveling west along Vestal Road to the Route 17 Westbound on-ramp.
16

Vestal Corridor Study Final Report – Executive Summary Sear-Brown
• During the PM peak period, there are fewer license plate matches than during the other time periods. This may be due to trucks returning to their business at the end of the day and parking for the night.
• The Saturday midday period had fewer license plate matches than the weekday periods because many trucking companies are closed and there are fewer trucks on the road.
• The number of trucks observed traveling through the survey locations during the evening and Saturday peak period was significantly lower than the morning and afternoon peak periods (less than half).
Interviews were also conducted with local businesses and trucking companies to gather further data on trucks arriving and departing from each business in the area. Trucks originating in the west typically use eastbound Route 17, exit to southbound Route 26, and exit to eastbound Route 434. From there, trucks turn left either at Jensen, Sycamore or African Roads to reach Vestal Road. Several respondents noted difficulty turning onto Vestal Road from Commerce Road because of the high volume of traffic on Vestal Road. Trucks originating in the east normally use westbound Route 17, exit to southbound Route 201, and exit to Vestal Road. Trucks destined to the west normally used the Vestal Road on-ramp to westbound Route 17. Trucks destined to Binghamton from Vestal Road used Jensen, Sycamore, African, or Murray Hill Roads to travel eastbound on Route 434 to Route 363. Respondents indicated that trucks destined to the east typically used Vestal Road to northbound Route 201 to eastbound Route 17. V. EXISTING LEVEL OF SERVICE
Level of Service (LOS) is a measure of delay, driver discomfort, frustration, fuel consumption and lost travel time at an intersection. It reflects delays due to waiting at red traffic signals and congestion. Specifically, LOS is stated as range from “A” to “F”, similar to a school report card. "A" is great, with little or no delay, while "F" is failing, with excessive delays. An overall LOS below “D” is generally considered unacceptable at an intersection with a traffic signal, where delay per vehicle traveling through the intersection exceeds 55 seconds. At an intersection controlled by "stop" signs, a LOS below “e” is generally considered unacceptable, where the average delay per vehicle will exceed 50 seconds. All of the signalized intersections operate at an overall Level of Service D or better for the existing condition. Even though the overall Level of Service operates at a D or above, certain movements operate at a Level of Service E or below. For the majority of intersections within the study area, the left turn/u-turn movements are experiencing a Level of Service E or below. The specific movements and the associated time periods are noted below in Table 1.
17

Vestal Corridor Study Final Report – Executive Summary Sear-Brown
TABLE 1 DEFICIENT LEVELS OF SERVICE
ID #
Intersections
Movement
Level of Service "E" or "F" (Peak Hours)
Vestal Parkway With: 19 Clayton Avenue WB left/U-turn AM. Midday, PM, Saturday 18 NYS Route 26 SB Ramps EB U-turn AM, Midday, PM
WB left AM, Midday, Saturday 16 Airborne Avenue WB left/U-turn AM, Midday 15 Ridgehaven Avenue EB U-turn AM, Midday, PM, Saturday
WB left/U-turn AM, Midday 14 African Road EB left/U-turn AM, Midday
WB left/U-turn AM, Midday, PM, Saturday 13 Town Square Mall EB left AM 12 Rano Blvd./Sycamore Rd. EB left AM, Midday, PM, Saturday 11 Parkway Plaza WB left AM, PM
NB left AM, Holiday Sat. NB left/thru AM, Holiday Sat. SB left AM, PM EB left PM
10 Jensen Road WB left AM, Midday, PM, Saturday SB Midday EB left Saturday WB left Saturday
9 Campus Plaza EB left/U-turn AM, Midday, PM, Saturday WB U-turn AM
8 Bunn Hill Road EB left Midday 5 Glenn G. Bartle Drive WB left AM SB left AM, Midday, PM
4 Murray Hill Road WB left AM EB left Midday, PM
3 Vestal Plaza EB U-turn AM WB left AM, Midday, PM
2 Clubhouse Road EB U-turn AM, Midday, PM, Saturday WB left AM, Midday, PM
1 Vestal Ave.\Normandy Ct. NB left AM Vestal Road With:
21 Main Street WB PM, Saturday 23 Oak Street SB left AM, PM, Saturday 25 Rano Blvd./Sycamore Rd. WB left PM 27 Jensen Road NB Midday, PM, Saturday 28 Commerce Road SB Midday, PM 30 Bunn Hill Road NB left Midday, PM, Saturday 31 NYS Rte. 201 Off-ramp SB left AM, Midday, PM
SB right PM, Saturday
18

Vestal Corridor Study Final Report – Executive Summary Sear-Brown
VI. QUEUEING Based on the analysis of the corridor using Synchro 5.0, which produces 50th and 95th percentile queue results, the following locations show existing queue deficiencies:
TABLE 2 DEFICIENT QUEUE LENGTHS
ID #
Intersections
Movement
Available
Storage (ft)
50th Percentile Queue (ft)
95th Percentile
Queue (ft) Morning Peak Period Vestal Parkway With:
19 Clayton Avenue WB left/U-turn 240 210 370 4 Murray Hill Road NB left 120 148 216 SB left 185 130 229
1 Vestal Ave./Normandy Ct. EB thru 255 8 385 Midday Peak Period Vestal Parkway With:
19 Clayton Avenue WB left/U-turn 240 176 276 12 Rano Blvd./Sycamore Rd. NB left 145 99 164 4 Murray Hill Road NB left 120 151 202 SB left 185 154 209
3 Vestal Plaza NB left 100 124 174 1 Vestal Ave./Normandy Ct. EB thru 255 8 260 Evening Peak Period Vestal Parkway With:
20 Main Street NB left 115 70 118 19 Clayton Avenue WB left/U-turn 240 236 410 17 NYS Route 26 NB Ramps WB left 450 445 652 12 Rano Blvd./Sycamore Rd. NB left 145 123 198 8 Bunn Hill Road WB thru 700 849 1024 4 Murray Hill Road NB left 120 224 318 SB left 185 40 377
1 Vestal Ave/Normandy Court EB thru 255 62 443 Vestal Road With:
23 Oak Street SB left 477 * 490 24 African Road NB left 125 60 195 25 Sycamore Road WB left 260 153 311
NB left 190 120 261 31 NYS Rte. 201 Off Ramp SB right 462 * 521
Saturday Peak Period Vestal Parkway With:
19 Clayton Avenue WB left 240 194 329 12 Rano Blvd./Sycamore Rd. NB left 145 104 172
SB left 320 223 369 4 Murray Hill Road NB left 120 113 167 1 Vestal Ave./Normandy Ct. EB thru 255 6 318 Vestal Road With:
25 Sycamore Road WB Left 260 365 466 NB Left 190 150 234
31 NYS Rte. 201 Off Ramp SB right 462 * 647 * Unsignalized Synchro analysis only provides 95th percentile queue
19

Vestal Corridor Study Final Report – Executive Summary Sear-Brown
VII. SAFETY CONSIDERATIONS, ACCIDENT HISTORY AND ANALYSIS A safety evaluation was conducted for Vestal Parkway, Vestal Road, Main Street, and Route 201. Accident data including accident reports, County Localized Accident Surveillance System (CLASS) and Statewide Accident Surveillance System (SASS) was obtained for the latest three-year period for these road segments. The latest three-year period of available data was from September 1996 to August 1999. This data was used to identify above average accident locations in the corridor. There were 776 accidents within the Vestal Parkway study limits during the three-year period from September 1, 1996 to August 31, 1999. There was one fatality, which occurred between the Parkway Plaza Mall driveway and Sycamore Road/Rano Boulevard on Route 434, and involved a westbound vehicle crossing over the median and striking two eastbound vehicles. The cause of the accident was attributed to driver inattention. There were 296 accidents resulting in injuries on Vestal Parkway. The injury accident rate of 38% is the same as the statewide average (38%). Property-damage only accidents accounted for 237 accidents and 242 non-reportable accidents occurred. The overall accident rate is 4.29 accidents per million vehicle miles (MVM), which is lower (18%) than the statewide accident rate of 5.20 accidents per MVM. Three bicycle accidents occurred on Vestal Parkway. One occurred at the Jensen Road intersection, which involved a southbound bicyclist riding through a red light and being struck by a northbound left-turning vehicle. Another occurred at the Bunn Hill Road intersection when an eastbound vehicle made a right-turn and struck an eastbound bicyclist. A third bicycle accident occurred at the Center Drive/Murray Hill Road intersection involving a southbound bicyclist riding through a red light and being struck by an eastbound vehicle. No pedestrian accidents occurred on Vestal Parkway during the period studied. Vestal Road – There were a total of 147 accidents and no fatalities on Vestal Road. There were 58 accidents resulting in injuries, accounting for 39% of all accidents. This is higher than the statewide average of 24%. Property-damage only accidents accounted for 39 accidents, and 50 non-reportable accidents occurred. The overall accident rate is 1.95 accidents per MVM, which is much lower (48%) than the statewide accident rate of 3.72 accidents per MVM. One pedestrian and one bicycle accident occurred on Vestal Road near the intersection with Bridge Street. The pedestrian accident involved a southbound motorist just south of the intersection striking a pedestrian crossing Bridge Street in the westbound direction. The bicycle accident involved a northbound vehicle turning left into the Kwik Fill gas station driveway, and striking a southbound bicyclist riding on the sidewalk at the mouth of the driveway. The intersections and segments studied are summarized in Table 3 (MEV = million entering vehicles).
20

Vestal Corridor Study Final Report – Executive Summary Sear-Brown
TABLE 3 LOCATIONS WITH ACCIDENT RATES ABOVE THE STATEWIDE AVERAGE
ID # Location Actual Rate
Statewide Rate
Accident Patterns
Deficiencies
20 Vestal Parkway & Main Street
1.06 0.74 Rear End High volume/congestion No apparent safety deficiency
17 Vestal Parkway & Route 26 NB Ramps
0.75 .42 Rear End Short acceleration lanes
12 Vestal Parkway & Sycamore Rd/Rano Blvd
1.74 0.74 Rear End High volume/congestion No apparent safety deficiency
11 Vestal Parkway & Parkway Plaza
1.15 0.74 Rear End High volume/congestion Traffic signals at Jensen Road and Parkway Plaza are not coordinated effectively Hess driveway alignment with intersection Vehicle queuing
10 Vestal Parkway & Jensen Road
1.20 0.74
Rear End Right Angle
High volume/congestion Limited sight distance on Jensen Road
9 Vestal Parkway & Campus Plaza
1.23 0.74 Rear End High volume/congestion
8 Vestal Parkway & Bunn Hill Road
1.16 0.74 Rear End Right Turn
High volume/congestion Vehicle queuing Short distance to left turn lane Conflict with Route 201 traffic merging onto Vestal Parkway
7 Vestal Parkway & Route 201 off ramps
0.59 0.18 Rear End Overtaking
Short acceleration lane and merging area onto WB Vestal Parkway
6 Vestal Parkway & Route 201 on ramps
0.27 0.11 Rear-End No apparent safety deficiency
3 Vestal Parkway & Vestal Plaza Drive
0.45 0.42 Rear-End Right Angle
Grade Close adjacent signals
21 Vestal Road & Main Street
0.73 0.42 Rear End Overtaking
High volume/congestion No apparent safety deficiency
26 Vestal Road & Prentice Road
0.25 0.19 Rear End Vestal Road is curved with a downgrade from west to east
27 Vestal Road & Jensen Road
0.66 0.19 Rear End Overtaking
No lane striping on NB approach
30 Vestal Road & Bunn Hill Road
0.31
0.19 Right Angle No apparent safety deficiency
21

Vestal Corridor Study Final Report – Executive Summary Sear-Brown
ID # Location Actual Rate
Statewide Rate
Accident Patterns
Deficiencies
31 Vestal Road & Route 201 Off Ramp
1.30 0.19 Rear End High volume/congestion Vehicle queuing Grade Insufficient signage Limited sight distance Bridge abutments
32 Vestal Road & Route 201 Off Ramp
0.77 0.19 Rear End Left Turn
Yield sign location
34 Vestal Road & Murray Hill Road
0.23 0.19 Right Angle No apparent safety deficiency
VIII. PROVISIONS FOR PEDESTRIANS AND BICYCLISTS There are limited pedestrian and bicycle facilities in the Vestal Corridor study area. Pedestrian facilities include sidewalks, curb cuts, and pedestrian signals and crosswalks. The majority of the pedestrian facilities in the study area are located in the vicinity of the mall and shopping plazas. Bicycle facilities within the study area consist of New York State and local on-street bicycle routes. New York State Bike Route 17 and Local Bike Route 2 both run along Vestal Road through the study area. There are also local secondary bike routes. Additionally, the NYSDOT has denoted bicycle pavement markings at new traffic signal installations to indicate that a bicycle will actuate the traffic signal. These pavement markings are on the northbound approach at the Vestal Parkway & Route 26 southbound intersection. A multi-use trail (Vestal Rail Trail) was recommended in the Binghamton Metropolitan Greenway Study within the study area along the abandoned rail line, the sand & gravel mine, and the towpath of the former Chenango Canal. A segment of this trail that runs along the abandoned rail line between Main Street and African Road is completed. IX. TRANSIT PROVISIONS Transit service in the study area is provided by Broome County Transit (BC Transit) and the Off Campus College Transport, Inc. (OCCT). The BC Transit operates 17 fixed bus routes using 43 buses in the Binghamton, Johnson City, and Endicott area. BC Transit has a two-fare system, Peak and Off-Peak. The Peak fare is $1.00 and occurs from 5:00 AM to 9:15 AM and 3:15 PM to 6:00 PM. The Off Peak fare is $0.50 and occurs from 9:15 AM to 3:15 PM and after 6:00 PM. Saturday operates as an Off Peak fare all-day and there is no service on Sunday. All of BC Transit’s buses are wheelchair accessible and have bike racks. There are two bus shelters located in the study area; one is located at the intersection of Vestal Road & Gates Road and the other at Vestal Plaza. BC Transit installed more bus shelters throughout their system in October 2001.
22

Vestal Corridor Study Final Report – Executive Summary Sear-Brown
The BC Transit routes operating in the study area are listed below:
• Route 5 • Route 15 • Route 17/25 • Route 47 • Shoppers’ Special The OCCT is a student owned and operated transportation service that provides service to students and community members of Binghamton University and surrounding off campus neighborhoods. OCCT operates ten buses and two lift equipped vehicles. The OCCT Transit route operating within the study area is Rivera Ridge –Town Square Mall. In the Binghamton Metropolitan Transportation Study’s (BMTS) 2001 –2002 Unified Planning Work Program (UPWP), they will be investigating the opportunities for integrating the bus service operated by the OCCT with the BC Transit system. X. PERCEIVED ISSUES FROM THE PUBLIC As part of this study, a survey of transportation users in the study area was conducted to gather basic demographic information and opinions on existing travel concerns and problems. The survey was handed out at the Binghamton University Student Union, Vestal Senior High School, Town Square Mall and at the Parkway Plaza. The survey included questions about a typical trip in or through the study area and opinion-type questions about transportation issues encountered during trips. Every individual who completed the survey had the opportunity to identify specific issues regarding transit, safety, pedestrian/bike, environmental, and other transportation-related problems that are encountered when traveling through the study area. Trip origin-destination information was also obtained. A number of comments were mentioned by people who returned the users survey. Congestion and excessive traffic was a major concern in the study area and received a number of responses (29%). The following locations were specifically mentioned as being congested and having excessive traffic in the responses:
• Target Plaza • Wal-Mart • Binghamton University & Vestal Parkway • Town Square Mall • Riverside Drive • Floral Drive • Main Street & Vestal Parkway • African Road & Clayton Road • Jensen Road • Rano Boulevard • Bunn Hill Road & Vestal Road
23

Vestal Corridor Study Final Report – Executive Summary Sear-Brown
Another major concern in the study area that received a number of responses (16%) was the lack of transit service/unreliable service in the study area. The following reasons/locations were listed as having problems with the transit service:
• Town Square Mall has bus service problems • No bus service on Sunday • Buses do not run often enough • Route 15 and Route 17 are too similar The following table contains a summary of the issues received from the user’s survey. In the returned user’s survey, seventy-seven people listed concerns with locations outside of the study area. Of these concerns 40 people listed the traffic circle on Route 201 as being congested and/or dangerous.
TABLE 4 USER COMMENTS
Comments Frequency Congestion/Excessive Traffic 199 Lack of transit service/unreliable service 107 Coordination at signals causing long delays 48 Disregarding Traffic Restrictions 46 Poor road conditions 32 Snowy/Ice Pavement Conditions 28 Not enough signal time for side roads/left turns 16 Speed 15 Too many traffic signals on Vestal Parkway 13 Lack of Traffic signals 9 Construction 9 Slow Drivers 8 Accidents 8 Location/access to bus stops, pedestrian crossings 8 Lack of Parking in Area 7 Misc. (drivers with cell phones, gas prices, elderly drivers, smog/carbon monoxide) 6 Truck traffic 6 Inconsistent Cab Service and Dangerous Drivers 5 Too many businesses 5 Lack of Turn Lanes 3 Congestion on Vestal Road 3 Signals not working correctly 3 Lack of bicycle/pedestrian (bus stops/cross walks…) facilities 3 Signs are not clear 2 No alternate routes when accidents occur 1 Not wide enough 1
24

Vestal Corridor Study Final Report – Executive Summary Sear-Brown
XI. EXISTING CONDITIONS – ENGINEERING CONSIDERATION Within the project area, there are several state and county roads, which have been reviewed as part of this study. These roads fall under the jurisdiction of either New York State or Broome County. 1. NEW YORK STATE ROUTES
a.) Route 434 (also known as Vestal Parkway), within the project limits, runs east from its intersection with Main Street to Vestal Avenue. This 9.4 km (5.8 miles) segment consists of two roadway classifications. The 1.0 km (0.6 miles) portion of Route 434 that runs from Main Street to Route 26 is classified as an urban minor arterial. The remaining 8.4 km (5.2 miles), from Route 26 to Vestal Avenue, is classified as an urban principal arterial. In addition, the entire roadway is a Designated Truck Access Highway, allowing travel for STAA vehicles and 53’ trailers. Designated Truck Access Highways require 3.0m (10’) minimum travel lane widths. Outside the study area, Route 434 runs west, parallel to Route 17, to the Town of Owego. From Vestal Avenue, Route 434 continues east to the City of Binghamton.
b.) Route 201 is a north-south urban principal arterial running along the eastern boundary of
the study area. Within the project limits, the roadway begins at Route 434 and extends 0.6 km (0.4 miles) to its interchange with County Route (CR) 44. The study also includes all entrance/exit ramps associated with both the Route 434 and CR 44 interchanges. Route 201 originates at Route 434 and continues north, through the study area, to Johnson City.
2. BROOME COUNTY ROADS
CR 44 (also known as Vestal Road) parallels Route 434, extending easterly from Bridge Street / Main Street to just past Murray Hill Road, where it connects to Route 434. The 11.5 km (7.1 miles) roadway runs east-west and falls under the jurisdiction of Broome County. It is classified as an urban minor arterial. CR 44 also includes segments which are Designated Truck Access Highways. Murray Hill Road to Bunn Hill Road (westbound only) (1.2 km/0.7 miles), Bunn Hill Road to Commerce Road (1.5 km/0.9 miles), and Sycamore Road to Prentice Road (0.7 km/0.5 miles) all are given this distinction.
XII. STUDY AREA NEEDS A. PAVEMENT DEFICIENCES The condition of the existing pavement along each of the roadways within the corridor study area has been evaluated based on 2001 NYSDOT data and site observation. As such, a generic rating of good, fair or poor was used to describe the existing conditions.
25

Vestal Corridor Study Final Report – Executive Summary Sear-Brown
1. Route 434: Within the study area, all existing pavement is in good condition with minor longitudinal and transverse cracking visible.
2. Route 201: This stretch of roadway also exhibits good pavement condition with minor isolated longitudinal and transverse cracking.
3. CR 44: The pavement from its intersection with Main Street to Ideal Terrace (1.8 km/1.1 miles) is in good condition with no cracking or deterioration visible. From Ideal Terrace to African Road (2.0 km/1.2 miles), however, the pavement is in fair condition with moderate transverse and longitudinal cracking and isolated areas of spalling. In July 2001 the segment from African Road to Route 201 (6.1 km/3.8 miles) was milled and repaved and therefore has a very good pavement condition. The last segment, from Route 201 to the intersection of Route 434 (1.5 km/0.9 miles), exhibits pavement that is in good condition with minor longitudinal and transverse cracking visible.
Overall, the pavement for all roadway segments involved in the corridor study is in fair to good condition with a few areas of moderate deterioration. From visual observations, there is no major deterioration that would be of concern. B. BRIDGE STRUCTURAL DEFICIENCIES The following table summarizes the existing bridges within the study area and also includes their respective State Condition Ratings. The State Condition Rating represents a weighted average of inspection report rating data that addresses various bridge elements. These ratings were provided by the NYSDOT and are the most recent updates as of April 2001. Upon refinement of the project scope, a more detailed inspection of each relevant structure will be performed in order to identify additional potential needs.
TABLE 5 BRIDGE RATINGS
Roadway B.I.N. Over/Under Feature Crossed
Condition Rating As Of 4/19/01
Route 434 1012999 Under Route 26 4.704 Route 434 1013009 Under Route 201 4.000 CR 44 1018431 Under Route 26 5.718 CR 44 1054822
1054821 Under Route 17 5.500
5.484 CR 44 1014349 Under Route 201 4.328 CR 44 7703184 Under NS 4.910
26

Vestal Corridor Study Final Report – Executive Summary Sear-Brown
C. NON-STANDARD/NON-CONFORMING GEOMETRIC FEATURES The subject roadways within the study area were reviewed with respect to existing geometric deficiencies. Available record plans for the subject highways were obtained from the NYSDOT and were used, where appropriate, to assess the existing highway geometric characteristics. A visual observation was performed to supplement the record plan review. Tables 6 and 7 summarize key non-standard or undesirable features determined from a review of record plans and/or field observations.
TABLE 6 NON-CONFORMING SIDESTREETS
Intersecting Roadway
Approximate Intersection Sight Distance Provided
/ Sight Line Intersection Sight Distance
Required Ideal Terrace 122 m (400’) / Rt.
91 m (300’) / Lt. 160 m (525’) 160 m (525’)
Old Vestal Road 122 m (400’) / Lt. 91 m (300’) / Rt.
160 m (525’) 160 m (525’)
Fourth Street 122 m (400’) / Lt. 160 m (525’) Third Avenue 30 m (100’) / Lt. 160 m (525’) Pearl Street 76 m (250’) / Rt. 160 m (525’) Second Avenue 91 m (300’) / Lt. 160 m (525’) Prentice Road 76 m (250’) / Rt.
122 m (400’) / Lt. 160 m (525’) 160 m (525’)
Shippers Road 30 m (100’) / Lt. 160 m (525’) Jensen Road 91 m (300’) / Rt. 160 m (525’) Schubmehl Road 152 m (500’) / Rt. 160 m (525’) Pinecrest Road 76 m (250’) / Lt. 160 m (525’) Meadowbrook Lane 76 m (250’) / Lt. 160 m (525’) Gates Road 61 m (200’) / Lt. 160 m (525’) Old Mill Road 137 m (450’) / Rt. 160 m (525’)
TABLE 7
NON-STANDARD AND UNDESIRABLE FEATURES
Road Non-Standard Geometric Feature Comments Route 434 - None - No substandard features identified Route 201 - Non-Standard Travel Lane and
Shoulders Widths on Ramps - Existing Ramp travel lane < 4.8m required - Various Ramp shoulder widths < 1.8m(6’)Rt &
0.9m(3’)Lt required. Restriping would eliminate non-conformance
CR 44 - Non-Standard Stopping Sight Distances
- Undesirable Vertical Clearance (NS Railroad Bridge)
- Undesirable Intersection Sight Distances
- Existing = 45m(148’)-70m(230’); 80m(262’) minimum required; 16 locations
- Existing = 3.8m(12.5’); 4.3m(14’) required per State standards
- Various sidestreets have intersection sight distances less than the desired 160m(525’)
27

Vestal Corridor Study Final Report – Executive Summary Sear-Brown
D. SAFETY DEFICIENCIES The 16 locations were identified as having accident rates near or above the state-wide average were summarized in Table 3 E. CAPACITY DEFICIENCIES Locations with deficient Levels of Service are summarized in Table 1. Locations with existing queue deficiencies are summarized in Table 2.
XIII. LAND USE ANALYSIS Land use data is a basic component of any transportation model. The model’s land use patterns clearly dictate origin and destinations of trips generated within a given area. The land use data in this study is based on the Binghamton Regional Traffic Model, which operates on TModel2™ software and is maintained by Binghamton Metropolitan Transportation Study (BMTS). TModel2 is a microcomputer based software package, which uses a highway network and geographic land use zones to simulate hourly traffic movements. The model incorporates socioeconomic data and trip rates to estimate the number of vehicle trips originating from and destined to transportation analysis zones (TAZs). The vehicle trips are then assigned to the highway network along the model’s calculated minimum travel time path(s). The Binghamton Regional Traffic Model is set up for the evening peak hour only, therefore any future estimates for the morning, midday or Saturday peak hours will be extrapolated based the model results for the evening peak hour volumes. The primary use of the Binghamton Regional Traffic Model will be to determine expected traffic patterns and performance measures for alternative land use scenarios (future years, new developments) or altered highway networks (new, improved, or closed roadways). A. Transportation Analysis Zones (TAZs) Trip Generators, which generate or attract trips, are defined within a “zone” (i.e., office park, residential home, shopping mall). The areas surrounding these generators are called Transportation Analysis Zones (TAZs), and are typically bounded by major roads, rivers, or railroad facilities which feed the surrounding transportation network and correspond to census tract and block group boundaries. The BMTS’s Model TAZs within the Vestal corridor study area are depicted in Figure 6.
28

50074 50073
61137
60135
50072
50069
51078
51076 51075
50071
58128
58125
50070
20036
40042 40029
58124
58126
20030 40045 40041 40043
40046 58120
40044
20035 45067 40053 45064
20031 40047 13027
10010
51077 40040
10011
13028 45068 51079
20034
58121
10095 13026
20032 30037
44063
44058
30092 13025 45066
10006 10005
13024 10007 10009
10008
12022 1002 45065
1001
58119
42051 20033
52062 12023
52080
41050 11016 30038 1003
53088 42055 1004 11017
52083
30039
12021
41049
44061
12020
41054
53087
42056 42052
11015
44060 41048 11014
11013 11012
58118
52082
43059
11018
42057
11019
53086 53085 54097 53089
53091 54094
53090
54093
54101
52084
Maine
ChenangoFenton
Dickinson
Union
ConklinVestal
Binghamton
KirkwoodCity ofBinghamton
Vestal Corridor StudyFigure - 6
NYSDOT Region 9TAZ Boundary Map
Study areaWater
Legend:
Broome County RoadsTaz Boundary

Vestal Corridor Study Final Report – Executive Summary Sear-Brown
XIV. EXISTING LAND USE The BMTS Regional Model uses three basic types of socioeconomic data: households, vehicle ownership, and employment. These data types are further divided into the 8 land use categories; however, to simplify the discussion and summary of the land use types, these eight categories were condensed into: Households, Retail, Manufacturing, Health, and Other. The base household and employment data was obtained from the 1990 Census Transportation Planning Package. Employment estimates are not meant to represent the exact number of employees in given TAZs because of the natural short-term variability of employment. The purpose of the employment data is only to provide a base for estimating the number of vehicle trip origins and destinations generated by each TAZ. Existing land uses within each TAZ in the study area are shown in Figure 7. Table 8 below summarizes the Vestal Corridor Study 2001 Land Use data by the BMTS TModel2 Zone Number.
TABLE 8 2001 - EXISTING LAND USE
Households and Number of Employees TAZ # Households Retail Manufacturing Health Other
19 0 250 135 30 600 23 610 vehicles entering / 1260 vehicles exiting* 24 43 40 235 60 700 25 215 190 0 35 120 26 251 450 0 200 320
119 328 270 400 45 1050 120 0 1100 0 0 0 121 1037 690 150 25 430 122 227 220 60 0 250 123 552 50 50 50 90 124 188 130 50 50 250 125 836 300 770 80 330 134 804 300 20 5 210
* For the purposes of the BMTS Travel Forecasting Model, trip generation totals for Binghamton University are derived from actual traffic counts, rather than using the model's trip generation procedure. This is due to the somewhat unique nature of land use at a university, which is difficult to simulate using the model's standard trip generation process.
XV. ESTIMATE OF EXPECTED LAND USE On June 29, 2001, a sub-committee met to discuss and develop the future land use projections for the Vestal Corridor Study. The sub-committee included representatives from the Town of Vestal, NYSDOT, Broome County, BMTS, and Binghamton University. Based on discussions during this meeting, it was concluded that the future analysis would include 5 year and 20 year projections, with a low and high-end growth scenario for each.
30

54093 54094
53091
54097
42057 11012 41048
42052 42056 41054
41049
12021
42055 30038
41050
20033 42051
45065 12022
45066
30092 30037
20032
13026 20034
Vestal Corridor StudyNYSDOT Region 9
Figure - 7Existing Land Use MapStudy area
Water
CommercialCommunity ServicesIndustrialNo DataPublic ServicesRecreationalResidentialVacantWild/Forest
Land Use
TAZ Boundry
Legend:

Vestal Corridor Study Final Report – Executive Summary Sear-Brown
Land Use Maps, as well as a TAZ map for the study area, were used to identify potential growth along the Vestal Parkway and Vestal Road corridors. Using all of the comments from the sub-committee, a meeting was held with BMTS to fine-tune the future growth assumptions for each of the time periods and scenarios. The draft growth projections were then distributed to all of the sub-committee members for their review and comment. Tables 9 and 10 show the low and high estimated increase in the number of households and employees for the 2006 and 2026 analysis years, respectively.
TABLE 9 2006 PROJECTED INCREASES FROM EXISTING CONDITIONS
Number of Households and Number of Employees Low Scenario High Scenario
TAZ # Households Retail Manufacturing Health Other TAZ # Households Retail Manufacturing Health Other19 0 +100 0 0 +100 19 0 +100 0 0 +100 23 +220 vehicles entering / +500 vehicles exiting* 23 +220 vehicles entering / +500 vehicles exiting* 24 0 0 0 0 +200 24 0 0 0 0 +200 25 +10 0 0 0 0 25 +25 +100 0 0 +100 26 0 +50 0 0 0 26 +10 +50 0 0 +100
119 0 +100 0 0 0 119 0 +250 0 0 +150 120 0 +300 0 0 0 120 0 +400 0 0 0 121 0 0 0 0 0 121 +10 +200 0 0 0 122 0 0 0 0 0 122 0 +50 0 0 0 123 0 0 0 0 0 123 0 0 0 0 0 124 0 0 0 0 +100 124 0 0 0 0 +100 125 0 0 0 0 0 125 0 0 0 0 0 134 0 0 0 0 0 134 0 +50 0 0 0
Total +10 +550 0 0 +400 +45 +1200 0 0 +750
TABLE 10
2026 PROJECTED INCREASES FROM EXISTING CONDITIONS Number of Households and Number of Employees
Low Scenario High Scenario TAZ # Households Retail Manufacturing Health Other TAZ # Households Retail Manufacturing Health Other
19 0 +200 0 0 +170 19 0 +150 0 0 +160 23 +300 vehicles entering / +670 vehicles exiting* 23 +300 vehicles entering / +670 vehicles exiting* 24 0 0 0 0 +170 24 0 0 0 0 +160 25 +52 +200 0 0 +85 25 +52 +300 0 0 +160 26 +300 -150 0 0 +340 26 +520 +150 0 0 +80
119 0 +150 +150 0 +553 119 0 +188 +300 0 +1680120 0 +400 0 0 0 120 0 +300 0 0 0 121 +1 +200 0 0 0 121 +25 +225 0 0 +80 122 0 +200 0 0 0 122 0 +300 0 0 0 123 0 +200 0 0 +170 123 0 +263 0 0 +160 124 0 +50 0 0 +85 124 0 +75 0 0 +160 125 0 +200 0 0 +170 125 0 +263 0 0 +160 134 0 +100 0 0 +85 134 0 +300 0 0 0
Total +353 +1550 +150 0 +1828 +597 +2514 +300 0 +2960
32

Vestal Corridor Study Final Report – Executive Summary Sear-Brown
Table 11 summarizes the existing and estimated growth within the study area.
TABLE 11 LAND USE SUMMARY
Number of Households and Number of Employees - all TAZs YEAR Households Retail Manufacturing Health Other 2001 4,481 3,990 1,870 580 4,350
2006 (Low) 4,491 4,540 1,870 580 4,750 2006 (High) 4,526 5,190 1,870 580 5,100 2026 (Low) 4,534 5,740 2,020 580 6,178 2026 (High) 4,578 6,504 2,170 580 7,150
* These totals do not include the growth projections for Binghamton University, which are noted in Tables 2 and 3 for the 2006 and 2026 scenarios
The number of residential units in the study area is projected to grow from 4,481 existing to 4,578 under the 2026 high scenario. This increase of approximately 2% is based on the limited property available directly within the study for residential growth. Based on data available from the Vestal town engineer, the majority of household growth is anticipated to occur further from the study area and has been incorporated into the future analysis models. With the high level of commercial development in the study area, the number of retail employees is projected to grow from 3,990 existing to 6,504 under the 2026 high scenario. This growth of approximately 63% represents the potential for continued commercial growth and possible consolidation of smaller business into larger developments. The manufacturing land uses within the area also has the possibility of significant growth along the Vestal Road corridor with future projections as high as 16% between 2001 exiting conditions and the 2026 high scenario. Health based employees are anticipated to experience negligible growth within the study area between existing conditions and 2026. Other than retail, the largest growth in employment levels is anticipated to occur in the “Other” category. The approximate 64% increase in employment covers various office and service industries that are not considered retail, manufacturing, or health related. Based on data supplied by Binghamton University, the majority of their planned growth will occur within the next five years with an approximate increase in student enrollment of 20%. Although there are no specific plans beyond five years, some growth was incorporated into the 2026 projected volumes. Although this report only presents the land use data for the Vestal Corridor Study project area, the Binghamton Regional Transportation Model used for analysis purposes covers the primarily urbanized portion of Broome County and some parts of Tioga County. The Broome County portion includes all of Binghamton, the villages of Johnson City, Endicott, Port Dickson, Owego and the Towns of Union, Dickinson, Kirkwood, Conklin, Vestal and Owego. It also includes portions of the Towns of Maine, Chenango, Fenton, and Windsor. Therefore, growth projections outside the study area, that may impact traffic volumes within the study area, will be accounted for in the regional model. The updated Regional Model will be used to effectively evaluate alternatives to the transportation system and study the effect of future growth.
33

Vestal Corridor Study Final Report – Executive Summary Sear-Brown
XVI. ESTIMATION OF FUTURE TRAFFIC VOLUMES The future No-Build traffic volumes were generated through the use of the Binghamton Metropolitan Transportation Study’s Binghamton Regional Traffic Model, which operates on Tmodel2™ software. A regional traffic model is a macroscopic tool that is used to determine expected traffic patterns and performance measures for alternative land use scenarios or altered highway networks. The results produced by the model provide only a general indication of the future traffic volumes and patterns and are not meant to produce exact results. The unknown variables involved in predicting traffic volumes limit the precision of the model, therefore the traffic volumes projected for this project should not be considered accurate, but they are provided to signify the order of magnitude of the anticipated traffic volumes. To determine the demand for future trips within the study area, the existing weekday PM Peak hour base-model incorporated the 2006 and 2026 land use projections. The BMTS Model calculated the resulting PM peak traffic volumes, which were then compared to base-model volumes to determine volume growth by intersection movement. This process was performed using both low growth and high growth 2006 and 2026 land use projections, as well as an additional 2026 high retail land use projection. The intersection movement growth, which was rounded to the nearest 10 vehicles, was then applied to existing turning movement counts to develop future volumes. Other considerations in developing the future traffic volumes included directional distribution and the location of specific development driveways. A detailed discussion of the development of the future traffic volumes can be found in the Final Report. Traffic volume diagrams depicting the expected traffic in 2006 and 2026 for both the low and high growth scenarios are also presented in Final Report. Although truck traffic was not specifically modeled, it was assumed that the percentage of trucks within the traffic flow would remain constant for the various scenarios modeled. Therefore, as the overall traffic volume increased, truck traffic was assumed to increase proportionally. XVII. EXPECTED TRAFFIC OPERATION Level of Service Consistent with the existing conditions analysis, the projected volumes were incorporated into the Synchro and CORSIM analysis packages. A summary of the capacity analysis by individual movement and overall intersection LOS for the weekday morning (AM) and evening (PM) and weekday Midday and Saturday Midday peak periods are presented in the Final Report. A summary of the deficient locations is presented later in the "Transportation Problems and Needs Identification" section of this Executive Summary. The future Level of Service analysis was optimized within the existing cycle length and coordination scheme. This accounts for any changes to the signal timings that may occur due to the actuation of the traffic signal based on the changing traffic demands. For this reason, some of the future capacity analysis shows results that are better than the existing capacity analysis. These differences are minor and do not affect the outcome of identifying deficiencies for the future conditions.
34

Vestal Corridor Study Final Report – Executive Summary Sear-Brown
A review of the analysis results indicates that the Level of Service for many of the intersections will deteriorate to unacceptable levels in the future for both the low and high growth scenarios evaluated. On Vestal Parkway, the long delays for left, u-turning, and side street traffic will increase. The delays for through traffic on Vestal Parkway will also increase to unacceptable levels at some locations, such as at Bunn Hill Road and Rano Boulevard/Sycamore Road for both the short (high growth only) and long term future. Based on the projected traffic volumes, Vestal Road will experience a significant increase in traffic which results in failing operations at most of the intersections from Main Street to the Route 201 ramps. This increase in traffic volumes on Vestal Road is due to the over capacity conditions on Vestal Parkway with the possible increase in development in the area. Queuing The queue analysis indicates that the storage of many turn bays will be exceeded with the projected traffic volumes. Additionally, the analysis indicates that the through traffic volumes on Vestal Parkway will back up to the adjacent intersections in the vicinity of Bunn Hill Road to Vestal Plaza. The analysis also indicated traffic queuing between the Route 26 Ramps on Vestal Parkway. The queue analysis indicates that traffic operations will be worse than predicted by Synchro, since many of the storage lengths will be exceeded, thereby affecting the overall through movement operation in the study area. Estimates of Periods of Delay An important measure of how significant congestion is along a corridor is "Vehicle Hours of Delay (VHD). Excessive VHD is defined as the delay experienced by vehicles traveling along a corridor that is in excess of the acceptable LOS “D” delays. Table 12 presents the VHD for each future scenario.
TABLE 12 EXCESSIVE VEHICLE-HOURS OF DELAY
Scenario Morning Peak Midday Peak Evening Peak Saturday Peak 2006 (Low) 13 29 148 109 2006 (High) 46 90 282 180 2026 (Low) 106 165 484 349 2026 (High) 126 260 661 402
2006 (High Retail) 168 353 626 539 XVIII. SAFETY CONSIDERATIONS As the traffic volumes continue to increase, it is anticipated that the number of accidents will increase respectively. The future accident rates, however, will remain the same as existing, or increase slightly unless there are changes to the roadway network. The number (17) and location of high-accident areas will also remain the same as existing or increase slightly.
35

Vestal Corridor Study Final Report – Executive Summary Sear-Brown
XIX. GOALS AND OBJECTIVES A set of goals and objectives is needed to better identify existing and future needs, formulate short- and long-term alternative solutions to address identified deficiencies, and evaluate the relative effectiveness of proposed alternatives. The established set of goals and objectives were defined for several major areas, including non-highway transportation opportunities, development patterns and opportunities, and social and environmental effects. A careful approach to the structuring of the goals and objectives early in the study provided a solid foundation for the development of improvements that respond directly to Vestal Corridor’s transportation problems, the selection of evaluation measures that effectively present the technical results, a technical approach that focuses on the most important issues, and a public involvement program that effectively communicates the information needed for decision making. The following is a list of goals and objectives that were derived based upon discussions between members of our planning/engineering team (NYSDOT, SBG, and EWT), and comments from the May 2001 VSAG meeting. Following each project goal is a list of bulleted objectives to achieve that specific goal. Project Goal 1: Alleviate existing and future peak hour traffic congestion within the study area, particularly on Route 434.
Objectives Evaluation Criteria • Reduce number of existing and forecasted
congested spot locations Level of Service (D or better is acceptable)
• Reduce arterial delays on Route 434 Average overall travel speed (Time/Distance)
Project Goal 2: Provide improved access for all modes within the study area.
Objectives Evaluation Criteria • Minimize through truck traffic on Vestal Road Number of truck trips whose origins/
destinations are outside study area • Reduce volume of through-vehicle traffic
residential streets (i.e. cut-through traffic bypassing Route 434)
Number of vehicles and average spot speeds
• More direct access to Binghamton University Travel time savings • Provide pedestrian and bicycle facilities
Traffic volume and accident reduction
• Improve access to transit within Study Area Number of transit riders; new routes Project Goal 3: Assure that solutions to identified problems maximize the return on resources invested.
Objectives Evaluation Criteria • Maximize added user benefits derived from
capital costs expended Estimated total project costs vs. estimated travel time savings, operating costs reductions and accident reductions
• Maximize cost effectiveness Benefit/Cost ratio (10% discount rate)
36

Vestal Corridor Study Final Report – Executive Summary Sear-Brown
Project Goal 4: Assure that solutions promote desired land use patterns
Objectives Evaluation Criteria • Facilitate municipal development goal
attainment Ways in which recommendations support objectives in Town of Vestal Master Plan.
• Facilitate Binghamton University development Ways in which recommendations support objectives in University Master Plan.
• Achieve BMTS support Supporting resolution from the BMTS Policy Committee.
• Avoid or minimize environmental impacts Air-quality and sound-level measurements
• Minimize dislocations of residences and businesses
Number of occupied properties
• Facilitate Regional Planning goals Ways in which recommendations support objectives in BMTS Bicycle and Pedestrian Plan and Binghamton Greenway Feasibility Study and BMTS Freight Plans
• Improve visual appearance along corridor Aesthetic elements incorporated in design of improvements
Project Goal 5: Provide improved safety of travel for all modes within the study area.
Objectives Evaluation Criteria • Reduce number of accidents and their severity
distribution. Estimated accident rates and severity distribution
• Heighten enforcement of traffic codes in the corridor
Number of traffic citations; perceptions of citizens with regard to enforcement–as reflected in user surveys
Project Goal 6: Restore and maintain existing infrastructure in a state of good repair
Objectives Evaluation Criteria • Evaluate condition of existing transportation
facilities, and forecast future deterioration Problem areas identified on roadways, bridges and other facilities; and solutions proposed
XX. TRANSPORTATION PROBLEMS AND NEEDS IDENTIFICATION This section of the report presents the existing and future needs in the Study Area, identified through the review of operations, public input and analyses conducted to date. The needs are presented in the following nine categories; Safety, Capacity, Pavement, Structural, Railroad, Non-Standard Features, Pedestrian, Bicycle and Transit. These needs listed in this section are those for which solutions will be investigated in the next phase of this study.
37

Vestal Corridor Study Final Report – Executive Summary Sear-Brown
SAFETY CONSIDERATIONS As discussed previously, seventeen high-accident areas have been identified as locations that have safety considerations to be addressed. The locations are summarized in Table 13 and illustrated on Figure 8:
TABLE 13 SAFETY DEFICIENCIES
ID # Location Accident Patterns
Deficiencies
20 Vestal Parkway & Main Street
Rear End High volume/congestion No apparent safety deficiency
17 Vestal Parkway & Route 26 NB Ramps
Rear End Short acceleration lanes
12 Vestal Parkway & Sycamore Road/Rano Boulevard
Rear End High volume/congestion No apparent safety deficiency
11 Vestal Parkway & Parkway Plaza
Rear End High volume/congestion Traffic signals at Jensen Road and Parkway Plaza are not coordinated effectively Hess driveway alignment with intersection Vehicle queuing
10 Vestal Parkway & Jensen Road
Rear End Right Angle
High volume/congestion Limited sight distance on Jensen Road
9 Vestal Parkway & Campus Plaza
Rear End High volume/congestion No apparent safety deficiency
8 Vestal Parkway & Bunn Hill Road
Rear End Right Turn
High volume/congestion Vehicle queuing Short distance to left turn lane Conflict with Route 201 traffic merging onto Vestal Parkway
7 Vestal Parkway & Route 201 off ramps
Rear End Overtaking
Short acceleration lane and merging area onto WB Vestal Parkway
6 Vestal Parkway & Route 201 on ramps
Rear-End No apparent safety deficiency
3 Vestal Parkway & Vestal Plaza Drive
Rear-End Right Angle
Grade Close adjacent signals
21 Vestal Road & Main Street
Rear End Overtaking
High volume/congestion No apparent safety deficiency
26 Vestal Road & Prentice Road
Rear End Vestal Road is curved with a downgrade from west to east
27 Vestal Road & Jensen Road
Rear End Overtaking
No lane striping on NB approach
38

Vestal Corridor Study Final Report – Executive Summary Sear-Brown
ID # Location Accident Patterns
Deficiencies
30 Vestal Road & Bunn Hill Road
Right Angle No apparent safety deficiency
31 Vestal Road & Route 201 Off Ramp
Rear End High volume/congestion Vehicle queuing Grade Insufficient signage Limited sight distance Bridge abutments
32 Vestal Road & Route 201 Off Ramp
Rear End Left Turn
Yield sign location
34 Vestal Road & Murray Hill Road
Right Angle No apparent safety deficiency
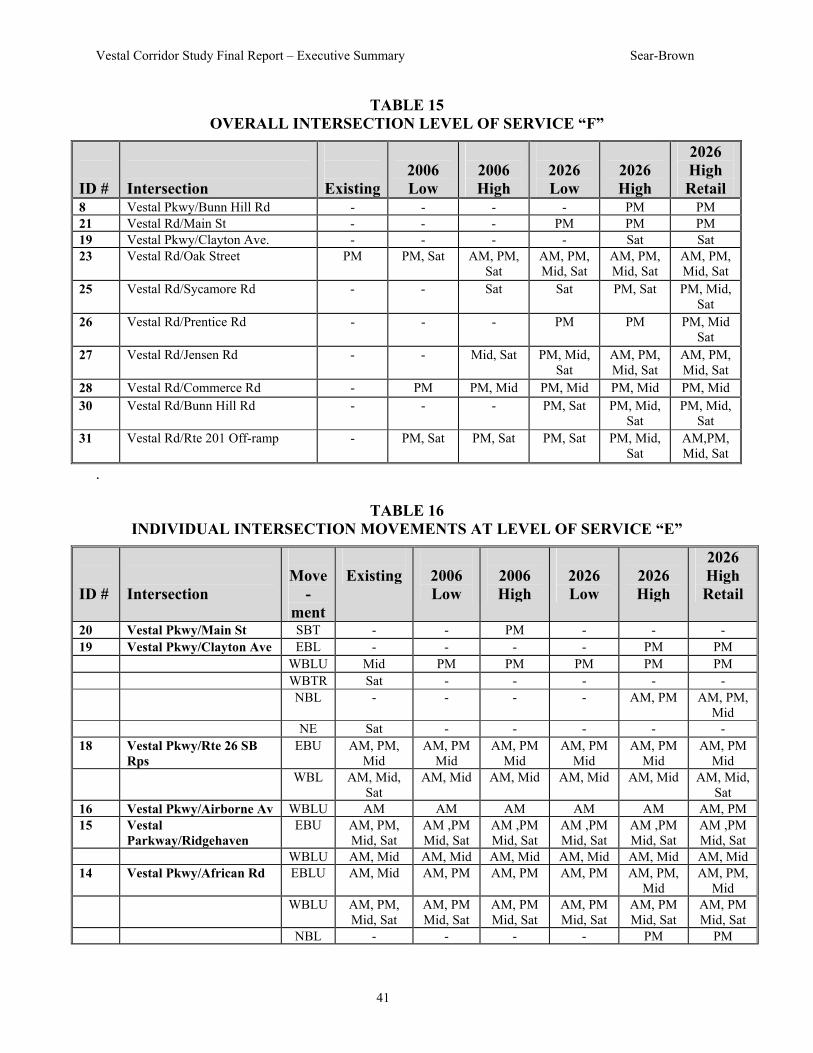
CAPACITY DEFICIENCIES The capacity deficiencies are noted below and summarized first by overall intersection level-of-service “E” (Table 14) and level-of-service “F” (Table 15) and then by individual intersection movement level-of-service “E” (Table 16) and level-of-service “F” (Table 17). For each of the scenarios, the tables present the time period in which the overall intersection or movement is deficient. The capacity deficiencies listed above are also shown graphically on Figure 8.
TABLE 14 OVERALL INTERSECTION LEVEL OF SERVICE “E”
ID #
Intersection
Existing
2006 Low
2006 High
2026 Low
2026 High
2026 High Retail
20 Vestal Pkwy/Main St - - - - PM PM 19 Vestal Pkwy/Clayton Ave - Sat Sat Sat - - 17 Vestal Pkwy/Rte 26 NB Ramps - - - - - PM 12 Vestal Pkwy/Sycamore/Rano - - - PM PM PM 8 Vestal Pkwy/Bunn Hill Rd - - PM PM - - 21 Vestal Rd/Main St - - PM Sat Sat Sat 23 Vestal Rd/Oak St Sat - - - - - 25 Vestal Rd/Sycamore Rd - Sat PM PM - - 26 Vestal Rd/Prentice Rd - - - Sat Sat - 27 Vestal Rd/Jensen Sat - - AM - - 28 Vestal Rd/Commerce Rd - - - - AM Sat 29 Vestal Rd/Gates Rd - - - - - PM 31 Vestal Rd/Rte 201 Off-ramp Sat - - AM, Mid AM -
39

��
� ��
� �
�
�
� � �
�
� �
���
�
� �� � ��� �
� ��� ���
�
�
�
�
�
� ��
��
�
�
�
�������
��������
���
����
� ���
������ ���
���
����
� ��
����
��
����������
������ ��
����
��
������
��
��
����
������
����
�
��������
�������
���
����
� ���
������ ���
���
����
� ��
����
� ������������� ����
� �������������� ���� ��
� �!"#� ���������� ��������
� ���������� ����������������� ����������$%&'��())*"()��%+",
-* +)��.�8�������� *(!���&/�%,�&!"��&0&1*%,
��/*1*�!1*�$
Vestal Corridor Study Final Report – Executive Summary Sear-Brown
TABLE 15 OVERALL INTERSECTION LEVEL OF SERVICE “F”
ID #
Intersection
Existing
2006 Low
2006 High
2026 Low
2026 High
2026 High Retail
8 Vestal Pkwy/Bunn Hill Rd - - - - PM PM 21 Vestal Rd/Main St - - - PM PM PM 19 Vestal Pkwy/Clayton Ave. - - - - Sat Sat 23 Vestal Rd/Oak Street PM PM, Sat AM, PM,
Sat AM, PM, Mid, Sat
AM, PM, Mid, Sat
AM, PM, Mid, Sat
25 Vestal Rd/Sycamore Rd - - Sat Sat PM, Sat PM, Mid, Sat
26 Vestal Rd/Prentice Rd - - - PM PM PM, Mid Sat
27 Vestal Rd/Jensen Rd - - Mid, Sat PM, Mid, Sat
AM, PM, Mid, Sat
AM, PM, Mid, Sat
28 Vestal Rd/Commerce Rd - PM PM, Mid PM, Mid PM, Mid PM, Mid 30 Vestal Rd/Bunn Hill Rd - - - PM, Sat PM, Mid,
Sat PM, Mid,
Sat 31 Vestal Rd/Rte 201 Off-ramp - PM, Sat PM, Sat PM, Sat PM, Mid,
Sat AM,PM, Mid, Sat
.
TABLE 16 INDIVIDUAL INTERSECTION MOVEMENTS AT LEVEL OF SERVICE “E”
ID #
Intersection
Move
-ment
Existing
2006 Low
2006 High
2026 Low
2026 High
2026 High Retail
20 Vestal Pkwy/Main St SBT - - PM - - - 19 Vestal Pkwy/Clayton Ave EBL - - - - PM PM WBLU Mid PM PM PM PM PM WBTR Sat - - - - - NBL - - - - AM, PM AM, PM,
Mid NE Sat - - - - - 18 Vestal Pkwy/Rte 26 SB
Rps EBU AM, PM,
Mid AM, PM
Mid AM, PM
Mid AM, PM
Mid AM, PM
Mid AM, PM
Mid WBL AM, Mid,
Sat AM, Mid AM, Mid AM, Mid AM, Mid AM, Mid,
Sat 16 Vestal Pkwy/Airborne Av WBLU AM AM AM AM AM AM, PM 15 Vestal
Parkway/Ridgehaven EBU AM, PM,
Mid, Sat AM ,PM Mid, Sat
AM ,PM Mid, Sat
AM ,PM Mid, Sat
AM ,PM Mid, Sat
AM ,PM Mid, Sat
WBLU AM, Mid AM, Mid AM, Mid AM, Mid AM, Mid AM, Mid 14 Vestal Pkwy/African Rd EBLU AM, Mid AM, PM AM, PM AM, PM AM, PM,
Mid AM, PM,
Mid WBLU AM, PM,
Mid, Sat AM, PM Mid, Sat
AM, PM Mid, Sat
AM, PM Mid, Sat
AM, PM Mid, Sat
AM, PM Mid, Sat
NBL - - - - PM PM
41

Vestal Corridor Study Final Report – Executive Summary Sear-Brown
ID #
Intersection
Move
-ment
Existing
2006 Low
2006 High
2026 Low
2026 High
2026 High Retail
13 Vestal Pkwy/Town Sq Mall
EBL AM AM AM AM AM AM
12 Vestal Pkwy/Sycamore/Rano
EBL AM, PM, Mid, Sat
AM, PM, Sat
AM, PM Sat
AM, Sat AM, Sat AM, Sat
EBT - - - - - Sat WBL Sat - - - - Sat WBT - - PM - - Sat NBTR - - PM PM PM PM, Sat SBL - - - - - Sat 11 Vestal Pkwy/Parkway Plz EBL PM AM, PM AM, PM AM, PM
Sat AM, PM
Sat AM, PM
Sat WBL AM, PM,
Mid AM, PM
Mid AM, PM
Mid AM, PM
Mid AM, PM
Mid AM, PM
Mid NBL AM AM AM AM AM AM NBLT AM AM AM AM AM AM SBL AM, PM AM, PM AM, PM AM, PM AM, PM AM, PM 10 Vestal Pkwy/Jensen Rd EBL Sat Sat Sat Sat Sat Sat WBL AM, PM,
Mid, Sat AM, PM Mid, Sat
AM, PM Mid, Sat
AM, PM Mid, Sat
AM, PM Mid, Sat
AM, PM Mid, Sat
SB - - PM - Mid - 9 Vestal Pkwy/Campus Plz EBLU AM, PM,
Mid, Sat AM, PM Mid, Sat
AM, PM Mid, Sat
AM, PM Mid, Sat
AM, PM Mid, Sat
AM, PM Mid, Sat
WBU AM AM AM AM AM AM 8 Vestal Pkwy/Bunn Hill
Rd EBL Mid - - - - -
WBL - - - PM PM PM NBL - - - - Mid, Sat Mid, Sat Vestal Parkway/Route
201 Interchange
7 Route 201 SB off-ramp to Vestal Parkway WB
- - - - - Mid
5 Vestal Pkwy/Glenn Bartle
EBT - - - - PM PM
WBL AM AM, PM AM, PM AM, PM AM, PM AM, PM NBL - - - PM PM PM NBLT - - - PM PM PM SBL AM, PM,
Mid PM, Mid PM, Mid PM, Mid PM, Mid PM, Mid
4 Vestal Pkwy/Murray Hill EBL PM, Mid PM, Mid PM, Mid PM, Mid PM, Mid PM, Mid EBT - - - - PM PM WBL AM - - - - PM NBTR - - - PM PM PM SBL - PM PM - - - SBTR - - - - PM PM 3 Vestal Pkwy/Vestal Plaza EBU AM AM AM AM AM AM WBL AM, PM,
Mid AM, PM
Mid AM, PM
Mid AM, PM
Mid AM, PM
Mid AM, PM
Mid 2 Vestal Pkwy/Clubbhouse EBU AM, PM, AM, Sat AM, Sat AM, Sat AM, Sat AM, Sat
42

Vestal Corridor Study Final Report – Executive Summary Sear-Brown
ID #
Intersection
Move
-ment
Existing
2006 Low
2006 High
2026 Low
2026 High
2026 High Retail
Mid, Sat WBL AM, PM,
Mid Mid Mid Mid Mid Mid
1 Vestal Pkwy/Vestal Ave & Normandy Ct
NBL AM - - - - -
21 Vestal Rd/Main St WB Sat - - - - - NBT - PM - - - Mid SBL - PM PM - - - 23 Vestal Rd/Oak St NB - - PM AM, Sat AM - SBTR - - - PM - - 24 Vestal Rd/African Rd WBL - - - - AM AM 25 Vestal Rd/Sycamore Rd EBT - - - - - PM WBL - - - - - AM NBL - - - - Mid - 26 Vestal Rd/Prentice Rd SB - PM Mid - - - 27 Vestal Rd/Jensen Rd NB PM, Sat - - - - - 28 Vestal Rd/Commerce Rd SB - AM - - - - 30 Vestal Rd/Bunn Hill Rd NBL AM - - - Mid, Sat Mid, Sat 31 Vestal Rd/Rte 201 Off-
ramp SBL AM, Mid Sat - - - -
SBR AM
KEY: NB – northbound SB - southbound EB - eastbound WB - westbound
L - Left Turn T - Through Movement R - Right Turn U – U-Turn
TABLE 17
INDIVIDUAL INTERSECTION MOVEMENTS LEVEL OF SERVICE “F”
ID #
Intersection
Move
-ment
Existing
2006 Low
2006 High
2026 Low
2026 High
2026 High Retail
20 Vestal Pkwy/Main St SBT - - - PM PM PM 19 Vestal Pkwy/Clayton Ave WBLU AM, PM,
Sat - - - - -
WBTR - Sat Sat Sat Sat Sat NE PM, Mid PM, Mid,
Sat PM, Mid,
Sat PM, Mid,
Sat PM, Mid,
Sat PM, Mid,
Sat SB AM AM AM AM AM AM 17 Vestal Pkwy/Rte 26 NB
Ramps WBL - - - PM PM PM
12 Vestal Pkwy/Sycamore/Rano
EBL - - - PM PM PM
WBT - - - PM PM PM 10 Vestal Pkwy/Jensen Rd SB Mid - - PM PM PM, Mid
43

Vestal Corridor Study Final Report – Executive Summary Sear-Brown
ID #
Intersection
Move
-ment
Existing
2006 Low
2006 High
2026 Low
2026 High
2026 High Retail
8 Vestal Pkwy/Bunn Hill Rd
WBT - - PM PM PM PM
NBL - PM PM PM PM PM SBL - - PM PM PM PM Vestal Pkwy/Route 201
Interchange
7 Route 201 SB off-ramp to Vestal Parkway WB
- Sat PM, Sat PM, Sat PM, Sat PM, Sat
4 Vestal Pkwy/Murray Hill SBL - - - PM PM PM 21 Vestal Rd/Main St WB PM PM PM PM, Sat PM, Mid,
Sat PM, Mid,
Sat NBT - - PM PM PM PM SBL - - - PM, Sat PM, Sat PM, Sat 23 Vestal Rd/Oak St NB - - - PM PM, Sat AM, PM,
Sat SBL AM, PM,
Sat AM, PM, Mid, Sat
AM, PM, Mid, Sat
AM, PM, Mid, Sat
AM, PM, Mid, Sat
AM, PM, Mid, Sat
SBTR - - - - PM PM 25 Vestal Rd/Sycamore Rd WBL PM, Sat PM, Sat PM, Mid,
Sat PM, Mid,
Sat PM, Mid,
Sat PM, Mid,
Sat NBL - PM PM PM PM PM, Mid 26 Vestal Rd/Prentice Rd SB - - PM, Sat PM, Mid,
Sat PM, Mid,
Sat PM, Mid,
Sat 27 Vestal Rd/Jensen Rd NB Mid PM, Mid,
Sat AM, PM, Mid, Sat
AM, PM, Mid, Sat
AM, PM, Mid, Sat
AM, PM, Mid, Sat
28 Vestal Rd/Commerce Rd SB PM, Mid PM, Mid, Sat
AM, PM, Mid, Sat
AM, PM, Mid, Sat
AM, PM, Mid, Sat
AM, PM, Mid, Sat
29 Vestal Rd/Gates Rd EBLT - - - - - PM 30 Vestal Rd/Bunn Hill Rd NBL PM, Mid,
Sat AM, PM, Mid, Sat
AM, PM, Mid, Sat
AM, PM, Mid, Sat
AM, PM, Mid, Sat
AM, PM, Mid, Sat
31 Vestal Rd/Rte 201 Off-ramp
SBL PM AM, PM, Mid
AM, PM, Mid, Sat
AM, PM, Mid, Sat
AM, PM, Mid, Sat
AM, PM, Mid, Sat
SBR PM, Sat PM, Mid, Sat
PM, Mid, Sat
PM, Mid, Sat
PM, Mid, Sat
AM, PM, Mid, Sat
PAVEMENT DEFICIENCIES There will be a need to address the fair pavement conditions on Vestal Road (Ideal Terrace to African Road) (identified on Figure 9, Pavement, Structural, and Design Deficiencies). RR CROSSINGS DEFICIENCIES There are no at-grade railroad crossings along primary roadways in the study area. NON-STANDARD FEATURES Non-standard features have been identified in Figure 9 and are summarized in Tables 6 and 7, presented earlier in this Executive Summary.
44

Vestal Corridor Study Final Report – Executive Summary Sear-Brown
STRUCTURAL DEFICIENCIES There will be a need to address the minor structural deterioration of the bridges noted below and shown in Figure 9. The level of deterioration is based on the overall condition rating:
Minor Deterioration • Route 434 under Route 26 (BIN 1012999) • Route 434 under Route 201 (BIN 1013009) • Vestal Road under Route 201 (BIN 1014349) • Vestal Road under NS railroad (BIN 7703184) PEDESTRIAN CONSIDERATIONS The majority of the pedestrian facilities in the study area are located in the vicinity of the mall and shopping plazas, but these facilities do not connect to each other, thereby limiting their usefulness. The concentration of retail uses, restaurants and convenience stores along the Vestal Parkway creates a natural “draw” for travelers using all modes of transportation, including walkers and bicyclists. This normal demand is compounded by the high percentage of students in the area, the majority of whom do not have access to a car. Improved pedestrian facilities along and across the following roadway segments should be considered:
• Vestal Parkway – African Road to Vestal Plaza • Vestal Road – Main Street to Vestal Parkway • African Road – Vestal Road to Vestal Parkway • Sycamore Road – Vestal Road to Vestal Parkway • Jensen Road – Vestal Road to Vestal Parkway • Bunn Hill Road – Vestal Road to Vestal Parkway These locations are depicted on Figure 10, Bicycle and Pedestrian Deficiencies. BICYCLE CONSIDERATIONS Vestal Road is designated as New York State Bicycle Route 17 and Local Bike Route 2 but provides a varying shoulder width of one to five feet. Therefore, the designated bike route in the study area does not provide consistent space for bicyclists (either wide curb lanes or consistent width shoulders). As such, the need to accommodate bicycle travel exists along the following roadways:
• Vestal Road – Main Street to Route 434 • Vestal Parkway – Main Street to Vestal Avenue • Main Street – Vestal Road to Vestal Parkway These locations are depicted on Figure 10, Bicycle and Pedestrian Deficiencies. A multi-use trail (Vestal Rail Trail) was recommended in the Binghamton Metropolitan Greenway Study within the study area along the abandoned rail line, the sand & gravel mine, and the towpath of the former Chenango Canal. A segment of this trail that runs along the abandoned rail line between Main Street and African Road was scheduled to begin construction this year (2001). Connection to this trail also needs to be considered.
45

��
� ��
� �
�
�
� � �
�
� �
���
�
� �� � �
� � �� ��
� �����
��
���� ������
�
����
�
����
��
�������
���� ��
�
� � � � �
�
����
� ����
�� ��
��
�
� �� ��
��
�� ��
���� � ��
�� �� �� ���
����
���������
����� ��
����
��
�����
�
��
����
�����
����
�
����
�
�� ����
����
����
�����
�����������
����
����
����
�����
�������
�����
�����
�������
� ������������� ����
���� !"
����������������� ���������
� ������� ���������������� �� ��������������������� ��������������� ��������
#�$%&'��())*!()��%+!,-*�+)��.�9
����������*( ��/&0�1� %�& !��%)+2%+)&'
��3*2*� 2*�$
�
� � �
� ��
�
��
��
��� ���
� � �
�� �� ��������
��

��
� ��
� �
�
�
� � �
�
� �
���
�
� �� � �
� � �� ��
� ���
��
�� � �
� �
��
� ��
�� ��
�
��
� � �
��
���� �� ��
� � �� ����
��
��������
������ ��
��
���
��
�
����
���
��
�����
��
�
�� ����
����
����
�����
�����������
����
����
����
�����
����
�����
����
����
�����������
����
����
�����
�� ����
��
�� � �
� �
��
� ��
�� ��
�
��
� � �
��
���� �� ��
� � �� ����
��
��������
������ ��
��
���
��
�
����
���
��
�����
��
�
�� ����
�����������
����
����
�����
�����������
����
����
����
�����
� ������������� ����
�� �!"#�������������
��$%&'��())*"()��%+",-* +)��.�10
��������� *(!��/�"�$%)*&!�&!"��*0,0'�
��1*0*�!0*�$

Vestal Corridor Study Final Report – Executive Summary Sear-Brown
TRANSIT CONSIDERATIONS
Transit service in the study area is provided by Broome County Transit (BC Transit) and the Off Campus College Transport, Inc. (OCCT). The most common responses to the transportation user’s survey were focused on the need to extend transit service hours, add more outlying destinations and improve service reliability. In general, the transit needs are summarized as follows:
• Increase the number of bus stops to include major retail facilities along Vestal Parkway • Provide connectivity from bus stops to desired destinations through sidewalks and safe
roadway crossings • Improve on-time performance and reliability on all routes • Expand bus service to include Sunday routes • Increase the frequency of runs on high demand routes. In the Binghamton Metropolitan Transportation Study’s (BMTS) 2001 –2002 Unified Planning Work Program (UPWP), they will be investigating the opportunities for integrating the bus service operated by the OCCT with the BC Transit system XXI. DEVELOPMENT OF ALTERNATIVES The alternatives for this project were developed in response to five primary categories of existing and future deficiencies: capacity, truck traffic, safety, pedestrian/bicycle and transit/ miscellaneous. In addition, pavement, non-standard features, and structural deficiencies are also areas that will be addressed with the alternatives for this project. Community suggestions for potential alternatives was obtained at four Study Advisory Group meetings held on October 18, 2000, May 22, 2001, November 20, 2001, and June 27, 2002, plus at a public meeting, held on November 13, 2000. In addition, e-mail and comment forms were received throughout the study, which presented suggested solutions. The alternatives are presented in this report at a planning level of detail. As such, further detailed engineering/design will be required to identify exact site-related features of specific roadway/facility improvements. In order to support existing and projected growth in traffic, a series of transportation and supporting facility improvements have been identified. In general, major alternatives were developed to address capacity deficiencies, with supporting improvements to address the other four deficiency categories. It should be emphasized that future needs, and corresponding improvement alternatives, were developed for forecast conditions based on the projected land uses scenarios. Future land use decisions can severely impact the future congestion within this project area regardless of which alternatives are constructed. Both long-term (generally the major alternatives) and short-term solutions are considered in this report. The Recommendation Section identifies the preferred long-term solution, plus short-term solutions that will address specific needs, and can be implemented in the near-term future.
48

Vestal Corridor Study Final Report – Executive Summary Sear-Brown
XXII. LIST OF POTENTIAL ALTERNATIVES The following presents the list of alternatives under consideration, organized by the category of deficiency it addresses. The specific problem or needs each alternative solves is summarized in Table 18. Many of the identified problems are rooted in the capacity deficiencies along Vestal Parkway, and truck impacts along Vestal Road. As such, system-wide capacity alternatives were developed first, as they would have significant effects on both the capacity and truck issues. These are major improvement alternatives that would require substantial funding, and would result in widespread changes to travel patterns and arterial operations in the study area.
A. Capacity Improvements Null Alternative – No major improvements. Only relatively minor capacity improvements, such as auxiliary turn lanes, signal improvements, and improved channelization, are included under the null alternative.
System-Wide Alternatives
These improvements represent the major alternatives, as mentioned above. For each, additional lesser improvements would be needed to make the system function at satisfactory levels of service. These lesser improvements are listed below each primary alternative.
1. Bridge across the Susquehanna River between Towns of Endwell and Vestal • New 4-lane bridge across the river with access to Route 17 and 17C as well as Vestal Road
and Vestal Parkway. • Closure of Route 17 (Exit 68) ramps to Vestal Road (also considered as a stand-alone
improvement for Alternative 7). • Upgrade African Road and Sycamore Road from 3 lanes each to 5 lanes each. • Upgrade Vestal Road from 2 lanes to 4 lanes between African and Sycamore Roads. • Individual intersection improvements, as necessary (noted in the Final Report).
2. Bridge across Susquehanna, with the closure of Route 201 access to Vestal Road • Same improvements noted under Alternative 1. • Closure of Route 201 ramps at Vestal Road in order to remove truck traffic from this portion
of Vestal Road (Also considered as a stand-alone alternative improvement for Alternative 8) • Individual intersection improvements, as necessary (noted in the Final Report). There are various sub-alternatives available for Alternatives 1 and 2. These are described later in this report. 3. Additional through lanes on Vestal Parkway • Add one additional lane in each direction through all intersections on Vestal Parkway. • Individual intersection improvements, as necessary (noted in the Final Report).
This alternative includes replacing the Route 201 and Route 26 bridges in order to accommodate the additional lanes. Figure 11 illustrates Alternative 3. Sub-alternative 3A adds one through lane in the westbound direction only on Vestal Parkway from Route 201 to African Road.
49

Vestal Corridor Study Final Report – Executive Summary Sear-Brown
4. Bridge across Susquehanna and additional through lanes on Vestal Parkway • Combination of Alternatives 2 and 3. • Individual intersection improvements, as necessary (noted in the Final Report).
Location-Specific Alternatives Other alternatives were developed to address identified capacity needs at specific locations. These can be implemented in conjunction with any of the system-wide alternatives (1-4). 5. Direct Route 201 access from Binghamton University Direct access to Binghamton University from/to Route 201 was discussed as an option to remove some traffic from Vestal Parkway between Bunn Hill Road and Glenn G. Bartle Drive. A review of access to Binghamton University reveals that the morning peak traffic can generally enter the site from Vestal Parkway and Route 201 without congestion. Traffic exiting the campus in the afternoon/evening and during special events causes the most congestion in the Vestal Parkway/Route 201 area. These peaks don’t generally occur during the Vestal Parkway peak periods. Additionally, recent development on the SUNY campus limits the options for provided full access (entering and exiting) from/to Route 201. Based on these facts, three alternatives were considered which provide one-way exiting access from Binghamton University to Route 201 northbound. Each alternative includes adding an additional lane to the Route 201 on-ramp and widening the bridge over Vestal Parkway to continue that lane. The new and existing roadway will merge on the tangent portion of the ramp.
• Sub-alternative A includes a connection from the SUNY Bunn Hill Access, approximately 200 feet south of the Bunn Hill Road intersection, to Route 201 northbound ramp, south of Vestal Parkway.
• Sub-alternative B provides a connection to the parking lot area on the northwest side of the campus to Route 201, traveling on the west side of the Field House.
• Sub-alternative C parallels the existing Vestal Parkway eastbound on-ramp to northbound Route 201, following adjacent to Bunn Hill Road, then connecting with Bunn Hill Access approximately 200 feet south of the Bunn Hill Road intersection.
Figures 12, 13, and 14 show the three SUNY/Route 201 access sub-alternatives. This alternative will remove traffic from Vestal Parkway, but not enough to change the additional intersection improvements that were identified for the Primary Alternatives, except that a northbound right turn lane at Vestal Parkway/Bunn Hill Road may no longer be needed. 6. Add jughandles to Vestal Parkway to eliminate left and u-turns. This alternative involves constructing jughandles at the majority of the signalized intersections along Vestal Parkway. The jughandles require all left and u-turning traffic to turn right onto the jughandle, which brings the traffic to the side street, where the traffic turns left to reach the Vestal Parkway intersection, then can turn left or proceed straight through the intersection to their desired route. The elimination of left turns on Vestal Parkway would reduce the number of phases needed for the traffic signal and may improve the progression of traffic on Vestal Parkway.
50


Vestal Corridor Study Final Report – Executive Summary Sear-Brown
New Bridge Sub-Alternatives
Under Alternatives 1 and 2, the major improvement is a new bridge across the Susquehanna River between the Towns of Endwell and Vestal. There are several bridge sub-alternatives to Alternatives 1 and 2 that were developed, investigated and compared. These bridge sub-alternatives vary in:
• •
•
• • •
Connection location on the south side of the river; Type of interchange connections with Route 17 and Route 17C on the north side of the river; and, Type of connection with Vestal Road.
Two potential connection locations were considered on the south side of the river - African Road or Sycamore Road. Various sub-alternatives considered different types of interchanges to Route 17 and 17C, including:
• Diamond Interchange at Route 17; • Single Point Urban Interchange (SPUI) Interchange at Route 17; • Cloverleaf Interchange at Route 17; • 3-Leg Directional Interchange at Route 17; • Trumpet Interchange at Route 17; • Skewed Diamond Interchange at Route 17; • Diamond Interchange at Route 17 with C-D Connector Road (necessary due to the close
proximity of an eastbound exit-ramp connection to Route 17C (ramp spacing is too close)); • At-grade access at Route 17C; • No direct access to Route 17C (not feasible with some interchange configurations); • Various locations (Hooper Road, different points along Route 17).
There are three Vestal Road connection options that could apply to any of the sub-alternatives:
Grade separation with a full diamond interchange; Grade separation with a half diamond interchange on the northern side of Vestal Road; At-grade access.
Each of the sub-alternatives, plus the Vestal Road connection options, were conceptually evaluated from a design, general impact and cost perspective, including the northern interchanges with 17 and 17C. However, the interchanges on the north side of the river were not analyzed from a traffic perspective, since the focus of this project is on the Vestal Road and Vestal Parkway corridors (traffic data was not collected on the north side). If one of the bridge alternatives is progressed, a more detailed study of the bridge will be recommended to determine the full impacts on both the north and south sides of the river. B. Truck Diversions from Vestal Road Based on the truck travel survey and a license plate survey completed for this study, Route 26 and Route 201 are the major truck routes used to enter the study area. The major routes to exit the study area include Route 17 at Vestal Road and Route 201. Based on the license plate
55

Vestal Corridor Study Final Report – Executive Summary Sear-Brown
survey, 25% of trucks entered Vestal Road from Route 201, 30% exited at Route 201 and 18% exited at Route 17 westbound. Some of the major alternative presented in the previous section will significantly divert trucks from some critical roadway sections:
Alternative 1, 2, and 4 - The closure of Route 17 westbound on-ramp (Exit 68) removes most trucks from the residential portion of Vestal Road. The eastbound off-ramp currently prohibits trucks.
Alternative 2 and 4 - The closure of Route 201 access to Vestal Road removes most truck traffic from Vestal Road between Commerce Road and Vestal Parkway. The construction of a new bridge across the Susquehanna River will divert the majority of Vestal Road destined trucks from Route 26 and Route 201 by providing a more direct route to their destination. The majority of trucking businesses are located in the vicinity of Vestal Road between Sycamore Road and Commerce Road. Additional alternatives considered to remove truck traffic from Vestal Road include:
7. Closure of Route 17 (Exit 68) ramps to Vestal Road (without system-wide major improvements) Closure of Route 17 (Exit 68) westbound on-ramp from Vestal Road removes trucks and cars from the residential portion of Vestal Road. The eastbound off-ramp already prohibits trucks and will result in a decrease of overall traffic volumes on Vestal Road in this area with its closure. The Twin Orchard neighborhood will see an overall decrease in traffic volumes along Vestal Road. Without additional access to Vestal Road from the north, trucks and cars will use Vestal Parkway to the most convenient crossover road and then travel along Vestal Road.
8. Closure of Route 201 ramps to Vestal Road (without system-wide major improvements) Closure of Route 201 ramps removes trucks and cars from Vestal Road between Commerce Road and Vestal Parkway. Without additional access to Vestal Road from the north, trucks and cars will use Vestal Parkway to the most convenient crossover road and then travel along Vestal Road. This reduces the overall traffic in the Willow Point neighborhood. To further limit the truck routes, all non-local truck traffic on Vestal Road east of Commerce Road should be restricted.
Similar to Alternatives Null and 1-4, intersection improvements necessary for Alternatives 7 and 8 to provide satisfactory traffic operations were identified and are noted in the Final Report. C. Safety Improvements Based on the intersections identified with safety deficiencies, the primary alternatives (Null and 1 – 4) and their associated improvements were reviewed to determine if the accident patterns could be reduced by the associated improvements. Each intersection identified with a safety deficiency is noted below, along with a summary of how each alternative will address those deficiencies. If other improvements are needed to address the deficiency, they are noted below.
56

Vestal Corridor Study Final Report – Executive Summary Sear-Brown
Vestal Parkway & Main Street • Null – Intersection capacity improvements do not address safety deficiencies. • Alternatives 1 & 2 will reduce traffic volumes on Vestal Parkway in this area, thereby
resulting in a decrease in the predominately east-west rear-end accidents that occur at this location as a result of congestion.
• Alternative 3 & 4 will provide additional capacity on Vestal Parkway with the additional through lanes and will reduce overall congestion, which will reduce the number of rear-end accidents that occur at this intersection
Vestal Parkway & Route 26 Northbound Ramp • Null – Intersection capacity improvements do not address safety deficiencies. • Alternatives 1 & 2 will reduce traffic volumes on Vestal Parkway in this area, thereby
resulting in a decrease in the predominately eastbound rear-end accidents that occur at this location as a result of congestion.
• Alternative 3 & 4 will provide additional capacity on Vestal Parkway with the additional through lanes and will reduce overall congestion, which will reduce the number of rear-end accidents that occur at this intersection
Vestal Parkway & Sycamore Road/Rano Boulevard • Null – Intersection capacity improvements do not address safety deficiencies. • Alternatives 1 & 2 will reduce traffic volumes on Vestal Parkway in this area, thereby
resulting in a decrease in the predominately east-west rear-end accidents that occur at this location as a result of congestion.
• Alternative 3 & 4 will provide additional capacity on Vestal Parkway with the additional through lanes and will reduce overall congestion, which will reduce the number of rear-end accidents that occur at this intersection.
Vestal Parkway & Parkway Plaza • Null – Intersection capacity improvements do not address safety deficiencies. • Alternatives 1 & 2 will reduce traffic volumes on Vestal Parkway in this area, thereby
resulting in a decrease in the predominately westbound rear-end accidents that occur at this location as a result of congestion.
• Alternatives 3 & 4 will provide additional capacity on Vestal Parkway with the additional through lanes and will reduce overall congestion, which will reduce the number of rear-end accidents that occur at this intersection.
Vestal Parkway & Jensen Road • Null – Intersection capacity improvements do not address safety deficiencies. • Alternatives 1 & 2 will reduce traffic volumes on Vestal Parkway in this area, thereby
resulting in a decrease in the predominately east-west rear-end accidents that occur at this location as a result of congestion.
• Alternatives 3 & 4 will provide additional capacity on Vestal Parkway with the additional through lanes and will reduce overall congestion, which will reduce the number of rear-end accidents that occur at this intersection
57

Vestal Corridor Study Final Report – Executive Summary Sear-Brown
Vestal Parkway & Bunn Hill Road • •
•
•
•
•
•
•
Null – Intersection capacity improvements do not address safety deficiencies. Alternative 1 & 2 will reduce traffic volumes on Vestal Parkway in this area, thereby resulting in a decrease in the predominately east-west rear-end accidents that occur at this location as a result of congestion
• Alternatives 3 & 4 will provide additional capacity on Vestal Parkway with the additional through lanes and will reduce overall congestion, which will reduce the number of rear-end accidents that occur at this intersection
Vestal Parkway & Route 201 Off-Ramp
Null, Alternatives 1, 2, 3 & 4 – Signalizing the Route 201 southbound ramp (including pedestrian indications) at Vestal Parkway westbound will reduce accidents associated with Route 201 traffic attempting to merge onto Vestal Parkway.
Vestal Parkway Westbound & Route 201 On-Ramp • Null, Alternatives 1, 2, 3 & 4 – No deficiencies or accident patterns were identified. Vestal Parkway & Vestal Plaza Drive
Null – Intersection capacity improvements do not address safety deficiencies. Additional improvement - Install backplates on the signal heads in the eastbound
direction to increase the visibility of the red indication in order to reduce the right-angle accidents at this intersection.
Alternatives 1 & 2 will reduce traffic volumes on Vestal Parkway in this area, thereby resulting in a decrease in the predominately east-west rear-end accidents that occur at this location as a result of congestion. Additional improvement – Install backplates on the signal heads in the eastbound
direction to increase the visibility of the red indication in order to reduce the right-angle accidents at this intersection.
Alternative 3 & 4 will provide additional capacity on Vestal Parkway with the additional through lanes and will reduce overall congestion, which will reduce the number of rear-end accidents that occur at this intersection Additional improvement – Install backplates on the signal heads in the eastbound
direction to increase the visibility of the red indication in order to reduce the right-angle accidents at this intersection.
Vestal Road & Main Street
Null & Alternatives 1 to 4 – These alternatives include adding a northbound through lane which will increase the capacity in the north-south direction and may reduce the number of north-south rear-end accidents Additional improvement – Provide additional signs and pavement markings to warn
motorist that the inside southbound lane becomes a left turn only lane. This will help to reduce the overtaking accidents that occur at this intersection.
Vestal Road & Prentice Road
Null & Alternatives 1, 3, and 4 – These alternatives include adding a traffic signal at this location. This may reduce the rear-end and lost control accidents as a result of the horizontal
58

Vestal Corridor Study Final Report – Executive Summary Sear-Brown
and vertical curves, provided adequate signage is in place to alert motorists of the traffic signal. Additional improvement – Provide signal ahead signs to slow vehicles in this area.
Vestal Road & Jensen Road •
•
•
Null & Alternatives 1 to 4 – These alternatives include adding a traffic signal and a westbound left turn lane at this intersection. The westbound left turn lane will reduce the rear-end accidents that occur in the westbound direction. Additional improvement – Provide striping on the northbound approach to encourage
proper lane usage. This will reduce the confusion and the overtaking accidents that occur on this approach due to the lack of lane markings.
Vestal Road & Bunn Hill Road • Alternatives 1 and 3 – The addition of a traffic signal at Bunn Hill Road will reduce the
number of right angle accidents that occur at this intersection. • Null & Alternatives 2 & 4 – These alternatives include adding a traffic signal, which will
reduce the number of right angle accidents that occur at this intersection. Vestal Road & Route 201 Off Ramp • Null and Alternatives 1 – These alternatives include adding a traffic signal (including
pedestrian indications) at this location. The traffic signal may reduce the number of rear-end accidents that occur on the southbound ramp by providing a clear indication when vehicles may exit the ramp. Additionally, for Alternative 1, the new bridge will divert some traffic from the Route 201 ramps and will reduce the congestion on the off-ramp, thereby reducing the rear-end accidents caused by congestion. Additional improvement – Provide vehicle detectors on the ramp and a Variable Message
Sign on Route 201 to warn motorists when vehicles are queued back onto the Route 201 mainline.
• Alternatives 2 & 4 – These alternatives include the closure of the Route 201 ramps, therefore the intersection accidents at this location will be eliminated.
• Alternative 3 – This alternative provides additional capacity on Vestal Parkway which will divert some traffic from Vestal Road and the Route 201 off-ramp, thereby reducing the congestion on the ramp and the rear-end accidents that occur as a result of that congestion. It also includes adding a traffic signal (including pedestrian indications) at this location. The traffic signal may reduce the number of rear-end accidents that occur on the southbound ramp by providing a clear indication when vehicles may exit the ramp. Additional improvement – Provide vehicle detectors on the ramp and a Variable Message
Sign on Route 201 to warn motorists when vehicles are queued back onto the Route 201 mainline.
Vestal Road and Route 201 On Ramp
Null – None. NYSDOT is currently investigating this intersection and will make modifications if deemed beneficial with regard to safety at this intersection. Alternative 1 – The construction of a new bridge across the Susquehanna River will divert traffic from Route 201, thereby reducing the number of conflicts at the on-ramp. NYSDOT
59

Vestal Corridor Study Final Report – Executive Summary Sear-Brown
is currently reviewing this intersection and will be implementing improvements with regard to safety at this intersection.
• Alternatives 2 & 4 – These alternatives include the closure of the Route 201 ramps, therefore the intersection accidents at this location will be eliminated.
• Alternative 3 – This alternative provides additional capacity on Vestal Parkway which will divert some traffic from Vestal Road and the Route 201 on-ramp, thereby reducing the number of left turn conflicts on the ramp and the accidents that occur as a result of these conflicts. NYSDOT is currently reviewing this intersection and will be implementing improvements with regard to safety at this intersection.
Vestal Road & Murray Hill Road • Null, Alternatives 1, 2, 3 & 4 – No deficiencies or accident patterns were identified.
Railroad Bridge on Vestal Road between Jensen and Prentice Road
The Railroad Bridge has been identified as a safety deficiency along Vestal Road. If the bridge remains for rail or other purposes, the bridge could be reconstructed to increase vertical clearance and improve roadway sight distance. D. Pedestrian/Bicycle Improvements Both system-wide and location-specific pedestrian and bicycle needs were identified. The following improvements were considered: System-wide Improvements
9. Add sidewalk facilities, options include: a. Vestal Parkway b. Vestal Road c. Extend Rail Trail 10. Provide adequate shoulders to accommodate bicycles, options include: a. Vestal Parkway b. Vestal Road c. Main Street d. Parallel path to Rail Trail
Localized Improvements
11. Add sidewalk facilities, options include
a. African Road b. Sycamore Road c. Jensen Road d. Bunn Hill Road
60

Vestal Corridor Study Final Report – Executive Summary Sear-Brown
12. Provide adequate shoulders to accommodate bicycles, options include
a. Main Street b. African Road c. Sycamore Road d. Jensen Road e. Bunn Hill Road
13. Investigate restricting right turn on red movements to protect pedestrians, locations
could include:
a. Vestal Parkway/Airborne Avenue Northbound b. Vestal Parkway/African Road c. Vestal Parkway/Rano-Sycamore Road d. Vestal Parkway/Bunn Hill Road
These locations are based on recommendations noted in a report, dated June 10, 2002, prepared by Officer Scott Mullins of the Vestal Police Department.
14. Provide pedestrian/bicycle connections to the Vestal Rail Trail. Provide
sidewalks/pedestrian crossing on Main Street between Vestal Road and Vestal Parkway to provide access to the Rail Trail. Provide sidewalks on African Road to connect to other end of the trail (end of current project, trail will continue in the future). Provide pedestrian crosswalks/pedestrian signals at Vestal Parkway/Airborne Avenue.
15. Provide sidewalks/improved pedestrian crossings at intersections, options include:
a. High School area – provide sidewalks on Vestal Parkway to connect Main Street and Clayton Ave
b. University area – provide crosswalks/pedestrian signals at Glenn G. Bartle and Murray Hill Road on Vestal Parkway and at the Press parking lot, Bunn Hill Road, and Murray Hill Road on Vestal Road. Improve lighting at Bunn Hill/Vestal Parkway intersection.
c. Town Square Mall Area – provide pedestrian pushbuttons/signals on Rano Boulevard/Sycamore Road (west side of street)
d. Bunn Hill Road – Provide pedestrian refuge islands, audible pedestrian signals, add pedestrian crossing warning signs/devices, add colored/textured pavement
e. Vestal Parkway/Jensen Road – provide crosswalks/pedestrian signals at intersection. 16. Construct a pedestrian facility from Binghamton University at Glenn G. Bartle Road,
north across the Susquehanna River on the south side of Route 201, sub-alternatives include: Sub-Alternative A - This sub-alternative parallels Vestal Parkway and Route 201 and includes widening the existing Route 201 bridge across the Susquehanna River. The crossing over Vestal Parkway and Vestal Road will be bridged so there are no at-grade crossings. A switchback ramping system that meets ADA requirements will be provided on each side of both the Vestal Parkway and Vestal Road bridges.
Sub-Alternative B - This sub-alternative includes a similar alignment but is 500 to 1,000 feet east of Route 201 and includes a separate bridge crossing of the Susquehanna River. The
61

Vestal Corridor Study Final Report – Executive Summary Sear-Brown
crossing over Vestal Parkway and Vestal Road will include an ADA ramping system and a bridge.
Figure 15 identifies existing pedestrian facilities and those proposed in the Alternatives 9, 11, and 15. Figures 16 and 17 show the two pedestrian facility options for Alternative 16. E. Transit / Miscellaneous Improvements In order to promote transit use within this corridor, several alternatives were developed to help make the existing bus system more attractive to travelers: 17. Include the Shoppes at Vestal (corner of African and Vestal Parkway) on applicable
bus routes. 18. Improve on-time performance and reliability of all routes. 19. Provide bus shelters at all major retail bus stops along Vestal Parkway and provide
pedestrian facilities to connect bus shelters and Vestal Parkway Table 18 presents the alternatives identified and needs addressed by those alternatives. XXIII. EVALUATION PROCESS The following two-step evaluation process was developed to assess the potential alternatives. A. Phase I: Preliminary Screening The main goal of this phase was to perform a “fatal-flaw” analysis of the list of ideas to eliminate those that are infeasible, those with obvious excessive impacts or with limited benefits. No numerical analysis was performed in Phase I. Alternatives that were not eliminated in Phase I were progressed to Phase II. B. Phase II: Planning Level Evaluation Each of the primary alternatives progressed from Phase I was examined at a planning level to determine its cost, social/environmental, engineering, and traffic related effects. These assessments are presented in the following section.
62


Vestal Corridor Study Final Report – Executive Summary Sear-Brown
Table 18 - Alternatives and Needs Addressed
NEEDS ADDRESSED ALTERNATIVES
Capacity
Safety
Pavement/Structural
Non- Standard Features
Pedestrian/ Bicycle
Transit
A. Capacity Improvements 1. Construct a bridge across the Susquehanna River between
Towns of Endwell and Vestal (closes Exit 68 from Route 17) X X
2. Construct a bridge and close Route 201 ramps to Vestal Road X X 3. Add an additional through lane on Vestal Parkway X X 4. Alternatives 2 and 3 combined X X 5. Direct access from SUNY to Route 201 X X 6. Add jughandles to Vestal Parkway X X B. Truck Diversion from Vestal Road 7. Close Route 17 ramps (Exit 68) to Vestal Road X X 8. Close Route 201 ramps to Vestal Road X X C. Safety All safety alternatives considered X X X D. Pedestrian/Bicycle 9. Add sidewalk facilities X X 10. Provide adequate shoulders for bicycles X X 11. Add sidewalk facilities X X 12. Provide adequate shoulders for bicycles X X 13. Investigate restricting right turn on red at identified locations X X 14. Provide ped/bicycle connections to the Vestal Rail Trail. X X 15. Provide sidewalks/improved ped. crossings at intersections. X X 16. Construct a pedestrian facility from Binghamton University,
across Susquehanna River, on the south side of Route 201. X X
E. Transit 17. Include the Shoppes at Vestal (corner of African and Vestal
Parkway) on applicable bus routes. X
18. Improve on-time performance and reliability of all routes. X 19. Provide bus shelters at all major retail bus stops along Vestal
Pkwy. Connect bus shelters to Vestal Pkwy. X X
66

Vestal Corridor Study Final Report – Executive Summary Sear-Brown
XXIV. EVALUATION OF ALTERNATIVES A. Improvements Eliminated in Phase I The following alternatives were eliminated during the preliminary Phase 1 “fatal-flaw” screening process:
• Alt 5, Sub-Alternative B – Binghamton University Exit Drive – Through Campus.
Reason for Elimination: This alignment would have a negative impact on the newly constructed Field House and general pedestrian and vehicular circulation in this area. The Exit Drive would need to be grade separated over the Field House loading dock service road, which would add considerable cost. Pedestrian access between the westerly parking area and the Gym and the Field House would be limited or unsafe as well as pedestrian traffic between the Field House and the tennis courts and the baseball field. Parking spaces would need to be reconfigured and some parking would be lost. For these reasons, this sub-alternative was eliminated from further consideration.
• Alt 6 – Add jughandles to Vestal Parkway at the signalized intersections. Reason for Elimination: Construction of jughandles along Vestal Parkway would require extensive right-of-way. There are eighteen signalized intersections along Vestal Parkway in the study area. Nine of these intersections are four-way intersections, which will require jughandles on both sides of the road. Therefore, a total of 27 jughandles will be needed to address all the left/u-turns that currently exist on the Parkway. Jughandles require extensive of right-of-way and must be set back on the side street far enough from the main intersection so that the side street can operate properly without being affected by queuing traffic. Due to the developed nature of Vestal Parkway, many properties and businesses would need to be taken in order to construct the jughandles, therefore this is not considered a viable alternative.
B. Improvements Progressed to Phase II The alternatives progressed to Phase II address the following areas of concern, as described in the previous technical memoranda:
• Capacity • Safety • Pavement • Non-Standard Features • Pedestrian Accommodations • Bicycle Accommodations • Transit Accommodations As discussed earlier, each of the alternatives progressed from Phase I was examined at a planning level to determine its cost, social/environmental, engineering, and traffic related effects. These assessments are discussed in the Final Document and are shown qualitatively in the Evaluation Matrix, Table 19. In some cases, more than one best solution was apparent, so different variations of the alternative were considered. The alternative variations were compared in the Evaluation Matrix in Table 19.
67


TABLE 20 +++ Benefit - Slight ImpactEVALUATION MATRIX - SUB-ALTERNATIVESVESTAL CORRIDOR STUDY + Slight/Moderate Benefit -- Moderate ImpactBenefit/Impact rated relative to other sub-alternatives
No Impact/Not Applicable --- High Impact
Construct. Environ. Right of Construct- Constr. Mainten. Access CapacityPossible Solution Cost Effects Way ability Impacts Costs
Alternatives 1, 2, 4 - Sub-Alternatives for Bridge at African Road Sub-Alternative A Diamond Interchange at Route 17/ At-grade access to Route 17C - -- - - - -- +++Sub-Alternative B SPUI Interchange at Route 17/ At-grade access to Route 17C -- -- -- --- - --- +++ +Sub-Alternative C Cloverleaf Interchange at Route 17/ At-grade access to Route 17C -- - --- -- - -- +++ +++Sub-Alternative D
3-Leg Directional Interchange at Route 17/ No direct access to Route 17C --- - --- --- - -- + +++Sub-Alternative E Trumpet Interchange at Route 17/ No direct access to Route 17C --- - -- -- - -- + +++Vestal Road Connection for each African Road Sub-AlternativeOption 1 - Full Diamond Interchange -- --- --- -- --- --- +++ +++Option 2 - Half Diamond Interchange -- --- -- -- --- -- + +++Option 3 - At-grade Connection - - - - - - +++ -Alternatives 1, 2, 4 - Sub-Alternatives for Bridge at Sycamore RoadSub-Alternative A
Skewed Diamond Interchange at Route 17/ No direct access to Route 17C - -- - - - -- +Sub-Alternative B
Diamond Interchange at Route 17 w/C-D Connector Road / No direct access to Route 17C - -- -- -- -- -- +
Sub-Alternative C3-Leg Directional Interchange at Route 17 w/C-D Connector Road / No direct access to Route 17C -- - --- --- -- -- + +++
Vestal Road Connection for each Sycamore Road Sub-AlternativeOption 1 - Full Diamond Interchange -- --- --- -- --- --- +++ +++Option 2 - Half Diamond Interchange -- --- -- -- --- -- + +++Option 3 - At-grade Connection - - - - - - +++ -Alternative 5 - Sub-Alternatives for Route 201 access from SUNY BinghamtonSub-Alternative A
Bunn Hill Access Connection w/direct connection to Route 201 - - - - - + +Sub-Alternative C
Bunn Hill Access Connection w/connection to Route 201 paralleling Bunn Hill Road and Vestal Parkway -- - - - - + +
Alternative 16 - Sub-Alternatives for sidewalk from SUNY Binghamton to north of Susquehanna RiverSub-Alternative A
Widening existing Route 201 Bridge to cross Susquehanna River --- - - -- --- - +Sub-Alternative B
Building separate pedestrian bridge to cross Susquehanna River --- -- --- -- -- -- +

Vestal Corridor Study Sear-Brown
XXV. RECOMMENDATIONS Based on our assessment of each of the alternatives presented and evaluated in the corridor study, a set of recommended projects has been developed. The projects represent logical combinations of proposed alternatives that can be designed and constructed simultaneously. These projects are consistent with the overall study goals and have been categorized into short and long-term improvements. The short-term projects generally represent smaller, less complex improvements that can be applied to the existing roadway structure with relative ease. These projects can be implemented within the next five years and begin providing immediate benefits to the public. The long-term projects represent large-scale, capital improvement projects that will significantly alter the existing roadway system. In each case, more detailed scoping studies will be need to be prepared for these projects to fully define what will be included in the design. These projects will be considered for implementation in a 6-20 year time frame, subject to available funding and other project priorities. The proposed projects below are listed in a generalized priority order. Factors used to determine this prioritization include magnitude of need, the effectiveness in meeting the identified needs, and project cost. The estimated costs, where shown, were developed for comparison purposes only and are not necessarily inclusive of all of the alternative details, as they may not be known at this level of analysis. Short Term Improvement Projects 1. Vestal Parkway/Sycamore Road/Rano Boulevard (estimated construction cost: TBD)
Move the service road (located on the southeast corner of Rano Blvd.) to the south and move the northbound approach stop bar closer to the intersection. Relocate or redesign the electric transmission tower, if feasible. Adjust the grade on Sycamore Road to improve southbound visibility. Increasing turning movement capacity through improved signal timing or by constructing lane capacity.
2. Route 201 Off-Ramp to Vestal Parkway Westbound (estimated construction cost:
$200,000)
Signalize the Route 201 off-ramp to Vestal Parkway westbound (Vestal Parkway eastbound will remain free-flow). Add a second lane to the Route 201 off-ramp after the one lane diverge from Route 201 mainline to provide additional storage capacity.
3. Vestal Parkway Signal System (estimated construction cost: $1,500,000)
Install a PC-based closed-loop traffic signal system. Due to the present signal spacing, three separate subsystems are proposed, each with its own master controller. Upgrade controllers, cabinets, power, detectors, conduit and pullboxes. Install interconnect and interduct conduit fiber optic cable. Install modems, telephone drops, PC and office peripherals, plus the closed-loop software.
70

Vestal Corridor Study Sear-Brown
4. Vestal Parkway Pedestrian Improvements
Install high-visibility pedestrian crosswalks and countdown pedestrian signals at all signalized intersections from Murray Hill Road to Main Street, where they are not presently in place.
Construct sidewalks on the north side of Vestal Parkway from Bunn Hill Road to African Road (estimated construction cost: $230,000).
Construct sidewalks on the east side of Bunn Hill Road between Vestal Parkway and Vestal Road (estimated construction cost: $10,000).
Develop a comprehensive approach to pedestrian safety in the Binghamton University area from Glenn Bartle Dr to Campus Plaza. This may include a grade-separated crossing of Vestal Parkway if deemed necessary, as part of a comprehensive, connected sidewalk system, and restrictions of right-turn-on-red at Vestal Parkway/Bunn Hill Road.
Improve pedestrian access to the Vestal Rail Trail from African Road and from the Vestal Parkway/Airborne Avenue intersection by constructing sidewalks on African Road between Vestal Road and Vestal Parkway and better aligning the crosswalk and trail access at the Vestal Parkway/Airborne Avenue intersection.
Construct sidewalks on the south side of Vestal Parkway from Main Street to the Route 26 Southbound Ramp (estimated construction cost: $52,000).
5. Vestal Road/Route 201 Interchange
As part of the project to replace the Route 201 over Vestal Road bridge, lengthen the span to improve sight distance on Vestal Road through the interchange. Signalize the Vestal Road/Route 201 ramps to address the current problem of traffic on the off-ramp queuing onto the mainline. Include detection on the ramp to pre-empt the signal to give the green phase to ramp traffic until the queue is adequately cleared.
6. Transit Improvements (total estimated construction cost: $60,000)
Construct bus shelters and pedestrian connections between BC Transit bus stop locations and transit riders’ desired destinations: Include The Shoppes at Vestal on applicable bus routes. Vestal Road and Oak Street – bus shelter Vestal Road and African Road – bus shelters on both side of the road and sidewalks to
connect with sidewalks on African Road. Vestal Road, between Commerce Road and Jensen Road –bus shelter and a sidewalk
connection to Commerce Road. Bunn Hill Road, between Vestal Road and Vestal Parkway –bus shelter and connection to
the sidewalk on Bunn Hill Road 7. Binghamton University Egress Improvement
Construct a roadway to provide direct egress from the Binghamton University campus in the vicinity of the new field house to Route 201 northbound. If necessary, widen the Route 201 over Route 434 bridge deck as part of the bridge replacement project.
71

Vestal Corridor Study Sear-Brown
8. Close Exit 68 of Route 17
Exit 68 provides access from Route 17 eastbound to Vestal Road, and from Vestal Road to Route 17 westbound. This creates substantial traffic in the Twin Orchards neighborhood, but also provides residents with convenient access. A decision on closing the exit should be based primarily on neighborhood input.
Long Term Improvement Projects 1. Vestal Parkway Widening, African Road to Route 201 (estimated construction cost:
$3,450,000)
Add a third through lane to Vestal Parkway in the westbound direction only, starting at the Route 201 off-ramp to Vestal Parkway westbound and merging back to two lanes after the African Road intersection. Provide adequate shoulders to accommodate bicyclists within the widened section.
2. Construct a New Bridge Crossing Over the Susquehanna River (total estimated
construction cost: $25,000,000 - $40,000,000)
Construct a new four-lane bridge across the Susquehanna River between the Towns of Union and Vestal. The facility must provide direct access to Route 17, but may provide indirect access to Route 17C. The type of interchange with Route 17/Route 17C will be determined during the design phase, as will the connection location in Vestal (African Road or Sycamore Road). Characteristics and other improvements associated with this new bridge may include:
Widen African Road and/or Sycamore Road from 3 lanes each to 5 lanes. Widen Vestal Road from 2 lanes to 4 lanes between African and Sycamore Roads. Provide individual intersection improvements, as noted in Final Report to Vestal Road
and Vestal Parkway. Provide at-grade connections to Vestal Road and Vestal Parkway.
Because the bridge will offer improved access from Route 17 for trucks traveling to/from the industrial area on Vestal Road, consideration will be given to closing the Route 201 access to Vestal Road and the Route 17 (Exit 68) access to Vestal Road (if not already done).
3. Construct a Pedestrian Connection from Binghamton University Across the
Susquehanna River (estimated construction cost: $2,600,000)
This project consists of providing a continuous pedestrian connection from Binghamton University to the north side of the Susquehanna River with grade separation at Vestal Parkway and Vestal Road. It also provides for a separate pedestrian facility either on or separate from Route 201. The crossing over Vestal Parkway and Vestal Road will include a ramping and bridge system to comply with ADA.
4. Vestal Road Sidewalks (estimated construction cost: $1,200,000)
Construct a pedestrian sidewalk on the north and south side of Vestal Road from Main Street to Murray Hill Road. Providing sidewalks on both sides of the road, particularly in the residential areas, denotes the nature of the area, encouraging motorists to drive accordingly.
72