
final copy.pdf
218
RISK MANAGEMENT IN MICROFINACE INSTITUITION A dissertation submitted in partial fulfilment of the requirements for the award of the degree of MASTER OF BUSINESS ADMINISTRATION By SIRIPURAPU DEEPTHI Register No 1120243 Under the guidance of DR ANIRBAN GHATAK Institute of Management Christ University, Bangalore March 2013
-
Upload
deepti-siripurapu -
Category
Documents
-
view
101 -
download
8
Transcript of final copy.pdf
RISK MANAGEMENT IN MICROFINACE INSTITUITION
A dissertation submitted in partial fulfilment of the
requirements for the award of the degree of
MASTER OF BUSINESS ADMINISTRATION
By
SIRIPURAPU DEEPTHI
Register No 1120243
Under the guidance of
DR ANIRBAN GHATAK
Institute of Management
Christ University, Bangalore
March 2013

ii
DECLARATION
I, Siripurapu Deepthi, do hereby declare that the dissertation entitled Risk Management In
Microfinance Institutions. has been undertaken by me for the award of the degree of Master
of Business Administration. I have completed this study under the guidance of Prof. Anand
Aivalli, Associate Professor, Institute of Management, Christ University, Bangalore.
I also declare that this dissertation has not been submitted for the award of any degree,
diploma, associateship or fellowship or any other title in this University or any other
university.
Place: Bangalore (Name & Signature of the
Candidate)
Date: Siripurapu Deepthi
Register No 1120243
iii
CERTIFICATE
This is to certify that the dissertation submitted by Miss Siripurapuu Deepthi on the title
Risk Management In Microfinance Institutions is a record of research work done by him
during the academic year 2012 – 13 under my guidance and supervision in partial fulfillment
of degree of Master of Business Administration. This dissertation has not been submitted for
the award of any degree, diploma, associateship or fellowship or any other title in this
University or any other university.
Place: Bangalore (Name & Signature of the guide)
Date: Dr Anirban Ghatak

iv
ACKNOWLEDGEMENTS
I am indebted to many people who helped me accomplish this dissertation successfully.
First, I thank the Vice Chancellor Dr Fr Thomas C Matthew of Christ University for giving me the
opportunity to do my research.
I thank Prof. Ghadially Zoher, Associate Dean, Fr Thomas T V, Director, Prof. C K T
Chandrasekhara, Head-Administration, Dr S Jeevananda, Coordinator, Kengeri Campus and Prof T S
Ramachandran, Head-Finance of Christ University Institute of Management for their kind support.
I thank Dr Anirban Ghatak, for his support and guidance during the course of my research. I
remember him with much gratitude for his patience and motivation, but for which I could not have
submitted this work.
I thank my parents for their blessings and constant support, without which this dissertation would not
have seen the light of day.
Siripurapu Deepthi
Register No: 1120243
v
ABSTRACT:
Inherently there is a high risk with the MFI segment. The small, medium and even larger
MFI find it difficult to manage risk or predict the outcome of credit transactions. In Indian
one can find various types of models with in micro financing, such as NGOs, NBFIs, Rural
Banking, Credit Union, these legal entities have different credit risk based on their business
focus, hence it becomes difficult for them, to be able to predict the credit risk that will be
involved. In this dissertation, I have tried to build a estimation model which can be used by
Micro financing institution in India. This model will project the credit risk based on
parameter such as operational self-sufficiency, operational efficiency, write offs, liquidity,
type of micro financing institution.
Apart from that, I have tried to analyze the level of credit risk management of NBFIs in
Bangalore and Hyderabad. And found that all NBFIs have almost the same kind of credit
management in place apart from some exceptional NFBIs, which have concentrated on
management quality along with the MIS in place, good reporting standards, good loan
portfolio management and etc.

vi
TABLE OF CONTENTS
Declaration ii
Certificate iii
Acknowledgement iv
Abstract v
Table of Contents vi
List of Tables vii
List of Charts viii
Abbreviations viii
CHAPTER I
INTRODUCTION
1.1 BACKGROUND OF THE STUDY 1
1.2 PHASES OF MICROFINANCE 4
1.3 PROBLEM STATEMENT 7
1.4 NEED FOR THE STUDY 7
1.5 PURPOSE OF THE STUDY 7
CHAPTER II
LITERATURE REVIEW
2.1 INTRODUCTION 8
2.2 MAJOR RISKS IN MICROFINANCE 9
2.3 HOW THE REVIEW HAVE BEEN CONDUCTED 10
2.4 STUDIES DONE IN THIS AREA 10
2.5 CONCLUSIONS 45
vii
CHAPTER III
RESEARCH METHODOLOGY
3.1 INTRODUCTION 46
3.2 STATEMENT OF THE PROBLEM 46
3.3 THE MODEL 46
3.3.1 SAMPLING METHOD 50
3.3.2 DATA COLLECTION 50
3.4 THE REGRESSION MODEL 50
3.4.1 THE VARIABLES 50
3.4.2 HYPOTHESIS 50
3.4.3 REGRESSION MODEL 52
CHAPTER IV
INDUSTRY OVERVIEW
4.1 MICROFINANCE INDUSTRY 53
CHAPTER V
DATA ANALYSIS AND INTERPRETATION
5.1 INTRODUCTION 55
5.2 MORGAN STANLEY CREDIT RISK ASSESSMENT 55
5.2.1 THE MODEL 55
5.2.2 ANALYSIS OF PRIMARY DATA 59
5.2.2.1 RESPONDENTS PROFILE 59
5.2.2.2 DATA CONSOLIDATION AND ANALYSIS 59
5.2.2.3 THE CRONBACH'S ALPHA TEST 62
5.2.3 ANALYSIS OF SECONDARY DATA 63
viii
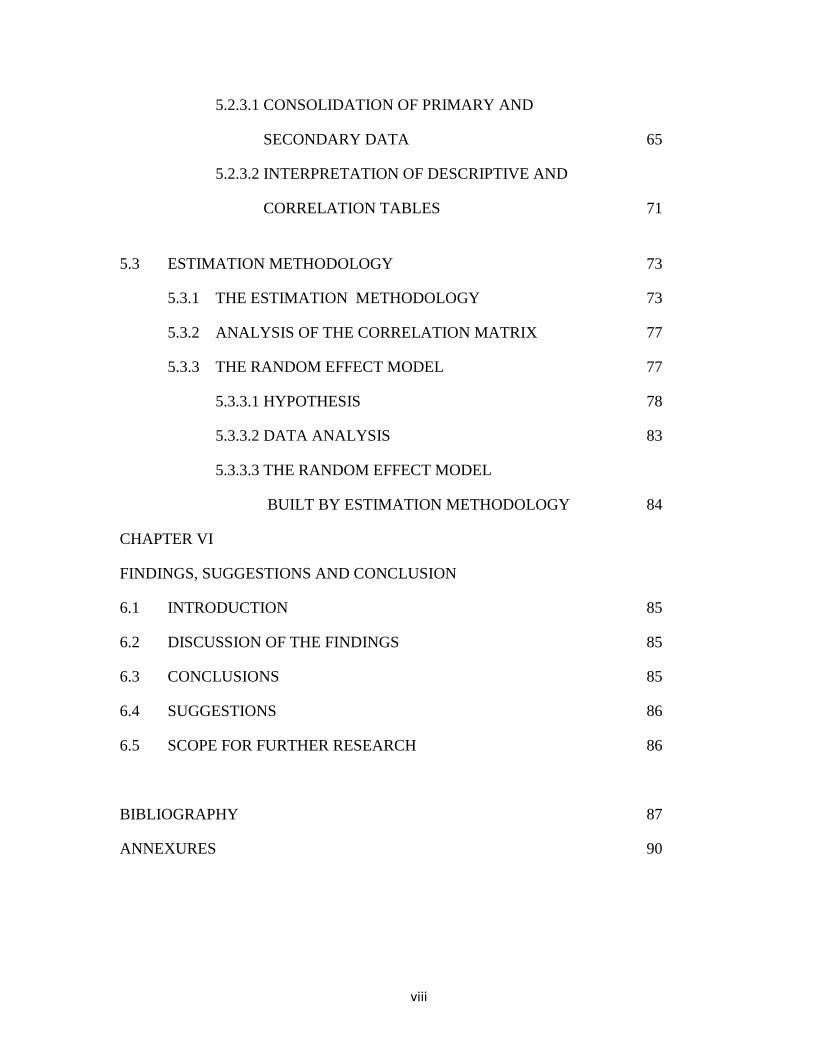
5.2.3.1 CONSOLIDATION OF PRIMARY AND
SECONDARY DATA 65
5.2.3.2 INTERPRETATION OF DESCRIPTIVE AND
CORRELATION TABLES 71
5.3 ESTIMATION METHODOLOGY 73
5.3.1 THE ESTIMATION METHODOLOGY 73
5.3.2 ANALYSIS OF THE CORRELATION MATRIX 77
5.3.3 THE RANDOM EFFECT MODEL 77
5.3.3.1 HYPOTHESIS 78
5.3.3.2 DATA ANALYSIS 83
5.3.3.3 THE RANDOM EFFECT MODEL
BUILT BY ESTIMATION METHODOLOGY 84
CHAPTER VI
FINDINGS, SUGGESTIONS AND CONCLUSION
6.1 INTRODUCTION 85
6.2 DISCUSSION OF THE FINDINGS 85
6.3 CONCLUSIONS 85
6.4 SUGGESTIONS 86
6.5 SCOPE FOR FURTHER RESEARCH 86
BIBLIOGRAPHY 87
ANNEXURES 90

ix
LIST OF TABLES
Table 1.1 Phases of microfinance 4
Table 1.2 Risk categories 5
Table 2.1 Major risks to microfinance institutions 9
Table 2.2 Classification of the microfinance industry 10
Table 2.3 Morgan Stanley credit assessment model 13
Table 2.4 Ratings of microfinance institutions 17
Table 2.5 Camel's indicators 24
Table 2.6 Operational features of different MFI models in India 36
Table 2.7 Cost Benefits Of Option 1 and Option 2 38
Table 2.8 Business Model For The Banks 39
Table 3.1 Morgan Stanley credit assessment model 46
Table 5.1 Morgan Stanley credit assessment model 55
Table 5.2 consolidated view of grades given to qualitative parameters 60
Table 5.3 The Cronbach's Alpha Test 62
Table 5.4 consolidated view of grades given to quantitative parameters 64
Table 5.5 Morgan Stanley Credit Risk Assessment 65
Table 5.6 Final grades given obtained from the 65
Morgan Stanley credit risk Assessment
Table 5.7 Descriptive of the Independent And Dependent Variable 67
Used to Determine The Morgan Stanley Credit Risk Assessment
Table 5.8 Pearson Correlation between the parameter used in
Morgan Stanley credit risk assessment 69
Table 5.9 Descriptive of the Independent And
Dependent Variable Used to Determine Estimation Model 74
x
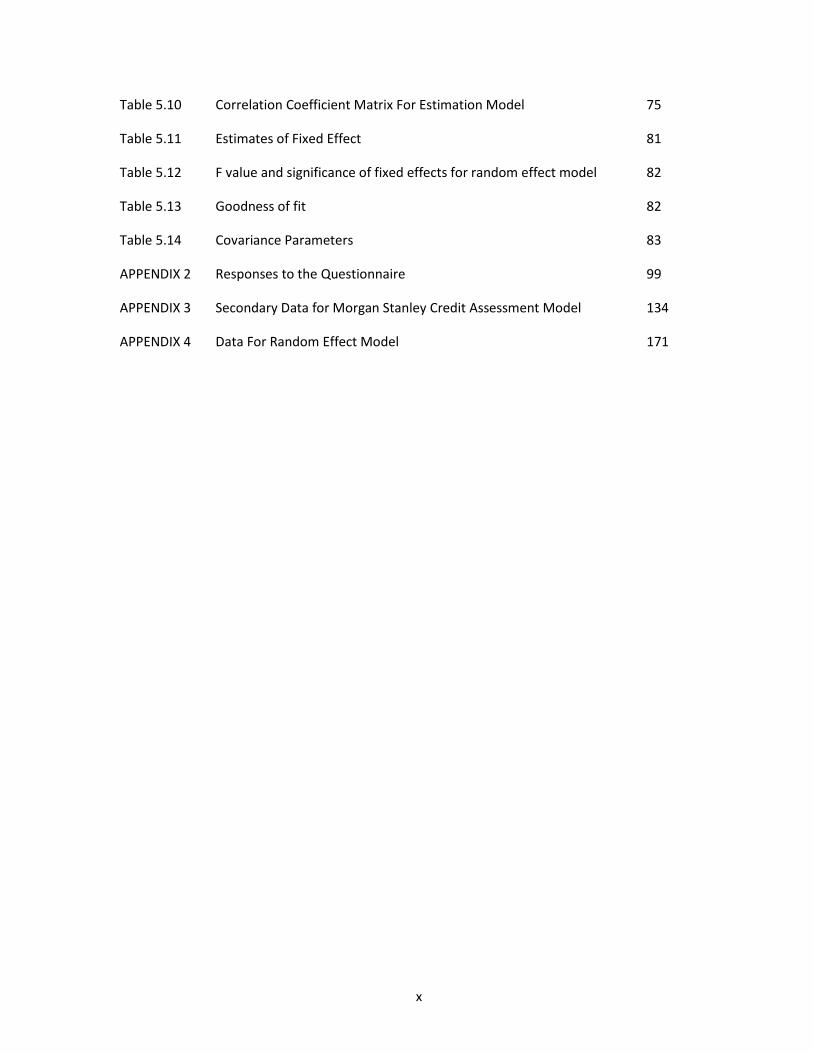
Table 5.10 Correlation Coefficient Matrix For Estimation Model 75
Table 5.11 Estimates of Fixed Effect 81
Table 5.12 F value and significance of fixed effects for random effect model 82
Table 5.13 Goodness of fit 82
Table 5.14 Covariance Parameters 83
APPENDIX 2 Responses to the Questionnaire 99
APPENDIX 3 Secondary Data for Morgan Stanley Credit Assessment Model 134
APPENDIX 4 Data For Random Effect Model 171

CHAPTER 1
INTRODUCTION
1.1 BACKGROUND OF THE STUDY :
According to “Fanie Jansen Van Vuuren in Risk management for microfinance institutions in
South Africa,” Risk is the probability that a decision will lead to a different outcome from the
one which is thought, due to the fact that the decisions are made under uncertainty with
imperfect information.
(Vijender, 2012)“Small-scale financial services primarily credit and savings, provided to
people who farm, fish or herd and adds that it refers to all types of financial services provided
to low-income households and enterprises.”
(Davis, 2006). ”Extension of small loans to entrepreneurs too poor to qualify for traditional
bank loans.”
The Reserve Bank of India defines, “microfinance is provision of thrift, credit and other
financial services and products of very small amount to the poor in rural, semi-urban and
urban areas for enabling them to raise their income levels and improve living standards.”
(khan) The practice of microfinance is not new and has probably been around for as long as
currency itself has. Informal credit and savings services probably formed around social
groups where the members got together to help one another as a community. Savings and
credit groups that have operated for centuries include the "susus" of Ghana, "chit funds" in
India, "tandas" in Mexico, "arisan" in Indonesia, "cheetu" in Sri Lanka, "tontines" in West
Africa, and "pasanaku" in Bolivia. One of the major concerns of microfinance is to increase
penetration so as to attain volumes and hence increase the number of people who can benefit.
Increasing penetration would raise the income levels of the people and hence improving the
living standards of people.
The interesting aspect of formal financial system is that, they can provide microcredit at low
interest rates and easy periodical installments, but this kind of facility is not available in
formal financial system. Microfinance operates mostly in an informal system since there
exist complex legal and operational procedures (such as collateral for microcredit, being able
to fulfill committee norms for working capital loans etc.). The problem gets complicated
2
when poor people apply for loans, since the poor people cannot inform the formal financial
system their creditworthiness or their requirement for savings, services, and loans.
Significant movement of microfinance has been seen in India. Most of the leading
practitioners of microfinance activities follow grameen model. Banks lean microcredit
through self-help groups(SHGs) , to local microfinance institutions that have contacts in
small villages, Business correspondence model.
RBI in its 2009-2010 annual report, talks about encouraging business correspondence model
for micro financing. “The lead banks were advised to provide banking services through a
banking outlet in every village having a population of over 2,000. The banking services could
be provided through any of the various forms of ICT-based models (such as BCs) and not
necessarily through a brick and mortar branch.” And hence the following were observes Out
of the 167 villages identified for transformation into „model villages‟, 160 are unbanked. A
total of 130 BCs/business facilitators (BFs) were appointed covering 111 villages, while ICT-
based financial inclusion was initiated in 88 villages by issue of 26,850 smart cards covering
59.6 per cent households in the villages. Of the 88 villages, 33 have achieved 100 per cent
BC-ICT based financial inclusion.
What services are provided by the micro financing in India?
Typically MFIs in India provide services such as- savings, credit and insurance.
The loans provided by the MFIs serve low income population in various ways: (comparison
of performance of microfinance institutions with commercial banks in India- prof zohra bi,
shyam lal dev pandey)
a) Loans for working capital
b) Alternatives the loans provided by money lenders
The major components of microfinance are
a) Deposits
b) Loans
c) Payment services

3
d) Money transfer
e) Insurance to the poor
From the reports submitted by RBI, sub-committee of central broad of directors of RBI who
were studying on the issues and concerns of MFI sector pointed out the following points
a) Out of the total loans outstanding of 45600 crores, under the Micro Financing sector at
the end out March 2010 , MFI segment accounted for about Ra 18344crores i.e. 40
percent. Also the incremental growth of advances is high
b) Hence there is a setback between SHG-bank linkage segment
c) The committee pointed out that the apart from interest rate, other incidental charges such
as processing free, interest free security deposits have hiked the effective interest rate
d) For larger MFI effective rates of interest calculated on the mean outstanding portfolio
during 2009-2010 and has ranges between 31 percent to 51 percent with an average of 35
percent. For smaller MFI the average interest rate was about 29 percent. The main
e) Problem identified was multiple lending, over financing and ghost borrowers. The
presence of ring leaders who acted as intermediaries between the MFI and the potential
customers.
f) The committee also noticed coercive methods of recovery of MFI , lack of grace period.
g) The committee pointed out that for larger MFIs the overhead costs as a percentage of
outstanding was higher that of smaller MFIs, hence smaller the MFI the efficient is the
operation.
h) Only 25% of the credit was used for income generating activities
Suggestions from the committee:
a) A new regulation act for NBFC-MFI
b) The minimum capital requirement of the NBFC- MFI should be enhanced from Rs 2
crores to Rs.15crores.
4
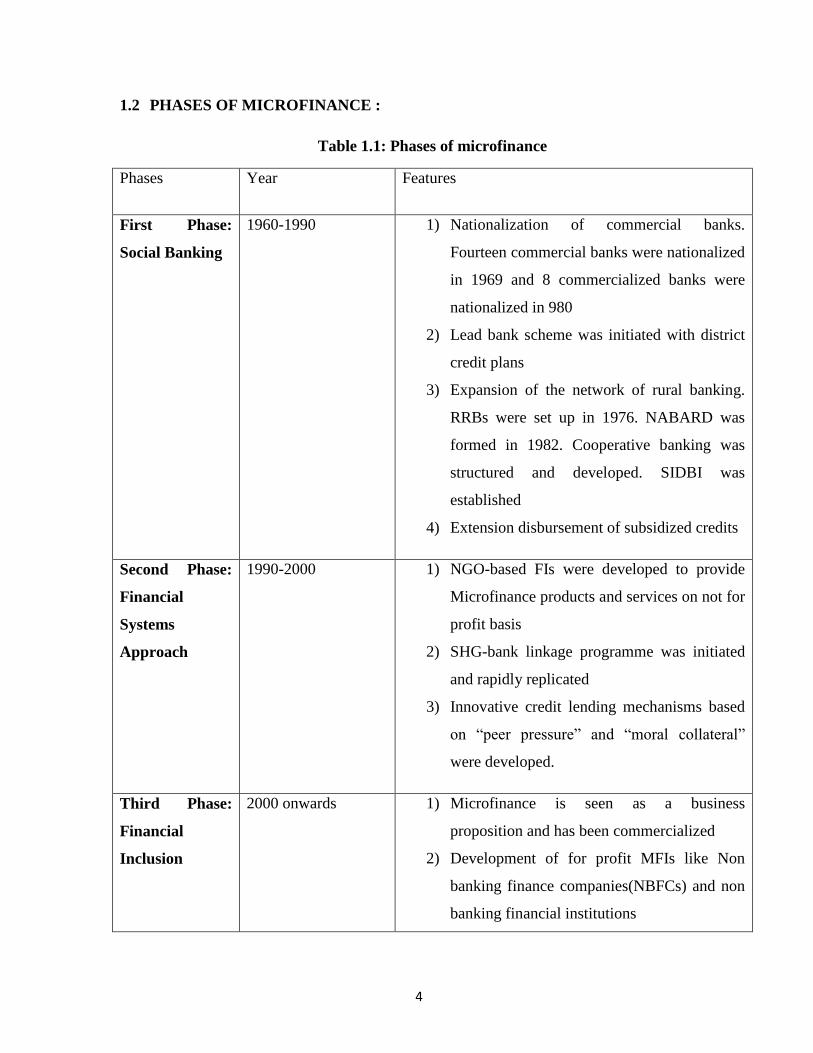
1.2 PHASES OF MICROFINANCE :
Table 1.1: Phases of microfinance
Phases Year Features
First Phase:
Social Banking
1960-1990 1) Nationalization of commercial banks.
Fourteen commercial banks were nationalized
in 1969 and 8 commercialized banks were
nationalized in 980
2) Lead bank scheme was initiated with district
credit plans
3) Expansion of the network of rural banking.
RRBs were set up in 1976. NABARD was
formed in 1982. Cooperative banking was
structured and developed. SIDBI was
established
4) Extension disbursement of subsidized credits
Second Phase:
Financial
Systems
Approach
1990-2000 1) NGO-based FIs were developed to provide
Microfinance products and services on not for
profit basis
2) SHG-bank linkage programme was initiated
and rapidly replicated
3) Innovative credit lending mechanisms based
on “peer pressure” and “moral collateral”
were developed.
Third Phase:
Financial
Inclusion
2000 onwards 1) Microfinance is seen as a business
proposition and has been commercialized
2) Development of for profit MFIs like Non
banking finance companies(NBFCs) and non
banking financial institutions

5
3) NGO-MFIs are been legitimized
4) Customers‟- centric/ client centric
microfinance products and services are given
importance
5) Policy regulations are increased
Source: Understanding Microfinance ,Debadutta K Panda.
Microfinancing is inherently a high risk business when compared to commercial bank(wright
and Haynes) and the agendas of a commercial bank are not aligned with the funding the poor.
Hence the with the risk return tradeoffs, higher the risk higher the return, the loans in a
microfinance are usually have interest rates ranging from 15%-48%( now regulated by RBI
with a cap of 24% effect from april 1st 2012).
According to “managing risk and creating value with microfinance”,”mike Goldberg and
eric palladini” risks in microfinance can be categorized at follows
Table 1.2: Risk categories
Risk category Subcategories Specific risks
Financial risk Credit Loan portfolio(internal)
Interest rate (internal/external)
Loan enforcement
practices(internal)
Loan rescheduling and
refinancing practices
Market Prices(external)
Markets(external)
Exchange
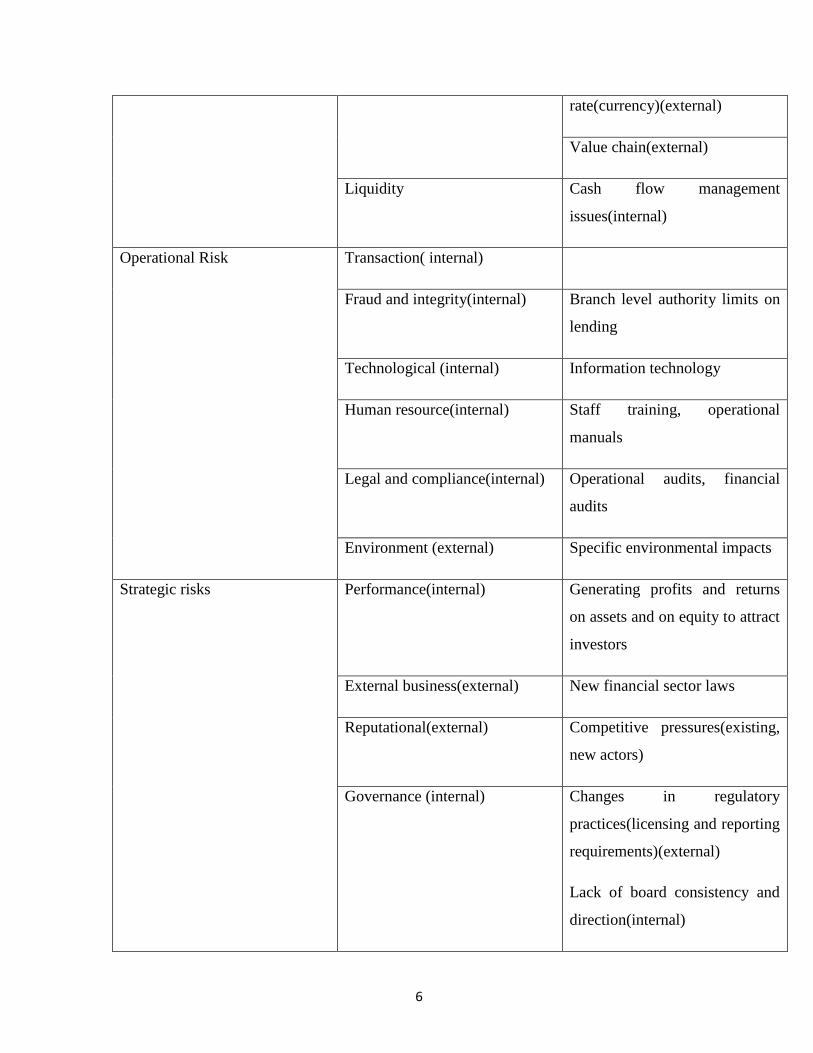
6
rate(currency)(external)
Value chain(external)
Liquidity Cash flow management
issues(internal)
Operational Risk Transaction( internal)
Fraud and integrity(internal) Branch level authority limits on
lending
Technological (internal) Information technology
Human resource(internal) Staff training, operational
manuals
Legal and compliance(internal) Operational audits, financial
audits
Environment (external) Specific environmental impacts
Strategic risks Performance(internal) Generating profits and returns
on assets and on equity to attract
investors
External business(external) New financial sector laws
Reputational(external) Competitive pressures(existing,
new actors)
Governance (internal) Changes in regulatory
practices(licensing and reporting
requirements)(external)
Lack of board consistency and
direction(internal)

7
Country (external) Relationships with donors and
government programs(eternal)
Producer risks Experience
Technology
Management ability
Source : understanding microfinance, debadutta panda
According to “understanding microfinance- debadutta k panda,” Risks in indian context can
be classified as
1) Functional risks
2) Financial risks
3) External risks.
In the following research we have mainly focused on the credit risk of the microfinance
industry and building a quantitative model in order forecast the credit risk based on some
independent predictable variables.
1.3 PROBLEM STATEMENT:
a) There Is No Proper Credit Grading System For An MFI.
b) There is no forecasting tool for credit risk measurement
1.4 NEED FOR THE STUDY:
The need for the study was that, there has been no study like Morgan Stanley credit risk
management or quantitative modeling on the microfinance sector of India. Lately RBI has
been pushing financial inclusion reforms onto the cooperate banks which are going to learn
the microfinance fundamentals from the existing MFIs.
1.5 PURPOSE OF THE STUDY:
8
The purpose of the study is to assess the credit risk management structure of an MFI based
on parameters mentioned in chapter 3 also quantify and project the credit risk using a
quantitative model.
Inherently there is a high risk with the MFI segment. The small, medium and even larger
MFI find it difficult to manage risk or predict the outcome of credit transactions.
The probable reason could be due to the fact that the customer base is volatile or
intermediaries between the MFI and the customers who hide the customer details or lack of
risk management tools.

CHAPTER 2
LITERATURE REVIEW
2.1 INTRODUCTION
By the risk management framework for micro financing institutes published by microfinance
network,
The document focuses on helping senior managers and directors of MFIs design a
comprehensive and systematic approach for identifying, anticipating and responding to the
major risks faced by the MFIs. This document identifies that risk management is an essential
element of long term success and hence for financial institutions, to effectively management
risk they have to keep the following points in mind.
a) They have to have systematic approach to evaluate and measure risk so as to identify
the risk in the early stage and hence fix it.
b) A good risk management framework allows management to quantify the risk and fine
tune to the capital allocation and liquidity needs to match the on and off balance sheet
risks faced by the institutions and to evaluate the impact of potential shocks to
financial system or institution.
c) Having a good information on potential consequences for both positive and negative.
There has been a significant increase in the emphasis on risk management, hence the bank
managers and regulators are able to better anticipate risks, than just to react to them.
Therefore to foster stronger financial institutions the revised camels approach among US
regulators emphasizes the quality of internal systems to identify and address potential
problems quickly.
For MFIs proper internal risk management yields to practices designed to limit risk associate
with individual product lines and systematic, quantitative methods to identify, monitor and
control aggregate risks across financial institutions.
MFIs have been growing and serving large base of customers and also attract more
mainstream investment capital and funds, hence they have to strengthen their internal
capacity to identify and anticipate potential risks to avoid unexpected losses and surprises.
Creating a risk management framework and culture with in an MFI in the next step after
mastering the fundamental of individual risks, such as credit risk, treasury risk, and liquidity
9
risk. A risk management framework is a guide for MFI managers to design an integrated and
comprehensive risk management system that helps them focus on most important risks in an
effective and efficient manner. Hence according to the paper risk management framework is
a consciously designed system to protect the organization from undesirable surprised
(downside risks) and enable it to the advantage of opportunities (upside risks).
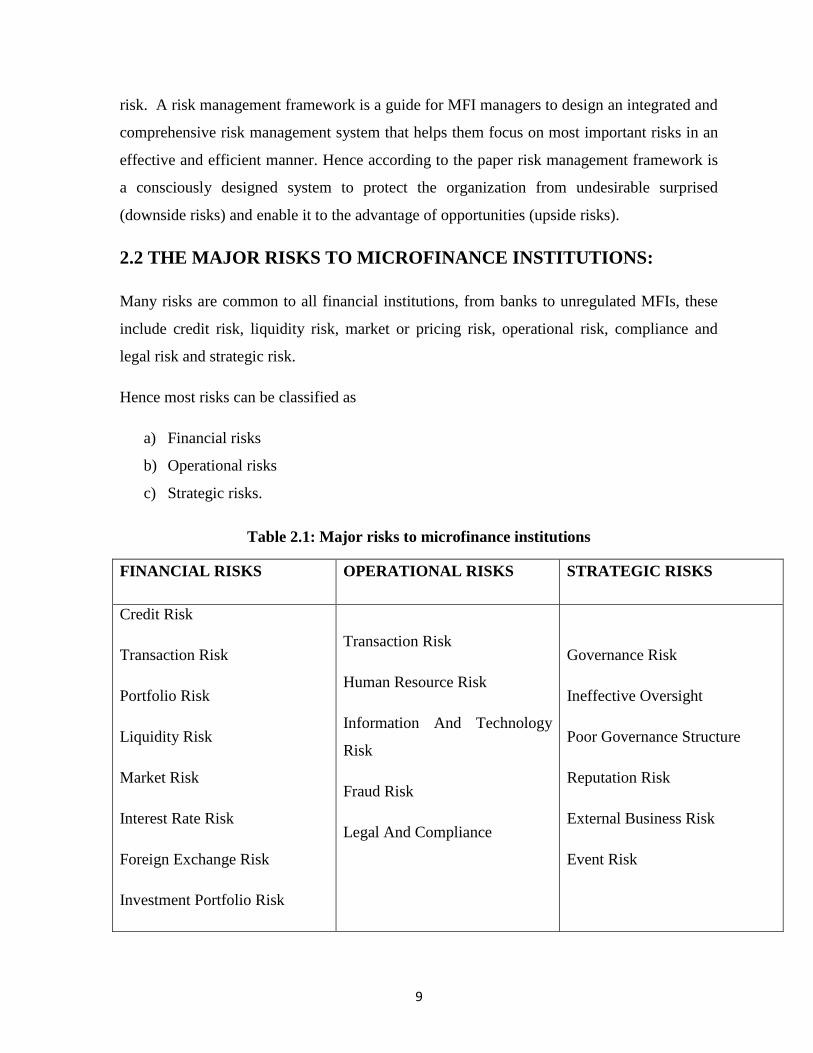
2.2 THE MAJOR RISKS TO MICROFINANCE INSTITUTIONS:
Many risks are common to all financial institutions, from banks to unregulated MFIs, these
include credit risk, liquidity risk, market or pricing risk, operational risk, compliance and
legal risk and strategic risk.
Hence most risks can be classified as
a) Financial risks
b) Operational risks
c) Strategic risks.
Table 2.1: Major risks to microfinance institutions
FINANCIAL RISKS OPERATIONAL RISKS STRATEGIC RISKS
Credit Risk
Transaction Risk
Portfolio Risk
Liquidity Risk
Market Risk
Interest Rate Risk
Foreign Exchange Risk
Investment Portfolio Risk
Transaction Risk
Human Resource Risk
Information And Technology
Risk
Fraud Risk
Legal And Compliance
Governance Risk
Ineffective Oversight
Poor Governance Structure
Reputation Risk
External Business Risk
Event Risk
10
Hence considering one risk at a time for literature review, we would get a better idea on
various aspects of risk management
2.3 HOW THE REVIEW HAS BEEN CONDUCTED:
The review has been conducted by looking up in different journals and data
bases of universities which have published relevant models to detect the credit
risk and other risks such as operational risk, market risk , foreign risk and then
they have been reporting in this dissertation.
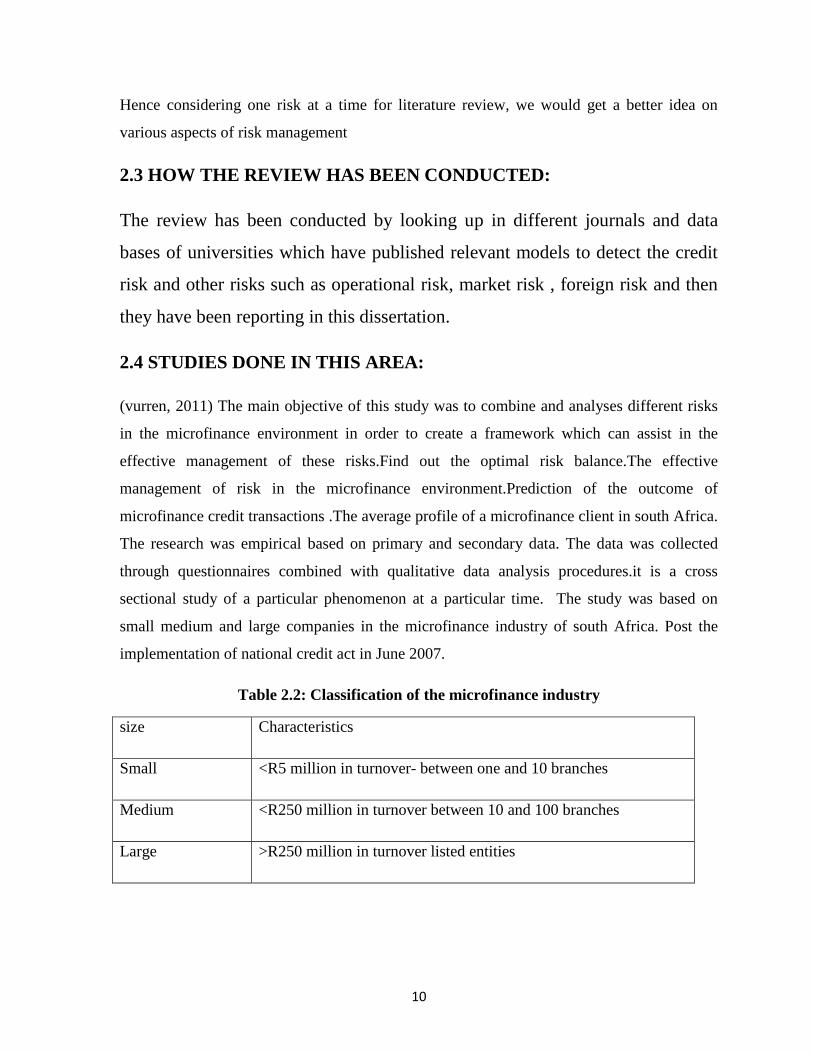
2.4 STUDIES DONE IN THIS AREA:
(vurren, 2011) The main objective of this study was to combine and analyses different risks
in the microfinance environment in order to create a framework which can assist in the
effective management of these risks.Find out the optimal risk balance.The effective
management of risk in the microfinance environment.Prediction of the outcome of
microfinance credit transactions .The average profile of a microfinance client in south Africa.
The research was empirical based on primary and secondary data. The data was collected
through questionnaires combined with qualitative data analysis procedures.it is a cross
sectional study of a particular phenomenon at a particular time. The study was based on
small medium and large companies in the microfinance industry of south Africa. Post the
implementation of national credit act in June 2007.
Table 2.2: Classification of the microfinance industry
size Characteristics
Small <R5 million in turnover- between one and 10 branches
Medium <R250 million in turnover between 10 and 100 branches
Large >R250 million in turnover listed entities
11
The target population has been divided into 4 categories The first category is unlisted entities
with less than 10 branches. The second category is unlisted entities with more than 10
branches The third entity is with banking license .The fourth category includes the
microfinance division of some of the traditional banks. According to the category the
questionnaires were designed. Data analysis was done through pie charts and bar charts and
then analysed. The following were the findings of the author. Five risk tools where to be
analyzed and the respondents gave “credit granting policy and customer affordability
calculations” the highest priority followed by “internal controls”, “debt controls”, “debt
collecting”, “staff training creating loyalty and integrity”, “credit scoring models.” The risks
that can be involved in non-bank microfinance institutions in south Africa where analyzed
and the respondents answered “internal and external fraud”, “bad debts”, customer migration
to competitors or the commercial banks” “regulation of the industry” and “lack of affordable
funding.” How well the risk tools used in banks can be applied to the micro financing
industry. Most effective way to lower the overall microfinance risk in south Africa. And the
respondents answered “conservative credit granting policy”, “improved internal controls”,
“better loan management system”, “better educated staff” , “better collecting on arrears
clients.” The biggest predictors of non-payment of new client in microfinance institution in
south Africa are “ disposable income” “number of loans” “ judgments” “employment
industry” credit enquiries” “gender”, “age”, “race”. The biggest contributor to minimize
credit risk in a microfinance institution in south Africa is accurate affordability calculation,
shorter term loans instead of longer ones , the use of a credit score model, small loan
amounts, the analysis of credit bureau information. The most efficient way to optimize client
service in a microfinance institution in south Africa, and the most efficient way to reduce risk
in microfinance institutions in south Africa are “real time loan management system”,”
decentralized credit decisions”, “cash disbursements to clients”, “ a call center function”,
centralized credit decision.” The items on which MFI would spend the most in a financial
year could be “ staff training, internal audit, independent review on the loan management
system”, “rewards for fraud tip offs” The biggest misperception in south Africa regarding
microfinance institutions. Are MFI were no affected negatively by the national credit act,
MFIs don‟t relieve poverty in SA, MFI in SA don‟t realy compete with the 4 major banks,
MFI in SA is an extremely high risk industry. The most efficient options to pro- actively

12
manage risk in a microfinance institution in SA are a credit scoring model, build customer
relationship with shorter products, extensive training for new staff, to only disburse 30 day
loans. The best predictors of on time payment of clients are correct affordability calculations
, a shorter term loan, work reference, a credit score model, a proper and signed credit
agreement. The findings from client information of 3000 microfinance clients in south
Africa: A good client means not in arrears for more than 2 installments And a bad client
means some on who is in arrears for more than 2 installments. The following table was
constructed for 2009 and 2010 year
In the paper the author identifies through literature review, identifies various ways to identify
the risks related to MFI, ie. The debt equity ratio( gearing risks), interest cover, liquidity risk,
market risk(beta) company specific risk, growth, management team, industry comparative
performance, theft and fraud and the non-performance of loans.
Then he identifies the relation between the business and credit risk. According to the author,
to lower the risk of loans not performing the emphasis should be on quality loans and a risk
portfolio not exceeding 5%. The quality of a loan is determined by the probability that the
credit decision is right. Hence usually the following are the ways for a proper credit decision.
Rationing credit ,Requiring collateral ,Screening applicants, Monitoring borrowers, Credit
scoring In this paper he takes up screening of applicants and monitoring borrowers. By
effectively managing the risk in the industry, south Africa has a good market where in
business models can be sustainable. By being able to service the poor through credit lending
it is creating opportunities to help build the economy. A combination of risk tools need to be
applied effectively in order to reduce material risks, predict good customer and also real time
loan management system with integrated credit scoring models, accurate affordability
calculation combined with well trained staff forms the basis of risk management . even
though there was a thorough examination of the MFI industry, the author did not look into
each risk and tools that need to be used to mitigate the risk.
(Ayayi, 2012) Credit risk assessment in the microfinance industry: an application to a
selected group of Vietnamese microfinance institutions and an extension to east Asian pacific
microfinance institutions. The objective of this is to access credit risk in order to determine
internal global scale rating for Vietnamese MFI. Particular attention is paid to conventional
13
and special credit evaluation metrics due to the unique institutional arrangement of MFIs and
the socioeconomic environment in which they operate. Also this research is to provide an
analysis to the Vietnamese MFI so that the donors and investors try making decisions with
respect to providing .The other important aspect of this paper is to help the MFI management
teams to evaluate their institution‟s performance and hence identify and correct the
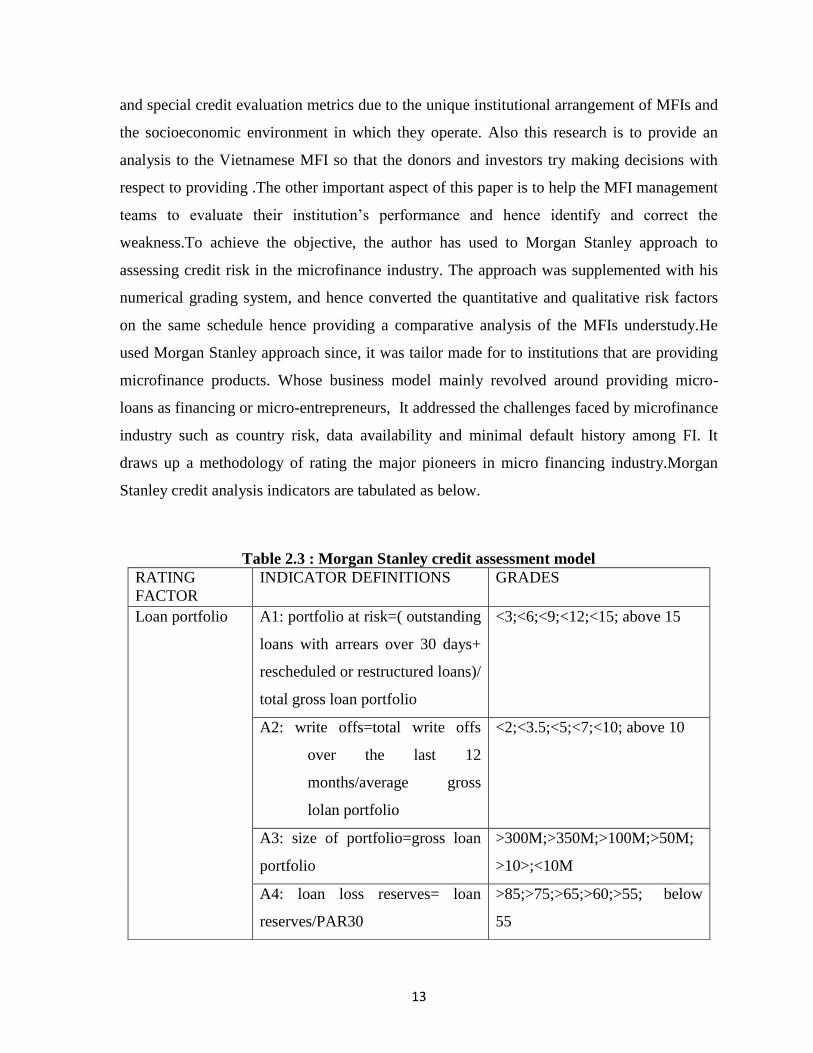
weakness.To achieve the objective, the author has used to Morgan Stanley approach to
assessing credit risk in the microfinance industry. The approach was supplemented with his
numerical grading system, and hence converted the quantitative and qualitative risk factors
on the same schedule hence providing a comparative analysis of the MFIs understudy.He
used Morgan Stanley approach since, it was tailor made for to institutions that are providing
microfinance products. Whose business model mainly revolved around providing micro-
loans as financing or micro-entrepreneurs, It addressed the challenges faced by microfinance
industry such as country risk, data availability and minimal default history among FI. It
draws up a methodology of rating the major pioneers in micro financing industry.Morgan
Stanley credit analysis indicators are tabulated as below.
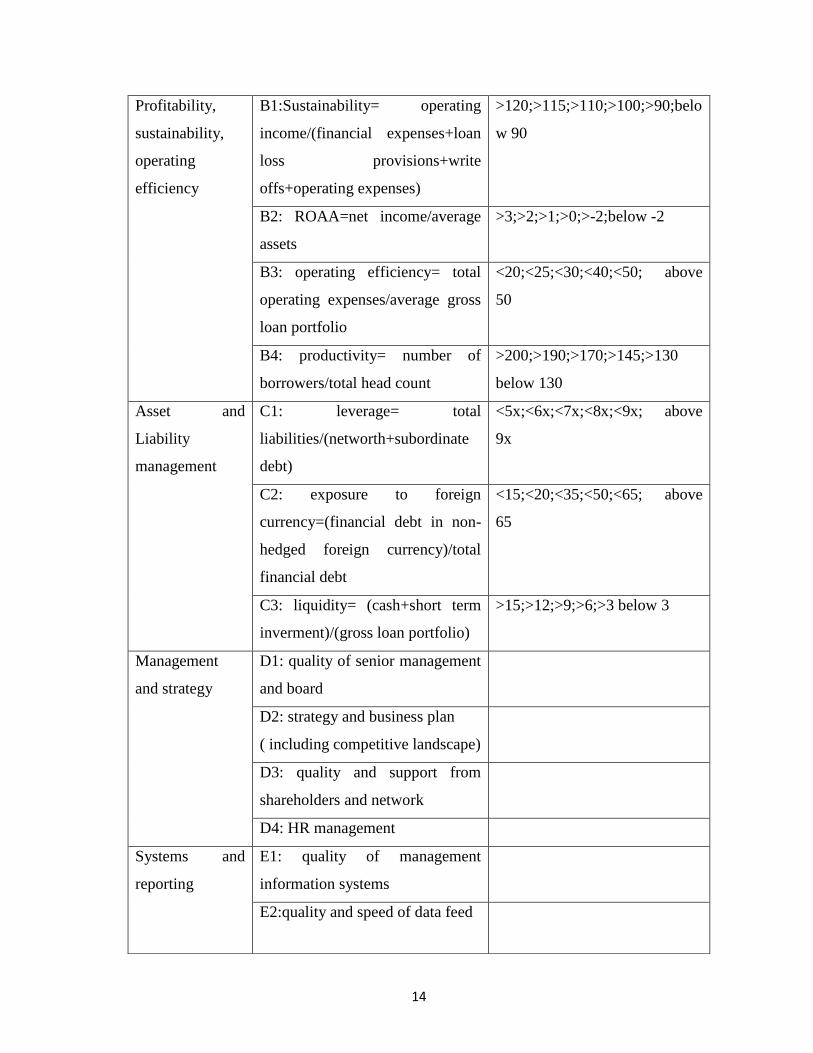
Table 2.3 : Morgan Stanley credit assessment model
RATING
FACTOR
INDICATOR DEFINITIONS GRADES
Loan portfolio A1: portfolio at risk=( outstanding
loans with arrears over 30 days+
rescheduled or restructured loans)/
total gross loan portfolio
<3;<6;<9;<12;<15; above 15
A2: write offs=total write offs
over the last 12
months/average gross
lolan portfolio
<2;<3.5;<5;<7;<10; above 10
A3: size of portfolio=gross loan
portfolio
>300M;>350M;>100M;>50M;
>10>;<10M
A4: loan loss reserves= loan
reserves/PAR30
>85;>75;>65;>60;>55; below
55
14
Profitability,
sustainability,
operating
efficiency
B1:Sustainability= operating
income/(financial expenses+loan
loss provisions+write
offs+operating expenses)
>120;>115;>110;>100;>90;belo
w 90
B2: ROAA=net income/average
assets
>3;>2;>1;>0;>-2;below -2
B3: operating efficiency= total
operating expenses/average gross
loan portfolio
<20;<25;<30;<40;<50; above
50
B4: productivity= number of
borrowers/total head count
>200;>190;>170;>145;>130
below 130
Asset and
Liability
management
C1: leverage= total
liabilities/(networth+subordinate
debt)
<5x;<6x;<7x;<8x;<9x; above
9x
C2: exposure to foreign
currency=(financial debt in non-
hedged foreign currency)/total
financial debt
<15;<20;<35;<50;<65; above
65
C3: liquidity= (cash+short term
inverment)/(gross loan portfolio)
>15;>12;>9;>6;>3 below 3
Management
and strategy
D1: quality of senior management
and board
D2: strategy and business plan
( including competitive landscape)
D3: quality and support from
shareholders and network
D4: HR management
Systems and
reporting
E1: quality of management
information systems
E2:quality and speed of data feed
15
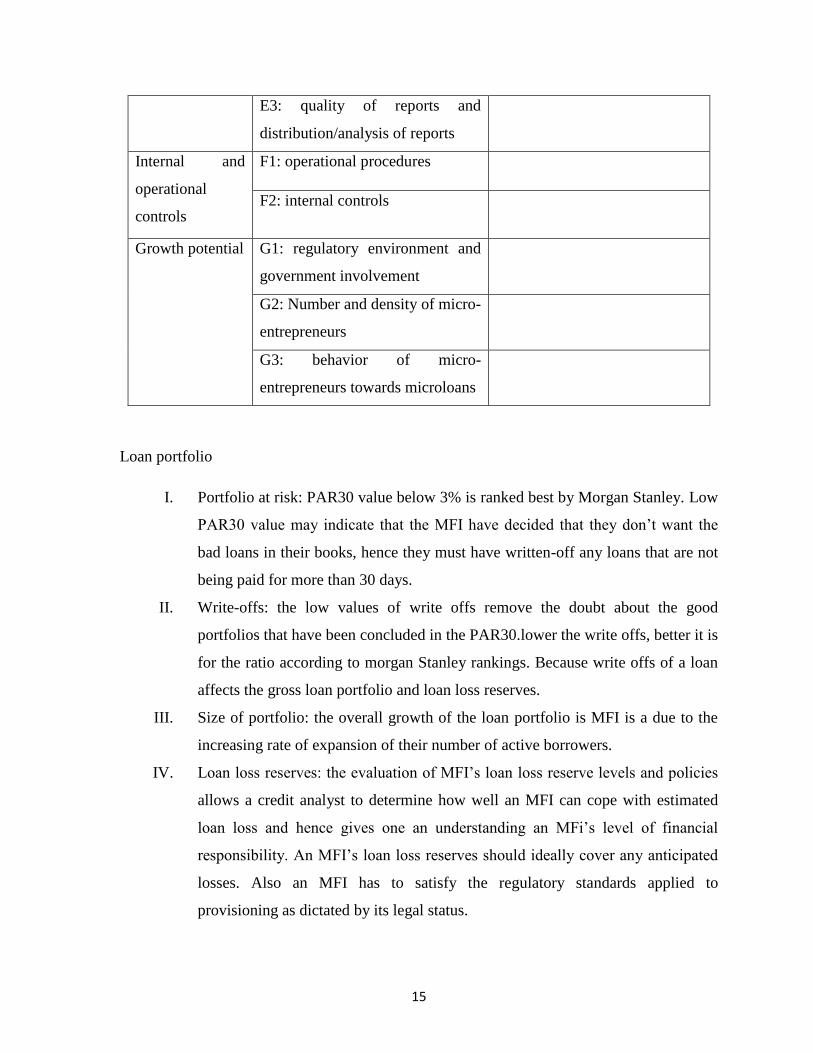
Loan portfolio
I. Portfolio at risk: PAR30 value below 3% is ranked best by Morgan Stanley. Low
PAR30 value may indicate that the MFI have decided that they don‟t want the
bad loans in their books, hence they must have written-off any loans that are not
being paid for more than 30 days.
II. Write-offs: the low values of write offs remove the doubt about the good
portfolios that have been concluded in the PAR30.lower the write offs, better it is
for the ratio according to morgan Stanley rankings. Because write offs of a loan
affects the gross loan portfolio and loan loss reserves.
III. Size of portfolio: the overall growth of the loan portfolio is MFI is a due to the
increasing rate of expansion of their number of active borrowers.
IV. Loan loss reserves: the evaluation of MFI‟s loan loss reserve levels and policies
allows a credit analyst to determine how well an MFI can cope with estimated
loan loss and hence gives one an understanding an MFi‟s level of financial
responsibility. An MFI‟s loan loss reserves should ideally cover any anticipated
losses. Also an MFI has to satisfy the regulatory standards applied to
provisioning as dictated by its legal status.
E3: quality of reports and
distribution/analysis of reports
Internal and
operational
controls
F1: operational procedures
F2: internal controls
Growth potential G1: regulatory environment and
government involvement
G2: Number and density of micro-
entrepreneurs
G3: behavior of micro-
entrepreneurs towards microloans

16
i) Profitability, sustainability and operational efficiency: this parameter gives the
idea of the financial viability of the MFI. One has to set minimum expected
levels of profitability and cash flow sustainability, while taking into account
the MFI‟s ability to leverage its operational platform and flexibility In the
event of deteriorating margins.
I. Sustainability: this measures the free cash flows, there by reflecting the extent
of an MFI‟s financial cushion against margin or top line shocks.
II. ROAA: takes into account taxes and other sources of revenues, including
income earned on cash in the bank there by providing a more measure for
profitability.
III. Operational efficiency: this indicated the MFI‟s ability to operate efficiently and
leverage its infrastructure.
a) Econometric analysis: for the econometric analysis the MFI for east asia and pacific
were analyzed and correlation matrix for 118 different MFI with 14 variable was
made and conclusions were drawn. Econometric analysis showed that there was no
statistical difference in terms of risk management among different types of MFI.There
was no significant conclusion made even after the econometric testing, morgan
Stanley approach to credit assessment was used to understand the credit risk of the
MFI, the research gap is even though the econometric analysis was done, It was
compared with few MFI in limited to East Asia and Pacific rather than comparing
with the global players in MFI. It indirectly means the researcher narrowed down his
interests to one particular region.
(GUTHRIE, 2010)Determinants of Credit Ratings of Microfinance Institutions in the
Former Soviet Union.This study primarily seeks to explore two questions. First,
whether ratings respond to individual indicators as the existing literature on both the
traditional financial sector and the microfinance sector predict. This is important to
determine perception of credit risk of microfinance benchmarking it with other
financial institutions. It tries to determine the optimal model for predicting the credit
rating of a MFI given number of independent variable This tries to use the traditional
rating agencies and financial institutions to MFI and specialized rating agencies. Also
it expands little work that has been done on determining contributors to a strong

17
credit rating of MFI and fills a gap in the knowledge regarding the optimal model for
predicting an institution‟s credit rating.This research is based on the work from
Gutierrez and Serrano.The work from Gutierrez and Serrano finds 5 key components
to credit rating.Size was found to positively impact the credit rating and is consistent
with the research on contributors to ratings of Russian financial institutions.
Profitability and efficiency also were identified as positive contributors to credit
ratings.Increased risk and lower portfolio quality harmed a firm‟s rating. The work
for Gutierrez and Serrano showed that metrics or social performance have no bearings
on ratings of MFI.The rating agencies are primarily concerned with identifying
probability of default, not a firm‟s impact on poverty alleviation or economic
development. This analysis has replicated the model proposed by Gutierrez and
Serrano , to establish the validity of the results for MFI. But the paper also expands
to identify the specific model that best predicts the rating of an MFI.The paper
surveys the rating agencies of the MFIs and identifies the following
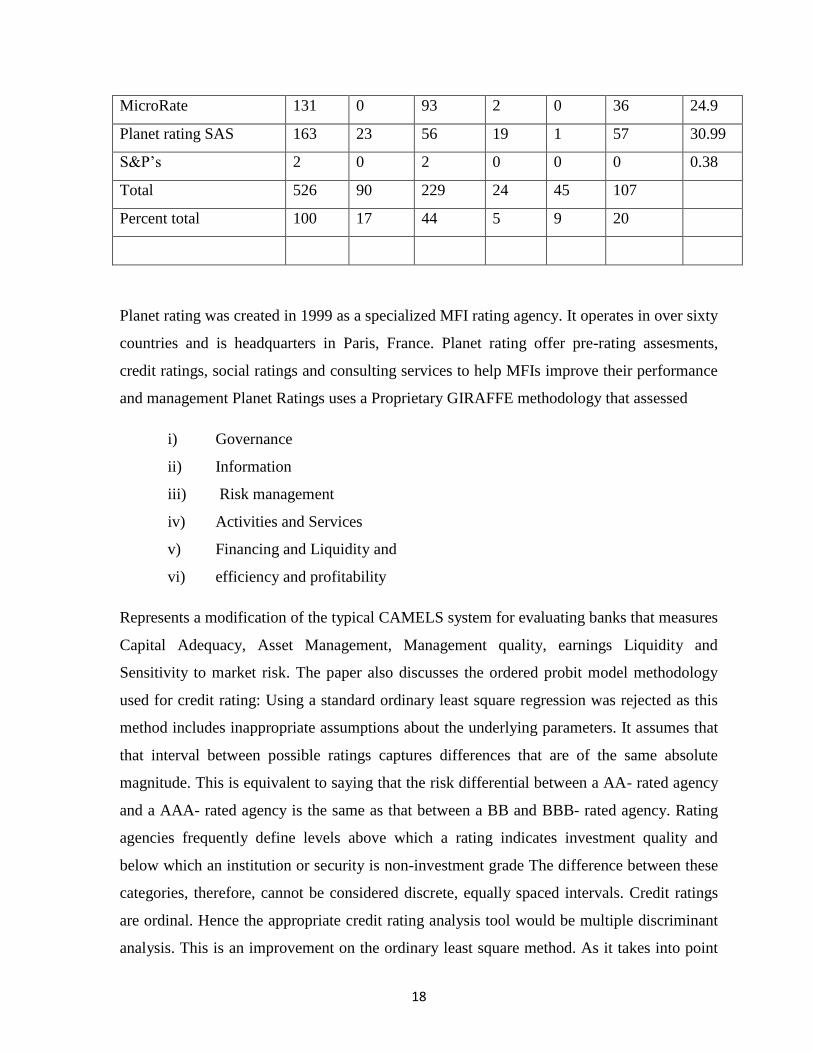
Table 2.4: Ratings of microfinance institutions
Ratings ECA LA MENA SA SSAf %
total
Apoyo and associados
internacionales S.A.C
1 0 1 0 0 0 0.19
Class and asociados
S.A.
3 0 3 0 0 0 0.57
CRISIL 24 0 1 0 21 0 4.56
Ecuability 2 0 2 0 0 0 .38
Equilibrium 8 0 8 0 0 0 1.52
Feller Rate 1 0 1 0 0 0 0.19
Fitch Ratings 10 0 10 0 0 0 1.9
JCR-VIS credit rating
company LTD
1 0 0 0 1 0 .19
M-CRIL 46 6 0 0 21 0 8.75
Microfinanza rating Sri 134 61 52 3 1 14 25.9
18
MicroRate 131 0 93 2 0 36 24.9
Planet rating SAS 163 23 56 19 1 57 30.99
S&P‟s 2 0 2 0 0 0 0.38
Total 526 90 229 24 45 107
Percent total 100 17 44 5 9 20
Planet rating was created in 1999 as a specialized MFI rating agency. It operates in over sixty
countries and is headquarters in Paris, France. Planet rating offer pre-rating assesments,
credit ratings, social ratings and consulting services to help MFIs improve their performance
and management Planet Ratings uses a Proprietary GIRAFFE methodology that assessed
i) Governance
ii) Information
iii) Risk management
iv) Activities and Services
v) Financing and Liquidity and
vi) efficiency and profitability
Represents a modification of the typical CAMELS system for evaluating banks that measures
Capital Adequacy, Asset Management, Management quality, earnings Liquidity and
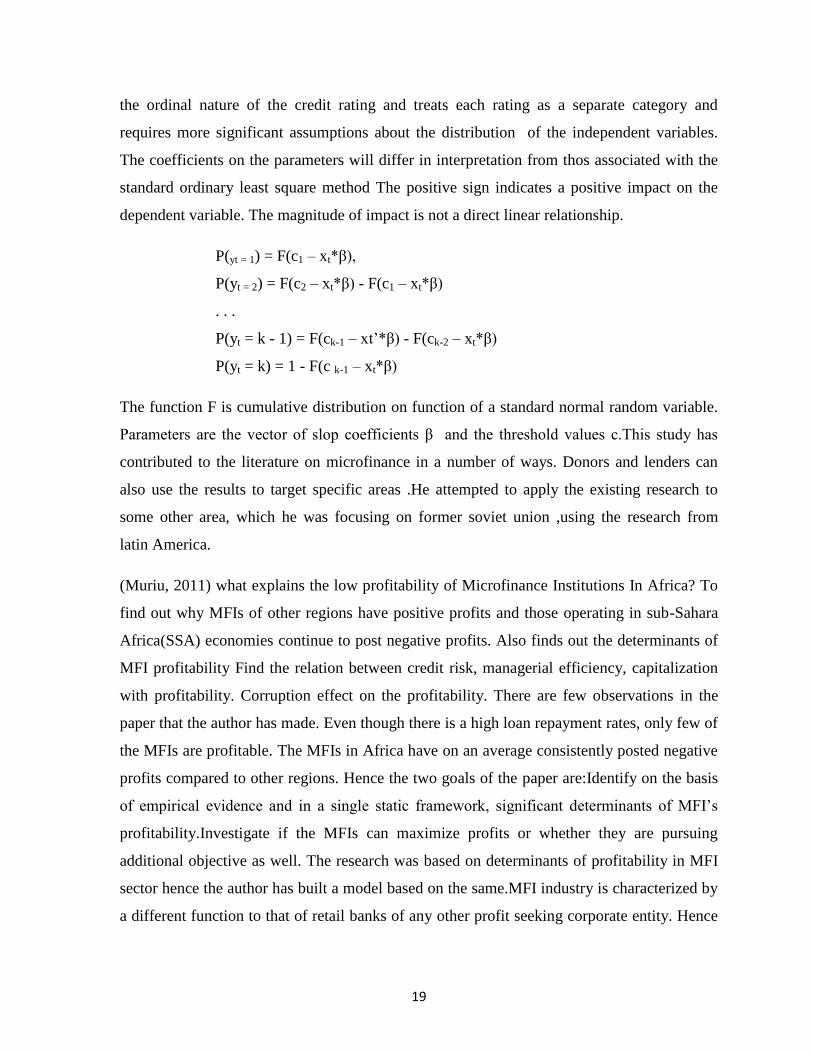
Sensitivity to market risk. The paper also discusses the ordered probit model methodology
used for credit rating: Using a standard ordinary least square regression was rejected as this
method includes inappropriate assumptions about the underlying parameters. It assumes that
that interval between possible ratings captures differences that are of the same absolute
magnitude. This is equivalent to saying that the risk differential between a AA- rated agency
and a AAA- rated agency is the same as that between a BB and BBB- rated agency. Rating
agencies frequently define levels above which a rating indicates investment quality and
below which an institution or security is non-investment grade The difference between these
categories, therefore, cannot be considered discrete, equally spaced intervals. Credit ratings
are ordinal. Hence the appropriate credit rating analysis tool would be multiple discriminant
analysis. This is an improvement on the ordinary least square method. As it takes into point
19
the ordinal nature of the credit rating and treats each rating as a separate category and
requires more significant assumptions about the distribution of the independent variables.
The coefficients on the parameters will differ in interpretation from thos associated with the
standard ordinary least square method The positive sign indicates a positive impact on the
dependent variable. The magnitude of impact is not a direct linear relationship.
P(yt = 1) = F(c1 – xt*β),
P(yt = 2) = F(c2 – xt*β) - F(c1 – xt*β)
. . .
P(yt = k - 1) = F(ck-1 – xt‟*β) - F(ck-2 – xt*β)
P(yt = k) = 1 - F(c k-1 – xt*β)
The function F is cumulative distribution on function of a standard normal random variable.
Parameters are the vector of slop coefficients β and the threshold values c.This study has
contributed to the literature on microfinance in a number of ways. Donors and lenders can
also use the results to target specific areas .He attempted to apply the existing research to
some other area, which he was focusing on former soviet union ,using the research from
latin America.
(Muriu, 2011) what explains the low profitability of Microfinance Institutions In Africa? To
find out why MFIs of other regions have positive profits and those operating in sub-Sahara
Africa(SSA) economies continue to post negative profits. Also finds out the determinants of
MFI profitability Find the relation between credit risk, managerial efficiency, capitalization
with profitability. Corruption effect on the profitability. There are few observations in the
paper that the author has made. Even though there is a high loan repayment rates, only few of
the MFIs are profitable. The MFIs in Africa have on an average consistently posted negative
profits compared to other regions. Hence the two goals of the paper are:Identify on the basis
of empirical evidence and in a single static framework, significant determinants of MFI‟s
profitability.Investigate if the MFIs can maximize profits or whether they are pursuing
additional objective as well. The research was based on determinants of profitability in MFI
sector hence the author has built a model based on the same.MFI industry is characterized by
a different function to that of retail banks of any other profit seeking corporate entity. Hence
20
multivariate regression model was used to for the same. The linear regression model that was
predicted was based on the literature reviews. Hence the determinants are
Size: this variable was used to capture the economies of scale or diseconomies of scale in the
market.
Age: age is introduced in model to capture the learning effects. From the literature review of
the author, older firms have more amount of experience in the same industry hence enjoy
higher profits
Capital assets ratio (CAP): high CAP ratio signifies that the MFI is operating over cautiously
and ignoring profitable investment opportunities. On the contrary the cost of insurance
against bankruptcy can be high for MI with low CAP ratio. The gearing ratio defines the
source of business finance to boost financial performance.
Credit risk: this is another determinant in MFI industry. Poor quality of credit reducs the
profitability of the MFI. Hence the negative relationship between credit risk and the
profitability. This is calculated by taking sum of the level of loans past due 30 days or more
and still accruing interest hence portfolio at risk( PAR30) . write off ratio which is the value
of loans written off during the year as uncollectible as a percentage of average gross portfolio
over the year. Other measure for credit risk is risk coverage(RC) ratio which is measure as
the adjusted impaired loss allowance/PAR30. Loan loss reserve ratio this is measured by
ratio of loan loss reserves to gross loans.
Efficiency: is expenses management should ensure a more effective use of MFI‟s loanable
resources. Higher ratios of operating expenses to gross loan portfolio imply a less efficient
management. From the literature review we can say that microfinance is a costly business
since it has high transaction cost and information cost. This is measured by operating
expense/average gross loan portfolio and in robustness tests, cost per borrower can be used
The other two proxies , Macroeconomic environment, inflation and real GNI per capita
growth. Dependent variable is ROA or ROE. Efficiency in delivering microfinance is an
important determinant of profitability.A major drawback of the negative profitability in SA
could be due to the fact that the managerial practices have come down due to the increase in
21
technological innovations. Higher spending could be due to the same reasons. the main
research gap is the analysis was based on literature review rather than actually coming up
with original work.
(Venkataraman, 2006)To measure each kind of risk in the Basel II norm through a
comprehensive IT solution. Risk identification, Quantitative risk measurement, Risk
mitigation, Minimum capital allocation. The 3 pillars of Basel II are
a) Pillar I: minimum capital requirement
b) Pillar II: supervisory review process
c) Pillar III: market discipline requirements
Types of risk
a) Credit risk; default by the borrower to repay the borrowings
b) Market risk: volatility of the bank‟s portfolio due to change in market factors
c) Operational risk: risk arising out of banks inefficient internal processes, systems,
people or external events like natural disasters, robbery,etc
Minimum capital allocation for credit risk: Standardized approach: external credit rating
agencies , capital allocation and credit rating are inversely proportional. Internal rating,
Foundation IR approach, Advanced IR approach, In both the methods capital allocated is
based on the following 3 factors ,EAD exposure at default: amount of facility that is likely to
be drawn in default,LGD loss given at default: measure the proportion of lost exposure n
default Probability of default(PD) chances of default in terms of percentage (default- fails to
repay borrowings) Minimum capital allocation for market risk: VAR is used to measure
market risk. VAR measures the likely loss in value of a portfolio over a iven time period with
specified probability. Minimum capital allocation for operational risk: These three methods
are used to measure and allocate operational risk.Basic indicator approach: capital charge
should be 15% banks average annual positive gross income over previous years.
Standardized indicator approach: in this approach the bank activities are classified into 8
business line. Each business line is having an exposure indicator which is multiplied by the
factor( beta) will give the capital charge for operational risk. Advanced measurement
approach: loss distribution approach is of the advanced versions in this approach, in which
22
the impact of significant operation events on various business lines of banks and frequency of
occurrences of these events are captured in the form of normal distribution.
(I.B., 2007) performance of microfinance providers in karnataka. Objective of the study To
study the growth and pattern of microfinance in Karnataka.To evaluate the business
performance of the Microfinance providers.To study the impact of micro financial
institutions on member enterprises .To identify the constraints faced by the microfinance
providers. The data for the research was collected from the primary source with respect to
amount lent, portfolio lending by microfinance providers, cost and returns involved in each
activities, recovery performance under micro financial activities in selected districts was
collected with the help of a questionnaire. Analytical techniques used are.Triennium
averages: the 1st three years average and the last three years averages was calculated because
of plausibility of large number of continuous time series data . the annual average growth in
percentages calculated by dividing the changes during the period by number of years in the
study period.this is done to study the performance of microfinance activities undertaken by
non government microfinance providers Compounding growth rate analysis: the growth in
the number of SHGs credit link, banks loan and refinance of microfinance providers can be
assessed by taking for 14 year period.And the compound growth were computed by using
exponential function of the form.
Yt=ABtUt
where
Yt is SHG credit linked/bank loans/refinance/ number of family assistd/recovery/over dues
A is the time period
Ut= error term
B= 1+G where g is the growth rate
By taking logarithm
We see that log(Yt)=log A+t log B+log Ut
23
Which is of the form
Qt=a+bt+Ut
Hence g=antilog(b)-1*100
Paired t test: to find out the impact of NGOs on the SHGs the paired t test was done. Which
is statistical test for finding the differences in performance of SHGs before and after joining
the NGOs who are involved in microfinance. Impact index: the impact of the NGO on the
SHGs was also assessed using the scoring pattern Impact index=(average scored
obtained)/(average maximum scored to be obtained).The pattern of growth of SHGs in the
state 1992-1993 to 2005-2006 and that the importance of SHGs has increased in the lives of
the poor people and that the microfinance may also be possible because of refinance support
provided by the apex level institutions involved in microfinance. The total amount of loans as
expanded considerably through NABARD especially from selected villages.
(Saltzman, 1998)Capital Adequacy. The objective of the capital adequacy analysis is to
measure the financial solvency of an MFI by determining whether the risks it has incurred
are adequately offset with capital and reserves to absorb potential losses. There are three
indicators:First one is leverage, explains the relationship between the risk-weighted assets of
the MFI and its equity. Second one is ability to raise equity, a qualitative assessment of an
MFI‟s ability to respond to a need to replenish or increase equity at any given time. the third,
is adequacy of reserves, is a quantitative measure of the MFI‟s loan loss reserve and the
degree to which the institution can absorb potential loan losses.
Asset Quality. The analysis of asset quality is divided into three components
PORTFOLIO QUALITY: Portfolio quality includes two quantitative indicators: portfolio at
risk, which measures the portfolio past due over 30 days; and write-offs/write-off policy,
which measures the MFI‟s adjusted write-offs based on CAMEL criteria
PORTFOLIO CLASSIFICATION SYSTEM: entails reviewing the portfolio‟s aging
schedules and assessing the institution‟s policies associated with assessing portfolio risk.
24
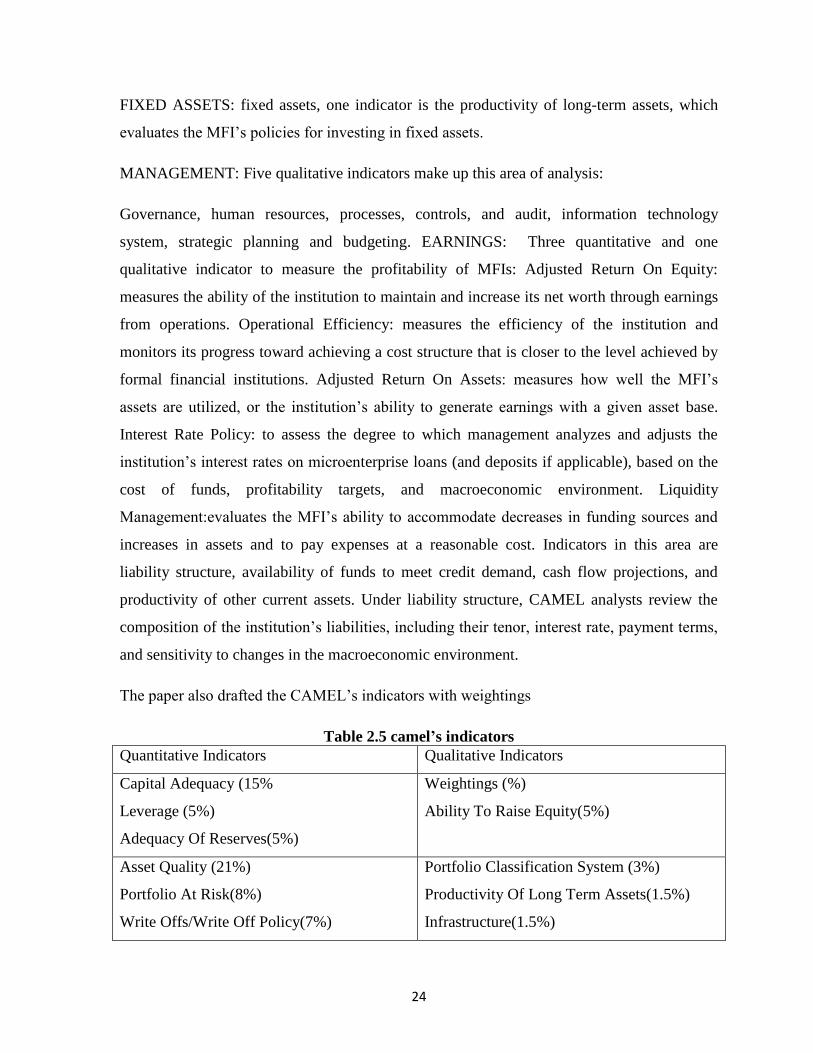
FIXED ASSETS: fixed assets, one indicator is the productivity of long-term assets, which
evaluates the MFI‟s policies for investing in fixed assets.
MANAGEMENT: Five qualitative indicators make up this area of analysis:
Governance, human resources, processes, controls, and audit, information technology
system, strategic planning and budgeting. EARNINGS: Three quantitative and one
qualitative indicator to measure the profitability of MFIs: Adjusted Return On Equity:
measures the ability of the institution to maintain and increase its net worth through earnings
from operations. Operational Efficiency: measures the efficiency of the institution and
monitors its progress toward achieving a cost structure that is closer to the level achieved by
formal financial institutions. Adjusted Return On Assets: measures how well the MFI‟s
assets are utilized, or the institution‟s ability to generate earnings with a given asset base.
Interest Rate Policy: to assess the degree to which management analyzes and adjusts the
institution‟s interest rates on microenterprise loans (and deposits if applicable), based on the
cost of funds, profitability targets, and macroeconomic environment. Liquidity
Management:evaluates the MFI‟s ability to accommodate decreases in funding sources and
increases in assets and to pay expenses at a reasonable cost. Indicators in this area are
liability structure, availability of funds to meet credit demand, cash flow projections, and
productivity of other current assets. Under liability structure, CAMEL analysts review the
composition of the institution‟s liabilities, including their tenor, interest rate, payment terms,
and sensitivity to changes in the macroeconomic environment.
The paper also drafted the CAMEL‟s indicators with weightings
Table 2.5 camel’s indicators
Quantitative Indicators Qualitative Indicators
Capital Adequacy (15%
Leverage (5%)
Adequacy Of Reserves(5%)
Weightings (%)
Ability To Raise Equity(5%)
Asset Quality (21%)
Portfolio At Risk(8%)
Write Offs/Write Off Policy(7%)
Portfolio Classification System (3%)
Productivity Of Long Term Assets(1.5%)
Infrastructure(1.5%)

25
Management(23%) Governance/Management (6%)
Human Resources (4%)
Processes, Controls, And Audit (4%)
Information Technology System (5%)
Strategic Planning And Budgeting( 4%)
Earnings (24%)
Return On Equity (5%)
Operational Efficiency( 8%)
Return On Assets (7%)
Interest Rate Policy (4%)
Liquidity Management (17%)
Productivity Of Other Current Assets (2%)
Liability Structure( 8%)
Availability Of Funds To Meet Credit
Demand (4%)
Cash Flow Projections( 3%)
Total(100) 47% 53%
(Barman, 2009) Role Of Microfinance Interventions In Financial Inclusion: A Comparative
Study Of Microfinance Models.To study the relationship between the level of indebtedness
to moneylenders and the type of microfinance model through a case study in Varanasi, U.P.
Comparing two microfinance models prevalent in the research area.This survey was
conducted among 59 households of twelve villages covering four blocks of the selected
district. Primary data on different socio-economic aspects of the households and details of
micro-financial services availed by them were collected directly from the clients through the
structured questionnaire and personal interview. Qualitative information was collected
through Focus Group Discussions (FGDs) and semi-structured interviews of the bankers,
NGOs and MFIs operating in the area to understand the supply-and demand sides of the
problem of microcredit in the selected research area. The collected data are subjected with
the chi-square statistical test in order to determine if there is significant variation in the
tendency to borrow from the moneylenders among clients of SHG and MFI model of
microfinance. The test is applied when one has two categorical variables from a single
population. It is used to determine whether there is a significant association between the two
variables i.e. indebtedness to moneylender and being client of particular type of microfinance
26
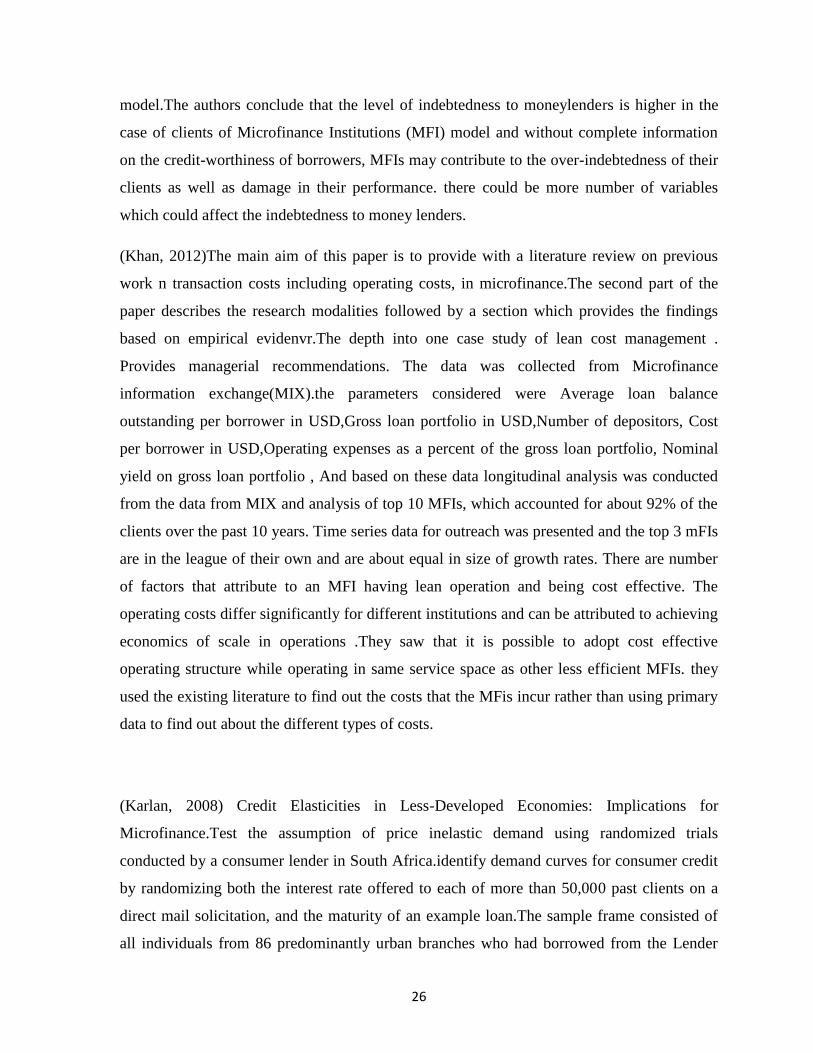
model.The authors conclude that the level of indebtedness to moneylenders is higher in the
case of clients of Microfinance Institutions (MFI) model and without complete information
on the credit-worthiness of borrowers, MFIs may contribute to the over-indebtedness of their
clients as well as damage in their performance. there could be more number of variables
which could affect the indebtedness to money lenders.
(Khan, 2012)The main aim of this paper is to provide with a literature review on previous
work n transaction costs including operating costs, in microfinance.The second part of the
paper describes the research modalities followed by a section which provides the findings
based on empirical evidenvr.The depth into one case study of lean cost management .
Provides managerial recommendations. The data was collected from Microfinance
information exchange(MIX).the parameters considered were Average loan balance
outstanding per borrower in USD,Gross loan portfolio in USD,Number of depositors, Cost
per borrower in USD,Operating expenses as a percent of the gross loan portfolio, Nominal
yield on gross loan portfolio , And based on these data longitudinal analysis was conducted
from the data from MIX and analysis of top 10 MFIs, which accounted for about 92% of the
clients over the past 10 years. Time series data for outreach was presented and the top 3 mFIs
are in the league of their own and are about equal in size of growth rates. There are number
of factors that attribute to an MFI having lean operation and being cost effective. The
operating costs differ significantly for different institutions and can be attributed to achieving
economics of scale in operations .They saw that it is possible to adopt cost effective
operating structure while operating in same service space as other less efficient MFIs. they
used the existing literature to find out the costs that the MFis incur rather than using primary
data to find out about the different types of costs.
(Karlan, 2008) Credit Elasticities in Less-Developed Economies: Implications for
Microfinance.Test the assumption of price inelastic demand using randomized trials
conducted by a consumer lender in South Africa.identify demand curves for consumer credit
by randomizing both the interest rate offered to each of more than 50,000 past clients on a
direct mail solicitation, and the maturity of an example loan.The sample frame consisted of
all individuals from 86 predominantly urban branches who had borrowed from the Lender
27
within the past 24 months, were in good standing, and did not currently have a loan from the
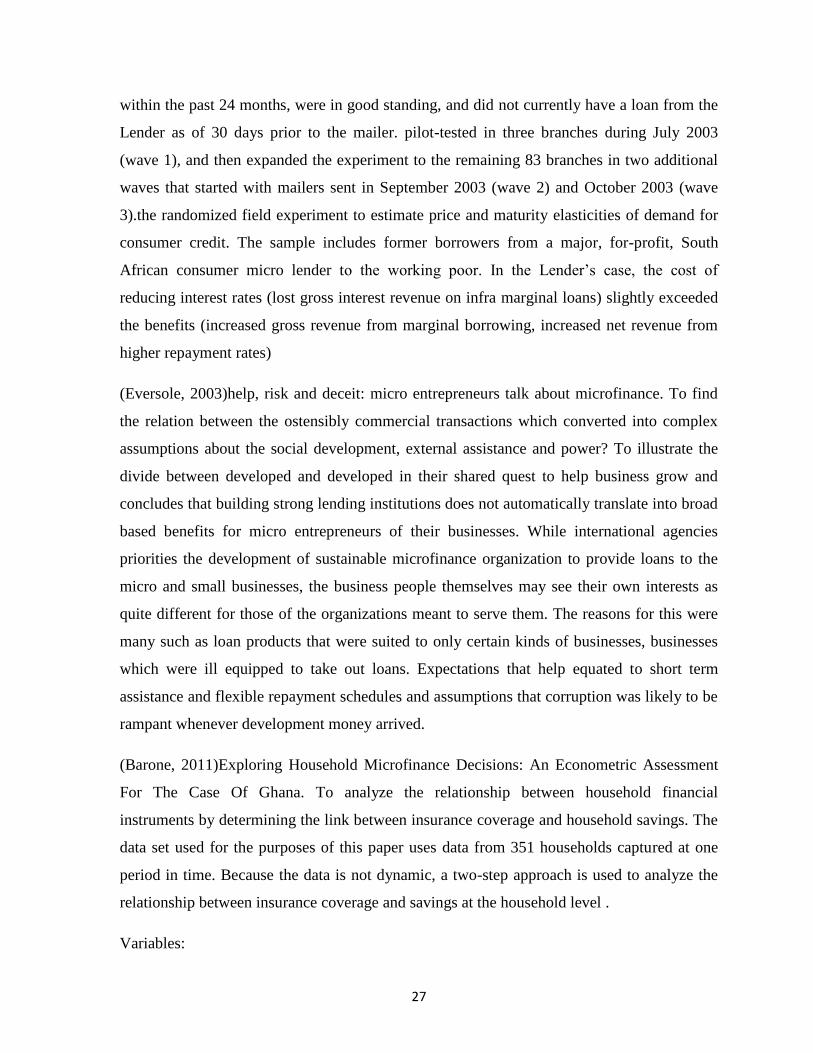
Lender as of 30 days prior to the mailer. pilot-tested in three branches during July 2003
(wave 1), and then expanded the experiment to the remaining 83 branches in two additional
waves that started with mailers sent in September 2003 (wave 2) and October 2003 (wave
3).the randomized field experiment to estimate price and maturity elasticities of demand for
consumer credit. The sample includes former borrowers from a major, for-profit, South
African consumer micro lender to the working poor. In the Lender‟s case, the cost of
reducing interest rates (lost gross interest revenue on infra marginal loans) slightly exceeded
the benefits (increased gross revenue from marginal borrowing, increased net revenue from
higher repayment rates)
(Eversole, 2003)help, risk and deceit: micro entrepreneurs talk about microfinance. To find
the relation between the ostensibly commercial transactions which converted into complex
assumptions about the social development, external assistance and power? To illustrate the
divide between developed and developed in their shared quest to help business grow and
concludes that building strong lending institutions does not automatically translate into broad
based benefits for micro entrepreneurs of their businesses. While international agencies
priorities the development of sustainable microfinance organization to provide loans to the
micro and small businesses, the business people themselves may see their own interests as
quite different for those of the organizations meant to serve them. The reasons for this were
many such as loan products that were suited to only certain kinds of businesses, businesses
which were ill equipped to take out loans. Expectations that help equated to short term
assistance and flexible repayment schedules and assumptions that corruption was likely to be
rampant whenever development money arrived.
(Barone, 2011)Exploring Household Microfinance Decisions: An Econometric Assessment
For The Case Of Ghana. To analyze the relationship between household financial
instruments by determining the link between insurance coverage and household savings. The
data set used for the purposes of this paper uses data from 351 households captured at one
period in time. Because the data is not dynamic, a two-step approach is used to analyze the
relationship between insurance coverage and savings at the household level .
Variables:
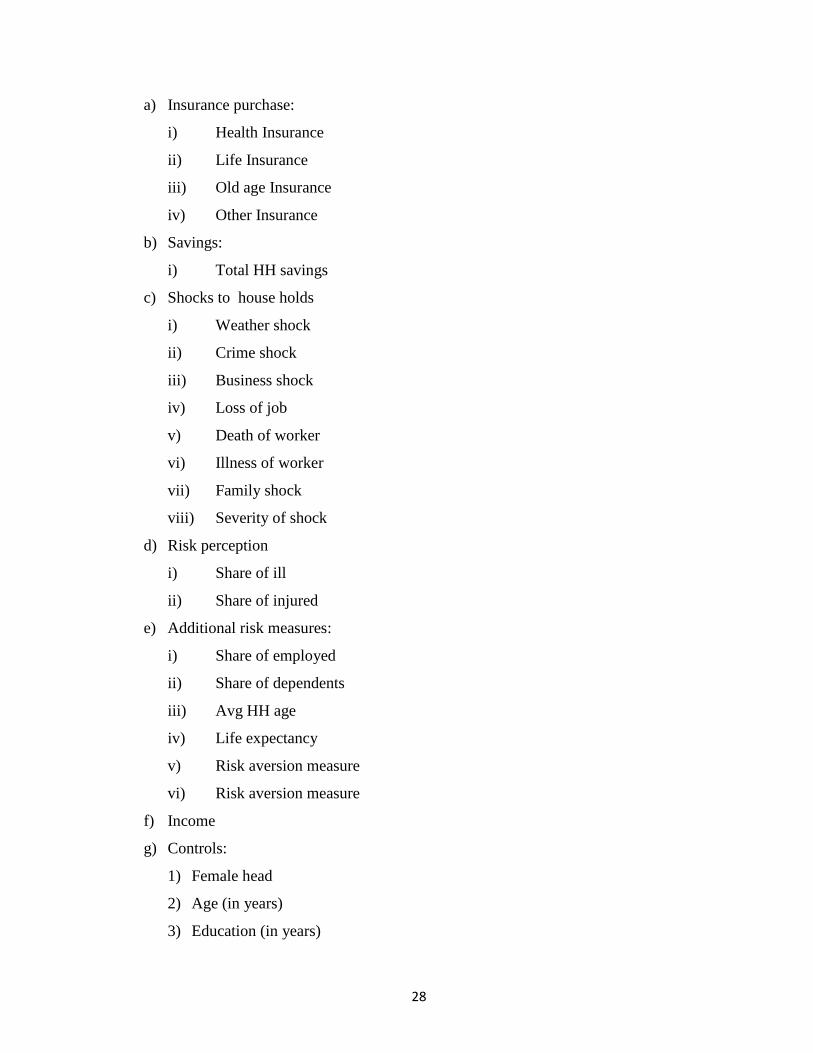
28
a) Insurance purchase:
i) Health Insurance
ii) Life Insurance
iii) Old age Insurance
iv) Other Insurance
b) Savings:
i) Total HH savings
c) Shocks to house holds
i) Weather shock
ii) Crime shock
iii) Business shock
iv) Loss of job
v) Death of worker
vi) Illness of worker
vii) Family shock
viii) Severity of shock
d) Risk perception
i) Share of ill
ii) Share of injured
e) Additional risk measures:
i) Share of employed
ii) Share of dependents
iii) Avg HH age
iv) Life expectancy
v) Risk aversion measure
vi) Risk aversion measure
f) Income
g) Controls:
1) Female head
2) Age (in years)
3) Education (in years)
29
4) HH earnings (occupational)
5) HH additional earnings
6) Distance to health provider (in km)
7) Vaccinations
8) Private Hospital
9) Health center1
10) Chemist/Pharmacist
11) Government Hospital
12) Mission Hospital
The sample mean , std dev of each of the variables was taken and analyzed based on the data.
Regression model of the nature:
P( Y=1, Health insurance) = α+β1 savings+β2 life insurance + β3 old age insurance +µ
Was constructed and regression analysis was done There are a variety of reasons to support
this claim. Financial tools, when used in unison, provide households with options for
managing assets. Prior to a shock, households can allocate income between savings and
insurance products to help protect against potential risks. The findings of this paper suggest
expanding access to products increases use through simple exposure. Households use saving
mechanisms and insurance products, they appear to increase their use of both products.
(crabb, 2007) foreign exchange risk management practices of microfinance institutions. to
review the current practices in the management of forex risk for and by MFIs.The advantages
and disadvantages of these practices The standard framework of the Forex risk measurements
are ,MeasuringVAR to exchange rate fluctuations,Purchasing derivatives of adjusting
portfolios to offset this risk, Continuously monitor the risk position.Diversify both the source
of debt capital and the use of debt capital, Insuring the risk of devaluation in the network,
Using currency swaps. Three general conclusions can be drawn from this study of Forex
exchange risk and MFIs.First need additional funding to meet demands and debt capital is
most likely source for funding. Second Forex exchange rate risk is significant and though it is
only one factor in a decision to lend to a MFI , it is a strong deterrent. The risk devaluation
against most major currencies such as the US dollar and the Euro is high and it is in these
30
currencies that any new debt capital is likely to be denominated. The existing Forex practices
are prohibitively expensive, either to the client or the institution. the potential intermediaries
or counter parties to any potential currency swap agreements were not discussed in the paper.
(Abiola, 2011)impact analysis of microfinance in Nigeria. To apply the financing constraints
approach to study whether microfinance institutions improve access to credit for
microenterprise in Nigeria or not. This paper is based on generating financial constraint
theory model thing or an event.
Pri = (1+ exp(-λi))-1, where λ is linearly dependent on the variables hypothesized to affect
the probability: λi = α + βXi.
The probability thus varies from 0 to 1 (λ = ±∞), and the model is simplified by rearranging it
into a log of the odds,
ln(Pi /(1 - Pi)) = α + βXi.
Which, for examples consists of individual outcomes, and can be estimated with maximum
likelihood. Interpretation of the coefficients can also be done by reverting back to the
probabilities. Thus,
Pr(IFA = 1) = f(α + β1IF + β2IO + y/Z)
where IFA is the decision to invest in fixed assets, IF is the variable for internal funds capital;
IO is the investment opportunity variable, and Z is a vector of variables that capture various
characteristics of the enterprise and the states in which it operates. Firms without investment
opportunities would not invest even if they had capital. Thus, control for investment
opportunity (IO) and separated it from the effect of internal funds (IF). The paper uses the
financing constraints approach to study the impact of microfinance on access to credit for
microenterprises in nigeria.The model contained ten independent variables (average profit,
market & skill, hired employee, asset loan, enterprise age, internally generated revenue,
business location, entrepreneur gender and availability of investment opportunity).They show
that MFBs improved access to credit in locations where more MFBs offered financial
products because investment in local microenterprises was less sensitive to availability of
internal funds in unconstrained location, than investment in microenterprises in locations
31
where microfinance activities were limited or non-existent and where micro entrepreneurs
had to rely more on internal funds for investment. Popularity of microfinance forces MFBs to
be more transparent and thereby decreases the cost of assembling a database with MFBs
branch distribution, therefore making the financing constraints approach more attractive for
use in the future.
(Rahman, 2011)The Development Perspective of Finance and Microfinance Sector in China:
How Far Is Microfinance Regulations? The paper reviews the development process of bank
and microfinance sector in China and presents their regulatory status. Research methodology:
since this paper is a review of existing literature there is so quantitative research
methodology. Microfinance structure and their services Since the first microfinance seed was
planted in China, a vast number of different types of microfinance operators have appeared
within the Chinese market. Generally, there are three broad categories of microfinance
service providers. These include,Micro-credit by financial institutes This category mostly
includes state own formal microfinance service providers i.e. ABC, ADBC, RCCs, Rural,
Commercial Bank, Rural Cooperative Bank, Postal Savings, China Development Bank
(CDB), MCC, VTB, LC, andRMCCs. The microfinance market share is dominated by these
providers.,Micro-credit by NGOs & international organizationsThe service providers are-
NGOs, international organizations and social organizations. The internationalorganizations
have been providing financial services as project based with the collaboration of government
agencies.They also incorporate different services beside micro-credit i.e savings, training in
project sites. NGO lending services have covered countrywide and large volume of business.
Micro-credit by Government agencies This category provides micro-credit focusing on the
government poverty reduction program. For instance, Urban Credit Bank (UCB) was
established to support laid-off workers which ultimately expanded micro-credit services to
urban areas.Only NGO-MFIs and MCCs are non-financial institutions and consequently not
allowed to work with savings or receive funding from commercial banks –thus, preventing
them from enjoying economies of scale Even the lending companies are also not allowed to
work with savings. In addition, the three newly created rural financial institutions (VTBs,
LCs, and RMCCs) as well as MCCs are subjected to geographical restriction. The traditional
collateral system for micro-financing still exists particularly for micro-lending companies,
lending companies, postal saving banks, MCCs, and VTBs. Even RCCs and UCCs have
32
followed a special kind of collateral to credit disbursement. RCCs required collateral for
large loan amounts and UCCs required companies guarantee. On the other hand, the donor
funded projects (UNDP, UNFPA, UNICEF, Heifer Project, World Vision, Oxfam Hong
Kong and CIDA) are allowed to providing micro-credit services by collaboration with
government departments or agencies having certain conditions. that the banking and
microfinance services have expanded and improved gradually. Hence, the banking sector is
close to the maturity stage while the microfinance sector is still at learning stage. CBRC is
the sole institute to deal with policy regulations for banks and microfinance service providers
which may contradict to handle different goal oriented institutes (Banks and MFIs run their
business in different perspectives).Author recommended to the concerned authorities to have
a balanced policy regulation for the microfinance
(Jiwani, 2007) Sustainable Microfinance: The Impact Of Pay For Performance On Key
Performance Indicators. This study investigated the relationships between pay-for-
performance incentive programs and loan officer productivity in microfinance institutions
(MFIs).
Loan officers‟ performance is measured by five key performance indicators:
1) new borrowers,
2) portfolio value,
3) average loan size,
4) arrear rate,
5) default rate.
The independent variable is the loan officer‟s financial incentive (the percentage of salary
that is based on performance). Five dependent measures (performance outcomes) have been
examined:
a) number of new borrowers,
b) value of portfolio,
c) average loan size of the borrowers,
d) number of borrowers in arrears (loans overdue > 30 days),
e) number of borrowers in default (loan overdue >90 days).
33
The second research question uses survey questions from supervisors of loan officers, and
loan officers to assess the impact of the productivity level of MFIs with financial incentives
and MFIs without financial incentives: Is there a difference between the productivity level of
loan officers at MFIs with financial incentives and MFIs without financial incentives All five
hypotheses suggested that there would be an increase in productivity with higher incentives.
Results indicated that the number of new borrowers was related to the size of the incentive
program. The negative correlation between the number of new borrowers and the size of the
incentive program indicated that MFIs with larger incentive programs had loan officers with
a smaller number of new borrowers in each month, and overall. There were no relationships
between the size of the incentive program and any of the other performance measures.
(Kundu, 2012)Savings, Lending Rate and Skill Improvement in Microfinance Operating
Through Public-Private Cooperation.microfinance program through joint liability credit
contract is explained with the help of a two-stage game when the program is operated by a
non-motivated NGO with the help of a commercial bank and government. Initially, the
author assume that two homogeneous members belong to the same village form SHG on the
basis of joint liability only for two periods. The group is formed by the initiative of an NGO
whose basic activities are:
1) Motivating local housewives to form SHG;
2) Collecting savings (contribution) from them in installment and giving them technical
knowledge for skill improvement of the participants at the initial stage;
3) Bridging the gap between the group and the bank as well as the government;
4) Maintaining the group corpus;
5) Collecting subsidy and cash credit from the DRDA and bank respectively;
6) Disbursing credit simultaneously to both the members and recovering credit from the
members
7) Generating profit after performing all these activities at the end of the second period.
Government Subsidized Microfinance Program in the Total Absence of Social Sanction:
Suppose each member of the group is willing to contribute (save) x amount in each
installment and each member has to contribute 2t times in each year. The amount saved by
each group member in each installment is deposited in the office of the NGO and the NGO
34
deposits the amount in the linked commercial bank. assume that before getting first credit
from her group, each member has to save t times regularly. During this period, she is also
getting skill-training from the NGO without spending any amount. Total amount
accumulated in the group after contributing for „t‟ times by each member is:
2tx(1 + i) = 2X(1 + i), where 2tx = X.
The NGO withdraws 2X amount from bank and distributes that equally among the group
members as credit against a rate of interest rˆ. The income earned by each member after
utilizing the microcredit as the working capital can be expressed as:
Ym = ƟX, where mϵ {1, 2} ...(1)
Here Ɵ is the degree of technical knowledge gained by each group member after group
formation from the NGO and Ɵ > 1. It is also assumed that the husbands of both the
members are earning members and ready to contribute their entire income for their family.
The annual earning of the husband of each group member is W and 2x < W. At the end of the
first stage, we have four possible levels of consumption of both the member households. If
the group member is well-behaved and is ready to repay her own loan with interest at the end
of the year, then the consumption of the non-defaulter member household will be:
CmGR
= W+ƟX- 2X+ X(1+ rˆ)
where m ϵ{1, 2}
It reestablishes the fact that even in the presence of government subsidy in microcredit
program under joint liability through formation of SHG, social sanction or depriving the
members from enjoying further benefits from the government still plays an important role of
security at the time of repayment of loan.It is also proved that if the group members are not
equally powerful in the society, then in the second stage of the game, the powerful member
applying her social influence and taking advantage of joint liability may force the less
powerful member to repay her loan with interest and enjoy a free ride. So positive assortative
matching, both from the economic as well as social point of view, is necessary at the time of
35
group formation and that should be maintained in both the periods to keep repayment rate
100%.
(Arch, 2005)Microfinance and development: risk and return for a policy outcome perspective
This paper address microfinance- financial services products including credit loans and
insurance which encourage productive and entrepreneurial activity for the marginalized often
unbanked also known as the poverty market. This paper provides the overview of the
microfinance market space, its industry players and it addresses current issues in
development policy. This is a descriptive paper hence the author has considered various
scenarios and analyzed the microfinance market The problem with the financial system of
Kenya is that it was built as if the structure of the economy was that o England or the US. In
reality all most all the people are small farmers, vendors and informal sector industrialists.
Hence a financial system that serves the reality should be created. The maturing of the
microfinance market has led to some spectacular successes.
(Stackel, 2010)Reducing Defaults In Microfinance: A Case Study Of Fundación Integral
Campesino (Finca) Costa Rica.This study seeks to determine why some microfinance
institutions have high default rates while other have low ones. Three literature-based
hypotheses regarding default reduction were tested on communal credit enterprises (CCEs)
of a poverty-focused microfinance program called FINCA Costa Rica. The hypothesis author
derived were from the literature review
a) Creating a highly-unified structure/group sentiment within MFIs,
b) implementing good quality training programs,
c) exerting discipline in financial administration.
These three methods were be explored here. The five CCEs also show differing
characteristics, related to default rates. Each CCE tracks their default rates on a document
called the credit profile, which shows all outstanding loans and the most current payment
status. The payment status can be: paid, between 1-30 days late, between 30-60 days late,
between 60-90 days late, and more than 90 days late. Starting with figure 3.5, the following
charts show the long-term default rates for each CCE during the months of August and
December. compare the group structures, training programs received, and amount of
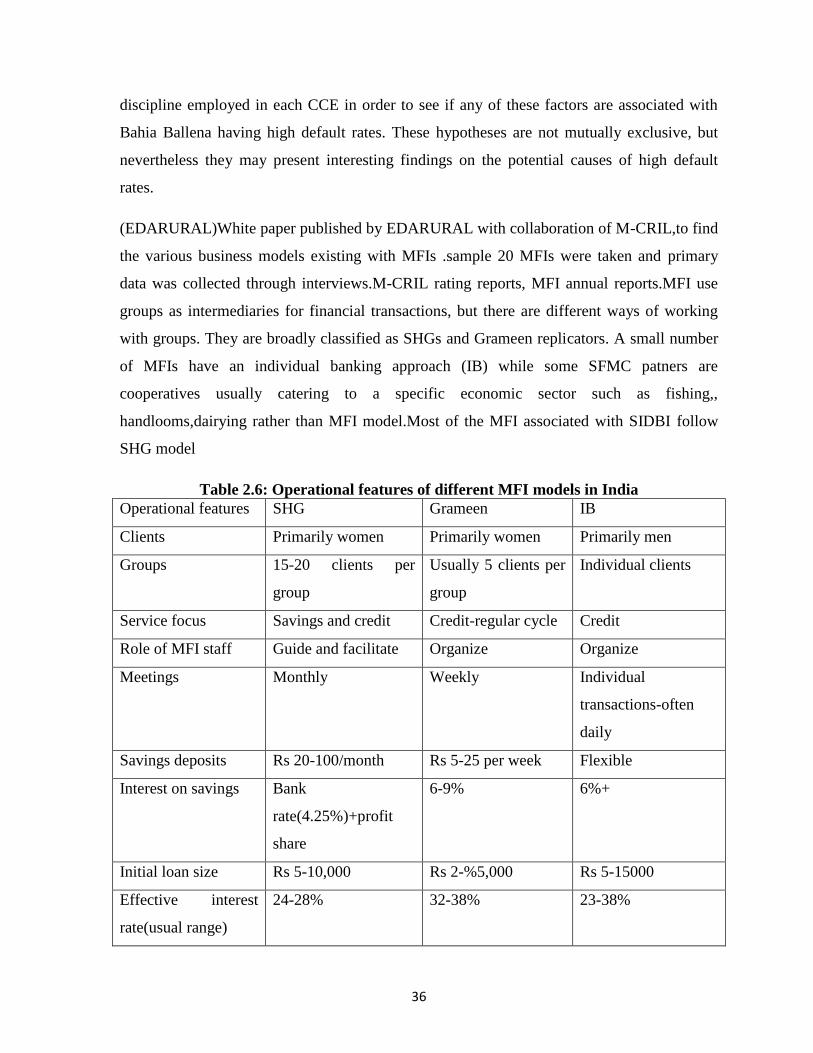
36
discipline employed in each CCE in order to see if any of these factors are associated with
Bahia Ballena having high default rates. These hypotheses are not mutually exclusive, but
nevertheless they may present interesting findings on the potential causes of high default
rates.
(EDARURAL)White paper published by EDARURAL with collaboration of M-CRIL,to find
the various business models existing with MFIs .sample 20 MFIs were taken and primary
data was collected through interviews.M-CRIL rating reports, MFI annual reports.MFI use
groups as intermediaries for financial transactions, but there are different ways of working
with groups. They are broadly classified as SHGs and Grameen replicators. A small number
of MFIs have an individual banking approach (IB) while some SFMC patners are
cooperatives usually catering to a specific economic sector such as fishing,,
handlooms,dairying rather than MFI model.Most of the MFI associated with SIDBI follow
SHG model
Table 2.6: Operational features of different MFI models in India
Operational features SHG Grameen IB
Clients Primarily women Primarily women Primarily men
Groups 15-20 clients per
group
Usually 5 clients per
group
Individual clients
Service focus Savings and credit Credit-regular cycle Credit
Role of MFI staff Guide and facilitate Organize Organize
Meetings Monthly Weekly Individual
transactions-often
daily
Savings deposits Rs 20-100/month Rs 5-25 per week Flexible
Interest on savings Bank
rate(4.25%)+profit
share
6-9% 6%+
Initial loan size Rs 5-10,000 Rs 2-%5,000 Rs 5-15000
Effective interest
rate(usual range)
24-28% 32-38% 23-38%
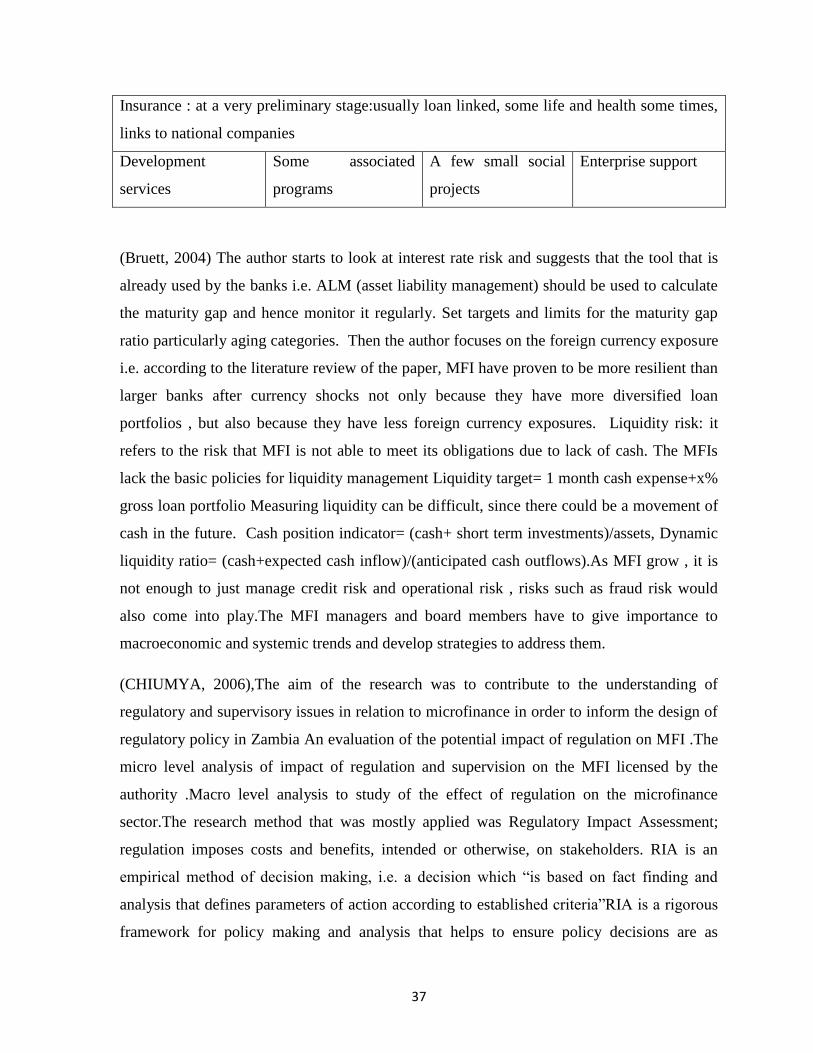
37
Insurance : at a very preliminary stage:usually loan linked, some life and health some times,
links to national companies
Development
services
Some associated
programs
A few small social
projects
Enterprise support
(Bruett, 2004) The author starts to look at interest rate risk and suggests that the tool that is
already used by the banks i.e. ALM (asset liability management) should be used to calculate
the maturity gap and hence monitor it regularly. Set targets and limits for the maturity gap
ratio particularly aging categories. Then the author focuses on the foreign currency exposure
i.e. according to the literature review of the paper, MFI have proven to be more resilient than
larger banks after currency shocks not only because they have more diversified loan
portfolios , but also because they have less foreign currency exposures. Liquidity risk: it
refers to the risk that MFI is not able to meet its obligations due to lack of cash. The MFIs
lack the basic policies for liquidity management Liquidity target= 1 month cash expense+x%
gross loan portfolio Measuring liquidity can be difficult, since there could be a movement of
cash in the future. Cash position indicator= (cash+ short term investments)/assets, Dynamic
liquidity ratio= (cash+expected cash inflow)/(anticipated cash outflows).As MFI grow , it is
not enough to just manage credit risk and operational risk , risks such as fraud risk would
also come into play.The MFI managers and board members have to give importance to
macroeconomic and systemic trends and develop strategies to address them.
(CHIUMYA, 2006),The aim of the research was to contribute to the understanding of
regulatory and supervisory issues in relation to microfinance in order to inform the design of
regulatory policy in Zambia An evaluation of the potential impact of regulation on MFI .The
micro level analysis of impact of regulation and supervision on the MFI licensed by the
authority .Macro level analysis to study of the effect of regulation on the microfinance
sector.The research method that was mostly applied was Regulatory Impact Assessment;
regulation imposes costs and benefits, intended or otherwise, on stakeholders. RIA is an
empirical method of decision making, i.e. a decision which “is based on fact finding and
analysis that defines parameters of action according to established criteria”RIA is a rigorous
framework for policy making and analysis that helps to ensure policy decisions are as
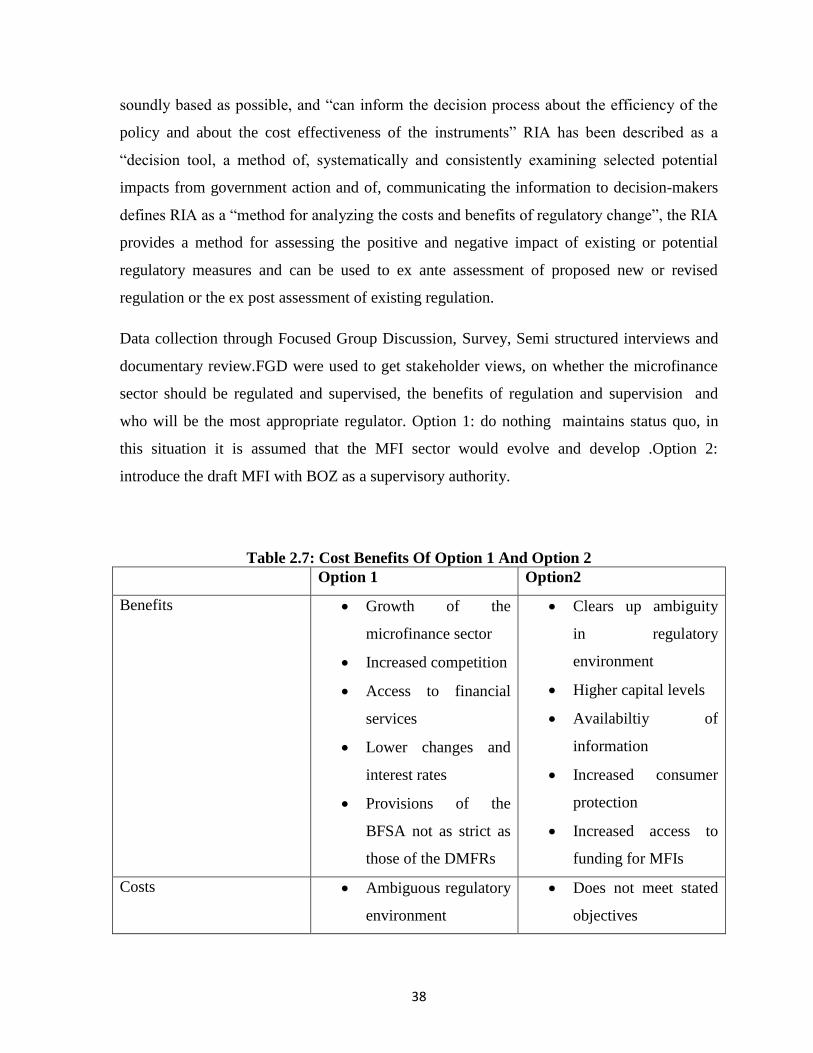
38
soundly based as possible, and “can inform the decision process about the efficiency of the
policy and about the cost effectiveness of the instruments” RIA has been described as a
“decision tool, a method of, systematically and consistently examining selected potential
impacts from government action and of, communicating the information to decision-makers
defines RIA as a “method for analyzing the costs and benefits of regulatory change”, the RIA
provides a method for assessing the positive and negative impact of existing or potential
regulatory measures and can be used to ex ante assessment of proposed new or revised
regulation or the ex post assessment of existing regulation.
Data collection through Focused Group Discussion, Survey, Semi structured interviews and
documentary review.FGD were used to get stakeholder views, on whether the microfinance
sector should be regulated and supervised, the benefits of regulation and supervision and
who will be the most appropriate regulator. Option 1: do nothing maintains status quo, in
this situation it is assumed that the MFI sector would evolve and develop .Option 2:
introduce the draft MFI with BOZ as a supervisory authority.
Table 2.7: Cost Benefits Of Option 1 And Option 2
Option 1 Option2
Benefits Growth of the
microfinance sector
Increased competition
Access to financial
services
Lower changes and
interest rates
Provisions of the
BFSA not as strict as
those of the DMFRs
Clears up ambiguity
in regulatory
environment
Higher capital levels
Availabiltiy of
information
Increased consumer
protection
Increased access to
funding for MFIs
Costs Ambiguous regulatory
environment
Does not meet stated
objectives
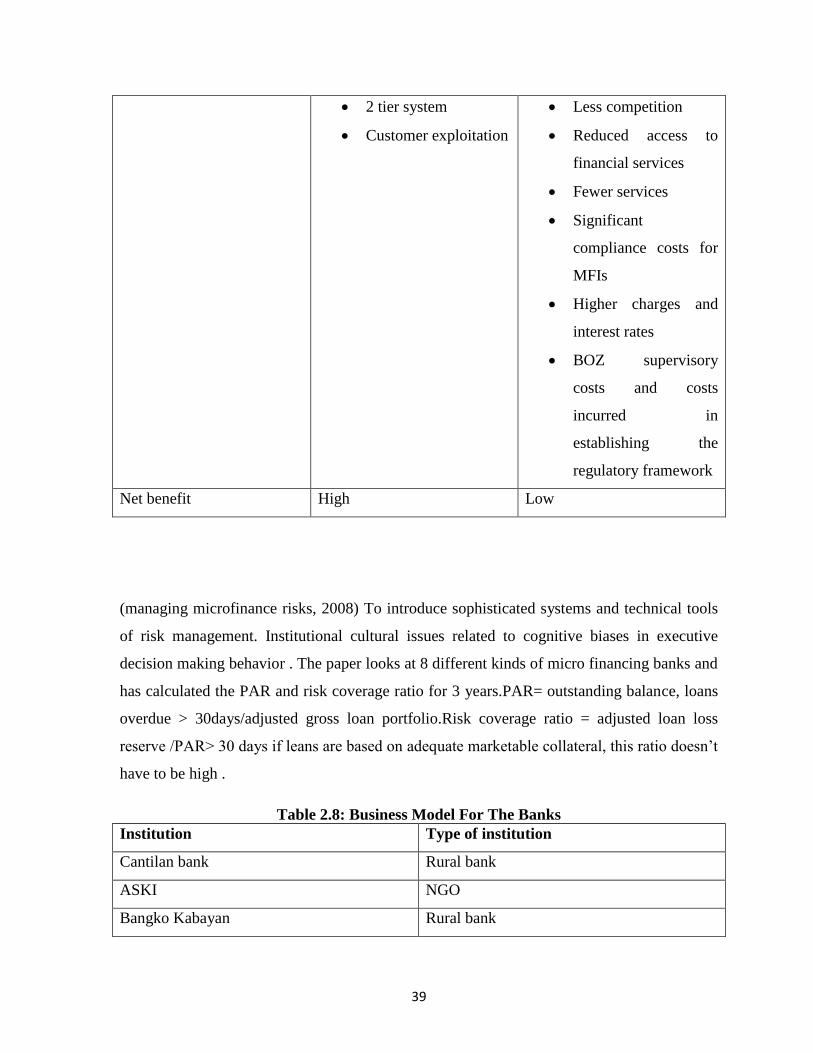
39
2 tier system
Customer exploitation
Less competition
Reduced access to
financial services
Fewer services
Significant
compliance costs for
MFIs
Higher charges and
interest rates
BOZ supervisory
costs and costs
incurred in
establishing the
regulatory framework
Net benefit High Low
(managing microfinance risks, 2008) To introduce sophisticated systems and technical tools
of risk management. Institutional cultural issues related to cognitive biases in executive
decision making behavior . The paper looks at 8 different kinds of micro financing banks and
has calculated the PAR and risk coverage ratio for 3 years.PAR= outstanding balance, loans
overdue > 30days/adjusted gross loan portfolio.Risk coverage ratio = adjusted loan loss
reserve /PAR> 30 days if leans are based on adequate marketable collateral, this ratio doesn‟t
have to be high .
Table 2.8: Business Model For The Banks
Institution Type of institution
Cantilan bank Rural bank
ASKI NGO
Bangko Kabayan Rural bank
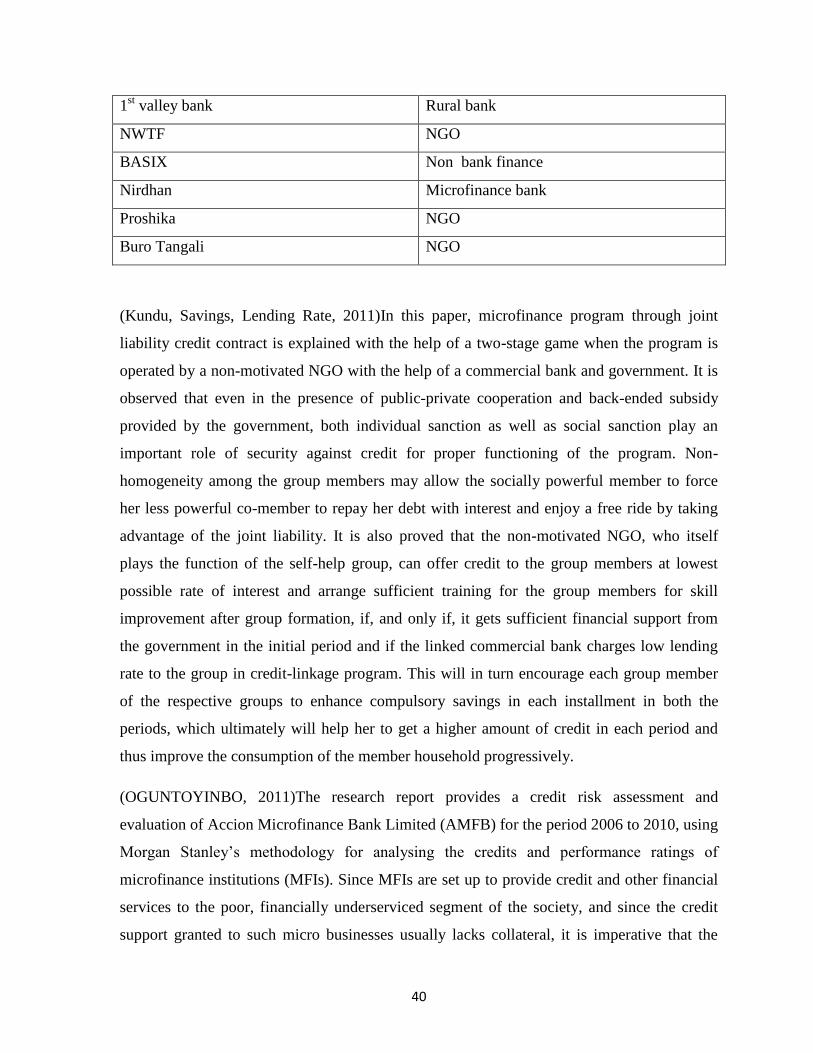
40
1st valley bank Rural bank
NWTF NGO
BASIX Non bank finance
Nirdhan Microfinance bank
Proshika NGO
Buro Tangali NGO
(Kundu, Savings, Lending Rate, 2011)In this paper, microfinance program through joint
liability credit contract is explained with the help of a two-stage game when the program is
operated by a non-motivated NGO with the help of a commercial bank and government. It is
observed that even in the presence of public-private cooperation and back-ended subsidy
provided by the government, both individual sanction as well as social sanction play an
important role of security against credit for proper functioning of the program. Non-
homogeneity among the group members may allow the socially powerful member to force
her less powerful co-member to repay her debt with interest and enjoy a free ride by taking
advantage of the joint liability. It is also proved that the non-motivated NGO, who itself
plays the function of the self-help group, can offer credit to the group members at lowest
possible rate of interest and arrange sufficient training for the group members for skill
improvement after group formation, if, and only if, it gets sufficient financial support from
the government in the initial period and if the linked commercial bank charges low lending
rate to the group in credit-linkage program. This will in turn encourage each group member
of the respective groups to enhance compulsory savings in each installment in both the
periods, which ultimately will help her to get a higher amount of credit in each period and
thus improve the consumption of the member household progressively.
(OGUNTOYINBO, 2011)The research report provides a credit risk assessment and
evaluation of Accion Microfinance Bank Limited (AMFB) for the period 2006 to 2010, using
Morgan Stanley‟s methodology for analysing the credits and performance ratings of
microfinance institutions (MFIs). Since MFIs are set up to provide credit and other financial
services to the poor, financially underserviced segment of the society, and since the credit
support granted to such micro businesses usually lacks collateral, it is imperative that the
41
management of such credit services be sound in order to mitigate the high risks involved.
Thus, credit risk management determines the success and survival of microfinance banks
(MFBs): weak credit management leads to capital erosion and eventual failure, whereas
sound credit risk management guarantees profitability and sustainability and, hence, the
realisation of the objectives of their setup – enhancing the welfare of micro-entrepreneurs.
The data for the research report were sourced from AMFB‟s financial statements for the
years 2006 to 2010 and from interviews that were conducted with principal officials of this
MFB. The research found that good regulatory corporate governance and management
practices, sound quantitative credit risk assessment and management, and quality and
maturity of management lead to low credit risk accompanied by high profitability and
sustainability for MFBs. As AMFB matured, the quality of portfolio, profitability,
sustainability and operating efficiency were seen to increase. The quality of shareholders,
board and management was found to be crucial for the sound management of the MFB. The
research report, therefore, recommends regular and continuous credit risk identification,
assessment and management, as well as sound corporate governance, if MFBs are to survive
and grow and achieve their developmental objectives
(Arvelo, 2008)The methodology addresses the specific challenges inherentvin microfinance
such as country risk, data availability and minimal default history among microfinance
institutions. Importantly, the methodology draws upon the work of major pioneers in
microfinance rating, including Standard and Poor‟s June 2007 report on assessing
microfinance risks, as well as the analysis of specialized rating agencies like Planet Finance,
MicroRate, M-CRIL and CRISIL. They also incorporated research insights made available
by important industry players like ACCION and the Consultative Group to Assist the Poor.2
Finally, our methodology builds on credit analysis processes used to assess established
emerging markets financial institutions and companies, applying the team‟s extensive
experience in emerging markets credit evaluation. the article describes the framework and
credit risk assessment process we use to determine internal global scale ratings for
microfinance institutions, including a detailed discussion of both conventional and
specialized credit evaluation metrics. The analysis has identified seven “rating factors” that
are important to consider when assessing the credit risk of these institutions: (1) loan
portfolio; (2) profitability, sustainability and operating efficiency; (3) management and
42
strategy; (4) systems and reporting; (5) operating procedures and internal controls; (6) asset-
liability management; and (7) growth potential. And before getting into the particulars, two
important .institutions that are (a) strictly dedicated to providing microfinance products and
(b) whose business model mainly revolves around providing microloans used to finance the
businesses of microentrepreneurs. Second, while it may be possible to make modifications to
or extrapolate from this model in the future, in its current form this framework considers the
industry only as it is today.
(Pearlman, 2007)This report explores the problems of low productivity in the microenterprise
sector and of low formal credit use, principally microfinance, by poor households.
Vulnerability to risk, defined as the inability to smooth consumption across negative income
shocks, as a new explanation for both phenomena. The limited ability to manage risk May
lead some poor households to choose low yield, low risk enterprises over higher yield but
more risky options. It also may lead them to forgo formal credit if this is used to finance high
yield/ high risk projects. Using both theoretical models and empirical evidence from
microentrepreneurs in Lima, Peru . Vulnerability is an important determinant of enterprise
choice and microfinance selection.
(Saad, 2009)Rural credit programs in developing countries are designed to help the poorest
of the poor by providing collateral-free loans at a low cost. In order to properly measure
The efficacy of these programs, one needs to examine not only the pecuniary benefits of the
programs but also the non-pecuniary benefits. The micro-loans are mandated for income-
generating purpose such as investing in a micro-enterprise. To elaborate, one way that credit
programs can benefit the poor is by providing them opportunities to increase their income.
Another way that these programs benefit is by empowering women. The credit programs tend
to target poor women, thereby providing them with income generating opportunities that they
otherwise lack. A woman's potential contribution to the household income may increase her
intra-household bargaining power and empower her. This may have far-reaching
consequences in terms of household investment in children's health and education, as well as
a woman's wellbeing. In the following thesis, the two different effects of credit programs.
The examines the effect of borrowing from credit and non-credit programs on self-
employment profits. The second chapter examines the effect of men's and women's self-
43
employment profits on woman's intra-household bargaining power and how it differs with
the gender of the primary borrower. The self-employment activities that are considered were
primarily funded by the credit programs or by noncredit sources such as commercial banks
and moneylenders.
(Kero, 2011)This paper analyzes two complementary macroprudential regulations that deal
with the problem of banks capital procyclicality; the countercyclical capital bu¤ers and
Spanish dynamic provisioning. The regulatory advances in relation to consultative
documents published by the Basel Commission in 2009 and 2011, known as the Basel III .In
the case of countercyclical capital buyers and concentrate in the discussion between Repullo
and Suarez (2011) and the Basel III proposal, if the gap of credit to Gdp is an appropriate
variable to activate the capital buyers. the reasons that show that Repullo and Suarez (2011)
is not a very well-founded critique against the Basel III and a number of issues that require
more research in this topic. The quantitative papers in the literature that try to account for the
efficiency of the Basel III regulations. The results of the literature show that the
countercyclical capital buyers contribute to the stabilization of the economy and the output
loss for the implementation of these regulations is not very big and in aggregate terms the
regulated economies perform much more better. Finally in the case of the Spanish dynamic
provisioning, both the regulatory authorities and the academic literature support its
implementation worldwide. The next step will be to build a theoretical framework that will
allow me to identify which is the most efficient regulation.
2.5 CONCLUSION:
The conclusion drawn from this literature review is that, there has been a lot of study on MFI
in Africa but not many in India. there is a definite regulatory body for MFIs in other
countries , but where as in India it has been up to RBI for registered MFI(NBFI) but the rest
of them work in the form of trust, which is not a regulated space. The type of customers
MFIs attract need high degree of customization since they have been and they also attract a
lot risks which is mostly linked to credit risks. The MFIs tend to cover their risks by
adjusting them to the interest rates which are so as to maintain the balance of risk and return.
There have been many models used for African nations but not in India which I see as
research gap and can be explored.

CHAPTER III
Research methodology

44
3.1 INTRODUCTION:
This chapter discusses the research methodology that has been undertaken while testing the
credit risk of microfinance industry in India. It contains the sampling method, the
questionnaire, the method of data collection, the models used and the method of analysis.
3.2 STATEMENT OF THE PROBLEM:
This study addresses the following problems:
a) To credit assess the Microfinance industry in India
b) To build a random effect model, in order to project the credit risk for a particular MFI
for the subsequent years.
3.3 THE MODEL:
The following is based on “Morgan Stanley credit risk assessment model.” Which gives an
idea of the credit risk of the MFI industry. And the variables are listed on in the table.
Table 3.1: Morgan Stanley Credit Assessment Model
RATING
FACTOR INDICATOR DEFINITIONS GRADES
Loan portfolio A1: portfolio at risk=( outstanding
loans with arrears over 30 days+
rescheduled or restructured loans)/
total gross loan portfolio. It is the
value of the loans which are
outstanding at the end of 30 days.
This assesses the credit risk that a
loan portfolio is carrying.
<3;<6;<9;<12;<15; above
15
A2: write offs=total write offs over
the last 12 months/average gross loan
portfolio. This is an independent
<2;<3.5;<5;<7;<10; above
10
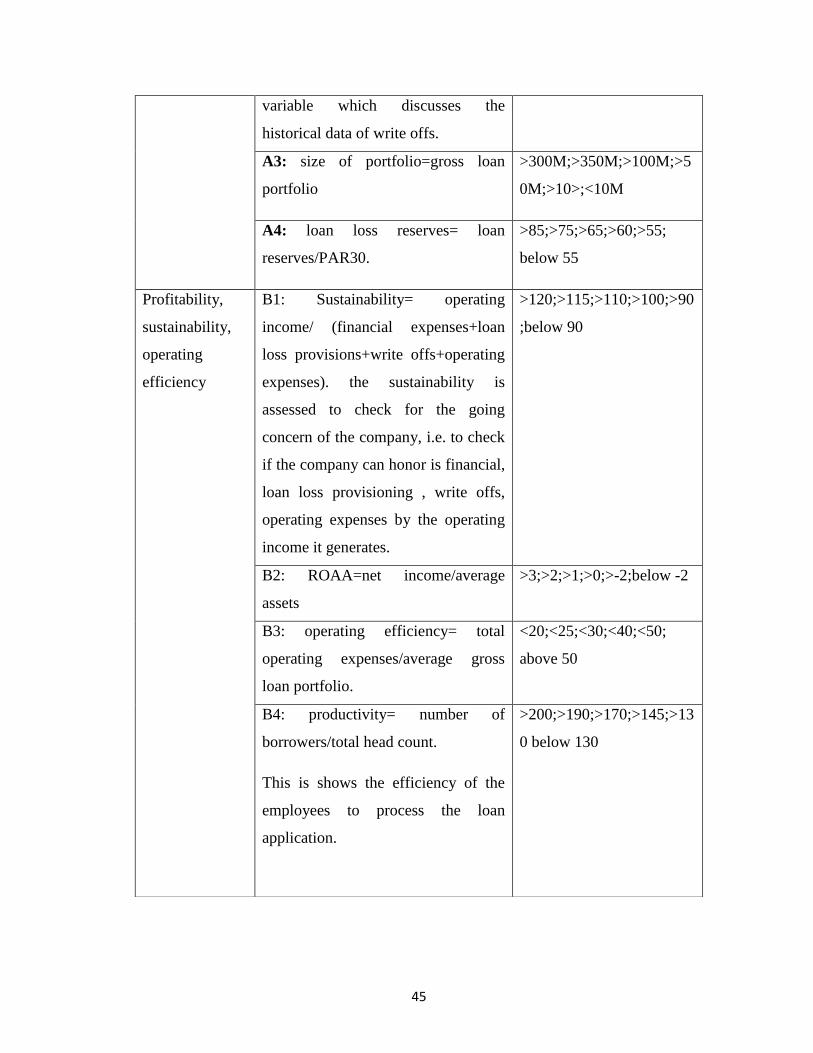
45
variable which discusses the
historical data of write offs.
A3: size of portfolio=gross loan
portfolio
>300M;>350M;>100M;>5
0M;>10>;<10M
A4: loan loss reserves= loan
reserves/PAR30.
>85;>75;>65;>60;>55;
below 55
Profitability,
sustainability,
operating
efficiency
B1: Sustainability= operating
income/ (financial expenses+loan
loss provisions+write offs+operating
expenses). the sustainability is
assessed to check for the going
concern of the company, i.e. to check
if the company can honor is financial,
loan loss provisioning , write offs,
operating expenses by the operating
income it generates.
>120;>115;>110;>100;>90
;below 90
B2: ROAA=net income/average
assets
>3;>2;>1;>0;>-2;below -2
B3: operating efficiency= total
operating expenses/average gross
loan portfolio.
<20;<25;<30;<40;<50;
above 50
B4: productivity= number of
borrowers/total head count.
This is shows the efficiency of the
employees to process the loan
application.
>200;>190;>170;>145;>13
0 below 130
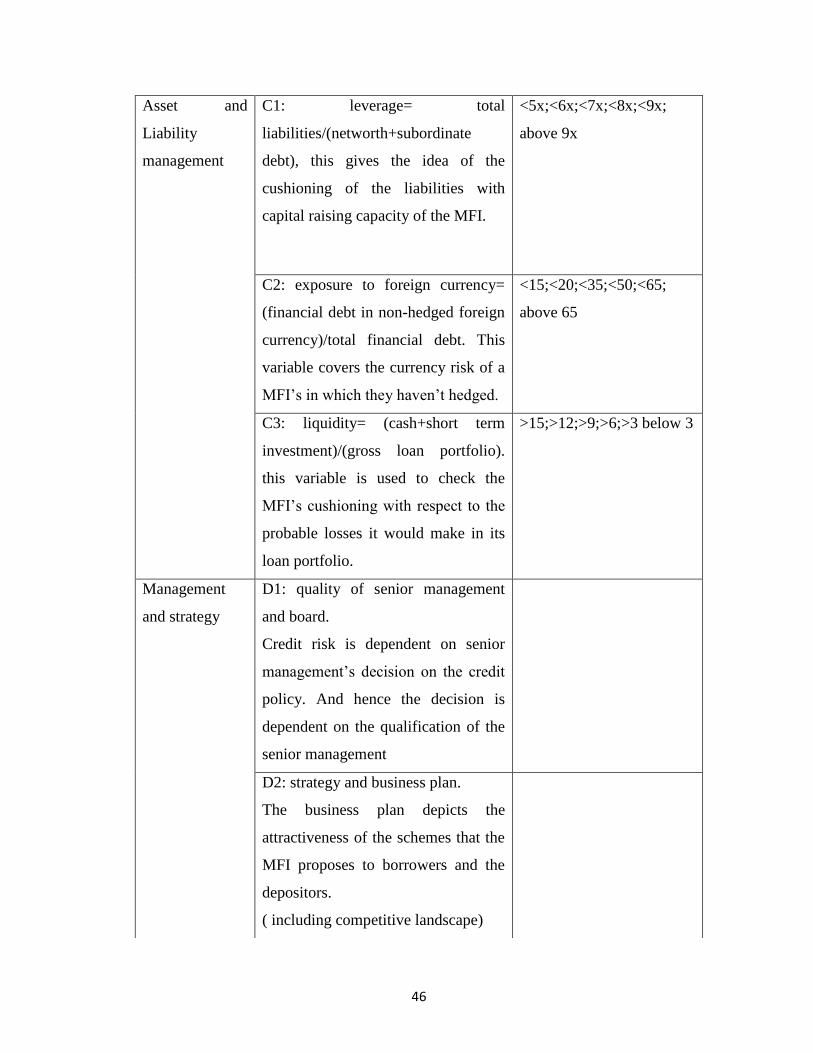
46
Asset and
Liability
management
C1: leverage= total
liabilities/(networth+subordinate
debt), this gives the idea of the
cushioning of the liabilities with
capital raising capacity of the MFI.
<5x;<6x;<7x;<8x;<9x;
above 9x
C2: exposure to foreign currency=
(financial debt in non-hedged foreign
currency)/total financial debt. This
variable covers the currency risk of a
MFI‟s in which they haven‟t hedged.
<15;<20;<35;<50;<65;
above 65
C3: liquidity= (cash+short term
investment)/(gross loan portfolio).
this variable is used to check the
MFI‟s cushioning with respect to the
probable losses it would make in its
loan portfolio.
>15;>12;>9;>6;>3 below 3
Management
and strategy
D1: quality of senior management
and board.
Credit risk is dependent on senior
management‟s decision on the credit
policy. And hence the decision is
dependent on the qualification of the
senior management
D2: strategy and business plan.
The business plan depicts the
attractiveness of the schemes that the
MFI proposes to borrowers and the
depositors.
( including competitive landscape)
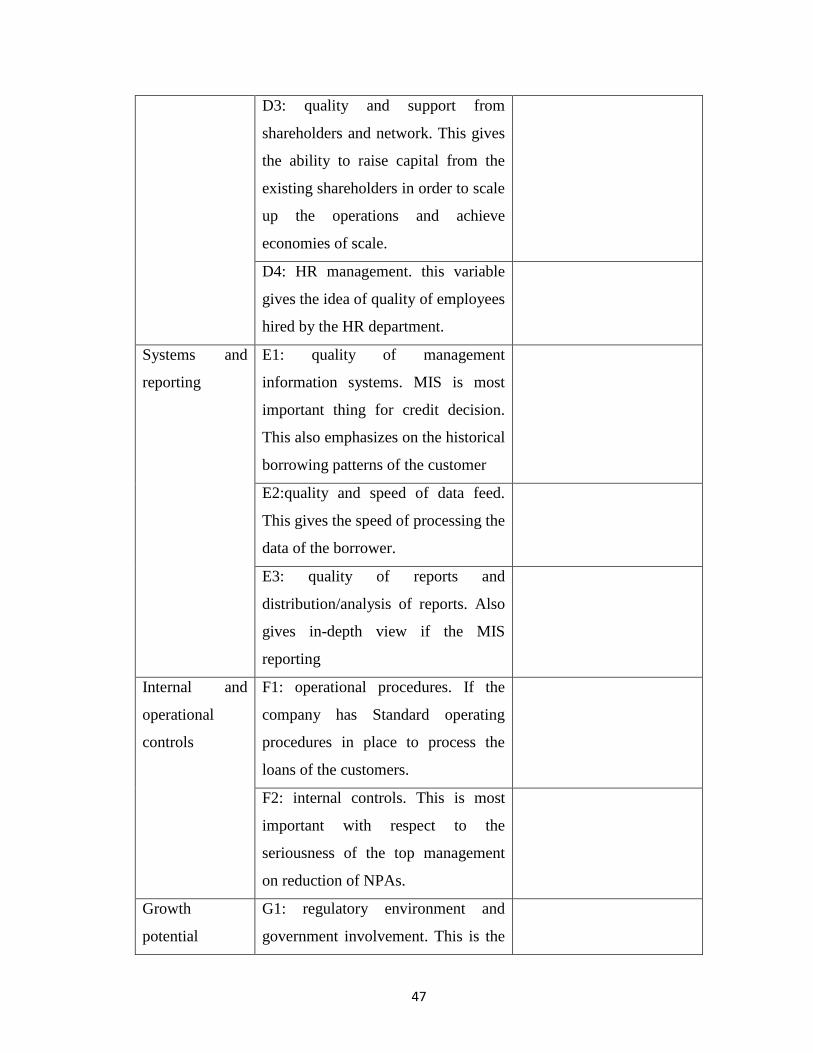
47
D3: quality and support from
shareholders and network. This gives
the ability to raise capital from the
existing shareholders in order to scale
up the operations and achieve
economies of scale.
D4: HR management. this variable
gives the idea of quality of employees
hired by the HR department.
Systems and
reporting
E1: quality of management
information systems. MIS is most
important thing for credit decision.
This also emphasizes on the historical
borrowing patterns of the customer
E2:quality and speed of data feed.
This gives the speed of processing the
data of the borrower.
E3: quality of reports and
distribution/analysis of reports. Also
gives in-depth view if the MIS
reporting
Internal and
operational
controls
F1: operational procedures. If the
company has Standard operating
procedures in place to process the
loans of the customers.
F2: internal controls. This is most
important with respect to the
seriousness of the top management
on reduction of NPAs.
Growth
potential
G1: regulatory environment and
government involvement. This is the
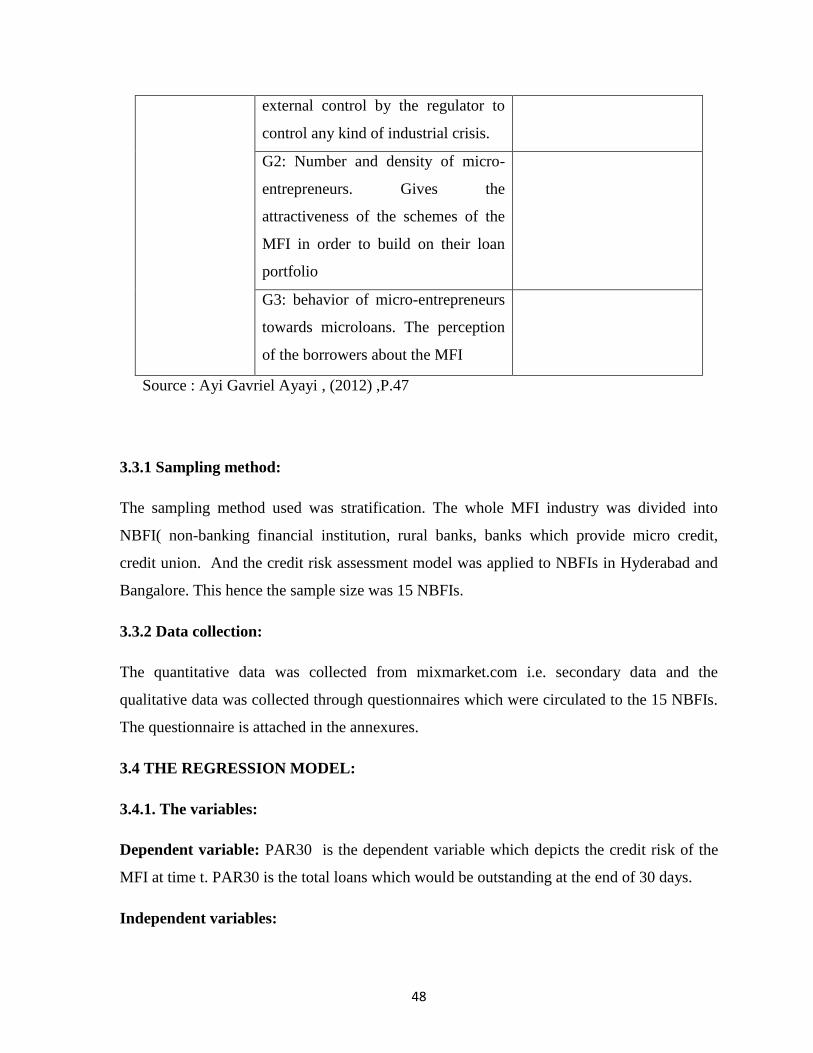
48
3.3.1 Sampling method:
The sampling method used was stratification. The whole MFI industry was divided into
NBFI( non-banking financial institution, rural banks, banks which provide micro credit,
credit union. And the credit risk assessment model was applied to NBFIs in Hyderabad and
Bangalore. This hence the sample size was 15 NBFIs.
3.3.2 Data collection:
The quantitative data was collected from mixmarket.com i.e. secondary data and the
qualitative data was collected through questionnaires which were circulated to the 15 NBFIs.
The questionnaire is attached in the annexures.
3.4 THE REGRESSION MODEL:
3.4.1. The variables:
Dependent variable: PAR30 is the dependent variable which depicts the credit risk of the
MFI at time t. PAR30 is the total loans which would be outstanding at the end of 30 days.
Independent variables:
external control by the regulator to
control any kind of industrial crisis.
G2: Number and density of micro-
entrepreneurs. Gives the
attractiveness of the schemes of the
MFI in order to build on their loan
portfolio
G3: behavior of micro-entrepreneurs
towards microloans. The perception
of the borrowers about the MFI
Source : Ayi Gavriel Ayayi , (2012) ,P.47

49
Write offs: this is the ratio between total write offs over the last 12 months/average gross
loan portfolio, Log of gross loan portfolio, operating sustainability, return of assets, operating
efficiency, productivity, log of leverage, liquidity, bank dummy, credit union dummy,NBFI
dummy,rural banking dummy.
3.4.2 Hypothesis:
Hypothesis 1:
H0: write offs have no effect on the credit risk (PAR30) of the MFI
H1: write offs have effect on the credit risk
Hypothesis 2:
H0: gross loan portfolio have no effect on the credit risk ( PAR30)
H1: gross loan portfolio have effect on the credit risk(PAR30)
Hypothesis 3:
H0: operating sustainability have no effect on the credit risk(PAR30)
H1: operating sustainability have effect on the credit risk(PAR30)
Hypothesis 4:
H0: return on assets have no effect on credit risk(PAR30)
H1: return on assets has effect on credit risk (PAR30)
Hypothesis 5:
H0: productivity has no effect on credit risk (PAR30)
H1: productivity has an effect credit risk (PAR30)
Hypothesis 6:
H0: leverage has no effect on credit risk of the MFI

50
H1: leverage has an effect on the credit risk of the MFI
Hypothesis 7:
H0: liquidity has no effect on the credit risk of the MFI
H1: liquidity has an effect on the credit risk of the MFI
Hypothesis 8:
H0: the type of the MFI has no effect on the credit risk it faces.
H1: the type of MFI has an effect on the credit risk it faces.
3.4.3 REGRESSION MODEL:
The model is based on the random effect modeling of the data. This model is to project the
credit risk of a particular MFI i at time t,
Yit = β0+β1(writeoffs)it+β2(log gross loan portfolio)it+β3(operational self-
sufficiency)it+β4(operational efficiency)it+β5( productivity)it +β6(liquidity)it+β7(bank
dummy)it+β8(NBFI dummy)it+β9(rural banking dummy)it+β10(NGO dummy)it+β11(credit
union)it
Where Yit is the par30 value of an MFI at time t( year) The variables are as defined in the
model.

Chapter IV Industry overview
51
4.1 INDUSTRY OVERVIEW:
Microfinance industry in India has been on a rampant growth with high success rate and also
sustainable business model. These business models have made an attempt to overcome to
challenges faces by traditional micro crediting houses.As of march 2009 India has reached
about 22 million borrowers with about $2.3 billion lending. The microfinance business model
in India generates about 20% to 30% ROE, and usually financed by the commercial as well
as the public sector banks. This could be due to the RBI rule of40% of total loan portfolio
should consist of priority sector leading or investment in RIDF (rural infrastructure
development ) bonds. And hence the commercial banks look at a return of 14-16% from the
MFI over the 4% return from RIDF bonds. Also the statistics talk about the a CAGR of 86%
in loan portfolio over the last 5 years, with about an average of 95% of repayment from the
rural/urban poor community which has been commendable performance by the MFIs. one
reason for this kind of growth is the customization of the loan products with respect to the
villages. Also the microfinance institutions have tried to diversify their products from loans
to insurance, savings, remittance, low cost health care, educational services which gives them
not only the edge with respect to reliability but also sustainability in terms of customer
retention. They have also tried to set up competitive MIS systems which will give them a
customer loan history which will be usefull to price their loans according to the customer
rather than product generalization. Microfinance institutions have gotten the view that,
performance through spatial expansion would do no good to both the organization as well as
the customers. They have looked into existence through saturation in few areas and spatial
expansion in few areas. RBI has been promoting the idea of business correspondence model,
which will reduce the operational cost of the MFI and improve their reach through mobile
banking. the regulator has stressed importance on financial inclusion since there are a huge
chunk of untapped population in banking who haven‟t had the advantage of earning returns
through investments.
There are various business models followed by the microfinance institutions one of which
would be JLG i.e joint liability group, which work on the philosophy in sync with the self-
52
help group. In this JLG, women make a group of 5-10 in size according to their reliability on
each other and save in a joint account and loan each other money, the MFI automatically
becomes a member of the group and deposits certain amount of money along with the
women. Typically these group charges each other interest rate of 25-35% pa. this is a
profitable model since there is an automatic pear pressure from the other women on the
borrower.
The various government organizations which are involved in this microfinance industry are
National Bank for Agriculture and Rural Development (NABARD), Small Industries
Development Bank of India (SIDBI), Friends of Women‟s World Banking (FWWB),
Rashtriya Mahila Kosh (RMK), Council for Advancement of People‟s Action and Rural
Technologies (CAPART), Rashtriya Gramin Vikas Nidhi (RGVN), various donor funded
programs especially by the International Fund for Agricultural Development (IFAD), United
Nations Development Programs (UNDP), World Bank and Department for International
Development, UK (DFID).
But there has been a situation where the industry has been plunged into crisis during 2008,
due to Andhra Pradesh, about 25% of the sector is concentrated in this state. And the crisis
happened with most of the customers of Andhra Pradesh committed suicides due to harsh
recovery procedures followed by the MFIs . this caused to regulator RBI to come into picture
and cap the interest rates charged by the MFIs. apart from this the political parties had step
in, and wrote of the whole loan portfolio which eventually caused the MFIs to run into losses
in these states. Then ujjivan microfinance has faced this problem, they have diversified into
north and north western states to minimize their exposure to one area. The non-repayment
either happens due to adamant group of customers behavior or due to inability to pay. One
other reason was the MFI trying to push their interest spreads to earn profits , which was
perceived by the regulator.
As a whole MFIs have been playing a major part in financial inclusions. But there is a
necessity for a regulatory body which defines clear boundaries for them also customers have
been growing for this kind of inclusion and this would bring in a lot of diversified
opportunities and liquidity into the economy, along with growth in contribution of
agricultural sector, with rapid growth of information outreach.
CHAPTER V
DATA ANALYSIS AND
INTERPRETATION
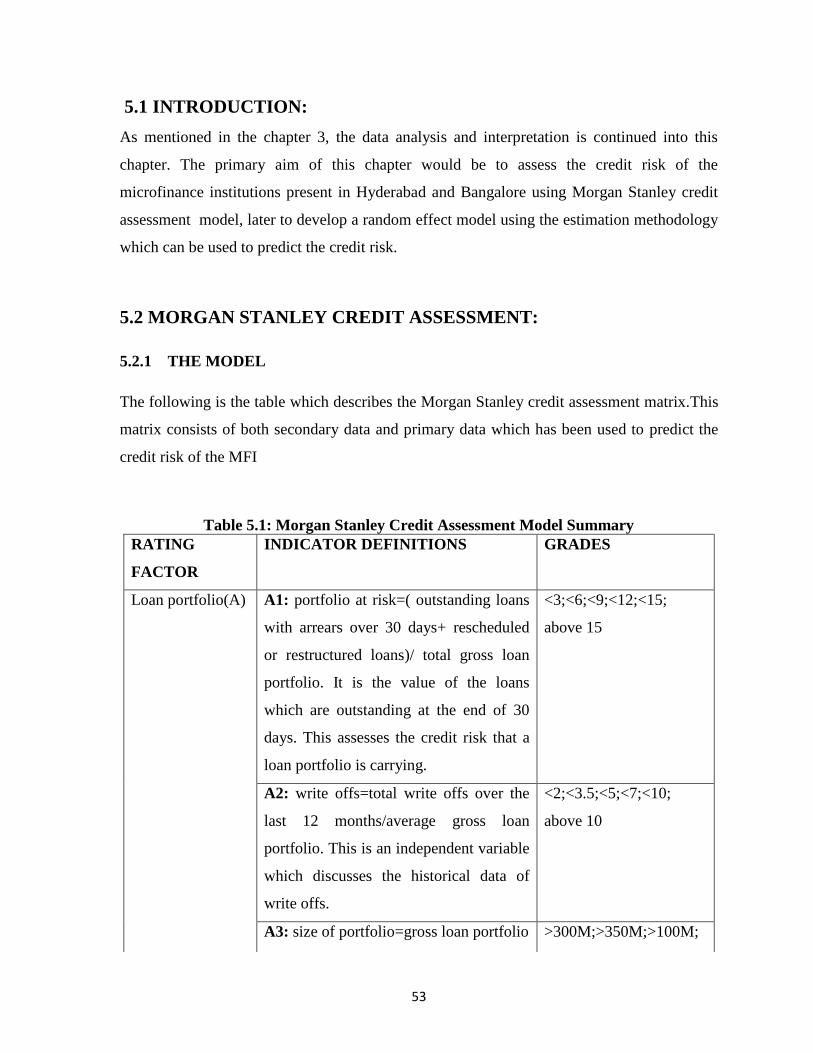
53
5.1 INTRODUCTION:
As mentioned in the chapter 3, the data analysis and interpretation is continued into this
chapter. The primary aim of this chapter would be to assess the credit risk of the
microfinance institutions present in Hyderabad and Bangalore using Morgan Stanley credit
assessment model, later to develop a random effect model using the estimation methodology
which can be used to predict the credit risk.
5.2 MORGAN STANLEY CREDIT ASSESSMENT:
5.2.1 THE MODEL
The following is the table which describes the Morgan Stanley credit assessment matrix.This
matrix consists of both secondary data and primary data which has been used to predict the
credit risk of the MFI
Table 5.1: Morgan Stanley Credit Assessment Model Summary
RATING
FACTOR
INDICATOR DEFINITIONS GRADES
Loan portfolio(A) A1: portfolio at risk=( outstanding loans
with arrears over 30 days+ rescheduled
or restructured loans)/ total gross loan
portfolio. It is the value of the loans
which are outstanding at the end of 30
days. This assesses the credit risk that a
loan portfolio is carrying.
<3;<6;<9;<12;<15;
above 15
A2: write offs=total write offs over the
last 12 months/average gross loan
portfolio. This is an independent variable
which discusses the historical data of
write offs.
<2;<3.5;<5;<7;<10;
above 10
A3: size of portfolio=gross loan portfolio >300M;>350M;>100M;
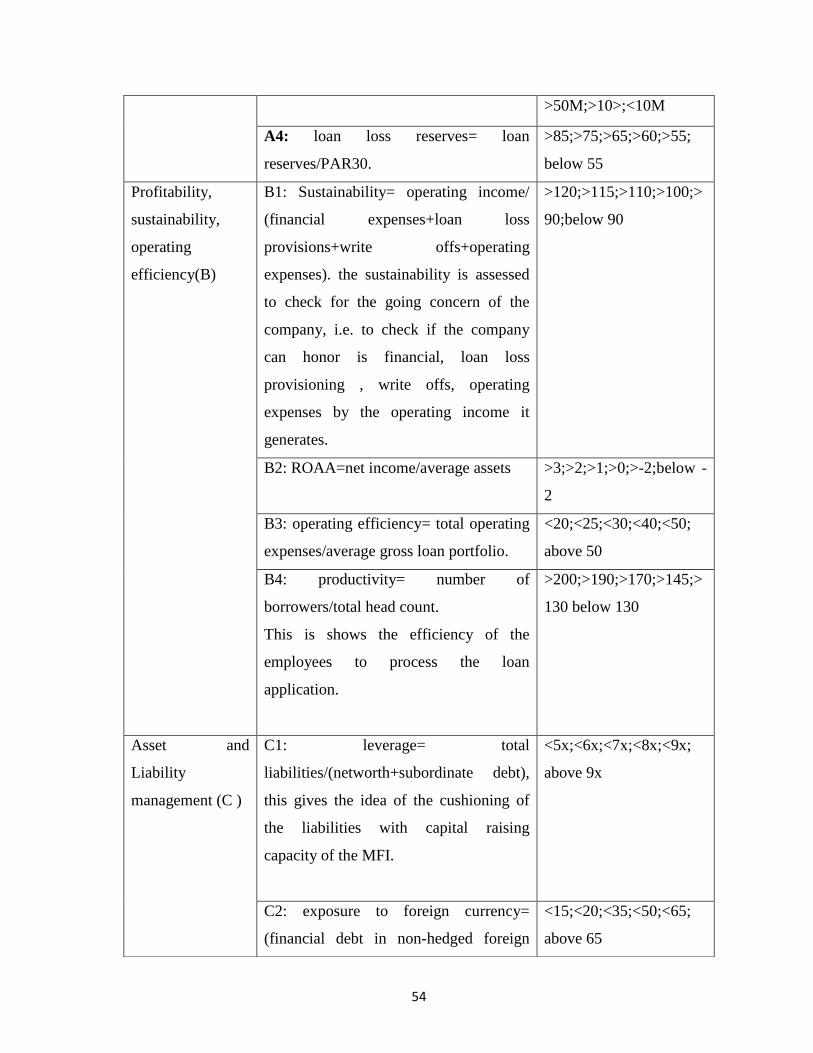
54
>50M;>10>;<10M
A4: loan loss reserves= loan
reserves/PAR30.
>85;>75;>65;>60;>55;
below 55
Profitability,
sustainability,
operating
efficiency(B)
B1: Sustainability= operating income/
(financial expenses+loan loss
provisions+write offs+operating
expenses). the sustainability is assessed
to check for the going concern of the
company, i.e. to check if the company
can honor is financial, loan loss
provisioning , write offs, operating
expenses by the operating income it
generates.
>120;>115;>110;>100;>
90;below 90
B2: ROAA=net income/average assets >3;>2;>1;>0;>-2;below -
2
B3: operating efficiency= total operating
expenses/average gross loan portfolio.
<20;<25;<30;<40;<50;
above 50
B4: productivity= number of
borrowers/total head count.
This is shows the efficiency of the
employees to process the loan
application.
>200;>190;>170;>145;>
130 below 130
Asset and
Liability
management (C )
C1: leverage= total
liabilities/(networth+subordinate debt),
this gives the idea of the cushioning of
the liabilities with capital raising
capacity of the MFI.
<5x;<6x;<7x;<8x;<9x;
above 9x
C2: exposure to foreign currency=
(financial debt in non-hedged foreign
<15;<20;<35;<50;<65;
above 65
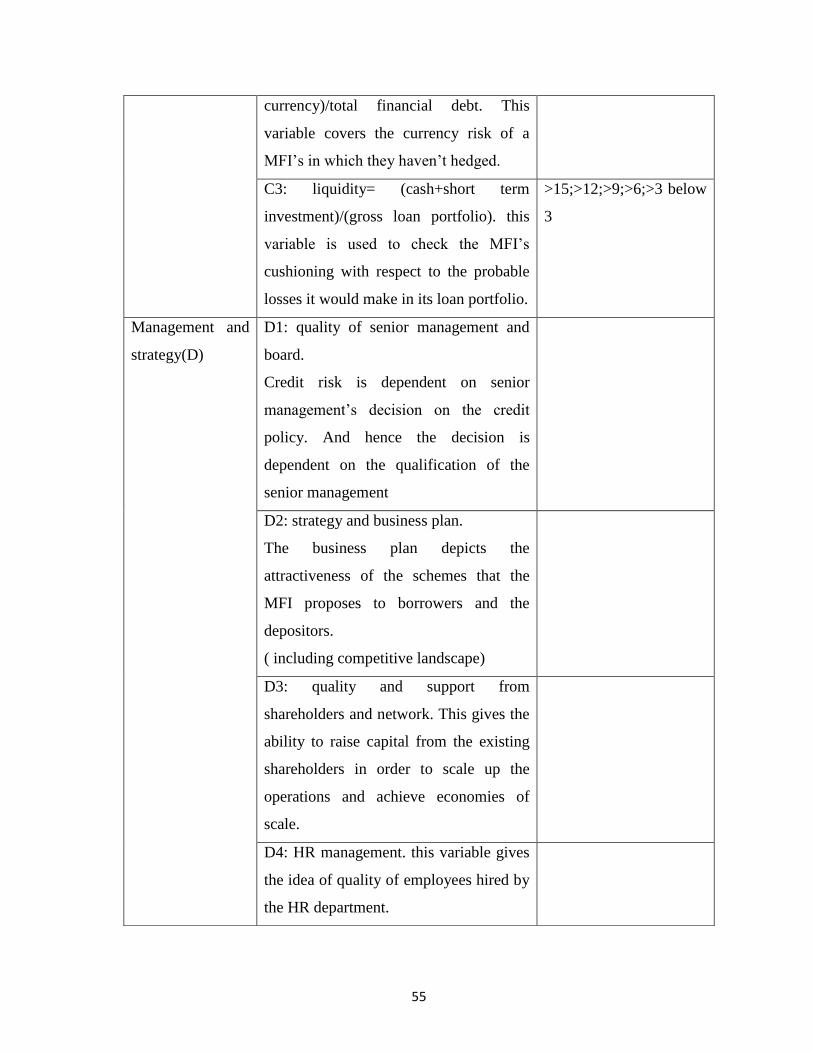
55
currency)/total financial debt. This
variable covers the currency risk of a
MFI‟s in which they haven‟t hedged.
C3: liquidity= (cash+short term
investment)/(gross loan portfolio). this
variable is used to check the MFI‟s
cushioning with respect to the probable
losses it would make in its loan portfolio.
>15;>12;>9;>6;>3 below
3
Management and
strategy(D)
D1: quality of senior management and
board.
Credit risk is dependent on senior
management‟s decision on the credit
policy. And hence the decision is
dependent on the qualification of the
senior management
D2: strategy and business plan.
The business plan depicts the
attractiveness of the schemes that the
MFI proposes to borrowers and the
depositors.
( including competitive landscape)
D3: quality and support from
shareholders and network. This gives the
ability to raise capital from the existing
shareholders in order to scale up the
operations and achieve economies of
scale.
D4: HR management. this variable gives
the idea of quality of employees hired by
the HR department.
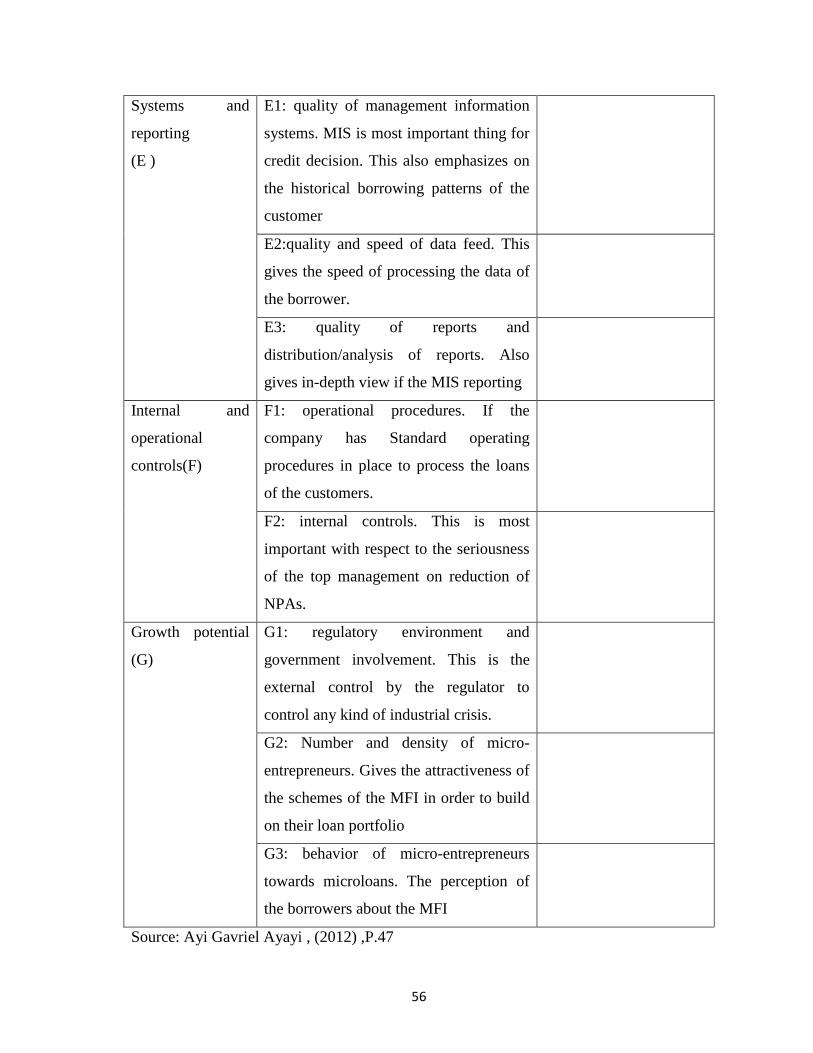
56
Systems and
reporting
(E )
E1: quality of management information
systems. MIS is most important thing for
credit decision. This also emphasizes on
the historical borrowing patterns of the
customer
E2:quality and speed of data feed. This
gives the speed of processing the data of
the borrower.
E3: quality of reports and
distribution/analysis of reports. Also
gives in-depth view if the MIS reporting
Internal and
operational
controls(F)
F1: operational procedures. If the
company has Standard operating
procedures in place to process the loans
of the customers.
F2: internal controls. This is most
important with respect to the seriousness
of the top management on reduction of
NPAs.
Growth potential
(G)
G1: regulatory environment and
government involvement. This is the
external control by the regulator to
control any kind of industrial crisis.
G2: Number and density of micro-
entrepreneurs. Gives the attractiveness of
the schemes of the MFI in order to build
on their loan portfolio
G3: behavior of micro-entrepreneurs
towards microloans. The perception of
the borrowers about the MFI
Source: Ayi Gavriel Ayayi , (2012) ,P.47
57
5.2.2 ANALYSIS OF PRIMARY DATA:
The analysis of primary data was conducted through questionnaires (annexure) which has
been administered to various NBFI present in Bangalore and Hyderabad. The responses
hence collected were graded according to the qualitative parameters of the model i.e.
Management and strategy (D), Systems and reporting (E), Internal and operational controls
(F), Growth potential (G) .Table 5.1 gives the synopsis of the whole questionnaire according
the parameters used in Morgan Stanley credit assessment matrix.
5.2.2.1 RESPONDENTS PROFILE:
The respondents of the questionnaire were mainly middle level managers of the NBFIs who
are involved in the daily operational activity of the company; the responses from these NBFI
were recorded through interaction in Bangalore and online entry for Hyderabad.
5.2.2.2 DATA CONSOLIDATION AND ANALYSIS:
Table 5.1 matrix was formed through 4 step process
Step 1: Questionnaire administration to various NBFCs.
Step2: Grading each question with respect to the responses
Step3: Average the grades of the questionnaire to obtain
D1,D2,D3,D4,E1,E2,E3,F1,F2,G1,G2,G3
Step4: Average the grades obtained above to form D, E, F, G
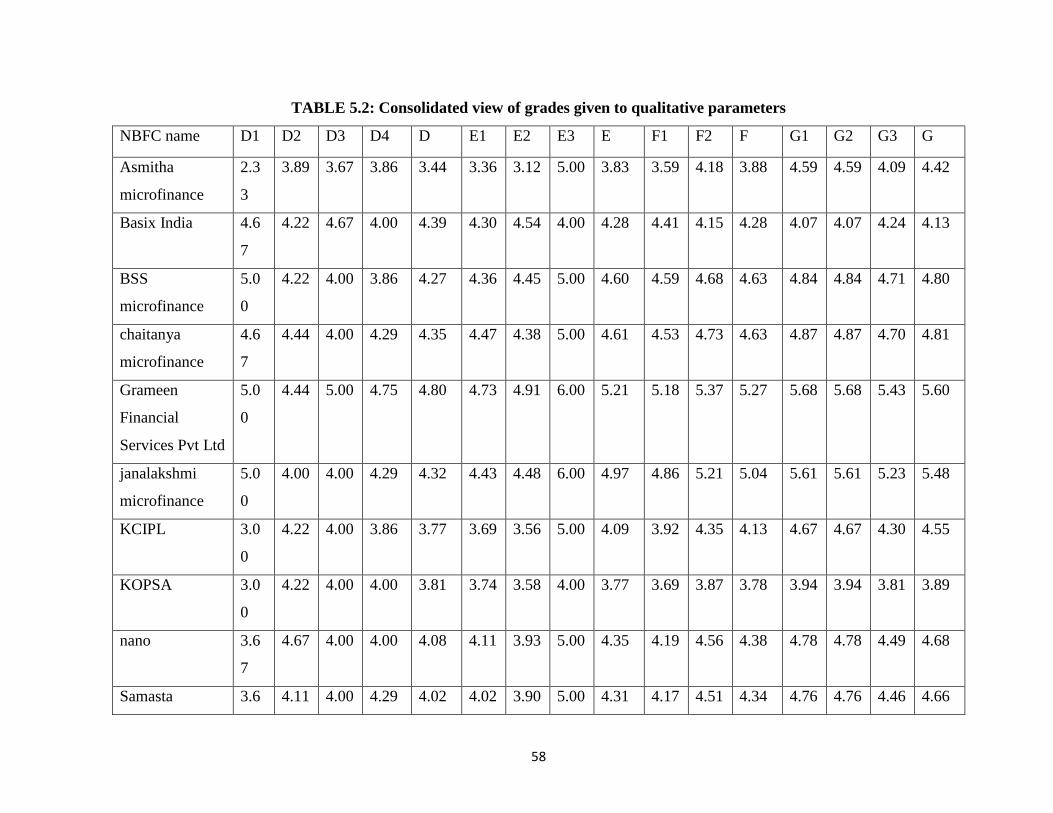
58
TABLE 5.2: Consolidated view of grades given to qualitative parameters
NBFC name D1 D2 D3 D4 D E1 E2 E3 E F1 F2 F G1 G2 G3 G
Asmitha
microfinance
2.3
3
3.89 3.67 3.86 3.44 3.36 3.12 5.00 3.83 3.59 4.18 3.88 4.59 4.59 4.09 4.42
Basix India 4.6
7
4.22 4.67 4.00 4.39 4.30 4.54 4.00 4.28 4.41 4.15 4.28 4.07 4.07 4.24 4.13
BSS
microfinance
5.0
0
4.22 4.00 3.86 4.27 4.36 4.45 5.00 4.60 4.59 4.68 4.63 4.84 4.84 4.71 4.80
chaitanya
microfinance
4.6
7
4.44 4.00 4.29 4.35 4.47 4.38 5.00 4.61 4.53 4.73 4.63 4.87 4.87 4.70 4.81
Grameen
Financial
Services Pvt Ltd
5.0
0
4.44 5.00 4.75 4.80 4.73 4.91 6.00 5.21 5.18 5.37 5.27 5.68 5.68 5.43 5.60
janalakshmi
microfinance
5.0
0
4.00 4.00 4.29 4.32 4.43 4.48 6.00 4.97 4.86 5.21 5.04 5.61 5.61 5.23 5.48
KCIPL 3.0
0
4.22 4.00 3.86 3.77 3.69 3.56 5.00 4.09 3.92 4.35 4.13 4.67 4.67 4.30 4.55
KOPSA 3.0
0
4.22 4.00 4.00 3.81 3.74 3.58 4.00 3.77 3.69 3.87 3.78 3.94 3.94 3.81 3.89
nano 3.6
7
4.67 4.00 4.00 4.08 4.11 3.93 5.00 4.35 4.19 4.56 4.38 4.78 4.78 4.49 4.68
Samasta 3.6 4.11 4.00 4.29 4.02 4.02 3.90 5.00 4.31 4.17 4.51 4.34 4.76 4.76 4.46 4.66
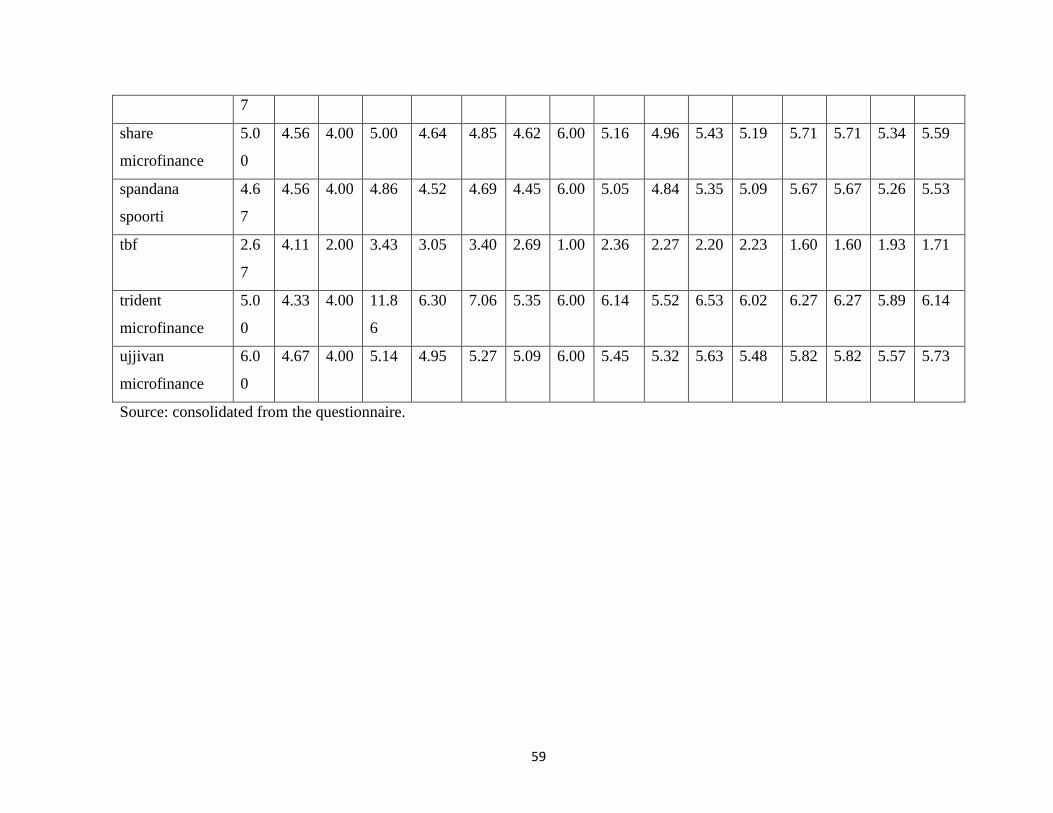
59
7
share
microfinance
5.0
0
4.56 4.00 5.00 4.64 4.85 4.62 6.00 5.16 4.96 5.43 5.19 5.71 5.71 5.34 5.59
spandana
spoorti
4.6
7
4.56 4.00 4.86 4.52 4.69 4.45 6.00 5.05 4.84 5.35 5.09 5.67 5.67 5.26 5.53
tbf 2.6
7
4.11 2.00 3.43 3.05 3.40 2.69 1.00 2.36 2.27 2.20 2.23 1.60 1.60 1.93 1.71
trident
microfinance
5.0
0
4.33 4.00 11.8
6
6.30 7.06 5.35 6.00 6.14 5.52 6.53 6.02 6.27 6.27 5.89 6.14
ujjivan
microfinance
6.0
0
4.67 4.00 5.14 4.95 5.27 5.09 6.00 5.45 5.32 5.63 5.48 5.82 5.82 5.57 5.73
Source: consolidated from the questionnaire.
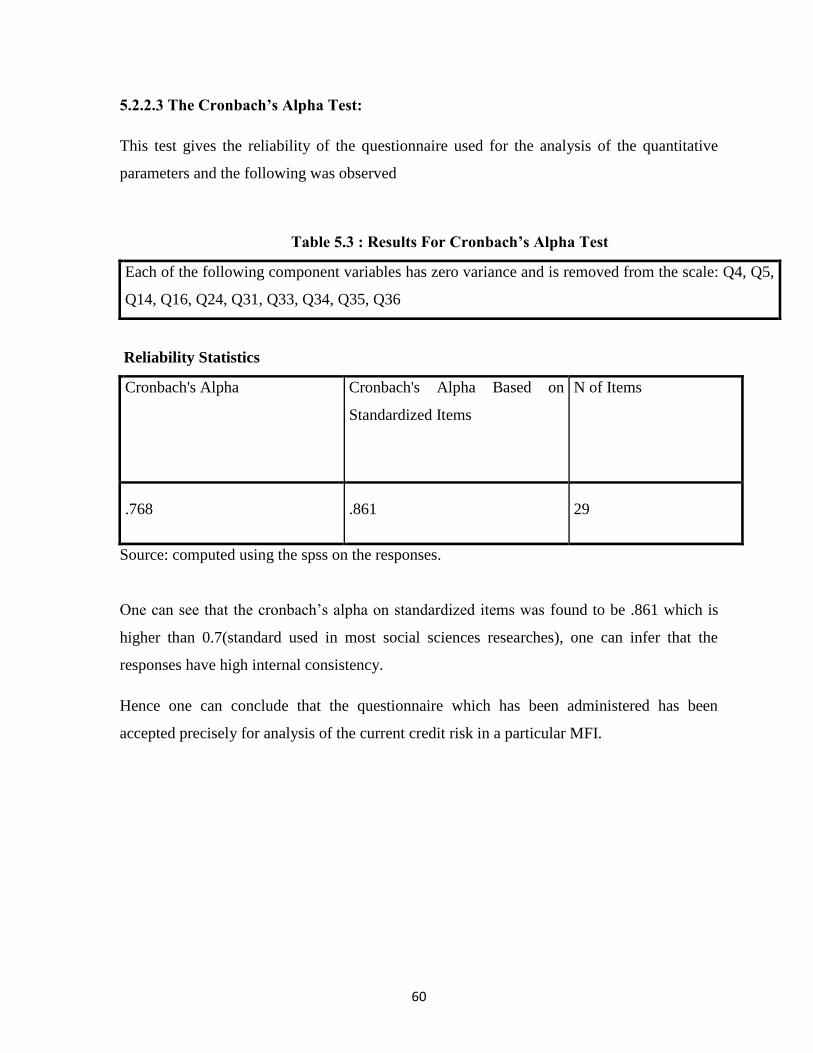
60
5.2.2.3 The Cronbach’s Alpha Test:
This test gives the reliability of the questionnaire used for the analysis of the quantitative
parameters and the following was observed
Table 5.3 : Results For Cronbach’s Alpha Test
Each of the following component variables has zero variance and is removed from the scale: Q4, Q5,
Q14, Q16, Q24, Q31, Q33, Q34, Q35, Q36
Reliability Statistics
Cronbach's Alpha Cronbach's Alpha Based on
Standardized Items
N of Items
.768 .861 29
Source: computed using the spss on the responses.
One can see that the cronbach‟s alpha on standardized items was found to be .861 which is
higher than 0.7(standard used in most social sciences researches), one can infer that the
responses have high internal consistency.
Hence one can conclude that the questionnaire which has been administered has been
accepted precisely for analysis of the current credit risk in a particular MFI.

61
5.2.3 ANALYSIS OF THE SECONDARY DATA:
the secondary data was obtained from mixmarket.com which was used for analysis of the
factors which represented loan portfolio(A) , Profitability/ sustainability/ operating
efficiency(B), Asset and Liability management (C ).
The following steps were followed to consolidate the grades for these factors
Step 1: obtain the data for the A1,A2,A3,A4,B1,B2,B3,B4,C1,C2,C3, for each of the years
and grade them.
Step 2: average the grade over the years to obtain the consolidated figure(annexure) .
Step 3: average A1,A2,A3,A4 to obtain A , B1,B2,B3,B4 to obtain B, C1,C2,C3 to obtain C.
Then the following table is obtained for the 15 NBFCs present in Hyderabad and Bangalore.
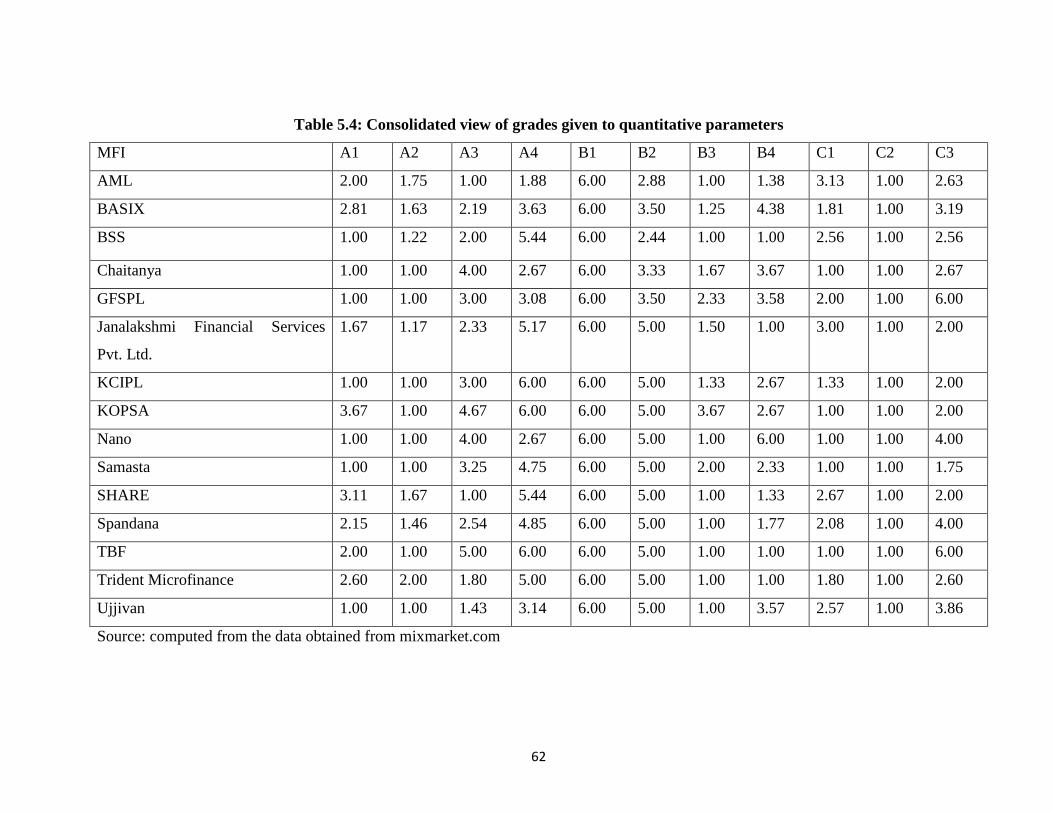
62
Table 5.4: Consolidated view of grades given to quantitative parameters
MFI A1 A2 A3 A4 B1 B2 B3 B4 C1 C2 C3
AML 2.00 1.75 1.00 1.88 6.00 2.88 1.00 1.38 3.13 1.00 2.63
BASIX 2.81 1.63 2.19 3.63 6.00 3.50 1.25 4.38 1.81 1.00 3.19
BSS 1.00 1.22 2.00 5.44 6.00 2.44 1.00 1.00 2.56 1.00 2.56
Chaitanya 1.00 1.00 4.00 2.67 6.00 3.33 1.67 3.67 1.00 1.00 2.67
GFSPL 1.00 1.00 3.00 3.08 6.00 3.50 2.33 3.58 2.00 1.00 6.00
Janalakshmi Financial Services
Pvt. Ltd.
1.67 1.17 2.33 5.17 6.00 5.00 1.50 1.00 3.00 1.00 2.00
KCIPL 1.00 1.00 3.00 6.00 6.00 5.00 1.33 2.67 1.33 1.00 2.00
KOPSA 3.67 1.00 4.67 6.00 6.00 5.00 3.67 2.67 1.00 1.00 2.00
Nano 1.00 1.00 4.00 2.67 6.00 5.00 1.00 6.00 1.00 1.00 4.00
Samasta 1.00 1.00 3.25 4.75 6.00 5.00 2.00 2.33 1.00 1.00 1.75
SHARE 3.11 1.67 1.00 5.44 6.00 5.00 1.00 1.33 2.67 1.00 2.00
Spandana 2.15 1.46 2.54 4.85 6.00 5.00 1.00 1.77 2.08 1.00 4.00
TBF 2.00 1.00 5.00 6.00 6.00 5.00 1.00 1.00 1.00 1.00 6.00
Trident Microfinance 2.60 2.00 1.80 5.00 6.00 5.00 1.00 1.00 1.80 1.00 2.60
Ujjivan 1.00 1.00 1.43 3.14 6.00 5.00 1.00 3.57 2.57 1.00 3.86
Source: computed from the data obtained from mixmarket.com
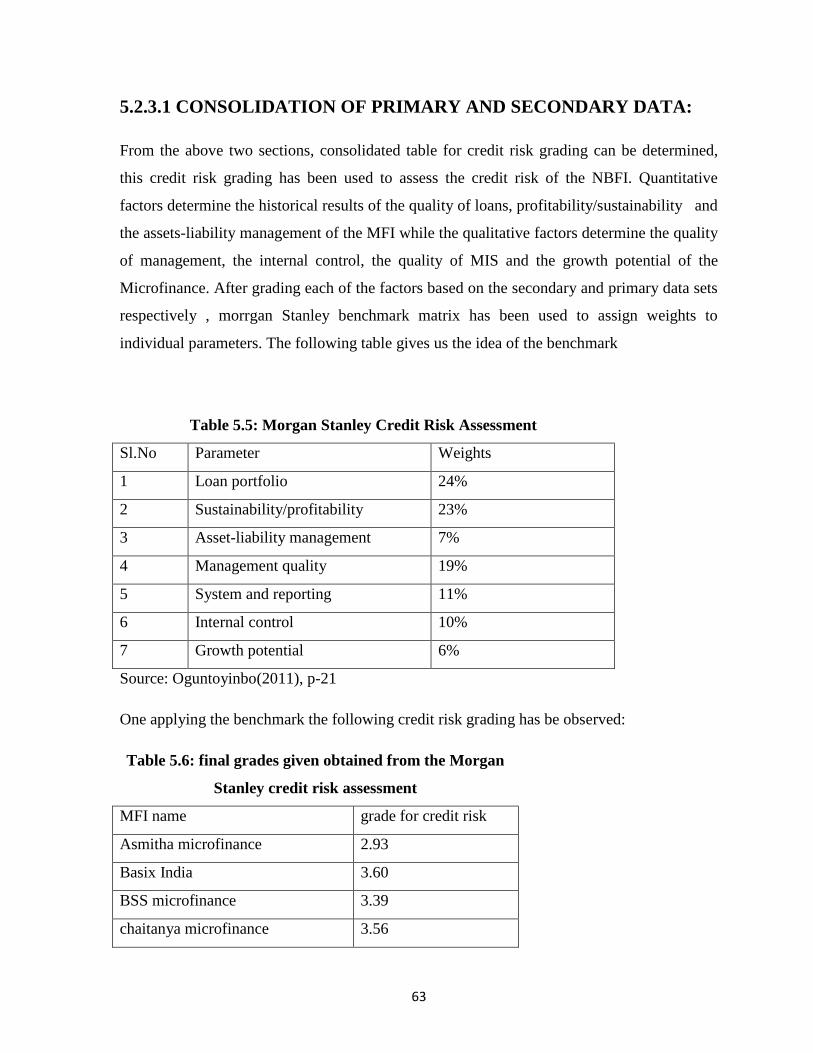
63
5.2.3.1 CONSOLIDATION OF PRIMARY AND SECONDARY DATA:
From the above two sections, consolidated table for credit risk grading can be determined,
this credit risk grading has been used to assess the credit risk of the NBFI. Quantitative
factors determine the historical results of the quality of loans, profitability/sustainability and
the assets-liability management of the MFI while the qualitative factors determine the quality
of management, the internal control, the quality of MIS and the growth potential of the
Microfinance. After grading each of the factors based on the secondary and primary data sets
respectively , morrgan Stanley benchmark matrix has been used to assign weights to
individual parameters. The following table gives us the idea of the benchmark
Table 5.5: Morgan Stanley Credit Risk Assessment
Sl.No Parameter Weights
1 Loan portfolio 24%
2 Sustainability/profitability 23%
3 Asset-liability management 7%
4 Management quality 19%
5 System and reporting 11%
6 Internal control 10%
7 Growth potential 6%
Source: Oguntoyinbo(2011), p-21
One applying the benchmark the following credit risk grading has be observed:
Table 5.6: final grades given obtained from the Morgan
Stanley credit risk assessment
MFI name grade for credit risk
Asmitha microfinance 2.93
Basix India 3.60
BSS microfinance 3.39
chaitanya microfinance 3.56
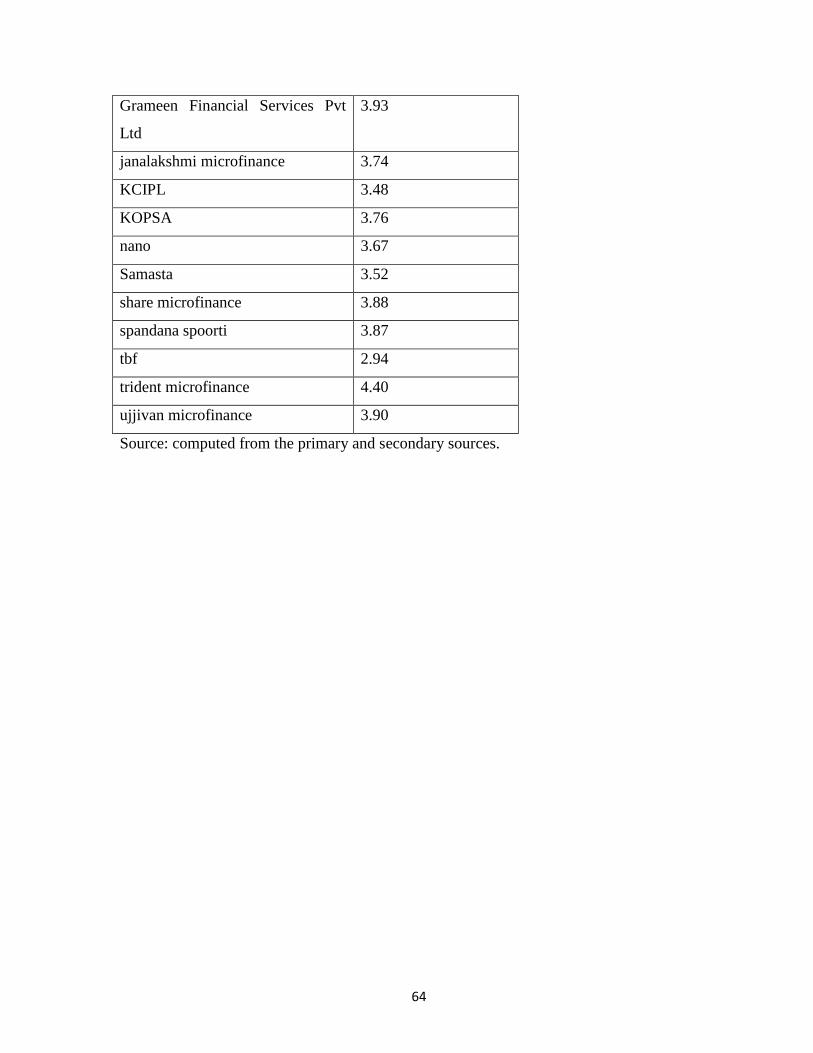
64
Grameen Financial Services Pvt
Ltd
3.93
janalakshmi microfinance 3.74
KCIPL 3.48
KOPSA 3.76
nano 3.67
Samasta 3.52
share microfinance 3.88
spandana spoorti 3.87
tbf 2.94
trident microfinance 4.40
ujjivan microfinance 3.90
Source: computed from the primary and secondary sources.
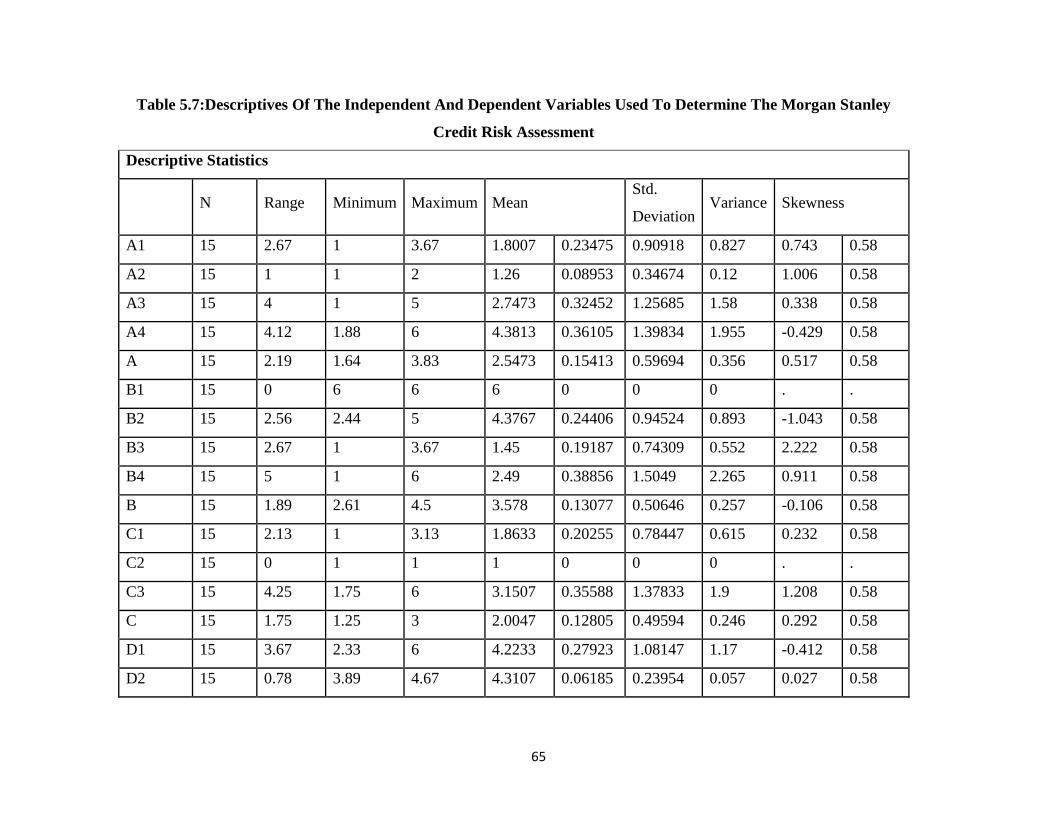
65
Table 5.7:Descriptives Of The Independent And Dependent Variables Used To Determine The Morgan Stanley
Credit Risk Assessment
Descriptive Statistics
N Range Minimum Maximum Mean Std.
Deviation Variance Skewness
A1 15 2.67 1 3.67 1.8007 0.23475 0.90918 0.827 0.743 0.58
A2 15 1 1 2 1.26 0.08953 0.34674 0.12 1.006 0.58
A3 15 4 1 5 2.7473 0.32452 1.25685 1.58 0.338 0.58
A4 15 4.12 1.88 6 4.3813 0.36105 1.39834 1.955 -0.429 0.58
A 15 2.19 1.64 3.83 2.5473 0.15413 0.59694 0.356 0.517 0.58
B1 15 0 6 6 6 0 0 0 . .
B2 15 2.56 2.44 5 4.3767 0.24406 0.94524 0.893 -1.043 0.58
B3 15 2.67 1 3.67 1.45 0.19187 0.74309 0.552 2.222 0.58
B4 15 5 1 6 2.49 0.38856 1.5049 2.265 0.911 0.58
B 15 1.89 2.61 4.5 3.578 0.13077 0.50646 0.257 -0.106 0.58
C1 15 2.13 1 3.13 1.8633 0.20255 0.78447 0.615 0.232 0.58
C2 15 0 1 1 1 0 0 0 . .
C3 15 4.25 1.75 6 3.1507 0.35588 1.37833 1.9 1.208 0.58
C 15 1.75 1.25 3 2.0047 0.12805 0.49594 0.246 0.292 0.58
D1 15 3.67 2.33 6 4.2233 0.27923 1.08147 1.17 -0.412 0.58
D2 15 0.78 3.89 4.67 4.3107 0.06185 0.23954 0.057 0.027 0.58
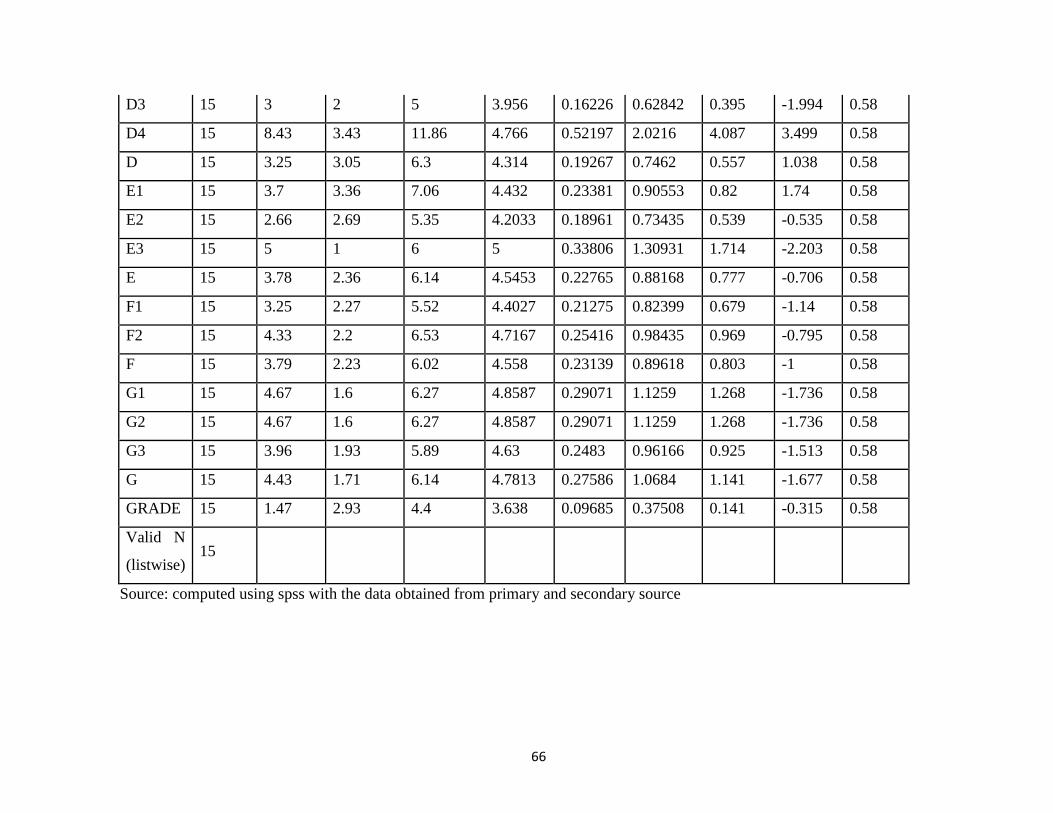
66
D3 15 3 2 5 3.956 0.16226 0.62842 0.395 -1.994 0.58
D4 15 8.43 3.43 11.86 4.766 0.52197 2.0216 4.087 3.499 0.58
D 15 3.25 3.05 6.3 4.314 0.19267 0.7462 0.557 1.038 0.58
E1 15 3.7 3.36 7.06 4.432 0.23381 0.90553 0.82 1.74 0.58
E2 15 2.66 2.69 5.35 4.2033 0.18961 0.73435 0.539 -0.535 0.58
E3 15 5 1 6 5 0.33806 1.30931 1.714 -2.203 0.58
E 15 3.78 2.36 6.14 4.5453 0.22765 0.88168 0.777 -0.706 0.58
F1 15 3.25 2.27 5.52 4.4027 0.21275 0.82399 0.679 -1.14 0.58
F2 15 4.33 2.2 6.53 4.7167 0.25416 0.98435 0.969 -0.795 0.58
F 15 3.79 2.23 6.02 4.558 0.23139 0.89618 0.803 -1 0.58
G1 15 4.67 1.6 6.27 4.8587 0.29071 1.1259 1.268 -1.736 0.58
G2 15 4.67 1.6 6.27 4.8587 0.29071 1.1259 1.268 -1.736 0.58
G3 15 3.96 1.93 5.89 4.63 0.2483 0.96166 0.925 -1.513 0.58
G 15 4.43 1.71 6.14 4.7813 0.27586 1.0684 1.141 -1.677 0.58
GRADE 15 1.47 2.93 4.4 3.638 0.09685 0.37508 0.141 -0.315 0.58
Valid N
(listwise) 15
Source: computed using spss with the data obtained from primary and secondary source
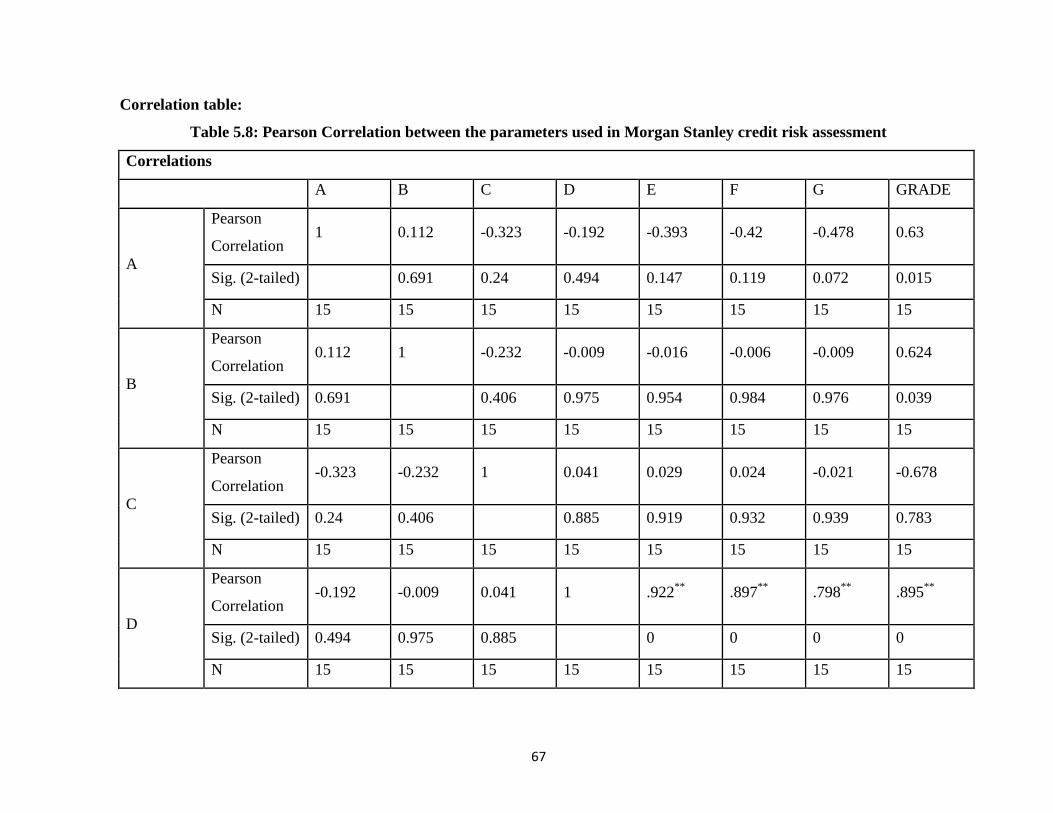
67
Correlation table:
Table 5.8: Pearson Correlation between the parameters used in Morgan Stanley credit risk assessment
Correlations
A B C D E F G GRADE
A
Pearson
Correlation 1 0.112 -0.323 -0.192 -0.393 -0.42 -0.478 0.63
Sig. (2-tailed) 0.691 0.24 0.494 0.147 0.119 0.072 0.015
N 15 15 15 15 15 15 15 15
B
Pearson
Correlation 0.112 1 -0.232 -0.009 -0.016 -0.006 -0.009 0.624
Sig. (2-tailed) 0.691 0.406 0.975 0.954 0.984 0.976 0.039
N 15 15 15 15 15 15 15 15
C
Pearson
Correlation -0.323 -0.232 1 0.041 0.029 0.024 -0.021 -0.678
Sig. (2-tailed) 0.24 0.406 0.885 0.919 0.932 0.939 0.783
N 15 15 15 15 15 15 15 15
D
Pearson
Correlation -0.192 -0.009 0.041 1 .922
** .897
** .798
** .895
**
Sig. (2-tailed) 0.494 0.975 0.885 0 0 0 0
N 15 15 15 15 15 15 15 15
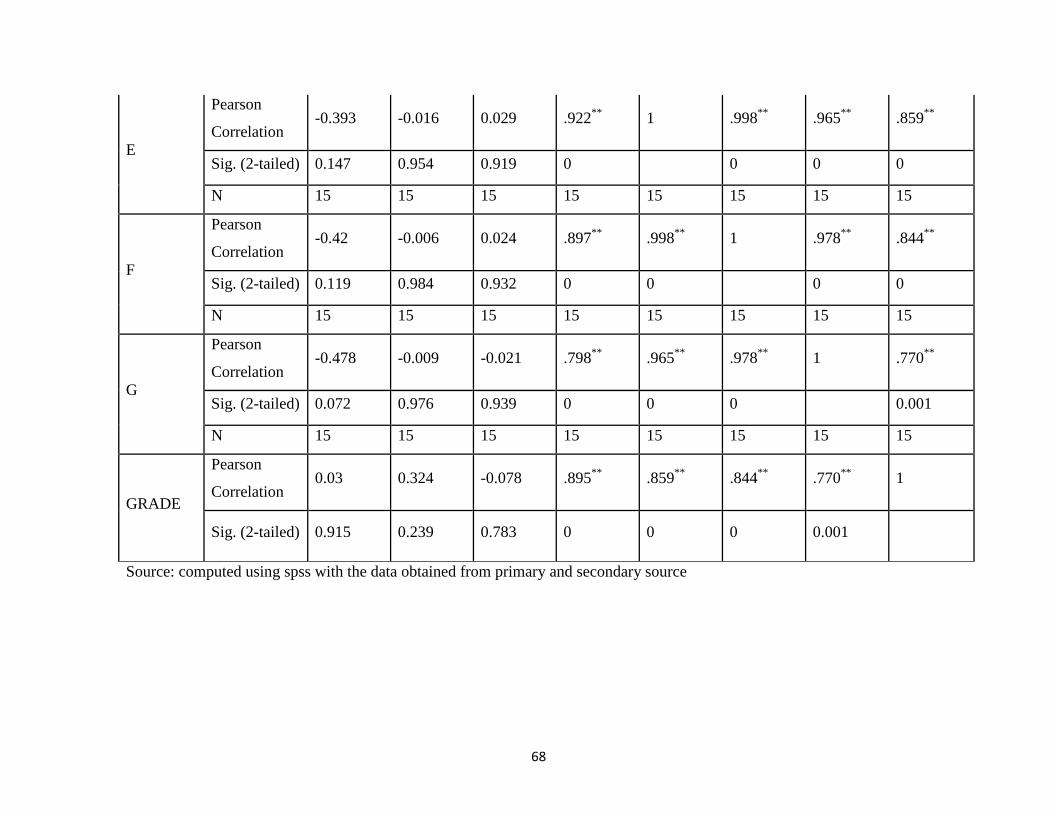
68
E
Pearson
Correlation -0.393 -0.016 0.029 .922
** 1 .998
** .965
** .859
**
Sig. (2-tailed) 0.147 0.954 0.919 0 0 0 0
N 15 15 15 15 15 15 15 15
F
Pearson
Correlation -0.42 -0.006 0.024 .897
** .998
** 1 .978
** .844
**
Sig. (2-tailed) 0.119 0.984 0.932 0 0 0 0
N 15 15 15 15 15 15 15 15
G
Pearson
Correlation -0.478 -0.009 -0.021 .798
** .965
** .978
** 1 .770
**
Sig. (2-tailed) 0.072 0.976 0.939 0 0 0 0.001
N 15 15 15 15 15 15 15 15
GRADE
Pearson
Correlation 0.03 0.324 -0.078 .895
** .859
** .844
** .770
** 1
Sig. (2-tailed) 0.915 0.239 0.783 0 0 0 0.001
Source: computed using spss with the data obtained from primary and secondary source
69
5.2.3.2 INTERPRETATION OF THE DESCRIPTIVE AND
CORRELATION TABLES:
From the above Pearson correlation table one can see that, the credit risk grade is positively
correlated with the management quality with a significance level of 0.000, therefore one can
say that better the management quality better is the credit risk management in MFI which is
in sync with the theories; management plays an important role in determining the loan
forwarding decision. For example credit risk is higher in farm related activities during low
monsoons, hence the management should control the credit forwarding to such areas. This
kind of decisions has to be taken up by the management in order to reduce the overall credit
risk of the MFI.
There is a positive relationship between the credit risk grade and the
profitability/sustainability , hence one can conclude that, better the credit risk management
better the profitability which is obviously in sync with the theory of MFI. In case of MFIs
their profitability is directly dependent on the credit forwarding, and the economies of scale
they achieve. Unlike the banking industry which has other related products, MFIs major
business is in loan disbursement hence better the credit risk management higher the
profitability, sustainability can be observed.
Loan portfolio is dependent on the write offs, PAR, gross loan portfolio, loan loss reserves.
The rationale behind the positive relationship with the credit risk management is that higher
the loan loss reserve better the cushioning to the risk which could be experienced, but gross
loan portfolio adjusted to the write offs gives the actual profit making portfolio and this
directly related to the credit risk management of the MFI.
Internal controls, which includes, regulatory control as well as the internal/external audit has
a positive relation with the credit risk management. These controls give a boundaries of
operations which are essential to control any kind of crisis in the industry. Internal controls
have a major role in the credit risk management and influence the decisions of the
management.
70
Management information system is another parameter which helps in credit risk assessment.
MIS determines the quality of the reporting tools which can be used for credit decision and
hence the credit risk management.
The asset liability management and credit risk management are negatively correlated , asset
liability management is dependent on the leverage, exposure to foreign currency and the
liquidity. Higher leverage lowers that credit risk management in the MFI since the repayment
capability of the MFI is dependent on the credit risk management. Also higher exposure to
foreign currency leads to poor credit risk management.
From the descriptive table one can observe that the credit risk grading of the NBFI present in
Hyderabad and Bangalore lies between, 2.94 and 4.4, with a standard deviation of 0.0967
which is very low, suggesting that the credit risk management in the NBFIs present in
Hyderabad and Bangalore are of similar kind, probably because of the fact that loan
portfolio, growth, asset liability management are of similar kind ( suggested by the low
standard deviations). This is due to the fact that all the NBFIs are working in the similar
markets such as Andhra Pradesh, Karnataka, Tamil Nadu, Maharashtra, and Madhya
Pradesh. One can observe that trident microfinance has the highest credit grading, even with
mediocre loan portfolio, and asset liability management they have maintaining high
profitability , management quality , MIS and strong market share which has given them the
edge over the other NBFIs. Ujjivan has strong financials which suggests its strategy to
diversify with respect to loan portfolio through strong management quality. The NBFIs have
differentiated with respect to internal process controls and system reporting ( standard
deviation of .87) which suggests that they have tried to improve on their profitability through
lowering their operational expenses. Which also suggest that they have strategized on the
latest regulation of 26% cap on interest rate and tried to offset it with improving operations.
Growth is of almost the same nature, unless they look into other areas of India such as north
and north west parts of India they are likely to compete in the same market.
71
5.3 ESTIMATION METHODOLOGY:
The estimation methodology is used to form a random effect model with the given data of
microfinance industry. This also helps in concluding the hypotheses which are explained in
the chapter 3.
5.3.1 The Estimation methodology
In this a random effect model has been built through the estimation methodology where the
dependent variable is portfolio at risk ( >30) and the independent variables are write offs, log
normal of gross loan portfolio, operational self-sufficiency, productivity, Return on assets,
non-banking dummy, NGO dummy, credit union dummy. The following table given the
descriptive of the data used to build the model. The sample size taken was 439.
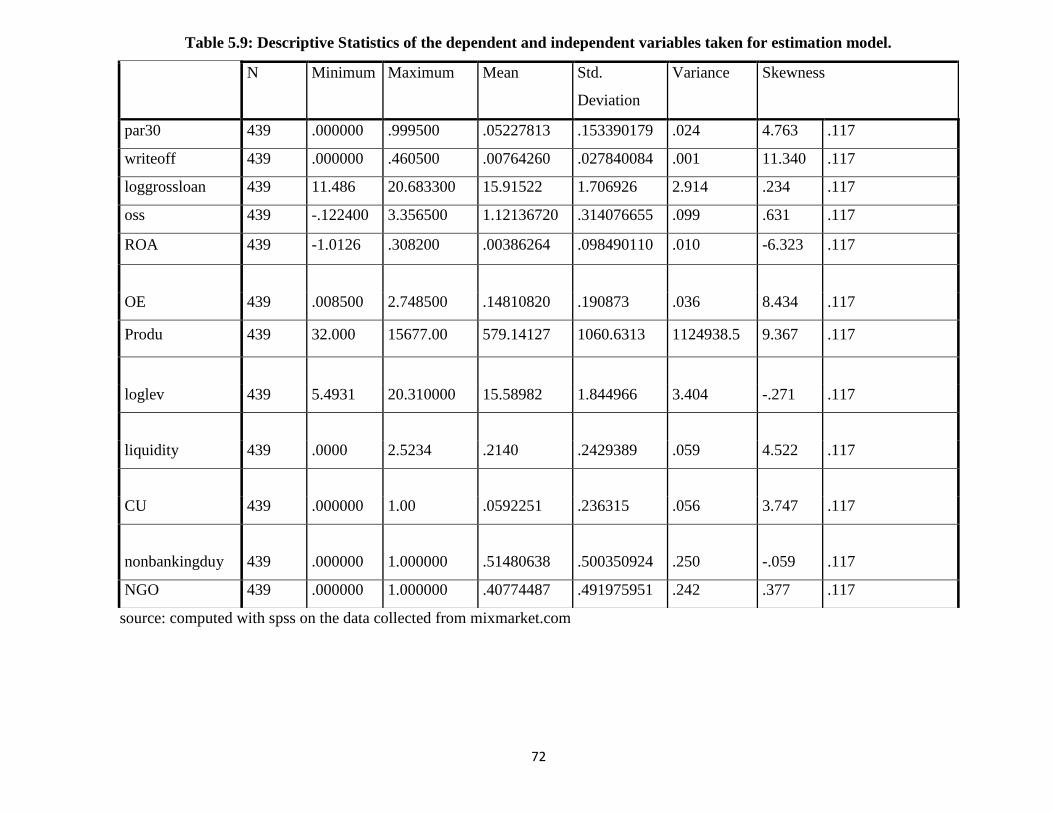
72
source: computed with spss on the data collected from mixmarket.com
Table 5.9: Descriptive Statistics of the dependent and independent variables taken for estimation model.
N Minimum Maximum Mean Std.
Deviation
Variance Skewness
par30 439 .000000 .999500 .05227813 .153390179 .024 4.763 .117
writeoff 439 .000000 .460500 .00764260 .027840084 .001 11.340 .117
loggrossloan 439 11.486 20.683300 15.91522 1.706926 2.914 .234 .117
oss 439 -.122400 3.356500 1.12136720 .314076655 .099 .631 .117
ROA 439 -1.0126 .308200 .00386264 .098490110 .010 -6.323 .117
OE 439 .008500 2.748500 .14810820 .190873 .036 8.434 .117
Produ 439 32.000 15677.00 579.14127 1060.6313 1124938.5 9.367 .117
loglev 439 5.4931 20.310000 15.58982 1.844966 3.404 -.271 .117
liquidity 439 .0000 2.5234 .2140 .2429389 .059 4.522 .117
CU 439 .000000 1.00 .0592251 .236315 .056 3.747 .117
nonbankingduy 439 .000000 1.000000 .51480638 .500350924 .250 -.059 .117
NGO 439 .000000 1.000000 .40774487 .491975951 .242 .377 .117
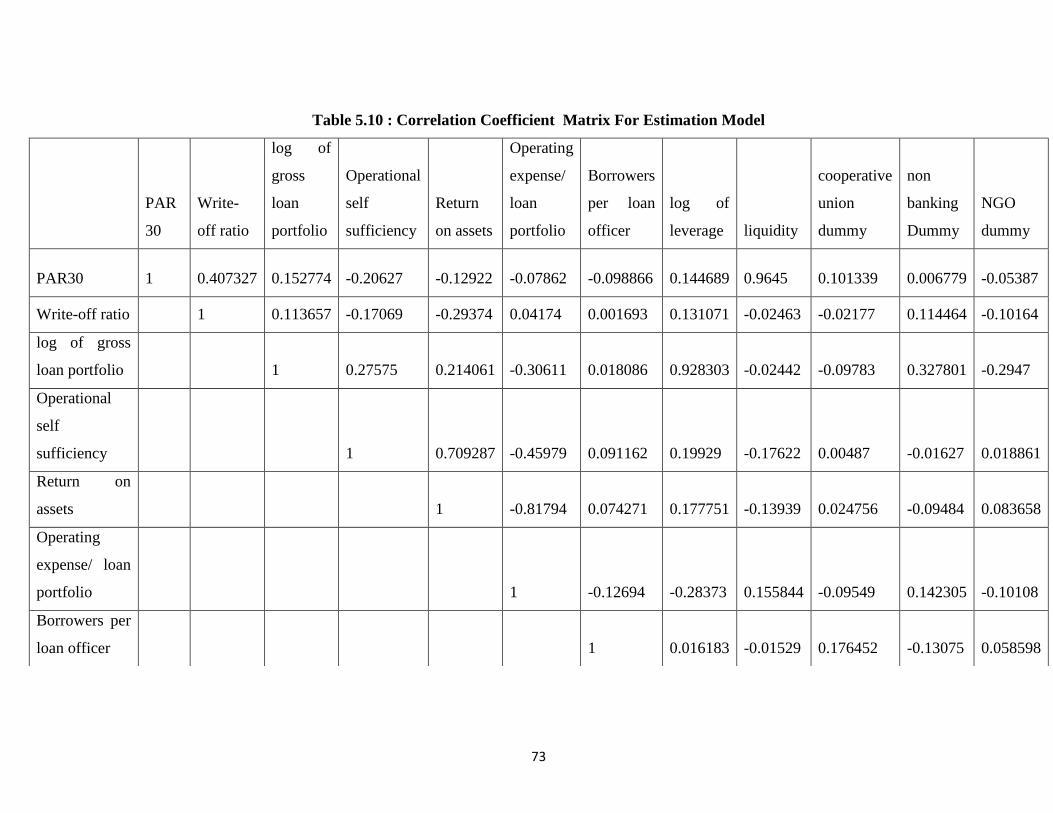
73
Table 5.10 : Correlation Coefficient Matrix For Estimation Model
PAR
30
Write-
off ratio
log of
gross
loan
portfolio
Operational
self
sufficiency
Return
on assets
Operating
expense/
loan
portfolio
Borrowers
per loan
officer
log of
leverage liquidity
cooperative
union
dummy
non
banking
Dummy
NGO
dummy
PAR30 1 0.407327 0.152774 -0.20627 -0.12922 -0.07862 -0.098866 0.144689 0.9645 0.101339 0.006779 -0.05387
Write-off ratio 1 0.113657 -0.17069 -0.29374 0.04174 0.001693 0.131071 -0.02463 -0.02177 0.114464 -0.10164
log of gross
loan portfolio 1 0.27575 0.214061 -0.30611 0.018086 0.928303 -0.02442 -0.09783 0.327801 -0.2947
Operational
self
sufficiency 1 0.709287 -0.45979 0.091162 0.19929 -0.17622 0.00487 -0.01627 0.018861
Return on
assets 1 -0.81794 0.074271 0.177751 -0.13939 0.024756 -0.09484 0.083658
Operating
expense/ loan
portfolio 1 -0.12694 -0.28373 0.155844 -0.09549 0.142305 -0.10108
Borrowers per
loan officer 1 0.016183 -0.01529 0.176452 -0.13075 0.058598
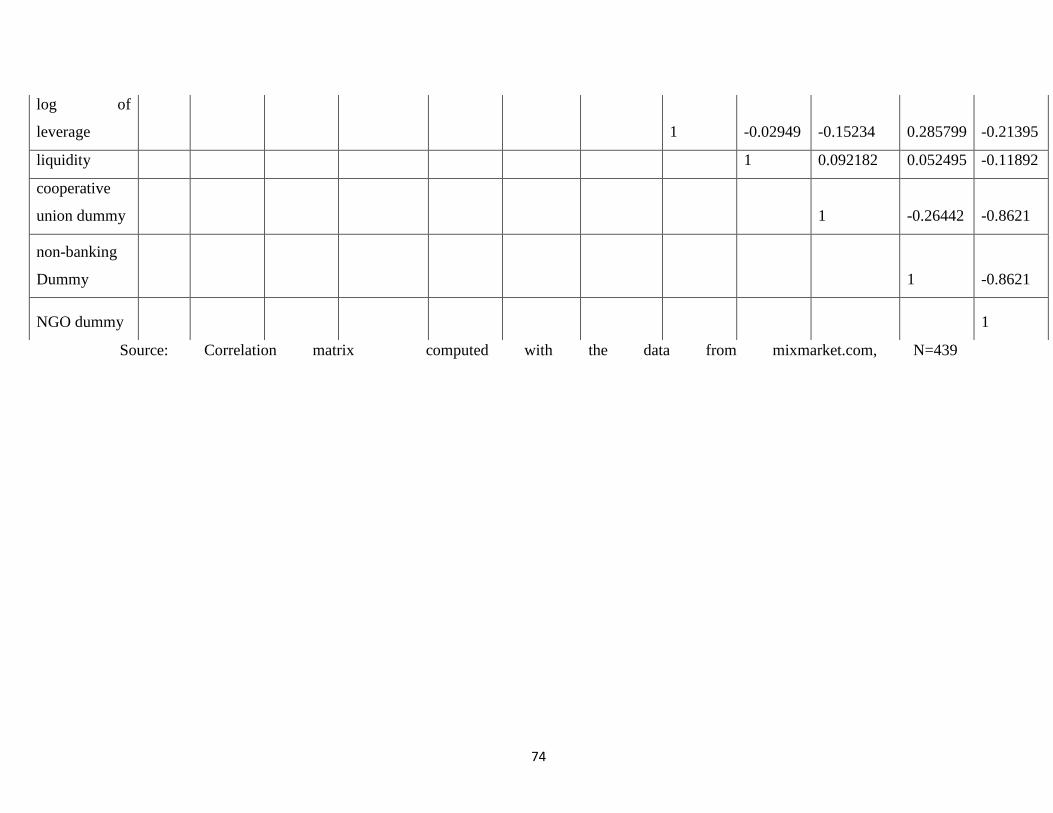
74
Source: Correlation matrix computed with the data from mixmarket.com, N=439
log of
leverage 1 -0.02949 -0.15234 0.285799 -0.21395
liquidity 1 0.092182 0.052495 -0.11892
cooperative
union dummy 1 -0.26442 -0.8621
non-banking
Dummy 1 -0.8621
NGO dummy 1
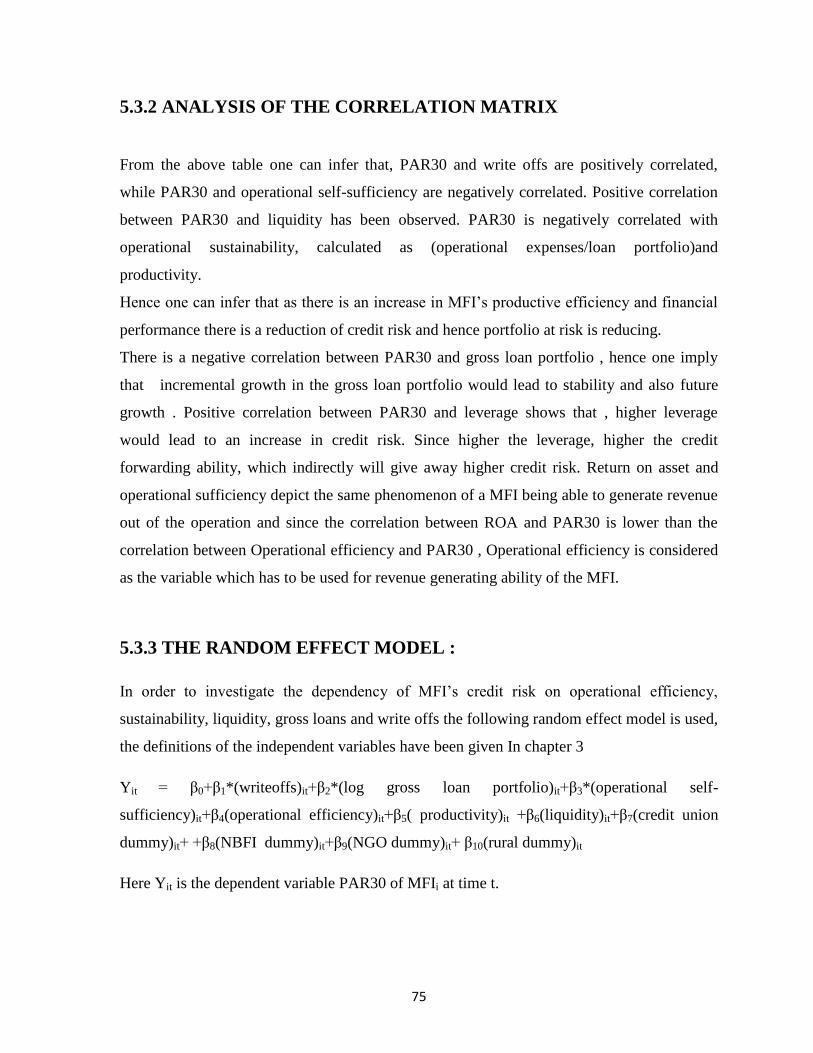
75
5.3.2 ANALYSIS OF THE CORRELATION MATRIX
From the above table one can infer that, PAR30 and write offs are positively correlated,
while PAR30 and operational self-sufficiency are negatively correlated. Positive correlation
between PAR30 and liquidity has been observed. PAR30 is negatively correlated with
operational sustainability, calculated as (operational expenses/loan portfolio)and
productivity.
Hence one can infer that as there is an increase in MFI‟s productive efficiency and financial
performance there is a reduction of credit risk and hence portfolio at risk is reducing.
There is a negative correlation between PAR30 and gross loan portfolio , hence one imply
that incremental growth in the gross loan portfolio would lead to stability and also future
growth . Positive correlation between PAR30 and leverage shows that , higher leverage
would lead to an increase in credit risk. Since higher the leverage, higher the credit
forwarding ability, which indirectly will give away higher credit risk. Return on asset and
operational sufficiency depict the same phenomenon of a MFI being able to generate revenue
out of the operation and since the correlation between ROA and PAR30 is lower than the
correlation between Operational efficiency and PAR30 , Operational efficiency is considered
as the variable which has to be used for revenue generating ability of the MFI.
5.3.3 THE RANDOM EFFECT MODEL :
In order to investigate the dependency of MFI‟s credit risk on operational efficiency,
sustainability, liquidity, gross loans and write offs the following random effect model is used,
the definitions of the independent variables have been given In chapter 3
Yit = β0+β1*(writeoffs)it+β2*(log gross loan portfolio)it+β3*(operational self-
sufficiency)it+β4(operational efficiency)it+β5( productivity)it +β6(liquidity)it+β7(credit union
dummy)it+ +β8(NBFI dummy)it+β9(NGO dummy)it+ β10(rural dummy)it
Here Yit is the dependent variable PAR30 of MFIi at time t.
76
Random effect model considers the effect of variances within the group and in between the
group in order to estimate the component of variances and also helps in building models
which come with in one group such as same time period or same company. So that we can
project the future credit risk applied to one particular MFI at a particular year.
A data set of 439 was collected from mixmarket.com and they were subjected to the
estimation methodology in order to build the random effect model and table 5.11 is the
estimation table for the same.
From the table of estimation of fixed effects the following hypothesis can be concluded.
5.3.3.1 Hypothesis:
Hypothesis 1:
H0: write offs have no effect on the credit risk (PAR30) of the MFI
H1: write offs have effect on the credit risk
From the table one can the observe that the p value is at .000 which is less than the
significance level of .05 hence one can reject the null hypothesis here, meaning one accept
the alternate hypothesis , which says there is an effect of write offs on credit risk from the
estimates we can see that there is a positive relationship between write offs and credit risk.
Hence concluding higher the write offs higher is the credit risk
Hypothesis 2:
H0: gross loan portfolio have no effect on the credit risk ( PAR30)
H1: gross loan portfolio have effect on the credit risk (PAR30)
From the table one can observe that p value is at 0.002 which is way less than 0.05, meaning
one can reject the null hypothesis, accepting the alternate hypothesis. Also one can observe
that there is a positive relationship between credit risk and gross loan portfolio.
Hypothesis 3:
H0: operating sustainability have no effect on the credit risk(PAR30)
77
H1: operating sustainability have effect on the credit risk(PAR30)
From the table one can observe that the p value is at 0.000 which is way less than .05 hence
one can interpret that the null hypothesis is rejected, accepting the alternate hypothesis.
Hence there is negative relationship between operating sustainability and credit risk
Hypothesis 4:
H0: operating efficiency have no effect on credit risk (PAR30)
H1: operating efficiency has effect on credit risk (PAR30)
From the table one can infer that the p value is at .005, which is less than .05 hence the null
hypothesis is rejected, accepting the alternate hypothesis. Concluding that operating
efficiency has an effect on credit risk
Hypothesis 5:
H0: productivity has no effect on credit risk (PAR30)
H1: productivity has an effect credit risk (PAR30)
From the table one can see that the value of P is .047 which is less than 0.05 hence e reject
the null hypothesis, meaning the alternate hypothesis is accepted.
Hypothesis 6:
H0: liquidity has no effect on the credit risk of the MFI
H1: liquidity has an effect on the credit risk of the MFI
From the table one can infer that the p value(0.01) is less than .05 hence the null hypothesis
is rejected while the alternate hypothesis is accepted.
Hypothesis 7:
H0: the type of the MFI has no effect on the credit risk it faces.
H1: the type of MFI has an effect on the credit risk it faces.

78
This hypothesis is tested with respect to the dummies taken up with respect to different
MFIs, ie. NGOs, credit union, NBFI and rural banking dummy and it has been seen that all
the three variables have significance more than .05 which means that there is no relation
between credit risk and the type of MFI.
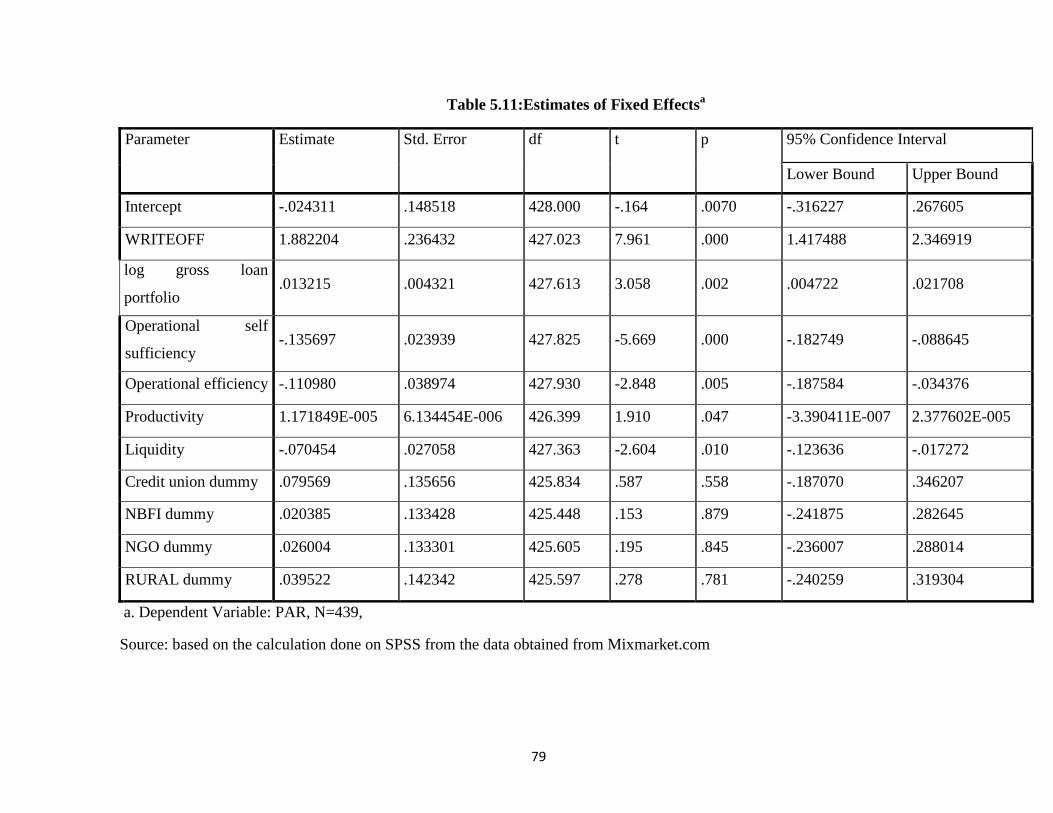
79
Table 5.11:Estimates of Fixed Effectsa
Parameter Estimate Std. Error df t p 95% Confidence Interval
Lower Bound Upper Bound
Intercept -.024311 .148518 428.000 -.164 .0070 -.316227 .267605
WRITEOFF 1.882204 .236432 427.023 7.961 .000 1.417488 2.346919
log gross loan
portfolio .013215 .004321 427.613 3.058 .002 .004722 .021708
Operational self
sufficiency -.135697 .023939 427.825 -5.669 .000 -.182749 -.088645
Operational efficiency -.110980 .038974 427.930 -2.848 .005 -.187584 -.034376
Productivity 1.171849E-005 6.134454E-006 426.399 1.910 .047 -3.390411E-007 2.377602E-005
Liquidity -.070454 .027058 427.363 -2.604 .010 -.123636 -.017272
Credit union dummy .079569 .135656 425.834 .587 .558 -.187070 .346207
NBFI dummy .020385 .133428 425.448 .153 .879 -.241875 .282645
NGO dummy .026004 .133301 425.605 .195 .845 -.236007 .288014
RURAL dummy .039522 .142342 425.597 .278 .781 -.240259 .319304
a. Dependent Variable: PAR, N=439,
Source: based on the calculation done on SPSS from the data obtained from Mixmarket.com
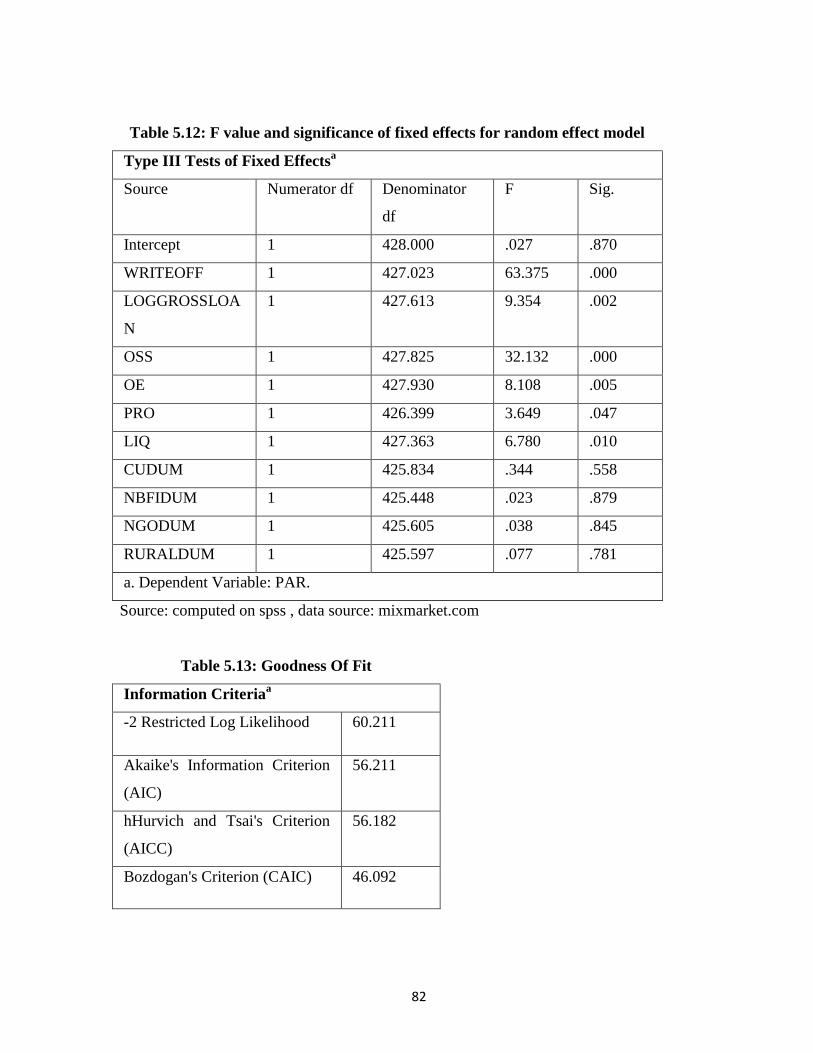
82
Table 5.12: F value and significance of fixed effects for random effect model
Type III Tests of Fixed Effectsa
Source Numerator df Denominator
df
F Sig.
Intercept 1 428.000 .027 .870
WRITEOFF 1 427.023 63.375 .000
LOGGROSSLOA
N
1 427.613 9.354 .002
OSS 1 427.825 32.132 .000
OE 1 427.930 8.108 .005
PRO 1 426.399 3.649 .047
LIQ 1 427.363 6.780 .010
CUDUM 1 425.834 .344 .558
NBFIDUM 1 425.448 .023 .879
NGODUM 1 425.605 .038 .845
RURALDUM 1 425.597 .077 .781
a. Dependent Variable: PAR.
Source: computed on spss , data source: mixmarket.com
Table 5.13: Goodness Of Fit
Information Criteriaa
-2 Restricted Log Likelihood 60.211
Akaike's Information Criterion
(AIC)
56.211
hHurvich and Tsai's Criterion
(AICC)
56.182
Bozdogan's Criterion (CAIC) 46.092
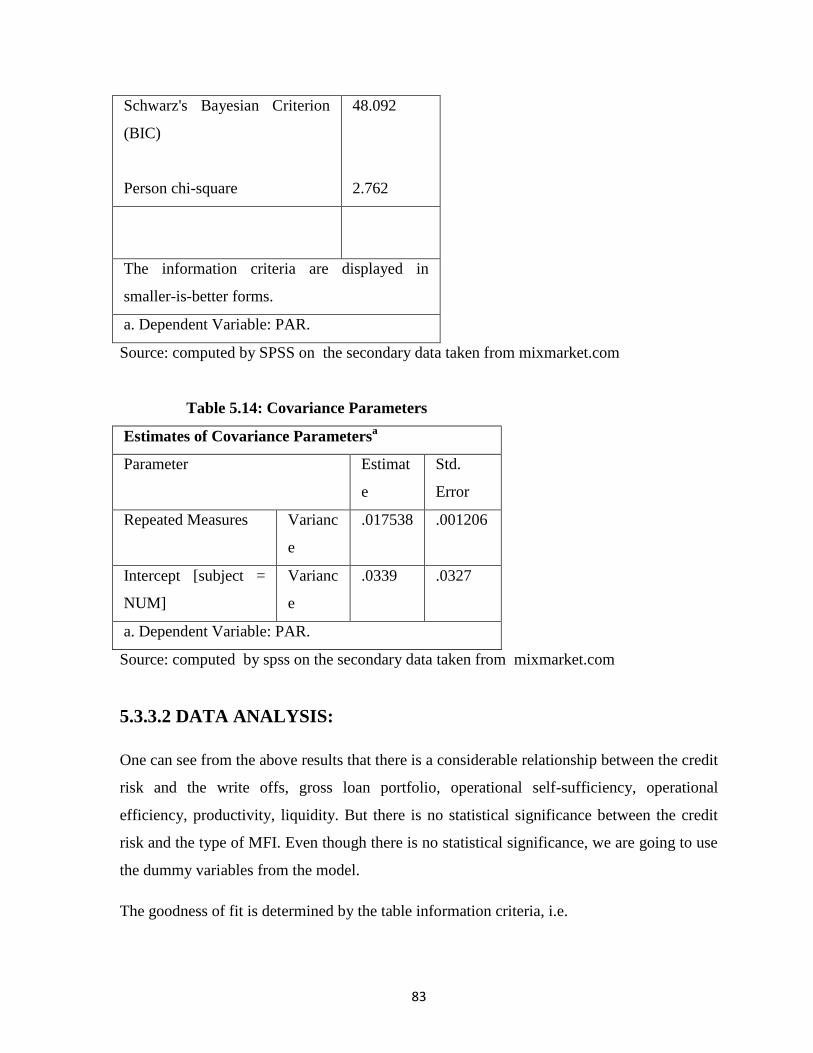
83
Schwarz's Bayesian Criterion
(BIC)
Person chi-square
48.092
2.762
The information criteria are displayed in
smaller-is-better forms.
a. Dependent Variable: PAR.
Source: computed by SPSS on the secondary data taken from mixmarket.com
Table 5.14: Covariance Parameters
Estimates of Covariance Parametersa
Parameter Estimat
e
Std.
Error
Repeated Measures Varianc
e
.017538 .001206
Intercept [subject =
NUM]
Varianc
e
.0339 .0327
a. Dependent Variable: PAR.
Source: computed by spss on the secondary data taken from mixmarket.com
5.3.3.2 DATA ANALYSIS:
One can see from the above results that there is a considerable relationship between the credit
risk and the write offs, gross loan portfolio, operational self-sufficiency, operational
efficiency, productivity, liquidity. But there is no statistical significance between the credit
risk and the type of MFI. Even though there is no statistical significance, we are going to use
the dummy variables from the model.
The goodness of fit is determined by the table information criteria, i.e.
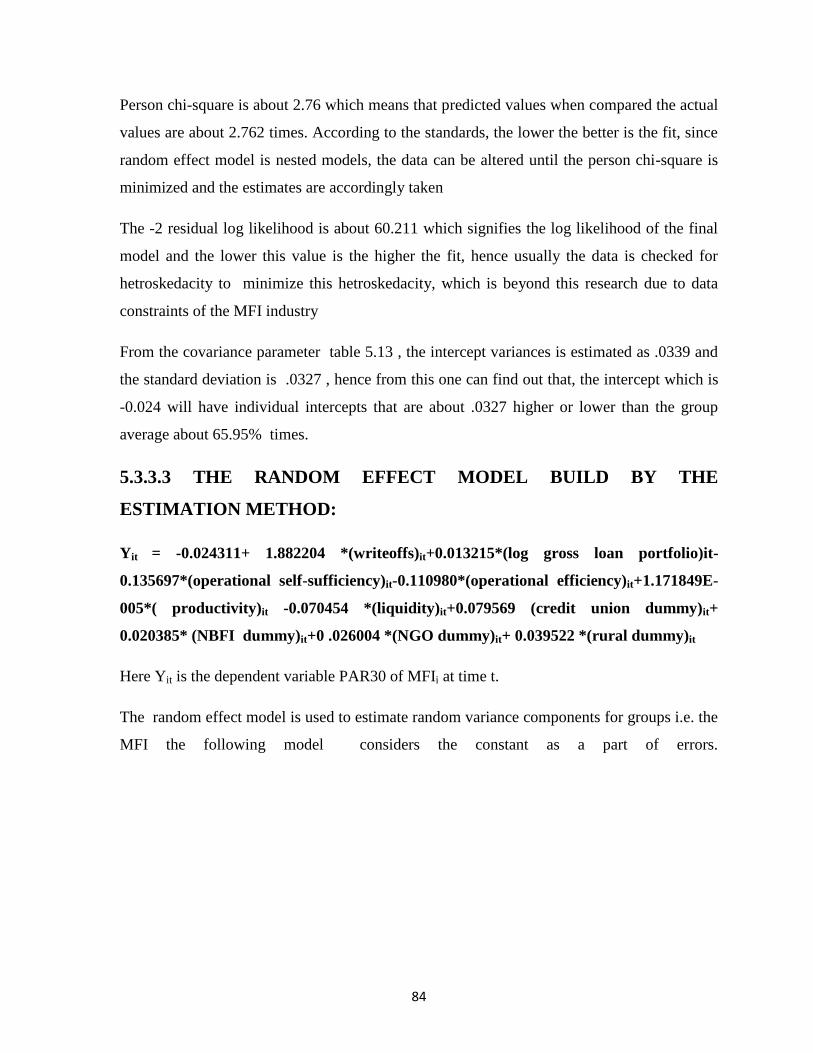
84
Person chi-square is about 2.76 which means that predicted values when compared the actual
values are about 2.762 times. According to the standards, the lower the better is the fit, since
random effect model is nested models, the data can be altered until the person chi-square is
minimized and the estimates are accordingly taken
The -2 residual log likelihood is about 60.211 which signifies the log likelihood of the final
model and the lower this value is the higher the fit, hence usually the data is checked for
hetroskedacity to minimize this hetroskedacity, which is beyond this research due to data
constraints of the MFI industry
From the covariance parameter table 5.13 , the intercept variances is estimated as .0339 and
the standard deviation is .0327 , hence from this one can find out that, the intercept which is
-0.024 will have individual intercepts that are about .0327 higher or lower than the group
average about 65.95% times.
5.3.3.3 THE RANDOM EFFECT MODEL BUILD BY THE
ESTIMATION METHOD:
Yit = -0.024311+ 1.882204 *(writeoffs)it+0.013215*(log gross loan portfolio)it-
0.135697*(operational self-sufficiency)it-0.110980*(operational efficiency)it+1.171849E-
005*( productivity)it -0.070454 *(liquidity)it+0.079569 (credit union dummy)it+
0.020385* (NBFI dummy)it+0 .026004 *(NGO dummy)it+ 0.039522 *(rural dummy)it
Here Yit is the dependent variable PAR30 of MFIi at time t.
The random effect model is used to estimate random variance components for groups i.e. the
MFI the following model considers the constant as a part of errors.

CHAPTER VI
FINDINGS, CONCLUSIONS AND SUGGESTIONS

85
6.1 Introduction:
This chapter the findings of the study are presented. This findings are based on chapter 5,
which talks about analysis and interpretation of data. Also this chapter gives conclusions
which have been observed during the research.
6.2 Discussion of the Findings:
a) From the following research one can decipher that the Morgan Stanley credit risk
assessment model is establishes the relationship between credit risk management and
loan portfolio, profitability/sustainability /operating efficiency, asset-liability
management , management quality, internal controls, growth, system and reporting
b) Also from the model one can see that NBFIs present in Bangalore and Hyderabad have a
credit grading in between 2.93 and 4.4.
c) From hypothesis testing one can find that there is a relationship between the credit risk (
PAR30) and write offs, gross loan portfolio, operational self-sufficiency, operational
efficiency, productivity, liquidity but the relationship is not statistically significant with
credit union dummy, NBFI dummy, rural dummy.
6.3 Conclusions:
From Morgan Stanley credit assessment model, I conclude that NBFI present in Bangalore
and Hyderabad have similar loan portfolios this could be due to the concentration of their
loans in sectors such as farm and farm related activity and urban poor, micro creditors. NBFI
such as trident microfinance, grameen financial services, Ujjivan microfinance which have
exceptionally high credit risk management in place, this is probably because of the
operational efficiency and management quality. Trident has shown high credit grading with
all the factors combined, due to the fact that is has a business model which is presence in one
place until saturation. This would not only reduce the operational expenses but also better
hold on the market with respect to customer reliability. Ujjivan microfinance, quickly
diversified its operations in various areas as soon there was a crisis in Andhra Pradesh.
Grameen financial services has its presence in agricultural and farm related activities of
86
Karnataka. These companies not only react quickly to market changes but also have strong
customer hold
On the other hand share microfinance , is one of the most respected NBFI which has its
presence in 19 states and has been established in 1989. Its credit risk grade is about 3.88
which is well above the average. Share microfinance has gone through organic growth over
the years and has established itself.
From the estimation model, I conclude that the credit risk of MFI is dependent on operational
efficiency, gross loan portfolio, operational self-sufficiency , liquidity , but has little
statistical significance with the type of MFI i.e. NBFI, NGO, rural bank and credit union.
This is partly because of the fact that all the MFIs have similar business models and face the
same kind of risk. The business models hence could be either brick and mortar i.e. branches,
or Self-help group or business correspondence model.
6.4 Suggestions:
From the above analysis, I think the microfinances which have grading below 3.64 have to
work on achieving economies of scale, improve their management quality, and work on
corporate governance. The operational efficiency can be improved through improving their
MIS. MIS plays and important role to identify the customers with respect to their credit
history. Growth of microfinance institutions is mostly based on loan disbursement and the
liquidity for this loan disbursement is majorly coming from equity or debts. Hence
microfinances should work not only on improving the quality of loans disbursed but also on
the returns to the investors.
6.5 Scope for Further Research:
The scope for further research would be to try this model on various other areas and compare
between the different types of microfinance. Also analyses the credit risk based on the
business model rather than the legal structure of the Microfinance.

BIBLIOGRAPHY
87
BIBLIOGRAPHY
(2008). managing microfinance risks. asian development bank.
Abiola, B. (2011). Impact Analysis of Microfinance in Nigeria. International Journal of
Economics and Finance, 217-225.
Arch, G. (2005). Microfinance and development: Risk and return from a policy outcome
perspective. Journal of Banking Regulation, 227–245.
Arvelo, M. (2008). Morgan Stanley‟s Approach to Assessing Credit Risks in the
Microfinance Industry. Journal ofAPPLIED CORPORATE FINANCE, 125-134.
Ayayi, A. G. (2012). Credit risk assessment in the microfinance industry. Economics of
Transition, 37-72.
Barman, D. (2009). Role of Microfinance Interventions in Financial Inclusion: A
Comparative Study of Microfinance Models. The Journal of Business Perspective,
51-59.
Barone, L. R. (2011). EXPLORING HOUSEHOLD MICROFINANCE DECISIONS: AN
ECONOMETRIC ASSESSMENT FOR THE . Georgetown University.
Bruett, T. (2004). Four Risks That Must be Managed by Microfinance Institutions.
Alternative Credit Technologies LLC .
CHIUMYA, C. (2006). THE REGULATION OF MICROFINANCE INSTITUTIONS:. The
University of Manchester.
crabb, p. (2007). foreign exchange risk management practices of microfinance institutions.
Journal of Microfinance, 52-63.
EDARURAL. (n.d.). MFI models & practice. Retrieved from
http://www.edarural.com/impact/chap2a.pdf.
88
Eversole, R. (2003). Help, risk and deceit: microentrepreneurs talk about microfinance.
Journal of International Development , 179-188.
GUTHRIE, P. M. (2010). DETERMINANTS OF CREDIT RATINGS OF MICROFINANCE
INSTITUTIONS IN. THE UNIVERSITY OF TEXAS AT SAN ANTONIO.
I.B., B. (2007). Performance of microfinance providers in karnataka. Kurnool: University of
Agricultural Sciences.
Jiwani, J. (2007). Sustainable microfinance : the impact of pay for performance on key
performance indicators. university of hong kong.
Karlan, D. S. (2008). Credit Elasticities in Less-Developed Economies:implications for
microfinance. American Economic Review, 1048-1068.
Kero, A. (2011). Macroprudential Regulations and the Basel III. Universitat Pompeu Fabra.
Khan, S. (2012). Cost Control in Microfinance: Lessons from ASA. Journal of Cost
Management, 5-22.
Kundu, A. (2011). Savings, Lending Rate. The IUP Journal of Managerial Economics, 33-
51.
Kundu, A. (2012). Savings, Lending Rate and Skill Improvement in Microfinance Operating
through Public-Private Cooperation. The IUP Journal of Managerial Economics, 33-
51.
Muriu, P. (2011). What Explains the Low Profitability of Microfinance Institutions in
Africa? African Journal Of Social Sciences, 850115.
OGUNTOYINBO, M. (2011). Credit risk assessment of the microfinance industry in
Nigeria:An application to Accion Microfinance Bank Limited (AMFB). University of
Stellenbosch.
Pearlman, S. (2007). ESSAYS ON VULNERABILITY, MICROFINANCE AND
ENTREPRENEURSHIP. University of Maryland.
89
Rahman, W. (2011). The Development Perspective of Finance and Microfinance Sector in
china: how far is microfinance regulation? International Journal of Economics and
Finance, 160-170.
Saad, S. T. (2009). Essays on Microfinance: financial and social impacts in bangladesh.
University of North Carolina.
Saltzman, S. B. (1998). The ACCION Camel. ACCION International.
Stackel, K. (2010). Reducing defaults in microfinance: A case study of fundacion integral
campesino (FINCA) Costa Rica. DUQUESNE UNIVERSITY.
Venkataraman, S. (2006). Integrated Risk Management Framework & Basel-II. Misys
Banking.
vurren, F. j. (2011). Risk Management For Microfinance Institutions In South Africa.
University of Pretoria.
Davis, S. (2006). Taking Stock of the microcredit summit campaign. microcredit summit. microcredit
summit.
khan, s. (n.d.). enterprise wide risk management in microfinancing institutions.
Vijender, A. (2012). Micro Finance and Risk Management for Poor in India. Research Journal of
Recent Sciences, 104-107.
Appendix

90
APPENDIX 1:
QUESTIONNAIRE
Morgan Stanley Credit risk assessment
This a part of my research where i have to assess the credit risk of a microfinance, kindly fill
the following sheet so that i can get a better perspective through my research
1) what is the composition of the board
2) kindly tell us the frequency of broad meetings
3) how would you rate the education background of the board members
1 -very highly qualified and have very good experience in MFI industry
2-highly qualified and have good experience in MFI industry
3-moderately qualified and have reasonable experience in MFI industry
4- Have low qualification and also the experience low
5-hav e very low qualification and also have very low experience in MFI industry
4) do you have a formal business plan
Yes no

91
5) do you prepare budget annually
6) where is the current growth/financial projection
7) how many competitors do you have
8) what is the market share of you company
9) what is your market
10) how many branches do you have

92
11) what is your expansion plan
12) who are your shareholders
13) what is the current proportion of shareholders
14) what is the takeoff authorized and paid up capital

93
15) who are the donors to the investment fund
16) do you have a HR policy
17) what is the objective of the HR policy
18) what is the total number of personnel
19) what is your training policy

94
20) how are the staff motivated
21) how do the salary of those working for MFI and other banks
22) what is the staff percentage turnover
23) how do you grade your MIS(very low to very high)
1 2 3 4 5
24) do you have a core banking system
YES
NO
25) if yes kindly grade the core banking system (very low to very high)

95
1 2 3 4 5
26) how would you grade the IT link between the HQ and branches (very low to very high)
1 2 3 4 5
27) how are the branches linked
28) what accounting software do you use
29) how would you grade your accounting software on a scale of 1 to 5(very low to very
high)
1 2 3 4 5
30) at what intervals do you make a consolidated report
daily
weekly
monthly
quarterly
semi annually
annually
31) do you have formal operational procedures
yes
no

96
32) how often do you review your procedures
33) do you have a problem with the senior managers to comply
yes
no
34) how many staff do you have for internal audit .
35) how do you control the processes involved
36) what is the relationship with internal auditor and external auditor

97
37) when was the MFI incorporated
38) when did the bank actually commence business has the MFI been licensed by the RBI
39) How would you grade the regulatory control of RBI on a scale of 1 to 5(very low to very
high)
1 2 3 4 5
40) what is the frequency of RBI inspections
41) what are the number of savings customers

98
42) what is the area of coverage of bank operations
43) what is the size of potential customers
44) Kindly fill in the name of the microfinance

99
APPENDIX 2: RESPONSES TO THE QUESTIONNAIRE 1 2 3 4 5 6
what is the composition of the board
how would you rate the education background of the board members
kindly tell us the frequency of broad meetings
do you have a formal business plan
do you prepare budget annually
where is the current growth/financial projection
Board Comprises of 8 Members -3 Independent -3 Nominee Directors -2 Promoter Directors
2-highly qualified and have good experience in MFI industry
-Every Quarterly a board meeting is conducted. -Annual General Meeting is conducted once in a year. All the meeting are conducted as stipulated by law
Yes Yes For the current FY our growth /financial projections for some parameters are on track and for few parameters we have already exceeded the plan.
board comprises of chairman and managing director( both being the same), it is a family owned NBFC with Blue orchid microfinance investments on board as minority shareholder
3-moderately qualified and have reasonable experience in MFI industry
the board meetings are often as the NBFI is family owned business
Yes Yes the current FY , we have reduced the interest rates in order to meet targets at certain places
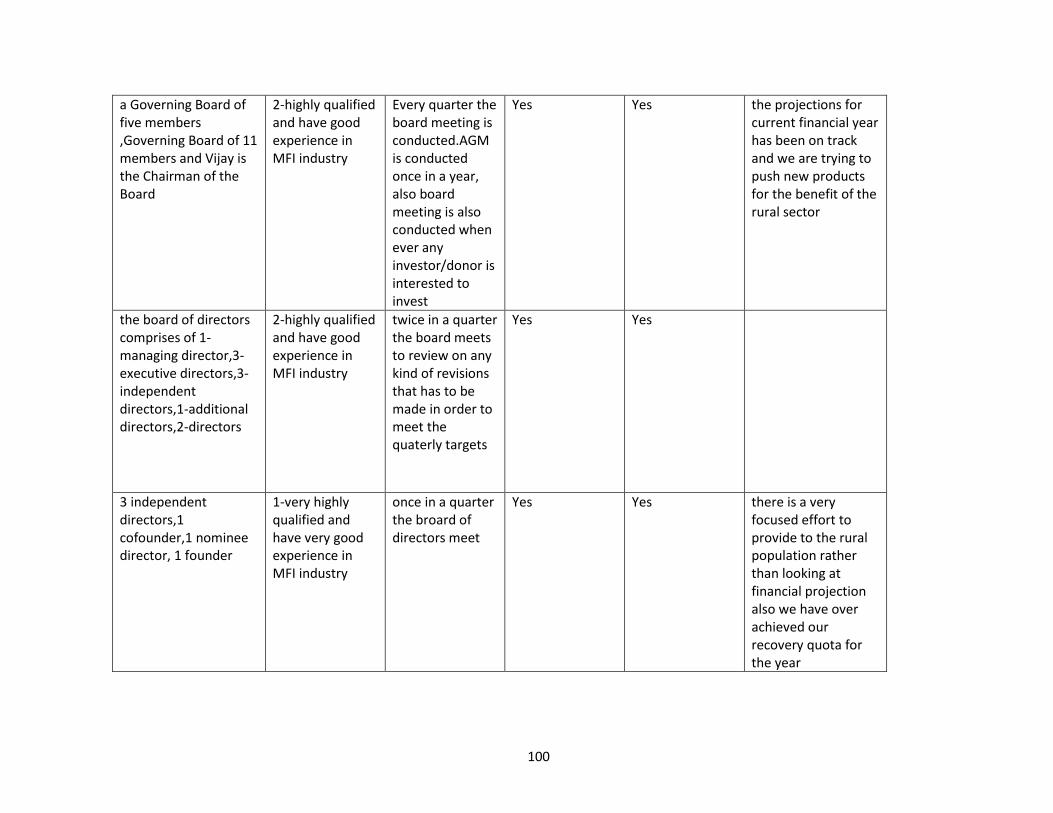
100
a Governing Board of five members ,Governing Board of 11 members and Vijay is the Chairman of the Board
2-highly qualified and have good experience in MFI industry
Every quarter the board meeting is conducted.AGM is conducted once in a year, also board meeting is also conducted when ever any investor/donor is interested to invest
Yes Yes the projections for current financial year has been on track and we are trying to push new products for the benefit of the rural sector
the board of directors comprises of 1- managing director,3-executive directors,3-independent directors,1-additional directors,2-directors
2-highly qualified and have good experience in MFI industry
twice in a quarter the board meets to review on any kind of revisions that has to be made in order to meet the quaterly targets
Yes Yes
3 independent directors,1 cofounder,1 nominee director, 1 founder
1-very highly qualified and have very good experience in MFI industry
once in a quarter the broard of directors meet
Yes Yes there is a very focused effort to provide to the rural population rather than looking at financial projection also we have over achieved our recovery quota for the year
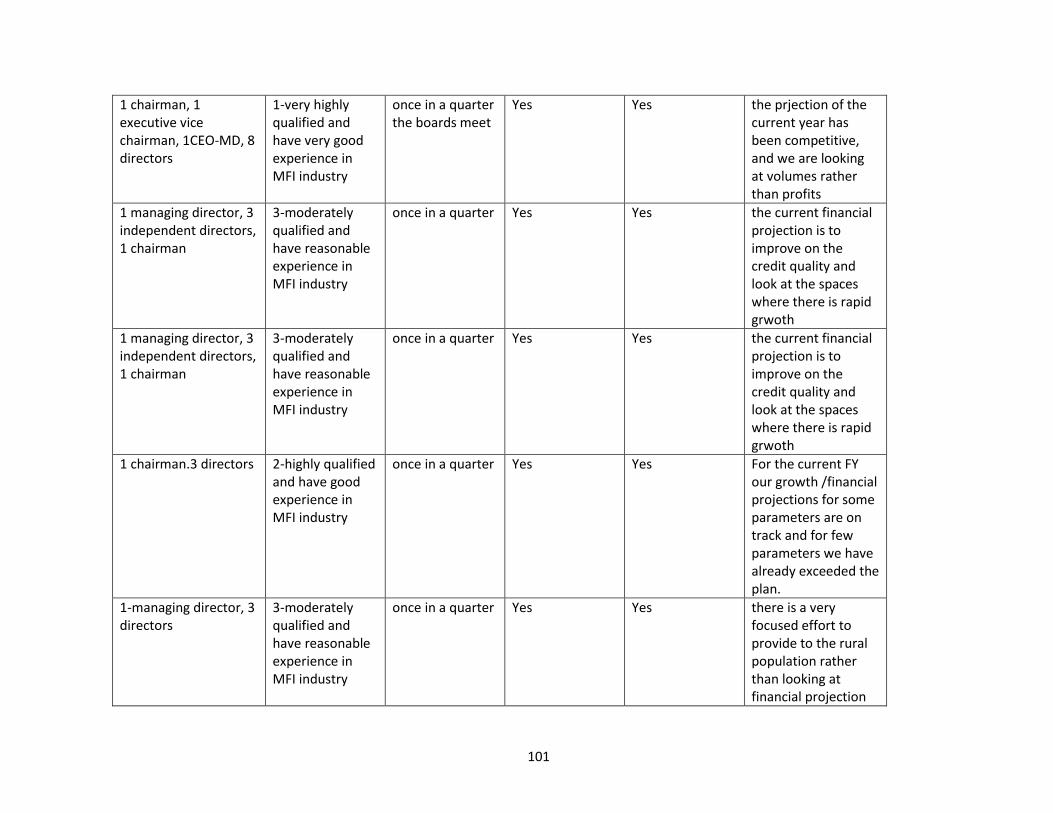
101
1 chairman, 1 executive vice chairman, 1CEO-MD, 8 directors
1-very highly qualified and have very good experience in MFI industry
once in a quarter the boards meet
Yes Yes the prjection of the current year has been competitive, and we are looking at volumes rather than profits
1 managing director, 3 independent directors, 1 chairman
3-moderately qualified and have reasonable experience in MFI industry
once in a quarter Yes Yes the current financial projection is to improve on the credit quality and look at the spaces where there is rapid grwoth
1 managing director, 3 independent directors, 1 chairman
3-moderately qualified and have reasonable experience in MFI industry
once in a quarter Yes Yes the current financial projection is to improve on the credit quality and look at the spaces where there is rapid grwoth
1 chairman.3 directors 2-highly qualified and have good experience in MFI industry
once in a quarter Yes Yes For the current FY our growth /financial projections for some parameters are on track and for few parameters we have already exceeded the plan.
1-managing director, 3 directors
3-moderately qualified and have reasonable experience in MFI industry
once in a quarter Yes Yes there is a very focused effort to provide to the rural population rather than looking at financial projection
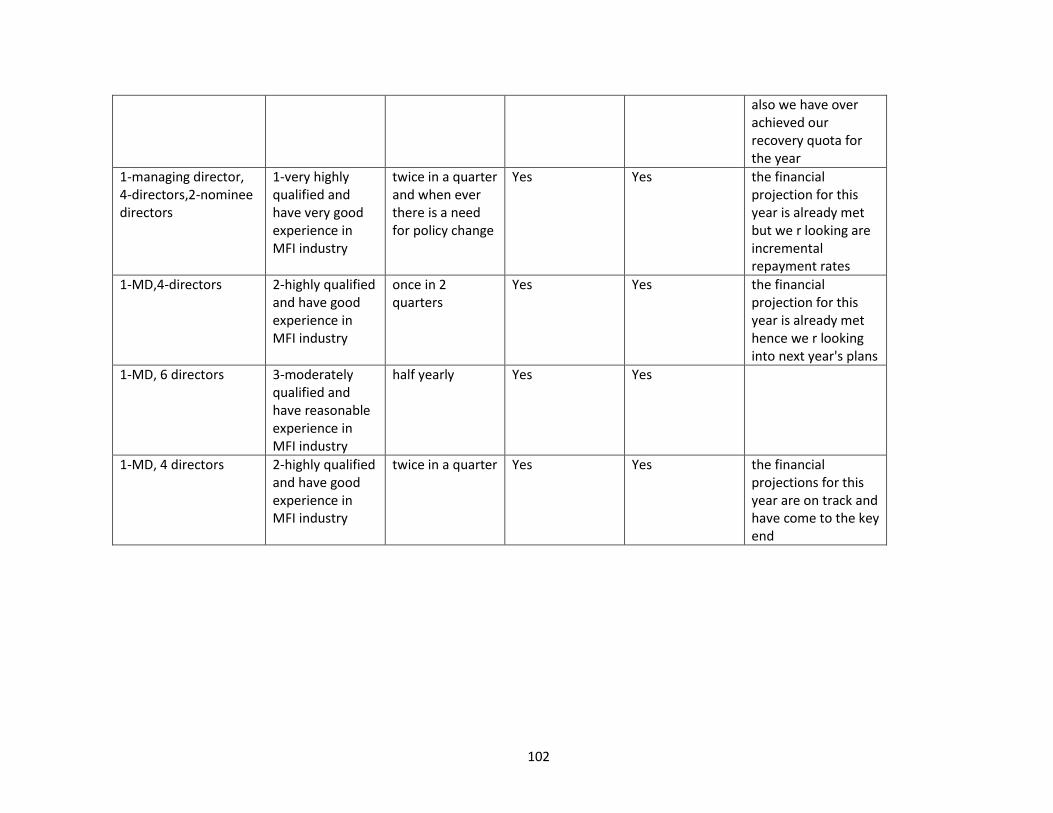
102
also we have over achieved our recovery quota for the year
1-managing director, 4-directors,2-nominee directors
1-very highly qualified and have very good experience in MFI industry
twice in a quarter and when ever there is a need for policy change
Yes Yes the financial projection for this year is already met but we r looking are incremental repayment rates
1-MD,4-directors 2-highly qualified and have good experience in MFI industry
once in 2 quarters
Yes Yes the financial projection for this year is already met hence we r looking into next year's plans
1-MD, 6 directors 3-moderately qualified and have reasonable experience in MFI industry
half yearly Yes Yes
1-MD, 4 directors 2-highly qualified and have good experience in MFI industry
twice in a quarter Yes Yes the financial projections for this year are on track and have come to the key end

103
1-non executive chairman, 1-CEO,1-nominee director,
1-very highly qualified and have very good experience in MFI industry
more than twice a quarter
Yes Yes
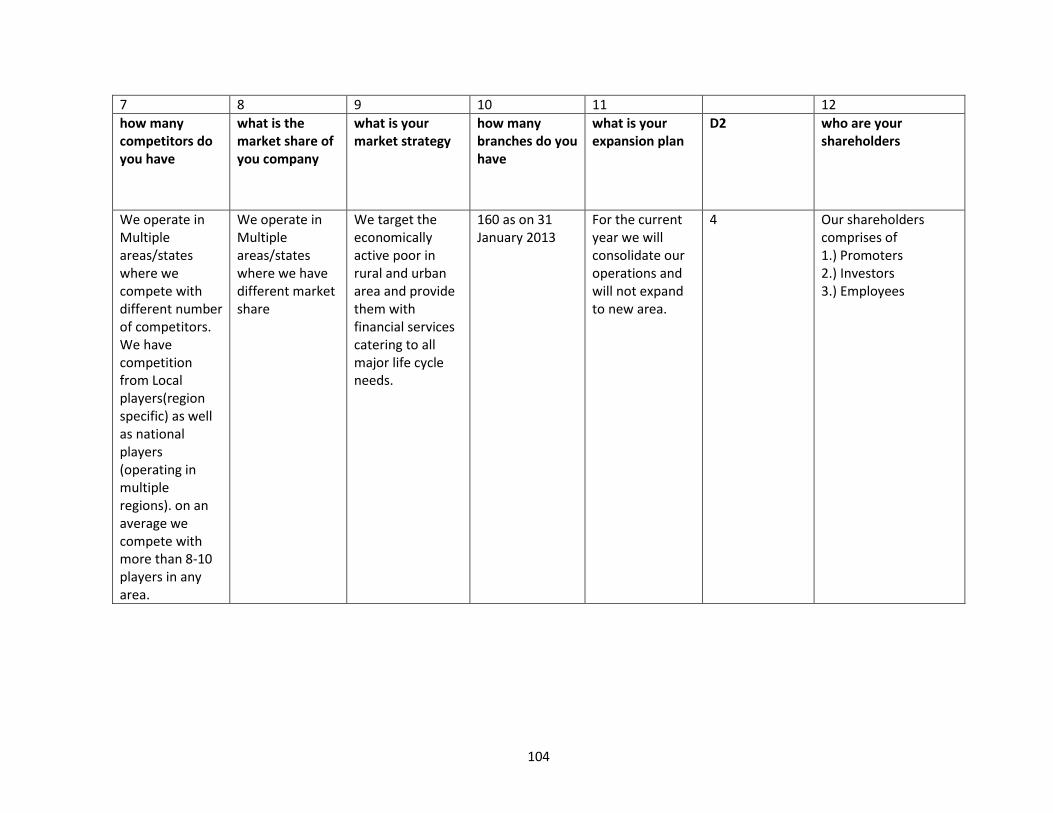
104
7 8 9 10 11 12
how many competitors do you have
what is the market share of you company
what is your market strategy
how many branches do you have
what is your expansion plan
D2 who are your shareholders
We operate in Multiple areas/states where we compete with different number of competitors. We have competition from Local players(region specific) as well as national players (operating in multiple regions). on an average we compete with more than 8-10 players in any area.
We operate in Multiple areas/states where we have different market share
We target the economically active poor in rural and urban area and provide them with financial services catering to all major life cycle needs.
160 as on 31 January 2013
For the current year we will consolidate our operations and will not expand to new area.
4 Our shareholders comprises of 1.) Promoters 2.) Investors 3.) Employees

105
we operate in multiple states and areas, hence the competitors are on basis of competitive interest rates
the microfinance industry unorganised to calculate the marketshare, but we hold varied market share at varied places
we target rural areas of adhra pradesh, tamil nadu, maharastra and orissa ( 18 states) by reduced interest rates
485 as on july 2009
as of now, we have been concentrating on the existing markets
3 the shareholders are, promoters, blue orchid microfinanceinvestors ltd
basix has different competitors at different areas and it is able to differentiate itself through its scale up plans by securing additional commercial equity of US$10 million and US$26 million
market share is different in different places, but as said earlier, BASIX focuses on market share through external commercial equity
yes our market strategy to provide not only the finance to rural farmers but also provide technical expertise in non farm spaces and also farm spaces, so that the farmers/micro entreprenuers are able to improve their incomes, reduce the operational cost and also improve the yield
921 as on july 2009
as of now we are trying to expand through the equity capital obtained through commericial equity , to diary industry since it has 4% growth YoY, and 10 million by 2014
2 the promoters, SIDBI, external commercial equity
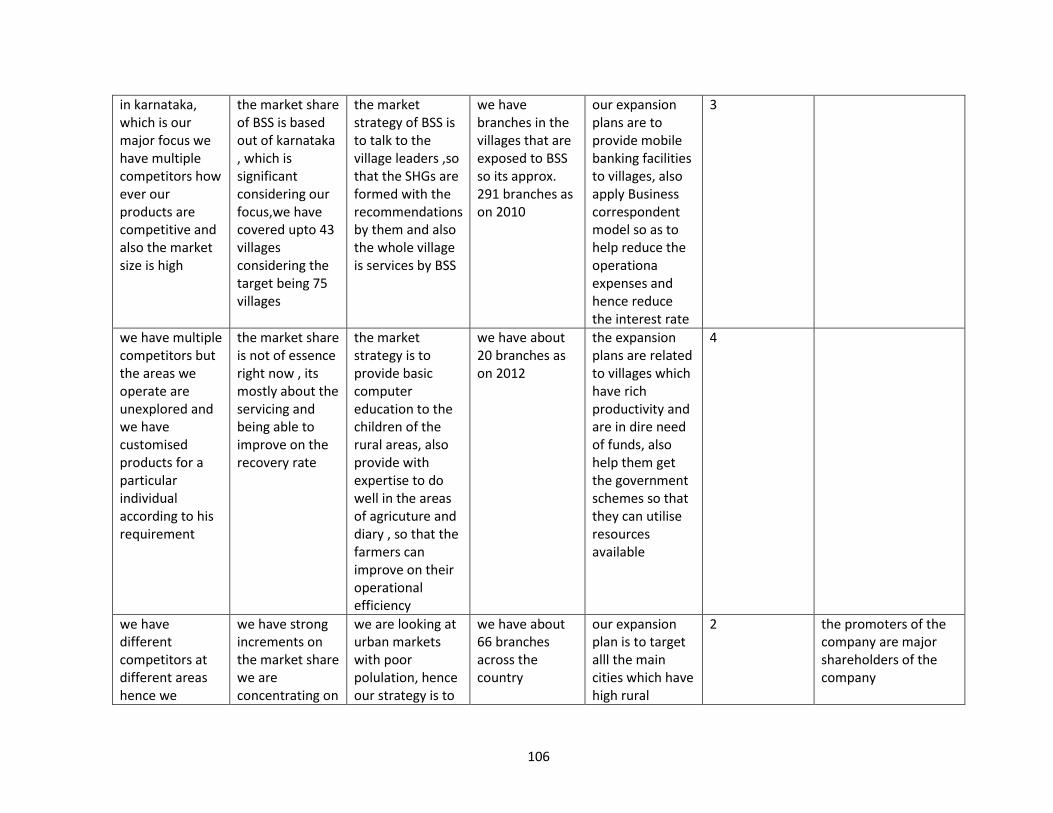
106
in karnataka, which is our major focus we have multiple competitors how ever our products are competitive and also the market size is high
the market share of BSS is based out of karnataka , which is significant considering our focus,we have covered upto 43 villages considering the target being 75 villages
the market strategy of BSS is to talk to the village leaders ,so that the SHGs are formed with the recommendations by them and also the whole village is services by BSS
we have branches in the villages that are exposed to BSS so its approx. 291 branches as on 2010
our expansion plans are to provide mobile banking facilities to villages, also apply Business correspondent model so as to help reduce the operationa expenses and hence reduce the interest rate
3
we have multiple competitors but the areas we operate are unexplored and we have customised products for a particular individual according to his requirement
the market share is not of essence right now , its mostly about the servicing and being able to improve on the recovery rate
the market strategy is to provide basic computer education to the children of the rural areas, also provide with expertise to do well in the areas of agricuture and diary , so that the farmers can improve on their operational efficiency
we have about 20 branches as on 2012
the expansion plans are related to villages which have rich productivity and are in dire need of funds, also help them get the government schemes so that they can utilise resources available
4
we have different competitors at different areas hence we
we have strong increments on the market share we are concentrating on
we are looking at urban markets with poor polulation, hence our strategy is to
we have about 66 branches across the country
our expansion plan is to target alll the main cities which have high rural
2 the promoters of the company are major shareholders of the company
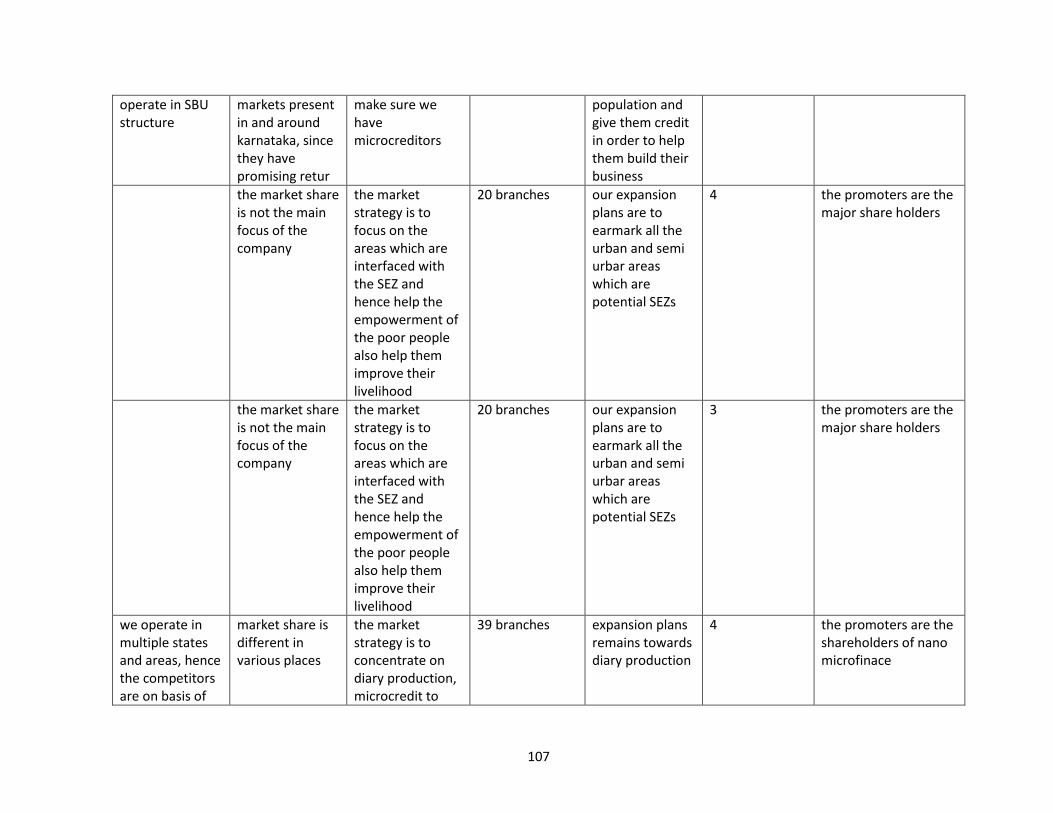
107
operate in SBU structure
markets present in and around karnataka, since they have promising retur
make sure we have microcreditors
population and give them credit in order to help them build their business
the market share is not the main focus of the company
the market strategy is to focus on the areas which are interfaced with the SEZ and hence help the empowerment of the poor people also help them improve their livelihood
20 branches our expansion plans are to earmark all the urban and semi urbar areas which are potential SEZs
4 the promoters are the major share holders
the market share is not the main focus of the company
the market strategy is to focus on the areas which are interfaced with the SEZ and hence help the empowerment of the poor people also help them improve their livelihood
20 branches our expansion plans are to earmark all the urban and semi urbar areas which are potential SEZs
3 the promoters are the major share holders
we operate in multiple states and areas, hence the competitors are on basis of
market share is different in various places
the market strategy is to concentrate on diary production, microcredit to
39 branches expansion plans remains towards diary production
4 the promoters are the shareholders of nano microfinace

108
competitive interest rates
farmer
we operate in multiple states and areas, hence the competitors are on basis of competitive interest rates
the market share is dependent on the southern and western sides of the india and the rual and urban poor population
the market strategy to be present at the western and southern part of india
29 branches the expansion plans are give community development to as many villages as possible ,Samasta will be operational in Maharashtra, Gujarat and Madhya Pradesh. By 2013, we plan to reach 1.8 million people in India
5 the promoters
we operate in Andhra Pradesh, Chhattisgarh, Delhi, Karnataka, Maharashtra, Madhya Pradesh, Uttar Pradesh, Rajasthan, Bihar, Uttarakhand, Gujarat, Haryana, Himachal Pradesh, Tamil Nadu, West Bengal,
since this is mostly unorganised space, we cannot pinpoint the market share but we are targeting at higher revenue through higher market share
the market strategy is to concentrate on women entreprenuers and also give higher empowerment at bother rural and urban poor population
914 branches the expansion plan is to to reach other parts of india
3 the promoters, Legatum Ventures Limited,Aavishkaar Goodwell,poor wome
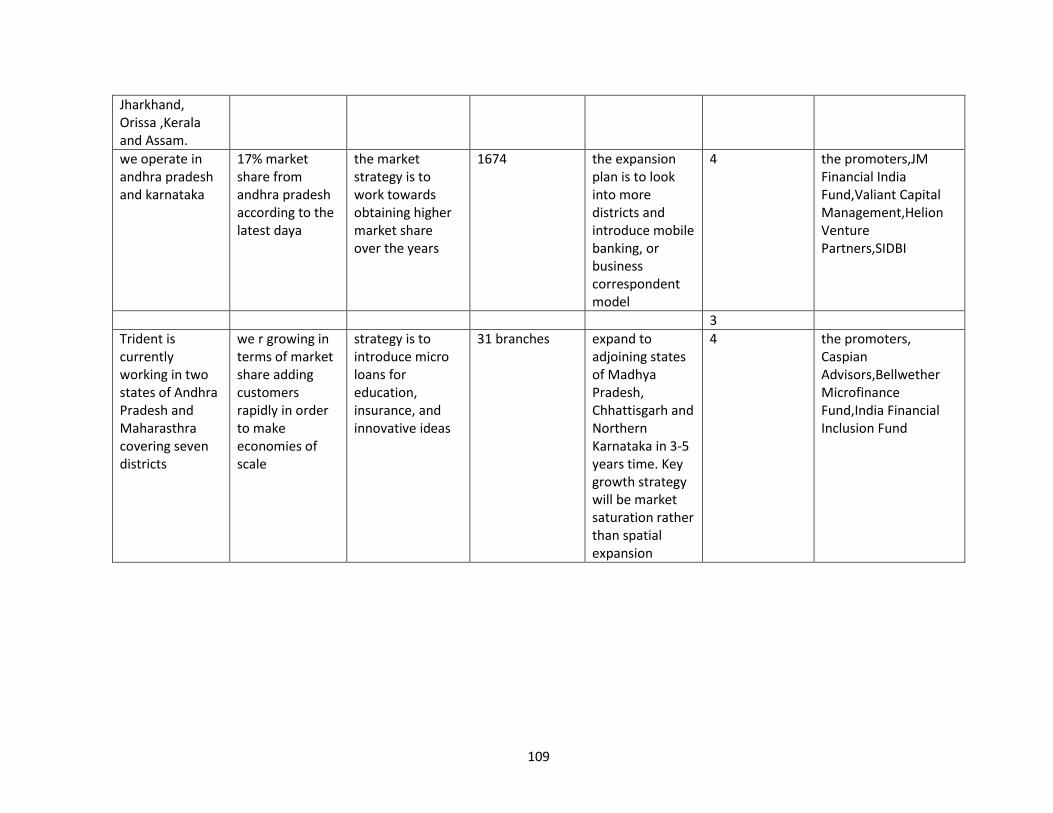
109
Jharkhand, Orissa ,Kerala and Assam.
we operate in andhra pradesh and karnataka
17% market share from andhra pradesh according to the latest daya
the market strategy is to work towards obtaining higher market share over the years
1674 the expansion plan is to look into more districts and introduce mobile banking, or business correspondent model
4 the promoters,JM Financial India Fund,Valiant Capital Management,Helion Venture Partners,SIDBI
3
Trident is currently working in two states of Andhra Pradesh and Maharasthra covering seven districts
we r growing in terms of market share adding customers rapidly in order to make economies of scale
strategy is to introduce micro loans for education, insurance, and innovative ideas
31 branches expand to adjoining states of Madhya Pradesh, Chhattisgarh and Northern Karnataka in 3-5 years time. Key growth strategy will be market saturation rather than spatial expansion
4 the promoters, Caspian Advisors,Bellwether Microfinance Fund,India Financial Inclusion Fund

110
Karnataka, Bengal, Tamil Nadu and Jharkhand States
we are focusing on expanding in northern and eastern areas
we are looking into expanding into 6 major cities
5 the promoters, The Michael & Susan Dell Foundation,Bellwether Microfinance Fund Private Limited,India Financial Inclusion Fund,Sequoia Capital ,The Lok Capital Group,Elevar Equity,
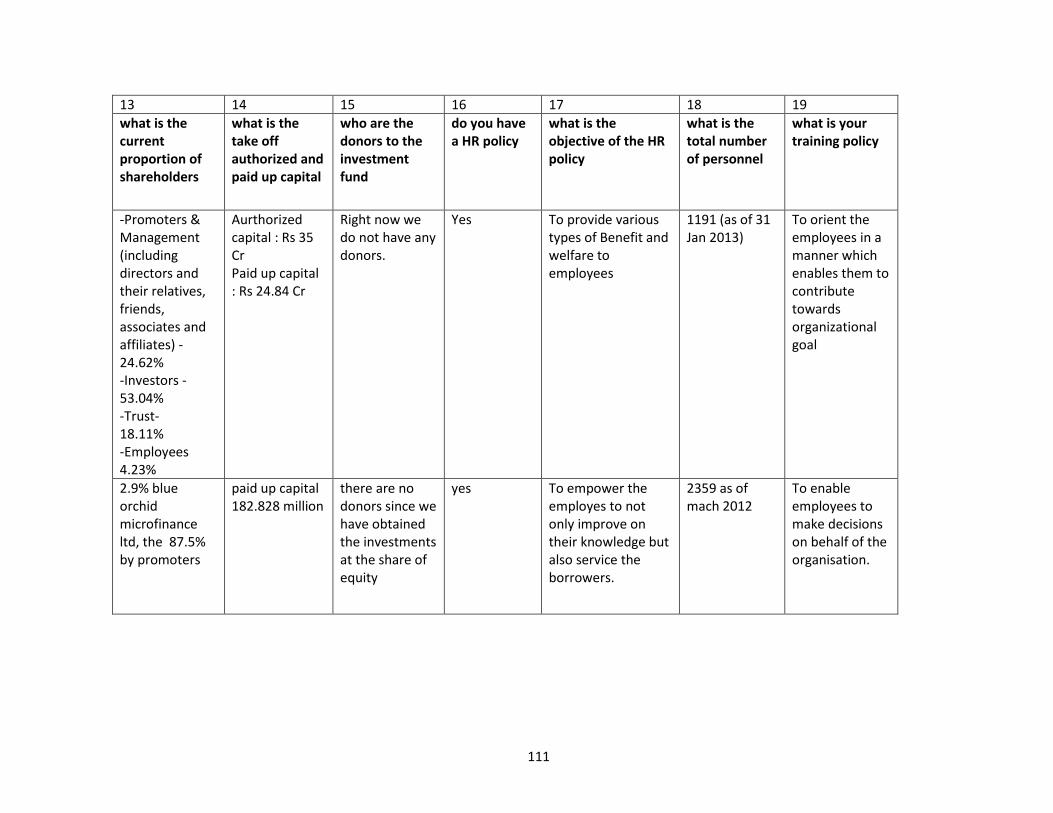
111
13 14 15 16 17 18 19
what is the current proportion of shareholders
what is the take off authorized and paid up capital
who are the donors to the investment fund
do you have a HR policy
what is the objective of the HR policy
what is the total number of personnel
what is your training policy
-Promoters & Management (including directors and their relatives, friends, associates and affiliates) -24.62% -Investors - 53.04% -Trust- 18.11% -Employees 4.23%
Aurthorized capital : Rs 35 Cr Paid up capital : Rs 24.84 Cr
Right now we do not have any donors.
Yes To provide various types of Benefit and welfare to employees
1191 (as of 31 Jan 2013)
To orient the employees in a manner which enables them to contribute towards organizational goal
2.9% blue orchid microfinance ltd, the 87.5% by promoters
paid up capital 182.828 million
there are no donors since we have obtained the investments at the share of equity
yes To empower the employes to not only improve on their knowledge but also service the borrowers.
2359 as of mach 2012
To enable employees to make decisions on behalf of the organisation.

112
Bharatiya Samruddhi Investments and Consulting Services has about 41.9% and IFC has about 17.6% , the other investors are Lok capital LLC, Aavishkar goodwell and SIDBI as the largest shareholders.
700 crores of paid up capital
donors such as ford foundation, the swiss agency for development and cooperation and canadian international development agency
yes to improve the confidance of the employees and help them improve their knowledge on microentreprenuers, also show them clear growth paths from the prositions of field executives and customer service associate to higher positions
10,000 as on 2012
give regular internal and external training to the employees so as to improve their knowledge
238million of authorised capital and 202 million of paid up capital
Yes have to not only pay competitively to the employees to attract their and retain them but also train them in different areas so as to help them build on their expertise
to help the employees get exposure with all the tools used on the microfinance space so that they can help build a competitive organisation
100 million authorised capital , 80.8 million paid up capital
no Yes to train and employee them so that there is collective growth of both organisation and the employee
120 as of 2011 to train the employees in different areas of rural or microcredit space so that they only able
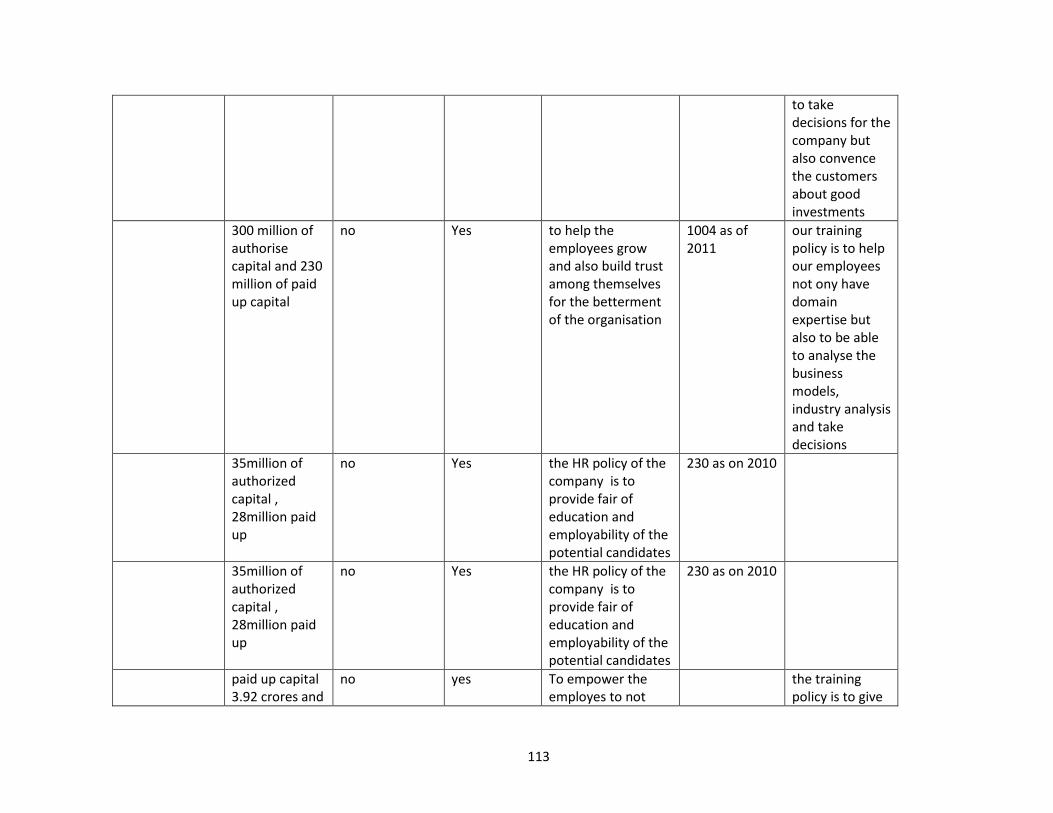
113
to take decisions for the company but also convence the customers about good investments
300 million of authorise capital and 230 million of paid up capital
no Yes to help the employees grow and also build trust among themselves for the betterment of the organisation
1004 as of 2011
our training policy is to help our employees not ony have domain expertise but also to be able to analyse the business models, industry analysis and take decisions
35million of authorized capital , 28million paid up
no Yes the HR policy of the company is to provide fair of education and employability of the potential candidates
230 as on 2010
35million of authorized capital , 28million paid up
no Yes the HR policy of the company is to provide fair of education and employability of the potential candidates
230 as on 2010
paid up capital 3.92 crores and
no yes To empower the employes to not
the training policy is to give
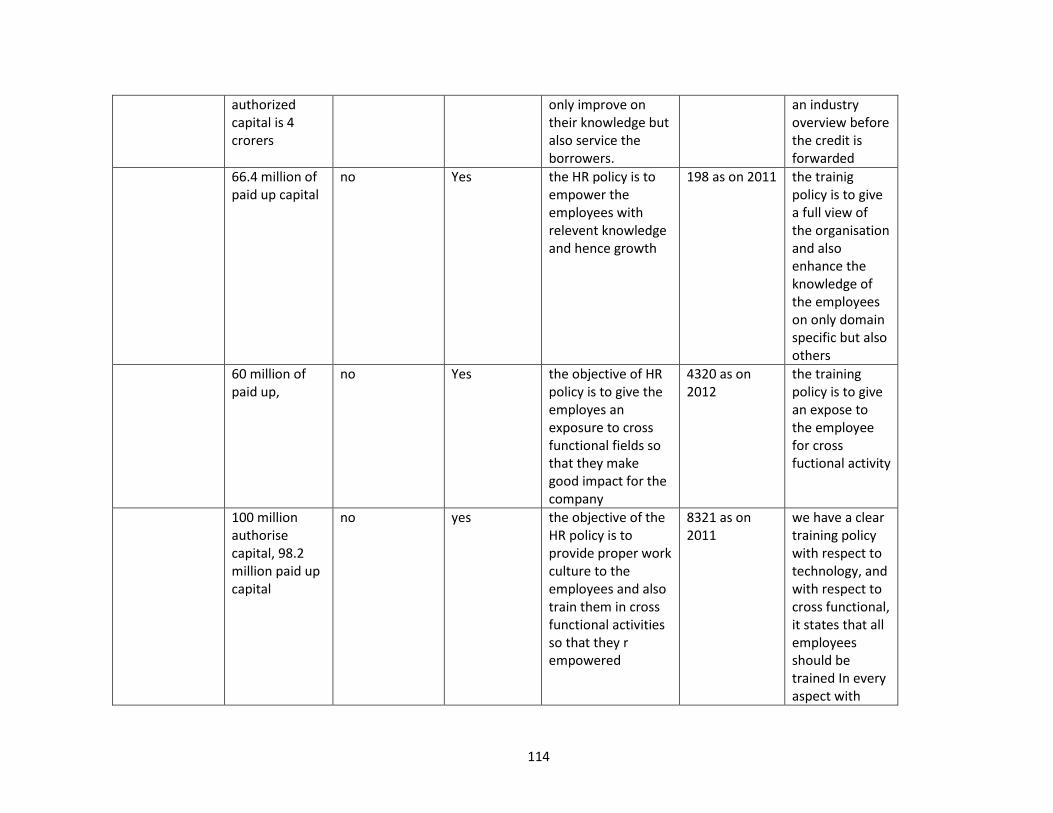
114
authorized capital is 4 crorers
only improve on their knowledge but also service the borrowers.
an industry overview before the credit is forwarded
66.4 million of paid up capital
no Yes the HR policy is to empower the employees with relevent knowledge and hence growth
198 as on 2011 the trainig policy is to give a full view of the organisation and also enhance the knowledge of the employees on only domain specific but also others
60 million of paid up,
no Yes the objective of HR policy is to give the employes an exposure to cross functional fields so that they make good impact for the company
4320 as on 2012
the training policy is to give an expose to the employee for cross fuctional activity
100 million authorise capital, 98.2 million paid up capital
no yes the objective of the HR policy is to provide proper work culture to the employees and also train them in cross functional activities so that they r empowered
8321 as on 2011
we have a clear training policy with respect to technology, and with respect to cross functional, it states that all employees should be trained In every aspect with
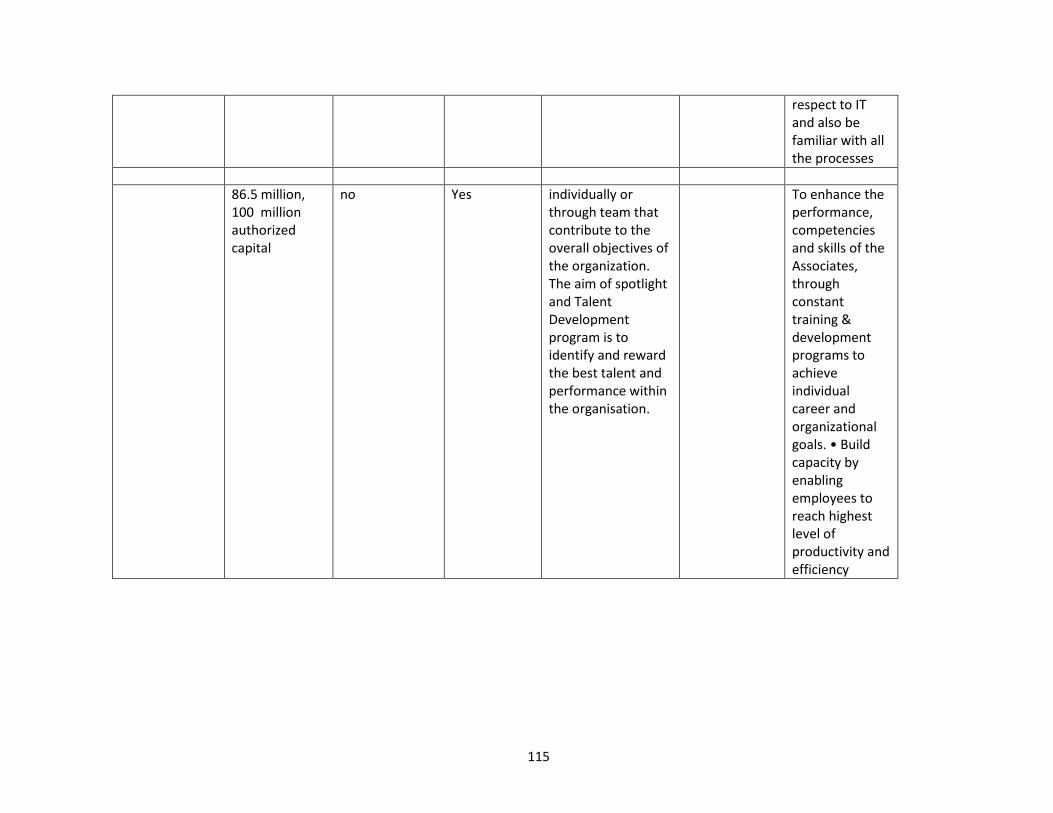
115
respect to IT and also be familiar with all the processes
86.5 million,
100 million authorized capital
no Yes individually or through team that contribute to the overall objectives of the organization. The aim of spotlight and Talent Development program is to identify and reward the best talent and performance within the organisation.
To enhance the performance, competencies and skills of the Associates, through constant training & development programs to achieve individual career and organizational goals. • Build capacity by enabling employees to reach highest level of productivity and efficiency
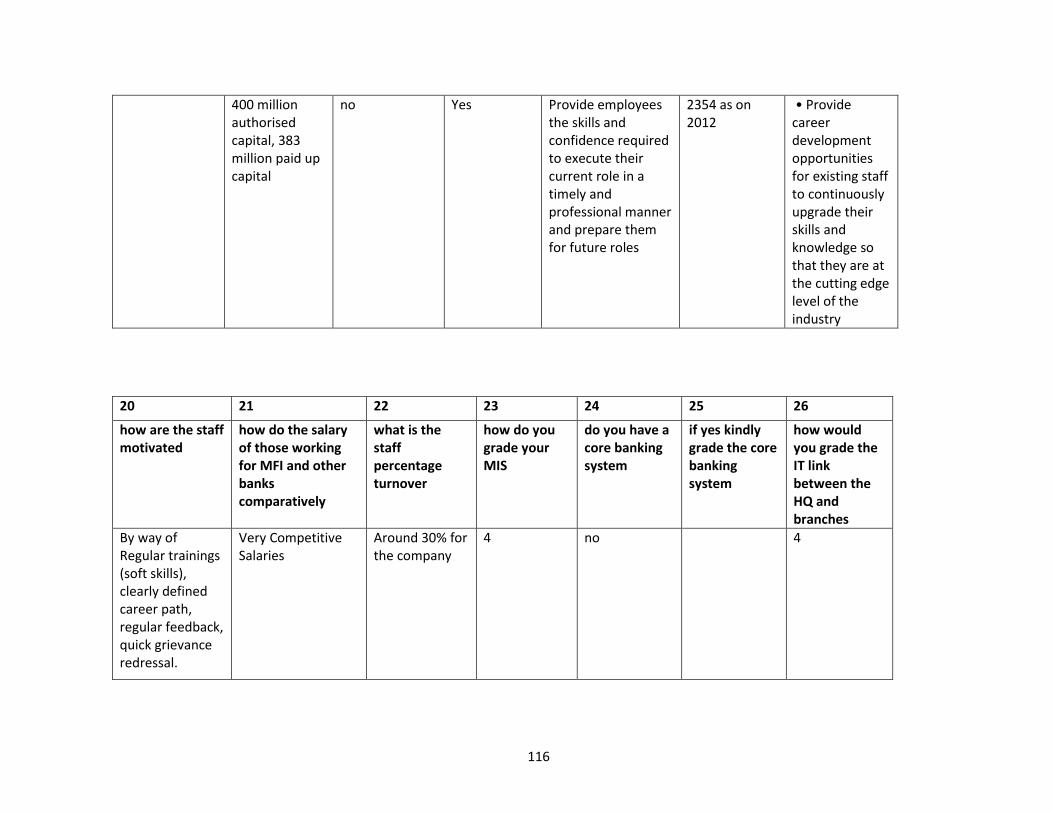
116
400 million authorised capital, 383 million paid up capital
no Yes Provide employees the skills and confidence required to execute their current role in a timely and professional manner and prepare them for future roles
2354 as on 2012
• Provide career development opportunities for existing staff to continuously upgrade their skills and knowledge so that they are at the cutting edge level of the industry
20 21 22 23 24 25 26
how are the staff motivated
how do the salary of those working for MFI and other banks comparatively
what is the staff percentage turnover
how do you grade your MIS
do you have a core banking system
if yes kindly grade the core banking system
how would you grade the IT link between the HQ and branches
By way of Regular trainings (soft skills), clearly defined career path, regular feedback, quick grievance redressal.
Very Competitive Salaries
Around 30% for the company
4 no 4
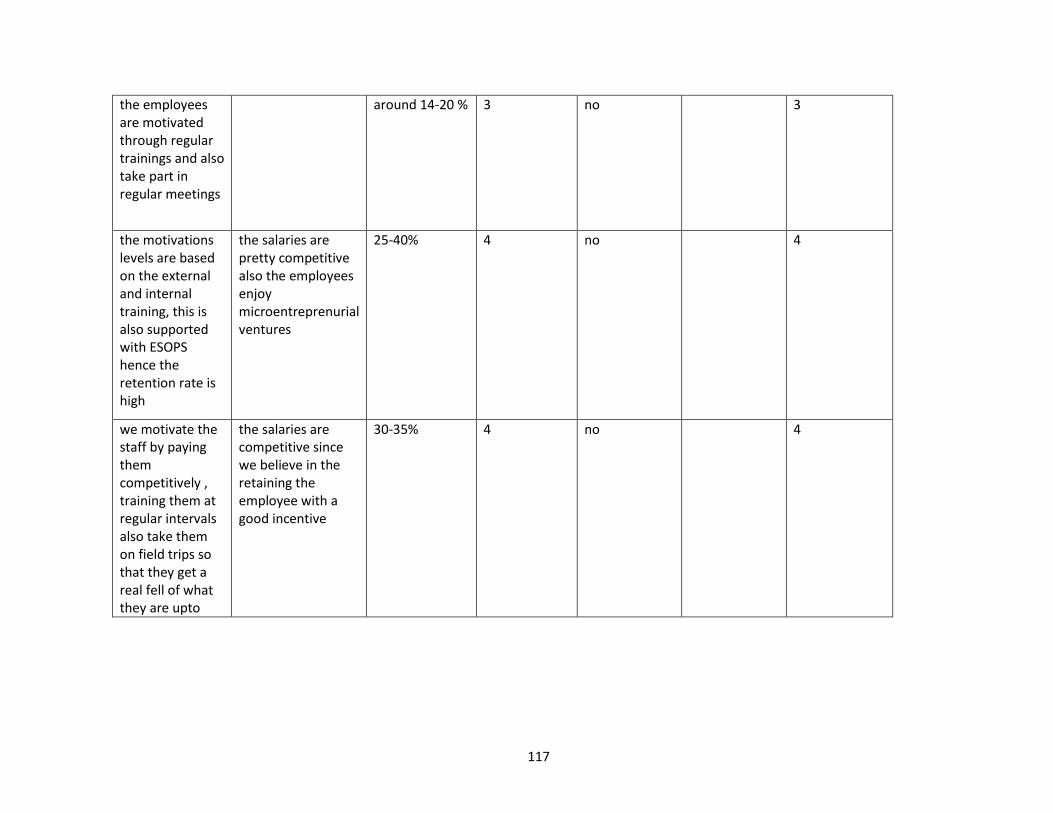
117
the employees are motivated through regular trainings and also take part in regular meetings
around 14-20 % 3 no 3
the motivations levels are based on the external and internal training, this is also supported with ESOPS hence the retention rate is high
the salaries are pretty competitive also the employees enjoy microentreprenurial ventures
25-40% 4 no 4
we motivate the staff by paying them competitively , training them at regular intervals also take them on field trips so that they get a real fell of what they are upto
the salaries are competitive since we believe in the retaining the employee with a good incentive
30-35% 4 no 4
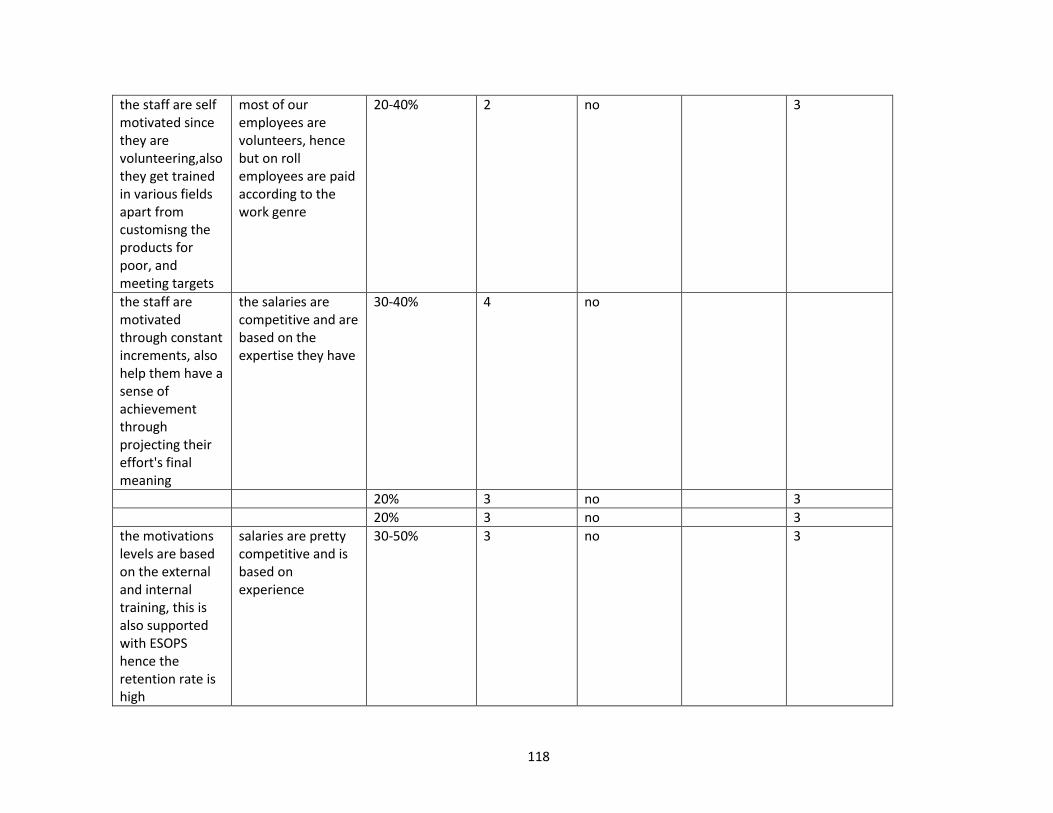
118
the staff are self motivated since they are volunteering,also they get trained in various fields apart from customisng the products for poor, and meeting targets
most of our employees are volunteers, hence but on roll employees are paid according to the work genre
20-40% 2 no 3
the staff are motivated through constant increments, also help them have a sense of achievement through projecting their effort's final meaning
the salaries are competitive and are based on the expertise they have
30-40% 4 no
20% 3 no 3
20% 3 no 3
the motivations levels are based on the external and internal training, this is also supported with ESOPS hence the retention rate is high
salaries are pretty competitive and is based on experience
30-50% 3 no 3
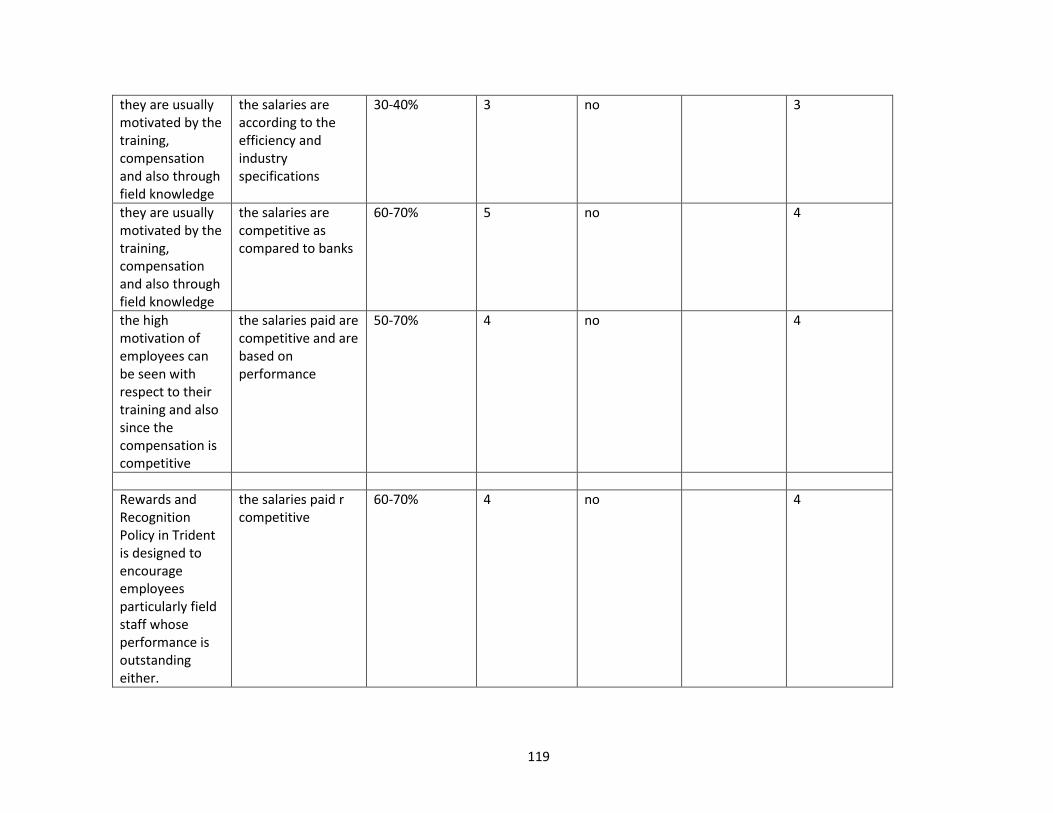
119
they are usually motivated by the training, compensation and also through field knowledge
the salaries are according to the efficiency and industry specifications
30-40% 3 no 3
they are usually motivated by the training, compensation and also through field knowledge
the salaries are competitive as compared to banks
60-70% 5 no 4
the high motivation of employees can be seen with respect to their training and also since the compensation is competitive
the salaries paid are competitive and are based on performance
50-70% 4 no 4
Rewards and Recognition Policy in Trident is designed to encourage employees particularly field staff whose performance is outstanding either.
the salaries paid r competitive
60-70% 4 no 4
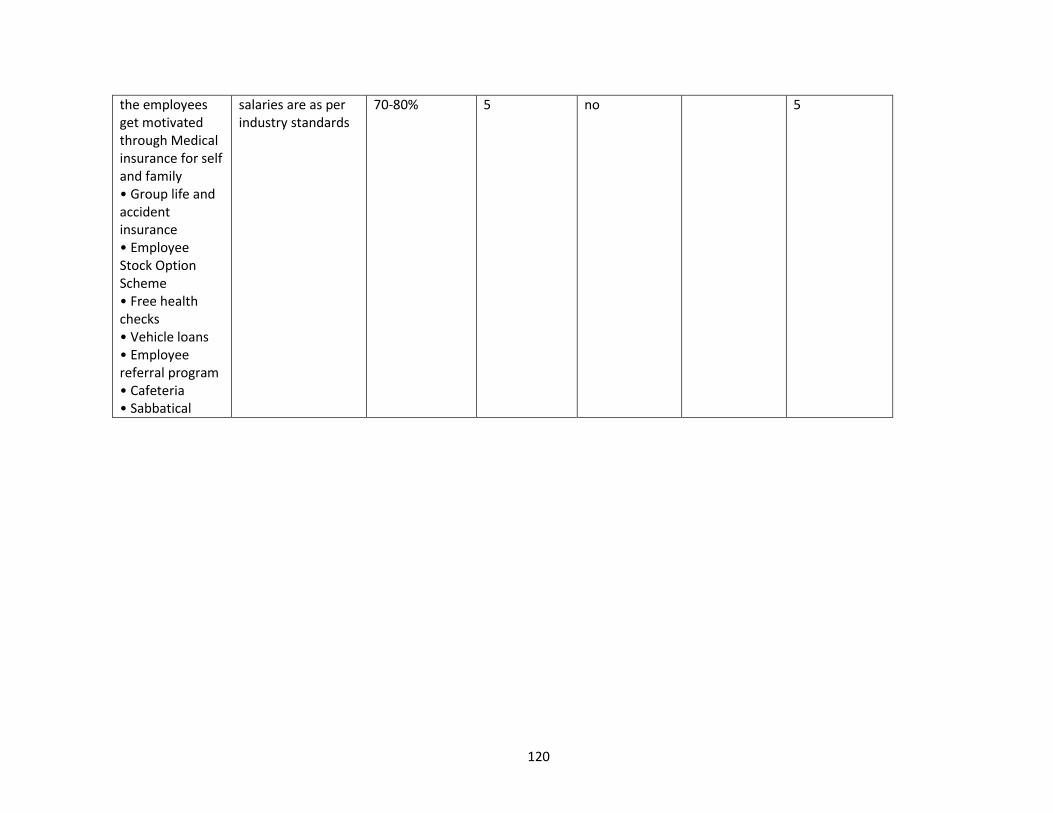
120
the employees get motivated through Medical insurance for self and family • Group life and accident insurance • Employee Stock Option Scheme • Free health checks • Vehicle loans • Employee referral program • Cafeteria • Sabbatical
salaries are as per industry standards
70-80% 5 no 5
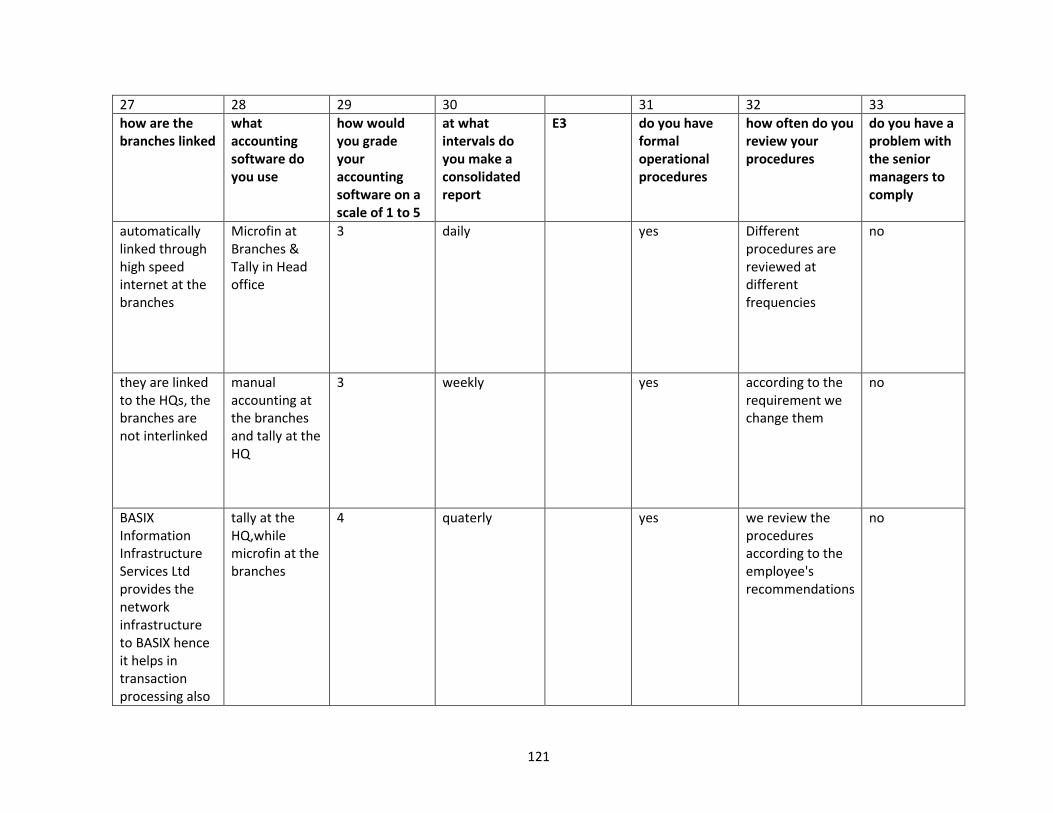
121
27 28 29 30 31 32 33
how are the branches linked
what accounting software do you use
how would you grade your accounting software on a scale of 1 to 5
at what intervals do you make a consolidated report
E3 do you have formal operational procedures
how often do you review your procedures
do you have a problem with the senior managers to comply
automatically linked through high speed internet at the branches
Microfin at Branches & Tally in Head office
3 daily yes Different procedures are reviewed at different frequencies
no
they are linked to the HQs, the branches are not interlinked
manual accounting at the branches and tally at the HQ
3 weekly yes according to the requirement we change them
no
BASIX Information Infrastructure Services Ltd provides the network infrastructure to BASIX hence it helps in transaction processing also
tally at the HQ,while microfin at the branches
4 quaterly yes we review the procedures according to the employee's recommendations
no
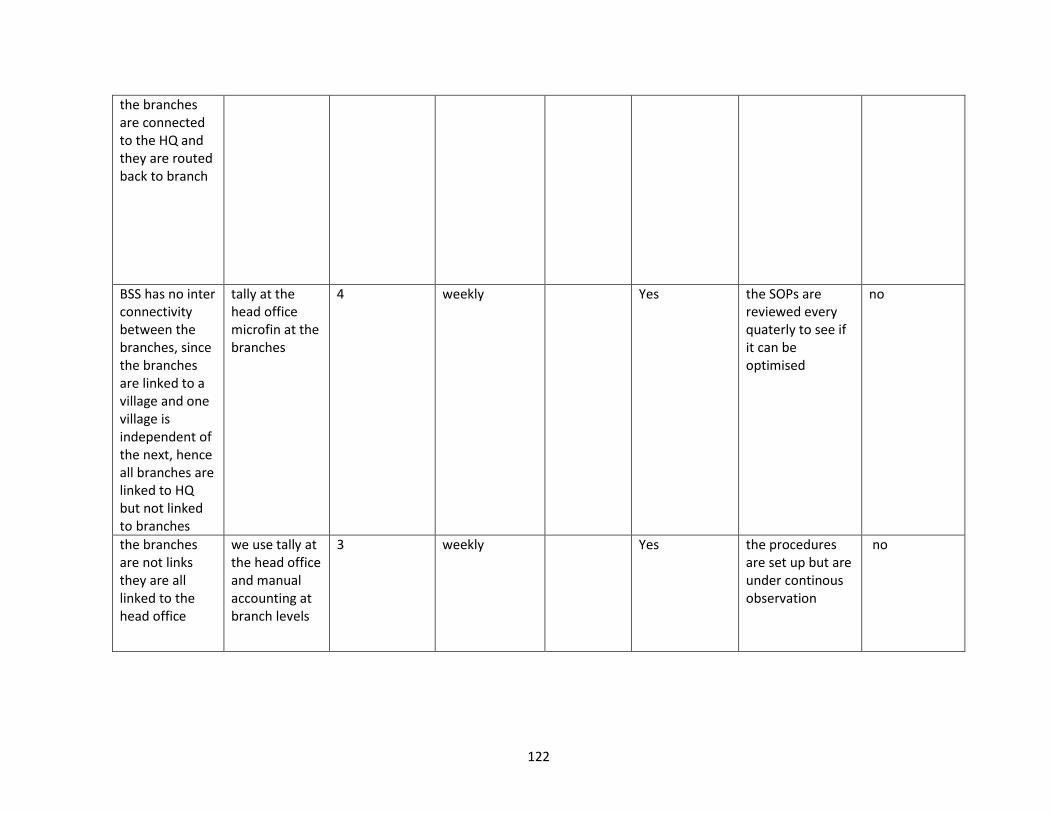
122
the branches are connected to the HQ and they are routed back to branch
BSS has no inter connectivity between the branches, since the branches are linked to a village and one village is independent of the next, hence all branches are linked to HQ but not linked to branches
tally at the head office microfin at the branches
4 weekly Yes the SOPs are reviewed every quaterly to see if it can be optimised
no
the branches are not links they are all linked to the head office
we use tally at the head office and manual accounting at branch levels
3 weekly Yes the procedures are set up but are under continous observation
no
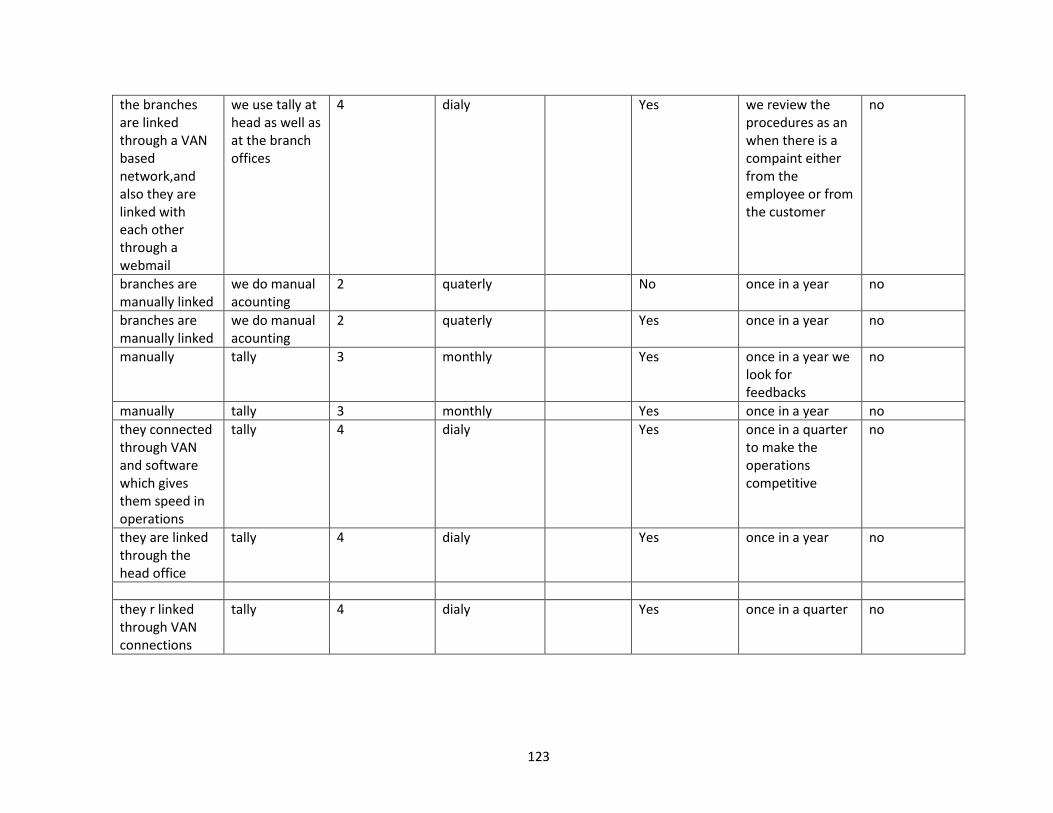
123
the branches are linked through a VAN based network,and also they are linked with each other through a webmail
we use tally at head as well as at the branch offices
4 dialy Yes we review the procedures as an when there is a compaint either from the employee or from the customer
no
branches are manually linked
we do manual acounting
2 quaterly No once in a year no
branches are manually linked
we do manual acounting
2 quaterly Yes once in a year no
manually tally 3 monthly Yes once in a year we look for feedbacks
no
manually tally 3 monthly Yes once in a year no
they connected through VAN and software which gives them speed in operations
tally 4 dialy Yes once in a quarter to make the operations competitive
no
they are linked through the head office
tally 4 dialy Yes once in a year no
they r linked through VAN connections
tally 4 dialy Yes once in a quarter no

124
they are linked through microfin
tally 4 dialy Yes every quarter no
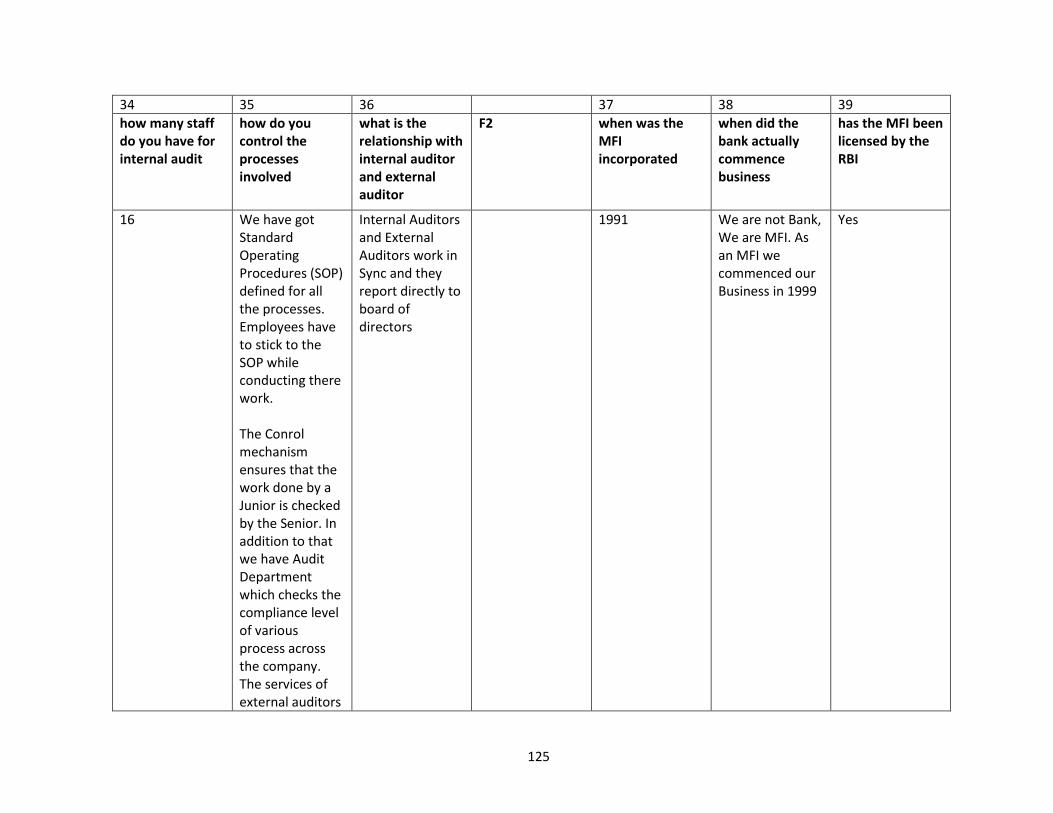
125
34 35 36 37 38 39
how many staff do you have for internal audit
how do you control the processes involved
what is the relationship with internal auditor and external auditor
F2 when was the MFI incorporated
when did the bank actually commence business
has the MFI been licensed by the RBI
16 We have got Standard Operating Procedures (SOP) defined for all the processes. Employees have to stick to the SOP while conducting there work. The Conrol mechanism ensures that the work done by a Junior is checked by the Senior. In addition to that we have Audit Department which checks the compliance level of various process across the company. The services of external auditors
Internal Auditors and External Auditors work in Sync and they report directly to board of directors
1991 We are not Bank, We are MFI. As an MFI we commenced our Business in 1999
Yes
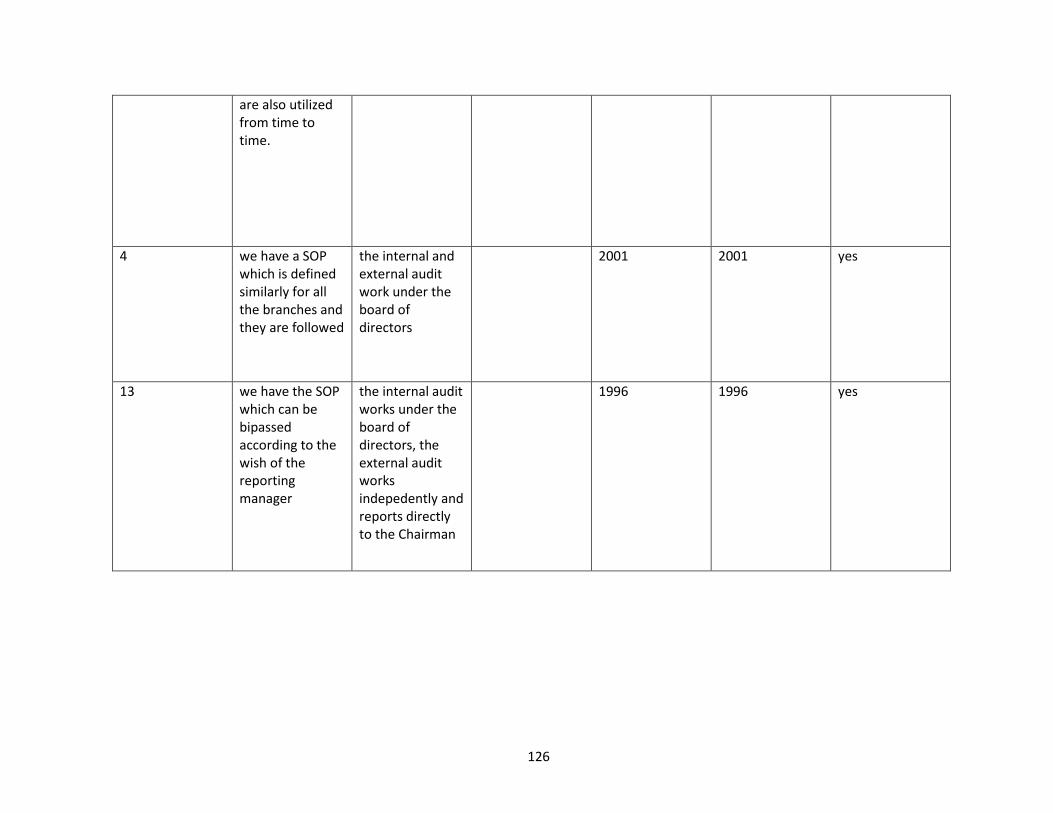
126
are also utilized from time to time.
4 we have a SOP which is defined similarly for all the branches and they are followed
the internal and external audit work under the board of directors
2001 2001 yes
13 we have the SOP which can be bipassed according to the wish of the reporting manager
the internal audit works under the board of directors, the external audit works indepedently and reports directly to the Chairman
1996 1996 yes
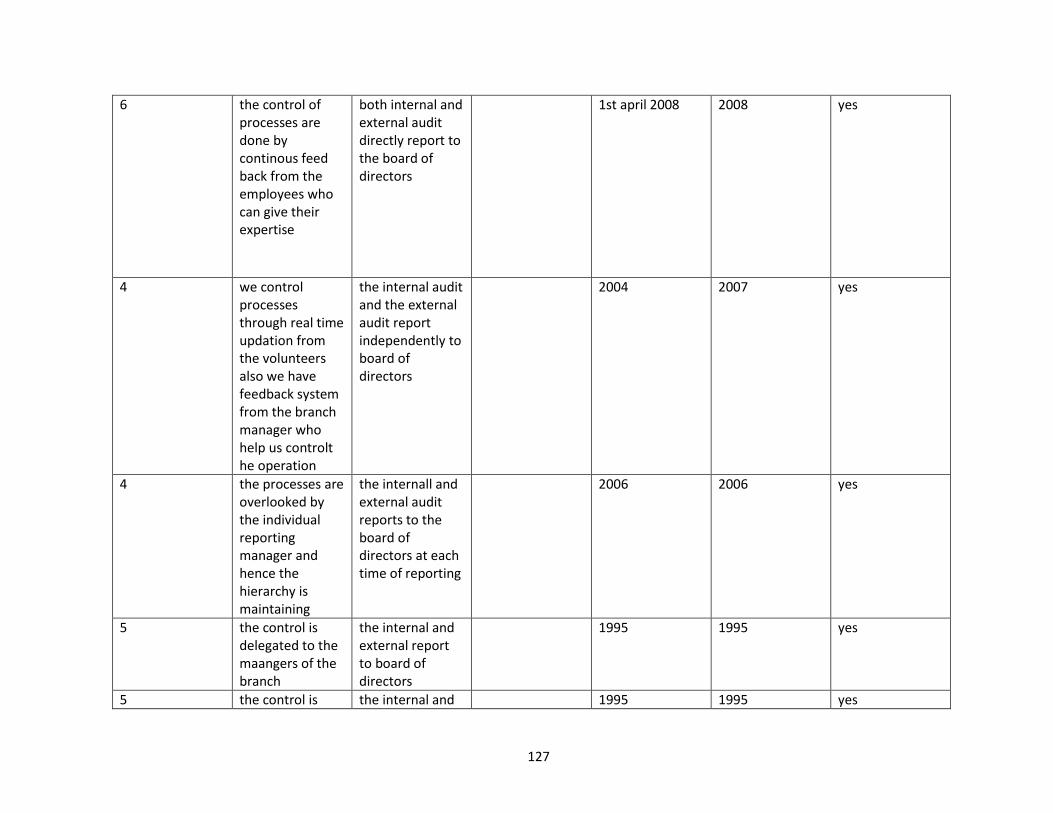
127
6 the control of processes are done by continous feed back from the employees who can give their expertise
both internal and external audit directly report to the board of directors
1st april 2008 2008 yes
4 we control processes through real time updation from the volunteers also we have feedback system from the branch manager who help us controlt he operation
the internal audit and the external audit report independently to board of directors
2004 2007 yes
4 the processes are overlooked by the individual reporting manager and hence the hierarchy is maintaining
the internall and external audit reports to the board of directors at each time of reporting
2006 2006 yes
5 the control is delegated to the maangers of the branch
the internal and external report to board of directors
1995 1995 yes
5 the control is the internal and 1995 1995 yes
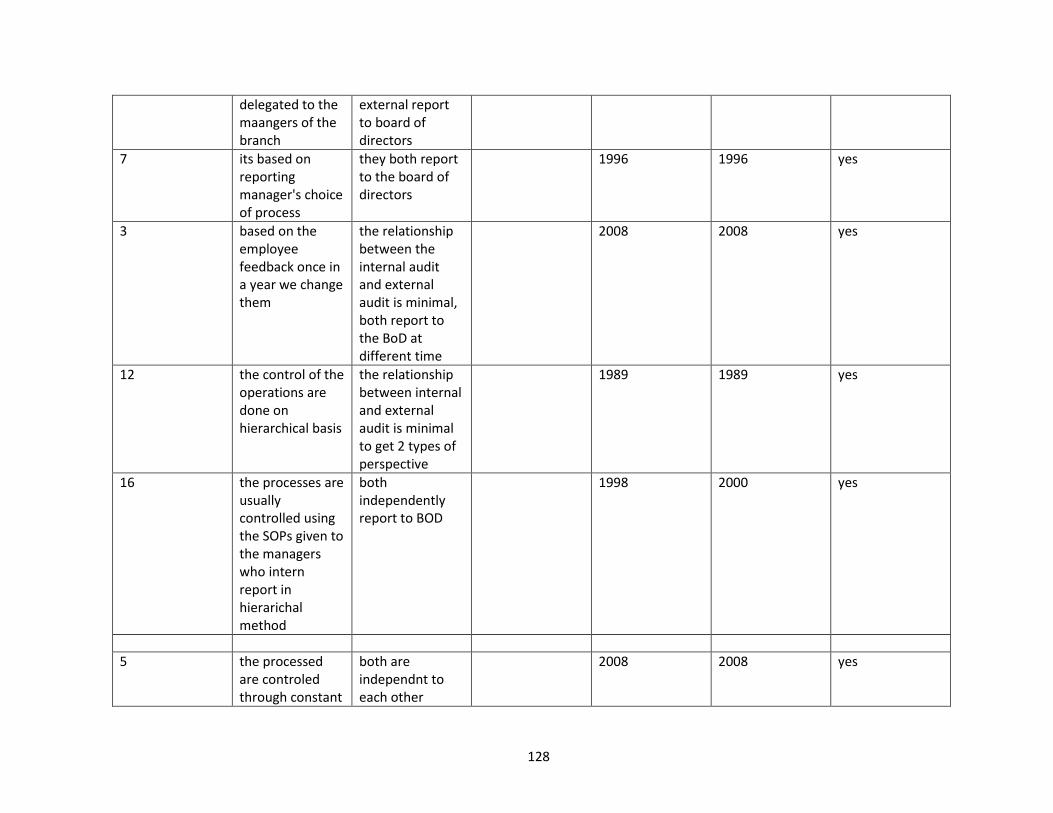
128
delegated to the maangers of the branch
external report to board of directors
7 its based on reporting manager's choice of process
they both report to the board of directors
1996 1996 yes
3 based on the employee feedback once in a year we change them
the relationship between the internal audit and external audit is minimal, both report to the BoD at different time
2008 2008 yes
12 the control of the operations are done on hierarchical basis
the relationship between internal and external audit is minimal to get 2 types of perspective
1989 1989 yes
16 the processes are usually controlled using the SOPs given to the managers who intern report in hierarichal method
both independently report to BOD
1998 2000 yes
5 the processed
are controled through constant
both are independnt to each other
2008 2008 yes
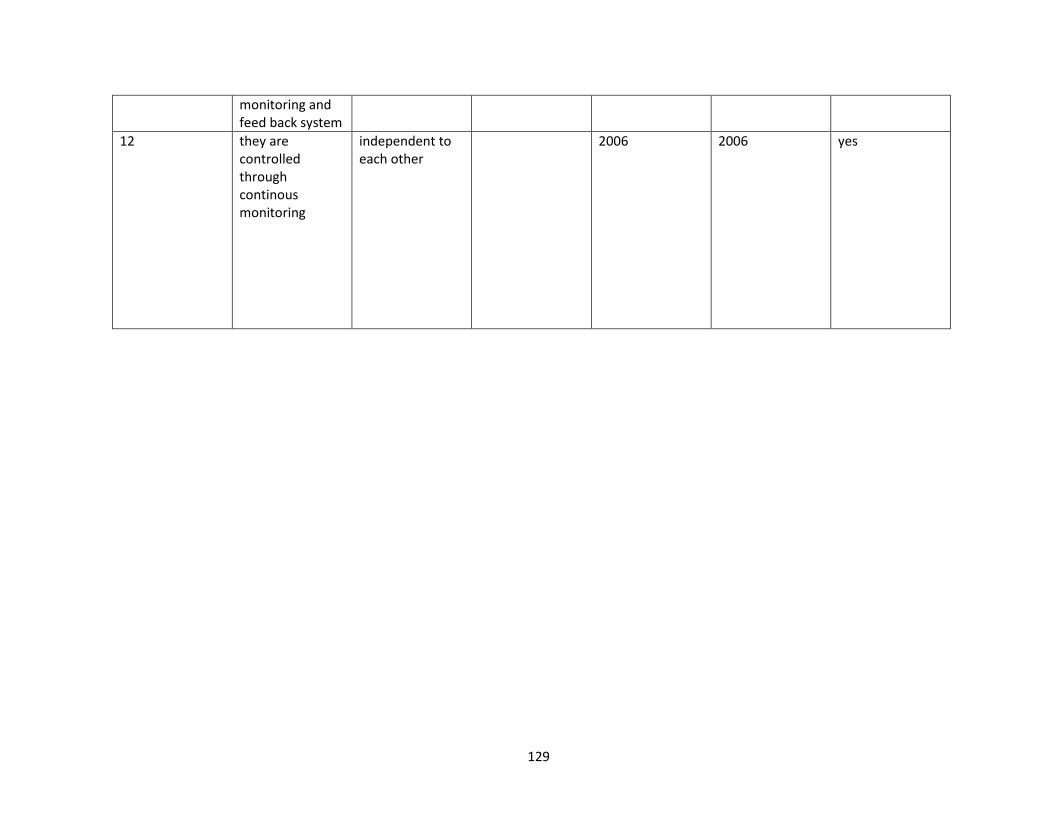
129
monitoring and feed back system
12 they are controlled through continous monitoring
independent to each other
2006 2006 yes
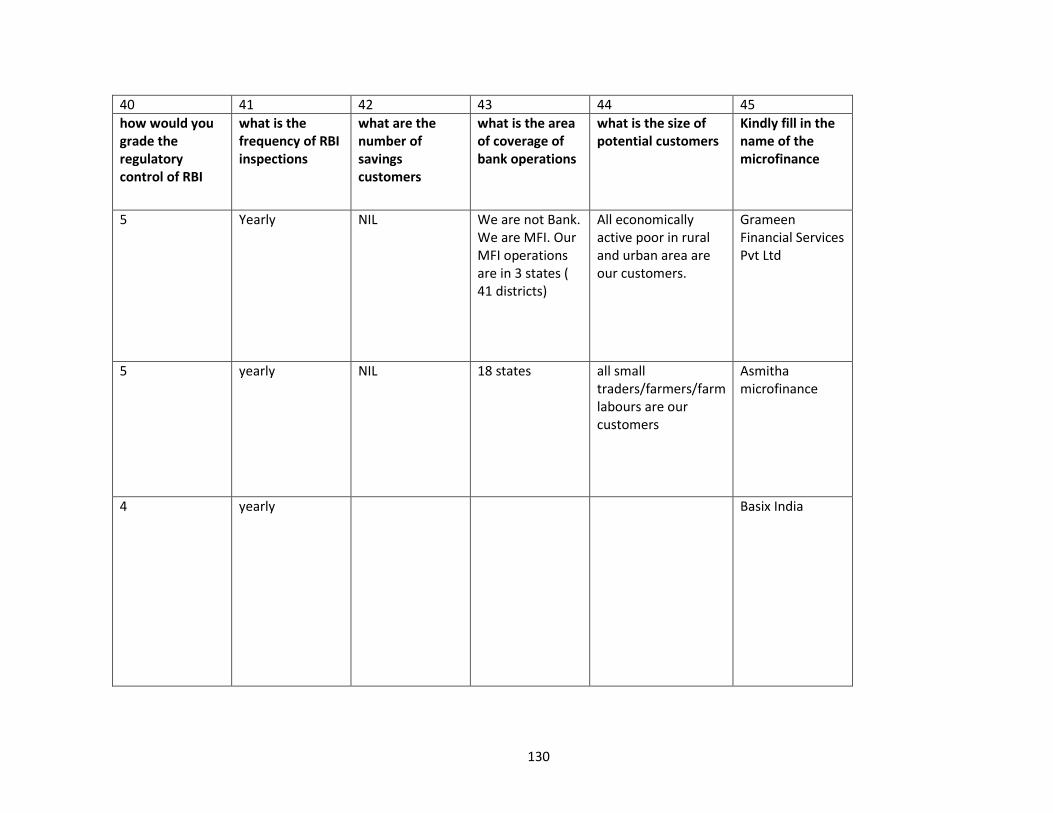
130
40 41 42 43 44 45
how would you grade the regulatory control of RBI
what is the frequency of RBI inspections
what are the number of savings customers
what is the area of coverage of bank operations
what is the size of potential customers
Kindly fill in the name of the microfinance
5 Yearly NIL We are not Bank. We are MFI. Our MFI operations are in 3 states ( 41 districts)
All economically active poor in rural and urban area are our customers.
Grameen Financial Services Pvt Ltd
5 yearly NIL 18 states all small traders/farmers/farm labours are our customers
Asmitha microfinance
4 yearly Basix India
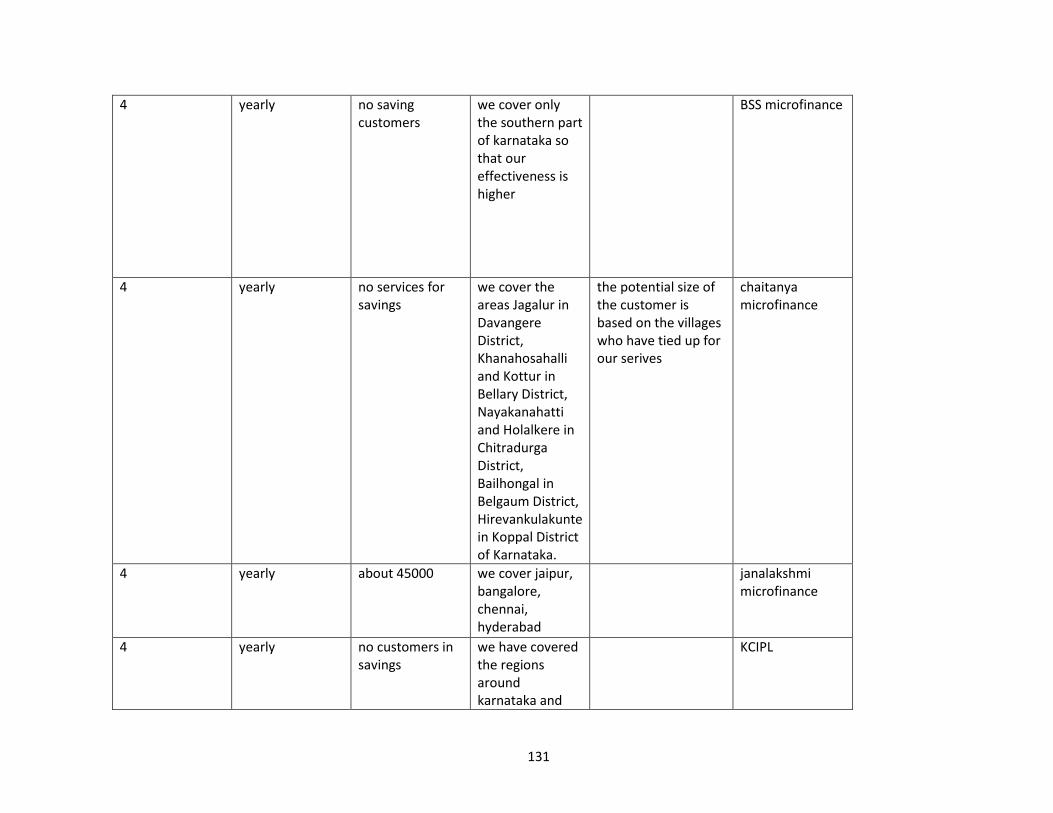
131
4 yearly no saving customers
we cover only the southern part of karnataka so that our effectiveness is higher
BSS microfinance
4 yearly no services for savings
we cover the areas Jagalur in Davangere District, Khanahosahalli and Kottur in Bellary District, Nayakanahatti and Holalkere in Chitradurga District, Bailhongal in Belgaum District, Hirevankulakunte in Koppal District of Karnataka.
the potential size of the customer is based on the villages who have tied up for our serives
chaitanya microfinance
4 yearly about 45000 we cover jaipur, bangalore, chennai, hyderabad
janalakshmi microfinance
4 yearly no customers in savings
we have covered the regions around karnataka and
KCIPL
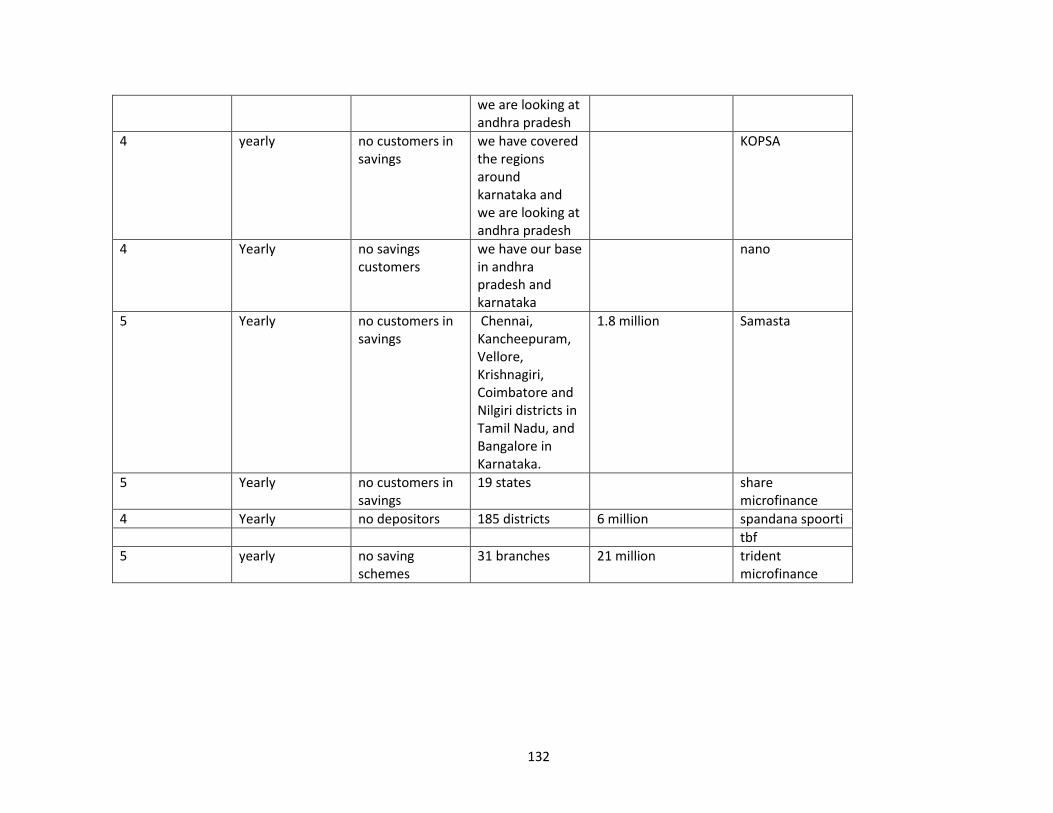
132
we are looking at andhra pradesh
4 yearly no customers in savings
we have covered the regions around karnataka and we are looking at andhra pradesh
KOPSA
4 Yearly no savings customers
we have our base in andhra pradesh and karnataka
nano
5 Yearly no customers in savings
Chennai, Kancheepuram, Vellore, Krishnagiri, Coimbatore and Nilgiri districts in Tamil Nadu, and Bangalore in Karnataka.
1.8 million Samasta
5 Yearly no customers in savings
19 states share microfinance
4 Yearly no depositors 185 districts 6 million spandana spoorti
tbf
5 yearly no saving schemes
31 branches 21 million trident microfinance
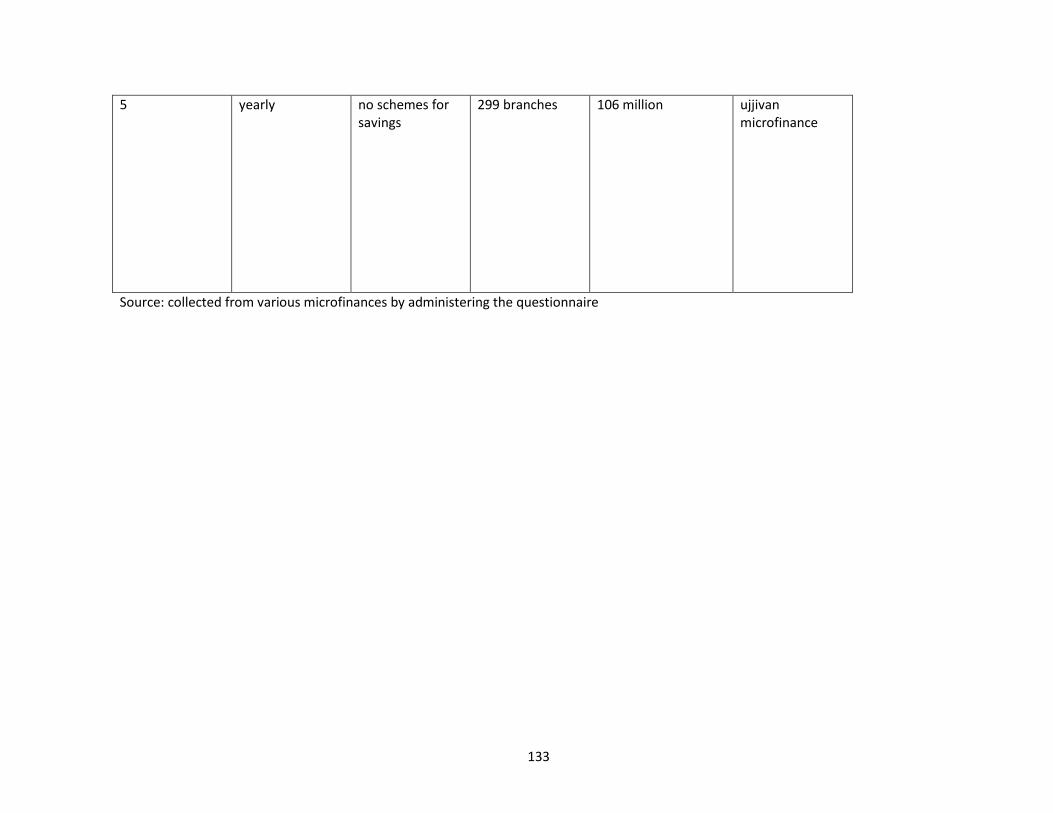
133
5 yearly no schemes for savings
299 branches 106 million ujjivan microfinance
Source: collected from various microfinances by administering the questionnaire
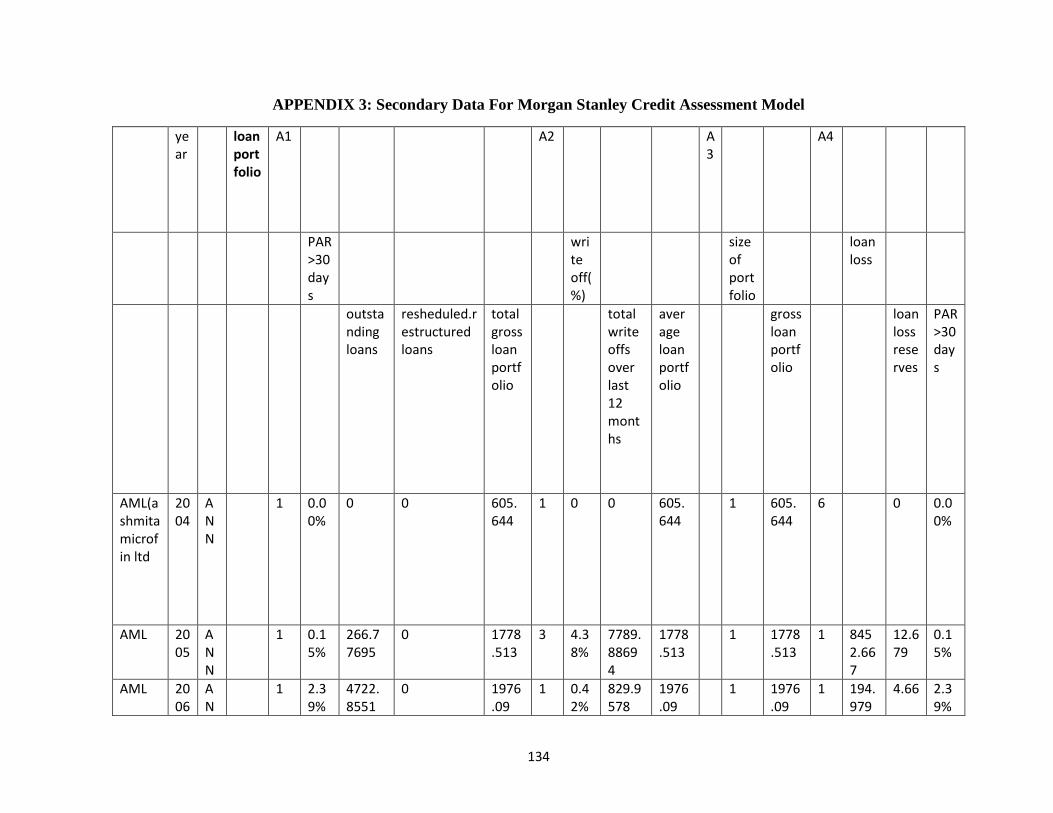
134
APPENDIX 3: Secondary Data For Morgan Stanley Credit Assessment Model
year
loan portfolio
A1 A2 A3
A4
PAR>30 days
write off(%)
size of portfolio
loan loss
outstanding loans
resheduled.restructured loans
total gross loan portfolio
total write offs over last 12 months
average loan portfolio
gross loan portfolio
loan loss reserves
PAR>30 days
AML(ashmita microfin ltd
2004
ANN
1 0.00%
0 0 605.644
1 0 0 605.644
1 605.644
6 0 0.00%
AML 2005
ANN
1 0.15%
266.77695
0 1778.513
3 4.38%
7789.88694
1778.513
1 1778.513
1 8452.667
12.679
0.15%
AML 2006
AN
1 2.39%
4722.8551
0 1976.09
1 0.42%
829.9578
1976.09
1 1976.09
1 194.979
4.66 2.39%
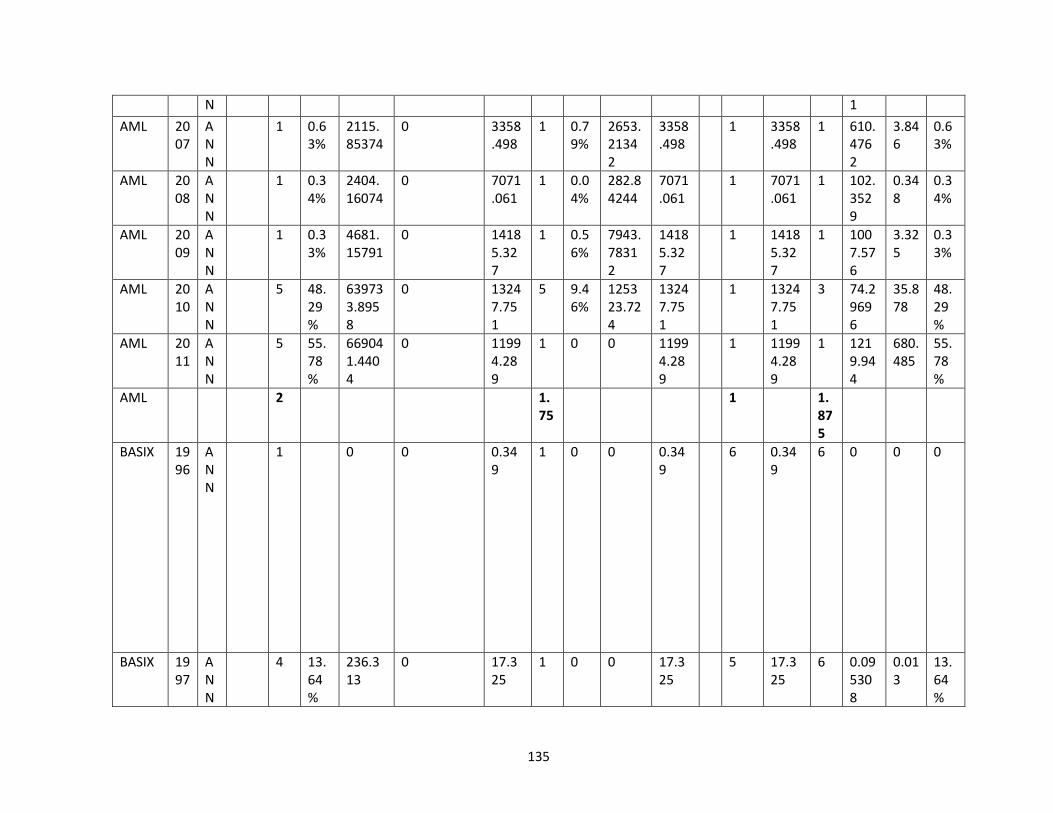
135
N 1
AML 2007
ANN
1 0.63%
2115.85374
0 3358.498
1 0.79%
2653.21342
3358.498
1 3358.498
1 610.4762
3.846
0.63%
AML 2008
ANN
1 0.34%
2404.16074
0 7071.061
1 0.04%
282.84244
7071.061
1 7071.061
1 102.3529
0.348
0.34%
AML 2009
ANN
1 0.33%
4681.15791
0 14185.327
1 0.56%
7943.78312
14185.327
1 14185.327
1 1007.576
3.325
0.33%
AML 2010
ANN
5 48.29%
639733.8958
0 13247.751
5 9.46%
125323.724
13247.751
1 13247.751
3 74.29696
35.878
48.29%
AML 2011
ANN
5 55.78%
669041.4404
0 11994.289
1 0 0 11994.289
1 11994.289
1 1219.944
680.485
55.78%
AML 2 1.75
1 1.875
BASIX 1996
ANN
1 0 0 0.349
1 0 0 0.349
6 0.349
6 0 0 0
BASIX 1997
ANN
4 13.64%
236.313
0 17.325
1 0 0 17.325
5 17.325
6 0.095308
0.013
13.64%

136
BASIX 1998
ANN
1 0 0 58.646
1 0 0 58.646
4 58.646
6 0 0.754
0
BASIX 1999
ANN
5 19.34%
2152.69672
0 111.308
1 0.49%
54.54092
111.308
3 111.308
6 8.159255
1.578
19.34%
BASIX 2000
ANN
5 15.56%
2382.01816
0 153.086
1 1.65%
252.5919
153.086
3 153.086
6 16.37532
2.548
15.56%
BASIX 2001
ANN
4 13.00%
2890.225
0 222.325
2 2.46%
546.9195
222.325
3 222.325
6 14.66923
1.907
13.00%
BASIX 2002
ANN
3 7.97%
2446.36759
0 306.947
2 3.30%
1012.9251
306.947
2 306.947
6 36.90088
2.941
7.97%
BASIX 2003
ANN
2 4.80%
1846.5072
0 384.689
2 2.40%
923.2536
384.689
1 384.689
5 57.6875
2.769
4.80%
BASIX 2004
ANN
1 1.79%
1017.90319
0 569 1 1.58%
898.48438
569 1 569 1 473.4078
8.474
1.79%
BASIX 2005
ANN
1 2.11%
2115.72232
0 1002.712
1 1.09%
1092.95608
1002.712
1 1002.712
1 774.1706
16.335
2.11%
BASIX 2006
ANN
1 1.37%
1909.93755
0 1394.115
1 0.73%
1017.70395
1394.115
1 1394.115
1 1022.044
14.002
1.37%
BASIX 2007
ANN
1 1.25%
2479.225
0 1983.38
1 0.67%
1328.8646
1983.38
1 1983.38
1 276.32
3.454
1.25%
BASIX 2008
ANN
1 2.51%
11599.30487
0 4621.237
1 0.00%
0 4621.237
1 4621.237
1 1335.618
33.524
2.51%
BASIX 20 A 5 37. 29304 0 7756 1 0.4 3490. 7756 1 7756 4 62.7 23.7 37.
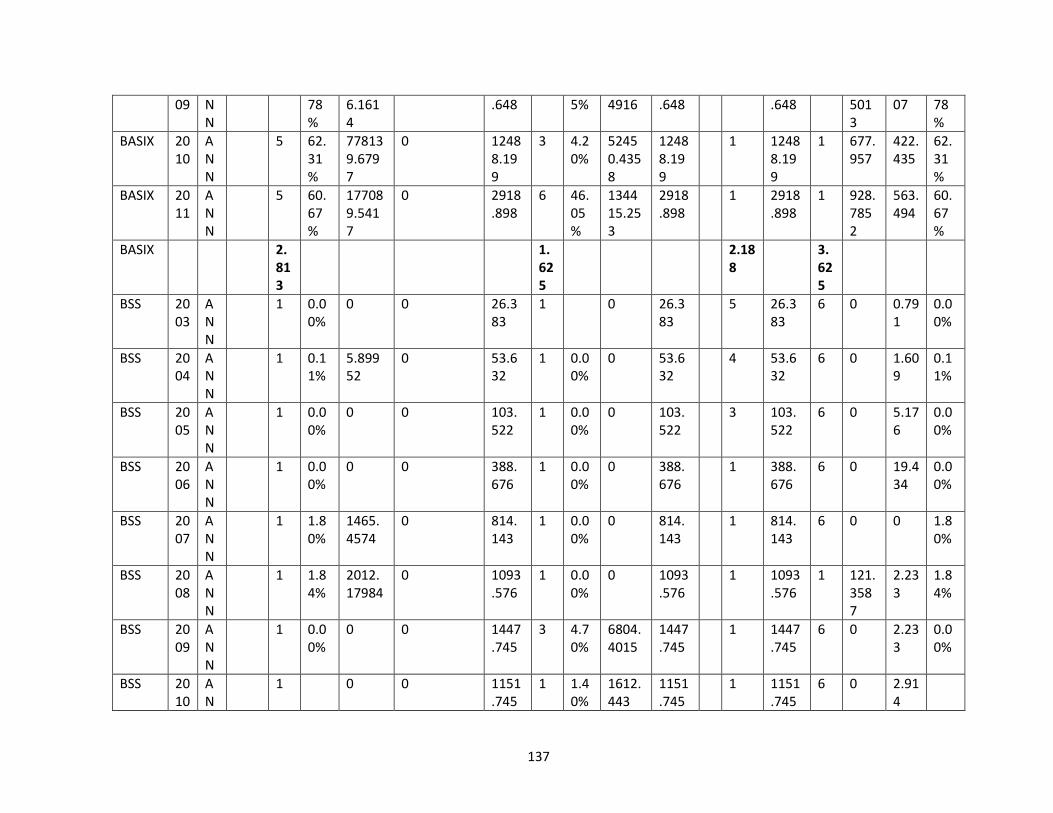
137
09 NN
78%
6.1614
.648 5% 4916 .648 .648 5013
07 78%
BASIX 2010
ANN
5 62.31%
778139.6797
0 12488.199
3 4.20%
52450.4358
12488.199
1 12488.199
1 677.957
422.435
62.31%
BASIX 2011
ANN
5 60.67%
177089.5417
0 2918.898
6 46.05%
134415.253
2918.898
1 2918.898
1 928.7852
563.494
60.67%
BASIX 2.813
1.625
2.188
3.625
BSS 2003
ANN
1 0.00%
0 0 26.383
1 0 26.383
5 26.383
6 0 0.791
0.00%
BSS 2004
ANN
1 0.11%
5.89952
0 53.632
1 0.00%
0 53.632
4 53.632
6 0 1.609
0.11%
BSS 2005
ANN
1 0.00%
0 0 103.522
1 0.00%
0 103.522
3 103.522
6 0 5.176
0.00%
BSS 2006
ANN
1 0.00%
0 0 388.676
1 0.00%
0 388.676
1 388.676
6 0 19.434
0.00%
BSS 2007
ANN
1 1.80%
1465.4574
0 814.143
1 0.00%
0 814.143
1 814.143
6 0 0 1.80%
BSS 2008
ANN
1 1.84%
2012.17984
0 1093.576
1 0.00%
0 1093.576
1 1093.576
1 121.3587
2.233
1.84%
BSS 2009
ANN
1 0.00%
0 0 1447.745
3 4.70%
6804.4015
1447.745
1 1447.745
6 0 2.233
0.00%
BSS 2010
AN
1 0 0 1151.745
1 1.40%
1612.443
1151.745
1 1151.745
6 0 2.914
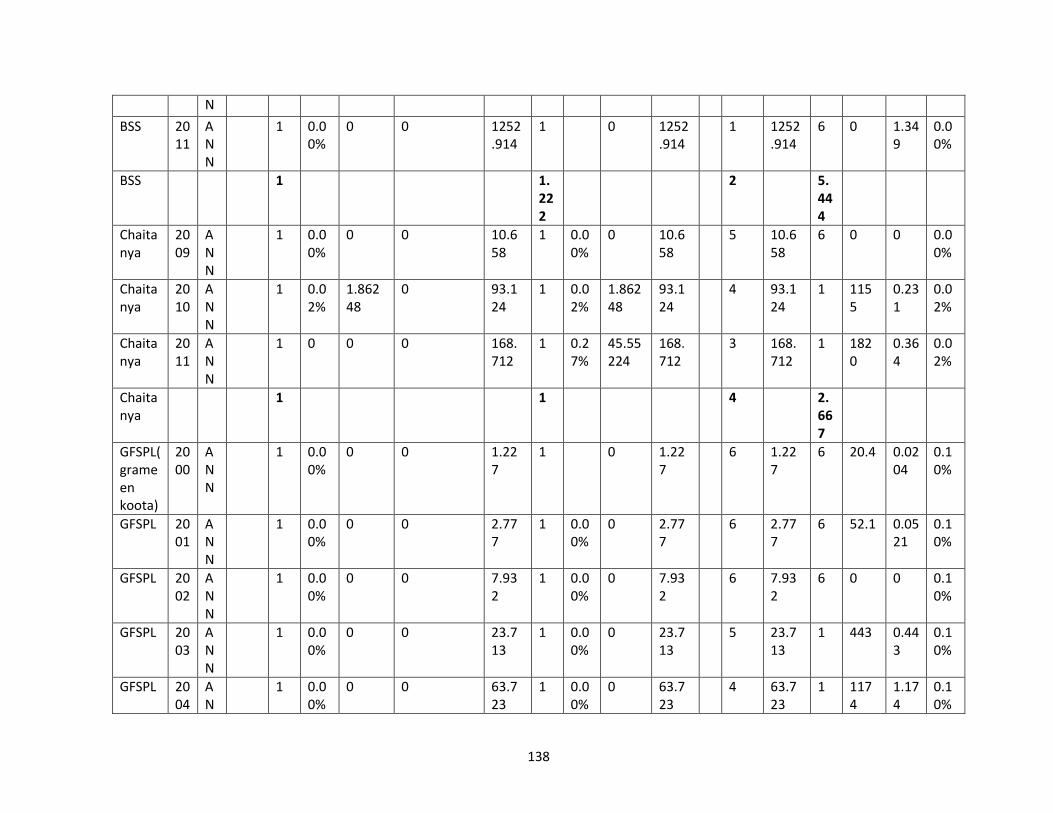
138
N
BSS 2011
ANN
1 0.00%
0 0 1252.914
1 0 1252.914
1 1252.914
6 0 1.349
0.00%
BSS 1 1.222
2 5.444
Chaitanya
2009
ANN
1 0.00%
0 0 10.658
1 0.00%
0 10.658
5 10.658
6 0 0 0.00%
Chaitanya
2010
ANN
1 0.02%
1.86248
0 93.124
1 0.02%
1.86248
93.124
4 93.124
1 1155
0.231
0.02%
Chaitanya
2011
ANN
1 0 0 0 168.712
1 0.27%
45.55224
168.712
3 168.712
1 1820
0.364
0.02%
Chaitanya
1 1 4 2.667
GFSPL( grameen koota)
2000
ANN
1 0.00%
0 0 1.227
1 0 1.227
6 1.227
6 20.4 0.0204
0.10%
GFSPL 2001
ANN
1 0.00%
0 0 2.777
1 0.00%
0 2.777
6 2.777
6 52.1 0.0521
0.10%
GFSPL 2002
ANN
1 0.00%
0 0 7.932
1 0.00%
0 7.932
6 7.932
6 0 0 0.10%
GFSPL 2003
ANN
1 0.00%
0 0 23.713
1 0.00%
0 23.713
5 23.713
1 443 0.443
0.10%
GFSPL 2004
AN
1 0.00%
0 0 63.723
1 0.00%
0 63.723
4 63.723
1 1174
1.174
0.10%

139
N
GFSPL 2005
ANN
1 0.00%
0 0 221.663
1 0.00%
0 221.663
3 221.663
1 4433
4.433
0.10%
GFSPL 2006
ANN
1 0.00%
0 0 459.791
1 0.00%
0 459.791
1 459.791
1 9195
9.195
0.10%
GFSPL 2007
ANN
1 0.13%
107.43993
0 826.461
1 0.00%
0 826.461
1 826.461
6 0 0 0.13%
GFSPL 2008
ANN
1 1.47%
2665.18791
0 1813.053
1 0.33%
598.30749
1813.053
1 1813.053
6 0 0 1.47%
GFSPL 2009
ANN
1 1.42%
4688.43672
0 3301.716
1 0.62%
2047.06392
3301.716
1 3301.716
1 1995.563
28.337
1.42%
GFSPL 2010
ANN
1 1.22%
3056.16466
0 2505.053
1 1.51%
3782.63003
2505.053
1 2505.053
1 2091.148
25.512
1.22%
GFSPL 2011
ANN
1 1.40%
5337.6736
0 3812.624
1 0.00%
0 3812.624
1 3812.624
1 787.8571
11.03
1.40%
GFSPL 1 1 3 3.083
Janalakshmi Financial Services Pvt. Ltd.
2004
ANN
3 6.31%
292.80924
0 46.404
1 0 46.404
5 46.404
6 0 0 6.31%
Janalakshmi
2005
AN
3 6.49%
567.99831
0 87.519
1 0.00%
0 87.519
4 87.519
6 0 0 6.49%
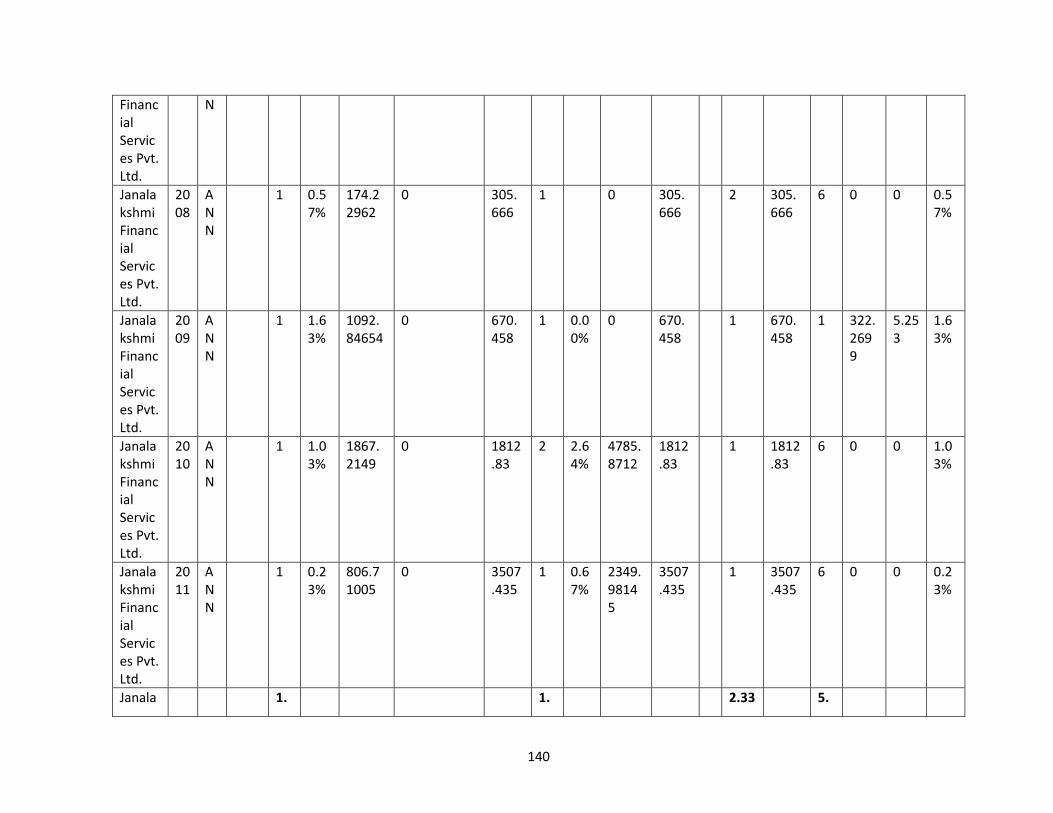
140
Financial Services Pvt. Ltd.
N
Janalakshmi Financial Services Pvt. Ltd.
2008
ANN
1 0.57%
174.22962
0 305.666
1 0 305.666
2 305.666
6 0 0 0.57%
Janalakshmi Financial Services Pvt. Ltd.
2009
ANN
1 1.63%
1092.84654
0 670.458
1 0.00%
0 670.458
1 670.458
1 322.2699
5.253
1.63%
Janalakshmi Financial Services Pvt. Ltd.
2010
ANN
1 1.03%
1867.2149
0 1812.83
2 2.64%
4785.8712
1812.83
1 1812.83
6 0 0 1.03%
Janalakshmi Financial Services Pvt. Ltd.
2011
ANN
1 0.23%
806.71005
0 3507.435
1 0.67%
2349.98145
3507.435
1 3507.435
6 0 0 0.23%
Janala 1. 1. 2.33 5.
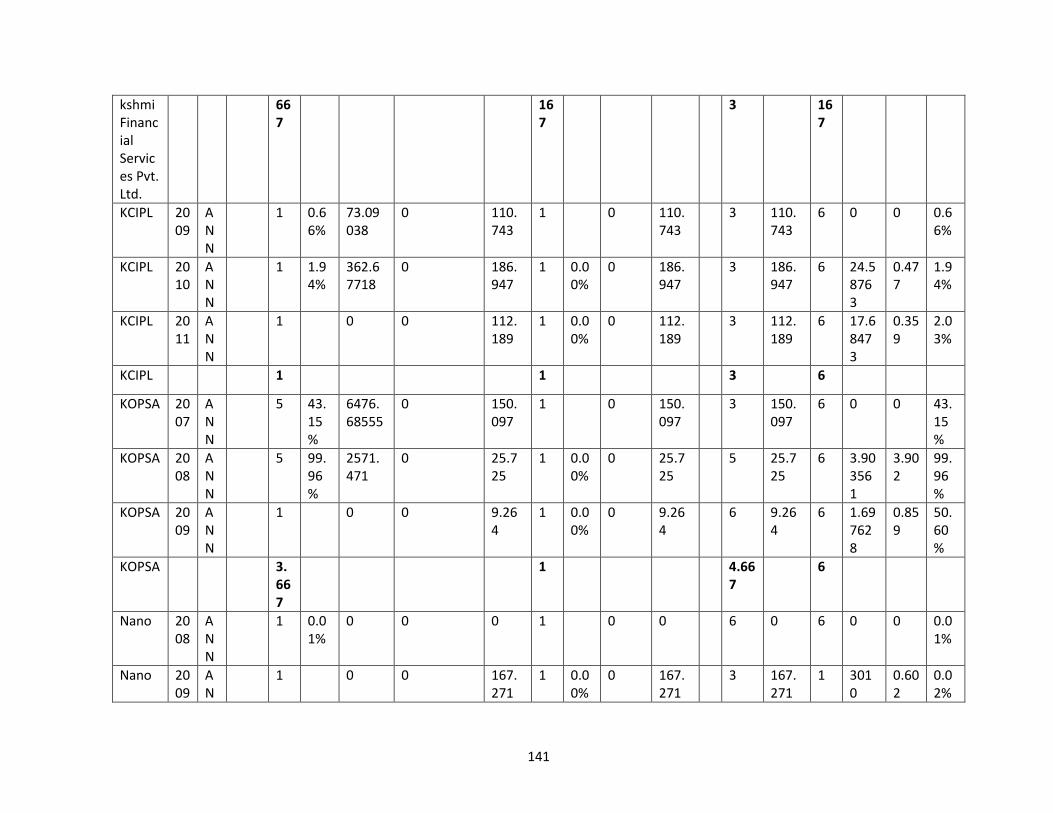
141
kshmi Financial Services Pvt. Ltd.
667
167
3 167
KCIPL 2009
ANN
1 0.66%
73.09038
0 110.743
1 0 110.743
3 110.743
6 0 0 0.66%
KCIPL 2010
ANN
1 1.94%
362.67718
0 186.947
1 0.00%
0 186.947
3 186.947
6 24.58763
0.477
1.94%
KCIPL 2011
ANN
1 0 0 112.189
1 0.00%
0 112.189
3 112.189
6 17.68473
0.359
2.03%
KCIPL 1 1 3 6
KOPSA 2007
ANN
5 43.15%
6476.68555
0 150.097
1 0 150.097
3 150.097
6 0 0 43.15%
KOPSA 2008
ANN
5 99.96%
2571.471
0 25.725
1 0.00%
0 25.725
5 25.725
6 3.903561
3.902
99.96%
KOPSA 2009
ANN
1 0 0 9.264
1 0.00%
0 9.264
6 9.264
6 1.697628
0.859
50.60%
KOPSA 3.667
1 4.667
6
Nano 2008
ANN
1 0.01%
0 0 0 1 0 0 6 0 6 0 0 0.01%
Nano 2009
AN
1 0 0 167.271
1 0.00%
0 167.271
3 167.271
1 3010
0.602
0.02%
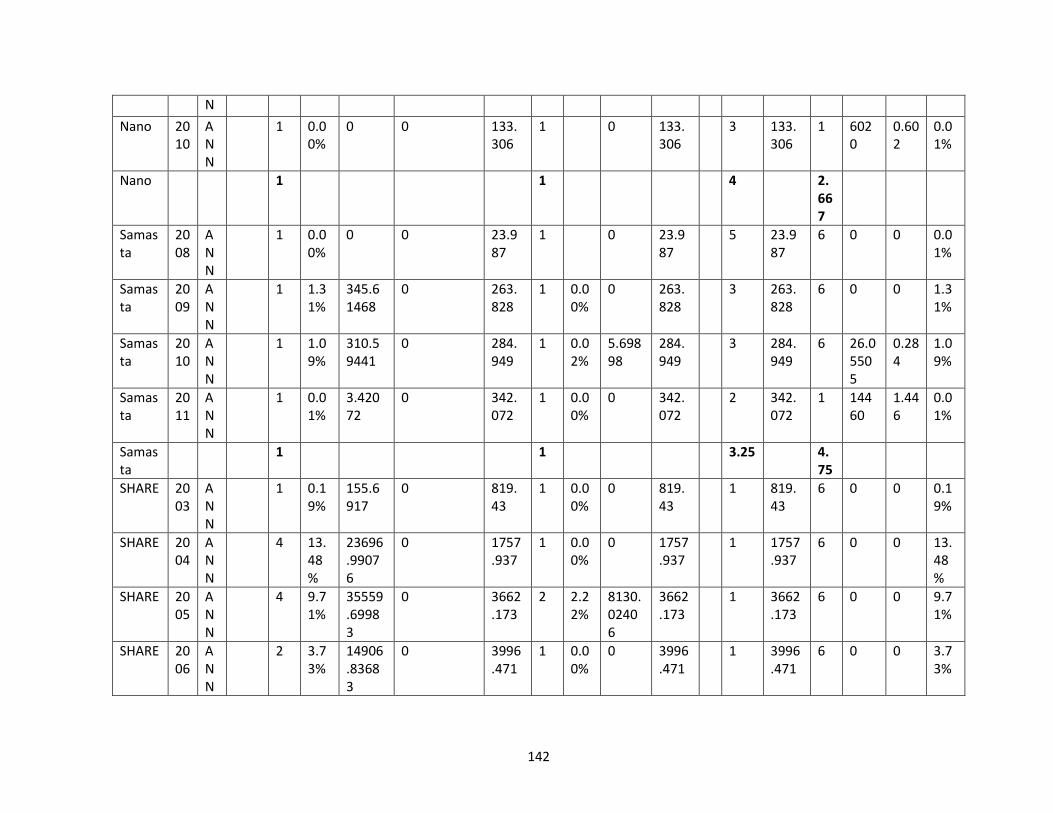
142
N
Nano 2010
ANN
1 0.00%
0 0 133.306
1 0 133.306
3 133.306
1 6020
0.602
0.01%
Nano 1 1 4 2.667
Samasta
2008
ANN
1 0.00%
0 0 23.987
1 0 23.987
5 23.987
6 0 0 0.01%
Samasta
2009
ANN
1 1.31%
345.61468
0 263.828
1 0.00%
0 263.828
3 263.828
6 0 0 1.31%
Samasta
2010
ANN
1 1.09%
310.59441
0 284.949
1 0.02%
5.69898
284.949
3 284.949
6 26.05505
0.284
1.09%
Samasta
2011
ANN
1 0.01%
3.42072
0 342.072
1 0.00%
0 342.072
2 342.072
1 14460
1.446
0.01%
Samasta
1 1 3.25 4.75
SHARE 2003
ANN
1 0.19%
155.6917
0 819.43
1 0.00%
0 819.43
1 819.43
6 0 0 0.19%
SHARE 2004
ANN
4 13.48%
23696.99076
0 1757.937
1 0.00%
0 1757.937
1 1757.937
6 0 0 13.48%
SHARE 2005
ANN
4 9.71%
35559.69983
0 3662.173
2 2.22%
8130.02406
3662.173
1 3662.173
6 0 0 9.71%
SHARE 2006
ANN
2 3.73%
14906.83683
0 3996.471
1 0.00%
0 3996.471
1 3996.471
6 0 0 3.73%
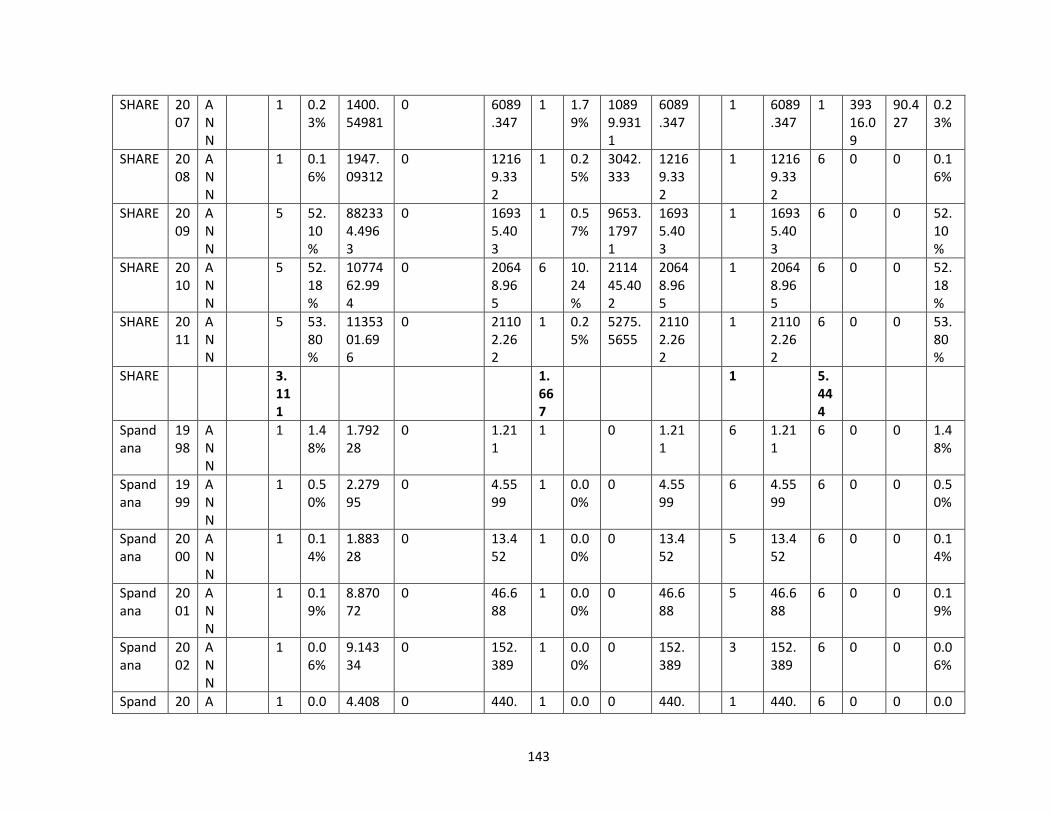
143
SHARE 2007
ANN
1 0.23%
1400.54981
0 6089.347
1 1.79%
10899.9311
6089.347
1 6089.347
1 39316.09
90.427
0.23%
SHARE 2008
ANN
1 0.16%
1947.09312
0 12169.332
1 0.25%
3042.333
12169.332
1 12169.332
6 0 0 0.16%
SHARE 2009
ANN
5 52.10%
882334.4963
0 16935.403
1 0.57%
9653.17971
16935.403
1 16935.403
6 0 0 52.10%
SHARE 2010
ANN
5 52.18%
1077462.994
0 20648.965
6 10.24%
211445.402
20648.965
1 20648.965
6 0 0 52.18%
SHARE 2011
ANN
5 53.80%
1135301.696
0 21102.262
1 0.25%
5275.5655
21102.262
1 21102.262
6 0 0 53.80%
SHARE 3.111
1.667
1 5.444
Spandana
1998
ANN
1 1.48%
1.79228
0 1.211
1 0 1.211
6 1.211
6 0 0 1.48%
Spandana
1999
ANN
1 0.50%
2.27995
0 4.5599
1 0.00%
0 4.5599
6 4.5599
6 0 0 0.50%
Spandana
2000
ANN
1 0.14%
1.88328
0 13.452
1 0.00%
0 13.452
5 13.452
6 0 0 0.14%
Spandana
2001
ANN
1 0.19%
8.87072
0 46.688
1 0.00%
0 46.688
5 46.688
6 0 0 0.19%
Spandana
2002
ANN
1 0.06%
9.14334
0 152.389
1 0.00%
0 152.389
3 152.389
6 0 0 0.06%
Spand 20 A 1 0.0 4.408 0 440. 1 0.0 0 440. 1 440. 6 0 0 0.0
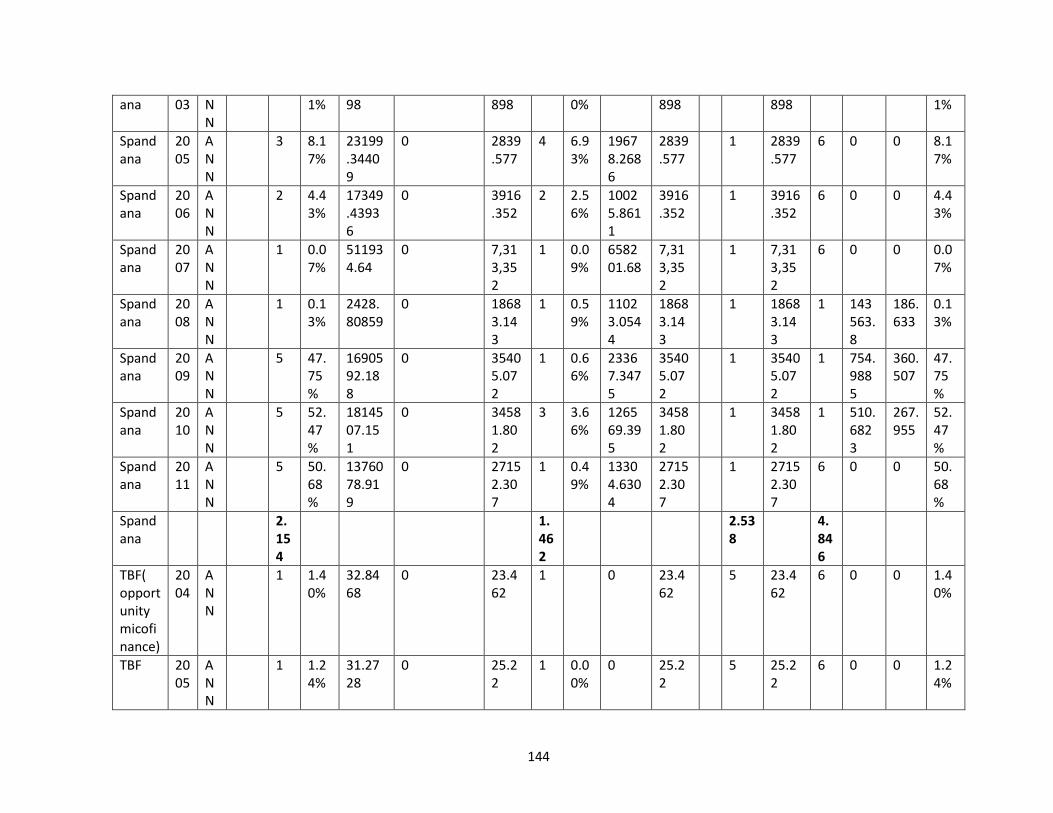
144
ana 03 NN
1% 98 898 0% 898 898 1%
Spandana
2005
ANN
3 8.17%
23199.34409
0 2839.577
4 6.93%
19678.2686
2839.577
1 2839.577
6 0 0 8.17%
Spandana
2006
ANN
2 4.43%
17349.43936
0 3916.352
2 2.56%
10025.8611
3916.352
1 3916.352
6 0 0 4.43%
Spandana
2007
ANN
1 0.07%
511934.64
0 7,313,352
1 0.09%
658201.68
7,313,352
1 7,313,352
6 0 0 0.07%
Spandana
2008
ANN
1 0.13%
2428.80859
0 18683.143
1 0.59%
11023.0544
18683.143
1 18683.143
1 143563.8
186.633
0.13%
Spandana
2009
ANN
5 47.75%
1690592.188
0 35405.072
1 0.66%
23367.3475
35405.072
1 35405.072
1 754.9885
360.507
47.75%
Spandana
2010
ANN
5 52.47%
1814507.151
0 34581.802
3 3.66%
126569.395
34581.802
1 34581.802
1 510.6823
267.955
52.47%
Spandana
2011
ANN
5 50.68%
1376078.919
0 27152.307
1 0.49%
13304.6304
27152.307
1 27152.307
6 0 0 50.68%
Spandana
2.154
1.462
2.538
4.846
TBF( opportunity micofinance)
2004
ANN
1 1.40%
32.8468
0 23.462
1 0 23.462
5 23.462
6 0 0 1.40%
TBF 2005
ANN
1 1.24%
31.2728
0 25.22
1 0.00%
0 25.22
5 25.22
6 0 0 1.24%
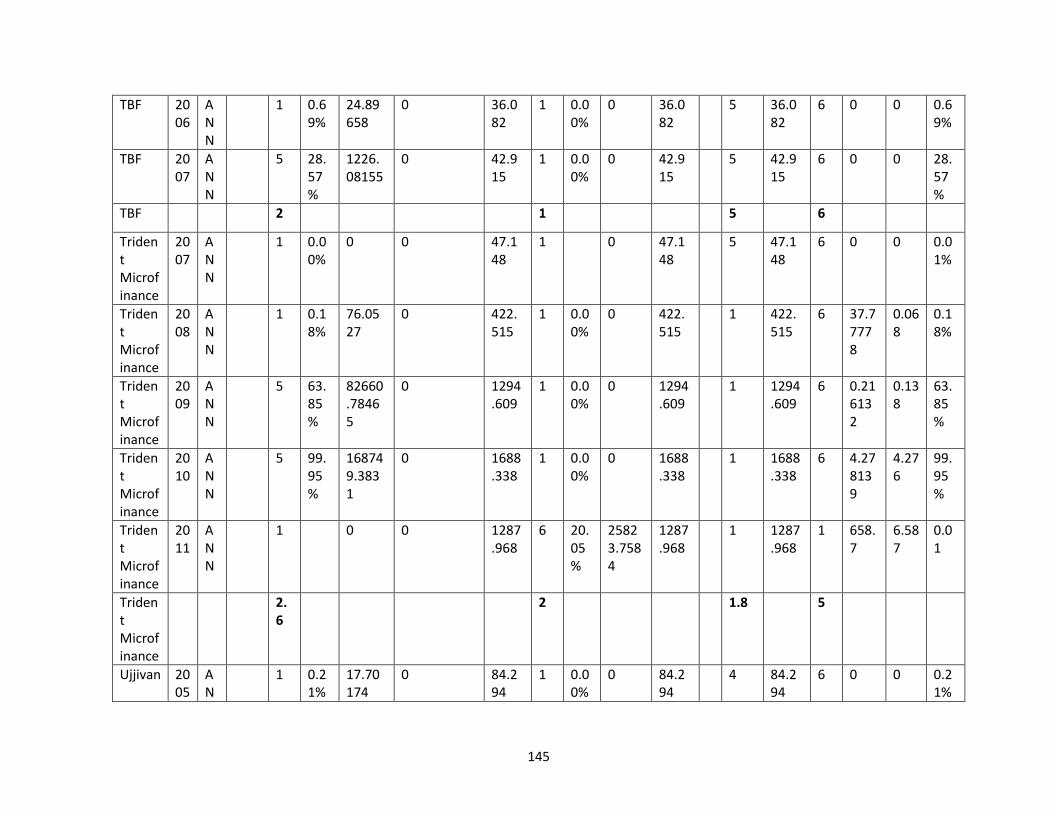
145
TBF 2006
ANN
1 0.69%
24.89658
0 36.082
1 0.00%
0 36.082
5 36.082
6 0 0 0.69%
TBF 2007
ANN
5 28.57%
1226.08155
0 42.915
1 0.00%
0 42.915
5 42.915
6 0 0 28.57%
TBF 2 1 5 6
Trident Microfinance
2007
ANN
1 0.00%
0 0 47.148
1 0 47.148
5 47.148
6 0 0 0.01%
Trident Microfinance
2008
ANN
1 0.18%
76.0527
0 422.515
1 0.00%
0 422.515
1 422.515
6 37.77778
0.068
0.18%
Trident Microfinance
2009
ANN
5 63.85%
82660.78465
0 1294.609
1 0.00%
0 1294.609
1 1294.609
6 0.216132
0.138
63.85%
Trident Microfinance
2010
ANN
5 99.95%
168749.3831
0 1688.338
1 0.00%
0 1688.338
1 1688.338
6 4.278139
4.276
99.95%
Trident Microfinance
2011
ANN
1 0 0 1287.968
6 20.05%
25823.7584
1287.968
1 1287.968
1 658.7
6.587
0.01
Trident Microfinance
2.6
2 1.8 5
Ujjivan 2005
AN
1 0.21%
17.70174
0 84.294
1 0.00%
0 84.294
4 84.294
6 0 0 0.21%
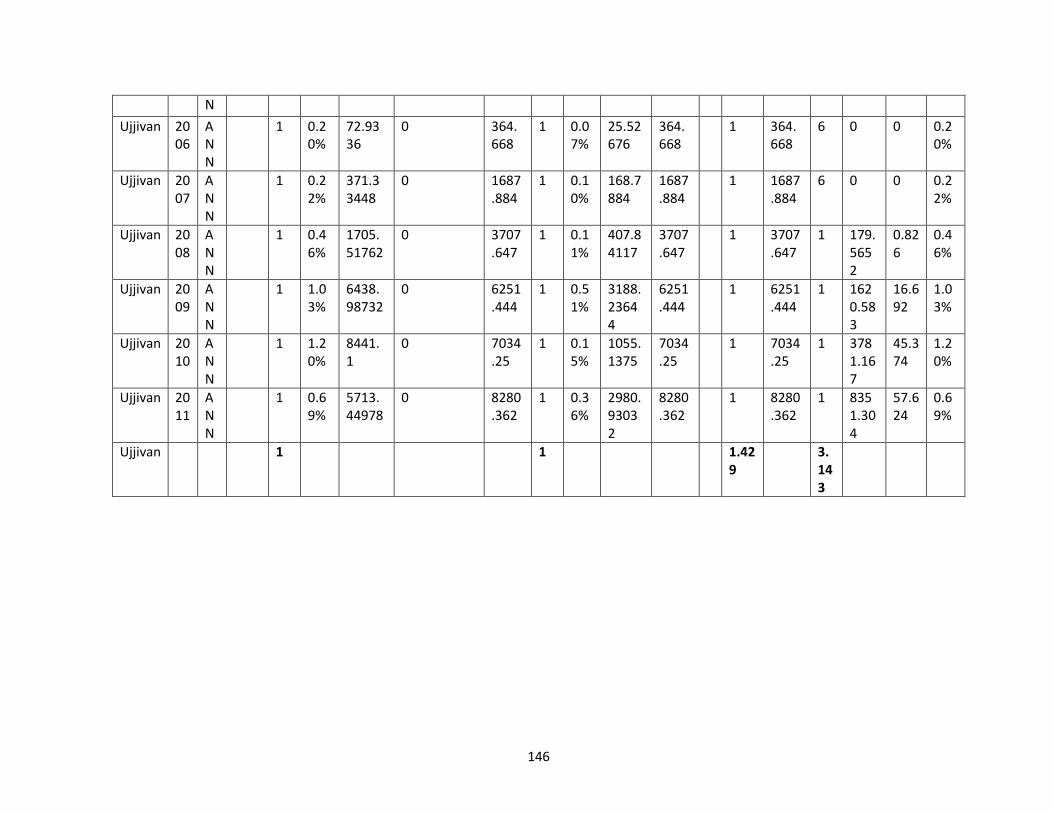
146
N
Ujjivan 2006
ANN
1 0.20%
72.9336
0 364.668
1 0.07%
25.52676
364.668
1 364.668
6 0 0 0.20%
Ujjivan 2007
ANN
1 0.22%
371.33448
0 1687.884
1 0.10%
168.7884
1687.884
1 1687.884
6 0 0 0.22%
Ujjivan 2008
ANN
1 0.46%
1705.51762
0 3707.647
1 0.11%
407.84117
3707.647
1 3707.647
1 179.5652
0.826
0.46%
Ujjivan 2009
ANN
1 1.03%
6438.98732
0 6251.444
1 0.51%
3188.23644
6251.444
1 6251.444
1 1620.583
16.692
1.03%
Ujjivan 2010
ANN
1 1.20%
8441.1
0 7034.25
1 0.15%
1055.1375
7034.25
1 7034.25
1 3781.167
45.374
1.20%
Ujjivan 2011
ANN
1 0.69%
5713.44978
0 8280.362
1 0.36%
2980.93032
8280.362
1 8280.362
1 8351.304
57.624
0.69%
Ujjivan 1 1 1.429
3.143
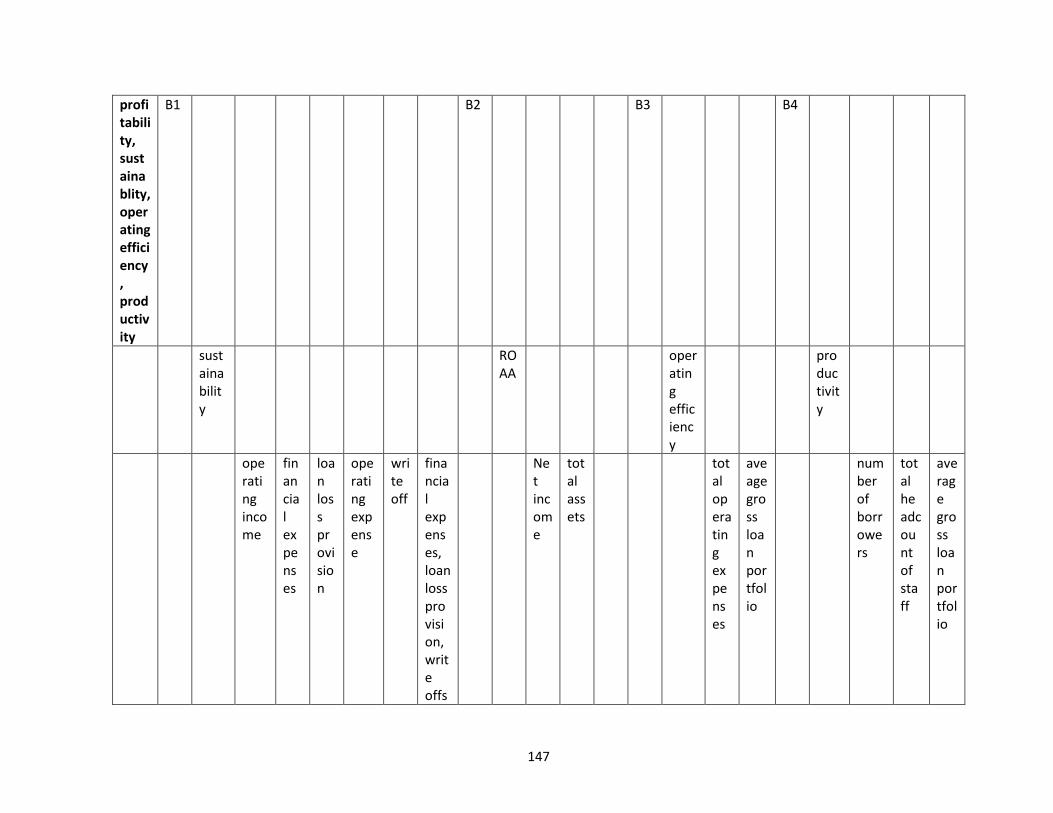
147
profitability, sustainablity, operating efficiency, productivity
B1 B2 B3 B4
sustainability
ROAA
operating efficiency
productivity
operating income
financial expenses
loan loss provision
operating expense
write off
financial expenses, loan loss provision, write offs
Net income
total assets
total operating expenses
aveage gross loan portfolio
number of borrowers
total headcount of staff
average gross loan portfolio
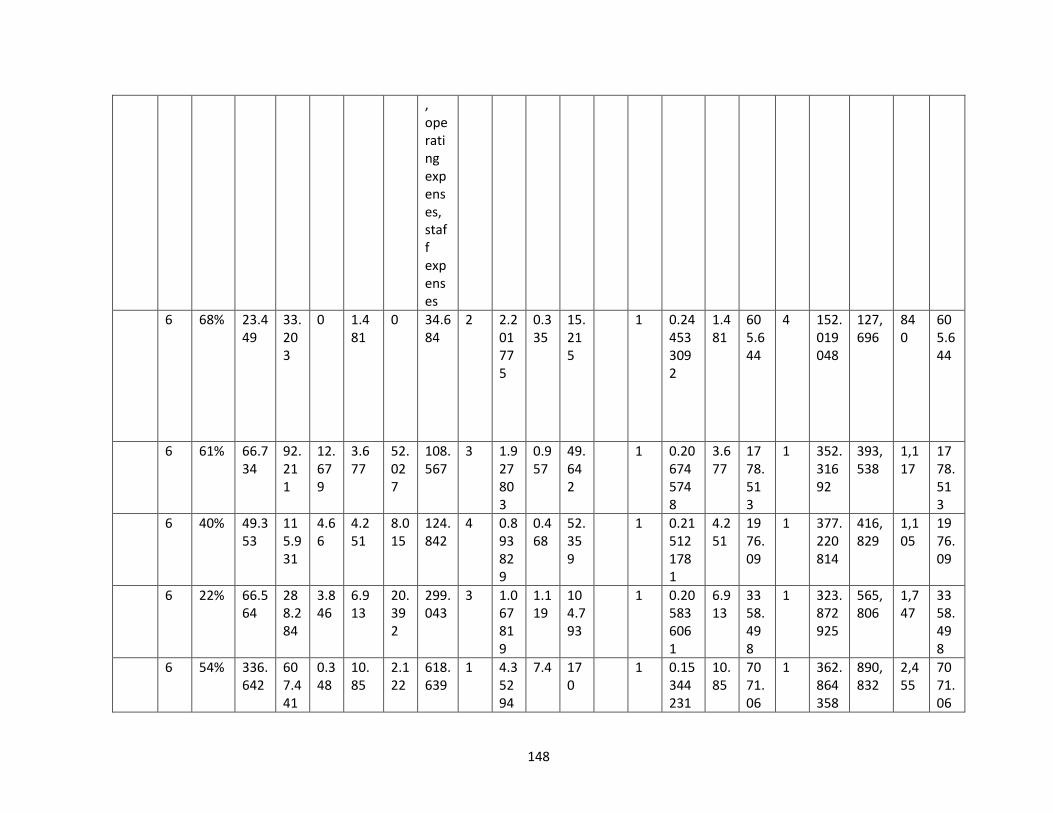
148
, operating expenses, staff expenses
6 68% 23.449
33.203
0 1.481
0 34.684
2 2.201775
0.335
15.215
1 0.244533092
1.481
605.644
4 152.019048
127,696
840
605.644
6 61% 66.734
92.211
12.679
3.677
52.027
108.567
3 1.927803
0.957
49.642
1 0.206745748
3.677
1778.513
1 352.31692
393,538
1,117
1778.513
6 40% 49.353
115.931
4.66
4.251
8.015
124.842
4 0.893829
0.468
52.359
1 0.215121781
4.251
1976.09
1 377.220814
416,829
1,105
1976.09
6 22% 66.564
288.284
3.846
6.913
20.392
299.043
3 1.067819
1.119
104.793
1 0.205836061
6.913
3358.498
1 323.872925
565,806
1,747
3358.498
6 54% 336.642
607.441
0.348
10.85
2.122
618.639
1 4.35294
7.4 170
1 0.15344231
10.85
7071.06
1 362.864358
890,832
2,455
7071.06
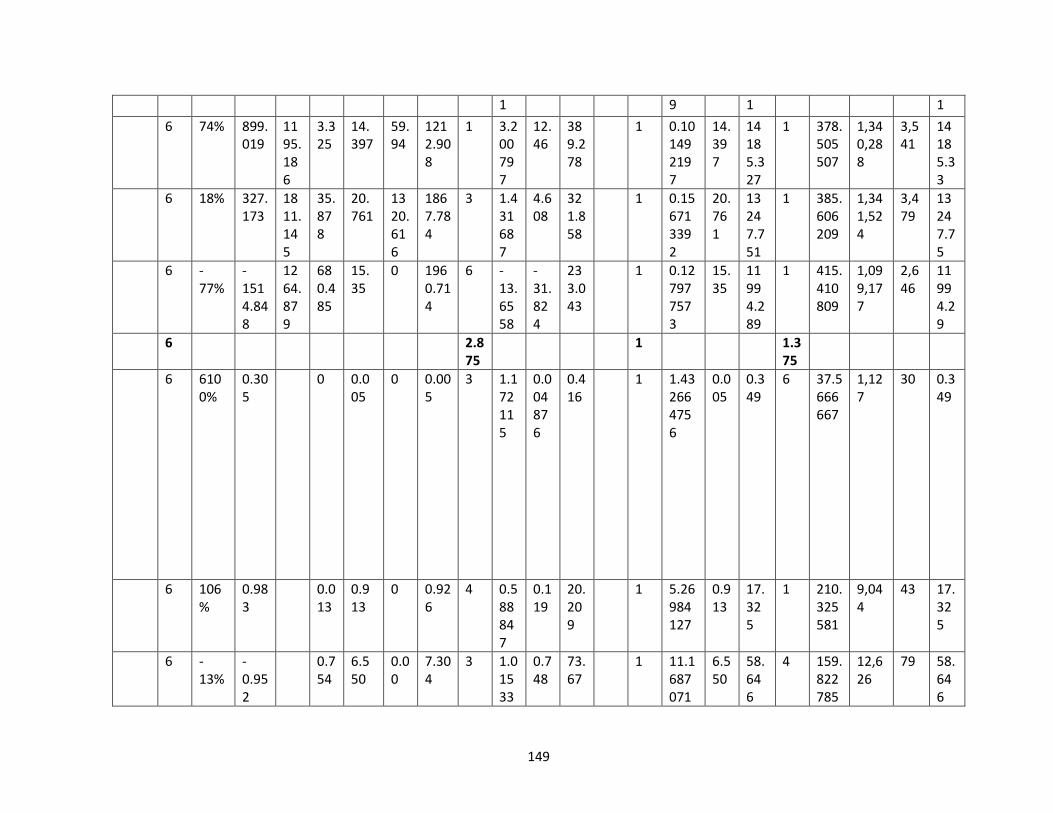
149
1 9 1 1
6 74% 899.019
1195.186
3.325
14.397
59.94
1212.908
1 3.200797
12.46
389.278
1 0.101492197
14.397
14185.327
1 378.505507
1,340,288
3,541
14185.33
6 18% 327.173
1811.145
35.878
20.761
1320.616
1867.784
3 1.431687
4.608
321.858
1 0.156713392
20.761
13247.751
1 385.606209
1,341,524
3,479
13247.75
6 -77%
-1514.848
1264.879
680.485
15.35
0 1960.714
6 -13.6558
-31.824
233.043
1 0.127977573
15.35
11994.289
1 415.410809
1,099,177
2,646
11994.29
6 2.875
1 1.375
6 6100%
0.305
0 0.005
0 0.005
3 1.172115
0.004876
0.416
1 1.432664756
0.005
0.349
6 37.5666667
1,127
30 0.349
6 106%
0.983
0.013
0.913
0 0.926
4 0.588847
0.119
20.209
1 5.26984127
0.913
17.325
1 210.325581
9,044
43 17.325
6 -13%
-0.952
0.754
6.550
0.00
7.304
3 1.01533
0.748
73.67
1 11.1687071
6.550
58.646
4 159.822785
12,626
79 58.646
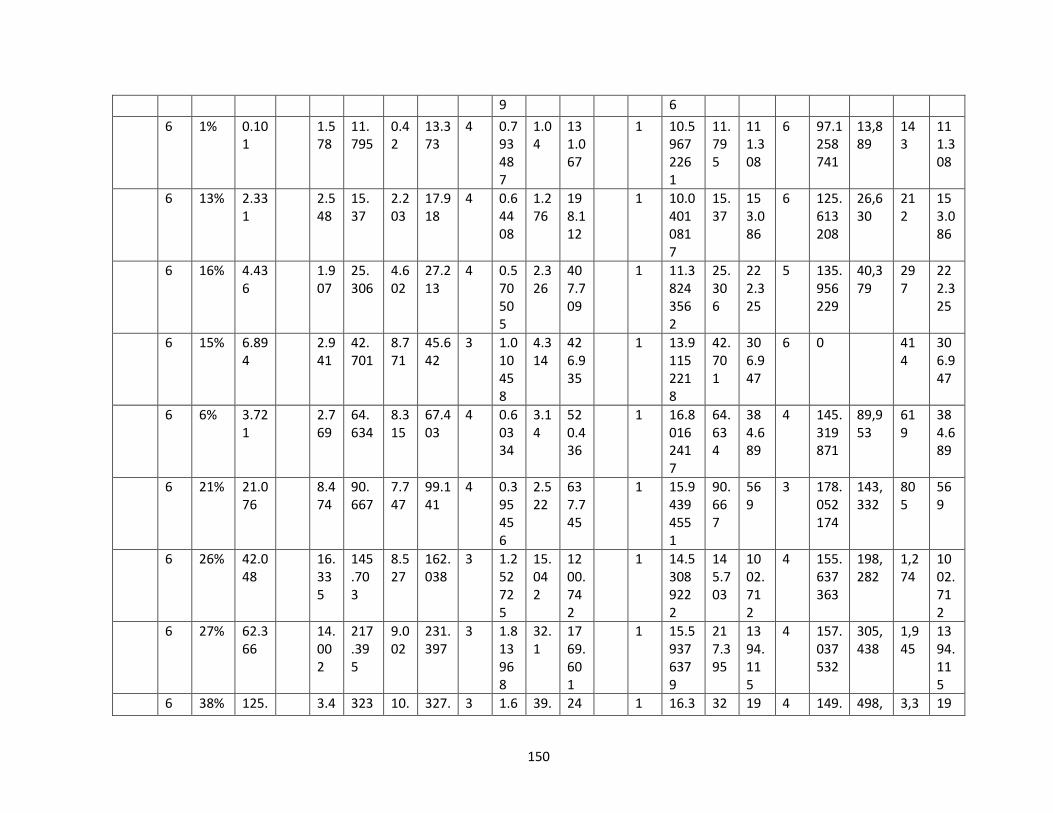
150
9 6
6 1% 0.101
1.578
11.795
0.42
13.373
4 0.793487
1.04
131.067
1 10.59672261
11.795
111.308
6 97.1258741
13,889
143
111.308
6 13% 2.331
2.548
15.37
2.203
17.918
4 0.64408
1.276
198.112
1 10.04010817
15.37
153.086
6 125.613208
26,630
212
153.086
6 16% 4.436
1.907
25.306
4.602
27.213
4 0.570505
2.326
407.709
1 11.38243562
25.306
222.325
5 135.956229
40,379
297
222.325
6 15% 6.894
2.941
42.701
8.771
45.642
3 1.010458
4.314
426.935
1 13.91152218
42.701
306.947
6 0 414
306.947
6 6% 3.721
2.769
64.634
8.315
67.403
4 0.60334
3.14
520.436
1 16.80162417
64.634
384.689
4 145.319871
89,953
619
384.689
6 21% 21.076
8.474
90.667
7.747
99.141
4 0.395456
2.522
637.745
1 15.94394551
90.667
569
3 178.052174
143,332
805
569
6 26% 42.048
16.335
145.703
8.527
162.038
3 1.252725
15.042
1200.742
1 14.53089222
145.703
1002.712
4 155.637363
198,282
1,274
1002.712
6 27% 62.366
14.002
217.395
9.002
231.397
3 1.813968
32.1
1769.601
1 15.59376379
217.395
1394.115
4 157.037532
305,438
1,945
1394.115
6 38% 125. 3.4 323 10. 327. 3 1.6 39. 24 1 16.3 32 19 4 149. 498, 3,3 19
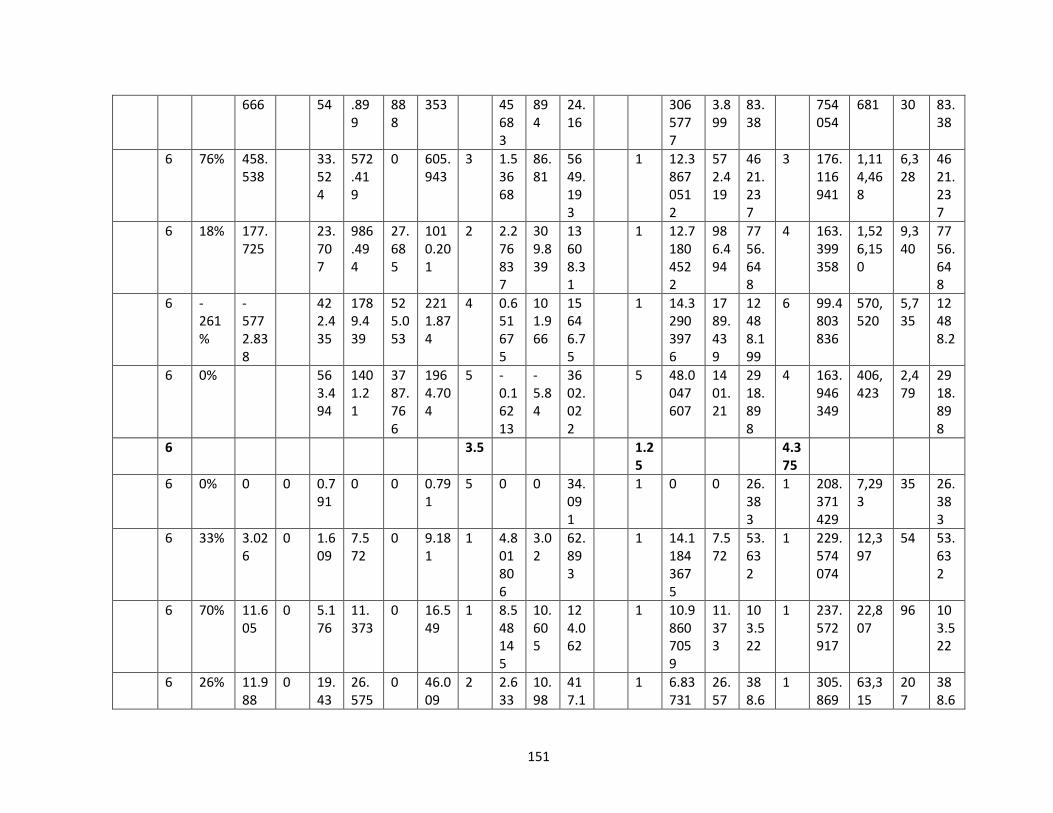
151
666 54 .899
888
353 45683
894
24.16
3065777
3.899
83.38
754054
681 30 83.38
6 76% 458.538
33.524
572.419
0 605.943
3 1.53668
86.81
5649.193
1 12.38670512
572.419
4621.237
3 176.116941
1,114,468
6,328
4621.237
6 18% 177.725
23.707
986.494
27.685
1010.201
2 2.276837
309.839
13608.31
1 12.71804522
986.494
7756.648
4 163.399358
1,526,150
9,340
7756.648
6 -261%
-5772.838
422.435
1789.439
525.053
2211.874
4 0.651675
101.966
15646.75
1 14.32903976
1789.439
12488.199
6 99.4803836
570,520
5,735
12488.2
6 0% 563.494
1401.21
3787.766
1964.704
5 -0.16213
-5.84
3602.022
5 48.0047607
1401.21
2918.898
4 163.946349
406,423
2,479
2918.898
6 3.5 1.25
4.375
6 0% 0 0 0.791
0 0 0.791
5 0 0 34.091
1 0 0 26.383
1 208.371429
7,293
35 26.383
6 33% 3.026
0 1.609
7.572
0 9.181
1 4.801806
3.02
62.893
1 14.11843675
7.572
53.632
1 229.574074
12,397
54 53.632
6 70% 11.605
0 5.176
11.373
0 16.549
1 8.548145
10.605
124.062
1 10.98607059
11.373
103.522
1 237.572917
22,807
96 103.522
6 26% 11.988
0 19.43
26.575
0 46.009
2 2.633
10.98
417.1
1 6.83731
26.57
388.6
1 305.869
63,315
207
388.6
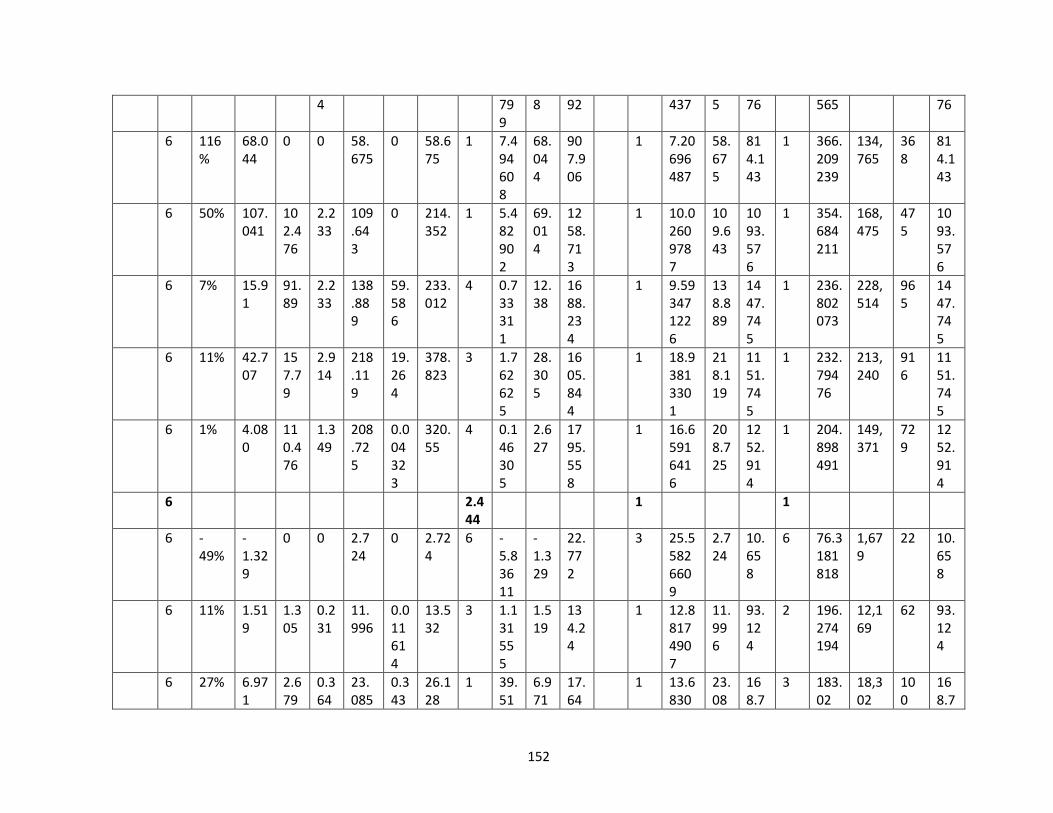
152
4 799
8 92 437 5 76 565 76
6 116%
68.044
0 0 58.675
0 58.675
1 7.494608
68.044
907.906
1 7.20696487
58.675
814.143
1 366.209239
134,765
368
814.143
6 50% 107.041
102.476
2.233
109.643
0 214.352
1 5.482902
69.014
1258.713
1 10.02609787
109.643
1093.576
1 354.684211
168,475
475
1093.576
6 7% 15.91
91.89
2.233
138.889
59.586
233.012
4 0.733311
12.38
1688.234
1 9.593471226
138.889
1447.745
1 236.802073
228,514
965
1447.745
6 11% 42.707
157.79
2.914
218.119
19.264
378.823
3 1.762625
28.305
1605.844
1 18.93813301
218.119
1151.745
1 232.79476
213,240
916
1151.745
6 1% 4.080
110.476
1.349
208.725
0.004323
320.55
4 0.146305
2.627
1795.558
1 16.65916416
208.725
1252.914
1 204.898491
149,371
729
1252.914
6 2.444
1 1
6 -49%
-1.329
0 0 2.724
0 2.724
6 -5.83611
-1.329
22.772
3 25.55826609
2.724
10.658
6 76.3181818
1,679
22 10.658
6 11% 1.519
1.305
0.231
11.996
0.011614
13.532
3 1.131555
1.519
134.24
1 12.88174907
11.996
93.124
2 196.274194
12,169
62 93.124
6 27% 6.971
2.679
0.364
23.085
0.343
26.128
1 39.51
6.971
17.64
1 13.6830
23.08
168.7
3 183.02
18,302
100
168.7
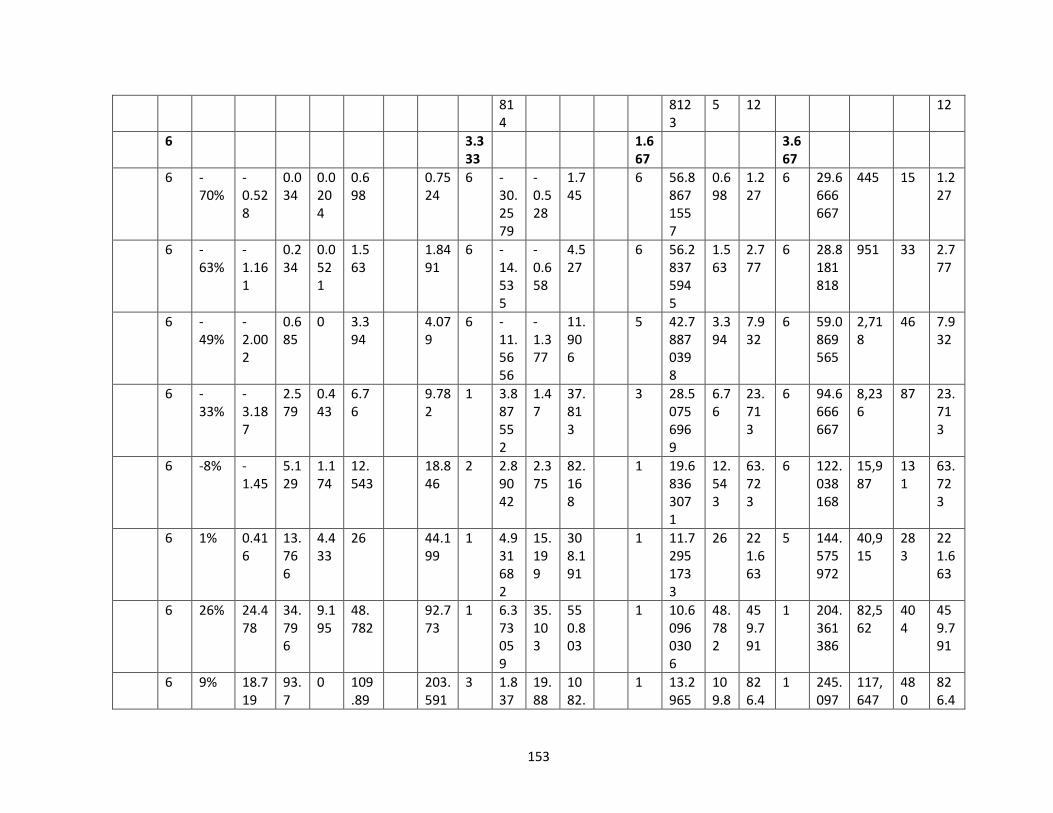
153
814
8123
5 12 12
6 3.333
1.667
3.667
6 -70%
-0.528
0.034
0.0204
0.698
0.7524
6 -30.2579
-0.528
1.745
6 56.88671557
0.698
1.227
6 29.6666667
445 15 1.227
6 -63%
-1.161
0.234
0.0521
1.563
1.8491
6 -14.535
-0.658
4.527
6 56.28375945
1.563
2.777
6 28.8181818
951 33 2.777
6 -49%
-2.002
0.685
0 3.394
4.079
6 -11.5656
-1.377
11.906
5 42.78870398
3.394
7.932
6 59.0869565
2,718
46 7.932
6 -33%
-3.187
2.579
0.443
6.76
9.782
1 3.887552
1.47
37.813
3 28.50756969
6.76
23.713
6 94.6666667
8,236
87 23.713
6 -8% -1.45
5.129
1.174
12.543
18.846
2 2.89042
2.375
82.168
1 19.68363071
12.543
63.723
6 122.038168
15,987
131
63.723
6 1% 0.416
13.766
4.433
26 44.199
1 4.931682
15.199
308.191
1 11.72951733
26 221.663
5 144.575972
40,915
283
221.663
6 26% 24.478
34.796
9.195
48.782
92.773
1 6.373059
35.103
550.803
1 10.60960306
48.782
459.791
1 204.361386
82,562
404
459.791
6 9% 18.719
93.7
0 109.89
203.591
3 1.837
19.88
1082.
1 13.2965
109.8
826.4
1 245.097
117,647
480
826.4

154
1 001
5 471
7419
91 61 917 61
6 2% 6.414
168.092
0 159.183
327.275
4 0.321666
4.854
1509.018
1 8.779831588
159.183
1813.053
1 275.113134
211,562
769
1813.053
6 4% 18.698
228.206
28.337
245.564
502.107
4 0.308598
9.456
3064.183
1 7.437465851
245.564
3301.716
1 255.542029
352,648
1,380
3301.716
6 5% 37.921
336.847
25.512
399.378
761.737
3 1.213422
35.101
2892.728
1 15.94289622
399.378
2505.053
3 183.730549
321,161
1,748
2505.053
6 -3% -17.074
306.832
11.03
346.318
664.18
5 -0.91097
-29.026
3186.262
1 9.083455384
346.318
3812.624
1 247.521705
313,610
1,267
3812.624
6 3.5 2.333
3.583
6 -31%
-2.92
2.13
0 7.413
0 9.543
5 0.209
51.713
1 15.97491596
7.413
46.404
1 1040.69231
13,529
13 46.404
6 29% 3.121
4.448
0 6.211
0 10.659
5 0.749
94.475
1 7.096744707
6.211
87.519
1 1277.33333
19,160
15 87.519
6 -32%
-53.114
57.187
0 106.698
0 163.885
5 -54.1
387.687
4 34.90672826
106.698
305.666
1 399.601852
43,157
108
305.666
6 -13%
-23.8
58.77
5.253
121.75
0 185.781
5 -22.
1148.
1 18.1596
121.7
670.4
1 273.87
82,161
300
670.4
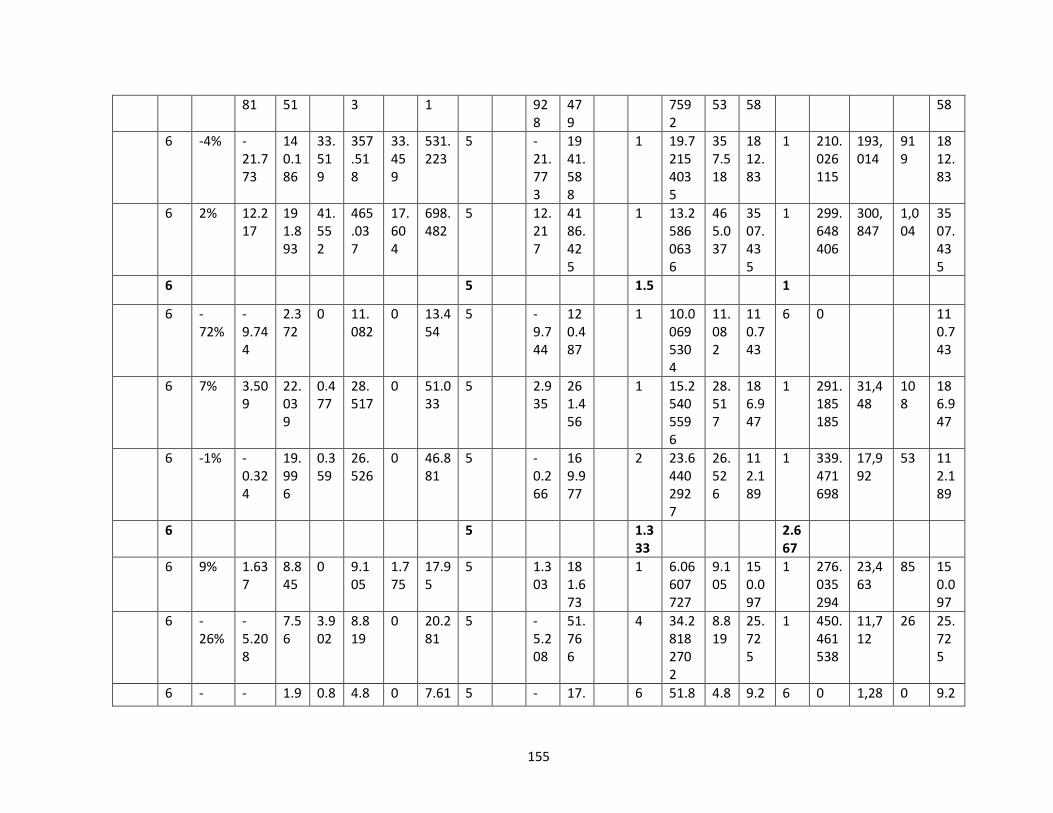
155
81 51 3 1 928
479
7592
53 58 58
6 -4% -21.773
140.186
33.519
357.518
33.459
531.223
5 -21.773
1941.588
1 19.72154035
357.518
1812.83
1 210.026115
193,014
919
1812.83
6 2% 12.217
191.893
41.552
465.037
17.604
698.482
5 12.217
4186.425
1 13.25860636
465.037
3507.435
1 299.648406
300,847
1,004
3507.435
6 5 1.5 1
6 -72%
-9.744
2.372
0 11.082
0 13.454
5 -9.744
120.487
1 10.00695304
11.082
110.743
6 0 110.743
6 7% 3.509
22.039
0.477
28.517
0 51.033
5 2.935
261.456
1 15.25405596
28.517
186.947
1 291.185185
31,448
108
186.947
6 -1% -0.324
19.996
0.359
26.526
0 46.881
5 -0.266
169.977
2 23.64402927
26.526
112.189
1 339.471698
17,992
53 112.189
6 5 1.333
2.667
6 9% 1.637
8.845
0 9.105
1.775
17.95
5 1.303
181.673
1 6.06607727
9.105
150.097
1 276.035294
23,463
85 150.097
6 -26%
-5.208
7.56
3.902
8.819
0 20.281
5 -5.208
51.766
4 34.28182702
8.819
25.725
1 450.461538
11,712
26 25.725
6 - - 1.9 0.8 4.8 0 7.61 5 - 17. 6 51.8 4.8 9.2 6 0 1,28 0 9.2
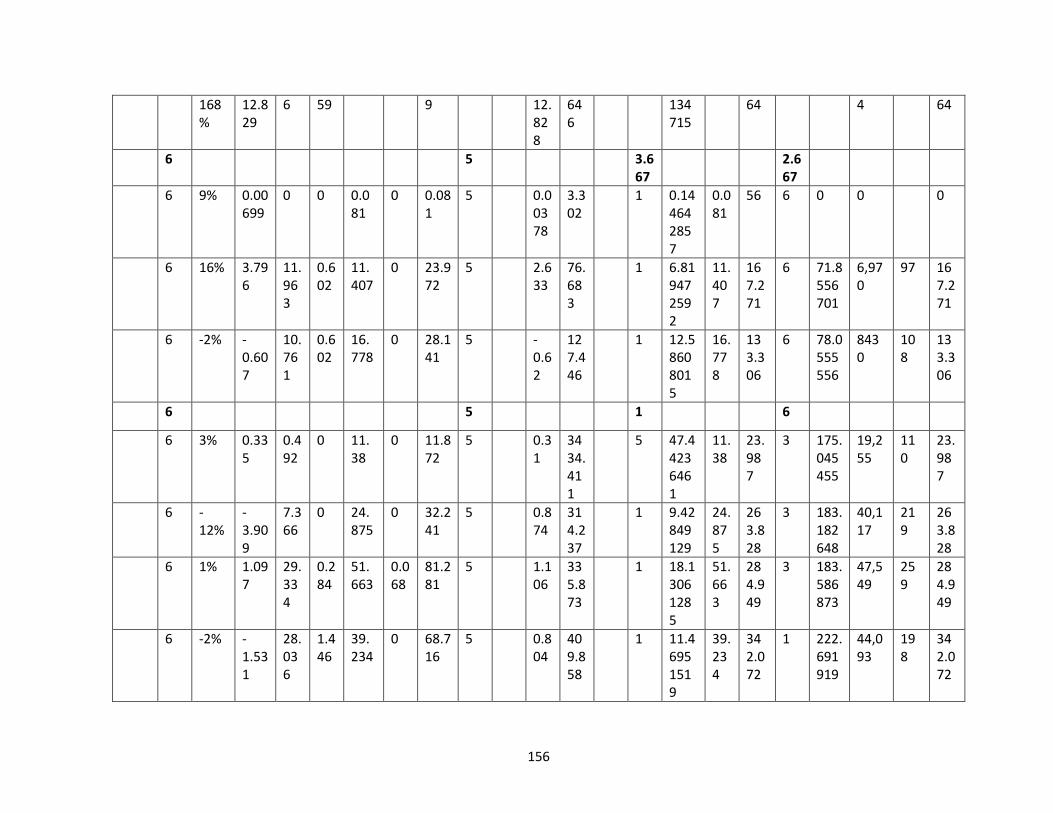
156
168%
12.829
6 59 9 12.828
646
134715
64 4 64
6 5 3.667
2.667
6 9% 0.00699
0 0 0.081
0 0.081
5 0.00378
3.302
1 0.144642857
0.081
56 6 0 0 0
6 16% 3.796
11.963
0.602
11.407
0 23.972
5 2.633
76.683
1 6.819472592
11.407
167.271
6 71.8556701
6,970
97 167.271
6 -2% -0.607
10.761
0.602
16.778
0 28.141
5 -0.62
127.446
1 12.58608015
16.778
133.306
6 78.0555556
8430
108
133.306
6 5 1 6
6 3% 0.335
0.492
0 11.38
0 11.872
5 0.31
3434.411
5 47.44236461
11.38
23.987
3 175.045455
19,255
110
23.987
6 -12%
-3.909
7.366
0 24.875
0 32.241
5 0.874
314.237
1 9.42849129
24.875
263.828
3 183.182648
40,117
219
263.828
6 1% 1.097
29.334
0.284
51.663
0.068
81.281
5 1.106
335.873
1 18.13061285
51.663
284.949
3 183.586873
47,549
259
284.949
6 -2% -1.531
28.036
1.446
39.234
0 68.716
5 0.804
409.858
1 11.46951519
39.234
342.072
1 222.691919
44,093
198
342.072
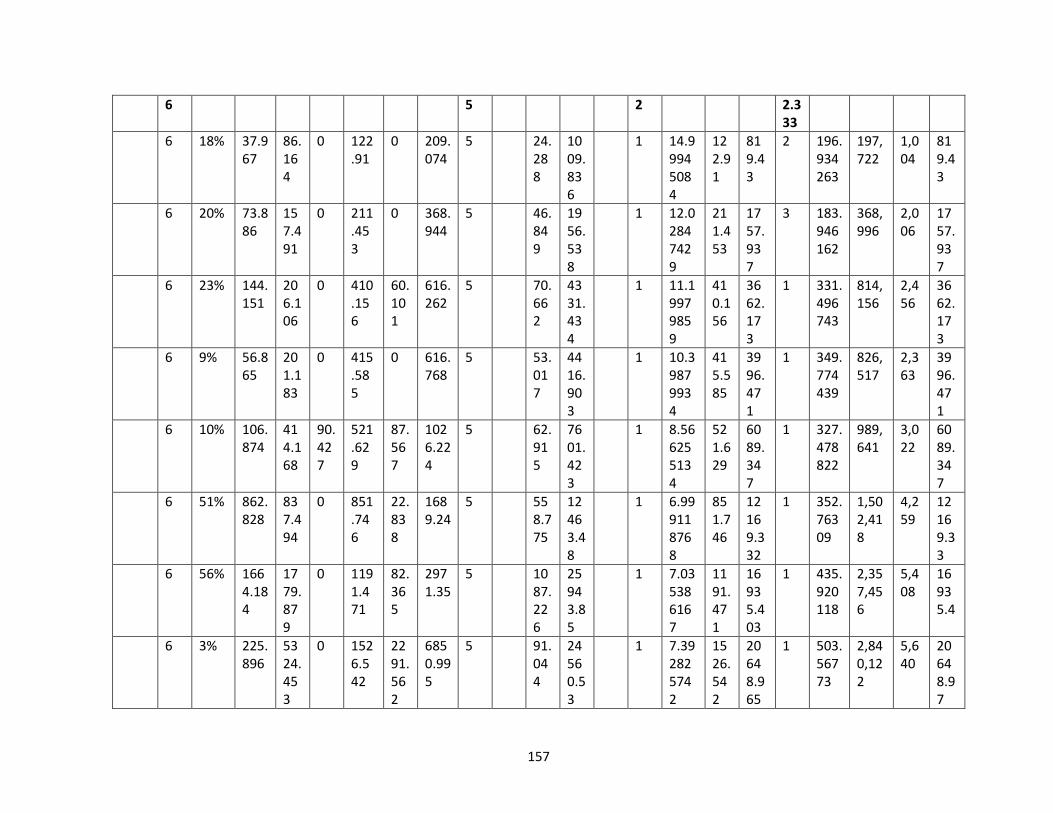
157
6 5 2 2.333
6 18% 37.967
86.164
0 122.91
0 209.074
5 24.288
1009.836
1 14.99945084
122.91
819.43
2 196.934263
197,722
1,004
819.43
6 20% 73.886
157.491
0 211.453
0 368.944
5 46.849
1956.538
1 12.02847429
211.453
1757.937
3 183.946162
368,996
2,006
1757.937
6 23% 144.151
206.106
0 410.156
60.101
616.262
5 70.662
4331.434
1 11.19979859
410.156
3662.173
1 331.496743
814,156
2,456
3662.173
6 9% 56.865
201.183
0 415.585
0 616.768
5 53.017
4416.903
1 10.39879934
415.585
3996.471
1 349.774439
826,517
2,363
3996.471
6 10% 106.874
414.168
90.427
521.629
87.567
1026.224
5 62.915
7601.423
1 8.566255134
521.629
6089.347
1 327.478822
989,641
3,022
6089.347
6 51% 862.828
837.494
0 851.746
22.838
1689.24
5 558.775
12463.48
1 6.999118768
851.746
12169.332
1 352.76309
1,502,418
4,259
12169.33
6 56% 1664.184
1779.879
0 1191.471
82.365
2971.35
5 1087.226
25943.85
1 7.035386167
1191.471
16935.403
1 435.920118
2,357,456
5,408
16935.4
6 3% 225.896
5324.453
0 1526.542
2291.562
6850.995
5 91.044
24560.53
1 7.392825742
1526.542
20648.965
1 503.56773
2,840,122
5,640
20648.97
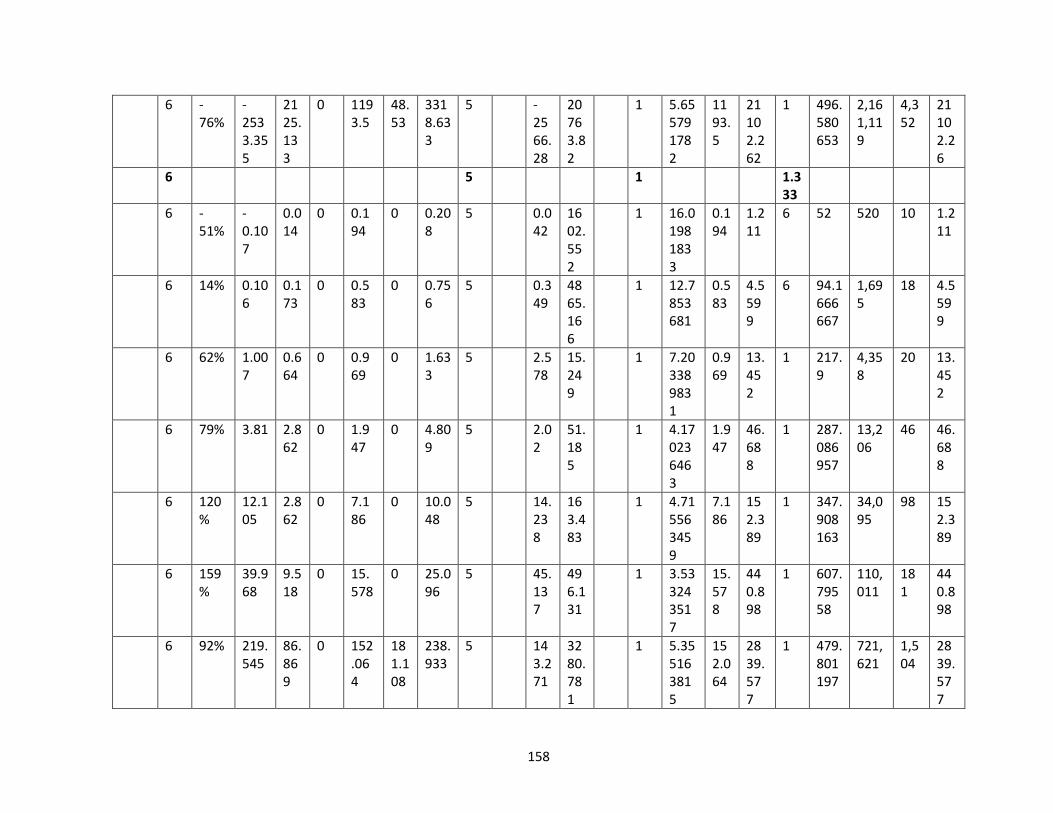
158
6 -76%
-2533.355
2125.133
0 1193.5
48.53
3318.633
5 -2566.28
20763.82
1 5.655791782
1193.5
21102.262
1 496.580653
2,161,119
4,352
21102.26
6 5 1 1.333
6 -51%
-0.107
0.014
0 0.194
0 0.208
5 0.042
1602.552
1 16.01981833
0.194
1.211
6 52 520 10 1.211
6 14% 0.106
0.173
0 0.583
0 0.756
5 0.349
4865.166
1 12.7853681
0.583
4.5599
6 94.1666667
1,695
18 4.5599
6 62% 1.007
0.664
0 0.969
0 1.633
5 2.578
15.249
1 7.203389831
0.969
13.452
1 217.9
4,358
20 13.452
6 79% 3.81 2.862
0 1.947
0 4.809
5 2.02
51.185
1 4.170236463
1.947
46.688
1 287.086957
13,206
46 46.688
6 120%
12.105
2.862
0 7.186
0 10.048
5 14.238
163.483
1 4.715563459
7.186
152.389
1 347.908163
34,095
98 152.389
6 159%
39.968
9.518
0 15.578
0 25.096
5 45.137
496.131
1 3.533243517
15.578
440.898
1 607.79558
110,011
181
440.898
6 92% 219.545
86.869
0 152.064
181.108
238.933
5 143.271
3280.781
1 5.355163815
152.064
2839.577
1 479.801197
721,621
1,504
2839.577
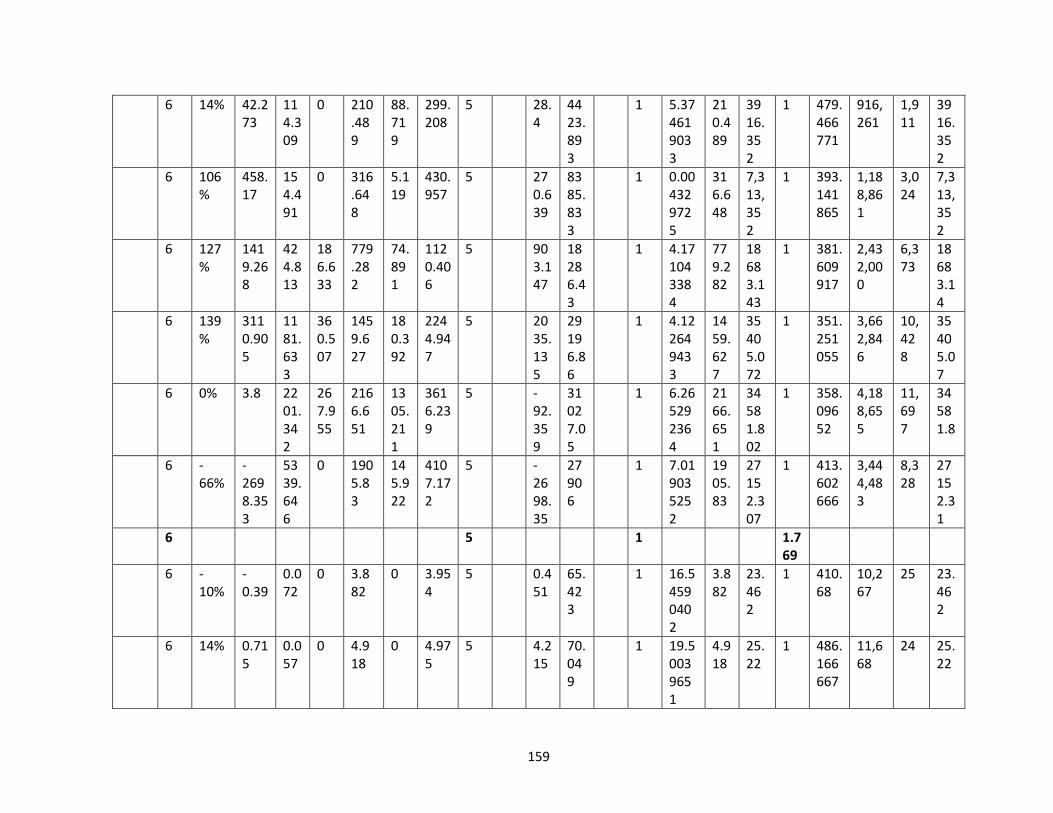
159
6 14% 42.273
114.309
0 210.489
88.719
299.208
5 28.4
4423.893
1 5.374619033
210.489
3916.352
1 479.466771
916,261
1,911
3916.352
6 106%
458.17
154.491
0 316.648
5.119
430.957
5 270.639
8385.833
1 0.004329725
316.648
7,313,352
1 393.141865
1,188,861
3,024
7,313,352
6 127%
1419.268
424.813
186.633
779.282
74.891
1120.406
5 903.147
18286.43
1 4.171043384
779.282
18683.143
1 381.609917
2,432,000
6,373
18683.14
6 139%
3110.905
1181.633
360.507
1459.627
180.392
2244.947
5 2035.135
29196.86
1 4.122649433
1459.627
35405.072
1 351.251055
3,662,846
10,428
35405.07
6 0% 3.8 2201.342
267.955
2166.651
1305.211
3616.239
5 -92.359
31027.05
1 6.265292364
2166.651
34581.802
1 358.09652
4,188,655
11,697
34581.8
6 -66%
-2698.353
5339.646
0 1905.83
145.922
4107.172
5 -2698.35
27906
1 7.019035252
1905.83
27152.307
1 413.602666
3,444,483
8,328
27152.31
6 5 1 1.769
6 -10%
-0.39
0.072
0 3.882
0 3.954
5 0.451
65.423
1 16.54590402
3.882
23.462
1 410.68
10,267
25 23.462
6 14% 0.715
0.057
0 4.918
0 4.975
5 4.215
70.049
1 19.50039651
4.918
25.22
1 486.166667
11,668
24 25.22
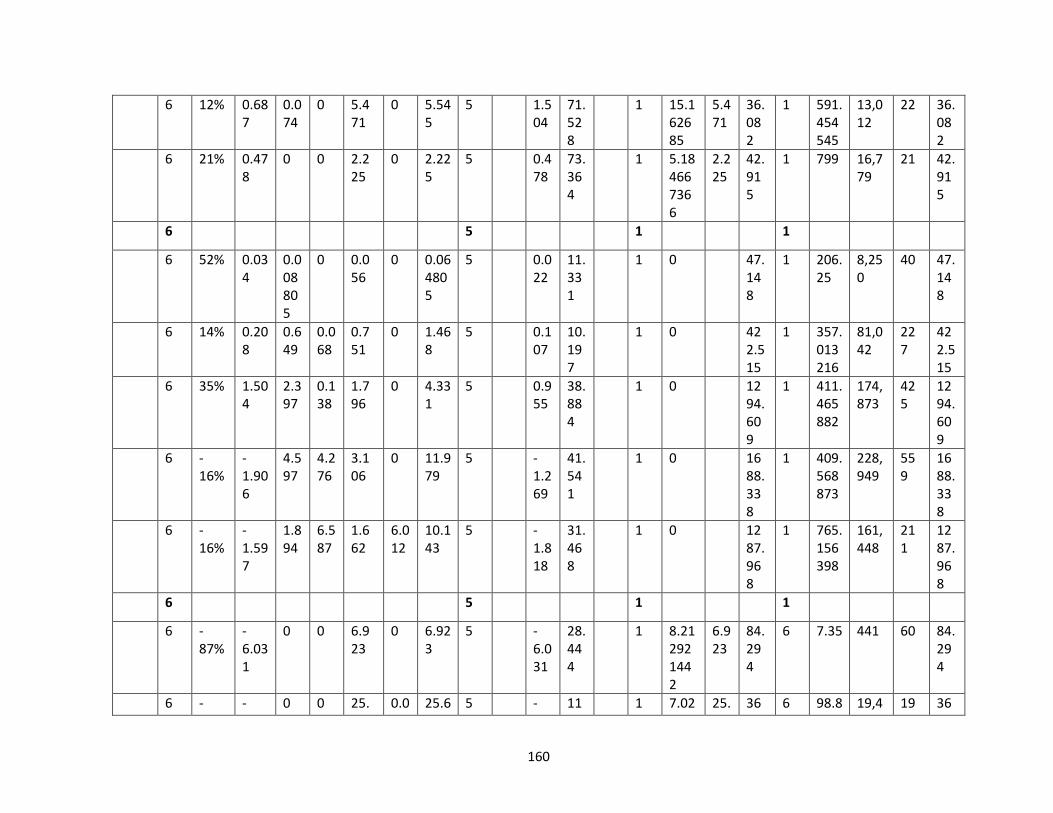
160
6 12% 0.687
0.074
0 5.471
0 5.545
5 1.504
71.528
1 15.162685
5.471
36.082
1 591.454545
13,012
22 36.082
6 21% 0.478
0 0 2.225
0 2.225
5 0.478
73.364
1 5.184667366
2.225
42.915
1 799 16,779
21 42.915
6 5 1 1
6 52% 0.034
0.008805
0 0.056
0 0.064805
5 0.022
11.331
1 0 47.148
1 206.25
8,250
40 47.148
6 14% 0.208
0.649
0.068
0.751
0 1.468
5 0.107
10.197
1 0 422.515
1 357.013216
81,042
227
422.515
6 35% 1.504
2.397
0.138
1.796
0 4.331
5 0.955
38.884
1 0 1294.609
1 411.465882
174,873
425
1294.609
6 -16%
-1.906
4.597
4.276
3.106
0 11.979
5 -1.269
41.541
1 0 1688.338
1 409.568873
228,949
559
1688.338
6 -16%
-1.597
1.894
6.587
1.662
6.012
10.143
5 -1.818
31.468
1 0 1287.968
1 765.156398
161,448
211
1287.968
6 5 1 1
6 -87%
-6.031
0 0 6.923
0 6.923
5 -6.031
28.444
1 8.212921442
6.923
84.294
6 7.35 441 60 84.294
6 - - 0 0 25. 0.0 25.6 5 - 11 1 7.02 25. 36 6 98.8 19,4 19 36
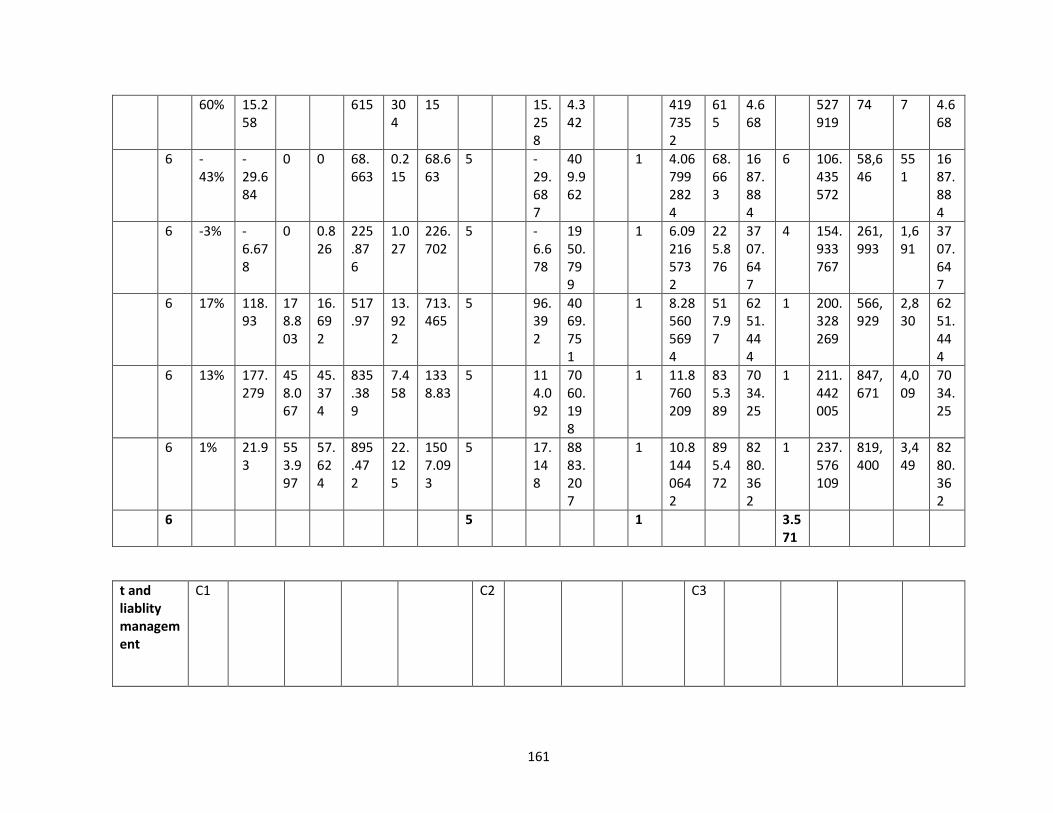
161
60% 15.258
615 304
15 15.258
4.342
4197352
615
4.668
527919
74 7 4.668
6 -43%
-29.684
0 0 68.663
0.215
68.663
5 -29.687
409.962
1 4.067992824
68.663
1687.884
6 106.435572
58,646
551
1687.884
6 -3% -6.678
0 0.826
225.876
1.027
226.702
5 -6.678
1950.799
1 6.092165732
225.876
3707.647
4 154.933767
261,993
1,691
3707.647
6 17% 118.93
178.803
16.692
517.97
13.922
713.465
5 96.392
4069.751
1 8.285605694
517.97
6251.444
1 200.328269
566,929
2,830
6251.444
6 13% 177.279
458.067
45.374
835.389
7.458
1338.83
5 114.092
7060.198
1 11.8760209
835.389
7034.25
1 211.442005
847,671
4,009
7034.25
6 1% 21.93
553.997
57.624
895.472
22.125
1507.093
5 17.148
8883.207
1 10.81440642
895.472
8280.362
1 237.576109
819,400
3,449
8280.362
6 5 1 3.571
t and liablity management
C1 C2 C3
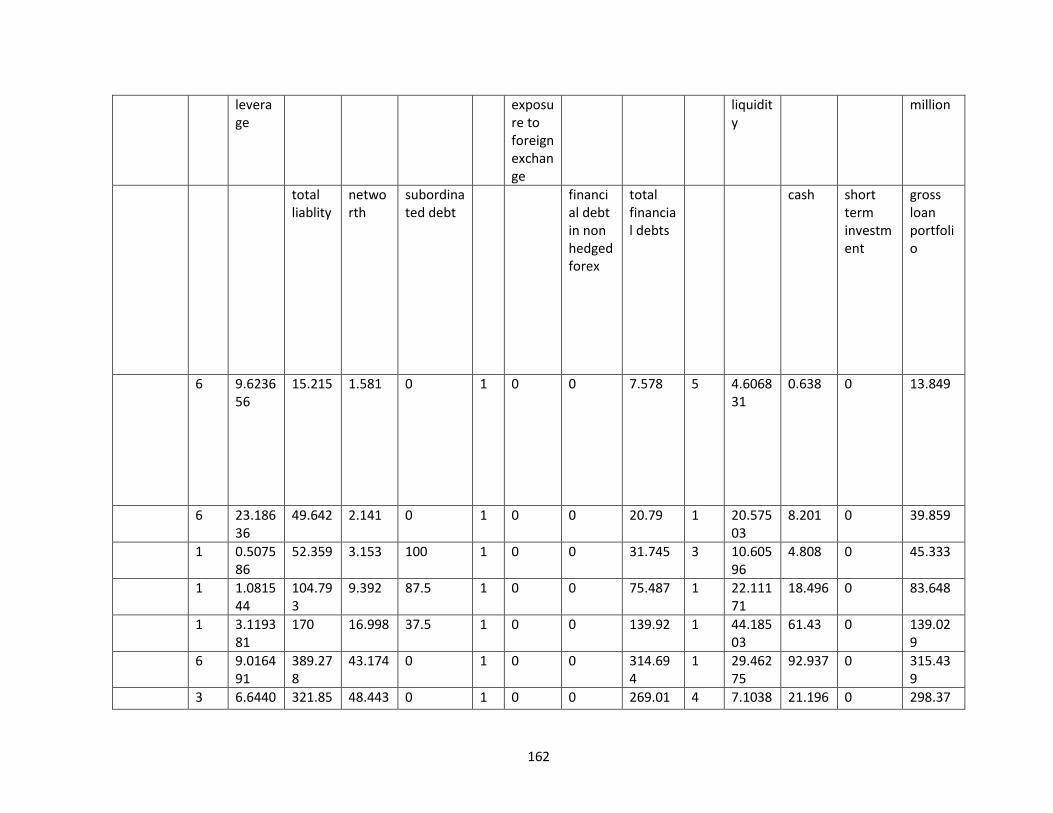
162
leverage
exposure to foreign exchange
liquidity
million
total liablity
networth
subordinated debt
financial debt in non hedged forex
total financial debts
cash short term investment
gross loan portfolio
6 9.623656
15.215 1.581 0 1 0 0 7.578 5 4.606831
0.638 0 13.849
6 23.18636
49.642 2.141 0 1 0 0 20.79 1 20.57503
8.201 0 39.859
1 0.507586
52.359 3.153 100 1 0 0 31.745 3 10.60596
4.808 0 45.333
1 1.081544
104.793
9.392 87.5 1 0 0 75.487 1 22.11171
18.496 0 83.648
1 3.119381
170 16.998 37.5 1 0 0 139.92 1 44.18503
61.43 0 139.029
6 9.016491
389.278
43.174 0 1 0 0 314.694
1 29.46275
92.937 0 315.439
3 6.6440 321.85 48.443 0 1 0 0 269.01 4 7.1038 21.196 0 298.37
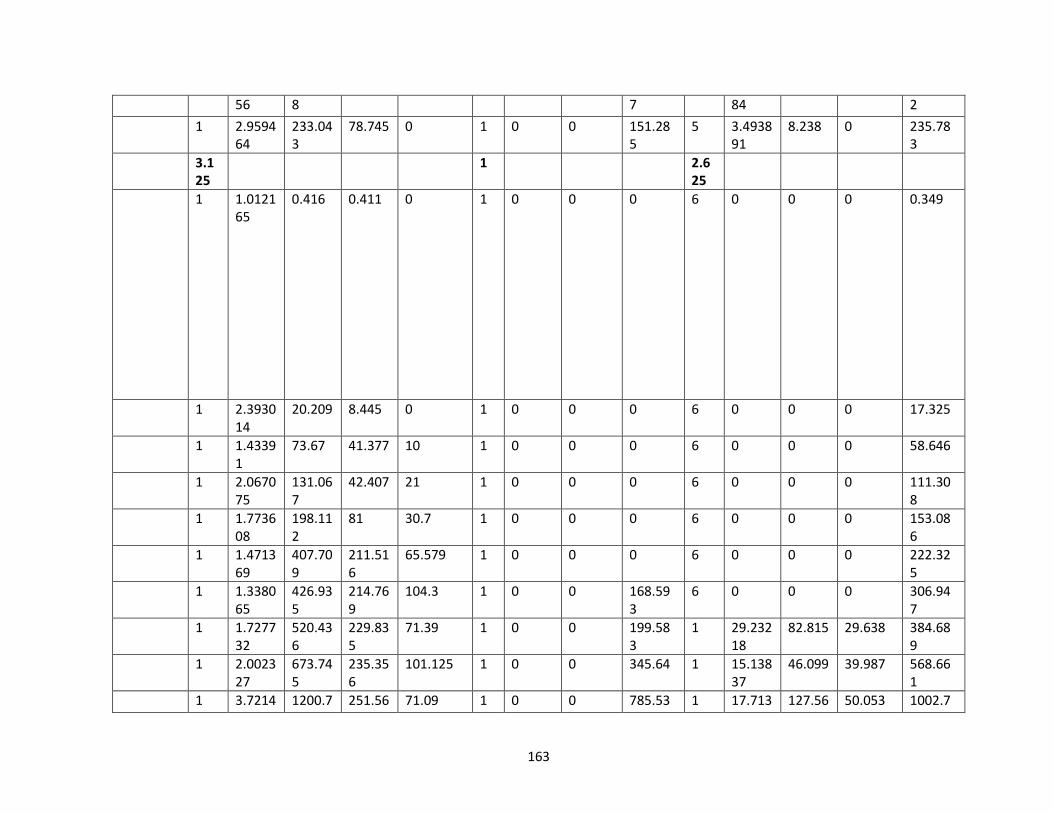
163
56 8 7 84 2
1 2.959464
233.043
78.745 0 1 0 0 151.285
5 3.493891
8.238 0 235.783
3.125
1 2.625
1 1.012165
0.416 0.411 0 1 0 0 0 6 0 0 0 0.349
1 2.393014
20.209 8.445 0 1 0 0 0 6 0 0 0 17.325
1 1.43391
73.67 41.377 10 1 0 0 0 6 0 0 0 58.646
1 2.067075
131.067
42.407 21 1 0 0 0 6 0 0 0 111.308
1 1.773608
198.112
81 30.7 1 0 0 0 6 0 0 0 153.086
1 1.471369
407.709
211.516
65.579 1 0 0 0 6 0 0 0 222.325
1 1.338065
426.935
214.769
104.3 1 0 0 168.593
6 0 0 0 306.947
1 1.727732
520.436
229.835
71.39 1 0 0 199.583
1 29.23218
82.815 29.638 384.689
1 2.002327
673.745
235.356
101.125 1 0 0 345.64 1 15.13837
46.099 39.987 568.661
1 3.7214 1200.7 251.56 71.09 1 0 0 785.53 1 17.713 127.56 50.053 1002.7
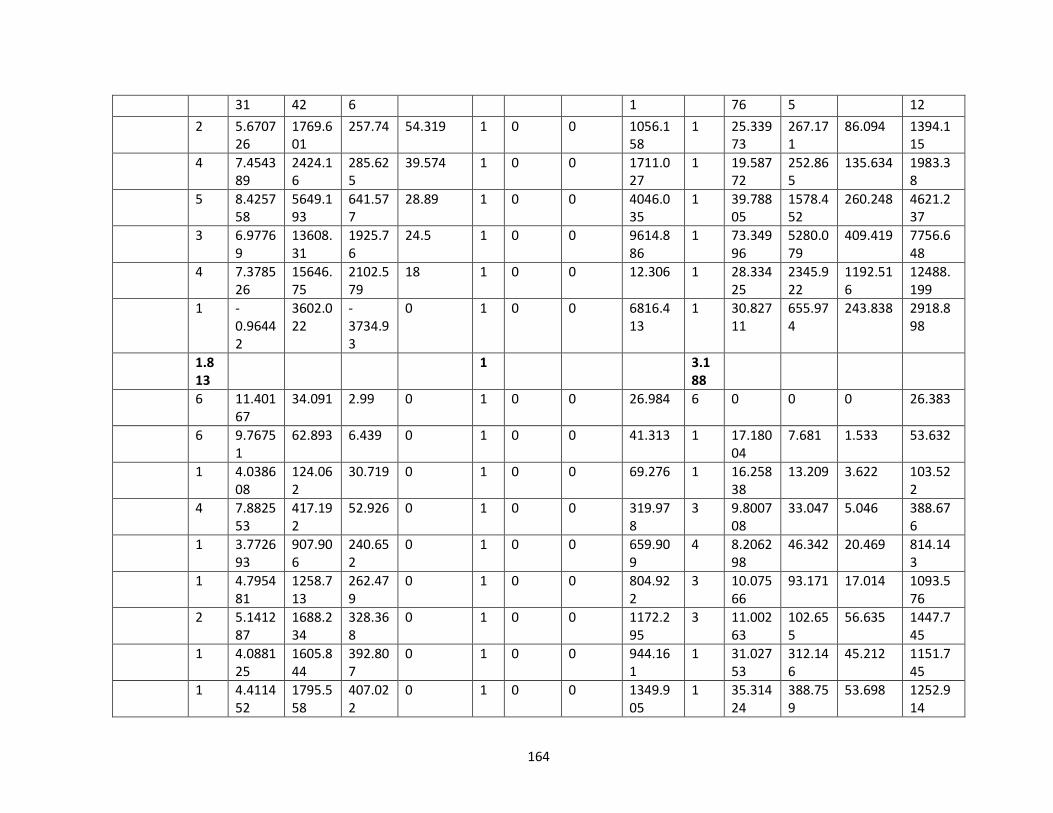
164
31 42 6 1 76 5 12
2 5.670726
1769.601
257.74 54.319 1 0 0 1056.158
1 25.33973
267.171
86.094 1394.115
4 7.454389
2424.16
285.625
39.574 1 0 0 1711.027
1 19.58772
252.865
135.634 1983.38
5 8.425758
5649.193
641.577
28.89 1 0 0 4046.035
1 39.78805
1578.452
260.248 4621.237
3 6.97769
13608.31
1925.76
24.5 1 0 0 9614.886
1 73.34996
5280.079
409.419 7756.648
4 7.378526
15646.75
2102.579
18 1 0 0 12.306 1 28.33425
2345.922
1192.516
12488.199
1 -0.96442
3602.022
-3734.93
0 1 0 0 6816.413
1 30.82711
655.974
243.838 2918.898
1.813
1 3.188
6 11.40167
34.091 2.99 0 1 0 0 26.984 6 0 0 0 26.383
6 9.76751
62.893 6.439 0 1 0 0 41.313 1 17.18004
7.681 1.533 53.632
1 4.038608
124.062
30.719 0 1 0 0 69.276 1 16.25838
13.209 3.622 103.522
4 7.882553
417.192
52.926 0 1 0 0 319.978
3 9.800708
33.047 5.046 388.676
1 3.772693
907.906
240.652
0 1 0 0 659.909
4 8.206298
46.342 20.469 814.143
1 4.795481
1258.713
262.479
0 1 0 0 804.922
3 10.07566
93.171 17.014 1093.576
2 5.141287
1688.234
328.368
0 1 0 0 1172.295
3 11.00263
102.655
56.635 1447.745
1 4.088125
1605.844
392.807
0 1 0 0 944.161
1 31.02753
312.146
45.212 1151.745
1 4.411452
1795.558
407.022
0 1 0 0 1349.905
1 35.31424
388.759
53.698 1252.914
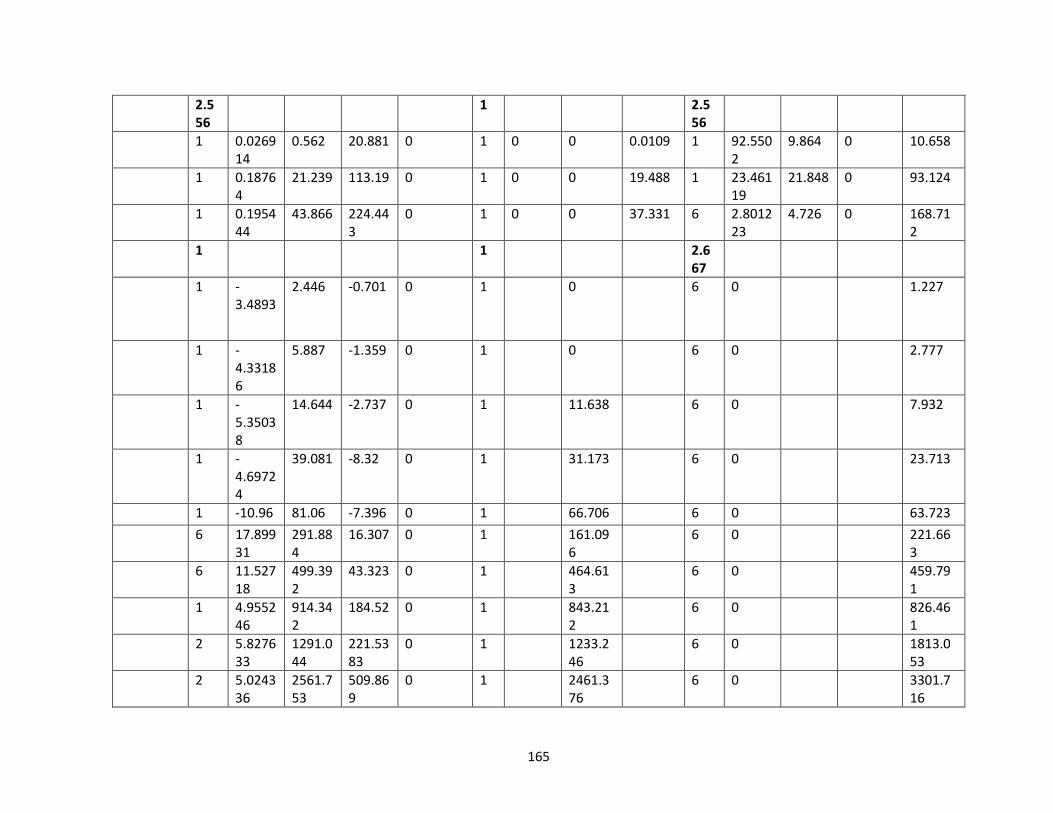
165
2.556
1 2.556
1 0.026914
0.562 20.881 0 1 0 0 0.0109 1 92.5502
9.864 0 10.658
1 0.18764
21.239 113.19 0 1 0 0 19.488 1 23.46119
21.848 0 93.124
1 0.195444
43.866 224.443
0 1 0 0 37.331 6 2.801223
4.726 0 168.712
1 1 2.667
1 -3.4893
2.446 -0.701 0 1 0 6 0 1.227
1 -4.33186
5.887 -1.359 0 1 0 6 0 2.777
1 -5.35038
14.644 -2.737 0 1 11.638 6 0 7.932
1 -4.69724
39.081 -8.32 0 1 31.173 6 0 23.713
1 -10.96 81.06 -7.396 0 1 66.706 6 0 63.723
6 17.89931
291.884
16.307 0 1 161.096
6 0 221.663
6 11.52718
499.392
43.323 0 1 464.613
6 0 459.791
1 4.955246
914.342
184.52 0 1 843.212
6 0 826.461
2 5.827633
1291.044
221.5383
0 1 1233.246
6 0 1813.053
2 5.024336
2561.753
509.869
0 1 2461.376
6 0 3301.716
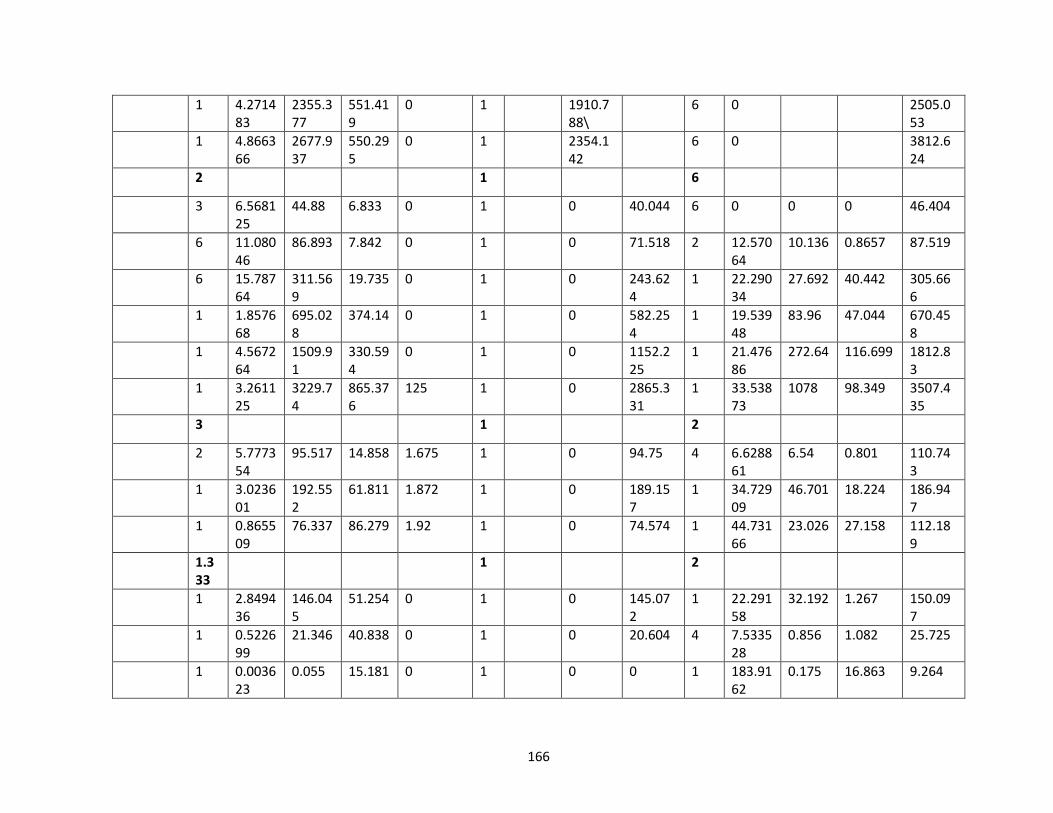
166
1 4.271483
2355.377
551.419
0 1 1910.788\
6 0 2505.053
1 4.866366
2677.937
550.295
0 1 2354.142
6 0 3812.624
2 1 6
3 6.568125
44.88 6.833 0 1 0 40.044 6 0 0 0 46.404
6 11.08046
86.893 7.842 0 1 0 71.518 2 12.57064
10.136 0.8657 87.519
6 15.78764
311.569
19.735 0 1 0 243.624
1 22.29034
27.692 40.442 305.666
1 1.857668
695.028
374.14 0 1 0 582.254
1 19.53948
83.96 47.044 670.458
1 4.567264
1509.91
330.594
0 1 0 1152.225
1 21.47686
272.64 116.699 1812.83
1 3.261125
3229.74
865.376
125 1 0 2865.331
1 33.53873
1078 98.349 3507.435
3 1 2
2 5.777354
95.517 14.858 1.675 1 0 94.75 4 6.628861
6.54 0.801 110.743
1 3.023601
192.552
61.811 1.872 1 0 189.157
1 34.72909
46.701 18.224 186.947
1 0.865509
76.337 86.279 1.92 1 0 74.574 1 44.73166
23.026 27.158 112.189
1.333
1 2
1 2.849436
146.045
51.254 0 1 0 145.072
1 22.29158
32.192 1.267 150.097
1 0.522699
21.346 40.838 0 1 0 20.604 4 7.533528
0.856 1.082 25.725
1 0.003623
0.055 15.181 0 1 0 0 1 183.9162
0.175 16.863 9.264

167
1 2
1 0.010623
0.0409 3.85 0 1 0 0 6 3.302 0 0
1 0.5844 28.891 49.437 0 1 0 26.25 5 3.08063
0.979 4.174 167.271
1 1.700789
80.83 47.525 0 1 0 78.801 1 16.66392
10.226 11.988 133.306
1 1 4
1 0.216188
6.194 28.651 0 1 0 4.638 1 16.21712
0.839 3.051 23.987
1 2.662709
229.198
86.077 0 1 0 206.447
2 14.96733
36.14 3.348 263.828
1 2.800817
248.987
88.898 0 1 0 220.765
2 12.49487
25.65 9.954 284.949
1 3.579068
322.27 90.043 0 1 0 317.991
2 14.23385
40.033 8.657 342.072
1 1 1.75
2 5.677211
857.713
151.08 0 1 589.867
1 18.19557
119.607
29.493 819.43
3 6.100515
1679.417
275.291
0 1 1186.984
4 7.316417
67.859 60.759 1757.937
6 11.68411
4007.791
343.012
0 1 2044.781
1 18.3186
512.372
158.487 3662.173
6 10.16123
4044.545
398.037
0 1 2,386,489
3 9.972723
213.164
185.393 3996.471
2 5.210214
6415.858
1231.4 0 1 5162737
1 24.57255
1384.03
112.278 6089.347
1 3.446347
10683.21
3099.866
0 1 9713.76
1 22.1721
2650.577
47.62 12169.332
1 4.630828
23021.82
3971.426
1000 1 20983 1 52.69 8574.524
348.74 16935.403
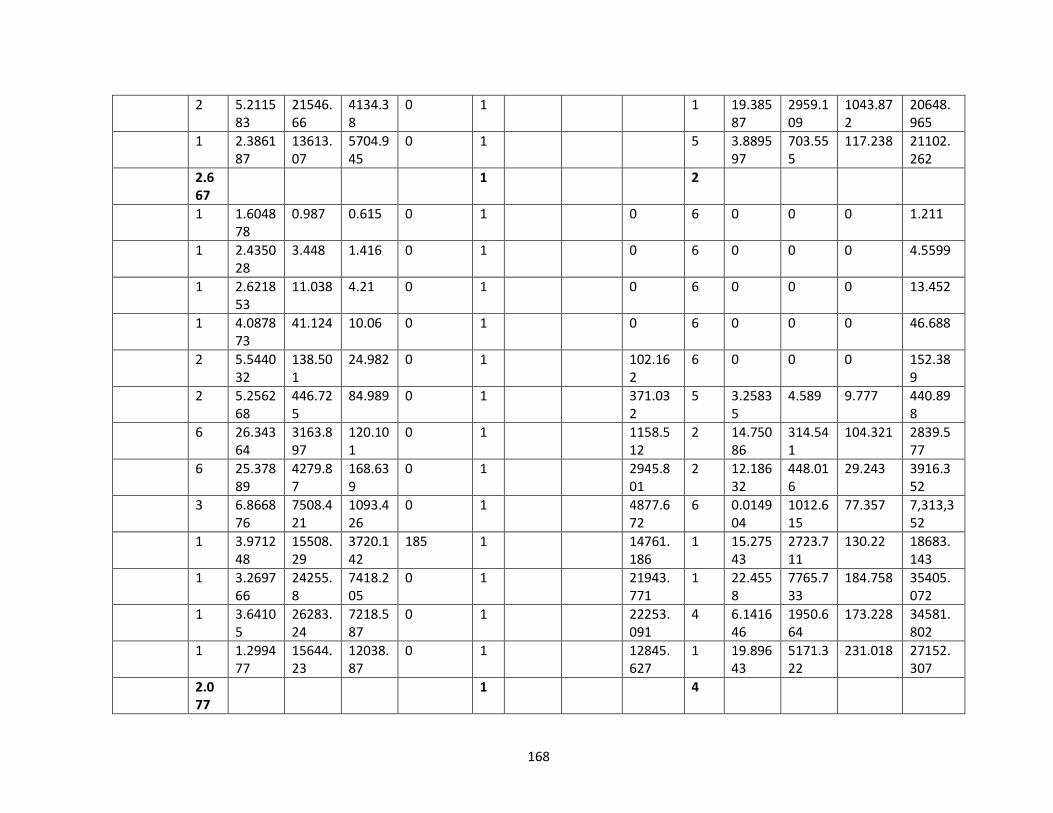
168
2 5.211583
21546.66
4134.38
0 1 1 19.38587
2959.109
1043.872
20648.965
1 2.386187
13613.07
5704.945
0 1 5 3.889597
703.555
117.238 21102.262
2.667
1 2
1 1.604878
0.987 0.615 0 1 0 6 0 0 0 1.211
1 2.435028
3.448 1.416 0 1 0 6 0 0 0 4.5599
1 2.621853
11.038 4.21 0 1 0 6 0 0 0 13.452
1 4.087873
41.124 10.06 0 1 0 6 0 0 0 46.688
2 5.544032
138.501
24.982 0 1 102.162
6 0 0 0 152.389
2 5.256268
446.725
84.989 0 1 371.032
5 3.25835
4.589 9.777 440.898
6 26.34364
3163.897
120.101
0 1 1158.512
2 14.75086
314.541
104.321 2839.577
6 25.37889
4279.87
168.639
0 1 2945.801
2 12.18632
448.016
29.243 3916.352
3 6.866876
7508.421
1093.426
0 1 4877.672
6 0.014904
1012.615
77.357 7,313,352
1 3.971248
15508.29
3720.142
185 1 14761.186
1 15.27543
2723.711
130.22 18683.143
1 3.269766
24255.8
7418.205
0 1 21943.771
1 22.4558
7765.733
184.758 35405.072
1 3.64105
26283.24
7218.587
0 1 22253.091
4 6.141646
1950.664
173.228 34581.802
1 1.299477
15644.23
12038.87
0 1 12845.627
1 19.89643
5171.322
231.018 27152.307
2.077
1 4
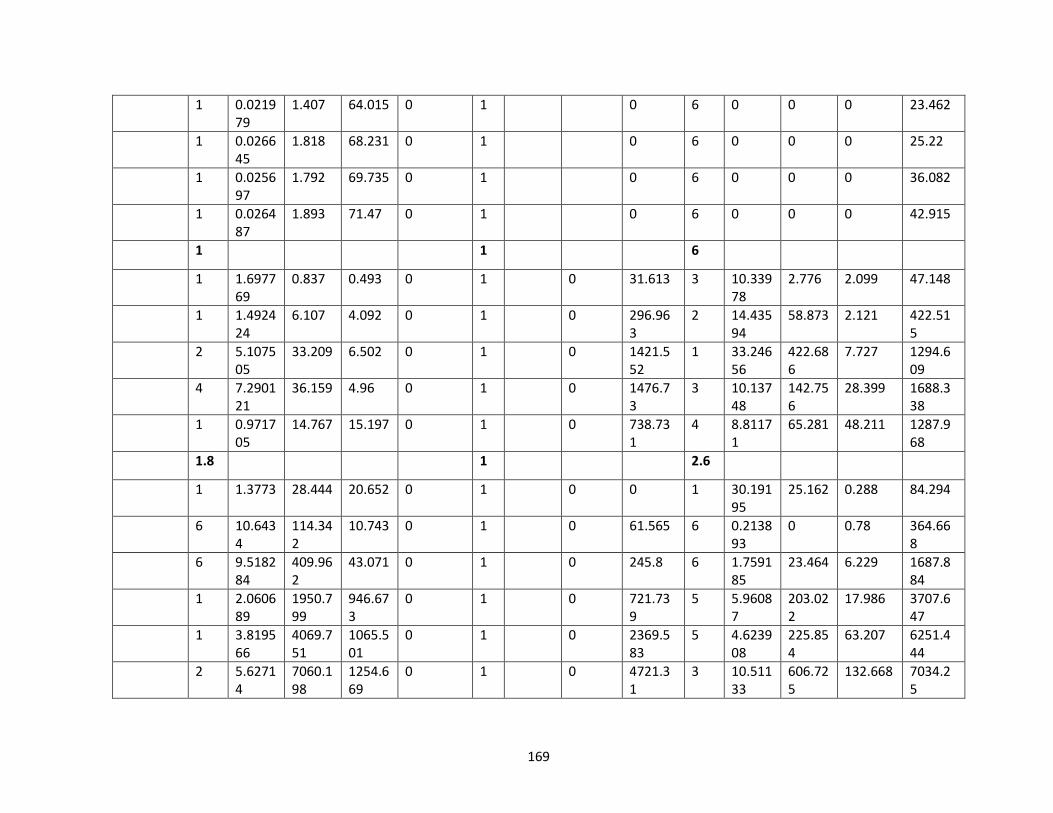
169
1 0.021979
1.407 64.015 0 1 0 6 0 0 0 23.462
1 0.026645
1.818 68.231 0 1 0 6 0 0 0 25.22
1 0.025697
1.792 69.735 0 1 0 6 0 0 0 36.082
1 0.026487
1.893 71.47 0 1 0 6 0 0 0 42.915
1 1 6
1 1.697769
0.837 0.493 0 1 0 31.613 3 10.33978
2.776 2.099 47.148
1 1.492424
6.107 4.092 0 1 0 296.963
2 14.43594
58.873 2.121 422.515
2 5.107505
33.209 6.502 0 1 0 1421.552
1 33.24656
422.686
7.727 1294.609
4 7.290121
36.159 4.96 0 1 0 1476.73
3 10.13748
142.756
28.399 1688.338
1 0.971705
14.767 15.197 0 1 0 738.731
4 8.81171
65.281 48.211 1287.968
1.8 1 2.6
1 1.3773 28.444 20.652 0 1 0 0 1 30.19195
25.162 0.288 84.294
6 10.6434
114.342
10.743 0 1 0 61.565 6 0.213893
0 0.78 364.668
6 9.518284
409.962
43.071 0 1 0 245.8 6 1.759185
23.464 6.229 1687.884
1 2.060689
1950.799
946.673
0 1 0 721.739
5 5.96087
203.022
17.986 3707.647
1 3.819566
4069.751
1065.501
0 1 0 2369.583
5 4.623908
225.854
63.207 6251.444
2 5.62714
7060.198
1254.669
0 1 0 4721.31
3 10.51133
606.725
132.668 7034.25
170
1 3.506635
8883.207
2533.257
0 1 0 6172.44
1 23.17355
1689.275
229.579 8280.362
2.571
1 3.857
Ssource: data taken from mixmarket.com
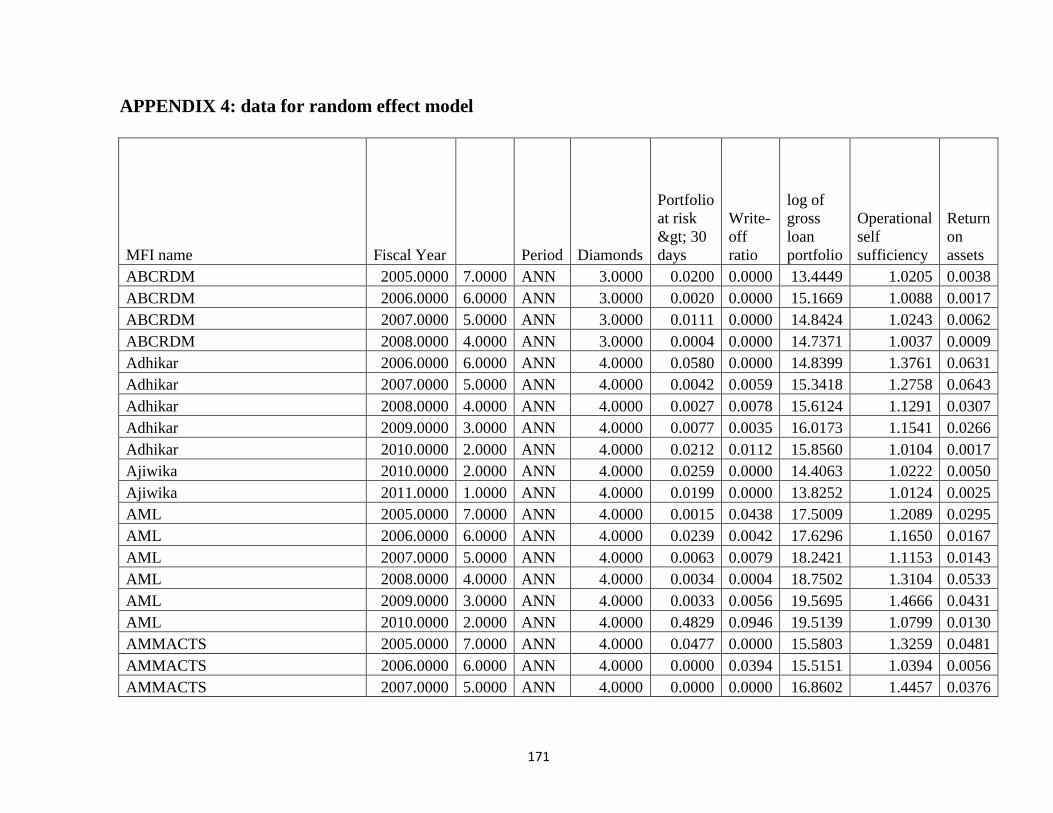
171
APPENDIX 4: data for random effect model
MFI name Fiscal Year Period Diamonds
Portfolio
at risk
> 30
days
Write-
off
ratio
log of
gross
loan
portfolio
Operational
self
sufficiency
Return
on
assets
ABCRDM 2005.0000 7.0000 ANN 3.0000 0.0200 0.0000 13.4449 1.0205 0.0038
ABCRDM 2006.0000 6.0000 ANN 3.0000 0.0020 0.0000 15.1669 1.0088 0.0017
ABCRDM 2007.0000 5.0000 ANN 3.0000 0.0111 0.0000 14.8424 1.0243 0.0062
ABCRDM 2008.0000 4.0000 ANN 3.0000 0.0004 0.0000 14.7371 1.0037 0.0009
Adhikar 2006.0000 6.0000 ANN 4.0000 0.0580 0.0000 14.8399 1.3761 0.0631
Adhikar 2007.0000 5.0000 ANN 4.0000 0.0042 0.0059 15.3418 1.2758 0.0643
Adhikar 2008.0000 4.0000 ANN 4.0000 0.0027 0.0078 15.6124 1.1291 0.0307
Adhikar 2009.0000 3.0000 ANN 4.0000 0.0077 0.0035 16.0173 1.1541 0.0266
Adhikar 2010.0000 2.0000 ANN 4.0000 0.0212 0.0112 15.8560 1.0104 0.0017
Ajiwika 2010.0000 2.0000 ANN 4.0000 0.0259 0.0000 14.4063 1.0222 0.0050
Ajiwika 2011.0000 1.0000 ANN 4.0000 0.0199 0.0000 13.8252 1.0124 0.0025
AML 2005.0000 7.0000 ANN 4.0000 0.0015 0.0438 17.5009 1.2089 0.0295
AML 2006.0000 6.0000 ANN 4.0000 0.0239 0.0042 17.6296 1.1650 0.0167
AML 2007.0000 5.0000 ANN 4.0000 0.0063 0.0079 18.2421 1.1153 0.0143
AML 2008.0000 4.0000 ANN 4.0000 0.0034 0.0004 18.7502 1.3104 0.0533
AML 2009.0000 3.0000 ANN 4.0000 0.0033 0.0056 19.5695 1.4666 0.0431
AML 2010.0000 2.0000 ANN 4.0000 0.4829 0.0946 19.5139 1.0799 0.0130
AMMACTS 2005.0000 7.0000 ANN 4.0000 0.0477 0.0000 15.5803 1.3259 0.0481
AMMACTS 2006.0000 6.0000 ANN 4.0000 0.0000 0.0394 15.5151 1.0394 0.0056
AMMACTS 2007.0000 5.0000 ANN 4.0000 0.0000 0.0000 16.8602 1.4457 0.0376
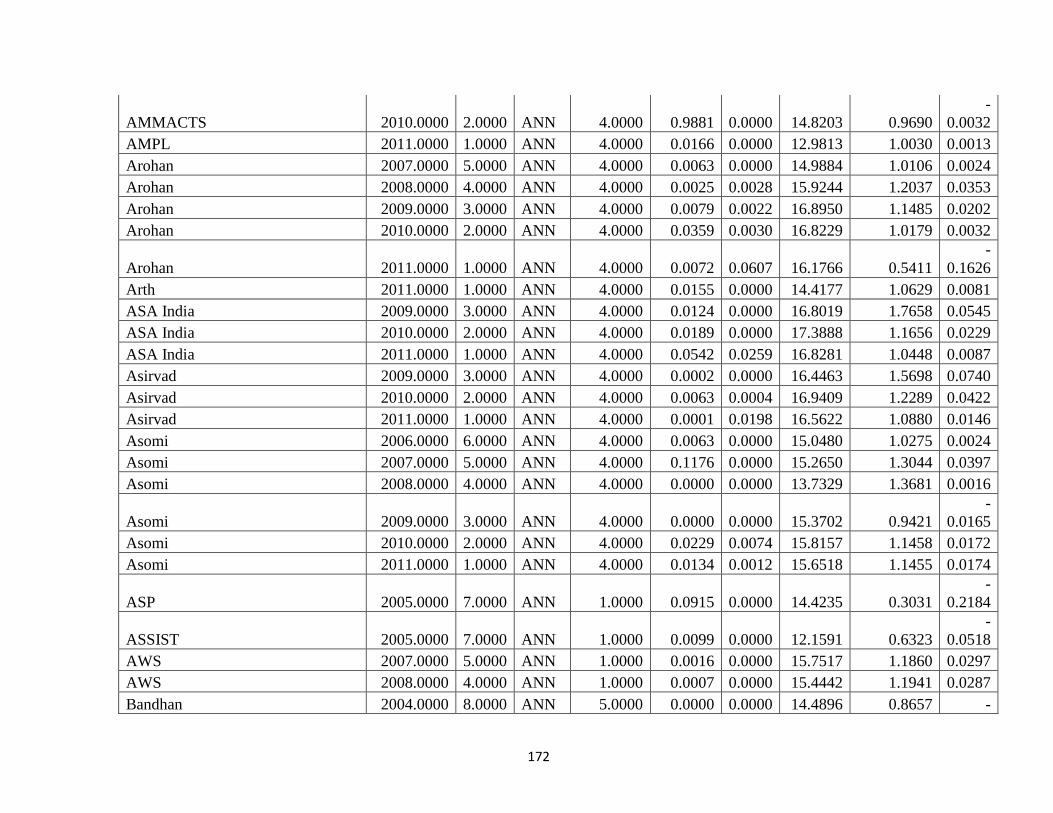
172
AMMACTS 2010.0000 2.0000 ANN 4.0000 0.9881 0.0000 14.8203 0.9690
-
0.0032
AMPL 2011.0000 1.0000 ANN 4.0000 0.0166 0.0000 12.9813 1.0030 0.0013
Arohan 2007.0000 5.0000 ANN 4.0000 0.0063 0.0000 14.9884 1.0106 0.0024
Arohan 2008.0000 4.0000 ANN 4.0000 0.0025 0.0028 15.9244 1.2037 0.0353
Arohan 2009.0000 3.0000 ANN 4.0000 0.0079 0.0022 16.8950 1.1485 0.0202
Arohan 2010.0000 2.0000 ANN 4.0000 0.0359 0.0030 16.8229 1.0179 0.0032
Arohan 2011.0000 1.0000 ANN 4.0000 0.0072 0.0607 16.1766 0.5411
-
0.1626
Arth 2011.0000 1.0000 ANN 4.0000 0.0155 0.0000 14.4177 1.0629 0.0081
ASA India 2009.0000 3.0000 ANN 4.0000 0.0124 0.0000 16.8019 1.7658 0.0545
ASA India 2010.0000 2.0000 ANN 4.0000 0.0189 0.0000 17.3888 1.1656 0.0229
ASA India 2011.0000 1.0000 ANN 4.0000 0.0542 0.0259 16.8281 1.0448 0.0087
Asirvad 2009.0000 3.0000 ANN 4.0000 0.0002 0.0000 16.4463 1.5698 0.0740
Asirvad 2010.0000 2.0000 ANN 4.0000 0.0063 0.0004 16.9409 1.2289 0.0422
Asirvad 2011.0000 1.0000 ANN 4.0000 0.0001 0.0198 16.5622 1.0880 0.0146
Asomi 2006.0000 6.0000 ANN 4.0000 0.0063 0.0000 15.0480 1.0275 0.0024
Asomi 2007.0000 5.0000 ANN 4.0000 0.1176 0.0000 15.2650 1.3044 0.0397
Asomi 2008.0000 4.0000 ANN 4.0000 0.0000 0.0000 13.7329 1.3681 0.0016
Asomi 2009.0000 3.0000 ANN 4.0000 0.0000 0.0000 15.3702 0.9421
-
0.0165
Asomi 2010.0000 2.0000 ANN 4.0000 0.0229 0.0074 15.8157 1.1458 0.0172
Asomi 2011.0000 1.0000 ANN 4.0000 0.0134 0.0012 15.6518 1.1455 0.0174
ASP 2005.0000 7.0000 ANN 1.0000 0.0915 0.0000 14.4235 0.3031
-
0.2184
ASSIST 2005.0000 7.0000 ANN 1.0000 0.0099 0.0000 12.1591 0.6323
-
0.0518
AWS 2007.0000 5.0000 ANN 1.0000 0.0016 0.0000 15.7517 1.1860 0.0297
AWS 2008.0000 4.0000 ANN 1.0000 0.0007 0.0000 15.4442 1.1941 0.0287
Bandhan 2004.0000 8.0000 ANN 5.0000 0.0000 0.0000 14.4896 0.8657 -
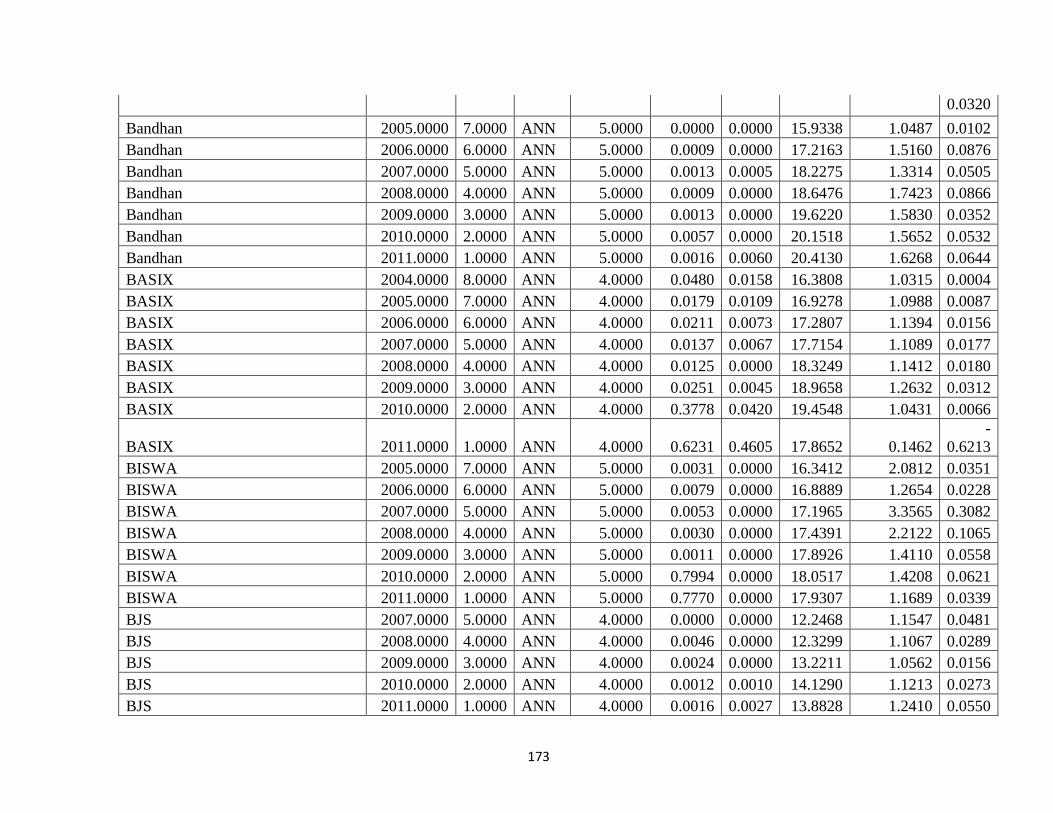
173
0.0320
Bandhan 2005.0000 7.0000 ANN 5.0000 0.0000 0.0000 15.9338 1.0487 0.0102
Bandhan 2006.0000 6.0000 ANN 5.0000 0.0009 0.0000 17.2163 1.5160 0.0876
Bandhan 2007.0000 5.0000 ANN 5.0000 0.0013 0.0005 18.2275 1.3314 0.0505
Bandhan 2008.0000 4.0000 ANN 5.0000 0.0009 0.0000 18.6476 1.7423 0.0866
Bandhan 2009.0000 3.0000 ANN 5.0000 0.0013 0.0000 19.6220 1.5830 0.0352
Bandhan 2010.0000 2.0000 ANN 5.0000 0.0057 0.0000 20.1518 1.5652 0.0532
Bandhan 2011.0000 1.0000 ANN 5.0000 0.0016 0.0060 20.4130 1.6268 0.0644
BASIX 2004.0000 8.0000 ANN 4.0000 0.0480 0.0158 16.3808 1.0315 0.0004
BASIX 2005.0000 7.0000 ANN 4.0000 0.0179 0.0109 16.9278 1.0988 0.0087
BASIX 2006.0000 6.0000 ANN 4.0000 0.0211 0.0073 17.2807 1.1394 0.0156
BASIX 2007.0000 5.0000 ANN 4.0000 0.0137 0.0067 17.7154 1.1089 0.0177
BASIX 2008.0000 4.0000 ANN 4.0000 0.0125 0.0000 18.3249 1.1412 0.0180
BASIX 2009.0000 3.0000 ANN 4.0000 0.0251 0.0045 18.9658 1.2632 0.0312
BASIX 2010.0000 2.0000 ANN 4.0000 0.3778 0.0420 19.4548 1.0431 0.0066
BASIX 2011.0000 1.0000 ANN 4.0000 0.6231 0.4605 17.8652 0.1462
-
0.6213
BISWA 2005.0000 7.0000 ANN 5.0000 0.0031 0.0000 16.3412 2.0812 0.0351
BISWA 2006.0000 6.0000 ANN 5.0000 0.0079 0.0000 16.8889 1.2654 0.0228
BISWA 2007.0000 5.0000 ANN 5.0000 0.0053 0.0000 17.1965 3.3565 0.3082
BISWA 2008.0000 4.0000 ANN 5.0000 0.0030 0.0000 17.4391 2.2122 0.1065
BISWA 2009.0000 3.0000 ANN 5.0000 0.0011 0.0000 17.8926 1.4110 0.0558
BISWA 2010.0000 2.0000 ANN 5.0000 0.7994 0.0000 18.0517 1.4208 0.0621
BISWA 2011.0000 1.0000 ANN 5.0000 0.7770 0.0000 17.9307 1.1689 0.0339
BJS 2007.0000 5.0000 ANN 4.0000 0.0000 0.0000 12.2468 1.1547 0.0481
BJS 2008.0000 4.0000 ANN 4.0000 0.0046 0.0000 12.3299 1.1067 0.0289
BJS 2009.0000 3.0000 ANN 4.0000 0.0024 0.0000 13.2211 1.0562 0.0156
BJS 2010.0000 2.0000 ANN 4.0000 0.0012 0.0010 14.1290 1.1213 0.0273
BJS 2011.0000 1.0000 ANN 4.0000 0.0016 0.0027 13.8828 1.2410 0.0550
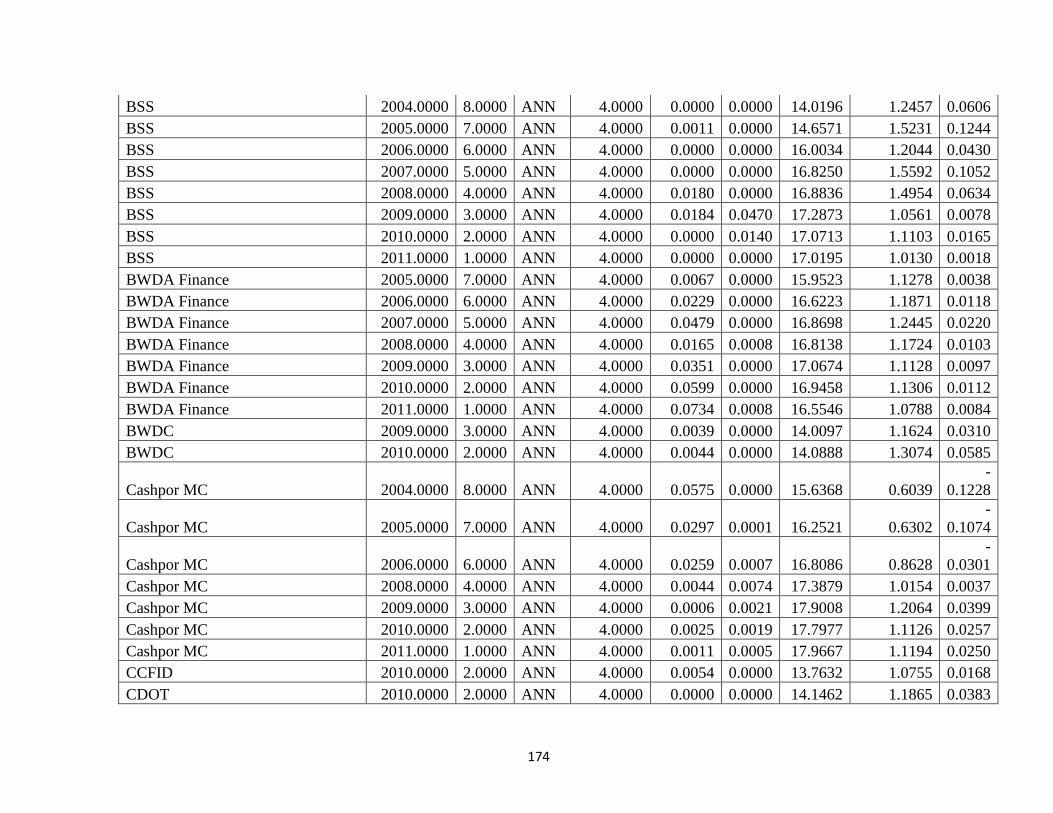
174
BSS 2004.0000 8.0000 ANN 4.0000 0.0000 0.0000 14.0196 1.2457 0.0606
BSS 2005.0000 7.0000 ANN 4.0000 0.0011 0.0000 14.6571 1.5231 0.1244
BSS 2006.0000 6.0000 ANN 4.0000 0.0000 0.0000 16.0034 1.2044 0.0430
BSS 2007.0000 5.0000 ANN 4.0000 0.0000 0.0000 16.8250 1.5592 0.1052
BSS 2008.0000 4.0000 ANN 4.0000 0.0180 0.0000 16.8836 1.4954 0.0634
BSS 2009.0000 3.0000 ANN 4.0000 0.0184 0.0470 17.2873 1.0561 0.0078
BSS 2010.0000 2.0000 ANN 4.0000 0.0000 0.0140 17.0713 1.1103 0.0165
BSS 2011.0000 1.0000 ANN 4.0000 0.0000 0.0000 17.0195 1.0130 0.0018
BWDA Finance 2005.0000 7.0000 ANN 4.0000 0.0067 0.0000 15.9523 1.1278 0.0038
BWDA Finance 2006.0000 6.0000 ANN 4.0000 0.0229 0.0000 16.6223 1.1871 0.0118
BWDA Finance 2007.0000 5.0000 ANN 4.0000 0.0479 0.0000 16.8698 1.2445 0.0220
BWDA Finance 2008.0000 4.0000 ANN 4.0000 0.0165 0.0008 16.8138 1.1724 0.0103
BWDA Finance 2009.0000 3.0000 ANN 4.0000 0.0351 0.0000 17.0674 1.1128 0.0097
BWDA Finance 2010.0000 2.0000 ANN 4.0000 0.0599 0.0000 16.9458 1.1306 0.0112
BWDA Finance 2011.0000 1.0000 ANN 4.0000 0.0734 0.0008 16.5546 1.0788 0.0084
BWDC 2009.0000 3.0000 ANN 4.0000 0.0039 0.0000 14.0097 1.1624 0.0310
BWDC 2010.0000 2.0000 ANN 4.0000 0.0044 0.0000 14.0888 1.3074 0.0585
Cashpor MC 2004.0000 8.0000 ANN 4.0000 0.0575 0.0000 15.6368 0.6039
-
0.1228
Cashpor MC 2005.0000 7.0000 ANN 4.0000 0.0297 0.0001 16.2521 0.6302
-
0.1074
Cashpor MC 2006.0000 6.0000 ANN 4.0000 0.0259 0.0007 16.8086 0.8628
-
0.0301
Cashpor MC 2008.0000 4.0000 ANN 4.0000 0.0044 0.0074 17.3879 1.0154 0.0037
Cashpor MC 2009.0000 3.0000 ANN 4.0000 0.0006 0.0021 17.9008 1.2064 0.0399
Cashpor MC 2010.0000 2.0000 ANN 4.0000 0.0025 0.0019 17.7977 1.1126 0.0257
Cashpor MC 2011.0000 1.0000 ANN 4.0000 0.0011 0.0005 17.9667 1.1194 0.0250
CCFID 2010.0000 2.0000 ANN 4.0000 0.0054 0.0000 13.7632 1.0755 0.0168
CDOT 2010.0000 2.0000 ANN 4.0000 0.0000 0.0000 14.1462 1.1865 0.0383
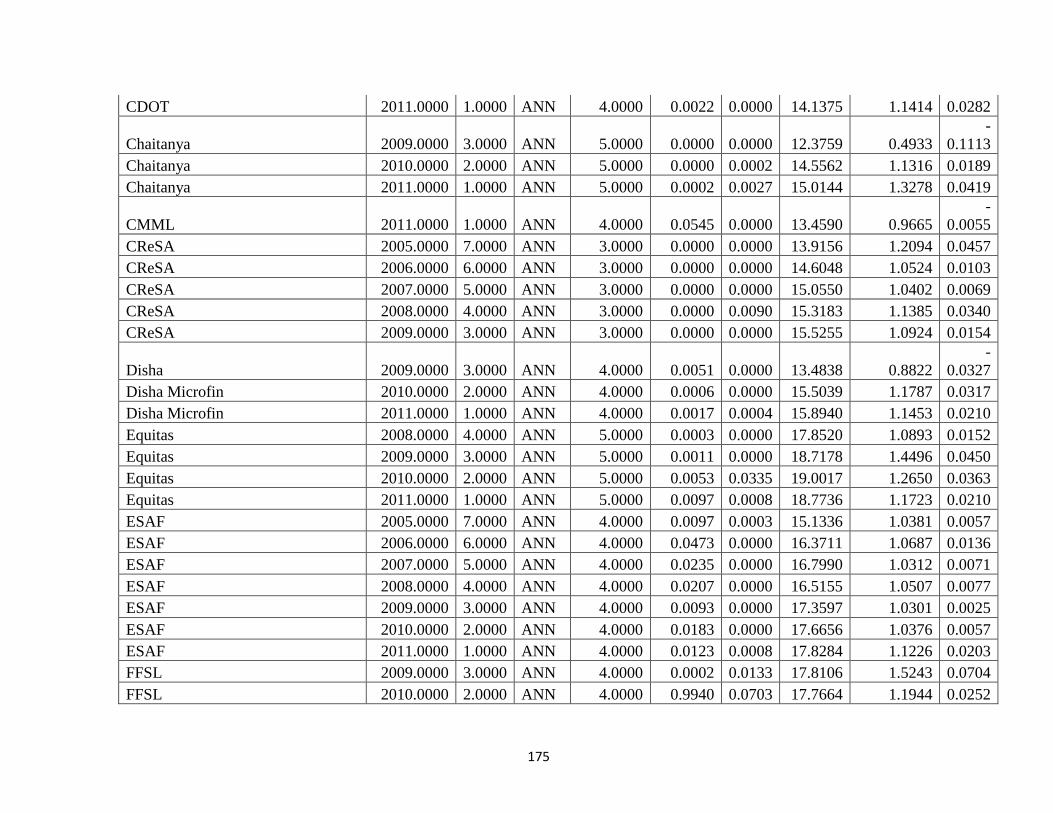
175
CDOT 2011.0000 1.0000 ANN 4.0000 0.0022 0.0000 14.1375 1.1414 0.0282
Chaitanya 2009.0000 3.0000 ANN 5.0000 0.0000 0.0000 12.3759 0.4933
-
0.1113
Chaitanya 2010.0000 2.0000 ANN 5.0000 0.0000 0.0002 14.5562 1.1316 0.0189
Chaitanya 2011.0000 1.0000 ANN 5.0000 0.0002 0.0027 15.0144 1.3278 0.0419
CMML 2011.0000 1.0000 ANN 4.0000 0.0545 0.0000 13.4590 0.9665
-
0.0055
CReSA 2005.0000 7.0000 ANN 3.0000 0.0000 0.0000 13.9156 1.2094 0.0457
CReSA 2006.0000 6.0000 ANN 3.0000 0.0000 0.0000 14.6048 1.0524 0.0103
CReSA 2007.0000 5.0000 ANN 3.0000 0.0000 0.0000 15.0550 1.0402 0.0069
CReSA 2008.0000 4.0000 ANN 3.0000 0.0000 0.0090 15.3183 1.1385 0.0340
CReSA 2009.0000 3.0000 ANN 3.0000 0.0000 0.0000 15.5255 1.0924 0.0154
Disha 2009.0000 3.0000 ANN 4.0000 0.0051 0.0000 13.4838 0.8822
-
0.0327
Disha Microfin 2010.0000 2.0000 ANN 4.0000 0.0006 0.0000 15.5039 1.1787 0.0317
Disha Microfin 2011.0000 1.0000 ANN 4.0000 0.0017 0.0004 15.8940 1.1453 0.0210
Equitas 2008.0000 4.0000 ANN 5.0000 0.0003 0.0000 17.8520 1.0893 0.0152
Equitas 2009.0000 3.0000 ANN 5.0000 0.0011 0.0000 18.7178 1.4496 0.0450
Equitas 2010.0000 2.0000 ANN 5.0000 0.0053 0.0335 19.0017 1.2650 0.0363
Equitas 2011.0000 1.0000 ANN 5.0000 0.0097 0.0008 18.7736 1.1723 0.0210
ESAF 2005.0000 7.0000 ANN 4.0000 0.0097 0.0003 15.1336 1.0381 0.0057
ESAF 2006.0000 6.0000 ANN 4.0000 0.0473 0.0000 16.3711 1.0687 0.0136
ESAF 2007.0000 5.0000 ANN 4.0000 0.0235 0.0000 16.7990 1.0312 0.0071
ESAF 2008.0000 4.0000 ANN 4.0000 0.0207 0.0000 16.5155 1.0507 0.0077
ESAF 2009.0000 3.0000 ANN 4.0000 0.0093 0.0000 17.3597 1.0301 0.0025
ESAF 2010.0000 2.0000 ANN 4.0000 0.0183 0.0000 17.6656 1.0376 0.0057
ESAF 2011.0000 1.0000 ANN 4.0000 0.0123 0.0008 17.8284 1.1226 0.0203
FFSL 2009.0000 3.0000 ANN 4.0000 0.0002 0.0133 17.8106 1.5243 0.0704
FFSL 2010.0000 2.0000 ANN 4.0000 0.9940 0.0703 17.7664 1.1944 0.0252
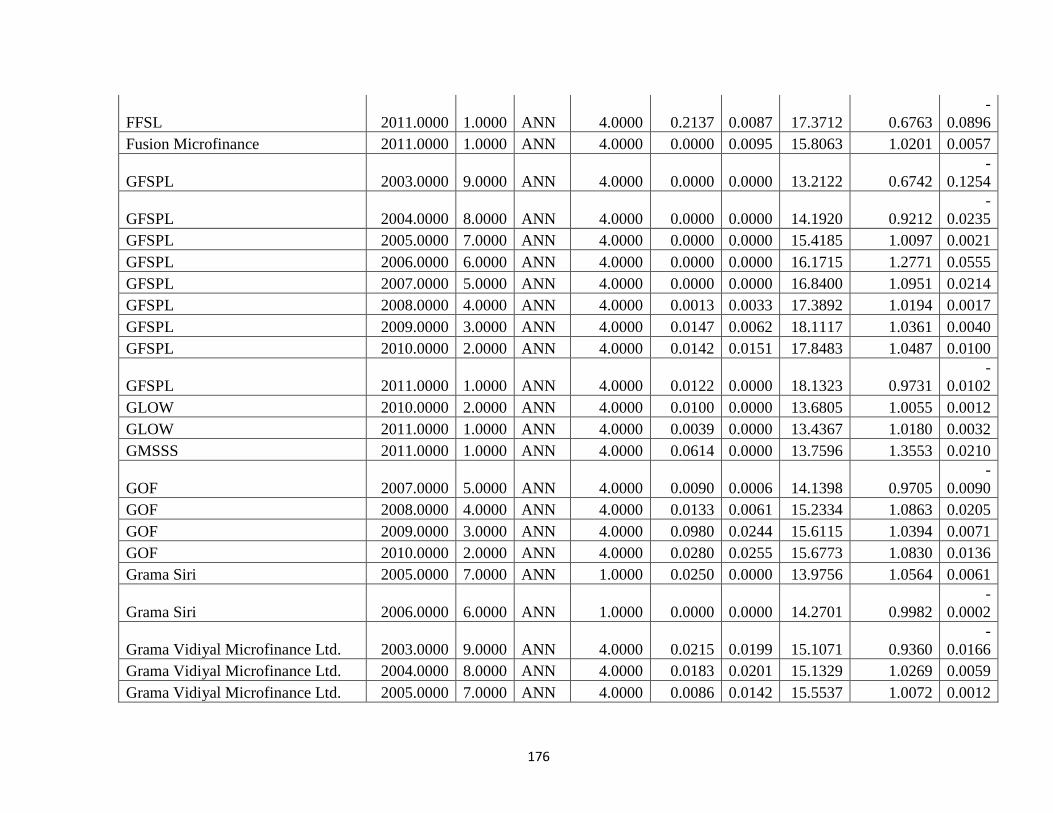
176
FFSL 2011.0000 1.0000 ANN 4.0000 0.2137 0.0087 17.3712 0.6763
-
0.0896
Fusion Microfinance 2011.0000 1.0000 ANN 4.0000 0.0000 0.0095 15.8063 1.0201 0.0057
GFSPL 2003.0000 9.0000 ANN 4.0000 0.0000 0.0000 13.2122 0.6742
-
0.1254
GFSPL 2004.0000 8.0000 ANN 4.0000 0.0000 0.0000 14.1920 0.9212
-
0.0235
GFSPL 2005.0000 7.0000 ANN 4.0000 0.0000 0.0000 15.4185 1.0097 0.0021
GFSPL 2006.0000 6.0000 ANN 4.0000 0.0000 0.0000 16.1715 1.2771 0.0555
GFSPL 2007.0000 5.0000 ANN 4.0000 0.0000 0.0000 16.8400 1.0951 0.0214
GFSPL 2008.0000 4.0000 ANN 4.0000 0.0013 0.0033 17.3892 1.0194 0.0017
GFSPL 2009.0000 3.0000 ANN 4.0000 0.0147 0.0062 18.1117 1.0361 0.0040
GFSPL 2010.0000 2.0000 ANN 4.0000 0.0142 0.0151 17.8483 1.0487 0.0100
GFSPL 2011.0000 1.0000 ANN 4.0000 0.0122 0.0000 18.1323 0.9731
-
0.0102
GLOW 2010.0000 2.0000 ANN 4.0000 0.0100 0.0000 13.6805 1.0055 0.0012
GLOW 2011.0000 1.0000 ANN 4.0000 0.0039 0.0000 13.4367 1.0180 0.0032
GMSSS 2011.0000 1.0000 ANN 4.0000 0.0614 0.0000 13.7596 1.3553 0.0210
GOF 2007.0000 5.0000 ANN 4.0000 0.0090 0.0006 14.1398 0.9705
-
0.0090
GOF 2008.0000 4.0000 ANN 4.0000 0.0133 0.0061 15.2334 1.0863 0.0205
GOF 2009.0000 3.0000 ANN 4.0000 0.0980 0.0244 15.6115 1.0394 0.0071
GOF 2010.0000 2.0000 ANN 4.0000 0.0280 0.0255 15.6773 1.0830 0.0136
Grama Siri 2005.0000 7.0000 ANN 1.0000 0.0250 0.0000 13.9756 1.0564 0.0061
Grama Siri 2006.0000 6.0000 ANN 1.0000 0.0000 0.0000 14.2701 0.9982
-
0.0002
Grama Vidiyal Microfinance Ltd. 2003.0000 9.0000 ANN 4.0000 0.0215 0.0199 15.1071 0.9360
-
0.0166
Grama Vidiyal Microfinance Ltd. 2004.0000 8.0000 ANN 4.0000 0.0183 0.0201 15.1329 1.0269 0.0059
Grama Vidiyal Microfinance Ltd. 2005.0000 7.0000 ANN 4.0000 0.0086 0.0142 15.5537 1.0072 0.0012
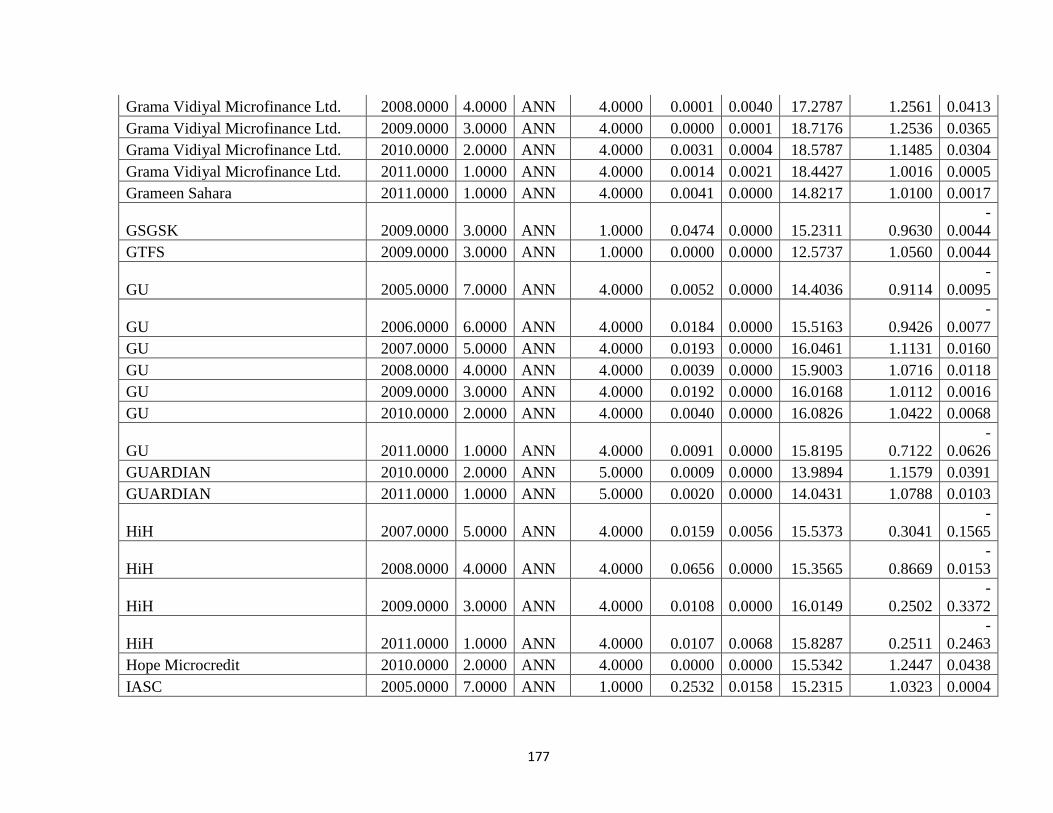
177
Grama Vidiyal Microfinance Ltd. 2008.0000 4.0000 ANN 4.0000 0.0001 0.0040 17.2787 1.2561 0.0413
Grama Vidiyal Microfinance Ltd. 2009.0000 3.0000 ANN 4.0000 0.0000 0.0001 18.7176 1.2536 0.0365
Grama Vidiyal Microfinance Ltd. 2010.0000 2.0000 ANN 4.0000 0.0031 0.0004 18.5787 1.1485 0.0304
Grama Vidiyal Microfinance Ltd. 2011.0000 1.0000 ANN 4.0000 0.0014 0.0021 18.4427 1.0016 0.0005
Grameen Sahara 2011.0000 1.0000 ANN 4.0000 0.0041 0.0000 14.8217 1.0100 0.0017
GSGSK 2009.0000 3.0000 ANN 1.0000 0.0474 0.0000 15.2311 0.9630
-
0.0044
GTFS 2009.0000 3.0000 ANN 1.0000 0.0000 0.0000 12.5737 1.0560 0.0044
GU 2005.0000 7.0000 ANN 4.0000 0.0052 0.0000 14.4036 0.9114
-
0.0095
GU 2006.0000 6.0000 ANN 4.0000 0.0184 0.0000 15.5163 0.9426
-
0.0077
GU 2007.0000 5.0000 ANN 4.0000 0.0193 0.0000 16.0461 1.1131 0.0160
GU 2008.0000 4.0000 ANN 4.0000 0.0039 0.0000 15.9003 1.0716 0.0118
GU 2009.0000 3.0000 ANN 4.0000 0.0192 0.0000 16.0168 1.0112 0.0016
GU 2010.0000 2.0000 ANN 4.0000 0.0040 0.0000 16.0826 1.0422 0.0068
GU 2011.0000 1.0000 ANN 4.0000 0.0091 0.0000 15.8195 0.7122
-
0.0626
GUARDIAN 2010.0000 2.0000 ANN 5.0000 0.0009 0.0000 13.9894 1.1579 0.0391
GUARDIAN 2011.0000 1.0000 ANN 5.0000 0.0020 0.0000 14.0431 1.0788 0.0103
HiH 2007.0000 5.0000 ANN 4.0000 0.0159 0.0056 15.5373 0.3041
-
0.1565
HiH 2008.0000 4.0000 ANN 4.0000 0.0656 0.0000 15.3565 0.8669
-
0.0153
HiH 2009.0000 3.0000 ANN 4.0000 0.0108 0.0000 16.0149 0.2502
-
0.3372
HiH 2011.0000 1.0000 ANN 4.0000 0.0107 0.0068 15.8287 0.2511
-
0.2463
Hope Microcredit 2010.0000 2.0000 ANN 4.0000 0.0000 0.0000 15.5342 1.2447 0.0438
IASC 2005.0000 7.0000 ANN 1.0000 0.2532 0.0158 15.2315 1.0323 0.0004

178
IASC 2006.0000 6.0000 ANN 1.0000 0.2093 0.0278 15.2804 1.0698 0.0011
ICNW 2009.0000 3.0000 ANN 4.0000 0.1935 0.0000 14.6440 1.2345 0.0243
ICNW 2010.0000 2.0000 ANN 4.0000 0.2483 0.0145 15.1336 1.2132 0.0255
ICNW 2011.0000 1.0000 ANN 4.0000 0.2226 0.0348 14.8233 1.2254 0.0276
IDF Financial Services 2008.0000 4.0000 ANN 4.0000 0.0132 0.0000 15.7701 1.0216 0.0030
IDF Financial Services 2009.0000 3.0000 ANN 4.0000 0.0333 0.0068 16.3759 1.2525 0.0293
IDF Financial Services 2010.0000 2.0000 ANN 4.0000 0.0305 0.0105 16.6037 1.0424 0.0044
IDF Financial Services 2011.0000 1.0000 ANN 4.0000 0.0647 0.0216 16.1848 1.0664 0.0076
India's Capital Trust Ltd 2009.0000 3.0000 ANN 4.0000 0.9607 0.1599 14.8684 1.0700 0.0184
India's Capital Trust Ltd 2010.0000 2.0000 ANN 4.0000 0.0016 0.0000 15.1571 1.0887 0.0278
Indur MACS 2008.0000 4.0000 ANN 4.0000 0.0000 0.0000 14.9668 1.1313 0.0189
Indur MACS 2009.0000 3.0000 ANN 4.0000 0.0000 0.0000 15.3047 0.9463
-
0.0076
Indur MACS 2010.0000 2.0000 ANN 4.0000 0.0827 0.0000 14.8768 0.9549
-
0.0089
IRCED 2011.0000 1.0000 ANN 4.0000 0.0000 0.0000 12.6433 0.9087
-
0.0130
Janalakshmi Financial Services Pvt.
Ltd. 2005.0000 7.0000 ANN 4.0000 0.0631 0.0000 14.4892 1.2433 0.0428
Janalakshmi Financial Services Pvt.
Ltd. 2009.0000 3.0000 ANN 4.0000 0.0057 0.0000 16.5175 0.8646
-
0.0305
Janalakshmi Financial Services Pvt.
Ltd. 2010.0000 2.0000 ANN 4.0000 0.0163 0.0264 17.5249 0.9563
-
0.0138
Janalakshmi Financial Services Pvt.
Ltd. 2011.0000 1.0000 ANN 4.0000 0.0103 0.0067 18.0489 1.0175 0.0041
Janodaya 2008.0000 4.0000 ANN 3.0000 0.0069 0.0185 14.7616 1.2348 0.0441
Janodaya 2009.0000 3.0000 ANN 3.0000 0.2501 0.0000 14.2575 1.0387 0.0087
JFSL 2005.0000 7.0000 ANN 1.0000 0.0458 0.0000 16.6065 1.2372 0.0171
JFSL 2006.0000 6.0000 ANN 1.0000 0.0729 0.0000 17.1389 1.2779 0.0210
JFSL 2007.0000 5.0000 ANN 1.0000 0.0911 0.0041 16.8565 1.0192 0.0034
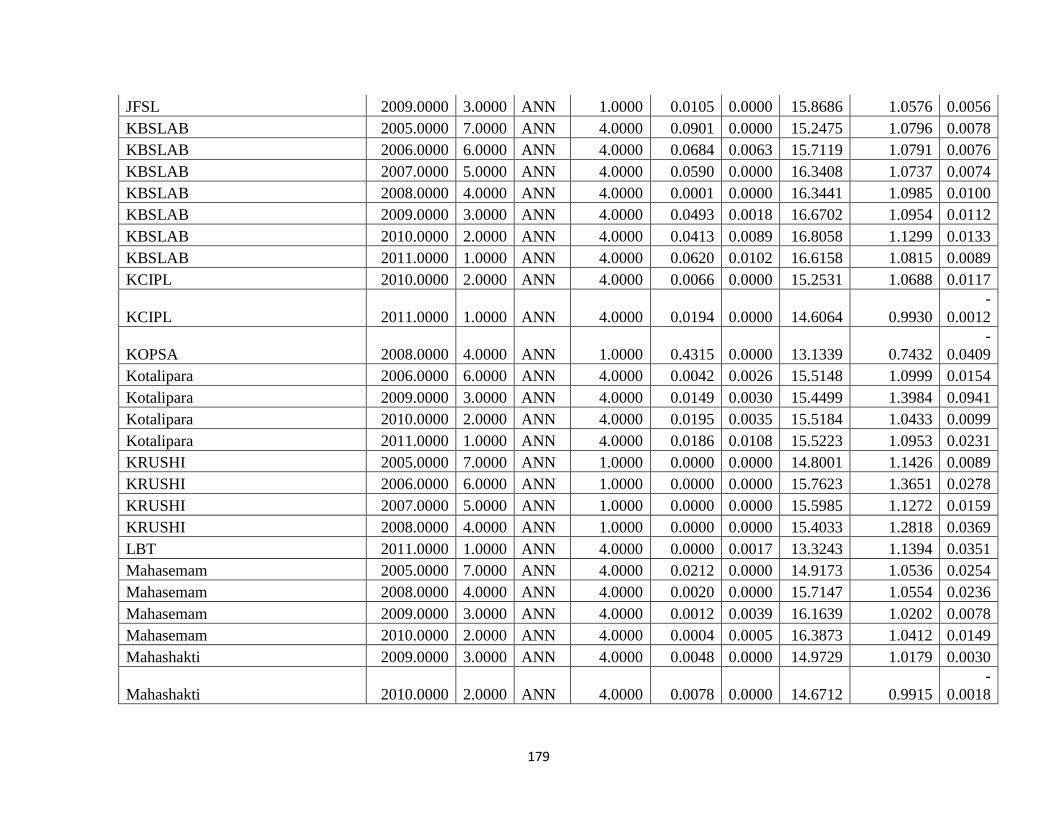
179
JFSL 2009.0000 3.0000 ANN 1.0000 0.0105 0.0000 15.8686 1.0576 0.0056
KBSLAB 2005.0000 7.0000 ANN 4.0000 0.0901 0.0000 15.2475 1.0796 0.0078
KBSLAB 2006.0000 6.0000 ANN 4.0000 0.0684 0.0063 15.7119 1.0791 0.0076
KBSLAB 2007.0000 5.0000 ANN 4.0000 0.0590 0.0000 16.3408 1.0737 0.0074
KBSLAB 2008.0000 4.0000 ANN 4.0000 0.0001 0.0000 16.3441 1.0985 0.0100
KBSLAB 2009.0000 3.0000 ANN 4.0000 0.0493 0.0018 16.6702 1.0954 0.0112
KBSLAB 2010.0000 2.0000 ANN 4.0000 0.0413 0.0089 16.8058 1.1299 0.0133
KBSLAB 2011.0000 1.0000 ANN 4.0000 0.0620 0.0102 16.6158 1.0815 0.0089
KCIPL 2010.0000 2.0000 ANN 4.0000 0.0066 0.0000 15.2531 1.0688 0.0117
KCIPL 2011.0000 1.0000 ANN 4.0000 0.0194 0.0000 14.6064 0.9930
-
0.0012
KOPSA 2008.0000 4.0000 ANN 1.0000 0.4315 0.0000 13.1339 0.7432
-
0.0409
Kotalipara 2006.0000 6.0000 ANN 4.0000 0.0042 0.0026 15.5148 1.0999 0.0154
Kotalipara 2009.0000 3.0000 ANN 4.0000 0.0149 0.0030 15.4499 1.3984 0.0941
Kotalipara 2010.0000 2.0000 ANN 4.0000 0.0195 0.0035 15.5184 1.0433 0.0099
Kotalipara 2011.0000 1.0000 ANN 4.0000 0.0186 0.0108 15.5223 1.0953 0.0231
KRUSHI 2005.0000 7.0000 ANN 1.0000 0.0000 0.0000 14.8001 1.1426 0.0089
KRUSHI 2006.0000 6.0000 ANN 1.0000 0.0000 0.0000 15.7623 1.3651 0.0278
KRUSHI 2007.0000 5.0000 ANN 1.0000 0.0000 0.0000 15.5985 1.1272 0.0159
KRUSHI 2008.0000 4.0000 ANN 1.0000 0.0000 0.0000 15.4033 1.2818 0.0369
LBT 2011.0000 1.0000 ANN 4.0000 0.0000 0.0017 13.3243 1.1394 0.0351
Mahasemam 2005.0000 7.0000 ANN 4.0000 0.0212 0.0000 14.9173 1.0536 0.0254
Mahasemam 2008.0000 4.0000 ANN 4.0000 0.0020 0.0000 15.7147 1.0554 0.0236
Mahasemam 2009.0000 3.0000 ANN 4.0000 0.0012 0.0039 16.1639 1.0202 0.0078
Mahasemam 2010.0000 2.0000 ANN 4.0000 0.0004 0.0005 16.3873 1.0412 0.0149
Mahashakti 2009.0000 3.0000 ANN 4.0000 0.0048 0.0000 14.9729 1.0179 0.0030
Mahashakti 2010.0000 2.0000 ANN 4.0000 0.0078 0.0000 14.6712 0.9915
-
0.0018
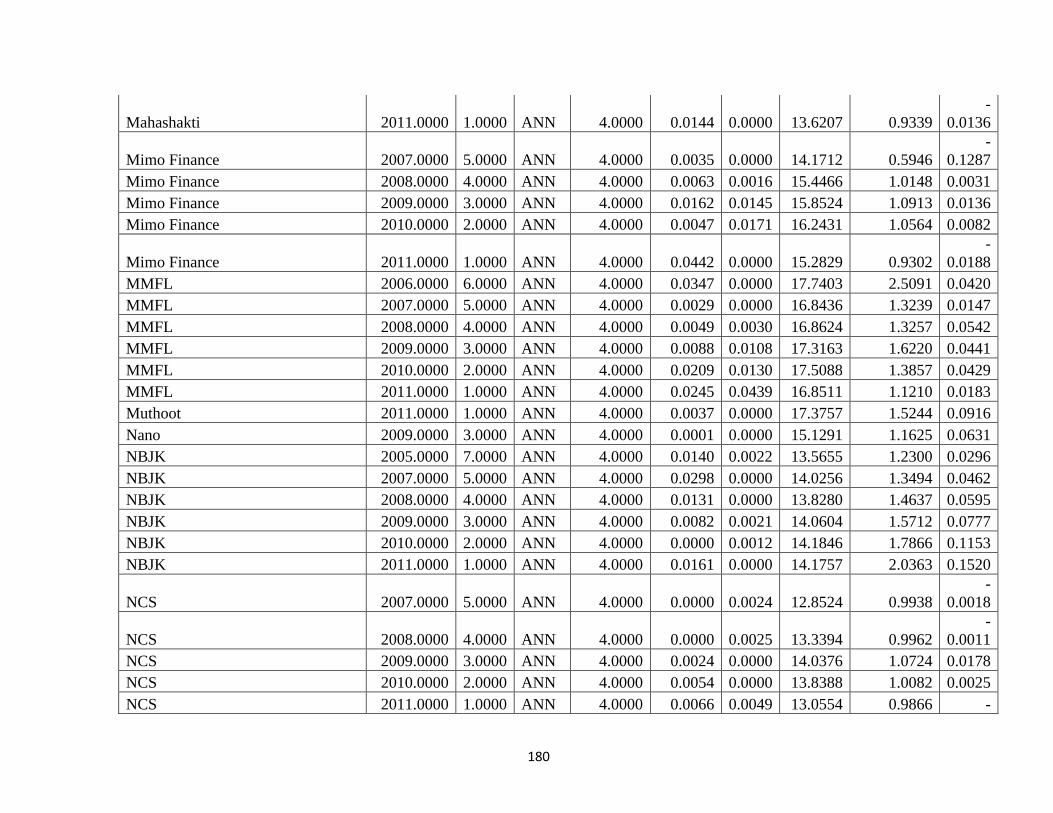
180
Mahashakti 2011.0000 1.0000 ANN 4.0000 0.0144 0.0000 13.6207 0.9339
-
0.0136
Mimo Finance 2007.0000 5.0000 ANN 4.0000 0.0035 0.0000 14.1712 0.5946
-
0.1287
Mimo Finance 2008.0000 4.0000 ANN 4.0000 0.0063 0.0016 15.4466 1.0148 0.0031
Mimo Finance 2009.0000 3.0000 ANN 4.0000 0.0162 0.0145 15.8524 1.0913 0.0136
Mimo Finance 2010.0000 2.0000 ANN 4.0000 0.0047 0.0171 16.2431 1.0564 0.0082
Mimo Finance 2011.0000 1.0000 ANN 4.0000 0.0442 0.0000 15.2829 0.9302
-
0.0188
MMFL 2006.0000 6.0000 ANN 4.0000 0.0347 0.0000 17.7403 2.5091 0.0420
MMFL 2007.0000 5.0000 ANN 4.0000 0.0029 0.0000 16.8436 1.3239 0.0147
MMFL 2008.0000 4.0000 ANN 4.0000 0.0049 0.0030 16.8624 1.3257 0.0542
MMFL 2009.0000 3.0000 ANN 4.0000 0.0088 0.0108 17.3163 1.6220 0.0441
MMFL 2010.0000 2.0000 ANN 4.0000 0.0209 0.0130 17.5088 1.3857 0.0429
MMFL 2011.0000 1.0000 ANN 4.0000 0.0245 0.0439 16.8511 1.1210 0.0183
Muthoot 2011.0000 1.0000 ANN 4.0000 0.0037 0.0000 17.3757 1.5244 0.0916
Nano 2009.0000 3.0000 ANN 4.0000 0.0001 0.0000 15.1291 1.1625 0.0631
NBJK 2005.0000 7.0000 ANN 4.0000 0.0140 0.0022 13.5655 1.2300 0.0296
NBJK 2007.0000 5.0000 ANN 4.0000 0.0298 0.0000 14.0256 1.3494 0.0462
NBJK 2008.0000 4.0000 ANN 4.0000 0.0131 0.0000 13.8280 1.4637 0.0595
NBJK 2009.0000 3.0000 ANN 4.0000 0.0082 0.0021 14.0604 1.5712 0.0777
NBJK 2010.0000 2.0000 ANN 4.0000 0.0000 0.0012 14.1846 1.7866 0.1153
NBJK 2011.0000 1.0000 ANN 4.0000 0.0161 0.0000 14.1757 2.0363 0.1520
NCS 2007.0000 5.0000 ANN 4.0000 0.0000 0.0024 12.8524 0.9938
-
0.0018
NCS 2008.0000 4.0000 ANN 4.0000 0.0000 0.0025 13.3394 0.9962
-
0.0011
NCS 2009.0000 3.0000 ANN 4.0000 0.0024 0.0000 14.0376 1.0724 0.0178
NCS 2010.0000 2.0000 ANN 4.0000 0.0054 0.0000 13.8388 1.0082 0.0025
NCS 2011.0000 1.0000 ANN 4.0000 0.0066 0.0049 13.0554 0.9866 -

181
0.0035
NDFS 2005.0000 7.0000 ANN 1.0000 0.0000 0.0000 13.3428 1.0765 0.0108
NDFS 2007.0000 5.0000 ANN 1.0000 0.0000 0.0014 14.6630 1.0525 0.0063
NEED 2007.0000 5.0000 ANN 4.0000 0.0000 0.0000 14.4616 1.4749 0.0562
NEED 2008.0000 4.0000 ANN 4.0000 0.0114 0.0123 15.0395 1.1275 0.0284
NEED 2009.0000 3.0000 ANN 4.0000 0.0196 0.0109 15.3146 1.1274 0.0247
NEED 2010.0000 2.0000 ANN 4.0000 0.0045 0.0115 15.5852 1.1164 0.0228
NEED 2011.0000 1.0000 ANN 4.0000 0.0025 0.0197 15.0550 1.1748 0.0300
Nidan 2005.0000 7.0000 ANN 1.0000 0.0263 0.0000 11.7059 1.4566 0.0873
Nidan 2007.0000 5.0000 ANN 1.0000 0.0261 0.0000 12.8793 1.1322 0.0127
Nidan 2008.0000 4.0000 ANN 1.0000 0.0000 0.0000 12.2057 0.4870
-
0.1267
Nidan 2009.0000 3.0000 ANN 1.0000 0.0000 0.0000 12.2918 0.4216
-
0.0140
Nirmaan Bharati 2007.0000 5.0000 ANN 1.0000 0.0003 0.0031 15.6695 1.2188 0.0485
PRAYAS 2011.0000 1.0000 ANN 5.0000 0.0061 0.0000 14.1623 1.4674 0.0919
Pustikar 2008.0000 4.0000 ANN 4.0000 0.0428 0.0000 16.2796 1.2594 0.0321
Pustikar 2009.0000 3.0000 ANN 4.0000 0.0080 0.0000 16.6325 1.4158 0.0439
Pustikar 2010.0000 2.0000 ANN 4.0000 0.0762 0.0000 16.8128 1.3937 0.0358
Pustikar 2011.0000 1.0000 ANN 4.0000 0.0800 0.0000 16.7933 1.3566 0.0329
PWMACS 2005.0000 7.0000 ANN 4.0000 0.0046 0.0067 13.4965 1.0029 0.0004
PWMACS 2007.0000 5.0000 ANN 4.0000 0.0141 0.0000 15.2132 1.0251 0.0034
PWMACS 2008.0000 4.0000 ANN 4.0000 0.0001 0.0036 15.4785 1.0817 0.0114
PWMACS 2009.0000 3.0000 ANN 4.0000 0.0000 0.0011 15.7625 1.0794 0.0117
PWMACS 2010.0000 2.0000 ANN 4.0000 0.4084 0.0192 15.4164 1.0071 0.0008
PWMACS 2011.0000 1.0000 ANN 4.0000 0.0907 0.0008 15.1488 0.7860
-
0.0373
RASS 2005.0000 7.0000 ANN 4.0000 0.0237 0.0473 14.0954 1.1272 0.0153
RASS 2006.0000 6.0000 ANN 4.0000 0.0455 0.0000 15.0109 1.4603 0.0516
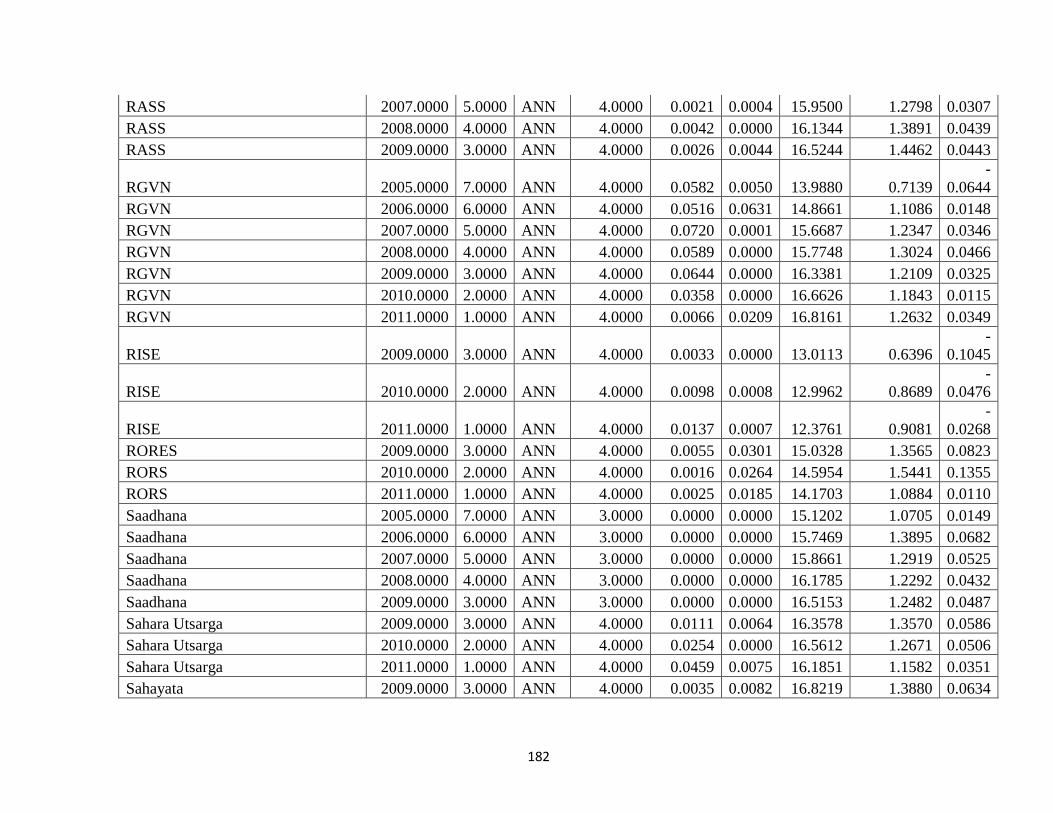
182
RASS 2007.0000 5.0000 ANN 4.0000 0.0021 0.0004 15.9500 1.2798 0.0307
RASS 2008.0000 4.0000 ANN 4.0000 0.0042 0.0000 16.1344 1.3891 0.0439
RASS 2009.0000 3.0000 ANN 4.0000 0.0026 0.0044 16.5244 1.4462 0.0443
RGVN 2005.0000 7.0000 ANN 4.0000 0.0582 0.0050 13.9880 0.7139
-
0.0644
RGVN 2006.0000 6.0000 ANN 4.0000 0.0516 0.0631 14.8661 1.1086 0.0148
RGVN 2007.0000 5.0000 ANN 4.0000 0.0720 0.0001 15.6687 1.2347 0.0346
RGVN 2008.0000 4.0000 ANN 4.0000 0.0589 0.0000 15.7748 1.3024 0.0466
RGVN 2009.0000 3.0000 ANN 4.0000 0.0644 0.0000 16.3381 1.2109 0.0325
RGVN 2010.0000 2.0000 ANN 4.0000 0.0358 0.0000 16.6626 1.1843 0.0115
RGVN 2011.0000 1.0000 ANN 4.0000 0.0066 0.0209 16.8161 1.2632 0.0349
RISE 2009.0000 3.0000 ANN 4.0000 0.0033 0.0000 13.0113 0.6396
-
0.1045
RISE 2010.0000 2.0000 ANN 4.0000 0.0098 0.0008 12.9962 0.8689
-
0.0476
RISE 2011.0000 1.0000 ANN 4.0000 0.0137 0.0007 12.3761 0.9081
-
0.0268
RORES 2009.0000 3.0000 ANN 4.0000 0.0055 0.0301 15.0328 1.3565 0.0823
RORS 2010.0000 2.0000 ANN 4.0000 0.0016 0.0264 14.5954 1.5441 0.1355
RORS 2011.0000 1.0000 ANN 4.0000 0.0025 0.0185 14.1703 1.0884 0.0110
Saadhana 2005.0000 7.0000 ANN 3.0000 0.0000 0.0000 15.1202 1.0705 0.0149
Saadhana 2006.0000 6.0000 ANN 3.0000 0.0000 0.0000 15.7469 1.3895 0.0682
Saadhana 2007.0000 5.0000 ANN 3.0000 0.0000 0.0000 15.8661 1.2919 0.0525
Saadhana 2008.0000 4.0000 ANN 3.0000 0.0000 0.0000 16.1785 1.2292 0.0432
Saadhana 2009.0000 3.0000 ANN 3.0000 0.0000 0.0000 16.5153 1.2482 0.0487
Sahara Utsarga 2009.0000 3.0000 ANN 4.0000 0.0111 0.0064 16.3578 1.3570 0.0586
Sahara Utsarga 2010.0000 2.0000 ANN 4.0000 0.0254 0.0000 16.5612 1.2671 0.0506
Sahara Utsarga 2011.0000 1.0000 ANN 4.0000 0.0459 0.0075 16.1851 1.1582 0.0351
Sahayata 2009.0000 3.0000 ANN 4.0000 0.0035 0.0082 16.8219 1.3880 0.0634

183
Saija 2010.0000 2.0000 ANN 4.0000 0.0018 0.0000 14.5735 0.7931
-
0.0703
Saija 2011.0000 1.0000 ANN 4.0000 0.0015 0.0021 13.0548 0.4892
-
0.1841
Samasta 2009.0000 3.0000 ANN 4.0000 0.0000 0.0000 15.5848 0.8797
-
0.0238
Samasta 2010.0000 2.0000 ANN 4.0000 0.0131 0.0002 15.6746 1.0135 0.0033
Samasta 2011.0000 1.0000 ANN 4.0000 0.0109 0.0000 15.7213 0.9776
-
0.0035
Sanchetna 2010.0000 2.0000 ANN 4.0000 0.0052 0.0000 13.8979 1.0462 0.0145
Sanchetna 2011.0000 1.0000 ANN 4.0000 0.0262 0.0000 13.0557 0.8716
-
0.0376
Sangamam 2007.0000 5.0000 ANN 1.0000 0.0039 0.0000 13.9513 1.3203 0.0675
Sanghamithra 2005.0000 7.0000 ANN 4.0000 0.0993 0.0102 15.4574 1.0425 0.0057
Sanghamithra 2006.0000 6.0000 ANN 4.0000 0.0282 0.0104 15.8312 1.0149 0.0020
Sanghamithra 2007.0000 5.0000 ANN 4.0000 0.0520 0.0029 16.3110 1.0128 0.0019
Sanghamithra 2008.0000 4.0000 ANN 4.0000 0.0926 0.0033 16.2468 1.1163 0.0169
Sanghamithra 2009.0000 3.0000 ANN 4.0000 0.0482 0.0428 16.5498 1.1913 0.0247
Sanghamithra 2010.0000 2.0000 ANN 4.0000 0.0800 0.0313 16.7012 1.2304 0.0322
Sanghamithra 2011.0000 1.0000 ANN 4.0000 0.0178 0.0176 16.7132 1.2169 0.0293
Sarala 2007.0000 5.0000 ANN 5.0000 0.0002 0.0000 14.0620 1.4008 0.0516
Sarala 2008.0000 4.0000 ANN 5.0000 0.0002 0.0000 15.0983 1.2701 0.0430
Sarala 2009.0000 3.0000 ANN 5.0000 0.0025 0.0000 15.8533 1.8262 0.0842
Sarala 2010.0000 2.0000 ANN 5.0000 0.0313 0.0006 16.1737 1.5357 0.0566
Sarala 2011.0000 1.0000 ANN 5.0000 0.0475 0.0079 15.8784 1.5175 0.0578
Sarvodaya Nano Finance 2005.0000 7.0000 ANN 4.0000 0.0386 0.0000 15.9631 0.9430
-
0.0101
Sarvodaya Nano Finance 2006.0000 6.0000 ANN 4.0000 0.0769 0.0000 16.5061 1.0111
-
0.0025
Sarvodaya Nano Finance 2007.0000 5.0000 ANN 4.0000 0.0872 0.0022 16.9088 1.0703 0.0047
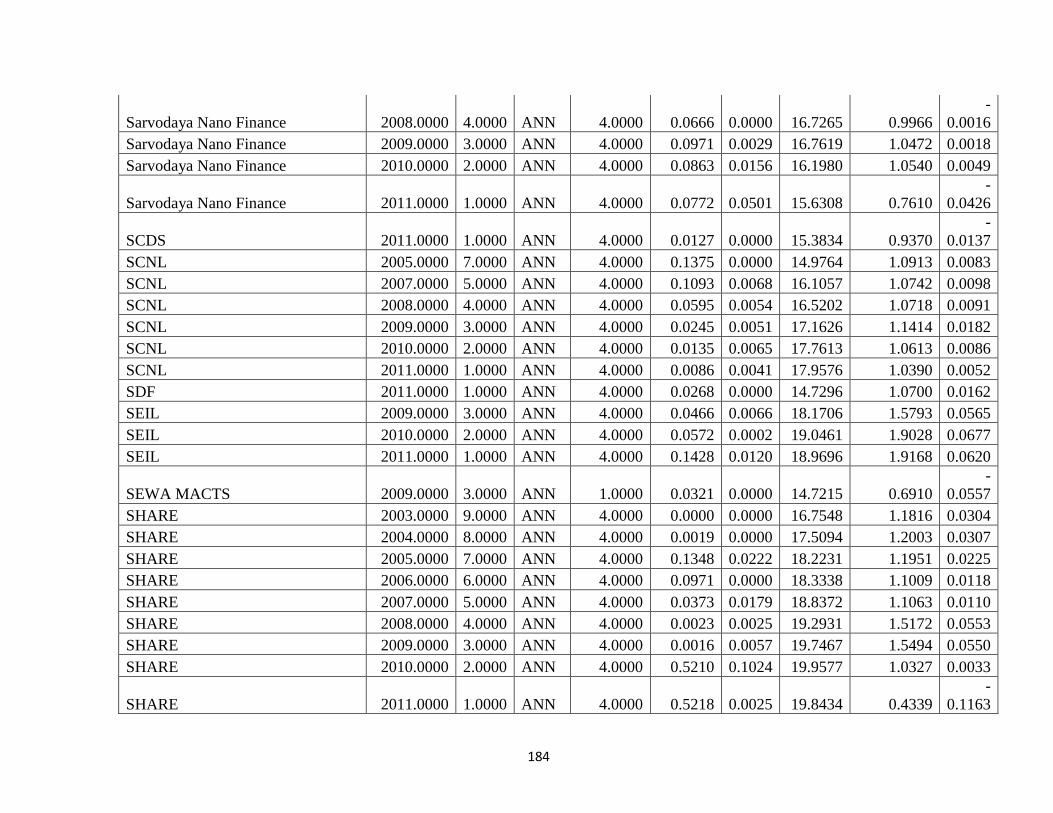
184
Sarvodaya Nano Finance 2008.0000 4.0000 ANN 4.0000 0.0666 0.0000 16.7265 0.9966
-
0.0016
Sarvodaya Nano Finance 2009.0000 3.0000 ANN 4.0000 0.0971 0.0029 16.7619 1.0472 0.0018
Sarvodaya Nano Finance 2010.0000 2.0000 ANN 4.0000 0.0863 0.0156 16.1980 1.0540 0.0049
Sarvodaya Nano Finance 2011.0000 1.0000 ANN 4.0000 0.0772 0.0501 15.6308 0.7610
-
0.0426
SCDS 2011.0000 1.0000 ANN 4.0000 0.0127 0.0000 15.3834 0.9370
-
0.0137
SCNL 2005.0000 7.0000 ANN 4.0000 0.1375 0.0000 14.9764 1.0913 0.0083
SCNL 2007.0000 5.0000 ANN 4.0000 0.1093 0.0068 16.1057 1.0742 0.0098
SCNL 2008.0000 4.0000 ANN 4.0000 0.0595 0.0054 16.5202 1.0718 0.0091
SCNL 2009.0000 3.0000 ANN 4.0000 0.0245 0.0051 17.1626 1.1414 0.0182
SCNL 2010.0000 2.0000 ANN 4.0000 0.0135 0.0065 17.7613 1.0613 0.0086
SCNL 2011.0000 1.0000 ANN 4.0000 0.0086 0.0041 17.9576 1.0390 0.0052
SDF 2011.0000 1.0000 ANN 4.0000 0.0268 0.0000 14.7296 1.0700 0.0162
SEIL 2009.0000 3.0000 ANN 4.0000 0.0466 0.0066 18.1706 1.5793 0.0565
SEIL 2010.0000 2.0000 ANN 4.0000 0.0572 0.0002 19.0461 1.9028 0.0677
SEIL 2011.0000 1.0000 ANN 4.0000 0.1428 0.0120 18.9696 1.9168 0.0620
SEWA MACTS 2009.0000 3.0000 ANN 1.0000 0.0321 0.0000 14.7215 0.6910
-
0.0557
SHARE 2003.0000 9.0000 ANN 4.0000 0.0000 0.0000 16.7548 1.1816 0.0304
SHARE 2004.0000 8.0000 ANN 4.0000 0.0019 0.0000 17.5094 1.2003 0.0307
SHARE 2005.0000 7.0000 ANN 4.0000 0.1348 0.0222 18.2231 1.1951 0.0225
SHARE 2006.0000 6.0000 ANN 4.0000 0.0971 0.0000 18.3338 1.1009 0.0118
SHARE 2007.0000 5.0000 ANN 4.0000 0.0373 0.0179 18.8372 1.1063 0.0110
SHARE 2008.0000 4.0000 ANN 4.0000 0.0023 0.0025 19.2931 1.5172 0.0553
SHARE 2009.0000 3.0000 ANN 4.0000 0.0016 0.0057 19.7467 1.5494 0.0550
SHARE 2010.0000 2.0000 ANN 4.0000 0.5210 0.1024 19.9577 1.0327 0.0033
SHARE 2011.0000 1.0000 ANN 4.0000 0.5218 0.0025 19.8434 0.4339
-
0.1163
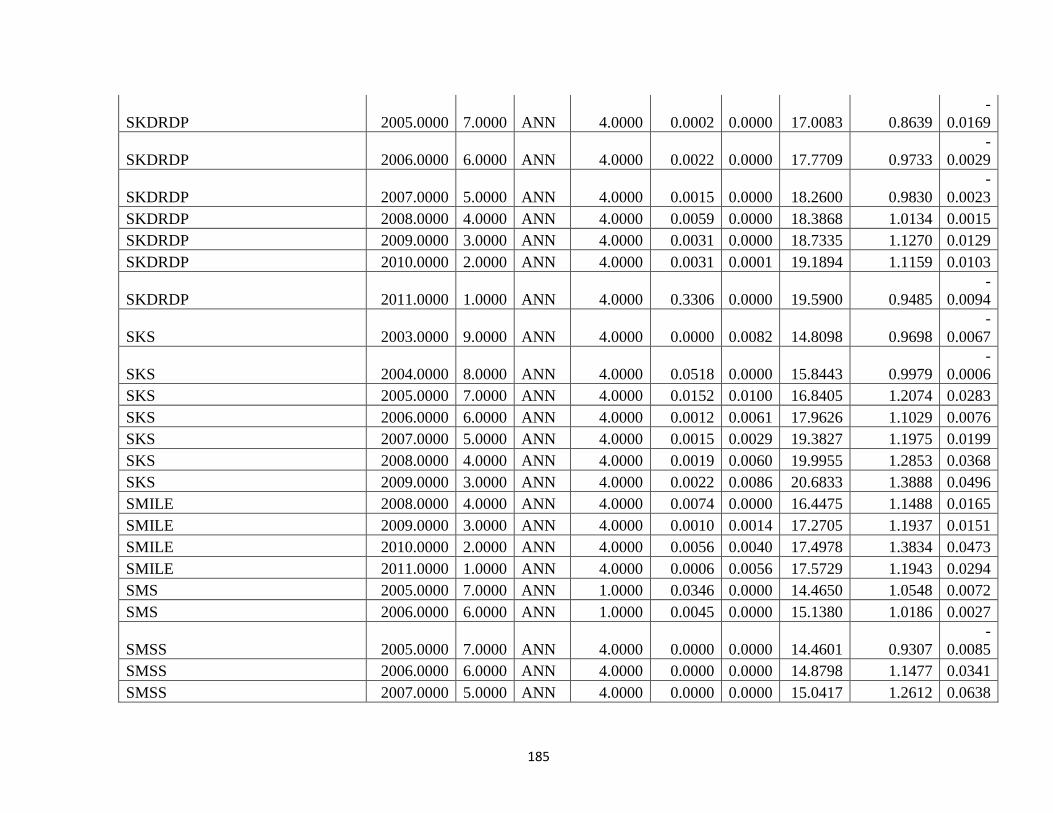
185
SKDRDP 2005.0000 7.0000 ANN 4.0000 0.0002 0.0000 17.0083 0.8639
-
0.0169
SKDRDP 2006.0000 6.0000 ANN 4.0000 0.0022 0.0000 17.7709 0.9733
-
0.0029
SKDRDP 2007.0000 5.0000 ANN 4.0000 0.0015 0.0000 18.2600 0.9830
-
0.0023
SKDRDP 2008.0000 4.0000 ANN 4.0000 0.0059 0.0000 18.3868 1.0134 0.0015
SKDRDP 2009.0000 3.0000 ANN 4.0000 0.0031 0.0000 18.7335 1.1270 0.0129
SKDRDP 2010.0000 2.0000 ANN 4.0000 0.0031 0.0001 19.1894 1.1159 0.0103
SKDRDP 2011.0000 1.0000 ANN 4.0000 0.3306 0.0000 19.5900 0.9485
-
0.0094
SKS 2003.0000 9.0000 ANN 4.0000 0.0000 0.0082 14.8098 0.9698
-
0.0067
SKS 2004.0000 8.0000 ANN 4.0000 0.0518 0.0000 15.8443 0.9979
-
0.0006
SKS 2005.0000 7.0000 ANN 4.0000 0.0152 0.0100 16.8405 1.2074 0.0283
SKS 2006.0000 6.0000 ANN 4.0000 0.0012 0.0061 17.9626 1.1029 0.0076
SKS 2007.0000 5.0000 ANN 4.0000 0.0015 0.0029 19.3827 1.1975 0.0199
SKS 2008.0000 4.0000 ANN 4.0000 0.0019 0.0060 19.9955 1.2853 0.0368
SKS 2009.0000 3.0000 ANN 4.0000 0.0022 0.0086 20.6833 1.3888 0.0496
SMILE 2008.0000 4.0000 ANN 4.0000 0.0074 0.0000 16.4475 1.1488 0.0165
SMILE 2009.0000 3.0000 ANN 4.0000 0.0010 0.0014 17.2705 1.1937 0.0151
SMILE 2010.0000 2.0000 ANN 4.0000 0.0056 0.0040 17.4978 1.3834 0.0473
SMILE 2011.0000 1.0000 ANN 4.0000 0.0006 0.0056 17.5729 1.1943 0.0294
SMS 2005.0000 7.0000 ANN 1.0000 0.0346 0.0000 14.4650 1.0548 0.0072
SMS 2006.0000 6.0000 ANN 1.0000 0.0045 0.0000 15.1380 1.0186 0.0027
SMSS 2005.0000 7.0000 ANN 4.0000 0.0000 0.0000 14.4601 0.9307
-
0.0085
SMSS 2006.0000 6.0000 ANN 4.0000 0.0000 0.0000 14.8798 1.1477 0.0341
SMSS 2007.0000 5.0000 ANN 4.0000 0.0000 0.0000 15.0417 1.2612 0.0638
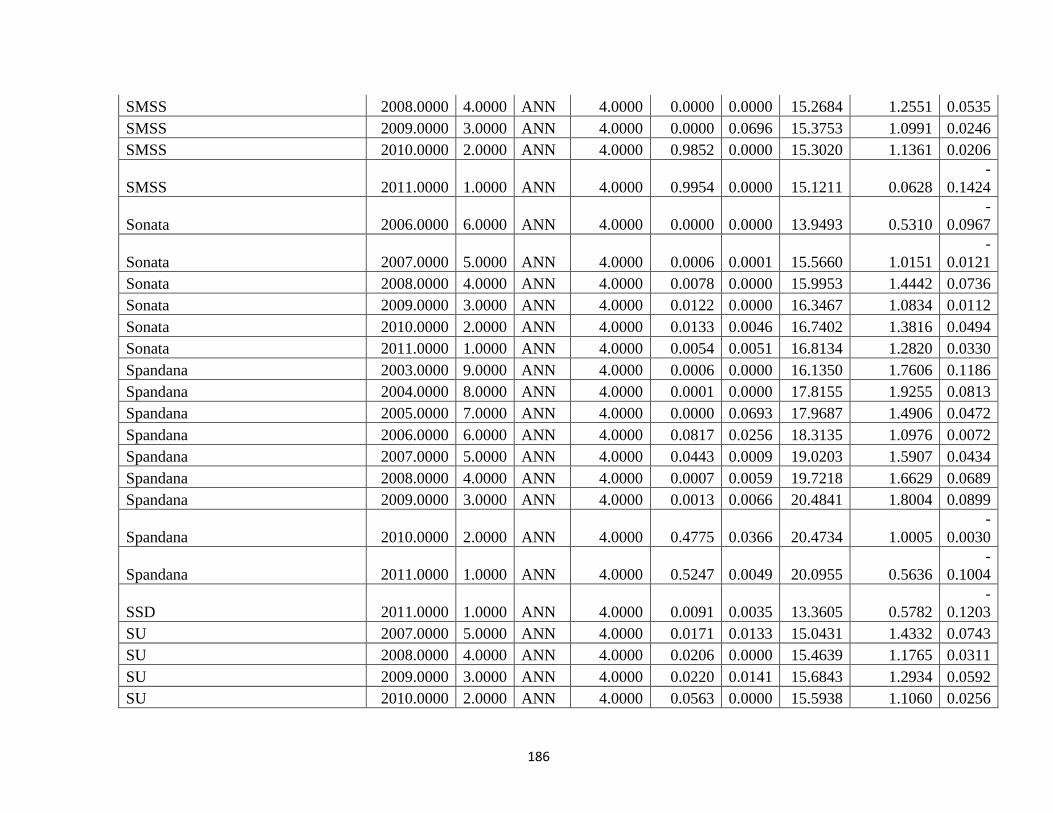
186
SMSS 2008.0000 4.0000 ANN 4.0000 0.0000 0.0000 15.2684 1.2551 0.0535
SMSS 2009.0000 3.0000 ANN 4.0000 0.0000 0.0696 15.3753 1.0991 0.0246
SMSS 2010.0000 2.0000 ANN 4.0000 0.9852 0.0000 15.3020 1.1361 0.0206
SMSS 2011.0000 1.0000 ANN 4.0000 0.9954 0.0000 15.1211 0.0628
-
0.1424
Sonata 2006.0000 6.0000 ANN 4.0000 0.0000 0.0000 13.9493 0.5310
-
0.0967
Sonata 2007.0000 5.0000 ANN 4.0000 0.0006 0.0001 15.5660 1.0151
-
0.0121
Sonata 2008.0000 4.0000 ANN 4.0000 0.0078 0.0000 15.9953 1.4442 0.0736
Sonata 2009.0000 3.0000 ANN 4.0000 0.0122 0.0000 16.3467 1.0834 0.0112
Sonata 2010.0000 2.0000 ANN 4.0000 0.0133 0.0046 16.7402 1.3816 0.0494
Sonata 2011.0000 1.0000 ANN 4.0000 0.0054 0.0051 16.8134 1.2820 0.0330
Spandana 2003.0000 9.0000 ANN 4.0000 0.0006 0.0000 16.1350 1.7606 0.1186
Spandana 2004.0000 8.0000 ANN 4.0000 0.0001 0.0000 17.8155 1.9255 0.0813
Spandana 2005.0000 7.0000 ANN 4.0000 0.0000 0.0693 17.9687 1.4906 0.0472
Spandana 2006.0000 6.0000 ANN 4.0000 0.0817 0.0256 18.3135 1.0976 0.0072
Spandana 2007.0000 5.0000 ANN 4.0000 0.0443 0.0009 19.0203 1.5907 0.0434
Spandana 2008.0000 4.0000 ANN 4.0000 0.0007 0.0059 19.7218 1.6629 0.0689
Spandana 2009.0000 3.0000 ANN 4.0000 0.0013 0.0066 20.4841 1.8004 0.0899
Spandana 2010.0000 2.0000 ANN 4.0000 0.4775 0.0366 20.4734 1.0005
-
0.0030
Spandana 2011.0000 1.0000 ANN 4.0000 0.5247 0.0049 20.0955 0.5636
-
0.1004
SSD 2011.0000 1.0000 ANN 4.0000 0.0091 0.0035 13.3605 0.5782
-
0.1203
SU 2007.0000 5.0000 ANN 4.0000 0.0171 0.0133 15.0431 1.4332 0.0743
SU 2008.0000 4.0000 ANN 4.0000 0.0206 0.0000 15.4639 1.1765 0.0311
SU 2009.0000 3.0000 ANN 4.0000 0.0220 0.0141 15.6843 1.2934 0.0592
SU 2010.0000 2.0000 ANN 4.0000 0.0563 0.0000 15.5938 1.1060 0.0256

187
SU 2011.0000 1.0000 ANN 4.0000 0.0766 0.0446 15.0281 0.9595
-
0.0098
Suryoday 2009.0000 3.0000 ANN 4.0000 0.0001 0.0000 15.0609 0.8105
-
0.0539
Suryoday 2010.0000 2.0000 ANN 4.0000 0.0502 0.0333 16.2011 1.0870 0.0257
Suryoday 2011.0000 1.0000 ANN 4.0000 0.0143 0.0151 16.7279 1.0368 0.0073
SVCL 2009.0000 3.0000 ANN 4.0000 0.0000 0.0000 14.5074 0.0734
-
0.6068
SVCL 2010.0000 2.0000 ANN 4.0000 0.0067 0.0000 15.9000 0.6916
-
0.1404
SVCL 2011.0000 1.0000 ANN 4.0000 0.0092 0.0012 16.2209 1.0273 0.0078
SVSDF 2009.0000 3.0000 ANN 4.0000 0.0000 0.0000 14.1619 1.0543 0.0056
SVSDF 2010.0000 2.0000 ANN 4.0000 0.0000 0.0000 14.7826 1.0248 0.0070
Swadhaar 2006.0000 6.0000 ANN 4.0000 0.0000 0.0304 11.4860 0.1626
-
1.0126
Swadhaar 2007.0000 5.0000 ANN 4.0000 0.0166 0.0374 12.5194 0.1788
-
0.9721
Swadhaar 2008.0000 4.0000 ANN 4.0000 0.0108 0.0000 13.9231 0.3118
-
0.4491
Swadhaar 2009.0000 3.0000 ANN 4.0000 0.0091 0.0185 15.2858 0.4924
-
0.2075
Swadhaar 2010.0000 2.0000 ANN 4.0000 0.0109 0.0156 16.2449 0.7937
-
0.0589
Swadhaar 2011.0000 1.0000 ANN 4.0000 0.0204 0.0146 16.5532 1.0179 0.0091
SWAWS 2005.0000 7.0000 ANN 4.0000 0.0032 0.0009 15.5254 1.2301 0.0235
SWAWS 2006.0000 6.0000 ANN 4.0000 0.0115 0.0001 15.9878 1.1598 0.0211
SWAWS 2007.0000 5.0000 ANN 4.0000 0.0006 0.0000 16.1789 1.0967 0.0178
SWAWS 2008.0000 4.0000 ANN 4.0000 0.0033 0.0000 16.2718 1.2426 0.0328
SWAWS 2009.0000 3.0000 ANN 4.0000 0.0046 0.0000 16.8019 1.6598 0.0745
SWAWS 2011.0000 1.0000 ANN 4.0000 0.9691 0.0000 16.5864 -0.1224
-
0.2581
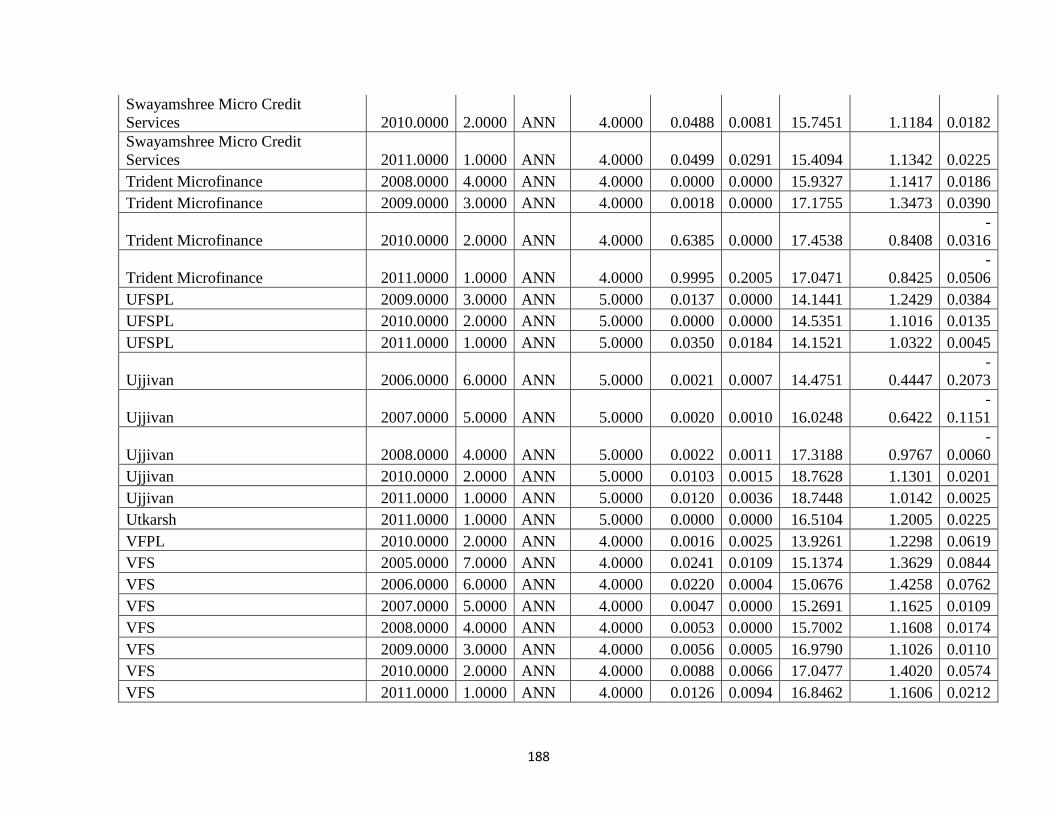
188
Swayamshree Micro Credit
Services 2010.0000 2.0000 ANN 4.0000 0.0488 0.0081 15.7451 1.1184 0.0182
Swayamshree Micro Credit
Services 2011.0000 1.0000 ANN 4.0000 0.0499 0.0291 15.4094 1.1342 0.0225
Trident Microfinance 2008.0000 4.0000 ANN 4.0000 0.0000 0.0000 15.9327 1.1417 0.0186
Trident Microfinance 2009.0000 3.0000 ANN 4.0000 0.0018 0.0000 17.1755 1.3473 0.0390
Trident Microfinance 2010.0000 2.0000 ANN 4.0000 0.6385 0.0000 17.4538 0.8408
-
0.0316
Trident Microfinance 2011.0000 1.0000 ANN 4.0000 0.9995 0.2005 17.0471 0.8425
-
0.0506
UFSPL 2009.0000 3.0000 ANN 5.0000 0.0137 0.0000 14.1441 1.2429 0.0384
UFSPL 2010.0000 2.0000 ANN 5.0000 0.0000 0.0000 14.5351 1.1016 0.0135
UFSPL 2011.0000 1.0000 ANN 5.0000 0.0350 0.0184 14.1521 1.0322 0.0045
Ujjivan 2006.0000 6.0000 ANN 5.0000 0.0021 0.0007 14.4751 0.4447
-
0.2073
Ujjivan 2007.0000 5.0000 ANN 5.0000 0.0020 0.0010 16.0248 0.6422
-
0.1151
Ujjivan 2008.0000 4.0000 ANN 5.0000 0.0022 0.0011 17.3188 0.9767
-
0.0060
Ujjivan 2010.0000 2.0000 ANN 5.0000 0.0103 0.0015 18.7628 1.1301 0.0201
Ujjivan 2011.0000 1.0000 ANN 5.0000 0.0120 0.0036 18.7448 1.0142 0.0025
Utkarsh 2011.0000 1.0000 ANN 5.0000 0.0000 0.0000 16.5104 1.2005 0.0225
VFPL 2010.0000 2.0000 ANN 4.0000 0.0016 0.0025 13.9261 1.2298 0.0619
VFS 2005.0000 7.0000 ANN 4.0000 0.0241 0.0109 15.1374 1.3629 0.0844
VFS 2006.0000 6.0000 ANN 4.0000 0.0220 0.0004 15.0676 1.4258 0.0762
VFS 2007.0000 5.0000 ANN 4.0000 0.0047 0.0000 15.2691 1.1625 0.0109
VFS 2008.0000 4.0000 ANN 4.0000 0.0053 0.0000 15.7002 1.1608 0.0174
VFS 2009.0000 3.0000 ANN 4.0000 0.0056 0.0005 16.9790 1.1026 0.0110
VFS 2010.0000 2.0000 ANN 4.0000 0.0088 0.0066 17.0477 1.4020 0.0574
VFS 2011.0000 1.0000 ANN 4.0000 0.0126 0.0094 16.8462 1.1606 0.0212
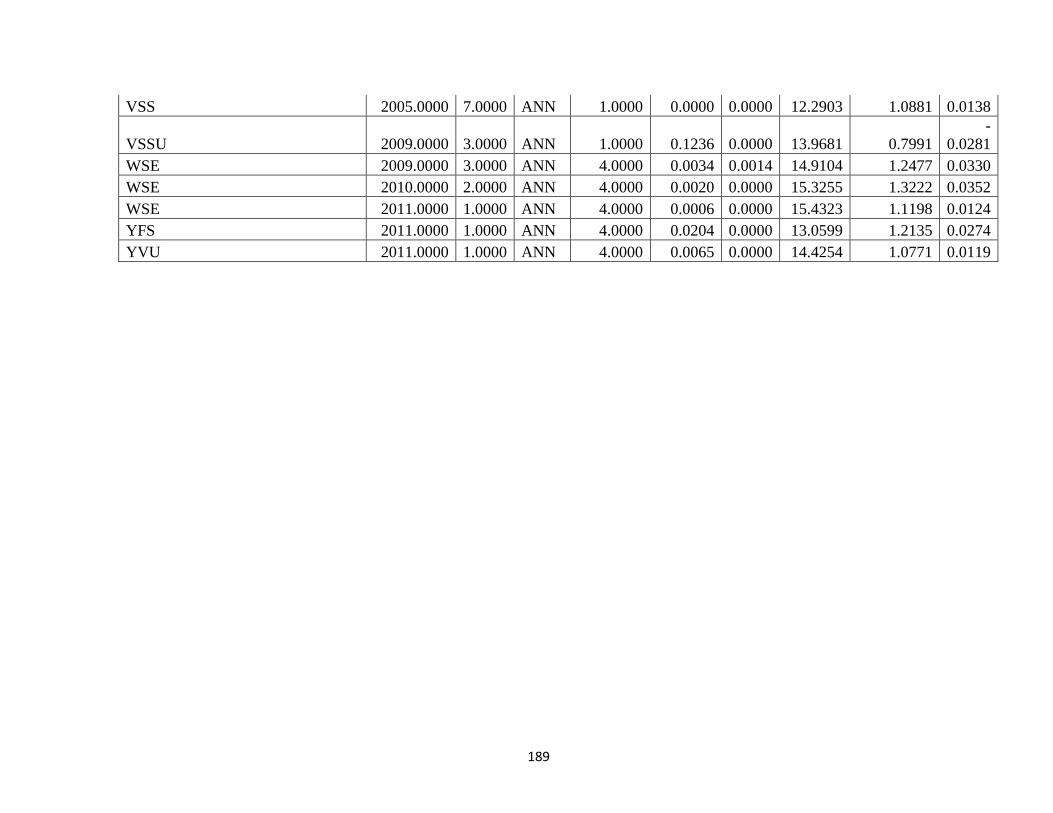
189
VSS 2005.0000 7.0000 ANN 1.0000 0.0000 0.0000 12.2903 1.0881 0.0138
VSSU 2009.0000 3.0000 ANN 1.0000 0.1236 0.0000 13.9681 0.7991
-
0.0281
WSE 2009.0000 3.0000 ANN 4.0000 0.0034 0.0014 14.9104 1.2477 0.0330
WSE 2010.0000 2.0000 ANN 4.0000 0.0020 0.0000 15.3255 1.3222 0.0352
WSE 2011.0000 1.0000 ANN 4.0000 0.0006 0.0000 15.4323 1.1198 0.0124
YFS 2011.0000 1.0000 ANN 4.0000 0.0204 0.0000 13.0599 1.2135 0.0274
YVU 2011.0000 1.0000 ANN 4.0000 0.0065 0.0000 14.4254 1.0771 0.0119
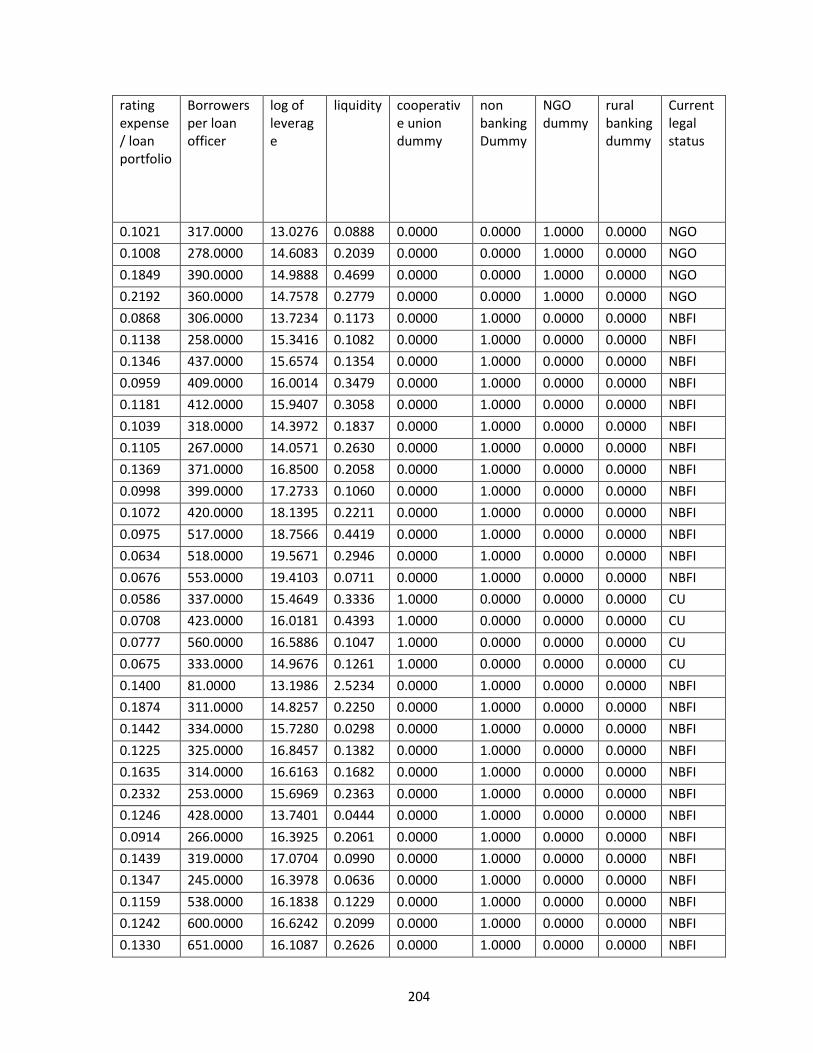
204
rating expense/ loan portfolio
Borrowers per loan officer
log of leverage
liquidity cooperative union dummy
non banking Dummy
NGO dummy
rural banking dummy
Current legal status
0.1021 317.0000 13.0276 0.0888 0.0000 0.0000 1.0000 0.0000 NGO
0.1008 278.0000 14.6083 0.2039 0.0000 0.0000 1.0000 0.0000 NGO
0.1849 390.0000 14.9888 0.4699 0.0000 0.0000 1.0000 0.0000 NGO
0.2192 360.0000 14.7578 0.2779 0.0000 0.0000 1.0000 0.0000 NGO
0.0868 306.0000 13.7234 0.1173 0.0000 1.0000 0.0000 0.0000 NBFI
0.1138 258.0000 15.3416 0.1082 0.0000 1.0000 0.0000 0.0000 NBFI
0.1346 437.0000 15.6574 0.1354 0.0000 1.0000 0.0000 0.0000 NBFI
0.0959 409.0000 16.0014 0.3479 0.0000 1.0000 0.0000 0.0000 NBFI
0.1181 412.0000 15.9407 0.3058 0.0000 1.0000 0.0000 0.0000 NBFI
0.1039 318.0000 14.3972 0.1837 0.0000 1.0000 0.0000 0.0000 NBFI
0.1105 267.0000 14.0571 0.2630 0.0000 1.0000 0.0000 0.0000 NBFI
0.1369 371.0000 16.8500 0.2058 0.0000 1.0000 0.0000 0.0000 NBFI
0.0998 399.0000 17.2733 0.1060 0.0000 1.0000 0.0000 0.0000 NBFI
0.1072 420.0000 18.1395 0.2211 0.0000 1.0000 0.0000 0.0000 NBFI
0.0975 517.0000 18.7566 0.4419 0.0000 1.0000 0.0000 0.0000 NBFI
0.0634 518.0000 19.5671 0.2946 0.0000 1.0000 0.0000 0.0000 NBFI
0.0676 553.0000 19.4103 0.0711 0.0000 1.0000 0.0000 0.0000 NBFI
0.0586 337.0000 15.4649 0.3336 1.0000 0.0000 0.0000 0.0000 CU
0.0708 423.0000 16.0181 0.4393 1.0000 0.0000 0.0000 0.0000 CU
0.0777 560.0000 16.5886 0.1047 1.0000 0.0000 0.0000 0.0000 CU
0.0675 333.0000 14.9676 0.1261 1.0000 0.0000 0.0000 0.0000 CU
0.1400 81.0000 13.1986 2.5234 0.0000 1.0000 0.0000 0.0000 NBFI
0.1874 311.0000 14.8257 0.2250 0.0000 1.0000 0.0000 0.0000 NBFI
0.1442 334.0000 15.7280 0.0298 0.0000 1.0000 0.0000 0.0000 NBFI
0.1225 325.0000 16.8457 0.1382 0.0000 1.0000 0.0000 0.0000 NBFI
0.1635 314.0000 16.6163 0.1682 0.0000 1.0000 0.0000 0.0000 NBFI
0.2332 253.0000 15.6969 0.2363 0.0000 1.0000 0.0000 0.0000 NBFI
0.1246 428.0000 13.7401 0.0444 0.0000 1.0000 0.0000 0.0000 NBFI
0.0914 266.0000 16.3925 0.2061 0.0000 1.0000 0.0000 0.0000 NBFI
0.1439 319.0000 17.0704 0.0990 0.0000 1.0000 0.0000 0.0000 NBFI
0.1347 245.0000 16.3978 0.0636 0.0000 1.0000 0.0000 0.0000 NBFI
0.1159 538.0000 16.1838 0.1229 0.0000 1.0000 0.0000 0.0000 NBFI
0.1242 600.0000 16.6242 0.2099 0.0000 1.0000 0.0000 0.0000 NBFI
0.1330 651.0000 16.1087 0.2626 0.0000 1.0000 0.0000 0.0000 NBFI
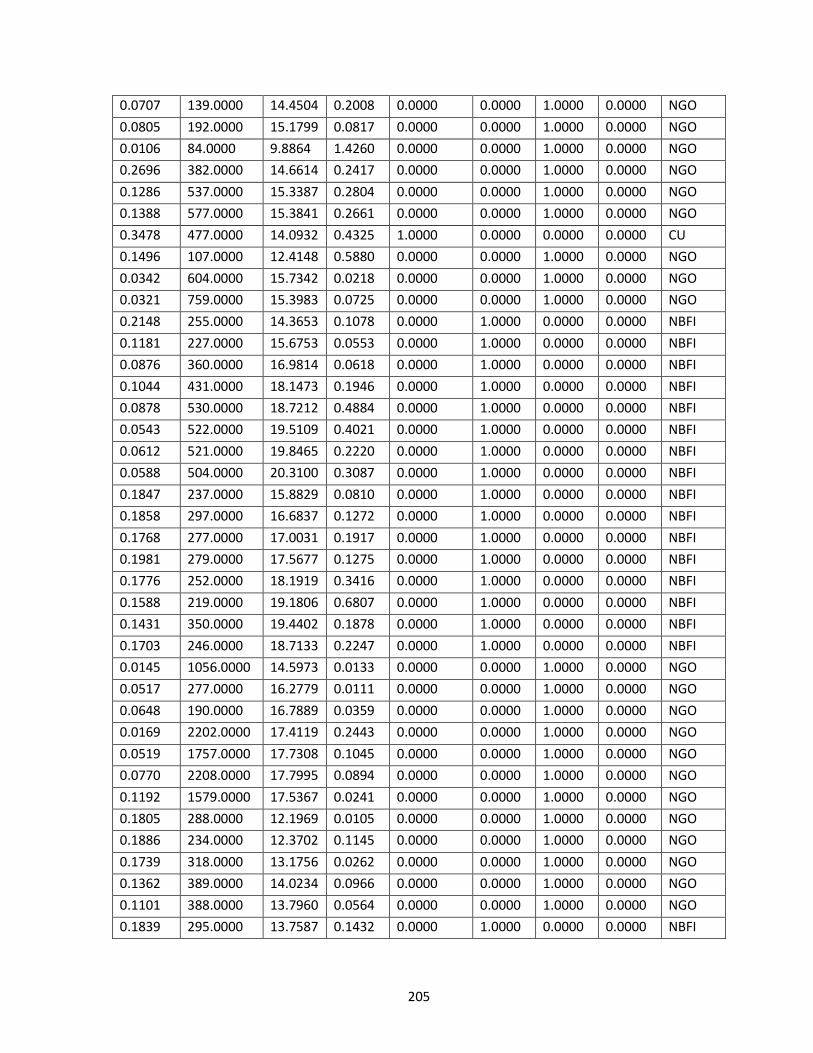
205
0.0707 139.0000 14.4504 0.2008 0.0000 0.0000 1.0000 0.0000 NGO
0.0805 192.0000 15.1799 0.0817 0.0000 0.0000 1.0000 0.0000 NGO
0.0106 84.0000 9.8864 1.4260 0.0000 0.0000 1.0000 0.0000 NGO
0.2696 382.0000 14.6614 0.2417 0.0000 0.0000 1.0000 0.0000 NGO
0.1286 537.0000 15.3387 0.2804 0.0000 0.0000 1.0000 0.0000 NGO
0.1388 577.0000 15.3841 0.2661 0.0000 0.0000 1.0000 0.0000 NGO
0.3478 477.0000 14.0932 0.4325 1.0000 0.0000 0.0000 0.0000 CU
0.1496 107.0000 12.4148 0.5880 0.0000 0.0000 1.0000 0.0000 NGO
0.0342 604.0000 15.7342 0.0218 0.0000 0.0000 1.0000 0.0000 NGO
0.0321 759.0000 15.3983 0.0725 0.0000 0.0000 1.0000 0.0000 NGO
0.2148 255.0000 14.3653 0.1078 0.0000 1.0000 0.0000 0.0000 NBFI
0.1181 227.0000 15.6753 0.0553 0.0000 1.0000 0.0000 0.0000 NBFI
0.0876 360.0000 16.9814 0.0618 0.0000 1.0000 0.0000 0.0000 NBFI
0.1044 431.0000 18.1473 0.1946 0.0000 1.0000 0.0000 0.0000 NBFI
0.0878 530.0000 18.7212 0.4884 0.0000 1.0000 0.0000 0.0000 NBFI
0.0543 522.0000 19.5109 0.4021 0.0000 1.0000 0.0000 0.0000 NBFI
0.0612 521.0000 19.8465 0.2220 0.0000 1.0000 0.0000 0.0000 NBFI
0.0588 504.0000 20.3100 0.3087 0.0000 1.0000 0.0000 0.0000 NBFI
0.1847 237.0000 15.8829 0.0810 0.0000 1.0000 0.0000 0.0000 NBFI
0.1858 297.0000 16.6837 0.1272 0.0000 1.0000 0.0000 0.0000 NBFI
0.1768 277.0000 17.0031 0.1917 0.0000 1.0000 0.0000 0.0000 NBFI
0.1981 279.0000 17.5677 0.1275 0.0000 1.0000 0.0000 0.0000 NBFI
0.1776 252.0000 18.1919 0.3416 0.0000 1.0000 0.0000 0.0000 NBFI
0.1588 219.0000 19.1806 0.6807 0.0000 1.0000 0.0000 0.0000 NBFI
0.1431 350.0000 19.4402 0.1878 0.0000 1.0000 0.0000 0.0000 NBFI
0.1703 246.0000 18.7133 0.2247 0.0000 1.0000 0.0000 0.0000 NBFI
0.0145 1056.0000 14.5973 0.0133 0.0000 0.0000 1.0000 0.0000 NGO
0.0517 277.0000 16.2779 0.0111 0.0000 0.0000 1.0000 0.0000 NGO
0.0648 190.0000 16.7889 0.0359 0.0000 0.0000 1.0000 0.0000 NGO
0.0169 2202.0000 17.4119 0.2443 0.0000 0.0000 1.0000 0.0000 NGO
0.0519 1757.0000 17.7308 0.1045 0.0000 0.0000 1.0000 0.0000 NGO
0.0770 2208.0000 17.7995 0.0894 0.0000 0.0000 1.0000 0.0000 NGO
0.1192 1579.0000 17.5367 0.0241 0.0000 0.0000 1.0000 0.0000 NGO
0.1805 288.0000 12.1969 0.0105 0.0000 0.0000 1.0000 0.0000 NGO
0.1886 234.0000 12.3702 0.1145 0.0000 0.0000 1.0000 0.0000 NGO
0.1739 318.0000 13.1756 0.0262 0.0000 0.0000 1.0000 0.0000 NGO
0.1362 389.0000 14.0234 0.0966 0.0000 0.0000 1.0000 0.0000 NGO
0.1101 388.0000 13.7960 0.0564 0.0000 0.0000 1.0000 0.0000 NGO
0.1839 295.0000 13.7587 0.1432 0.0000 1.0000 0.0000 0.0000 NBFI
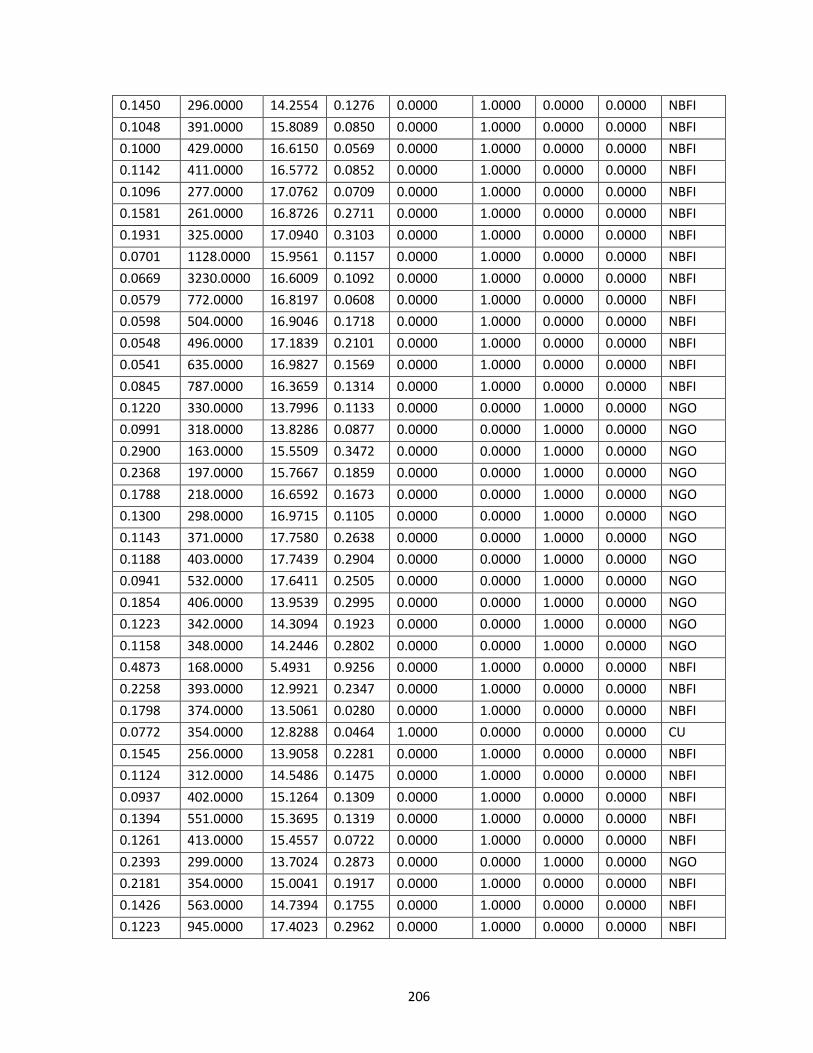
206
0.1450 296.0000 14.2554 0.1276 0.0000 1.0000 0.0000 0.0000 NBFI
0.1048 391.0000 15.8089 0.0850 0.0000 1.0000 0.0000 0.0000 NBFI
0.1000 429.0000 16.6150 0.0569 0.0000 1.0000 0.0000 0.0000 NBFI
0.1142 411.0000 16.5772 0.0852 0.0000 1.0000 0.0000 0.0000 NBFI
0.1096 277.0000 17.0762 0.0709 0.0000 1.0000 0.0000 0.0000 NBFI
0.1581 261.0000 16.8726 0.2711 0.0000 1.0000 0.0000 0.0000 NBFI
0.1931 325.0000 17.0940 0.3103 0.0000 1.0000 0.0000 0.0000 NBFI
0.0701 1128.0000 15.9561 0.1157 0.0000 1.0000 0.0000 0.0000 NBFI
0.0669 3230.0000 16.6009 0.1092 0.0000 1.0000 0.0000 0.0000 NBFI
0.0579 772.0000 16.8197 0.0608 0.0000 1.0000 0.0000 0.0000 NBFI
0.0598 504.0000 16.9046 0.1718 0.0000 1.0000 0.0000 0.0000 NBFI
0.0548 496.0000 17.1839 0.2101 0.0000 1.0000 0.0000 0.0000 NBFI
0.0541 635.0000 16.9827 0.1569 0.0000 1.0000 0.0000 0.0000 NBFI
0.0845 787.0000 16.3659 0.1314 0.0000 1.0000 0.0000 0.0000 NBFI
0.1220 330.0000 13.7996 0.1133 0.0000 0.0000 1.0000 0.0000 NGO
0.0991 318.0000 13.8286 0.0877 0.0000 0.0000 1.0000 0.0000 NGO
0.2900 163.0000 15.5509 0.3472 0.0000 0.0000 1.0000 0.0000 NGO
0.2368 197.0000 15.7667 0.1859 0.0000 0.0000 1.0000 0.0000 NGO
0.1788 218.0000 16.6592 0.1673 0.0000 0.0000 1.0000 0.0000 NGO
0.1300 298.0000 16.9715 0.1105 0.0000 0.0000 1.0000 0.0000 NGO
0.1143 371.0000 17.7580 0.2638 0.0000 0.0000 1.0000 0.0000 NGO
0.1188 403.0000 17.7439 0.2904 0.0000 0.0000 1.0000 0.0000 NGO
0.0941 532.0000 17.6411 0.2505 0.0000 0.0000 1.0000 0.0000 NGO
0.1854 406.0000 13.9539 0.2995 0.0000 0.0000 1.0000 0.0000 NGO
0.1223 342.0000 14.3094 0.1923 0.0000 0.0000 1.0000 0.0000 NGO
0.1158 348.0000 14.2446 0.2802 0.0000 0.0000 1.0000 0.0000 NGO
0.4873 168.0000 5.4931 0.9256 0.0000 1.0000 0.0000 0.0000 NBFI
0.2258 393.0000 12.9921 0.2347 0.0000 1.0000 0.0000 0.0000 NBFI
0.1798 374.0000 13.5061 0.0280 0.0000 1.0000 0.0000 0.0000 NBFI
0.0772 354.0000 12.8288 0.0464 1.0000 0.0000 0.0000 0.0000 CU
0.1545 256.0000 13.9058 0.2281 0.0000 1.0000 0.0000 0.0000 NBFI
0.1124 312.0000 14.5486 0.1475 0.0000 1.0000 0.0000 0.0000 NBFI
0.0937 402.0000 15.1264 0.1309 0.0000 1.0000 0.0000 0.0000 NBFI
0.1394 551.0000 15.3695 0.1319 0.0000 1.0000 0.0000 0.0000 NBFI
0.1261 413.0000 15.4557 0.0722 0.0000 1.0000 0.0000 0.0000 NBFI
0.2393 299.0000 13.7024 0.2873 0.0000 0.0000 1.0000 0.0000 NGO
0.2181 354.0000 15.0041 0.1917 0.0000 1.0000 0.0000 0.0000 NBFI
0.1426 563.0000 14.7394 0.1755 0.0000 1.0000 0.0000 0.0000 NBFI
0.1223 945.0000 17.4023 0.2962 0.0000 1.0000 0.0000 0.0000 NBFI
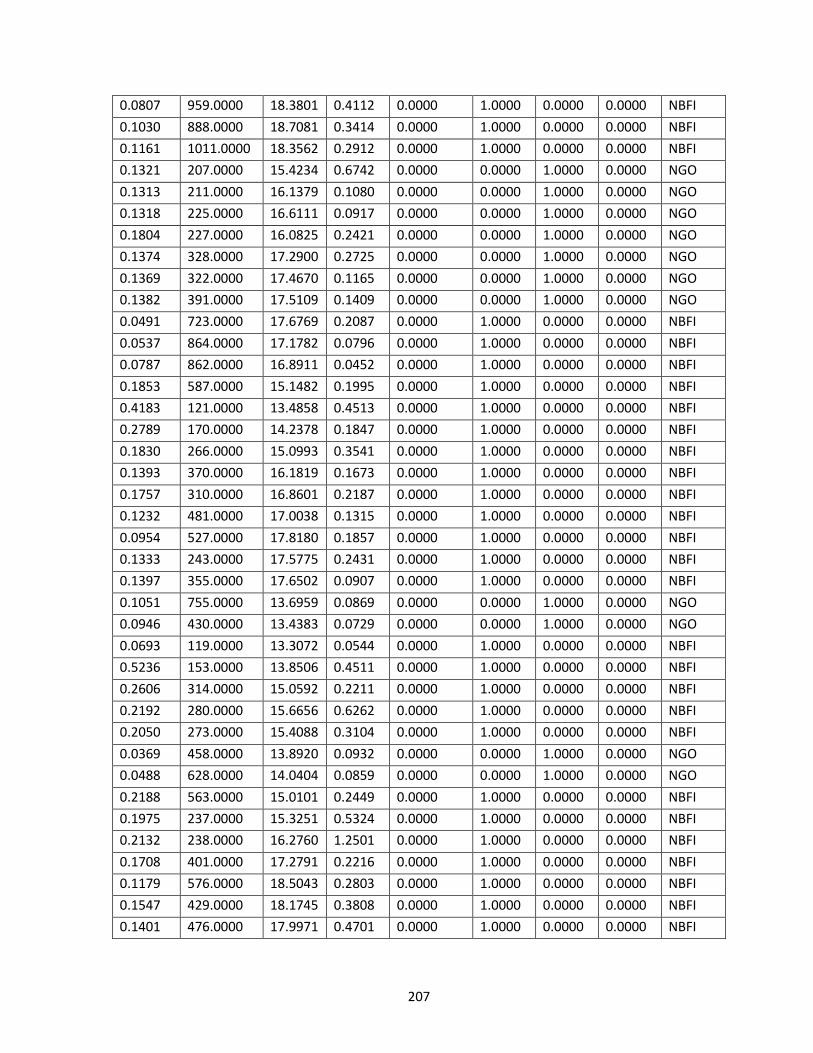
207
0.0807 959.0000 18.3801 0.4112 0.0000 1.0000 0.0000 0.0000 NBFI
0.1030 888.0000 18.7081 0.3414 0.0000 1.0000 0.0000 0.0000 NBFI
0.1161 1011.0000 18.3562 0.2912 0.0000 1.0000 0.0000 0.0000 NBFI
0.1321 207.0000 15.4234 0.6742 0.0000 0.0000 1.0000 0.0000 NGO
0.1313 211.0000 16.1379 0.1080 0.0000 0.0000 1.0000 0.0000 NGO
0.1318 225.0000 16.6111 0.0917 0.0000 0.0000 1.0000 0.0000 NGO
0.1804 227.0000 16.0825 0.2421 0.0000 0.0000 1.0000 0.0000 NGO
0.1374 328.0000 17.2900 0.2725 0.0000 0.0000 1.0000 0.0000 NGO
0.1369 322.0000 17.4670 0.1165 0.0000 0.0000 1.0000 0.0000 NGO
0.1382 391.0000 17.5109 0.1409 0.0000 0.0000 1.0000 0.0000 NGO
0.0491 723.0000 17.6769 0.2087 0.0000 1.0000 0.0000 0.0000 NBFI
0.0537 864.0000 17.1782 0.0796 0.0000 1.0000 0.0000 0.0000 NBFI
0.0787 862.0000 16.8911 0.0452 0.0000 1.0000 0.0000 0.0000 NBFI
0.1853 587.0000 15.1482 0.1995 0.0000 1.0000 0.0000 0.0000 NBFI
0.4183 121.0000 13.4858 0.4513 0.0000 1.0000 0.0000 0.0000 NBFI
0.2789 170.0000 14.2378 0.1847 0.0000 1.0000 0.0000 0.0000 NBFI
0.1830 266.0000 15.0993 0.3541 0.0000 1.0000 0.0000 0.0000 NBFI
0.1393 370.0000 16.1819 0.1673 0.0000 1.0000 0.0000 0.0000 NBFI
0.1757 310.0000 16.8601 0.2187 0.0000 1.0000 0.0000 0.0000 NBFI
0.1232 481.0000 17.0038 0.1315 0.0000 1.0000 0.0000 0.0000 NBFI
0.0954 527.0000 17.8180 0.1857 0.0000 1.0000 0.0000 0.0000 NBFI
0.1333 243.0000 17.5775 0.2431 0.0000 1.0000 0.0000 0.0000 NBFI
0.1397 355.0000 17.6502 0.0907 0.0000 1.0000 0.0000 0.0000 NBFI
0.1051 755.0000 13.6959 0.0869 0.0000 0.0000 1.0000 0.0000 NGO
0.0946 430.0000 13.4383 0.0729 0.0000 0.0000 1.0000 0.0000 NGO
0.0693 119.0000 13.3072 0.0544 0.0000 1.0000 0.0000 0.0000 NBFI
0.5236 153.0000 13.8506 0.4511 0.0000 1.0000 0.0000 0.0000 NBFI
0.2606 314.0000 15.0592 0.2211 0.0000 1.0000 0.0000 0.0000 NBFI
0.2192 280.0000 15.6656 0.6262 0.0000 1.0000 0.0000 0.0000 NBFI
0.2050 273.0000 15.4088 0.3104 0.0000 1.0000 0.0000 0.0000 NBFI
0.0369 458.0000 13.8920 0.0932 0.0000 0.0000 1.0000 0.0000 NGO
0.0488 628.0000 14.0404 0.0859 0.0000 0.0000 1.0000 0.0000 NGO
0.2188 563.0000 15.0101 0.2449 0.0000 1.0000 0.0000 0.0000 NBFI
0.1975 237.0000 15.3251 0.5324 0.0000 1.0000 0.0000 0.0000 NBFI
0.2132 238.0000 16.2760 1.2501 0.0000 1.0000 0.0000 0.0000 NBFI
0.1708 401.0000 17.2791 0.2216 0.0000 1.0000 0.0000 0.0000 NBFI
0.1179 576.0000 18.5043 0.2803 0.0000 1.0000 0.0000 0.0000 NBFI
0.1547 429.0000 18.1745 0.3808 0.0000 1.0000 0.0000 0.0000 NBFI
0.1401 476.0000 17.9971 0.4701 0.0000 1.0000 0.0000 0.0000 NBFI
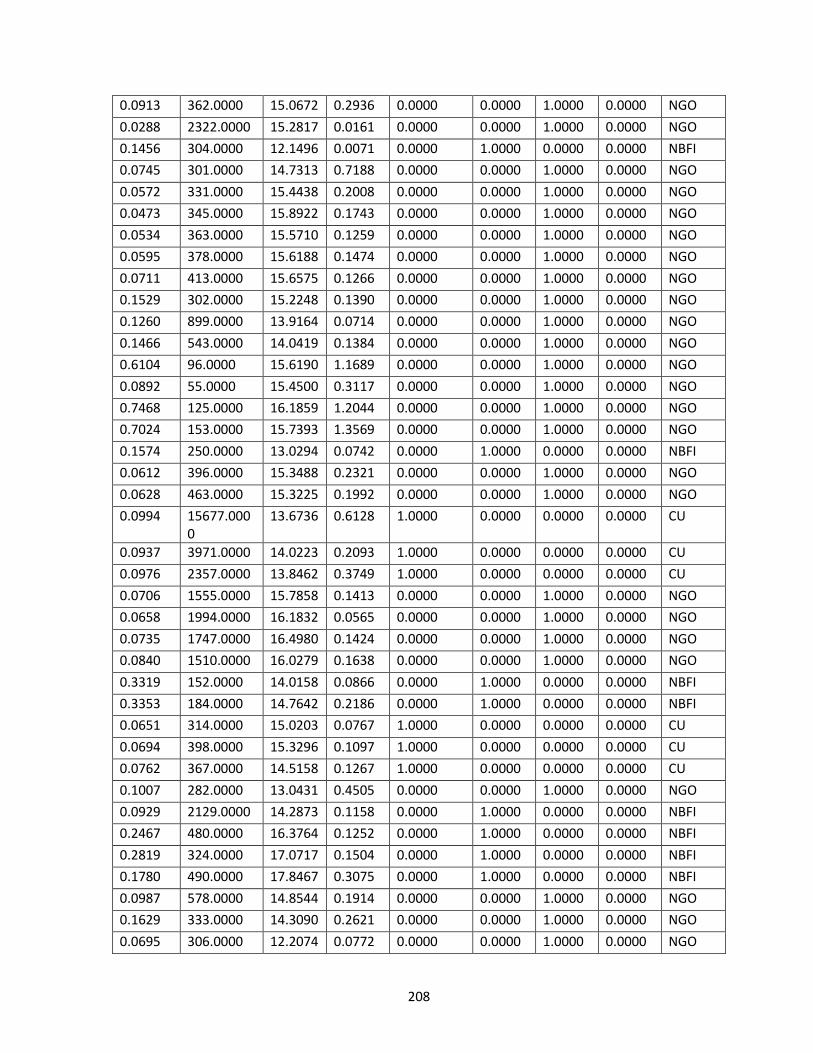
208
0.0913 362.0000 15.0672 0.2936 0.0000 0.0000 1.0000 0.0000 NGO
0.0288 2322.0000 15.2817 0.0161 0.0000 0.0000 1.0000 0.0000 NGO
0.1456 304.0000 12.1496 0.0071 0.0000 1.0000 0.0000 0.0000 NBFI
0.0745 301.0000 14.7313 0.7188 0.0000 0.0000 1.0000 0.0000 NGO
0.0572 331.0000 15.4438 0.2008 0.0000 0.0000 1.0000 0.0000 NGO
0.0473 345.0000 15.8922 0.1743 0.0000 0.0000 1.0000 0.0000 NGO
0.0534 363.0000 15.5710 0.1259 0.0000 0.0000 1.0000 0.0000 NGO
0.0595 378.0000 15.6188 0.1474 0.0000 0.0000 1.0000 0.0000 NGO
0.0711 413.0000 15.6575 0.1266 0.0000 0.0000 1.0000 0.0000 NGO
0.1529 302.0000 15.2248 0.1390 0.0000 0.0000 1.0000 0.0000 NGO
0.1260 899.0000 13.9164 0.0714 0.0000 0.0000 1.0000 0.0000 NGO
0.1466 543.0000 14.0419 0.1384 0.0000 0.0000 1.0000 0.0000 NGO
0.6104 96.0000 15.6190 1.1689 0.0000 0.0000 1.0000 0.0000 NGO
0.0892 55.0000 15.4500 0.3117 0.0000 0.0000 1.0000 0.0000 NGO
0.7468 125.0000 16.1859 1.2044 0.0000 0.0000 1.0000 0.0000 NGO
0.7024 153.0000 15.7393 1.3569 0.0000 0.0000 1.0000 0.0000 NGO
0.1574 250.0000 13.0294 0.0742 0.0000 1.0000 0.0000 0.0000 NBFI
0.0612 396.0000 15.3488 0.2321 0.0000 0.0000 1.0000 0.0000 NGO
0.0628 463.0000 15.3225 0.1992 0.0000 0.0000 1.0000 0.0000 NGO
0.0994 15677.0000
13.6736 0.6128 1.0000 0.0000 0.0000 0.0000 CU
0.0937 3971.0000 14.0223 0.2093 1.0000 0.0000 0.0000 0.0000 CU
0.0976 2357.0000 13.8462 0.3749 1.0000 0.0000 0.0000 0.0000 CU
0.0706 1555.0000 15.7858 0.1413 0.0000 0.0000 1.0000 0.0000 NGO
0.0658 1994.0000 16.1832 0.0565 0.0000 0.0000 1.0000 0.0000 NGO
0.0735 1747.0000 16.4980 0.1424 0.0000 0.0000 1.0000 0.0000 NGO
0.0840 1510.0000 16.0279 0.1638 0.0000 0.0000 1.0000 0.0000 NGO
0.3319 152.0000 14.0158 0.0866 0.0000 1.0000 0.0000 0.0000 NBFI
0.3353 184.0000 14.7642 0.2186 0.0000 1.0000 0.0000 0.0000 NBFI
0.0651 314.0000 15.0203 0.0767 1.0000 0.0000 0.0000 0.0000 CU
0.0694 398.0000 15.3296 0.1097 1.0000 0.0000 0.0000 0.0000 CU
0.0762 367.0000 14.5158 0.1267 1.0000 0.0000 0.0000 0.0000 CU
0.1007 282.0000 13.0431 0.4505 0.0000 0.0000 1.0000 0.0000 NGO
0.0929 2129.0000 14.2873 0.1158 0.0000 1.0000 0.0000 0.0000 NBFI
0.2467 480.0000 16.3764 0.1252 0.0000 1.0000 0.0000 0.0000 NBFI
0.2819 324.0000 17.0717 0.1504 0.0000 1.0000 0.0000 0.0000 NBFI
0.1780 490.0000 17.8467 0.3075 0.0000 1.0000 0.0000 0.0000 NBFI
0.0987 578.0000 14.8544 0.1914 0.0000 0.0000 1.0000 0.0000 NGO
0.1629 333.0000 14.3090 0.2621 0.0000 0.0000 1.0000 0.0000 NGO
0.0695 306.0000 12.2074 0.0772 0.0000 0.0000 1.0000 0.0000 NGO
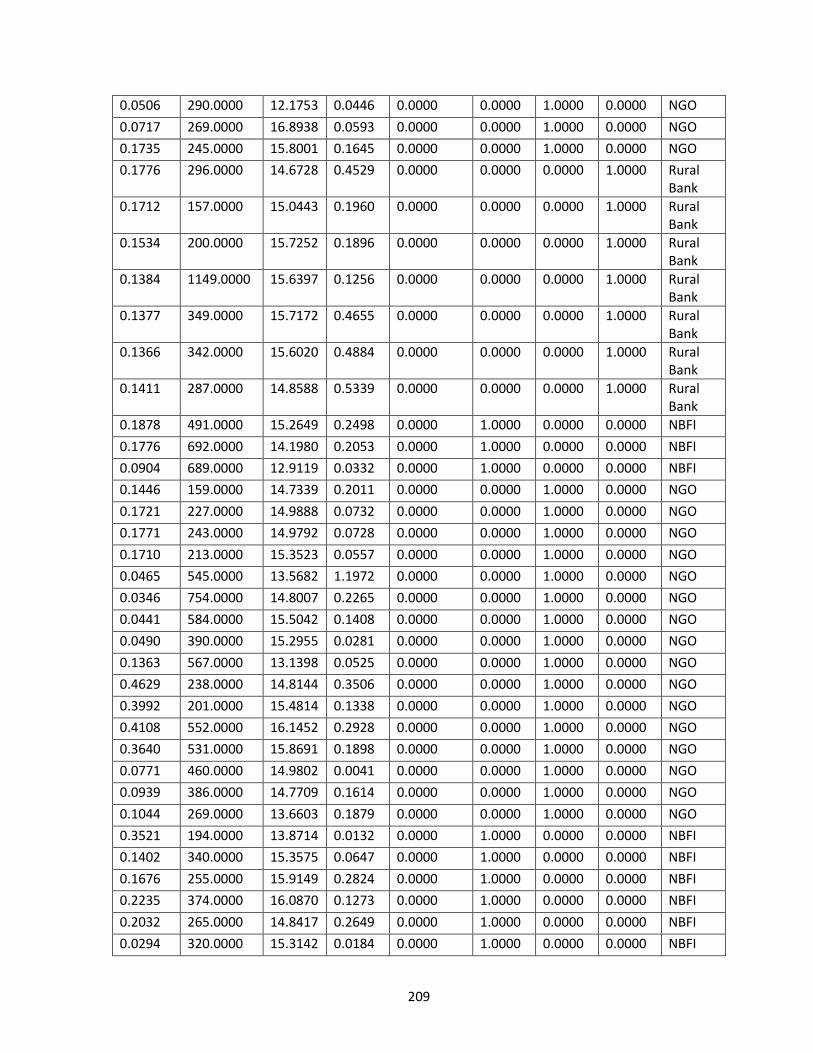
209
0.0506 290.0000 12.1753 0.0446 0.0000 0.0000 1.0000 0.0000 NGO
0.0717 269.0000 16.8938 0.0593 0.0000 0.0000 1.0000 0.0000 NGO
0.1735 245.0000 15.8001 0.1645 0.0000 0.0000 1.0000 0.0000 NGO
0.1776 296.0000 14.6728 0.4529 0.0000 0.0000 0.0000 1.0000 Rural Bank
0.1712 157.0000 15.0443 0.1960 0.0000 0.0000 0.0000 1.0000 Rural Bank
0.1534 200.0000 15.7252 0.1896 0.0000 0.0000 0.0000 1.0000 Rural Bank
0.1384 1149.0000 15.6397 0.1256 0.0000 0.0000 0.0000 1.0000 Rural Bank
0.1377 349.0000 15.7172 0.4655 0.0000 0.0000 0.0000 1.0000 Rural Bank
0.1366 342.0000 15.6020 0.4884 0.0000 0.0000 0.0000 1.0000 Rural Bank
0.1411 287.0000 14.8588 0.5339 0.0000 0.0000 0.0000 1.0000 Rural Bank
0.1878 491.0000 15.2649 0.2498 0.0000 1.0000 0.0000 0.0000 NBFI
0.1776 692.0000 14.1980 0.2053 0.0000 1.0000 0.0000 0.0000 NBFI
0.0904 689.0000 12.9119 0.0332 0.0000 1.0000 0.0000 0.0000 NBFI
0.1446 159.0000 14.7339 0.2011 0.0000 0.0000 1.0000 0.0000 NGO
0.1721 227.0000 14.9888 0.0732 0.0000 0.0000 1.0000 0.0000 NGO
0.1771 243.0000 14.9792 0.0728 0.0000 0.0000 1.0000 0.0000 NGO
0.1710 213.0000 15.3523 0.0557 0.0000 0.0000 1.0000 0.0000 NGO
0.0465 545.0000 13.5682 1.1972 0.0000 0.0000 1.0000 0.0000 NGO
0.0346 754.0000 14.8007 0.2265 0.0000 0.0000 1.0000 0.0000 NGO
0.0441 584.0000 15.5042 0.1408 0.0000 0.0000 1.0000 0.0000 NGO
0.0490 390.0000 15.2955 0.0281 0.0000 0.0000 1.0000 0.0000 NGO
0.1363 567.0000 13.1398 0.0525 0.0000 0.0000 1.0000 0.0000 NGO
0.4629 238.0000 14.8144 0.3506 0.0000 0.0000 1.0000 0.0000 NGO
0.3992 201.0000 15.4814 0.1338 0.0000 0.0000 1.0000 0.0000 NGO
0.4108 552.0000 16.1452 0.2928 0.0000 0.0000 1.0000 0.0000 NGO
0.3640 531.0000 15.8691 0.1898 0.0000 0.0000 1.0000 0.0000 NGO
0.0771 460.0000 14.9802 0.0041 0.0000 0.0000 1.0000 0.0000 NGO
0.0939 386.0000 14.7709 0.1614 0.0000 0.0000 1.0000 0.0000 NGO
0.1044 269.0000 13.6603 0.1879 0.0000 0.0000 1.0000 0.0000 NGO
0.3521 194.0000 13.8714 0.0132 0.0000 1.0000 0.0000 0.0000 NBFI
0.1402 340.0000 15.3575 0.0647 0.0000 1.0000 0.0000 0.0000 NBFI
0.1676 255.0000 15.9149 0.2824 0.0000 1.0000 0.0000 0.0000 NBFI
0.2235 374.0000 16.0870 0.1273 0.0000 1.0000 0.0000 0.0000 NBFI
0.2032 265.0000 14.8417 0.2649 0.0000 1.0000 0.0000 0.0000 NBFI
0.0294 320.0000 15.3142 0.0184 0.0000 1.0000 0.0000 0.0000 NBFI
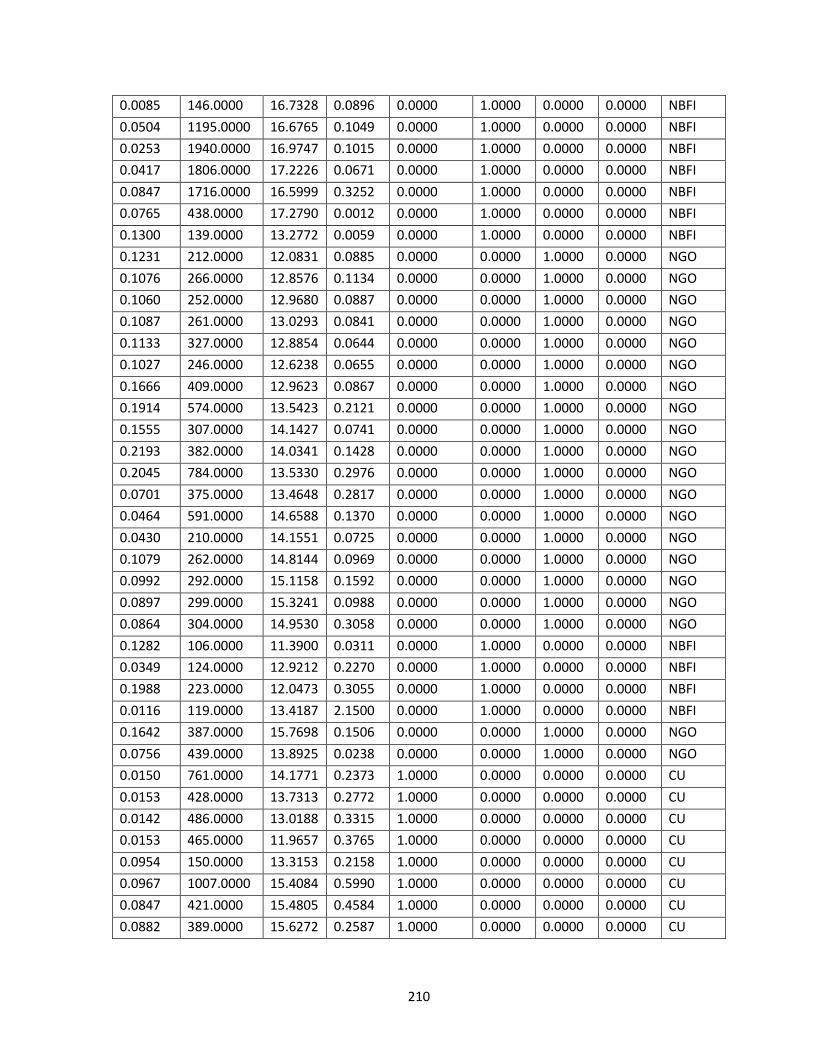
210
0.0085 146.0000 16.7328 0.0896 0.0000 1.0000 0.0000 0.0000 NBFI
0.0504 1195.0000 16.6765 0.1049 0.0000 1.0000 0.0000 0.0000 NBFI
0.0253 1940.0000 16.9747 0.1015 0.0000 1.0000 0.0000 0.0000 NBFI
0.0417 1806.0000 17.2226 0.0671 0.0000 1.0000 0.0000 0.0000 NBFI
0.0847 1716.0000 16.5999 0.3252 0.0000 1.0000 0.0000 0.0000 NBFI
0.0765 438.0000 17.2790 0.0012 0.0000 1.0000 0.0000 0.0000 NBFI
0.1300 139.0000 13.2772 0.0059 0.0000 1.0000 0.0000 0.0000 NBFI
0.1231 212.0000 12.0831 0.0885 0.0000 0.0000 1.0000 0.0000 NGO
0.1076 266.0000 12.8576 0.1134 0.0000 0.0000 1.0000 0.0000 NGO
0.1060 252.0000 12.9680 0.0887 0.0000 0.0000 1.0000 0.0000 NGO
0.1087 261.0000 13.0293 0.0841 0.0000 0.0000 1.0000 0.0000 NGO
0.1133 327.0000 12.8854 0.0644 0.0000 0.0000 1.0000 0.0000 NGO
0.1027 246.0000 12.6238 0.0655 0.0000 0.0000 1.0000 0.0000 NGO
0.1666 409.0000 12.9623 0.0867 0.0000 0.0000 1.0000 0.0000 NGO
0.1914 574.0000 13.5423 0.2121 0.0000 0.0000 1.0000 0.0000 NGO
0.1555 307.0000 14.1427 0.0741 0.0000 0.0000 1.0000 0.0000 NGO
0.2193 382.0000 14.0341 0.1428 0.0000 0.0000 1.0000 0.0000 NGO
0.2045 784.0000 13.5330 0.2976 0.0000 0.0000 1.0000 0.0000 NGO
0.0701 375.0000 13.4648 0.2817 0.0000 0.0000 1.0000 0.0000 NGO
0.0464 591.0000 14.6588 0.1370 0.0000 0.0000 1.0000 0.0000 NGO
0.0430 210.0000 14.1551 0.0725 0.0000 0.0000 1.0000 0.0000 NGO
0.1079 262.0000 14.8144 0.0969 0.0000 0.0000 1.0000 0.0000 NGO
0.0992 292.0000 15.1158 0.1592 0.0000 0.0000 1.0000 0.0000 NGO
0.0897 299.0000 15.3241 0.0988 0.0000 0.0000 1.0000 0.0000 NGO
0.0864 304.0000 14.9530 0.3058 0.0000 0.0000 1.0000 0.0000 NGO
0.1282 106.0000 11.3900 0.0311 0.0000 1.0000 0.0000 0.0000 NBFI
0.0349 124.0000 12.9212 0.2270 0.0000 1.0000 0.0000 0.0000 NBFI
0.1988 223.0000 12.0473 0.3055 0.0000 1.0000 0.0000 0.0000 NBFI
0.0116 119.0000 13.4187 2.1500 0.0000 1.0000 0.0000 0.0000 NBFI
0.1642 387.0000 15.7698 0.1506 0.0000 0.0000 1.0000 0.0000 NGO
0.0756 439.0000 13.8925 0.0238 0.0000 0.0000 1.0000 0.0000 NGO
0.0150 761.0000 14.1771 0.2373 1.0000 0.0000 0.0000 0.0000 CU
0.0153 428.0000 13.7313 0.2772 1.0000 0.0000 0.0000 0.0000 CU
0.0142 486.0000 13.0188 0.3315 1.0000 0.0000 0.0000 0.0000 CU
0.0153 465.0000 11.9657 0.3765 1.0000 0.0000 0.0000 0.0000 CU
0.0954 150.0000 13.3153 0.2158 1.0000 0.0000 0.0000 0.0000 CU
0.0967 1007.0000 15.4084 0.5990 1.0000 0.0000 0.0000 0.0000 CU
0.0847 421.0000 15.4805 0.4584 1.0000 0.0000 0.0000 0.0000 CU
0.0882 389.0000 15.6272 0.2587 1.0000 0.0000 0.0000 0.0000 CU
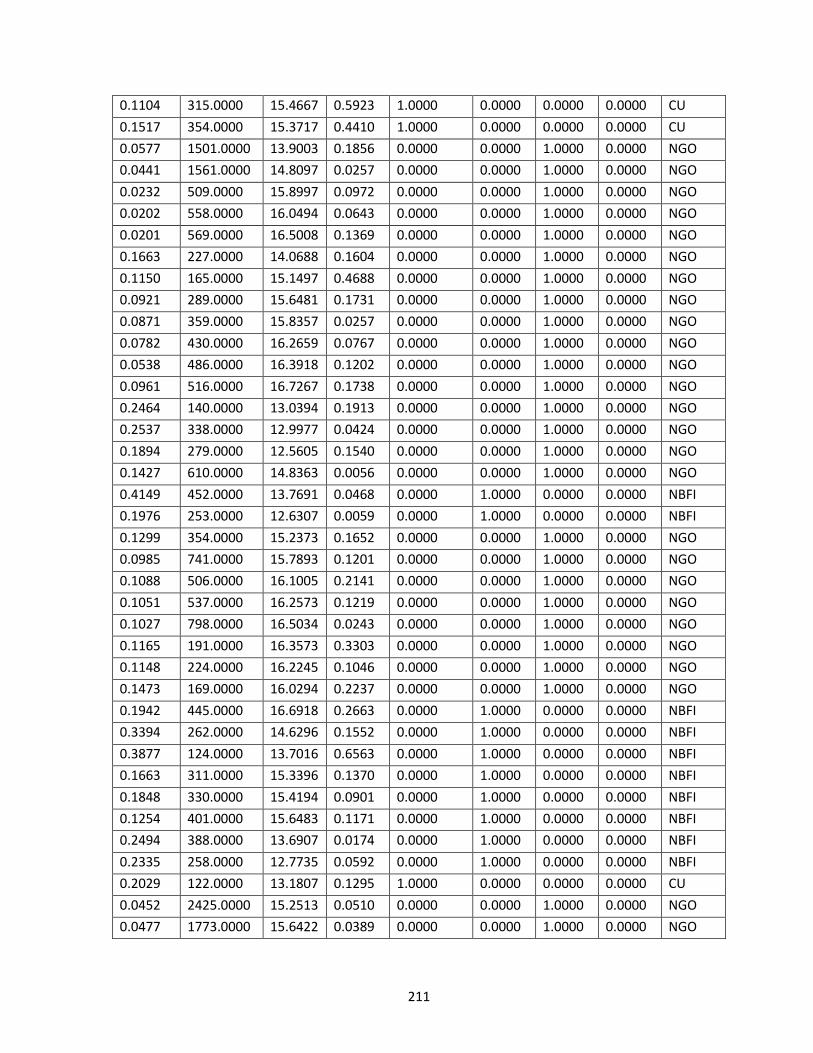
211
0.1104 315.0000 15.4667 0.5923 1.0000 0.0000 0.0000 0.0000 CU
0.1517 354.0000 15.3717 0.4410 1.0000 0.0000 0.0000 0.0000 CU
0.0577 1501.0000 13.9003 0.1856 0.0000 0.0000 1.0000 0.0000 NGO
0.0441 1561.0000 14.8097 0.0257 0.0000 0.0000 1.0000 0.0000 NGO
0.0232 509.0000 15.8997 0.0972 0.0000 0.0000 1.0000 0.0000 NGO
0.0202 558.0000 16.0494 0.0643 0.0000 0.0000 1.0000 0.0000 NGO
0.0201 569.0000 16.5008 0.1369 0.0000 0.0000 1.0000 0.0000 NGO
0.1663 227.0000 14.0688 0.1604 0.0000 0.0000 1.0000 0.0000 NGO
0.1150 165.0000 15.1497 0.4688 0.0000 0.0000 1.0000 0.0000 NGO
0.0921 289.0000 15.6481 0.1731 0.0000 0.0000 1.0000 0.0000 NGO
0.0871 359.0000 15.8357 0.0257 0.0000 0.0000 1.0000 0.0000 NGO
0.0782 430.0000 16.2659 0.0767 0.0000 0.0000 1.0000 0.0000 NGO
0.0538 486.0000 16.3918 0.1202 0.0000 0.0000 1.0000 0.0000 NGO
0.0961 516.0000 16.7267 0.1738 0.0000 0.0000 1.0000 0.0000 NGO
0.2464 140.0000 13.0394 0.1913 0.0000 0.0000 1.0000 0.0000 NGO
0.2537 338.0000 12.9977 0.0424 0.0000 0.0000 1.0000 0.0000 NGO
0.1894 279.0000 12.5605 0.1540 0.0000 0.0000 1.0000 0.0000 NGO
0.1427 610.0000 14.8363 0.0056 0.0000 0.0000 1.0000 0.0000 NGO
0.4149 452.0000 13.7691 0.0468 0.0000 1.0000 0.0000 0.0000 NBFI
0.1976 253.0000 12.6307 0.0059 0.0000 1.0000 0.0000 0.0000 NBFI
0.1299 354.0000 15.2373 0.1652 0.0000 0.0000 1.0000 0.0000 NGO
0.0985 741.0000 15.7893 0.1201 0.0000 0.0000 1.0000 0.0000 NGO
0.1088 506.0000 16.1005 0.2141 0.0000 0.0000 1.0000 0.0000 NGO
0.1051 537.0000 16.2573 0.1219 0.0000 0.0000 1.0000 0.0000 NGO
0.1027 798.0000 16.5034 0.0243 0.0000 0.0000 1.0000 0.0000 NGO
0.1165 191.0000 16.3573 0.3303 0.0000 0.0000 1.0000 0.0000 NGO
0.1148 224.0000 16.2245 0.1046 0.0000 0.0000 1.0000 0.0000 NGO
0.1473 169.0000 16.0294 0.2237 0.0000 0.0000 1.0000 0.0000 NGO
0.1942 445.0000 16.6918 0.2663 0.0000 1.0000 0.0000 0.0000 NBFI
0.3394 262.0000 14.6296 0.1552 0.0000 1.0000 0.0000 0.0000 NBFI
0.3877 124.0000 13.7016 0.6563 0.0000 1.0000 0.0000 0.0000 NBFI
0.1663 311.0000 15.3396 0.1370 0.0000 1.0000 0.0000 0.0000 NBFI
0.1848 330.0000 15.4194 0.0901 0.0000 1.0000 0.0000 0.0000 NBFI
0.1254 401.0000 15.6483 0.1171 0.0000 1.0000 0.0000 0.0000 NBFI
0.2494 388.0000 13.6907 0.0174 0.0000 1.0000 0.0000 0.0000 NBFI
0.2335 258.0000 12.7735 0.0592 0.0000 1.0000 0.0000 0.0000 NBFI
0.2029 122.0000 13.1807 0.1295 1.0000 0.0000 0.0000 0.0000 CU
0.0452 2425.0000 15.2513 0.0510 0.0000 0.0000 1.0000 0.0000 NGO
0.0477 1773.0000 15.6422 0.0389 0.0000 0.0000 1.0000 0.0000 NGO
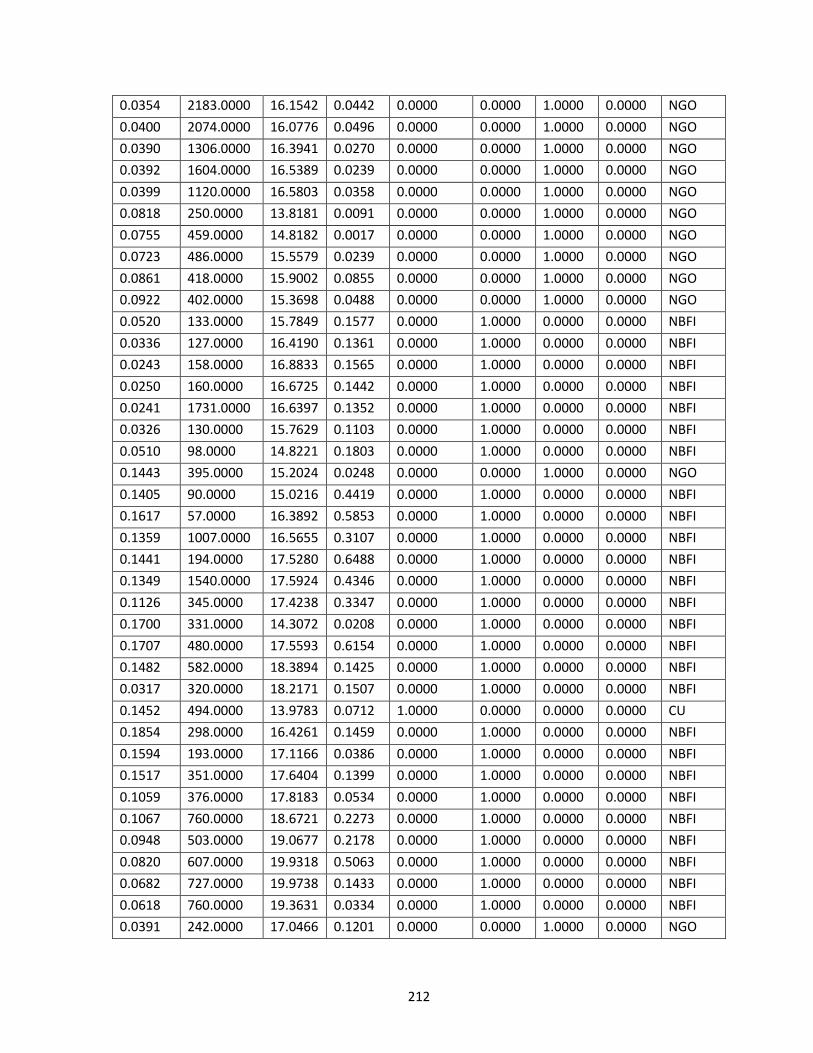
212
0.0354 2183.0000 16.1542 0.0442 0.0000 0.0000 1.0000 0.0000 NGO
0.0400 2074.0000 16.0776 0.0496 0.0000 0.0000 1.0000 0.0000 NGO
0.0390 1306.0000 16.3941 0.0270 0.0000 0.0000 1.0000 0.0000 NGO
0.0392 1604.0000 16.5389 0.0239 0.0000 0.0000 1.0000 0.0000 NGO
0.0399 1120.0000 16.5803 0.0358 0.0000 0.0000 1.0000 0.0000 NGO
0.0818 250.0000 13.8181 0.0091 0.0000 0.0000 1.0000 0.0000 NGO
0.0755 459.0000 14.8182 0.0017 0.0000 0.0000 1.0000 0.0000 NGO
0.0723 486.0000 15.5579 0.0239 0.0000 0.0000 1.0000 0.0000 NGO
0.0861 418.0000 15.9002 0.0855 0.0000 0.0000 1.0000 0.0000 NGO
0.0922 402.0000 15.3698 0.0488 0.0000 0.0000 1.0000 0.0000 NGO
0.0520 133.0000 15.7849 0.1577 0.0000 1.0000 0.0000 0.0000 NBFI
0.0336 127.0000 16.4190 0.1361 0.0000 1.0000 0.0000 0.0000 NBFI
0.0243 158.0000 16.8833 0.1565 0.0000 1.0000 0.0000 0.0000 NBFI
0.0250 160.0000 16.6725 0.1442 0.0000 1.0000 0.0000 0.0000 NBFI
0.0241 1731.0000 16.6397 0.1352 0.0000 1.0000 0.0000 0.0000 NBFI
0.0326 130.0000 15.7629 0.1103 0.0000 1.0000 0.0000 0.0000 NBFI
0.0510 98.0000 14.8221 0.1803 0.0000 1.0000 0.0000 0.0000 NBFI
0.1443 395.0000 15.2024 0.0248 0.0000 0.0000 1.0000 0.0000 NGO
0.1405 90.0000 15.0216 0.4419 0.0000 1.0000 0.0000 0.0000 NBFI
0.1617 57.0000 16.3892 0.5853 0.0000 1.0000 0.0000 0.0000 NBFI
0.1359 1007.0000 16.5655 0.3107 0.0000 1.0000 0.0000 0.0000 NBFI
0.1441 194.0000 17.5280 0.6488 0.0000 1.0000 0.0000 0.0000 NBFI
0.1349 1540.0000 17.5924 0.4346 0.0000 1.0000 0.0000 0.0000 NBFI
0.1126 345.0000 17.4238 0.3347 0.0000 1.0000 0.0000 0.0000 NBFI
0.1700 331.0000 14.3072 0.0208 0.0000 1.0000 0.0000 0.0000 NBFI
0.1707 480.0000 17.5593 0.6154 0.0000 1.0000 0.0000 0.0000 NBFI
0.1482 582.0000 18.3894 0.1425 0.0000 1.0000 0.0000 0.0000 NBFI
0.0317 320.0000 18.2171 0.1507 0.0000 1.0000 0.0000 0.0000 NBFI
0.1452 494.0000 13.9783 0.0712 1.0000 0.0000 0.0000 0.0000 CU
0.1854 298.0000 16.4261 0.1459 0.0000 1.0000 0.0000 0.0000 NBFI
0.1594 193.0000 17.1166 0.0386 0.0000 1.0000 0.0000 0.0000 NBFI
0.1517 351.0000 17.6404 0.1399 0.0000 1.0000 0.0000 0.0000 NBFI
0.1059 376.0000 17.8183 0.0534 0.0000 1.0000 0.0000 0.0000 NBFI
0.1067 760.0000 18.6721 0.2273 0.0000 1.0000 0.0000 0.0000 NBFI
0.0948 503.0000 19.0677 0.2178 0.0000 1.0000 0.0000 0.0000 NBFI
0.0820 607.0000 19.9318 0.5063 0.0000 1.0000 0.0000 0.0000 NBFI
0.0682 727.0000 19.9738 0.1433 0.0000 1.0000 0.0000 0.0000 NBFI
0.0618 760.0000 19.3631 0.0334 0.0000 1.0000 0.0000 0.0000 NBFI
0.0391 242.0000 17.0466 0.1201 0.0000 0.0000 1.0000 0.0000 NGO
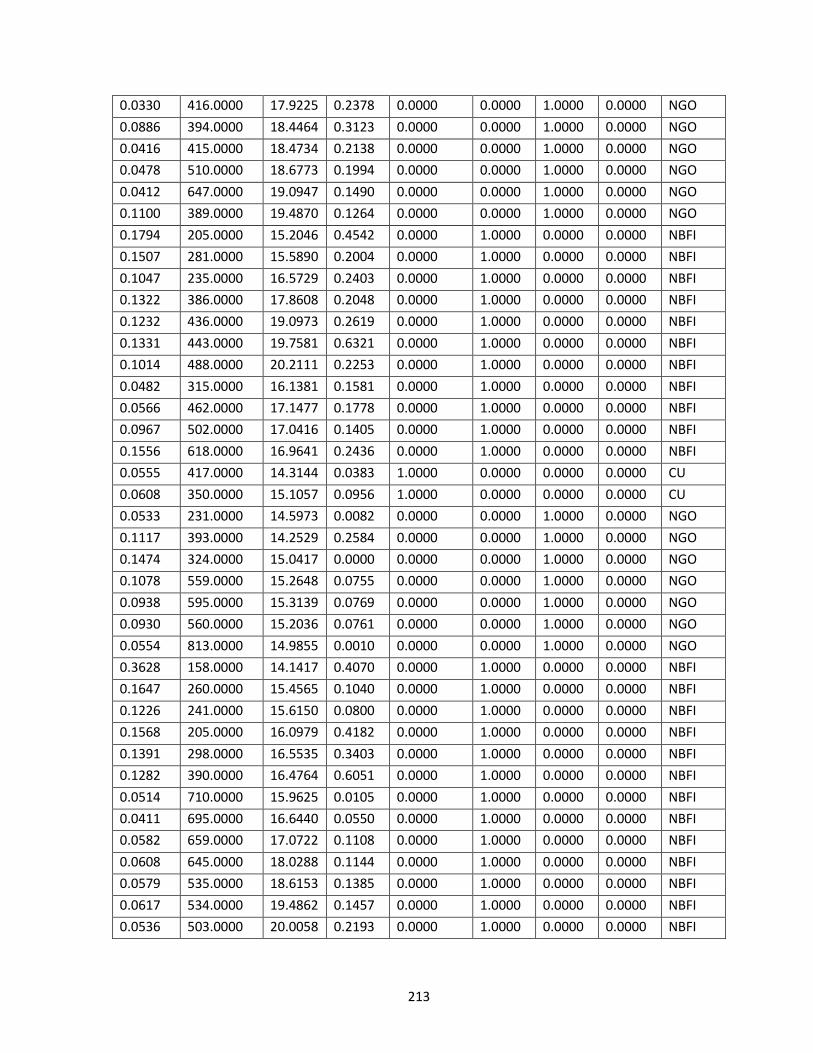
213
0.0330 416.0000 17.9225 0.2378 0.0000 0.0000 1.0000 0.0000 NGO
0.0886 394.0000 18.4464 0.3123 0.0000 0.0000 1.0000 0.0000 NGO
0.0416 415.0000 18.4734 0.2138 0.0000 0.0000 1.0000 0.0000 NGO
0.0478 510.0000 18.6773 0.1994 0.0000 0.0000 1.0000 0.0000 NGO
0.0412 647.0000 19.0947 0.1490 0.0000 0.0000 1.0000 0.0000 NGO
0.1100 389.0000 19.4870 0.1264 0.0000 0.0000 1.0000 0.0000 NGO
0.1794 205.0000 15.2046 0.4542 0.0000 1.0000 0.0000 0.0000 NBFI
0.1507 281.0000 15.5890 0.2004 0.0000 1.0000 0.0000 0.0000 NBFI
0.1047 235.0000 16.5729 0.2403 0.0000 1.0000 0.0000 0.0000 NBFI
0.1322 386.0000 17.8608 0.2048 0.0000 1.0000 0.0000 0.0000 NBFI
0.1232 436.0000 19.0973 0.2619 0.0000 1.0000 0.0000 0.0000 NBFI
0.1331 443.0000 19.7581 0.6321 0.0000 1.0000 0.0000 0.0000 NBFI
0.1014 488.0000 20.2111 0.2253 0.0000 1.0000 0.0000 0.0000 NBFI
0.0482 315.0000 16.1381 0.1581 0.0000 1.0000 0.0000 0.0000 NBFI
0.0566 462.0000 17.1477 0.1778 0.0000 1.0000 0.0000 0.0000 NBFI
0.0967 502.0000 17.0416 0.1405 0.0000 1.0000 0.0000 0.0000 NBFI
0.1556 618.0000 16.9641 0.2436 0.0000 1.0000 0.0000 0.0000 NBFI
0.0555 417.0000 14.3144 0.0383 1.0000 0.0000 0.0000 0.0000 CU
0.0608 350.0000 15.1057 0.0956 1.0000 0.0000 0.0000 0.0000 CU
0.0533 231.0000 14.5973 0.0082 0.0000 0.0000 1.0000 0.0000 NGO
0.1117 393.0000 14.2529 0.2584 0.0000 0.0000 1.0000 0.0000 NGO
0.1474 324.0000 15.0417 0.0000 0.0000 0.0000 1.0000 0.0000 NGO
0.1078 559.0000 15.2648 0.0755 0.0000 0.0000 1.0000 0.0000 NGO
0.0938 595.0000 15.3139 0.0769 0.0000 0.0000 1.0000 0.0000 NGO
0.0930 560.0000 15.2036 0.0761 0.0000 0.0000 1.0000 0.0000 NGO
0.0554 813.0000 14.9855 0.0010 0.0000 0.0000 1.0000 0.0000 NGO
0.3628 158.0000 14.1417 0.4070 0.0000 1.0000 0.0000 0.0000 NBFI
0.1647 260.0000 15.4565 0.1040 0.0000 1.0000 0.0000 0.0000 NBFI
0.1226 241.0000 15.6150 0.0800 0.0000 1.0000 0.0000 0.0000 NBFI
0.1568 205.0000 16.0979 0.4182 0.0000 1.0000 0.0000 0.0000 NBFI
0.1391 298.0000 16.5535 0.3403 0.0000 1.0000 0.0000 0.0000 NBFI
0.1282 390.0000 16.4764 0.6051 0.0000 1.0000 0.0000 0.0000 NBFI
0.0514 710.0000 15.9625 0.0105 0.0000 1.0000 0.0000 0.0000 NBFI
0.0411 695.0000 16.6440 0.0550 0.0000 1.0000 0.0000 0.0000 NBFI
0.0582 659.0000 17.0722 0.1108 0.0000 1.0000 0.0000 0.0000 NBFI
0.0608 645.0000 18.0288 0.1144 0.0000 1.0000 0.0000 0.0000 NBFI
0.0579 535.0000 18.6153 0.1385 0.0000 1.0000 0.0000 0.0000 NBFI
0.0617 534.0000 19.4862 0.1457 0.0000 1.0000 0.0000 0.0000 NBFI
0.0536 503.0000 20.0058 0.2193 0.0000 1.0000 0.0000 0.0000 NBFI
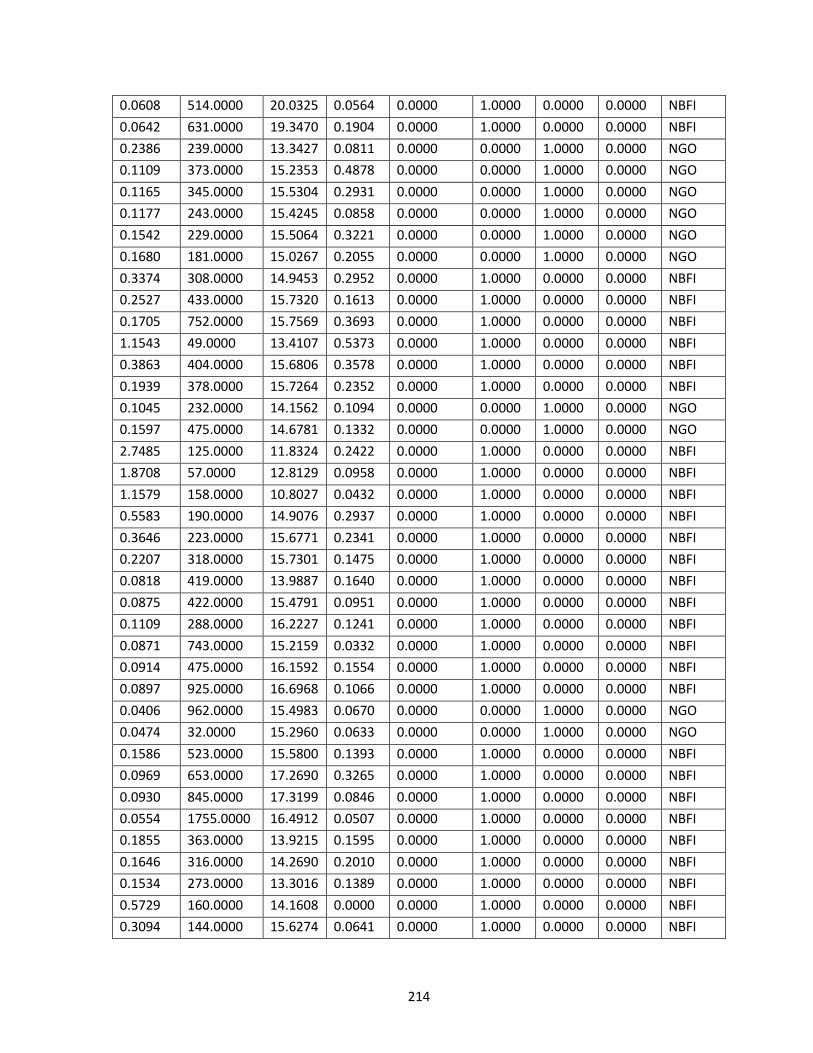
214
0.0608 514.0000 20.0325 0.0564 0.0000 1.0000 0.0000 0.0000 NBFI
0.0642 631.0000 19.3470 0.1904 0.0000 1.0000 0.0000 0.0000 NBFI
0.2386 239.0000 13.3427 0.0811 0.0000 0.0000 1.0000 0.0000 NGO
0.1109 373.0000 15.2353 0.4878 0.0000 0.0000 1.0000 0.0000 NGO
0.1165 345.0000 15.5304 0.2931 0.0000 0.0000 1.0000 0.0000 NGO
0.1177 243.0000 15.4245 0.0858 0.0000 0.0000 1.0000 0.0000 NGO
0.1542 229.0000 15.5064 0.3221 0.0000 0.0000 1.0000 0.0000 NGO
0.1680 181.0000 15.0267 0.2055 0.0000 0.0000 1.0000 0.0000 NGO
0.3374 308.0000 14.9453 0.2952 0.0000 1.0000 0.0000 0.0000 NBFI
0.2527 433.0000 15.7320 0.1613 0.0000 1.0000 0.0000 0.0000 NBFI
0.1705 752.0000 15.7569 0.3693 0.0000 1.0000 0.0000 0.0000 NBFI
1.1543 49.0000 13.4107 0.5373 0.0000 1.0000 0.0000 0.0000 NBFI
0.3863 404.0000 15.6806 0.3578 0.0000 1.0000 0.0000 0.0000 NBFI
0.1939 378.0000 15.7264 0.2352 0.0000 1.0000 0.0000 0.0000 NBFI
0.1045 232.0000 14.1562 0.1094 0.0000 0.0000 1.0000 0.0000 NGO
0.1597 475.0000 14.6781 0.1332 0.0000 0.0000 1.0000 0.0000 NGO
2.7485 125.0000 11.8324 0.2422 0.0000 1.0000 0.0000 0.0000 NBFI
1.8708 57.0000 12.8129 0.0958 0.0000 1.0000 0.0000 0.0000 NBFI
1.1579 158.0000 10.8027 0.0432 0.0000 1.0000 0.0000 0.0000 NBFI
0.5583 190.0000 14.9076 0.2937 0.0000 1.0000 0.0000 0.0000 NBFI
0.3646 223.0000 15.6771 0.2341 0.0000 1.0000 0.0000 0.0000 NBFI
0.2207 318.0000 15.7301 0.1475 0.0000 1.0000 0.0000 0.0000 NBFI
0.0818 419.0000 13.9887 0.1640 0.0000 1.0000 0.0000 0.0000 NBFI
0.0875 422.0000 15.4791 0.0951 0.0000 1.0000 0.0000 0.0000 NBFI
0.1109 288.0000 16.2227 0.1241 0.0000 1.0000 0.0000 0.0000 NBFI
0.0871 743.0000 15.2159 0.0332 0.0000 1.0000 0.0000 0.0000 NBFI
0.0914 475.0000 16.1592 0.1554 0.0000 1.0000 0.0000 0.0000 NBFI
0.0897 925.0000 16.6968 0.1066 0.0000 1.0000 0.0000 0.0000 NBFI
0.0406 962.0000 15.4983 0.0670 0.0000 0.0000 1.0000 0.0000 NGO
0.0474 32.0000 15.2960 0.0633 0.0000 0.0000 1.0000 0.0000 NGO
0.1586 523.0000 15.5800 0.1393 0.0000 1.0000 0.0000 0.0000 NBFI
0.0969 653.0000 17.2690 0.3265 0.0000 1.0000 0.0000 0.0000 NBFI
0.0930 845.0000 17.3199 0.0846 0.0000 1.0000 0.0000 0.0000 NBFI
0.0554 1755.0000 16.4912 0.0507 0.0000 1.0000 0.0000 0.0000 NBFI
0.1855 363.0000 13.9215 0.1595 0.0000 1.0000 0.0000 0.0000 NBFI
0.1646 316.0000 14.2690 0.2010 0.0000 1.0000 0.0000 0.0000 NBFI
0.1534 273.0000 13.3016 0.1389 0.0000 1.0000 0.0000 0.0000 NBFI
0.5729 160.0000 14.1608 0.0000 0.0000 1.0000 0.0000 0.0000 NBFI
0.3094 144.0000 15.6274 0.0641 0.0000 1.0000 0.0000 0.0000 NBFI
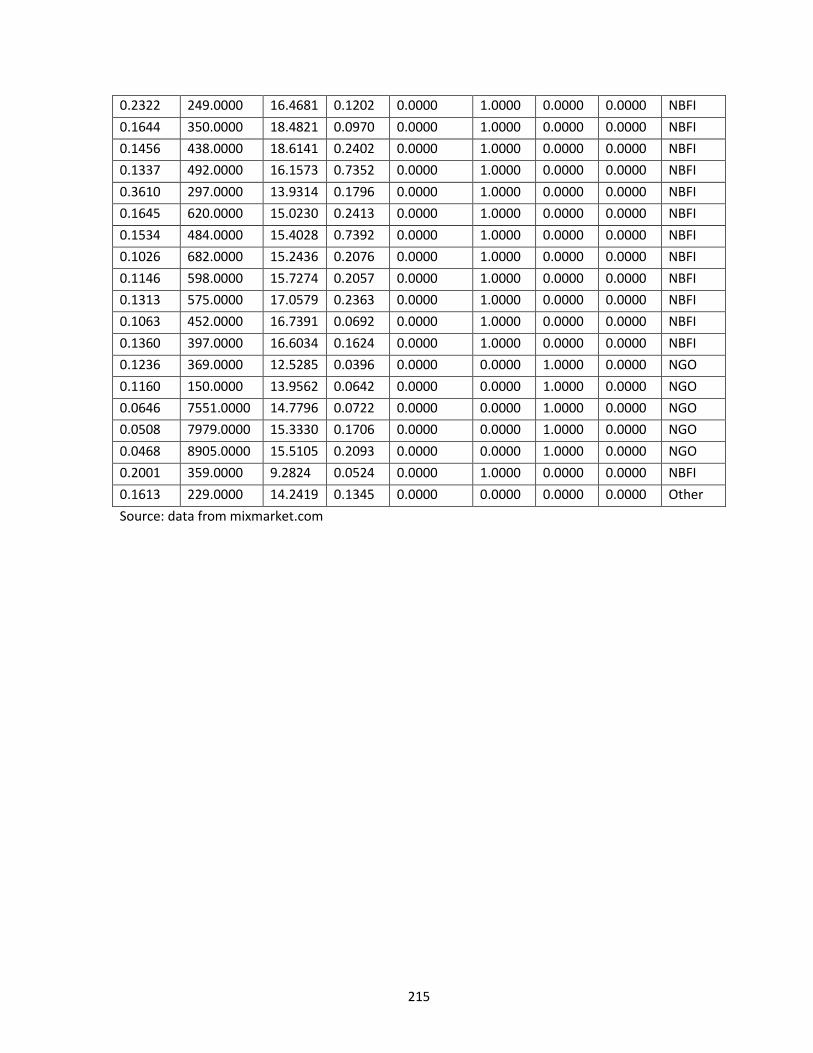
215
0.2322 249.0000 16.4681 0.1202 0.0000 1.0000 0.0000 0.0000 NBFI
0.1644 350.0000 18.4821 0.0970 0.0000 1.0000 0.0000 0.0000 NBFI
0.1456 438.0000 18.6141 0.2402 0.0000 1.0000 0.0000 0.0000 NBFI
0.1337 492.0000 16.1573 0.7352 0.0000 1.0000 0.0000 0.0000 NBFI
0.3610 297.0000 13.9314 0.1796 0.0000 1.0000 0.0000 0.0000 NBFI
0.1645 620.0000 15.0230 0.2413 0.0000 1.0000 0.0000 0.0000 NBFI
0.1534 484.0000 15.4028 0.7392 0.0000 1.0000 0.0000 0.0000 NBFI
0.1026 682.0000 15.2436 0.2076 0.0000 1.0000 0.0000 0.0000 NBFI
0.1146 598.0000 15.7274 0.2057 0.0000 1.0000 0.0000 0.0000 NBFI
0.1313 575.0000 17.0579 0.2363 0.0000 1.0000 0.0000 0.0000 NBFI
0.1063 452.0000 16.7391 0.0692 0.0000 1.0000 0.0000 0.0000 NBFI
0.1360 397.0000 16.6034 0.1624 0.0000 1.0000 0.0000 0.0000 NBFI
0.1236 369.0000 12.5285 0.0396 0.0000 0.0000 1.0000 0.0000 NGO
0.1160 150.0000 13.9562 0.0642 0.0000 0.0000 1.0000 0.0000 NGO
0.0646 7551.0000 14.7796 0.0722 0.0000 0.0000 1.0000 0.0000 NGO
0.0508 7979.0000 15.3330 0.1706 0.0000 0.0000 1.0000 0.0000 NGO
0.0468 8905.0000 15.5105 0.2093 0.0000 0.0000 1.0000 0.0000 NGO
0.2001 359.0000 9.2824 0.0524 0.0000 1.0000 0.0000 0.0000 NBFI
0.1613 229.0000 14.2419 0.1345 0.0000 0.0000 0.0000 0.0000 Other
Source: data from mixmarket.com