Final copy of Theogene UWIMANA's dissertation (+250788801023)
66
Scientia et Lux B.P. 155 Ruhengeri Rwanda T : +250 788 90 30 30 : +250 788 90 30 32 E : [email protected] W : www.ines.ac.rw FACULTY OF APPLIED FUNDAMENTAL SCIENCES DEPARTMENT OF LAND SURVEY A Dissertation submitted in partial Fulfillment of requirements for the Award of Bachelors‟ Degree in Land Survey Presented by Theogene UWIMANA Reg.N O : 11/4000 Supervisor: Selina Khan (Msc) Musanze August, 2015 INSTITUT D’ENSEIGNEMENT SUPÉRIEUR DE RUHENGERI Accredited by Ministerial Order N° 005/2010/Mineduc of 16 June 2010 ASSESSING THE IMPACT OF HUMAN ACTIVITIES ON FOREST COVER FROM 2001-2009 USING GIS. CASE STUDY: KINIGI Sector.
-
Upload
uwimana-theogene -
Category
Engineering
-
view
119 -
download
1
Transcript of Final copy of Theogene UWIMANA's dissertation (+250788801023)

i
Scientia et Lux
B.P. 155
Ruhengeri
Rwanda
T : +250 788 90 30 30
: +250 788 90 30 32
E : [email protected] W : www.ines.ac.rw
FACULTY OF APPLIED FUNDAMENTAL SCIENCES
DEPARTMENT OF LAND SURVEY
A Dissertation submitted in partial
Fulfillment of requirements for the
Award of Bachelors‟ Degree in Land
Survey
Presented by Theogene UWIMANA
Reg.NO
: 11/4000
Supervisor: Selina Khan (Msc)
Musanze August, 2015
INSTITUT D’ENSEIGNEMENT SUPÉRIEUR
DE RUHENGERI
Accredited by Ministerial Order N° 005/2010/Mineduc of 16 June 2010
ASSESSING THE IMPACT OF HUMAN ACTIVITIES
ON FOREST COVER FROM 2001-2009 USING GIS.
CASE STUDY: KINIGI Sector.

i
CERTIFICATE OF ORGINALITY
INSTITUT D’ENSEIGNEMENT SUPÉRIEUR DE
RUHENGERI
FACULTY OF FOUNDAMENTAL APPLIED SCIENCES
DEPARTMENT OF LAND SURVEY
I hereby declare that the project research, entitled “Assessing the impacts of human activities on
forest cover from 2001-2009 using GIS, case study of Kinigi sector” is submitted in fulfillment of
a bachelor degree is my own work and that all combinations from any other persons or sources
are properly and duly cited. I further declare that the material has not been submitted either in
whole or in part for a degree at this or any other university.
Student:
UWIMANA Theogene
Date: ………../07/2015
Signature:……………
The undersigned to hereby state that, the above student‟s work including the project research,
he‟s been completed to my satisfaction and the thesis is ready for examination.
Supervisor: Selina Khan
Date:…………/07/2015
Signature:……………..

ii
DEDICATION
To my beloved parents,
To all my beloved brothers and
sister,
To all my beloved classmates;
To all of my friends.

iii
ABSTRACT
The purpose of this project research is to assess the impact of human activities on forest cover
from 2001-2009 using GIS in Kinigi Sector.
Human activities influenced the coverage of forest and is impacted the environment in the study
area. Therefore this study aims to spatially assess forest coverage and analyze related outcomes
and impacts on the environments and the population. Data was obtained by interview with
citizens using structured questionnaire. Data from questionnaire has been analyzed using
Microsoft excel software.
To analyze the extent of the forest cover in Kinigi Sector between 2001 and 2009, two satellites
(1 for 2001 and 1 for 2009) images has been classified using ArcMap 10.2, changes of classified
uses has been detected using the same software and print out maps show change detection
results.
Results show 98% of respondents said that there is negative change in land use especially in
forest cover. The results from image classification show that there is a decrease of 3.53% in
forest cover between 2001 and 2009; it further shows an increase of 2.9% of crop land
(agricultural land) and an increase of 0.63% in built up area.
In this way, rural and urban planners are recommended to find measures and solutions to reduce
the destruction or disappearance of forests in Kinigi Sector. We also recommend to the
Authorities of Kinigi Sector to consider the coverage of forest that have been disappeared within
Kinigi Sector during the years 2001-2009, and take precautions to avoid loss of forests in the
future by aware the peoples living in Kinigi Sector to plant forest in order to restore the amount
of forest that has been cut and preserve the forest in future. Also, people have to build in grouped
settlement to use land properly.

iv
RÉSUME
Le but de cette recherche est d'évaluer l'impact des activités humaines sur l‟étendue de forêt
depuis 2001-2009 en utilisant le GIS dans le Secteur Kinigi.
Les activités humaines ont influencé sur l‟étendue de la forêt et il est touché sur l'environnement
dans le Secteur d'étude. So, cette étude vise à évaluer l'espace de l‟étendue forestière et
d'analyser les résultats et leurs impacts sur les environnements et la population. Les données ont
été obtenues par interview avec les citoyens en utilisant questionnaire structuré. Les données de
questionnaire a été analysées avec le logiciel Microsoft Excel.
Pour analyser l'étendue de l‟étendue forestière dans le Secteur Kinigi entre 2001 et 2009, deux
images satellitaires (1 pour 2001 et 1 pour 2009) ont été classé en utilisant ArcMap 10.2, les
changements d'utilisation de terres ont été détectée en utilisant le même logiciel et imprimer des
cartes montrant les résultats de ce changement détectée lors de l‟Analyzer.
Les résultats montrent que 98% des citoyens qui ont répondue (répondants) ont dit qu'il ya un
changement négatif dans l'utilisation des terres en particulier sur l‟étendue forestiere. Les
résultats de la classification d'images montrent qu'il ya une diminution de 3,53% de l‟étendue
forestière entre 2001 et 2009; il montre en outre une augmentation de 2,9% des terres cultivées
(terres agricoles) et une augmentation de 0,63% en zone bâtie.
De cette façon, les planificateurs ruraux et urbains sont recommandés de trouver des mesures et
des solutions pour réduire la destruction ou disparition des forêts. Nous recommandons aussi au
Autorités du Secteur de Kinigi de considérer l'étendue forestières qui ont disparue au sein du
Secteur Kinigi pendant les années 2001-2009 et prend les précautions pour éviter les pertes des
forets dans le future en sensibilisant aux peuples du Secteur Kinigi à planter des forêts pour
restauré et préservé les forêts qui ont disparue. Aussi, les peuples de Kinigi doivent construit en
habitant groupé afin d'utiliser les terres de manière appropriée.

v
ACKNOWLEGDEMENT
My sincere thanks go to the Almighty God for helping and keeping me healthy and strong
during my five year of study at INES RUHENGERI. Thanks you my Lord!
My grateful gratitude goes to my supervisor Selina Khan, for her guidance and supports
throughout my research project. Her professional experiences and practical comments,
critiques and advices inspired to conduct this research.
My gratitude goes to INES Sponsorship for granting me this opportunity to study in the Land
Survey Department and conducting this research. Many thanks to the department staffs and
lectures of Land Survey for providing input that leads to the success of this research.
Many thanks to my friends at INES RUHENGERI and my classmates in Land Survey 2010-
2015, especially SERUGENDO François Xavier, NIYIGENA J. Nepomuscene,
NDUWAMUKIZA Martin, HABAKUBAHO Everigiste and HAKUZIMANA Basilien; we
lived together during the five years of study the support of you during that time encouraged
Me.
Warm thanks to my beloved father, brothers and sister for their financial supports and
encouragement during five years of study at INES RUHENGERI.
May God bless you all.

vi
ABBREVIATIONS
CGIS-UR: Centre for Geographic Information System-University of Rwanda,
DHS : Demographic Household Survey,
EICV : Enquêtes Intégrale sur les Conditions de Vie des ménages,
ETM: Enhanced Thematic Mapper,
FAO: Food Agriculture Organization,
GDP: Gross Domestic Product,
GIS: Geographical Information System,
GLCF: Global Land Cover Facility,
GPS: Global Positioning System,
GPS: Global Positioning System,
HIV/AIDS: Human Immunodeficiency Virus/Acquired Immuno Deficiency
Syndrome,
INES : Instutut d‟Enseignement Superieur de Ruhengeri,
IPAR: Institute of Policy Analysis and Research,
MINAGRI: Ministry of Agriculture and Animal Ressources,
NISR: National Institute of Statistic in Rwanda,
ORTPN : Office Rwandaise du Tourisme et des Parc Nationaux,
PNV : Parc National de Virunga,
RDB: Rwanda Development Board,
UNEP: United Nations Environment Program,
PDDESA: Population Division Department of Economic and Social Affairs.
vii
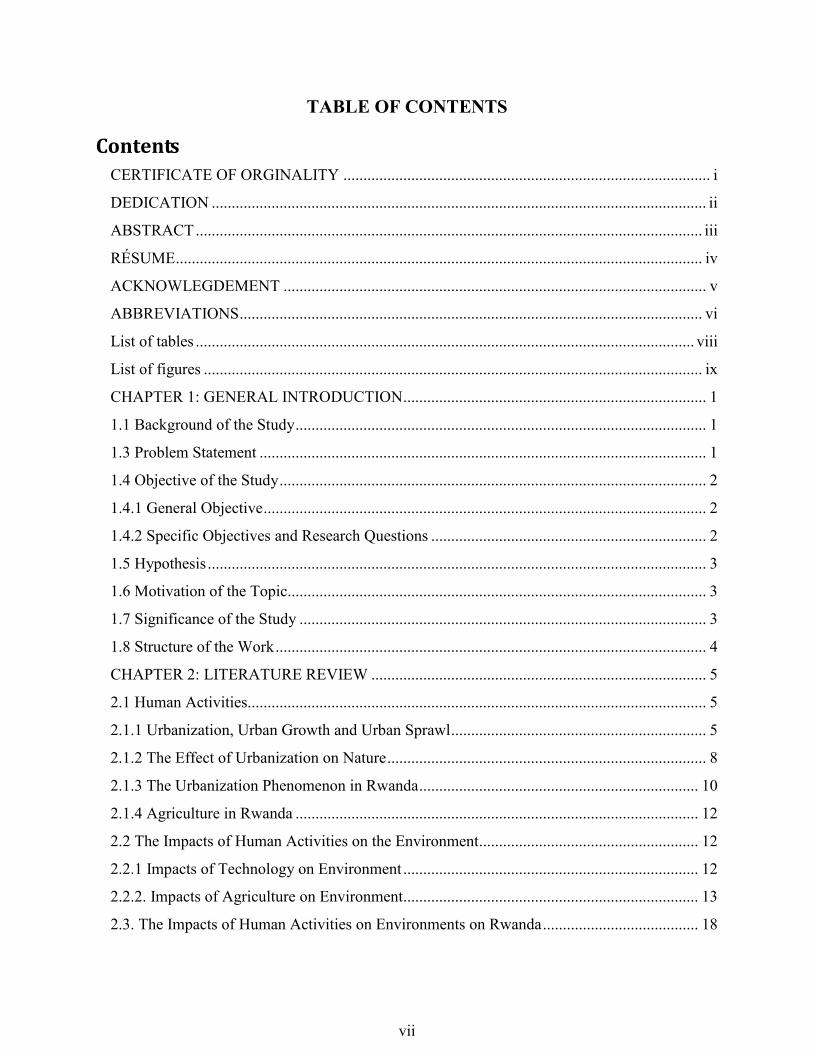
TABLE OF CONTENTS
Contents
CERTIFICATE OF ORGINALITY ............................................................................................ i
DEDICATION ............................................................................................................................ ii
ABSTRACT ............................................................................................................................... iii
RÉSUME .................................................................................................................................... iv
ACKNOWLEGDEMENT .......................................................................................................... v
ABBREVIATIONS .................................................................................................................... vi
List of tables ............................................................................................................................. viii
List of figures ............................................................................................................................. ix
CHAPTER 1: GENERAL INTRODUCTION ............................................................................ 1
1.1 Background of the Study ....................................................................................................... 1
1.3 Problem Statement ................................................................................................................ 1
1.4 Objective of the Study ........................................................................................................... 2
1.4.1 General Objective ............................................................................................................... 2
1.4.2 Specific Objectives and Research Questions ..................................................................... 2
1.5 Hypothesis ............................................................................................................................. 3
1.6 Motivation of the Topic......................................................................................................... 3
1.7 Significance of the Study ...................................................................................................... 3
1.8 Structure of the Work ............................................................................................................ 4
CHAPTER 2: LITERATURE REVIEW .................................................................................... 5
2.1 Human Activities................................................................................................................... 5
2.1.1 Urbanization, Urban Growth and Urban Sprawl ................................................................ 5
2.1.2 The Effect of Urbanization on Nature ................................................................................ 8
2.1.3 The Urbanization Phenomenon in Rwanda ...................................................................... 10
2.1.4 Agriculture in Rwanda ..................................................................................................... 12
2.2 The Impacts of Human Activities on the Environment ....................................................... 12
2.2.1 Impacts of Technology on Environment .......................................................................... 12
2.2.2. Impacts of Agriculture on Environment.......................................................................... 13
2.3. The Impacts of Human Activities on Environments on Rwanda ....................................... 18

viii
2.3.1 Degradation of Natural Resources and Biodiversity ........................................................ 18
CHAPTER 3: RESEARCH METHOLOGY AND TECHNIQUES ........................................ 23
3.1 Study Area Description ....................................................................................................... 23
3.1.1 Location and Demography of Musanze District .............................................................. 23
3.1.2 Geographical Location of Kinigi Sector .......................................................................... 24
3.2 Methodology ....................................................................................................................... 25
3.2.1 Data Collection Methods .................................................................................................. 25
3.2.2 Determination of Sample Size ......................................................................................... 26
3.2.3 Data Source ...................................................................................................................... 27
3.2.4 Secondary Data Collection ............................................................................................... 27
3.3. Data Processing .................................................................................................................. 28
3.4 Software Used ..................................................................................................................... 28
3.5 Georeferencing .................................................................................................................... 28
3.6 Digitalization ....................................................................................................................... 29
3.7 Clipping ............................................................................................................................... 29
3.8 Overlay and Detect Change................................................................................................. 29
CHAPTER 4: RESULTS PRESENTATION AND ANALYSIS ............................................. 30
4.1 Analysis of Questionnaires Data ......................................................................................... 30
4.1.1 Sex of the Respondents .................................................................................................... 30
4.1.2 Main Land Use Types in Kinigi Sector in 2001............................................................... 31
4.1.3 Change in Land Use Type for 8 years .............................................................................. 32
4.1.4 The Impact of Change in Land Use Type in Kinigi ......................................................... 33
4.1.5 The Change in Land Value in Kinigi from 2001-2009 .................................................... 34
4.1.6 The Advantage of Tourism in Kinigi ............................................................................... 35
4.1.7 Level of Satisfaction on Water Quantity and Quality in Kinigi ....................................... 35
4.2 Spatial analysis .................................................................................................................... 36
4.2.1 Land Use of Kinigi Sector in 2001................................................................................... 36
4.2.3 Land Use of Kinigi Sector in 2009................................................................................... 38
4.2.4 Land Use Change From 2001-2009 ................................................................................. 40
CHAPTER 5: CONCLUSION AND RECOMMENDATIONS .............................................. 43
5.1 Conclusion ........................................................................................................................... 43

ix
5.2. Recommendations .............................................................................................................. 44
References ................................................................................................................................. 45
APPENDICES ........................................................................................................................... 50

viii
List of tables
Table 1: Data sources .................................................................................................................... 27
Table 2: Respondents by cell ........................................................................................................ 26
Table 3: Sex of respondents .......................................................................................................... 30
Table 4: The main land use type in Kinigi sector in 2001 ............................................................ 31
Table 5: Change in land use between 2001-2009 ......................................................................... 32
Table 6: Respondent‟s view on impact caused by the change in land use ................................... 33
Table 7: Level of satisfaction on water quantity and quality ........................................................ 36
Table 8: Land use distribution in 2001 ......................................................................................... 37
Table 9: Percentage of land use in 2009 ....................................................................................... 39
Table 10: Area of use change of Kinigi between 2001 and 2009. ................................................ 41
Table 11: Land use conversion between 2001 and 2009 .............................................................. 41

ix
List of figures
Figure 1: Irrigation Scheme hydrology ......................................................................................... 14
Figure 2: Administrative Map of Musanze District ...................................................................... 23
Figure 3: Administrative map of Kinigi Sector ............................................................................ 24
Figure 4: Gender of Respondents ................................................................................................. 31
Figure 6: Main Land Use Type in Kinigi in 2009 ........................................................................ 33
Figure 7: Impact of change in land use ......................................................................................... 34
Figure 8: Change in Land Market ................................................................................................. 35
Figure 9: Level of Satisfaction on Drinking Water. ..................................................................... 36
Figure 10: Land Use of Kinigi in 2001 ......................................................................................... 37
Figure 11: Land Use Distribution in 2001 .................................................................................... 38
Figure 12: Land Use Distribution of Kinigi Sector in 2009 ......................................................... 39
Figure 13: Land Use in 2009 ........................................................................................................ 40
Figure 14: Map of Land Use Change of Kinigi From 2001-2009. ............................................... 40
1
CHAPTER 1: GENERAL INTRODUCTION
1.1 Background of the Study
Kinigi sector is a touristic area which is located near the Virunga Mountains and Kinigi is
continuously developing day by day in order to satisfy the needs of tourists. Virunga
Gorillas Mountain is a highly endangered African ape subspecies, with a total estimated
population of 380 existing only in the Virunga Conservation Area encompassing Rwanda,
Democratic Republic of Congo and Uganda (Gray et al., 2005).
This development of Kinigi sector occupies a significant area of former lands and is causing
challenges for farmers in Kinigi Sector. Today, due to urbanization in Rwanda, especially in
Kinigi sector, forest cover has been decreased continuously.
However, Rapid growth of urban income in Rwanda and increasing demands for high-value
products (such as processed agriculture products) could be a catalyst for faster agriculture
growth and subsequent rural development.
Geographic Information Systems have been used to analyze and monitor the distribution of
forest and agricultural land. In order to predict associated land uses change. (Engelen, 1999).
In this study, I access the impact of human activities on forest cover in Kinigi sector with the
objectives of detecting the area of forest cover and human activities, such as a new settlements
and agricultural land and land use to evaluate changes in Kinigi Sector from 2001 to 2009,
relevant recommendations will be drawn.
1.3 Problem Statement
Kinigi Sector contains the largest part of the Volcanoes National Parc, and its head office at
Kinigi. 5 of the 8 volcanoes of the Virunga chain (Karisimbi, Bisoke, Sabyinyo, Gahinga and
Muhabura) are within Musanze District. It is also in this sector that most of Rwanda's
mountain gorillas are found, making it the most popular tourist destination in the country.

2
Kinigi sector is a touristic sector in Musanze and one of the largest cities in Rwanda and
serves as a hub for tourists. The investment in this sector of tourism comprised 42% of
registered project in 2012 and tourism receipts are expected to rise to an annual growth rate of
11.5% in 2015 (RDB, 2013). Kinigi urban area is being expended into rural areas especially
in forest cover which serve as green space. The reason for the disappearance of forest is
because Kinigi‟s population needs space of variety of human activities. However forest to
provide oxygen to clean the air of polluants, absorb noise and regulating humidity in this area.
In Kinigi Sector forests are needed for many reasons, first reason is that forests help the peoples
living in Kinigi to breathe, it pumps out the oxygen we need to live and absorb the carbon
dioxide we emit. The second reason is that forest feed us, it gives us medicine, it also help us to
keep our ecosystem.
The expansion of Kinigi sector is creating direct and indirect impacts with those living there
facing new challenges and opportunities in meeting their needs and accommodating the
byproducts of urbanization: the prices of timber have been increased because of the decrease of
the forest.
1.4 Objective of the Study
1.4.1 General Objective
The general objective of this research is to assess the impact of human activities on forest in
Kinigi Sector in Musanze District.
1.4.2 Specific Objectives and Research Questions
The specific objectives and research questions are stated in the table below:

3
No Specific objectives Research Questions
1 To study the coverage of forest and other
land use in Kinigi sector from 2001-2009
How did forest and human activities evolve in
Kinigi sector?
2 To detect forest which has been affected by
human activities
What forest area has been affected by human
activities in Kinigi from 2001-2009?
3 To evaluate the decrease of forest in Kinigi
from 2001-2009
How did the human activities affect forest and
agricultural land in Kinigi from 2001-2009?
4 To evaluate forest change due to human
activities in Kinigi from 2001-2009
How Kinigi‟s settlement and agricultural land
extended from 2001 to 2009?
1.5 Hypothesis
This research has one hypothesis which has been formulated:
There is a decrease in forest area due to human activities in Kinigi sector.
1.6 Motivation of the Topic
The impacts of human activities on the environment in Rwanda have been scantily studied.
Therefore, this research is established to understand the dynamics of human activities, such as
settlement and agricultural activities and its effects on forest areas.
This research was conducted to show local leaders which challenges and impacts of human
activities, the population might face already and in the future if the destination of forest
continues to decrease and also the forest is the habit of the animals and therefore tourism could
also decrease which decrease economy of the country.
1.7 Significance of the Study
Land use and land cover change due to urbanization in Kinigi sector resulting in high pressure on
land and also in the development of tourism in PNV (Parc National de Virunga).
I conducted this research in order to apply what I learned during five years of study in land
survey especially in Urban and Regional planning and Geographic Information System.
My project focused on assessing the impact of human activities on forest cover from 2001 to
2011 using GIS, a case study of Kinigi Sector therefore I will show the impact of human

4
activities on forest cover which can guides the urban and rural planners and policy makers in the
future.
1.8 Structure of the Work
This research is divided into five chapters: Chapter one provide a general introduction which
will deal with background of the project, objectives, motivation of the study, problem statement
and structure of the document. Chapter two of the project contains the literature review, the
already existing research findings related to this topic. Chapter three includes the methodology
which will deal with the description of the study area, data acquisition methods, data processing
(Spatial and non-spatial) and the discussion of those results. Chapter four presents results
analysis, maps and discussions. The last chapter contains conclusion and recommendations.

5
CHAPTER 2: LITERATURE REVIEW
2.1 Human Activities
Human activities are something that people do or cause to happen. Human activities are
responsible for most of the loss in biodiversity throughout the world. With an increasing
population, we are consuming more and more natural resources. We do this by driving more,
using more energy in our homes, and buying many more products than we need.
2.1.1 Urbanization, Urban Growth and Urban Sprawl
a) Urbanization and Urban Growth
Urbanization and urban growth are two different concepts often found in the literature of urban
studies. The distinction should be noted that urbanization refers to proportion of the national
population living in urban areas, and urban growth refers to an increase in urban population size,
independent of rural population (United Nations Population Division, 2002).
On the other hand, urbanization can be viewed and perceived to mean a lot of things depending on
how it is used. It can be viewed as a characteristic of the population, as a particular kind of land
use and land cover, as well as a characteristic of social and economic processes and interactions
affecting both population and land (McIntyre et al, 2000).
Physical scientists especially ecologists generally approach definitions of urbanization from the
standpoint of the built environment. To them, density of buildings and impervious surfaces is as
important as population (Long, Rain, and Ratcliffe, 2001). McIntyre et al (2000), however, noted
that among ecologists, a wide variety of urban definitions have been used in research ranging
from any human alteration of the landscape to more precise definitions based on density and
specified land-use characteristics. In spite of these variations, urbanization trends are universal.
Local factors can speed up or slow down the process, but it cannot be stopped. Urbanization is not
necessarily bad, but the rapid change brings a lot of economic and social problems that are
difficult to manage. Some agree that it is a consequence of economic development but it is also a
requirement for economic development.

6
Urban Sprawl
„„Sprawl, is an unplanned, unsystematic, area-intensive outward growth mainly of city-type
settlements into the rural space and is a consequence of progressive urbanization. The wish for
living in green places, for weekend houses, quickly accessible shopping centers, cheap industrial
areas, and transportation infrastructure occupies much space, and if there are no conditions posed
by regional planning and environmental protection, then construction will happen at places where
it is cheapest. In this way, open spaces, recreational areas, and ecological compensation areas are
lost, become dissected or downsized and lose their ecological and socio-economic functions.‟‟
(Landscape Gesellschaft fur Geo-Kommunikation (2000–2002: 469))
Factors that Encourage Urbanization
Population Growth
There are three components of urban population growth: natural growth of urban population, rural
urban migration and the reclassification of areas previously defined as rural. Natural increase
provides a base for urban population growth rates, and rural-urban migration and reclassification
supplement this growth. Anyhow the natural increase of the population in the city often declines
sharply together with the urbanization process that has happened. (Stutz and Souza 1998)
World population reached 6.1 billion in mid-2000 and is currently growing by 77 million people
per year. By 2025, world population is expected to be between 7.9 billion and 10.9 billion, with
the medium variant 9.3 billion. The different prospects changes with the calculation way and HIV.
Even the fertility is high in many countries the impact of HIV/AIDS epidemic is huge. Morbidity,
Mortality and population losses are increasing (PDDESA 2001).
The population in today's developed countries is not expected to grow in next 50 years because
fertility levels are remaining below replacement level. On the contrary, the population in
developing countries is projected to rise from 4.9 million in 2000 to 8.2 billion in 2050. The rapid
growth is expected among the group of 48 least developed countries. Their population is expected
nearly to triple in the next 50 years. International immigration is projected to remain high in 21st
century. The more developed areas are expected to continue being net receivers of international
migrants. This has a high impact to the population growth in developed areas and cities (PDDESA
2001).

7
Poverty
Poverty is hard to define. Poverty means that human needs are not met. Poverty is everyday life in
every country, even in developed areas. In every country can be identified individuals who have
so small income that they cannot afford even the very basic goods. These physical needs are
adequate diet, housing, work, water supply, sanitation and health care. For humans a few mental
demands are also important, like basic civil and political rights and feeling of safety (HABITAT,
1996).
Poverty can be measured by income level. This is not always the best way to define poor people
because some level of personal income cannot substitute problems with health, crime, physical
violence or life expectancy. Still using this kind of income level is normal in every country.
People whose income is under this minimum level are considered poor. At least 20 per cent of the
world‟s populations live in absolutely poverty. More than 90 percent of these live in the
developing countries. These numbers are only rough averages because it is in reality difficult to
estimate the amount of people who suffer from absolute poverty (HABITAT, 1996).
Standard of Living
The differences in standard of living are major issues when considering factors that encourage
urbanization. Higher living standards and higher salaries in the city attract people to move to the
cities. As long as the income gap between rural and urban areas is big, people tend to move to the
cities. Economic factors and employment are the main reasons for migration. Sometimes the
employment in rural areas is non-existing. In these cases moving to the city, even for very low
salaries, is more profitable than staying in the countryside (Sajor 2001, Brookfield and Byron
1993).
Environmental Pressure
The biggest environmental pressure for rural people is the lack of profitable land. The land
inherited from the parents is divided to the children and their children. At last the land per farmer
becomes so small that it is unprofitable to farm. On the other hand erosion and land deterioration
makes farming even more difficult. Even when poor farmers have enough land space they can‟t
always afford and compete for non-sufficient water resources or fertilizers. Water is sometimes
very polluted and regulations forbid the use of that kind of water because of food contamination.

8
This gives no opportunity to the poor farmers. They can either continue farming with
contaminated water and get caught with the contamination of crops or try to find some other
livelihood. This is the problem in lower basins of many rivers in developing countries (Sajor
2001).
Water shortage increases social inequity. Poor farmers cannot sink boreholes to the necessary
depths to extract water. Wealthier farmers can benefit by moving inland to buy up more land or
water. The only way to survive for these poor farmers is to move to cities to find some
nonagricultural livelihood (UNEP 1999).
2.1.2 The Effect of Urbanization on Nature
Complexity of Environmental Problems
Probably most of the major environmental problems of the next century will result from the
continuation and sharpening of existing problems that currently do not receive enough political
attention. The problems are not necessarily noticed in many countries or then nothing is done
even the situation has been detected. The most emerging issues are climate changes, freshwater
scarcity, deforestation, and fresh water pollution and population growth (UNEP 1999).
These problems are very complex and their interactions are hard to define. It is very important to
examine problems through the social-economic-cultural system. Even the interconnections
between environmental problems are now better known, we still lack exact information on how
the issues are linked, on what degree they interact and what are the most effective measures. One
problem is to integrate land- and water use planning to provide food and water security (UNEP
1999).
Overpopulation
The major cause of most environmental problems is the rapidly growing human population.
About 90 million babies are born each year. At this rate, by the year 2050, global population will
reach 10 billion. The current world population is on average very young and has many years of
reproductive life ahead. Because of this the population will grow even the fertility rate seems to
decrease. The population growth takes mostly place in developing countries. These countries are

9
in charge of 90% of current population growth. It has been estimated that by the year 2025 even
84% of the world‟s people will live in developing regions (ENCARTA 2001).
Growing Demand for Food and Facilities
Due to the growing population, demands for water, food, housing, heat, energy, clothing, and
consumer goods are increasing alarmingly. Rapid population growth not only lessens available
calorie supply from food per person but also risks the present food production with pollution.
Increasing demand forces farmers to exhaust the soil or to use marginal land. The only way to
product food to all this population is to create more effective agricultural production.
Irrigation is the most important way, because in the future the arable land is not increasing,
probably decreasing, due to erosion and land deterioration (ENCARTA 2001, Brookfield and
Byron 1993).
At this moment world‟s population is 6 billion people. The urbanization is about 50 per cent
which means that half of the population is living in the urban areas and the other half in the rural
areas. This means that the other half of the population, in rural areas, has to produce the food to
the population in urban areas. Most of the population growth takes place in urban areas, which
means more pressure to the rural people to produce food for the growing amount of urban people
(Varis 1998, Vakkilainen and Varis 1999).
Growing urbanization means more consumption and need of different products. The production of
these needs water and creates more pollutants. In developing countries where the urbanization is
occurring most rapidly the technology is not high enough to take responsibility of water treatment
and clean production. Many Western companies produce their products in developing countries
because of more flexible environmental law and cheaper production costs. This puts extra
pressure on the environment of the developing countries (Varis 1998, Vakkilainen and Varis
1999).
Problems for Food Production
Plants need water, solar energy and nutrients to grow. Humans can only change few things to help
plants to product more, the amount of water and fertilizer. In the areas where these are needed
there is also often uncertainty of water supply and lacking of capital for fertilizers. Water and food
10
availability is closely linked together because of the enormous need of green water. For example,
each ton of grain needs 1000 tons of water for successful growth (Allan 1997, Varis 1997b).
The quality of water is often threatened in poor areas due to domestic and industrial wastes.
Agriculture as well produces numerous side effects to water resources, including erosion, leaching
of nutrients, accumulation and wash off of pesticides and heavy metals, increased salinity due to
evaporation losses and spearing of various diseases such as schistosomiasis and malaria
(Vakkilainen and Varis 1999, Varis 1997b).
Until now the increasing of the fertilizers have helped to produce bigger yields. The population
growth is nowadays so fast that increasing use of fertilizers is not enough. The next step in
producing more food will be different crops and irrigation methods, like drip irrigation and water
saver plants (Vakkilainen and Varis 1999, Varis 1997b).
Pollutants of Air, Soil and Water
Even the industrialized countries, with higher standards of living and greater numbers of cars,
produce far more air pollution and greenhouse gases than developing countries; they can reduce
environmental hazards by using technology such as smokestack scrubbers, emission systems, and
wastewater treatment plants. Developing countries do not have this new technology or capacity to
do so. The consumption is far lower but the expensive energy-efficient or clean-up technologies
are economically impractical for these countries. For these reasons environmental problems occur
more often in developed countries (ENCARTA 2001).
2.1.3 The Urbanization Phenomenon in Rwanda
Historically speaking, urban development is a very recent phenomenon which was brought in
Rwanda at the beginning of the 20th
century when the colonizers arrived in Rwanda. Indeed, the
absence of towns is partly due to scattered individual settlement in the whole country on the one
hand and a decentralized economic system before the colonial period in Rwanda, peddlers
moved from one hill to another selling their goods (there was no established places for trade) on
the other hand.
The colonial administration did not encourage urban development in Rwanda because it was

11
considered as a country with very little economic interests. Although the administration centers
were created fifty years later during the colonial period, jobless people were not allowed to
remain there. After independence, the regimes which came to power opposed urban development
under the pretext that priority ought to be given to the development of rural areas. To support this
strategy, the following decisions were taken:
i. The creation of rural centers to keep the rural populations in one place;
ii. Introduction of new administrative policies where citizens had to get a pass in order to
move to town;
iii. Citizens were obliged to get a residence permit and a permanent employment card;
iv. Regular raids to catch and send back jobless people in their respective rural communes.
During the independence in 1962, Kigali population reached 6.000 people only. The other
centers also called urban centers were province headquarters. New province distribution map
has allowed rural areas to join towns. The urbanization rate has increased three times between
1962 and 1972 (from 1 to 3%), it reached 5% in 1978 and approximately 9% just before the
1994 tragedy. With more than 17%, Rwanda remains the least urbanized country in Africa,
behind Burundi. The average urbanization rate in Africa is about 35%.
According to the data, analysis and evidence from the third household living conditions survey
(Enquête intégrale sur les conditions de vie des ménages-EICV3) and the fourth Demographic and
household living conditions survey (DHS), The development of cities in Rwanda is very recent,
and the rate of urbanization stands at about 18%. Although, this rate is among the lowest in the
world, the annual growth rate of the urban population of 4.5% far exceeds the worldwide average
of 1.8%. Almost half of the urban dwellers are concentrated in the City of Kigali, with about one
Million inhabitants. This monocephalic situation highlights the imbalance between urban centers
within Rwanda.
Challenges caused by rapid urbanization combined with scarcity of land, are the proliferation of
unplanned urban growth and environmental degradation. After independence and until until 2004,
urban planning did not receive prior attention – a fact which resulted in a rapid rise of unplanned
settlements.

12
2.1.4 Agriculture in Rwanda
The agricultural sector is an important conduit in the economic development efforts of Rwanda.
Performance in the agricultural sector has a positive effect on the country‟s GDP (Gross Domestic
Product). In 2011, GDP (Gross Domestic Product) at current prices was estimated to be Rwf
3,828 billion, up from Rwf 3,280 billion in the year 2010 (NISR: National Institute of Statistic in
Rwanda, National accounts, 2011). Cultivated area represents 1.12 million hectares, around 46%
of the country, distributed between 870 000 ha of annual crops and 250 000 of performance crops
(MINAGRI, 2011). In 2009, this sector contributed 34% to the country‟s GDP. Between, 2001-
2006, the sector contributed 36% to the Gross Domestic Product (GDP) while in 2011 it
accounted for 47% of the Gross Domestic Product NISR: National Institute of Statistic in
Rwanda, National accounts, 2011). According to IPAR (2012), the population living under the
poverty datum line is 44.9% while the target in 2015 is 23%. Between 2005/6 and 2010/11
poverty fell by 11.8%. (IPAR, 2012)
About 80% of the Rwandan population is dependent on agriculture (MINAGRI Annual Report,
2010/2011) of which majority (79.6%) are women (National Gender Policy Strategic Plan, 2010).
A significant proportion of the agricultural population (42.2%) receives help from family
members for their field operations. With a total population of around 12 million and an estimated
population growth rate of 2.9%, Rwanda represents one of the most densely populated countries
in Sub-Saharan Africa. Given the limited availability of arable land for agriculture and the
constantly growing food requirements of the population, ensuring food security poses a major
challenge. Most of the farmlands in Rwanda consist of fragmented plots of land. On average, the
farm holdings are spread over 4 different blocks of lands. Approximately 80% of farms have a
surface area of less than 1Ha each. FAO estimates that the population will rise further to 14
million by 2020 (FAO, 2005).
2.2 The Impacts of Human Activities on the Environment
2.2.1 Impacts of Technology on Environment
The applications of technology often result in unavoidable environmental impacts, Environmental
impacts caused by the application of technology are often perceived as unavoidable for several

13
reasons. First, given that the purpose of many technologies is to exploit, control, or otherwise
“improve” upon nature for the perceived benefit of humanity while at the same time the myriad of
processes in nature have been optimized and are continually adjusted by evolution, any
disturbance of these natural processes by technology is likely to result in negative environmental
consequences (Commoner, B. (1971)). Second, the conservation of mass principle and the first
law of thermodynamics (i.e., conservation of energy) dictate that whenever material resources or
energy are moved around or manipulated by technology, environmental consequences are
inescapable. Third, according to the second law of thermodynamics, order can be increased within
a system (such as the human economy) only by increasing disorder or entropy outside the system
(i.e., the environment). Thus, technologies can create “order” in the human economy (i.e., order as
manifested in buildings, factories, transportation networks, communication systems, etc.) only at
the expense of increasing “disorder” in the environment. According to a number of studies,
increased entropy is likely to be correlated to negative environmental impacts (Faber, M., Niemes,
N. and Stephan, G. (2012); (Kümmel, R. (1989)); (Ruth, M. (1993); (Huesemann, M.H., and J.A.
Huesemann (2011)).
2.2.2. Impacts of Agriculture on Environment
The environmental impact of agriculture varies based on the wide variety of agricultural practices
employed around the world.
a) Fishing
The impact of fishing on environment can be divided into issues that involve the availability of
fish to be caught, such as overfishing, sustainable fisheries, and fisheries management; and issues
that involve the impact of fishing on other elements of the environment, such as by-catch.
These conservation issues are part of marine conservation, and are addressed in fisheries science
programs. There is a growing gap between how many fish are available to be caught and
humanity‟s desire to catch them, a problem that gets worse as the world population grows.
Similar to other environmental issues, there can be conflict between the fishermen who depend on
fishing for their livelihoods and fishery scientists who realize that if future fish populations are to
be sustainable then some fisheries must reduce or even close. (Myers, R. A.; Worm, B. (2003))

14
The journal Science published a four-year study in November 2006, which predicted that, at
prevailing trends, the world would run out of wild-caught seafood in 2048. The scientists stated
that the decline was a result of overfishing, pollution and other environmental factors that were
reducing the population of fisheries at the same time as their ecosystems were being degraded.
Yet again the analysis has met criticism as being fundamentally flawed, and many fishery
management officials, industry representatives and scientists challenge the findings, although the
debate continues. Many countries, such as Tonga, the United States, Australia and New Zealand,
and international management bodies have taken steps to appropriately manage marine resources
(Worm, Boris; Barbier, E. B.; Beaumont, N.; Duffy, J. E.; Folke, C.; Halpern, B. S.; Jackson, J. B.
C.; Lotze, H. K. et al. (2006-11-03); Juliet Eilperin (2009-11-02)).
b) Irrigation
The impacts of irrigation on environmental includes the changes in quantity and quality of soil
and water as a result of irrigation and the ensuing effects on natural and social conditions at the
tail-end and downstream of the irrigation scheme.
The impacts stem from the changed hydrological conditions owing to the installation and
operation of the scheme.
Figure 1: Irrigation Scheme hydrology
An irrigation scheme often draws water from the river and distributes it over the irrigated area. As
a hydrological result it is found that:
The downstream river discharge is reduced,
15
The evaporation in the scheme is increased,
The groundwater recharge in the scheme is increased,
The level of the water table rises,
The drainage flow is increased.
These may be called direct effects.
Effects on soil and water quality are indirect and complex, and subsequent impacts on natural,
ecological and socio-economic conditions are intricate. In some, but not all instances, water
logging and soil salinization can result. However, irrigation can also be used, together with soil
drainage, to overcome soil salinization by leaching excess salts from the vicinity of the root zone
(Van Hoorn, J. W. and J.G. Van Alphen (2006)).
Irrigation can also be done extracting groundwater by (tube) wells. As a hydrological result it is
found that the level of the water descends. The effects may be water mining, land/soil subsidence,
and, along the coast, saltwater intrusion.
Irrigation projects can have large benefits, but the negative side effects are often overlooked
(Thakkar, Himanshu, (1999)). Agricultural irrigation technologies such as high powered water
pumps, dams, and pipelines are responsible for the large-scale depletion of fresh water resources
such as aquifers, lakes, and rivers. As a result of this massive diversion of freshwater, lakes,
rivers, and creeks are running dry, severely altering or stressing surrounding ecosystems, and
contributing to the extinction of many aquatic species (Pearce, R. (2006))
c) Agricultural land loss and soil erosion
Lal and Stewart estimated global loss of agricultural land by degradation and abandonment at 12
million hectares per year (Lal, R. and B. A. Stewart. (1990)). In contrast, according to Scherr,
GLASOD (Global Assessment of Human-Induced Soil Degradation, under the UN Environment
Programme) estimated that 6 million hectares of agricultural land per year had been lost to soil
degradation since the mid-1940s, and she noted that this magnitude is similar to earlier estimates
by Dudal and by Rozanov et al. (Scherr, S. J. (1999)). Such losses are attributable not only to soil
erosion, but also to salinization, loss of nutrients and organic matter, acidification, compaction,

16
water logging and subsidence (Oldeman, L. R., R. T. A. Hakkeling and W. G. Sambroek. (1990))
Human-induced land degradation tends to be particularly serious in dry regions. Focusing on soil
properties, Oldeman estimated that about 19 million square kilometers of global land area had
been degraded; Dregne and Chou, who included degradation of vegetation cover as well as soil,
estimated about 36 million square kilometers degraded in the world‟s dry regions (Eswaran, H.,
R. Lal and P. F. Reich. (2001)). Despite estimated losses of agricultural land, the amount of arable
land used in crop production globally increased by about 9 percent from 1961 to 2012, and is
estimated to have been 1.396 billion hectares in 2012 (FAOSTAT, (2010))
Global average soil erosion rates are thought to be high, and erosion rates on conventional
cropland generally exceed estimates of soil production rates, usually by more than an order of
magnitude (Montgomery, D. R. (2007)) In the US, sampling for erosion estimates by the US
NRCS (Natural Resources Conservation Service) is statistically based, and estimation uses the
Universal Soil Loss Equation and Wind Erosion Equation. For 2010, annual average soil loss by
sheet, rill and wind erosion on non-federal US land was estimated to be 10.7 t/ha on cropland and
1.9 t/ha on pasture land; the average soil erosion rate on US cropland had been reduced by about
34 percent since 1982 (NRCS. (2013)). No-till and low-till practices have become increasingly
common on North American cropland used for production of grains such as wheat and barley. On
uncultivated cropland, the recent average total soil loss has been 2.2 t/ha per year (NRCS. (2013)).
In comparison with agriculture using conventional cultivation, it has been suggested that, because
no-till agriculture produces erosion rates much closer to soil production rates, it could provide a
foundation for sustainable agriculture(Montgomery, D. R. (2007)).
d) Meat Production
The impacts of meat production on Environmental include use of fossil energy, water and land
resources, greenhouse gas emissions, and in some instances, rainforest clearing, water pollution
and species endangerment, among other adverse effects (Steinfeld, H. et al. (2006)).
Steinfeld et al. of the FAO estimated that 18 percent of global anthropogenic GHG (greenhouse
gas) emissions (estimated as 100-year carbon dioxide equivalents) are associated in some way
with livestock production. (Steinfeld, H. et al. (2006)). However, many estimates use different
sectoral assignment of some emissions. For example, a more recent FAO analysis estimated that

17
all agriculture, including the livestock sector, in 2011 accounted for 12 percent of global
anthropogenic GHG emissions expressed as 100-year carbon dioxide equivalents (Tubiello, F. N.
et al. (2014)). Similarly, the Intergovernmental Panel on Climate Change has estimated that about
10 to 12 percent of global anthropogenic GHG emissions (expressed as 100-year carbon dioxide
equivalents) were assignable to all of agriculture, including the livestock sector, in 2005
(Intergovernmental Panel on Climate Change. (2007)) and again in 2010 (Intergovernmental
Panel on Climate Change (2014)). The percentage assignable to livestock would be some fraction
of the percentage for agriculture. The amount assignable to meat production would be some
fraction of that assigned to livestock. FAO data indicate that meat accounted for 26 percent of
global livestock product tonnage in 2011 (Oldeman, L. R., R. T. A. Hakkeling and W. G.
Sambroek (1990)).
Globally, enteric fermentation (mostly in ruminant livestock) accounts for about 27 percent of
anthropogenic methane emissions, (Intergovernmental Panel on Climate Change (2013)). Despite
methane‟s 100-year global warming potential, recently estimated at 28 without and 35 with
climate carbon feedbacks, (Intergovernmental Panel on Climate Change (2013)). Methane
emission is currently contributing relatively little to global warming. Over the decade 2000
through 2009, atmospheric methane content increased by an average of only 6 Tg per year
(because nearly all natural and anthropogenic methane emission was offset by degradation), while
atmospheric carbon dioxide increased by nearly 16,000 Tg per year. (Intergovernmental Panel on
Climate Change (2013)). At the currently estimated rate of methane degradation, slight reduction
of anthropogenic methane emissions, to about 98 percent of that decade‟s average, would be
expected to result in no further increase of atmospheric methane content. Although reduction of
methane emissions would have a rapid effect on warming, the expected effect would be small
(Dlugokencky, E. J., E. G. Nisbet, R. Fisher and D. Lowry. (2011)). Other anthropogenic GHG
emissions associated with livestock production include carbon dioxide from fossil fuel
consumption (mostly for production, harvesting and transport of feed), and nitrous oxide
emissions associated with use of nitrogenous fertilizers, growing of nitrogen-fixing legume
vegetation and manure management. Management practices that can mitigate GHG emissions
from production of livestock and feed have been identified (Boadi, D. (2004); Martin, C. et al.
(2010); Eckard, R. J. et al. (2010)).

18
Livestock production, including feed production and grazing, uses about 30 percent of the earth‟s
ice-free terrestrial surface: about 26 percent for grazing and about 4 percent for other feed
production (Steinfeld, H. et al. (2006)). The intensity and duration of grazing use vary greatlyn
(Holechek, J. L., R. D. Pieper and C. H. Herbel. (1995)). and these, together with terrain,
vegetation and climate, influence the nature and importance of grazing‟s environmental impact,
which can range from severe to negligible, and in some cases (as noted below) beneficial.
Excessive use of vegetation by grazing can be especially conducive to land degradation in dry
areas (Dregne, H. , E., & Chou, N. T. (1992)).
2.3. The Impacts of Human Activities on Environments on Rwanda
Rwanda‟s environmental problems are associated mainly with bad management of natural
resources such as land, forests and water. There are also problems caused by industrial,
commercial and human settlement activities and various pollutions. The production and
management of waste constitute also a challenge to environment quality, particularly in urban
areas (MINIRENA, 2001).
2.3.1 Degradation of Natural Resources and Biodiversity
A) Population and Resources Imbalance
The major environmental problem in Rwanda is the imbalance between the population and natural
resources (land, water, flora, fauna and other nonrenewable resources) which have been degrading
over decades. This degradation is reflected through massive deforestation, the reduction of
biodiversity, the cultivation of marginal areas, the erosion and unplanned cultivation of marshes.
The imbalance between the population and natural resources has resulted in a constantly
increasing impoverishment of the population. In 1993, the proportion of households living below
the poverty threshold was 53%. It greatly increased after the 1994 war and genocide. Surveys
carried out in 2001 show that at the national level, 60% of households lives under the poverty
threshold (MINIRENA, 2001).

19
B) Land Degradation
The degradation of land in Rwanda is happening at a worrying speed. The current situation is
alarming. There are several causes for this. There are natural and/or structural causes first and
there are also man-made causes.
Natural causes
a. Causes of a Pedological Nature
From their pedogenesis, Rwanda‟s soils are fragile and therefore vulnerable and very sensitive to
erosion.
b. Causes of a geomorphological nature
Rwanda is characterized by an uneven relief with a physiographical configuration formed of steep
slopes exposed to erosion.
c. Causes of a climatic nature
Rainfall in Rwanda is governed by altitude. Annual rainfall increases from East (900mm) to West
(1600mm). High rainfalls expose steep-sloped soils to water erosion, and low rainfalls expose
lowlands to high insolation.
Man-made causes
a) Population pressure due to agricultural land needs
The use of land for agriculture occupies more than 90% of the population. Today, the physical
population density in Rwanda is about 309 inhabitants/km2 and the physiological density is more
than 430 inhabitants/km2.
As a result of the high population pressure, there is a rapid reduction of the size of farmland for
families. This land shortage has led to the occupation and cultivation of land which is unsuitable
for agriculture. Crops are planted on slopes and occupy up to more than 80% of land recognized
as more marginal, marshland and protected areas.

20
Erosion due to cultivation on excessively steep slopes without any techniques for erosion control
or soil and water management and conservation, together with their excessive cultivation make
soils in Rwanda prone to continuous degradation. Land losses are considerable and are estimated
at between 0 and 557 tonnes/ha per year (MINIRENA, 2001)
b) Scattered settlements and excessive land parcelling
The prevailing mode of scattered human settlements in Rwanda is the source of wastage of land
which is supposed to be suitable for agro-pastoral activities. In addition, scattered human
settlements enhance erosion as a result of the many paths joining households and the lack of
systems for the collection and drainage of wastewater and rain water. Excessive land parceling as
a result of land heritage had contributed to the miniaturization of plots to such an extent that
farmers no longer practice fallow and no longer manage to meet their basic nutritional needs. This
crisis situation contributes to the exhaustion of land resources and accelerates its deterioration
and, indirectly, the degradation of environment (MINIRENA, 2001).
c) Bad farming practices and overgrazing
The methods and techniques used for soil conservation have given priority to soil protection at the
expense of the improvement or restoration of soil fertility of the hill land. This inadequacy of
modern farming techniques for land development and rational management of land resources
leads to frightening erosion.
Concerning marshland, a comprehensive analysis of the problem of wetlands in Rwanda shows
that, in general, they are mismanaged and used in a disorganized manner for agricultural and
quarrying purposes without prior studies of the impact on water resources and human health. The
destruction of lake shores and river banks has led to the sapping of shores, resulting in silting up
and inverted soils due to inflow of new materials deposited by water erosion from neighbouring
watersheds. Overgrazing affects particularly the eastern regions of the country where cattle
treading promotes the degradation of the soils already weakened by severe sunny periods and
facilitates the progression of the desert. As a result, there is a very extensive degradation of the
soils and serious loss of their fertility as well as increased water and wind erosion (MINIRENA,
2001)
21
d) Anarchical exploitation of mines and quarries
Mining and quarrying activities carried out in the different parts of the country affect the soils of
the hills and marshes. They contribute to increased erosion on hills where quarries that have been
left open promote erosion, together with the drying up of marshland, lakes and rivers.
e) Deforestation and abandonment of the system of erosion control
Massive deforestation, combined with the abandonment and the destruction of erosion control
systems, particularly following the displacement of the population caused by the 1994 war and
genocide, contribute greatly to the degradation of the bare land on steep slopes and hills.
C) Disasters
A disaster is defined as a total upheaval of society, causing human life, material, economic and
environmental losses, and which is beyond the capacity of the affected society to face it with its
own resources. There are two types of disasters which affect environment: natural disasters and
man-made disasters.
Natural disasters
Natural disasters are those which are due to climatic or seismo-volcanic disturbances. They
represent a permanent threat to our country and include drought, torrential rains, floods,
landslides, earthquakes, volcanic eruptions.
Man-made disasters
Man-made disasters are a result of human activities and are mainly bush fires, conflicts and wars,
deforestation and others.
a. Bush fires
In Rwanda, bush fires are very frequent during the dry season, especially in the eastern and south-
eastern regions (Umutara, Kibungo and Bugesera). Parks and protected areas are the most affected
for pastoral reasons, poaching, mining, carbonization, etc. This phenomenon is responsible for
land degradation, deforestation, loss of biodiversity, etc.

22
b. Conflicts and wars
Since 1959, Rwanda has experienced conflicts and social crises which resulted in losses of human
lives. The latest and most flagrant case is the war which plunged the country into grief since 1990
and was followed by the massacres and the genocide in 1994, with the following consequences on
the environment: degradation of environment in general; massive displacements of the population
which led to the degradation and modification of ecosystems; loss of skills in the field of
environment and reduction of formerly protected areas (MINIRENA, 2001).
c. Deforestation
Although this phenomenon is not considered as a disaster in general, in the case of Rwanda, it is a
major man-made disaster. The case of the forest of Gishwati is a sufficient example.
d. Other disasters
Some chemical products have the characteristic of exploding under the effect of high temperatures
when they are badly conserved and/or have expired. Such is the case with mancozeb which caught
fire in the warehouses of Gikondo. Mention should also be made of the excessive use of toxic
products, fires from various sources, particularly those linked to petrol stations, garages,
industries and factories; road accidents and poor electrical installations, etc.

23
CHAPTER 3: RESEARCH METHOLOGY AND TECHNIQUES
3.1 Study Area Description
3.1.1 Location and Demography of Musanze District
Musanze District is one of 5 Districts that assemble the Northern Province of Rwanda. It is
composed by of 15 sectors among which 4 are located along Virunga National Park; 68 cells
and 432 Villages. Its total area is estimated at 530.4 km2
of what 60km2 is Virunga national
park and forest and 28km2 covers the Ruhondo Lake. Musanze District border in the North
DRC (Demacratic Republic of Congo) and Uganda, Burera District in the East, Gakanke
District in the South and Nyabihu Ditrict in the West (Figure 1). The population number is
estimated at 368,267 inhabitants where 174,399 inhabitants equal to 47.4% are males and
193,868 inhabitants equal to 52.6% are females. The average annual growth rate in Musanze
district is estimated at 1.8. (NISR 2012).
Figure 2: Administrative Map of Musanze District

24
3.1.2 Geographical Location of Kinigi Sector
Kinigi sector is one of the 15 sectors of Musanze District. This Sector has 5 Cells which are
Nyonirima, Kampanga, Nyabigoma, Bisoke, Kaguhu; all those cells are divided into 28 villages.
Kinigi sector is located near the Volcano National Park, with perimeter which is equal to
25.87km. Geographically, Kinigi sector lies between the following coordinates: 454283m Easting
and 4839800m Northing. It is located at about 9.5 km from Musanze town. (NISR 2012)
Figure 3: Administrative map of Kinigi Sector
Kinigi is located in a hilly region within an altitude ranging between 2190 and 2260m. The soil is
very fertile and suitable for agriculture. This region is prone to soil erosion due to steep slopes on
the southern aspect of the volcanoes and high rainfall. (Musanze Land officer)

25
Population Size, Structure and Density
The population of Kinigi is estimated at 27,221 which present 7.4% of Musanze district peoples in
which 12,818 equal to 47.1% are males and 14,403 equal to 52.2% are females. The number of
households is estimated at 6,311 of the population counts, the average annual growth rate in
Kinigi sector is estimated at 2.6 and the density at 337Inhabitants./km2. (NISR, 2012)
Climate in Kinigi Sector
Generally, the north-western region of Rwanda has a moderate and humid climate due to its high
altitude and abundant rainfall, which records the national annual rainfall maxima of 2000 mm
between 2000 and 3000 m of altitude.
The afromountain forests of PNV enable climatic regulation in the region as far as precipitation is
concerned. There is rainfall throughout the year but with two heavy rain seasons; the longest
being from February to June with a peak in April while the shortest is from September to
December with a peak in November. This pattern of rainfall is characteristic of the Intertropical
Convergence Zone known to be ideal for agricultural activities. The annual temperature averages
depend on altitude, decreasing by 0.65°C every 100 m. (Lebrun 1960 in ORTPN 2005b:5).
3.2 Methodology
For the success of this research, different methods and techniques were used in order to get useful
information and data related to the topic. Kinigi Sector has been chosen among 15 Sectors of
Musanze District, because Kinigi is a sector which is attractive to tourist and creates income for
the whole country because of demographic pressure, urban areas and settlements and other human
activities are expanding and threatens to destroy the environments and forest.
The study aims to develop a well understanding about to assess the impacts of human activities on
the environment. Different already existing studies have been considered, in order to compare
results in the global context.
3.2.1 Data Collection Methods
Data collection methods refer to a set of methods and principles that are used to collect data when
conducting a research on a specific topic. In this part researcher describe the different methods
used to obtain or collect necessary data.
26
Primary Data
Questionnaires
The questionnaire was administered via a face to face with respondents. From questionnaires the
researcher will collect data such as historical data of land use, current land uses and the reasons
for land use change, on other hand, questionnaires will include questions about the impacts of
human activities on forest in Kinigi sector and the reasons for those changes.
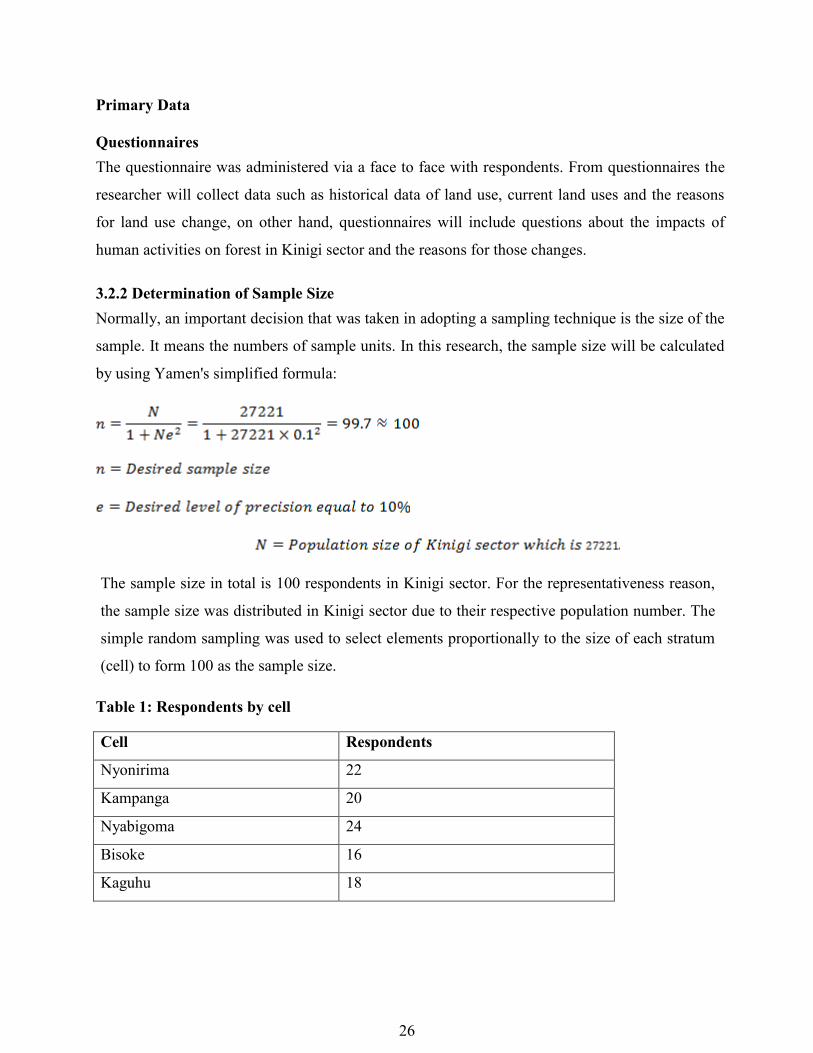
3.2.2 Determination of Sample Size
Normally, an important decision that was taken in adopting a sampling technique is the size of the
sample. It means the numbers of sample units. In this research, the sample size will be calculated
by using Yamen's simplified formula:
The sample size in total is 100 respondents in Kinigi sector. For the representativeness reason,
the sample size was distributed in Kinigi sector due to their respective population number. The
simple random sampling was used to select elements proportionally to the size of each stratum
(cell) to form 100 as the sample size.
Table 1: Respondents by cell
Cell Respondents
Nyonirima 22
Kampanga 20
Nyabigoma 24
Bisoke 16
Kaguhu 18

27
3.2.3 Data Source
For this research project, Landsat 7 Enhanced Thematic Mapper (ETM+) data is online acquired.
Landsat satellite images of Kinigi sector were acquired for 2001 and orthophoto of 2009. The
Landsat satellites image of 2001 was obtained from Global Land Cover Facility (GLCF) an Earth
Science Data Interface. Further administrative maps were obtained from CGIS-UR. These were
transformed and referenced brought to Universal Transverse Mercator projection in zone 35.
Researcher prefer to download satellites images from global land cover facility because to access
the images is free of cost and it resolution is high.
Table 2: Data Sources
3.2.4 Secondary Data Collection
In order to have a full understanding of the change in forest due to human activities in Kinigi
Sector from 2001 to 2009, secondary data was collected from different sources such as: satellites
imagery from Landsat, Rwanda shapefiles of administrative boundaries for the study area and also
different publication, dissertation and journals in order to have a full understanding about
urbanization and its effects on agricultural land.
S/N Category Data type Year Scale+resolution Source
1. Landsat image Image 2001 30m ™
GLCF
2. Orthophoto Image 2009 30m TM
GLCF
4 Administrative and local
government Map of Rwanda.
Shapefiles 2005 View scale CGIS-UR

28
3.3. Data Processing
The main purpose was to digitalize landsat images of 2001 and orthophoto of 2009 to create land
use of Kinigi sector in both period, and then change detection of land use to detect the change in
forest cover, agricultural land and built up area in order to verify hypothesis and objectives of the
study.
3.4 Software Used
Basically, the following software will be used for this research project;
a) ArcGIS– This will be also used to create the map of the study areas and present results of change
in Kinigi Sector;
b) Erdas Imagine2010: This will be used for processing satellites images (eg: layers stack, resolution
merge, etc);
c) Microsoft Word: will be used basically for write-up of the research;
d) Microsoft Excel will be used in entering non-spatial data from questionnaires and the production
of graphs for presenting the results.
3.5 Georeferencing
With aerial photography and satellite imagery, sometimes the location information delivered with
them is inadequate, and the data does not overlap with other data you have used. I need to align or
georeference them to a map coordinate system. A map coordinate system is defined using a map
projection (ITRF 2005, Projected Coordinates System).
MAP PROJECTION VALUES
Coordinate System ITRF 2005 Transverse Mercator
Projection Transverse Mercator
Datum ITRF 2005
False Easting 500,000
False Northing 5,000,000
Central Merdian 30
Scale Factor 0.9999
Latitude of Origin 0
Units: Meter

29
3.6 Digitalization
Digitalization is process of generating vector data. The latter is a coordinate-based data model that
represents geographic features as points, lines, and polygons. This method has been used during
the creation features class (vector layer) from raster layer (orthophoto and landsat) and production
of maps of land use.
3.7 Clipping
This tool allows extracting a portion of a raster dataset based on a template extent. The clip output
includes any pixels that intersect the template extent. The clipped area is specified using an output
extent file which delimitate my study area of Kinigi Sector from orthophoto, from Administrative
map and VNP forest has been clipped to analyze every change in forest cover change in Kinigi
Sector from 2001-2009.
3.8 Overlay and Detect Change
As overlay is one of function of GIS where data layers were combined and new information is
derived, usually by creating features in a new layer. In this section, we look at techniques of
combining two spatial data layers and producing a third one from them. This method has been
used to detect the changes in forest from 2001-2009 by which the coverage of forest and human
activities has been overlayed.
30
CHAPTER 4: RESULTS PRESENTATION AND ANALYSIS
This chapter is about the major findings collected from the field survey. It is going to deal with
the presentation, analysis and interpretation of two types of data, data from respondents using
questionnaire and spatial data from GPS and satellites images in order to analyze the impact of
human activities on forest in Kinigi Sector. Information was obtained by interviews with citizens
using structured questionnaires; the data are presented in the form of tables and graphs.
4.1 Analysis of Questionnaires Data
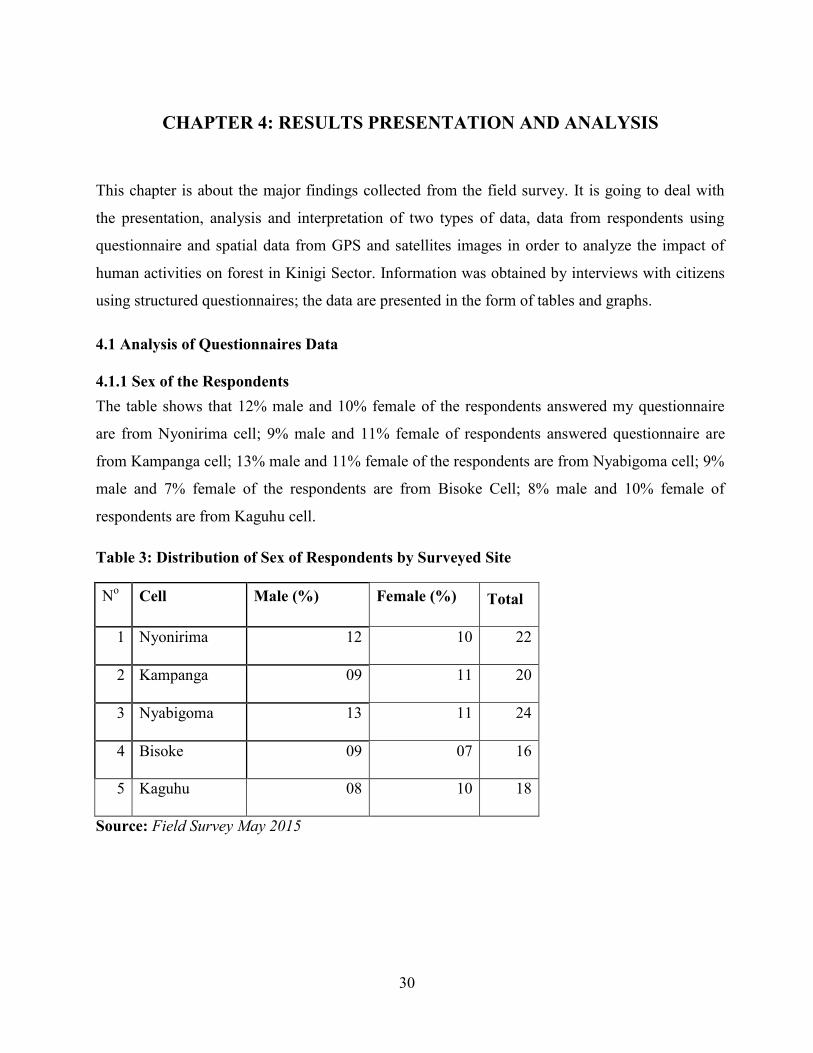
4.1.1 Sex of the Respondents
The table shows that 12% male and 10% female of the respondents answered my questionnaire
are from Nyonirima cell; 9% male and 11% female of respondents answered questionnaire are
from Kampanga cell; 13% male and 11% female of the respondents are from Nyabigoma cell; 9%
male and 7% female of the respondents are from Bisoke Cell; 8% male and 10% female of
respondents are from Kaguhu cell.
Table 3: Distribution of Sex of Respondents by Surveyed Site
No Cell Male (%) Female (%) Total
1 Nyonirima 12 10 22
2 Kampanga 09 11 20
3 Nyabigoma 13 11 24
4 Bisoke 09 07 16
5 Kaguhu 08 10 18
Source: Field Survey May 2015

31
Figure 4: Gender of Respondents
4.1.2 Main Land Use Types in Kinigi Sector in 2001
During the survey, I was interested to know the view on land use types in Kingi sector in the
recent years.
From graph, we see that 46% of respondents said that crop was the main activities in Kinigi
sector; 50% of the respondents said that forest was the main land use type in Kinigi; 4% of the
respondents said that built up area were the main land use type in Kinigi sector; no one said that it
was a water body.
Figure 5: Land Use Type in Kinigi Sector in 2001

32
Table 4: Main Land Use Type in Kinigi Sector in 2001
No Types of land use Respondents Percentage (%)
1 Crop 46 46
2 Forest 50 50
3 Built up 4 4
5 Water body 00 00
6 Total 100 100
Source: Field survey May, 2015
4.1.3 Change in Land Use Type for 8 years
I also asked the respondents the change in land use type in Kinigi sector during the 2001 and
2009. Among 100 respondents who filled the questionnaires, 98 respondents said that there is a
significant change in land use in Kinigi sector from 2001 until 2009 and 2 respondents said that
there is not any change in land use types.
After answering this questions, we asked again those who agree that there is a change in land use
type the dominants land use types in Kinigi sector in 2009, the results is summarized in the below
table 5.
From the below table, 47 respondents equal 47.96% state that in 2009 the main land use type was
forest cover, 9 respondents equal to 9.18% said that the main land use types was built up area, 42
respondents equal to 42.86% said the main land use types was crop. Looking on those results and
the one of the previous question we see that time by time there is a decrease in forest cover but
there is an increase in built up area and crop land.
Table 5: Change in Land Use from 2001-2009
No Types of land use Respondents Percentage (%)
1 Crop 42 42.86
2 Forest 47 47.96
3 Built up 09 9.18
5 Total 98 100
Source: Field survey May, 2015

33
Figure 6: Main Land Use Type in Kinigi in 2009
4.1.4 The Impact of Change in Land Use Type in Kinigi
After seeing the dominant land use in kinigi and the change of land use type, it was necessary to
seek information if there are impacts of that change to the peoples living in Kinigi Sector. The
result from respondents is summarized in the table 6 below.
Table 6: Respondent’s View on Impact Caused by the Change in Land Use
NO
Impacts caused by the change in land use Respondents Percentages (%)
1 High price of timber products 70 70
2 Land conflict 30 30
Total 100 100
Source: Field survey May, 2015
The below figure shows that 70% of respondents said that those change in land use types caused
the high price of timber because forest cover are decreasing on a rate of 3.53% from 2001 to 2009
and 30% of respondents said that those change in land use type caused land conflict.

34
Figure 7: Impact of change in land use
4.1.5 The Change in Land Value in Kinigi from 2001-2009
During my survey, researcher asked information on land value in Kinigi sector because the time
human activities is growing in a region also the land market on that region increase because more
investors are willing to invest in some Sectors. We asked if there is change in land market or land
value 87% of respondents said that there is a change in land value (land market) and 13% of
respondents said that there is no change in land value (land market).
From the below figure we see that the majority of respondents said that there is a change in land
market, those who said that there is change in land market said that the cause of those change is
that Kinigi sector nowaday is a tourist sector and many investors invest in infrastructure in Kinigi
sector in order to facilitate the tourist coming around the world to visit Virunga National Park.

35
Figure 8: Change in Land Market
4.1.6 The Advantage of Tourism in Kinigi
From the respondent‟s view on the advantage of tourism in Kinigi Sector, 96% of respondents
said that there are advantages for them caused by tourism, 4% of respondents said that no
advantages. The respondents who said that there are advantages for them, they state the following
advantages:
Opportunities to create new job;
Access to infrastructure;
New opportunities on investments;
Access to Land market.
4.1.7 Level of Satisfaction on Water Quantity and Quality in Kinigi
In Kinigi Sector, I seek the information about the quantity and quality of water because it has an
important influence on health.
From the below figure we see that poor water quantity and quality was dominant in Bisoke cell,
where 50% of the respondents said that they are not satisfied with quantity and quality of water
they get, this cell is a rural cell in Kinigi sector the reason why there is not sufficient water and
electricity. Kampanga and Nyonirima cells have sufficient water quantity and qualite because it is
the urban area or cells Kinigi sector and those cells is situated near the road.

36
Table 7: Level of Satisfaction on Water Quantity and Quality
No Cell Good (%) Moderate (%) Poor (%)
1 Nyonirima 63,64 27,27 9,1
2 Kampanga 75 15 10
3 Nyabigoma 50 4,17 8,33
4 Bisoke 12,5 37,7 50
5 Kaguhu 44,44 44,44 11,11
Figure 9: Level of Satisfaction on Drinking Water.
4.2 Spatial analysis
4.2.1 Land Use of Kinigi Sector in 2001
The below figure represents the statistics area of each land use derived from image classification
using ArcMap 10.2, and they are categorized into three types of land use. Built up area in 2001
occupies 0.48% of the total land use. This may be justified by the fact that the rate of population
growth was not high in 2001.
Crop and forest area occupies large areas which are 48.59% and 50.93% respectively for crop and
forest is justified by the fact that many people living in Kinigi were living by agriculture and there
were so many forests.

37
Figure 10: Land Use of Kinigi in 2001
Table 8: Land Use Distribution in 2001
Year Area in 2001 Percentage (%)
forest 4025,62 50,93
Crop 3840,88 48,59
Built up area 37,65 0,48
The above figure show that in 2001 in Kinigi sector there was many forest and agriculture was at
a high level. It shows that in 2001, 50.93% of land use type was forest, 48.59% was crop land and
0.48% was built up area.

38
Figure 11: Land Use Distribution in 2001
4.2.3 Land Use of Kinigi Sector in 2009
Comparing to the figure12, there is increasing of the built up area, increase of agricultural land,
and decrease in forest area. The above table show land use in 2009.

39
Figure 12: Land Use Distribution of Kinigi Sector in 2009
Table 9: Percentage of Land Use in 2009
Year Area in 2009 Percentage (%)
forest 3746,44 47,40
Crop 4070,38 51,50
Built up area 87,38 1,11
From the figure below, it shows that there is a decrease of 3.53% of forest area, decrease of 2.93%
in agricultural land and a decrease of 0.61% in built up area.
Comparing to the data of land use from questionnaires and one from spatial data from
classification there is a difference of 0.56% in forest cover, 8.64% in crop area and 8.05% in built
up area. The result from spatial analysis by classification is not similar because the respondents
estimate their view on land use, they don‟t know the extent of each land use types.

40
Figure 13: Land Use in 2009
4.2.4 Land Use Change From 2001-2009
The above figure is a result after digitizing all changes in land use between the year 2001 and
2009. The change of land use is summarized in the below table.
Figure 14: Map of Land Use Change of Kinigi From 2001-2009.

41
Figure14 above represents the statistics area of each land use land cover as they are categorized
into three types of land use , the table shows that in 2001, forest area was 48.59% of total land use
in Kinigi sector but in 2009 there is decrease of 3.53%, this is because that peoples cut forest for
settlement and others forest are cut for agricultural purpose as shown by figure 14, 271.9387ha of
forest has been converted into crop and 7,24Ha of forest has been converted into built up area
(See table 11).
Table 10: Area of Use Change of Kinigi From2001-2009.
Land use types 2001 2009 Change from 2001-2009
Area (ha.) Area (%) Area (ha) Area(%) Area (ha) %change
Built-up Land 37,65 0.48 87.38 1.11 +49.73 +0.63
Forest Land 4025,62 50.93 3746.44 47.40 -279.18 -3.53
Crop Land 3840,88 48.59 4070.38 51.50 +229.5 +2.90
Total 7904.15 100 7904.2 100
Table 11: Land Use Conversion From 2001-2009
Land use change change type Area in Ha % Observations
Crop Built up Forest
Crop converted into Built up 58.98 0.75 loss gain no change
Forest converted into Crop 271.94 3.69 gain no change loss
Forest converted into Built up 7.24 0.09 no change gain loss
Built-up in 2001 occupies 0.48% of the total land use. This may be justified by the fact that the
rate of population growth was not high and also the tourism sector in Kinigi was not developed at
high level. in 2009, built up area increase from 0.48 to 1.11% which means that there is a high
change in the eight years, they built many residential house, lodges, restaurants, hotels because of
the development of tourism sector in Kinigi sector in order that the tourists coming all over the
world get access to all needs and facilities in Kinigi sector.

42
The great occupation of crop and forest land which are 51.50% and 47.40% respectively for crop
and forest is justified by the fact that many people living in Kinigi sector were mainly interested
in agricultural activities.
Also the cause of those changes is that in Rwanda‟s environment problems are associated mainly
with bad management of natural resources. Also those changes have been caused by commercial
and human settlement activities. Massive deforestation in kinigi is due to the fact that Tourism
Sector in Kinigi is developing and the infrastructure also has to develop in Kinigi sector so that
the development of tourism sector will fit with the infrastructure development in order to satisfy
the needs of the tourists from all over the World to visit the Virunga National Park.

43
CHAPTER 5: CONCLUSION AND RECOMMENDATIONS
5.1 Conclusion
This research aimed to assessing the impact of human activities on forest from 2001-2009 in
Kinigi Sector using GIS. To provide a detailed information (Statistical and spatial) on the changes
on forest cover in Kinigi Sector due to human activities and how those changes affected forest
cover, I used many techniques in order to achieve the objectives of this study; interview through
structured questionnaires, change detection with ArcGIS software, statistical analysis via MS
Excel, Field visit and observation.
The hypothesis that there is a decrease in forest due to human activities has been confirmed.
It was found that there is a conversion of forest into built up area and agricultural land, those
change impacted peoples livelihood, such as by timber trade in Kinigi Sector as said by
respondents (see figure 6).
Assessment of land use change results were presented in table 11 where built-up area and
agricultural land have been increased and the forest coverage have been decreased at a high level.
98% of the respondents agree with those changes which results to the loose of the forest coverage.
Forest Products usually provide food, medicine and other goods to rural people living in Kinigi
sector. However, due to overexploitation of forest products, some of them will disappeared, the
most dramatic impact is a loss of habitat for millions of species in ecosystem which is living in
forest; also forest soils are moist, but without protection from sun-blocking tree cover they
quickly dry out. Trees also help perpetuate the water cycle by returning water vapor back into the
atmosphere. Without trees to fill these roles, the erosion control systems will be in danger and the
continuous loose of the forest will greatly contribute to the degradation of bare land on steep
slopes and hills in Kinigi Sector. Therefore, appropriate conservation measures are needed in
order to restore the forest cover which has been affected by human activities by planting other
forest and conserve the forest
in Kinigi Sector.

44
5.2. Recommendations
Based on results from this research, our objectives have been achieved. However, it is
recommended the following:
I recommend to consider the forest within Kinigi sector because from the results I see that
they is a loose in forest coverage in Kinigi Sector from 2001-2009, the forest coverage has
been cutted to get get settlement areas and also agricultural land;
Kinigi sector where forest cover has been cutted for built up and crop should be restored
and preserved, so the authorities in Sector must sentitize to the population to plant new
trees;
During the development of rural area into urban area, the physical planners must plan,
control that change in order to avoid the loose of green space;
The population of Kinigi have to built in grouped settlements in order to use land in proper
way;
My research is based on assessing the impact of human activities on forest cover from
2001 to 2009 in Kinigi. Future research on impact of human activities in Kinigi sector
could also look at a longer period of time thereby accounting for more than a eight years
time period. For the purposes of my research, eight years was a sufficient to be able to see
if human activities impact forest cover.

45
References
1. Allan T. (1997), Watersheds and “Problemsheds”: Where do Goverments find Economic;
2. Asamoah, B., (2010). Urbanization and Changing Patterns of Urban Land Use in Ghana:
Policy and Planning Implications for Residential Land Use in Kumasi. Unpublished MSc
Dissertation, Department of Planning, KNUST, Ghana,
3. Boadi, D. 2004. Mitigation strategies to reduce enteric methane emissions from dairy
cows: Update review. Can. J. Anim. Sci. 84:319–335,
4. Brookfield H., Byron Y. (1993). South- East Asia’s Environmental Future: The Search for
Sustainability. United Nations University Press/ Oxford University Press, Malaysia,
5. Clarke, K.C., 1986. Advances in geographic information systems, computers,
environment and urban systems, Vol. 10,
6. Commoner, B. (1971). The closing cycle – Nature, man, and technology, Alfred A. Knopf.
7. Connell, J. & L e a , J. (1996). Distant Places, Other Cities? Urban life in
Contemporary Papua New Guinea. In S. Watson & K. Gibson (eds), Postmodern cities
and spaces, (pp.165-183) Cambridge, Massachusetts,
8. Dalal, R.C. et al. 2003. Nitrous oxide emission from Australian agricultural lands and
mitigation options: a review. Australian Journal of Soil Research, Australia,
9. Dlugokencky, E. J., E. G. Nisbet, R. Fisher and D. Lowry. 2011. Global atmospheric
methane: budget, changes and dangers. Phil. Trans. Royal Soc,
10. Dregne, H., E., & Chou, N. T. 1992. Global desertification dimensions and costs. In:
Dregne, H. E. (ed.) Degradation and restoration of arid lands. Texas Technical
University. pp. 73-92,
11. Eckard, R. J. et al. 2010. Options for the abatement of methane and nitrous oxide from
ruminant production: A review. Livestock Science 130: 47–56,
12. Effectiveness and Social/Environmental Impacts of Irrigation Projects: a Review. In:
Annual Report 1988, International Institute for Land Reclamation and Improvement
(ILRI), Wageningen,
13. ENCARTA (2001). Microsoft Encarta Encyclopedia Deluxe 2001,

46
14. Eswaran, H., R. Lal and P. F. Reich (2001). Land degradation: an overview. In. Bridges,
E.M. et al. (eds.) Responses to Land Degradation. Proc. 2nd. Int. Conf. Land Degradation
and Desertification, Khon Kaen, Thailand. Oxford Press, New Delhi, India,
15. Faber, M., Niemes, N. and Stephan, G. (2012). Entropy, environment, and resources,
Spinger Verlag, Berlin, Germany,
16. FAO (2005), Rwanda country report, Rome,
17. FAO. Management of irrigation-induced salt-affected soils,
18. FAOSTAT (2001), [Agricultural statistics database] Food and Agriculture Organization of
the United Nations, Rome,
19. Gazel, H. Harre, D. & Moriconi-Ebrard, F. (2010). L’urbanisation en Afrique centrale et
orientale, Rapport général de l’étude Africapolis II,
20. Gray et al., (2005). Introduction to Effects of Urbanization on Stream Ecosystems,
21. Grizans, J. (2009), Urban Issues and Solutions in the Context of Sustainable
Development : A Review of the literature, University of Southern Denmark,
22. HABITAT (1996). An Urbanizing World: Global Report on Human Settlements. United
Nations. Oxford University Press, New York,
23. Holechek, J. L., R. D. Pieper and C. H. Herbel. (1995). Range management: principles and
practices. 2nd Ed. Prentice-Hall.
24. Huesemann, M.H., and J.A. Huesemann (2011). Technofix: Why Technology Won’t Save
Us or the Environment, Chapter 1, “The inherent unpredictability and unavoidability of
unintended consequences“, New Society Publishers,
25. Intergovernmental Panel on Climate Change (2007). Climate change 2007, Mitigation of
climate change. Fourth Assessment Report,
26. Intergovernmental Panel on Climate Change (2013). Climate change 2013, The physical
science basis. Fifth Assessment Report,
27. Intergovernmental Panel on Climate Change (2014). Climate change 2014, Mitigation of
climate change. Fifth Assessment Report,
28. IPAR (2012), Against the odds : Achieving the MDGs in Rwanda. Institute of Policy
Analysis and Research, Kigali, Rwanda,

47
29. John F. Long, David R. Rain, and Michael R. Ratcliffe, (2001). Population Density vs.
Urban Population: Comparative GIS Studies in China, India, and the United States,
Population Division, US. Census Bureau,
30. Juliet Eilperin (2009-11-02). "Seafood Population Depleted by 2048, Study Finds". The
Washington Post,
31. Kigali City, (2007). Kigali Conceptual Master Plan, Kigali,
32. Klein, C. A. M.; Ledgard, S. F. (2005). Nitrous oxide emissions from New Zealand
agriculture _key sources and mitigation strategies. Nutrient Cycling in Agroecosystems.
New Zeland,
33. Kok, P., Hall, P. & Nieuwmeijer, L. (1992). Planning options and their implications.
Pretoria,
34. Kümmel, R. (1989). "Energy as a factor of production and entropy as a pollution indicator
in macroeconomic modeling". Ecological Economics,
35. Lal, R. and B. A. Stewart. 1990. Soil degradation. Springer-Verlag, New York,
36. Landscape Gesellschaft fur Geo-Kommunikation, (2000–2002) Lexikon der
Geowissenschaften. Band 5, Heidelberg, Berlin ,
37. Masakazu, Ichimura, (2003). Urbanization, Urban Environment and Land Use:
Challenges and Opportunities. London, Institute for Global Environmental Strategies ,
38. Martin, C. et al. (2010). Methane mitigation in ruminants: from microbe to the farm scale.
Animal 4 : 351-365,
39. MINIFRA (2009), National Urban Housing Policy for Rwanda, Kigali,
40. MINIRENA (2002), Politiques de l’environment, Kigali,
41. MINAGRI (2011), Agriculture in Rwanda, 2009-2012 , 40p , Kigali Rwanda,
42. Montgomery, D. R. (2007). Soil erosion and agricultural sustainability. Proc. Nat. Acad,
43. Mutiara, Febi et al (2008). Managing Asia’s Rapid Urbanisation for Social Progress.
Indonesia,
44. Myers, R. A.; Worm, B. (2003). "Rapid worldwide depletion of predatory fish
communities". Nature 423 (6937): 280–283,,
45. National Development Planning Commission, (2005). Growth and Poverty Reduction
Strategy (GPRS II): 2006 – 2009. Accra, Government of Ghana,
46. NISR (2011), National Accounts, Kigali Rwanda,

48
47. NISR (2008-2012), Statistical bulletin , Kigali, Rwanda,
48. NISR (2011), The Third Integrated Household Living Conditions, Kigali,
49. NRCS (2013). Summary report 2010 national resources inventory. United States Natural
Resources Conservation Service. 163 pp,
50. Oldeman, L. R., R. T. A. Hakkeling and W. G. Sambroek. (1990). World map of the status
of human-induced soil degradation. An explanatory note. GLASOD, Global Assessment of
Soil Degradation. International Soil Reference and Information Centre, Wageningen,
51. Pearce, R. (2006). When the rivers run dry: Water – the defining crisis of the twenty-first
century, Beacon Press, ISBN 0807085731,
52. Population Division Department of Economic and Social Affairs (PDDESA) (2001).
World Population Prospects: The 2000 revision. United Nations, New York,
53. Ruth, M. (1993). Integrating economics, ecology, and thermodynamics, Kluwer Academic
Publishers, ISBN 0792323777,
54. Sajor Edsel ( 2001 ), Visiting Assistant Professor in Asian Institute of Technology in the
School of Environment, Resources and Development, Thailand. Personal contact in
Bangkok, November 2001,
55. Scherr, S. J. (1999). Soil degradation: a threat to developing country food security by
2020? International Food Policy Research Institute. Washington, D. C,
56. Steinfeld, H. et al. 2006. Livestock's Long Shadow: Environmental Issues and Options.
Livestock, Environment and Development, FAO, Rome. 391 pp,
57. Stutz F., Souza A. (1998). The world economy: Resources, Location, Trade, and
Development. Prentice Hall, New Jersey,
58. The Prospectus for World Urbanization and Rural Growth, (2001) United Nations
Population Division World Urbanization Prospects: The 2001 Revision, page 13-34 ,
59. Thakkar, Himanshu (1999). Assessment of Irrigation in India. World Commission on
Dams,
60. Tubiello, F. N. et al. 2014. Agriculture, forestry and other land use emissions by sources
and removal by sinks 1990-2011. FAO Statistics Division, Working Paper Series ESS/14-
02,
61. UNCHS, (1993). Improvement of municipal management, report of the executive
Director, habitat International,

49
62. United Nations Environmental Program (UNEP) (1997). Asia Pacific Environmental
Outlook. UNEP, Thailand,
63. Van Hoorn, J. W. and J.G. van Alphen. (2006). Salinity control. In: H.P. Ritzema (ed.),
Drainage Principles and Applications. Publication 16, International Institute for Land
Reclamation and Improvement (ILRI), Wageningen, The Netherlands. pp. 533-600,
64. Varis O. (1997a). Interconnections on Water, Food, Poverty, and Global Urbanization: a
Qualitative Analysis on Driving Forces, Impacts, and Policy Tools. International
Conference on Large Scale Water Resources Development in Developing Countries: New
Dimensions of Prospects & Problems, Kathmandu, Nepal,
65. Waugh, D. (2009). The New Wider world, Cheltenham, Nelson Thornes Ltd,
66. Worm, Boris; Barbier, E. B.; Beaumont, N.; Duffy, J. E.; Folke, C.; Halpern, B. S.;
Jackson, J. B. C.; Lotze, H. K. et al. (2006). "Impacts of Biodiversity Loss on Ocean
Ecosystem Services". Science 314 (5800): pp.787–790.

50
APPENDICES
a
Appendice1: Questionnaire
I, Theogene UWIMANA student at INES RUHENGERI in land survey department undertaking a
final project on “ASSESSING THE IMPACT OF HUMAN ACTIVITIES ON FOREST COVER
FROM 2001-2099 USING GIS, A Case study of Kinigi sector. This is intended to get information
from citizens living in Kinigi, this research only for academics purposes. We would kindly like to
ask you to complete the present questionnaire.
Privacy Statement
We and respect your privacy. All information obtained will be treated confidentially and it will
only use for academics purposes.
Thanks for your cooperation.
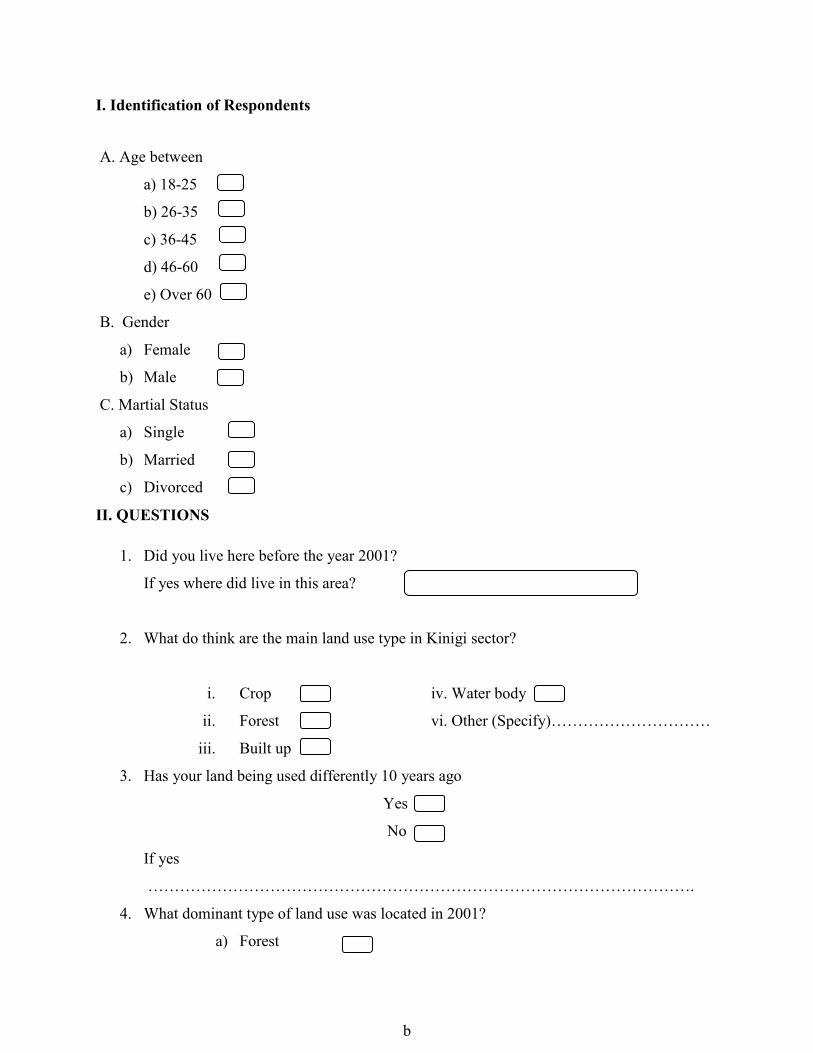
b
I. Identification of Respondents
A. Age between
a) 18-25
b) 26-35
c) 36-45
d) 46-60
e) Over 60
B. Gender
a) Female
b) Male
C. Martial Status
a) Single
b) Married
c) Divorced
II. QUESTIONS
1. Did you live here before the year 2001?
If yes where did live in this area?
2. What do think are the main land use type in Kinigi sector?
i. Crop iv. Water body
ii. Forest vi. Other (Specify)…………………………
iii. Built up
3. Has your land being used differently 10 years ago
Yes
No
If yes
………………………………………………………………………………………….
4. What dominant type of land use was located in 2001?
a) Forest

c
b) Built-up
c) Crop
d) Others (Specify)
5. Do you think are the impacts of those change to citizens living in Kinigi sector?
a) High price of timber
b) Low access to agricultural land
c) Missing land for farms
d) Land conflict
6. Comparing to the period before tourism development in Kinigi, is there any significant
change on land value?
Yes
No
If yes what are the main reasons for those change………………………….
………………………………………………………………………………
………………………………………………………………………………
………………………………………………………………………………
7. What are the impact on your life Kinigi urbanized than before?
a) Hungry
b) Poverty
c) Create new job
d) Access to infrastructure
e) New opportunities on investments
f) Others specify
8. Has tourism or disadvantages for you as citizen of Kinigi Sector?
Yes
No
If yes, which are those?.................................................................................
……………………………………………………………………………..
……………………………………………………………………………..
……………………………………………………………………………..
………………………………..
d
9. What is your level of satisfaction on drinking water in Kinigi Sector?
a) Quantity
i. Good
ii. Moderate
iii. Poor
b) Quality
i. Good
ii. Moderate
iii. Poor
10. Do you have enough electricity in Kinigi Sector?
a) Yes
b) No