Final-Benchmarking-Report-FINALsm
68
New Jersey Bicycling Benchmarking Report 2013 - 2014 Prepared for : Alan M. Voorhees Transportation Center Edward J. Bloustein School of Planning and Public Policy Rutgers, The State University of New Jersey Prepared by : New Jersey Department of Transportation
-
Upload
gabriela-kappes -
Category
Documents
-
view
13 -
download
0
Transcript of Final-Benchmarking-Report-FINALsm

1
New Jersey Bicycling Benchmarking Report
2013 - 2014
Prepared for :Alan M. Voorhees Transportation CenterEdward J. Bloustein School of Planning and Public PolicyRutgers, The State University of New Jersey
Prepared by :New Jersey Department of Transportation

2013-2014 New Jersey Bicycling Benchmarking Report
SUBMITED TO:
SUBMITED BY:
New Jersey Department of Transportation1035 Parkway AvenueP.O. Box 600Trenton, NJ 08635-0600
Alan M. Voorhees Transportation CenterEdward J. Bloustein School of Planning and Public PolicyRutgers, The State University of New Jersey33 Livingston AvenueNew Brunswick, NJ 08901

ABOUT
The Alan M. Voorhees Transportation Center (VTC) is a national leader in the research and development of innovativetransportation policy. Located within the Edward J. Bloustein School of Planning and Public Policy at Rutgers University, VTC has the full array of resources from a major research university on transportation issues of regional and national significance.
Alan M. Voorhees Transportation CenterEdward J. Bloustein School of Planning and Public PolicyRutgers, The State University of New Jersey33 Livingston Avenue, Fourth FloorNew Brunswick, New Jersey 08901
For questions or comments, you may contact Charles Brown, MPA at [email protected]
Please visit the Bicycle and Pedestrian Resource Center at http://njbikeped.org/
ACKNOWLEDGMENTS
This report was written by Charles Brown, MPA, Betsey Harvey, MCRP, James Sinclair, MCRP, and Nicholas J. Klein of the Alan M. Voorhees Transportation Center at Rutgers University, with support from Robert B. Noland.
The authors would like to thank the engineers, planners, police officers, elected officials, administrators, and countless other friendly municipal employees who responded to our survey on their bicycle infrastructure and policies. This report would not have been possible without their assistance. We would also like to thank graduate students James Bonanno, Gabriela Kappes, Mikhail Kublanov, and Michael Thompson for assisting in the collection of data, and Salwa Marzouk for her help in the design of the report.
New Brunswick, home to the Bicycle and Pedestrian Resource Center, during the winter.

TABLE OF CONTENTSIntroduction . . . . . . . . . . . . . . . . . . . . . . . . . . . . . . . . . . . . . . . . . . . . . . . . . . . . . . . . . . . . . . . . . . . . . . . . . . . . . . . . . . . . . . . . . . . . . . . . . . 7
Background. . . . . . . . . . . . . . . . . . . . . . . . . . . . . . . . . . . . . . . . . . . . . . . . . . . . . . . . . . . . . . . . . . . . . . . . . . . . . . . . . . . . . . . . . . . . . . . . . . . . 9
Methodology. . . . . . . . . . . . . . . . . . . . . . . . . . . . . . . . . . . . . . . . . . . . . . . . . . . . . . . . . . . . . . . . . . . . . . . . . . . . . . . . . . . . . . . . . . . . . . . . . . 11
Demographics. . . . . . . . . . . . . . . . . . . . . . . . . . . . . . . . . . . . . . . . . . . . . . . . . . . . . . . . . . . . . . . . . . . . . . . . . . . . . . . . . . . . . . . . . . . . . . . . . . 14
Population and Employment . . . . . . . . . . . . . . . . . . . . . . . . . . . . . . . . . . . . . . . . . . . . . . . . . . . . . . . . . . . . . . . . . . . . . . . . . . . . . 14
Bicycling by Mode Share . . . . . . . . . . . . . . . . . . . . . . . . . . . . . . . . . . . . . . . . . . . . . . . . . . . . . . . . . . . . . . . . . . . . . . . . . . . . . . . . . 17
Survey Results. . . . . . . . . . . . . . . . . . . . . . . . . . . . . . . . . . . . . . . . . . . . . . . . . . . . . . . . . . . . . . . . . . . . . . . . . . . . . . . . . . . . . . . . . . . . . 22
Education and Advocacy. . . . . . . . . . . . . . . . . . . . . . . . . . . . . . . . . . . . . . . . . . . . . . . . . . . . . . . . . . . . . . . . . . . . . . . . . . . . . . . . . . . . . . . 22
Adult Education and Employee Incentives . . . . . . . . . . . . . . . . . . . . . . . . . . . . . . . . . . . . . . . . . . . . . . . . . . . . . . . . . . . . . . 22
Safe Routes to School . . . . . . . . . . . . . . . . . . . . . . . . . . . . . . . . . . . . . . . . . . . . . . . . . . . . . . . . . . . . . . . . . . . . . . . . . . . . . . . 23
Funding and Staffing . . . . . . . . . . . . . . . . . . . . . . . . . . . . . . . . . . . . . . . . . . . . . . . . . . . . . . . . . . . . . . . . . . . . . . . . . . . . . . . . . . . . . . . . . 25
Infrastructure . . . . . . . . . . . . . . . . . . . . . . . . . . . . . . . . . . . . . . . . . . . . . . . . . . . . . . . . . . . . . . . . . . . . . . . . . . . . . . . . . . . . . . . . . . . . . . . . 30
Bicycle Route Infrastructure . . . . . . . . . . . . . . . . . . . . . . . . . . . . . . . . . . . . . . . . . . . . . . . . . . . . . . . . . . . . . . . . . . . . . . . . . . 30
Infrastructure Maintenance . . . . . . . . . . . . . . . . . . . . . . . . . . . . . . . . . . . . . . . . . . . . . . . . . . . . . . . . . . . . . . . . . . . . . . . . . . . . . . 37
Other Infrastructure . . . . . . . . . . . . . . . . . . . . . . . . . . . . . . . . . . . . . . . . . . . . . . . . . . . . . . . . . . . . . . . . . . . . . . . . . . . . . . . . . . . . . 39
Bicycle Parking . . . . . . . . . . . . . . . . . . . . . . . . . . . . . . . . . . . . . . . . . . . . . . . . . . . . . . . . . . . . . . . . . . . . . . . . . . . . . . . . . . . . . . . . . . . . . . . . . . . 39
Bicycle Parking Infrastructure . . . . . . . . . . . . . . . . . . . . . . . . . . . . . . . . . . . . . . . . . . . . . . . . . . . . . . . . . . . . . . . . . . . . . . . . . . . . . . . . 39
Zoning Policies that Require Bicycle Parking in New Developments . . . . . . . . . . . . . . . . . . . . . . . . . . . . . . . . . 43
Abandoned Bicycle Policies . . . . . . . . . . . . . . . . . . . . . . . . . . . . . . . . . . . . . . . . . . . . . . . . . . . . . . . . . . . . . . . 43
Bicycle Policies. . . . . . . . . . . . . . . . . . . . . . . . . . . . . . . . . . . . . . . . . . . . . . . . . . . . . . . . . . . . . . . . . . . . . . . . . . . . . 44
Safe Passing Laws . . . . . . . . . . . . . . . . . . . . . . . . . . . . . . . . . . . . . . . . . . . . . . . . . . . . . . . . . . . . . . . . . . . . . 44
Electric Bicycle Policies . . . . . . . . . . . . . . . . . . . . . . . . . . . . . . . . . . . . . . . . . . . . . . . . . . . . . . . . . . . . . . . . . 44
Cars Parked in Bicycle Lanes . . . . . . . . . . . . . . . . . . . . . . . . . . . . . . . . . . . . . . . . . . . . . . . . . . . . . . . . . . . . . . 44
Bicycle Maps . . . . . . . . . . . . . . . . . . . . . . . . . . . . . . . . . . . . . . . . . . . . . . . . . . . . . . . . . . . . . . . . . . . . . . . . . 44
Bicycling on Sidewalks . . . . . . . . . . . . . . . . . . . . . . . . . . . . . . . . . . . . . . . . . . . . . . . . . . . . . . . . . . . . . . . . . . 44
Bicycle Transportation Within Master Plans . . . . . . . . . . . . . . . . . . . . . . . . . . . . . . . . . . . . . . . . . . . . . . . . . . . 44
Complete Streets . . . . . . . . . . . . . . . . . . . . . . . . . . . . . . . . . . . . . . . . . . . . . . . . . . . . . . . . . . . . . . . . . . . . . . 45
Bicycle Share . . . . . . . . . . . . . . . . . . . . . . . . . . . . . . . . . . . . . . . . . . . . . . . . . . . . . . . . . . . . . . . . . . . . . . . . . 45
Bicycle Theft, Safety, and Security . . . . . . . . . . . . . . . . . . . . . . . . . . . . . . . . . . . . . . . . . . . . . . . . . . . . . . . . . . . . . 45
Bicycle Security . . . . . . . . . . . . . . . . . . . . . . . . . . . . . . . . . . . . . . . . . . . . . . . . . . . . . . . . . . . . . . . . . . 45
Bicycle Theft . . . . . . . . . . . . . . . . . . . . . . . . . . . . . . . . . . . . . . . . . . . . . . . . . . . . . . . . . . . . . . . . . . . . 49
Bicyclist Fatalities and Injuries . . . . . . . . . . . . . . . . . . . . . . . . . . . . . . . . . . . . . . . . . . . . . . . . . . . . . . . . 49
Investing in Bicycling . . . . . . . . . . . . . . . . . . . . . . . . . . . . . . . . . . . . . . . . . . . . . . . . . . . . . . . . . . . . . . . . . . . . . . . 49
Conclusion . . . . . . . . . . . . . . . . . . . . . . . . . . . . . . . . . . . . . . . . . . . . . . . . . . . . . . . . . . . . . . . . . . . . . . . . . . . . . . . 50
Appendix A - Reasons for Investing in Bicycling . . . . . . . . . . . . . . . . . . . . . . . . . . . . . . . . . . . . . . . . . . . . . . . . . . . 52
Appendix B - Voorhees Transportation Center Reports Referenced in the Text. . . . . . . . . . . . . . . . . . . . . . . . . . . . 53
Appendix C - Survey Instrument. . . . . . . . . . . . . . . . . . . . . . . . . . . . . . . . . . . . . . . . . . . . . . . . . . . . . . . . . . . . . . . . 54

TABLESTable 1: Profession of Survey Respondents. . . . . . . . . . . . . . . . . . . . . . . . . . . . . . . . . . . . . . . . . . . . . . . . . . . . . . . . . . . . . . . . . . . . . . . . 12
Table 2: Population and Employment. . . . . . . . . . . . . . . . . . . . . . . . . . . . . . . . . . . . . . . . . . . . . . . . . . . . . . . . . . . . . . . . . . . . . . . . . . . . 15
Table 3: Share of Bicycle Commuters by Gender. . . . . . . . . . . . . . . . . . . . . . . . . . . . . . . . . . . . . . . . . . . . . . . . . . . . . . . . . . . . . . . . . . . 19
Table 4: Number of Bicycle Commuters Compared to the Results of VTC 2013 Study. . . . . . . . . . . . . . . . . . . . . . . . . . . . . . . . . 20
Table 5: Safe Routes to School Recognition Program Award Winners in 2013 and 2014 . . . . . . . . . . . . . . . . . . . . . . . . . . . . . . 23
Table 6: Municipalities Involved with Three Safe Routes to School Programs in 2013 and 2014. . . . . . . . . . . . . . . . . . . . . . . . . 23
Table 7: Spending on Bicycle Infrastructure in 2013. . . . . . . . . . . . . . . . . . . . . . . . . . . . . . . . . . . . . . . . . . . . . . . . . . . . . . . . . . . . . . . . 25
Table 8: Spending on Bicycle Education in 2013. . . . . . . . . . . . . . . . . . . . . . . . . . . . . . . . . . . . . . . . . . . . . . . . . . . . . . . . . . . . . . . . . . . 25
Table 9: Municipalities with the Most Bicycle Route Infrastructure Mileage by Type. . . . . . . . . . . . . . . . . . . . . . . . . . . . . . . . . . . 30
Table 10: Percent of and Total Number of Municipalities by Infrastructure Type . . . . . . . . . . . . . . . . . . . . . . . . . . . . . . . . . . . . . 31
Table 11: Percentage of Road Mileage with On-Street Bicycle Lanes. . . . . . . . . . . . . . . . . . . . . . . . . . . . . . . . . . . . . . . . . . . . . . . . . 35
Table 12: Municipalities that Require Bicycle Parking in New Developments. . . . . . . . . . . . . . . . . . . . . . . . . . . . . . . . . . . . . . . . . . 43
Table 13: Municipalities that Prohibit Adults from Riding on Sidewalks. . . . . . . . . . . . . . . . . . . . . . . . . . . . . . . . . . . . . . . . . . . . . . 44
Table 14: Fatalities and Injuries to Bicyclists, 2009-2013. . . . . . . . . . . . . . . . . . . . . . . . . . . . . . . . . . . . . . . . . . . . . . . . . . . . . . . . . . . . 48
Table 15: Reasons for Investing in Bicycling. . . . . . . . . . . . . . . . . . . . . . . . . . . . . . . . . . . . . . . . . . . . . . . . . . . . . . . . . . . . . . . . . . . . . . . 52
FIGURESFigure 1: Delaware and Raritan Canal Trail. . . . . . . . . . . . . . . . . . . . . . . . . . . . . . . . . . . . . . . . . . . . . . . . . . . . . . . . . . . . . 8
Figure 2: Hoboken Bicycle Corral . . . . . . . . . . . . . . . . . . . . . . . . . . . . . . . . . . . . . . . . . . . . . . . . . . . . . . . . . . . . . . . . . . . 9
Figure 3: Municipalities Selected for This Study . . . . . . . . . . . . . . . . . . . . . . . . . . . . . . . . . . . . . . . . . . . . . . . . . . . . . . . 10
Figure 4: Safe Routes to School Event . . . . . . . . . . . . . . . . . . . . . . . . . . . . . . . . . . . . . . . . . . . . . . . . . . . . . . . . . . . . . . 13
Figure 5: Bicyclist and Toddler . . . . . . . . . . . . . . . . . . . . . . . . . . . . . . . . . . . . . . . . . . . . . . . . . . . . . . . . . . . . . . . . . . . 14
Figure 6: Population Distribution by Age Group . . . . . . . . . . . . . . . . . . . . . . . . . . . . . . . . . . . . . . . . . . . . . . . . . . . . . . 16
Figure 7: Bicyclist in the Winter. . . . . . . . . . . . . . . . . . . . . . . . . . . . . . . . . . . . . . . . . . . . . . . . . . . . . . . . . . 17
Figure 8: Nassau Street in Princeton . . . . . . . . . . . . . . . . . . . . . . . . . . . . . . . . . . . . . . . . . . . . . . . . . . . . . . 18
Figure 9: Princeton University Bicycle Parking . . . . . . . . . . . . . . . . . . . . . . . . . . . . . . . . . . . . . . . . . . . . . . . . 18
Figure 10: Zagster Bicycle Share Program . . . . . . . . . . . . . . . . . . . . . . . . . . . . . . . . . . . . . . . . . . . . . . . . . . . 18
Figure 11: Commuting Bicycle Mode Share by Municipality . . . . . . . . . . . . . . . . . . . . . . . . . . . . . . . . . . . . . . . 21
Figure 12: Bicyclists at the New Brunswick Ciclovia. . . . . . . . . . . . . . . . . . . . . . . . . . . . . . . . . . . . . . . . . . 22
Figure 13: Responses to Education and Advocacy Questions. . . . . . . . . . . . . . . . . . . . . . . . . . . . . . . . . . . . . . . . . . 22
Figure 14: Montclair Complete Street. . . . . . . . . . . . . . . . . . . . . . . . . . . . . . . . . . . . . . . . . . . . . . . . . . . . . . . . . . . 24
Figure 15: Safe Routes to School Recognition Award . . . . . . . . . . . . . . . . . . . . . . . . . . . . . . . . . . . . . . . . . 24
Figure 16: Bicycle Parking Depot . . . . . . . . . . . . . . . . . . . . . . . . . . . . . . . . . . . . . . . . . . . . . . . . . . . . . . . . . . . . . . 24
Figure 17: Lafayette School Bicycle Parking . . . . . . . . . . . . . . . . . . . . . . . . . . . . . . . . . . . . . . . . . . . . . . . . . . . 26
Figure 18: Children Riding to School. . . . . . . . . . . . . . . . . . . . . . . . . . . . . . . . . . . . . . . . . . . . . . . . . . . . . . . . . . . . 26
Figure 19: Parking at Businesses . . . . . . . . . . . . . . . . . . . . . . . . . . . . . . . . . . . . . . . . . . . . . . . . . . . . . . . . . . . . . . 26
Figure 20: Number of Staff Devoted to Bicycle Planning in Each Municipality. . . . . . . . . . . . . . . . . . . . . . . . . . . . . . . 27

6
Figure 21: Suburban Bicycle Lane . . . . . . . . . . . . . . . . . . . . . . . . . . . . . . . . . . . . . . . . . . . . . . . . . . . . . . . . . . . . . 28
Figure 22: Bicycling Classes . . . . . . . . . . . . . . . . . . . . . . . . . . . . . . . . . . . . . . . . . . . . . . . . . . . . . . . . . . . . . . . . . . . . 28
Figure 23: Princeton Junction Bicycle Parking. . . . . . . . . . . . . . . . . . . . . . . . . . . . . . . . . . . . . . . . . . . . . . . . . . . . . . 28
Figure 24: Full-Time Equivalent Staff Devoted to Bicycle Planning in Each Municipality. . . . . . . . . . . . . . . . . . . . . . . . . . 29
Figure 25: Green Bicycle Lane. . . . . . . . . . . . . . . . . . . . . . . . . . . . . . . . . . . . . . . . . . . . . . . . . . . . . . . . . . . . . . . . . . . . 32
Figure 26: Newark’s Sharrows . . . . . . . . . . . . . . . . . . . . . . . . . . . . . . . . . . . . . . . . . . . . . . . . . . . . . . . . . . . . . . . . . . . . 32
Figure 27: Newark’s Waterfront Park . . . . . . . . . . . . . . . . . . . . . . . . . . . . . . . . . . . . . . . . . . . . . . . . . . . . . . . . . . . . . . . 32
Figure 28: Total Bicycle Route Infrastructure Mileage . . . . . . . . . . . . . . . . . . . . . . . . . . . . . . . . . . . . . . . . . . . . . . . . . . 33
Figure 29: Hoboken Bicycle Racks . . . . . . . . . . . . . . . . . . . . . . . . . . . . . . . . . . . . . . . . . . . . . . . . . . . . . . . . . . . . . . . . . 34
Figure 30: Hoboken Bicycle Path . . . . . . . . . . . . . . . . . . . . . . . . . . . . . . . . . . . . . . . . . . . . . . . . . . . . . . . . . . . . . . . . . . 34
Figure 31: Hoboken’s Sharrows . . . . . . . . . . . . . . . . . . . . . . . . . . . . . . . . . . . . . . . . . . . . . . . . . . . . . . . . . . . . . . . . . . . 34
Figure 32: Edinburg Road, in West Windsor . . . . . . . . . . . . . . . . . . . . . . . . . . . . . . . . . . . . . . . . . . . . . . . . . . . . . . . . . 35
Figure 33: Jersey City’s Green-Painted Bicycle Lane. . . . . . . . . . . . . . . . . . . . . . . . . . . . . . . . . . . . . . . . . . . . . . . . . . . . . 36
Figure 34: Jersey City’s Main Street Bicycle Lane. . . . . . . . . . . . . . . . . . . . . . . . . . . . . . . . . . . . . . . . . . . . . . . . . . . . . . . 36
Figure 35: Jersey City Bicycle Lane . . . . . . . . . . . . . . . . . . . . . . . . . . . . . . . . . . . . . . . . . . . . . . . . . . . . . . . . . . . . . . . . . 36
Figure 36: How Does Your City Ensure That Those Responsible for the Design and Maintenance of City-Owned Roads are
Familiar with the Latest Design Standards for Accommodating Bicyclists?. . . . . . . . . . . . . . . . . . . . . . . . . . . . . . . . 37
Figure 37: Which Programs Does Your City Have to Remove Obstructions from Traffic Lanes and Bicycle Facilities?. . . . . 37
Figure 38: Ocean City’s Bicycle Boulevard . . . . . . . . . . . . . . . . . . . . . . . . . . . . . . . . . . . . . . . . . . . . . . . . . . . . . . 38
Figure 39: Ocean City’s HAWK Signal. . . . . . . . . . . . . . . . . . . . . . . . . . . . . . . . . . . . . . . . . . . . . . . . . . . . . . . . 38
Figure 40: Ocean City Cycle Track . . . . . . . . . . . . . . . . . . . . . . . . . . . . . . . . . . . . . . . . . . . . . . . . . 38
Figure 41: What Infrastructure Does Your City Have to Accommodate Bicyclists at Intersections? . . . . . . . . . . . . . . . . 39
Figure 42: Number of Municipalities that have Different Types of Bicycle Racks. . . . . . . . . . . . . . . . . . . . . . . . . . . . . 40
Figure 43: Types of Bicycle Racks. . . . . . . . . . . . . . . . . . . . . . . . . . . . . . . . . . . . . . . . . . . . . . . . . . . . . . . . . . 40
Figure 44: What Proportions of the Following Have Bicycle Racks in Your City?. . . . . . . . . . . . . . . . . . . . . . . . . . . . . . . 41
Figure 45: New Brunswick Ciclovia. . . . . . . . . . . . . . . . . . . . . . . . . . . . . . . . . . . . . . . . . . . . . . . . . . . . . . . . . . . . 42
Figure 46: Bicycle Corral. . . . . . . . . . . . . . . . . . . . . . . . . . . . . . . . . . . . . . . . . . . . . . . . . . . . . . . . . . . . . . . . . 42
Figure 47: New Brunswick Sharrow. . . . . . . . . . . . . . . . . . . . . . . . . . . . . . . . . . . . . . . . . . . . . . . . . . . . . . . . . 42
Figure 48: Belmar Beach Cruisers. . . . . . . . . . . . . . . . . . . . . . . . . . . . . . . . . . . . . . . . . . . . . . . . . . . . . . . . . . . 46
Figure 49: Boardwalk Bicycle Parking . . . . . . . . . . . . . . . . . . . . . . . . . . . . . . . . . . . . . . . . . . . . . . . . . . . . . . . 46
Figure 50: Event Bicycle Parking. . . . . . . . . . . . . . . . . . . . . . . . . . . . . . . . . . . . . . . . . . . . . . . . . . . . . . . . . . . 46
Figure 51: Percent of Police Trained to Use Bicycles on Patrol . . . . . . . . . . . . . . . . . . . . . . . . . . . . . . . . . . . . . . . 47
Figure 52: Bicyclists in Collingswood . . . . . . . . . . . . . . . . . . . . . . . . . . . . . . . . . . . . . . . . . . . . . . . . . . . . . . 50

7
In 2014, the Alan M. Voorhees Transportation Center (VTC) undertook a study to benchmark the state of local bicycling investment in New Jersey municipalities for the years 2013-2014. The New Jersey Bicycling Benchmarking Report reviews the state of bicycle infrastructure, policies, programs, and safety in New Jersey. It relies primarily on 2013 and 2014 data provided by select municipalities through an extensive survey; secondary data from online resources was also used.
The purpose of this report is to provide a comprehensive summary of the bicycle environment at the municipal level and to provide a baseline for follow-up reports to show how municipal support for bicycling changes over time. An additional goal is to identify and highlight municipalities that are exemplary in their investment in a safe and convenient bicycling environment, and to encourage other municipalities to follow their lead.
The report is modeled after the Bicycling and Walking in the United States: 2014 Benchmarking Report by the Alliance for Biking and Walking, but focuses only on New Jersey to be more informative for local municipalities. It also draws from other state-based reports such as WalkTexas, BikeTexas 2012 Benchmark Study.
As this is the first time a bicycle benchmarking report has been completed in New Jersey, significant effort was put into collecting local bicycling information that was previously not easily accessible outside of municipal governments. To acquire this information, VTC conducted a detailed survey of 60 municipalities to understand their efforts to promote bicycling at the local level. Of the 60 municipalities surveyed, 54 provided responses, for a response rate of 90 percent. Aside from the survey, additional historical data from public online sources and previous VTC studies was complied. This data included crash data, commute mode data, demographic data, and other measures that provide insight into bicycling in the state.
This report focuses on six facets of bicycle planning, programming, and policy. Infrastructure – which includes safe bicycling facilities, bicycle parking, and maintenance – facilitates bicycling. Policy includes local ordinances and initiatives that can help – or hinder – the use of bicycles in municipalities. Funding and staffing shows a municipality’s commitment to improving the local bicycle environment. Education and advocacy helps to improve safe bicycling habits by children and adults, while safety shows how these efforts translate into real-world benefits. A summary of the findings follow; a more detailed discussion can be found in the Survey Results chapter.
Education and AdvocacyMost of the municipalities surveyed do not offer bicycle education or other municipal bicycling programs for residents. Only four offer bicycle education to adults, and four were involved in the 2013 Safe Routes to School Bike to School Day. Nor do many offer incentives to government employees for bicycling for commuting or other work trips: just one municipality provides reimbursement to employees who use bicycles rather than vehicles for work trips, and eight have participated in bike to work events. On the advocacy side, nine respondents have hosted, or plan to host, a Ciclovia or a similar “open streets” initiative to promote physical activity.
Funding and StaffingMost municipalities did not spend money on bicycling in 2013, with only fourteen reporting any spending on bicycle infrastructure and seven on bicycle education. Thirty municipalities did report employing at least one staff member to work on bicycle planning and other bicycle-related activi-ties, with the average municipality having two staff members that do so.
InfrastructureMunicipalities vary in the type and amount of bicycling infra-structure that they have. Municipalities were asked about their bicycle route infrastructure, types and locations of bicycle racks, and the use of other infrastructure, such as advanced stop lines and bicycle signal heads. A total of 184.2 miles of bicycle infrastructure exists among the municipalities surveyed. The survey also found that the most innovative types of bicycle infrastructure, such as green painted bicycle lanes and bicycle traffic signals are rare in New Jersey. Many municipalities have no bicycle infrastructure at all aside from bicycle racks, and six reported having no bicycle racks.
PolicyMunicipalities were asked about a range of policy topics, including the availability of bicycle maps, consideration of bicycles in master plans, local laws, bicycle share systems, and Complete Streets policies. Twenty-nine municipalities have a Complete Streets policy, while 32 municipalities have a bicycle element in their master plan. Only three municipalities stated that they actively enforce laws against illegal parking in bicycle lanes.
INTRODUCTION

8
SafetyData show that fatalities and injuries suffered by bicyclists involved in automobile crashes are decreasing. The shore towns that were surveyed, which have some of the highest rates of bicycling, have among the fewest numbers of bicycle-automobile collisions despite their high bicycle mode share, and also tend to have more police officers trained to patrol on bicycles.
Notable CommunitiesThis report also highlights ten municipalities that stand out for their exemplary bicycle planning, policy, and programming efforts. They represent a diversity of locales – urban, suburban, shore towns – that similarly situated municipalities can look to as examples in their own bicycle planning efforts. While there are always opportunities for improvement, these locales strive for excellence in making their communities welcoming to bicyclists. These notable communities are presented in sidebars throughout the report. They have been placed in sections that reflect their strength, and their order does not constitute as a ranking.
The remainder of the report is divided into seven chapters. The Introduction summarizes the results of report and is followed by the Background chapter, which discusses past reports that were drawn upon in the creation of the method-ology and the report as a whole. The Methodology chapter discusses the selection method for the municipalities included in the survey, the creation of the survey, and the process of collecting survey responses. The Demographics chapter includes pertinent demographic information about the communities involved in the survey, such as commuting mode share by bicycle, population, and employment statis-tics. The Survey Results chapter presents an analysis of the survey responses. The Discussion chapter follows, providing a summary look at the survey results as a whole, and what it reveals about the state of bicycling in New Jersey. Finally, the report wraps up with the Conclusion chapter, which summa-rizes the major finding of the survey and provides recom-mendations for future reporting on bicycling in New Jersey.
The popular Delaware and Raritan Canal Trail allows for 77 miles of scenic riding from New Brunswick to Trenton.
Figure 1: Delaware and Raritan Canal Trail

9
The objectives of this report are multi-fold. First, the objective is to develop a methodology for collecting bicycling data from municipal governments in New Jersey that will inform future data collection efforts. Second, the objective is to establish an initial standard against which future bicycling data can be compared. The third objective is to capture a wide range of components that contribute to a supportive bicycling environment that had not in the past been readily available in one place. Fourth, the objective is to collect and present this data in a way that is useful for municipalities, state agencies, advocacy groups, and counties alike to see where strengths and opportunities for growth exist. The final objective is to present these data in a way that will permit measurement and evaluation in future iterations of this report on the state of bicycling in New Jersey municipalities.
This report draws upon previous, similar studies conducted in other states and nationally. Of particular importance was the Bicycling and Walking in the United States: 2014 Benchmarking Report conducted by the Alliance for Bike & Walking and the BikeTexas 2012 Benchmark Study.
The project team examined the types of questions used in these reports to develop a questionnaire that would reflect the unique characteristics of New Jersey municipalities and needs of New Jersey bicyclists. The resulting survey became the basis upon which this report was founded.
Further municipal-level data was gathered from numerous online resources, including Plan4Safety (New Jersey’s crash database), the American Community Survey, the United States Census, and municipal websites. The project team also included data previously gathered by the Alan M. Voorhees Transportation Center for use in other reports (see appendix B). This information not only provides context for the surveyed municipalities, but also supplies information that was not included on the survey, including demographic data, mode share data, and data on bicycling to work.
BACKGROUND
Figure 2: Hoboken Bicycle Corral
The first on-street bicycle corral in Hoboken was installed at the corner of Hudson Street and Hudson Place. Picture source: City of Hoboken

10
Figure 3: Municipalities Selected for This Study

11
To establish a benchmark for bicycling in New Jersey, the Alan M. Voorhees Transportation Center (VTC) developed a survey to gather information about numerous bicycling characteristics of select municipalities. These characteristics fell into one of six categories: education and advocacy programs, funding, infrastructure, policy, staffing, and safety. Because of the unwieldy nature of surveying all of New Jersey’s 564 municipalities, a sample of 60 municipalities was selected based on five criteria. The municipalities to which the survey was sent is shown in Figure 3.
Selection criteria were as follows:
1. The largest municipality by population in each county (21 municipalities); 2. Largest municipalities by population not included in the first criteria (16); 3. Additional municipalities designated as a “Bicycle Friendly Community” by the League of American Bicyclists (4); 4. Municipalities with the highest bicycle mode shares (8); and 5. Municipalities with the highest levels of bicycle-transit commuters (10).
The project team first selected the municipality with the largest residential population in each of the 21 counties in New Jersey:
Second, the largest municipalities by residential population not included in the first criteria were chosen:
Third, five municipalities that were not already selected and that the League of American Bicyclists have designated as “Bicycle Friendly Communities” were added:
METHODOLOGY
Camden / Camden CountyEdison / Middlesex CountyEgg Harbor Township / Atlantic CountyElizabeth / Union CountyEvesham / Burlington CountyFranklin Township / Somerset CountyHackensack / Bergen CountyHamilton / Mercer CountyJersey City / Hudson CountyLower Township / Cape May CountyMiddletown / Monmouth County
Newark / Essex CountyParsippany-Troy Hills / Morris CountyPaterson / Passaic CountyPennsville / Salem CountyPhillipsburg / Warren CountyRaritan Township / Hunterdon CountyToms River / Ocean CountyVernon / Sussex CountyVineland / Cumberland CountyWashington Township / Gloucester County
Bayonne / Hudson CountyBrick / Ocean CountyCherry Hill / Camden CountyClifton / Passaic CountyEast Orange / Essex CountyGloucester Township / Camden CountyLakewood / Ocean CountyNew Brunswick / Middlesex County
North Bergen / Hudson CountyOld Bridge / Middlesex CountyPassaic / Passaic CountyPiscataway / Middlesex CountyTrenton / Mercer CountyUnion City / Hudson CountyUnion Township / Union CountyWoodbridge / Middlesex County
Hoboken / Hudson CountyMontclair / Essex CountyOcean City / Cape May County
Princeton / Mercer CountyWest Windsor / Mercer County

12
To determine the survey questions, the research team looked at those posed in similar projects undertaken elsewhere – namely, the BikeTexas 2012 Benchmark Study and the Bicycling and Walking in the United States: 2014 Benchmarking Report – and chose those most relevant for New Jersey.
For some questions, particularly those concerning demo-graphic data, Complete Streets policies, and Safe Routes to School participation, data was available without the need for input by the municipality. Therefore, in order to make the survey as straightforward as possible to complete, questions were included only if they would be hard, if not impossible to answer without the help of municipal staff. The resulting survey contained forty questions (see Appendix). Images of the object in question were included in those questions that addressed infrastructure improvements to ensure consistency of answers. Paper and online versions of the survey were created to give each municipality a choice in how to submit their responses.
To distribute the survey, municipal clerks in the chosen mu-nicipalities were first telephoned and asked to provide an initial point of contact. Trained graduate students then called each contact to confirm that the contact was the best person available to answer the questions in the survey. Letters were then mailed to those contacts notifying them that they would be approached to complete the questionnaire within two weeks. Each contact was given the option of completing the survey either online, on paper, or through a guided phone call. The majority elected to use the online questionnaire. In total, 54 of the 60 municipalities completed the survey for a response rate of 90 percent.
The survey asked respondents to provide their names and job positions. Municipalities could list up to three people who contributed to the responses. Table 1 shows that the majority of those involved in the survey worked as either planners or engineers, with local police departments often contributing as well.
Fourth, eight municipalities with the highest bicycle mode share for the commute journey (based on data from the 2008-2012 American Community Survey [ACS]) were chosen. Due to the year-round nature of the ACS, these communities tended to be towns located along the Jersey Shore. Many of these communities have low populations that increase substantially during the summer months.
Finally, the ten municipalities that have the highest levels of bicycle-transit commuters were selected. An earlier VTC study (Bicycling to Rail Stations in NJ: 2013 Benchmarking Report) analyzed commute patterns at NJ TRANSIT rail stations throughout the state. Using that data, the research team selected the final ten municipalities for the study:
Allenhurst / Monmouth CountyAvon-by-the-Sea / Monmouth CountyBelmar / Monmouth CountyBradley Beach / Monmouth County
Seaside Heights / Ocean CountyWest Cape May / Cape May CountyWildwood / Cape May CountyWildwood Crest / Cape May County
Chatham Borough / Morris CountyCollingswood / Camden CountyCranford / Union CountyGlen Ridge / Essex CountyMaplewood / Essex County
Metuchen / Middlesex CountyMorristown / Morris CountyRed Bank / Monmouth CountySummit / Union CountyWestfield / Union County
Profession Engineer
PlannerPoliceOther
AdministrationElected Official
Public Works
Number of Respondents
1716
157
622
Table 1: Profession of Survey Respondents

13
A demonstration bicycle lane created for a Safe Routes to School event in Montclair.
Figure 4: Safe Routes to School Event

14
Population and EmploymentPrior to administering the survey, demographic data were collected for each of the 60 municipalities to be surveyed. Data were gathered on the population, age, bicycling mode share, and pedestrian and bicycle safety statistics for each municipality. (Bicycle safety statistics can be found in the Survey Results chapter.) Demographic data were obtained from the United States 2010 Decennial Census, the United States Census 2009-2013 American Community Survey 5-Year Estimates, and the 2011 Longitudinal Employer-Household Dynamics Origin-Destination Employment Statistics (all sources use the most recent data available).
Table 2 (see next page) lists the population and employment numbers for each of the 60 municipalities surveyed. The total population of the sixty municipalities is 3,156,237, which represents about 36 percent of the state’s total population. Persons employed within the 60 municipalities, an important factor that helps determine the need for bicycle route infra-structure, constituted a total workforce of 1,297,623, about 38 percent of the total number of people working within New Jersey. Data are also available for the number of jobs located locally or outside the municipality. The more local jobs that are available (as a percentage of total jobs), the greater the capacity of workers to bicycle to transit is likely to be. West Cape May has the highest percentage of residents who work locally at 50.0 percent, followed by Vernon (47.5%),
DEMOGRAPHICS
A man seen bicycling with his toddler in New Brunswick.
Figure 5: Bicyclist and Toddler
Lower Township (45.9%), Bayonne (39.0%), and Vineland (31.0%). The data suggest that these, and other municipalities that score highly, may have an unmet capacity to provide commuters with bicycling facilities; only West Cape May and Lower Township have bicycle commuting mode shares in the top ten municipalities.
Figure 6 (see page 16) shows the age distribution of the pop-ulation in each municipality (the municipalities are sorted in decreasing order by the share of the population that is under 18). Several communities stand out in that they have large shares of children (under 18) or adults over 65. In Lakewood, 42 percent of the population is under 18 years old. At the other end of the spectrum, almost 30 percent of the residents of Ocean City and West Cape May Borough are over 65 years old. Municipalities with a large share of children or a large share of older adults each have specific travel needs. For mu-nicipalities with a large number of children, planners may want to pay particular attention to the safety of bicycle infrastruc-ture near schools and develop education programs for both drivers and school age children. For populations that skew older, planners should ensure that bicycling environments are safe for older people who may bicycle less frequently, more slowly, and be less aware of their surroundings. In addition, planners should ensure that mobility programs are in place for older adults who no longer drive.

15
Source: 2010 United States Census, Table DP-1; 2011 Longitudinal Employer-Household Dynamics Origin-Destination Employment Statistics
Municipality County Population Local Jobs Percent Residents Working Locally
West Cape May Cape May 1,024 24 50.0%Vernon Sussex 23,943 3,181 47.5%Lower Township Cape May 22,866 3,948 45.9%Bayonne Hudson 63,024 13,717 39.0%Vineland Cumberland 60,724 25,507 31.0%Paterson Passaic 146,199 34,105 29.0%Toms River Ocean 91,239 34,942 27.8%Pennsville Salem 13,409 3,331 26.3%Lakewood Ocean 92,843 25,916 25.3%Brick Ocean 75,072 19,279 25.0%Union City Hudson 66,455 10,502 24.5%Hamilton Mercer 88,464 32,460 24.9%Ocean City Cape May 11,701 4,068 23.1%Wildwood Crest Cape May 3,270 379 22.2%Egg Harbor Township Atlantic 43,323 11,454 21.0%Elizabeth Union 124,969 46,031 20.9%Middletown Monmouth 66,522 17,578 20.8%Old Bridge Middlesex 65,375 10,255 20.8%Jersey City Hudson 247,597 102,358 20.6%Washington Township Gloucester 48,559 14,004 19.7%Gloucester Township Camden 64,634 14,825 19.8%Phillipsburg Warren 14,950 4,181 19.0%Passaic Passaic 69,781 13,377 17.7%Newark Essex 277,140 134,699 17.4%East Orange Essex 64,270 12,007 15.9%North Bergen Hudson 60,773 17,016 14.3%Raritan Township Hunterdon 22,185 5,907 14.3%Camden Camden 77,344 30,309 14.1%Clifton Passaic 84,136 29,133 14.1%Trenton Mercer 84,913 36,384 14.1%Wildwood Cape May 5,325 2,093 13.7%Westfield Union 30,316 8,732 13.8%Hoboken Hudson 50,005 17,365 13.4%Evesham Burlington 45,538 21,686 12.9%Bradley Beach Monmouth 4,298 528 12.7%Woodbridge Middlesex 99,585 47,517 12.7%Avon-by-the-Sea Monmouth 1,901 278 12.6%Edison Middlesex 99,967 65,892 12.3%Belmar Monmouth 5,794 930 12.2%Franklin Township Somerset 62,300 28,959 10.9%Glen Ridge Essex 7,527 1,043 10.5%Metuchen Middlesex 13,574 5,433 10.4%Cherry Hill Camden 71,045 47,172 10.0%Collingswood Camden 13,926 4,396 9.7%Maplewood Essex 23,867 5,786 9.5%Seaside Heights Ocean 2,887 935 9.3%Montclair Essex 37,669 18,975 9.0%Cranford Union 22,625 11,679 8.4%Union Township Union 56,642 28,342 8.4%Parsippany-Troy Hills Morris 53,238 47,310 8.1%Princeton Mercer 12,307 24,928 7.4%Hackensack Bergen 43,010 40,189 7.2%Piscataway Middlesex 56,044 35,598 7.1%Summit Union 21,457 16,386 6.3%New Brunswick Middlesex 55,181 40,193 5.9%Red Bank Monmouth 12,206 10,732 5.6%Chatham Borough Morris 8,962 3,987 5.3%Morristown Morris 18,411 24,035 5.3%West Windsor Mercer 27,165 25,919 5.2%Allenhurst Monmouth 496 376 0.3%
Table 2: Population and Employment

16
Figure 6: Population Distribution by Age Group
LakewoodGlen Ridge
PassaicCamden
WestfieldSummit
Chatham BoroughWest Windsor
MaplewoodPaterson
Egg Harbor TownshipRaritan Township
PhillipsburgEast Orange
ElizabethNewark
MontclairTrenton
VinelandMiddletown
VernonGloucester Township
CranfordMetuchen
Washington TownshipUnion City
EveshamCherry HillOld Bridge
EdisonBayonne
Franklin TownshipClifton
PennsvilleWoodbridge
North BergenToms River
HamiltonJersey City
Union TownshipNew Brunswick
Parsippany-Troy HillsBrick
WildwoodRed Bank
PiscatawayLower TownshipSeaside Heights
CollingswoodHackensackMorristown
BelmarAvon-By-The-Sea
Wildwood CrestAllenhurst
Bradley BeachOcean City
West Cape MayHobokenPrinceton
Source: US 2010 Decennial Census, Table DP-1
0% 10% 20% 30% 40% 50% 60% 70% 80% 90% 100%
0-17 Years Old 18-64 Years Old 65 Years and Older
17
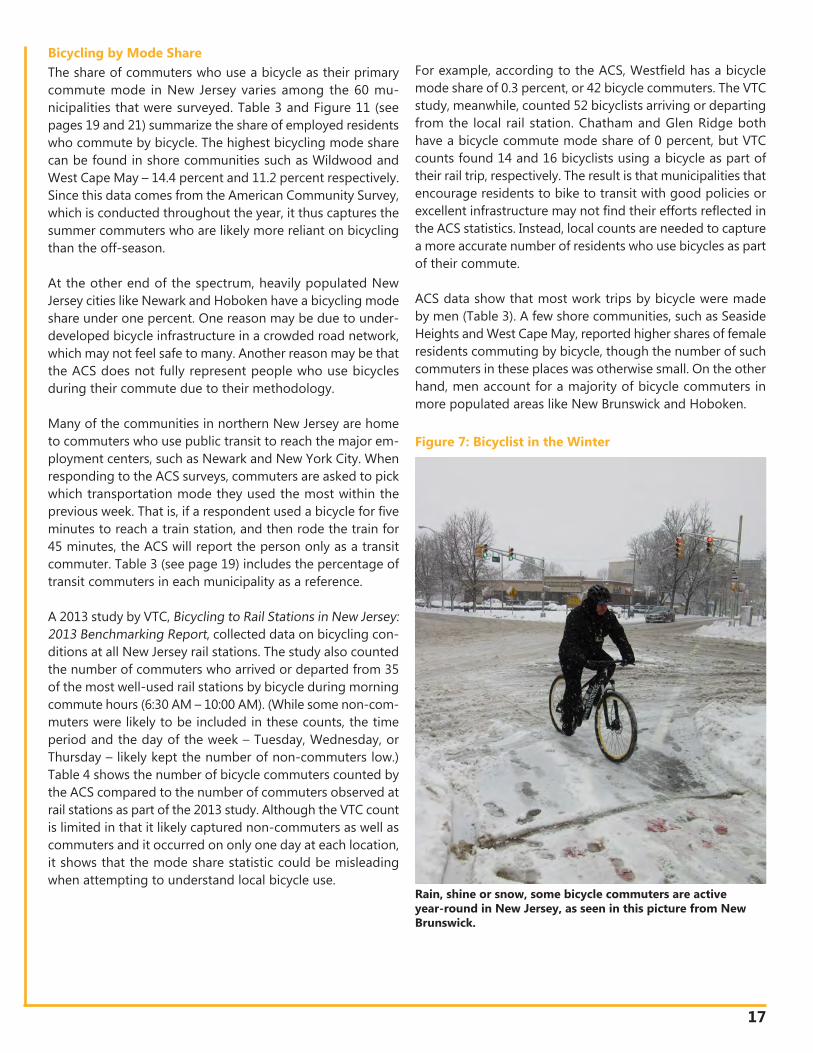
Bicycling by Mode ShareThe share of commuters who use a bicycle as their primary commute mode in New Jersey varies among the 60 mu-nicipalities that were surveyed. Table 3 and Figure 11 (see pages 19 and 21) summarize the share of employed residents who commute by bicycle. The highest bicycling mode share can be found in shore communities such as Wildwood and West Cape May – 14.4 percent and 11.2 percent respectively. Since this data comes from the American Community Survey, which is conducted throughout the year, it thus captures the summer commuters who are likely more reliant on bicycling than the off-season.
At the other end of the spectrum, heavily populated New Jersey cities like Newark and Hoboken have a bicycling mode share under one percent. One reason may be due to under-developed bicycle infrastructure in a crowded road network, which may not feel safe to many. Another reason may be that the ACS does not fully represent people who use bicycles during their commute due to their methodology.
Many of the communities in northern New Jersey are home to commuters who use public transit to reach the major em-ployment centers, such as Newark and New York City. When responding to the ACS surveys, commuters are asked to pick which transportation mode they used the most within the previous week. That is, if a respondent used a bicycle for five minutes to reach a train station, and then rode the train for 45 minutes, the ACS will report the person only as a transit commuter. Table 3 (see page 19) includes the percentage of transit commuters in each municipality as a reference.
A 2013 study by VTC, Bicycling to Rail Stations in New Jersey: 2013 Benchmarking Report, collected data on bicycling con-ditions at all New Jersey rail stations. The study also counted the number of commuters who arrived or departed from 35 of the most well-used rail stations by bicycle during morning commute hours (6:30 AM – 10:00 AM). (While some non-com-muters were likely to be included in these counts, the time period and the day of the week – Tuesday, Wednesday, or Thursday – likely kept the number of non-commuters low.) Table 4 shows the number of bicycle commuters counted by the ACS compared to the number of commuters observed at rail stations as part of the 2013 study. Although the VTC count is limited in that it likely captured non-commuters as well as commuters and it occurred on only one day at each location, it shows that the mode share statistic could be misleading when attempting to understand local bicycle use.
For example, according to the ACS, Westfield has a bicycle mode share of 0.3 percent, or 42 bicycle commuters. The VTC study, meanwhile, counted 52 bicyclists arriving or departing from the local rail station. Chatham and Glen Ridge both have a bicycle commute mode share of 0 percent, but VTC counts found 14 and 16 bicyclists using a bicycle as part of their rail trip, respectively. The result is that municipalities that encourage residents to bike to transit with good policies or excellent infrastructure may not find their efforts reflected in the ACS statistics. Instead, local counts are needed to capture a more accurate number of residents who use bicycles as part of their commute.
ACS data show that most work trips by bicycle were made by men (Table 3). A few shore communities, such as Seaside Heights and West Cape May, reported higher shares of female residents commuting by bicycle, though the number of such commuters in these places was otherwise small. On the other hand, men account for a majority of bicycle commuters in more populated areas like New Brunswick and Hoboken.
Figure 7: Bicyclist in the Winter
Rain, shine or snow, some bicycle commuters are active year-round in New Jersey, as seen in this picture from New Brunswick.

18
NOTABLE COMMUNITY
Princeton has the highest bicycle commuter mode share for any non-shore municipality in this survey. They also reported the second most mileage of off-road trails, with 32 miles. Along with Princeton University, the municipality has launched a pilot bicycle share program at their local train station. Princeton is recognized by the League of American Bicyclists as a Bicycle Friendly Community, and Princeton University as a Bicycle Friendly University (both Bronze). Princeton has a Complete Streets policy, and is located in Mercer County, which also has one in place, and is the only county where every municipality has a Complete Streets policy.
A pilot bicycle share program, Zagster, is available at the Prince-ton train station. Membership is $20 and allows for free use of the bicycles for two hours, or for a fee beyond that time. Picture source: zagster.com
Princeton has added 5.2 miles of sharrow marking on their streets, including Nassau Street, which separates Princeton University from a popular commercial stretch of the downtown area.
Figure 8: Nassau Street in Princeton Figure 9: Princeton University Bicycle Parking
Figure 10: Zagster Bicycle Share Program
Bicycle parking is plentiful inside Princeton University’s scenic campus, with over 3,600 spaces available. The university has a variety of paths open to bicyclists within the campus, allowing for safe, low-stress riding for students and staff. Picture source: princeton.edu

19
Table 3: Share of Bicycle Commuters by Gender
Source: American Community Survey 5-Year Estimate, 2009-2013, Table S0801
1 Individuals 16 years or older who worked during the reference week – the percentages are derived from this variable.* 0% may be due to the large margin of error created by the small ACS sample size, rather than zero bicycle commuters
Rank Municipality Workers 16 Years and Older1
Percent of Workers who Commute by Bicycle
Percent of Workers who Commute by Transit
All Men Women All1 Wildwood 2,322 14.4% 17.0% 12.3% 6.1%2 West Cape May 365 11.2% 7.0% 14.9% 1.6%3 Belmar 3,167 9.1% 12.8% 4.5% 4.9%4 Wildwood Crest 1,479 8.2% 13.1% 2.6% 0.9%5 Seaside Heights 978 7.6% 0.0%* 12.9% 14.1%6 Allenhurst 275 7.3% 11.8% 0.0%* 11.3%7 Avon-by-the-Sea 938 5.5% 7.1% 3.5% 3.6%8 Princeton 13,649 4.6% 7.5% 1.6% 10.0%9 Ocean City 5,139 3.6% 3.2% 3.9% 2.7%
10 Lower Township 10,359 1.9% 2.0% 1.8% 1.7%11 Bradley Beach 2,229 1.8% 3.1% 0.0%* 4.3%12 Red Bank 6,337 1.2% 2.1% 0.0%* 11.8%13 Hackensack 21,927 1.1% 1.4% 0.8% 19.9%14 New Brunswick 23,706 1.0% 1.5% 0.3% 10.9%14 Passaic 26,543 1.0% 1.7% 0.0%* 17.2%16 Lakewood 25,360 0.8% 1.0% 0.7% 3.4%16 Trenton 32,898 0.8% 1.3% 0.2% 12.4%18 Collingswood 7,372 0.7% 1.0% 0.4% 13.3%18 Elizabeth 56,326 0.7% 1.1% 0.2% 12.0%18 Hoboken 33084 0.7% 1.1% 0.3% 55.0%18 Morristown 10,828 0.7% 1.2% 0.2% 5.1%18 Toms River 43,088 0.7% 1.2% 0.1% 1.9%23 Summit 9,409 0.6% 0.5% 0.6% 20.9%23 Montclair 18,559 0.5% 0.8% 0.3% 24.3%23 Pennsville 5,933 0.5% 1.0% 0.0%* 1.4%23 West Windsor 12,932 0.5% 0.9% 0.0%* 20.7%27 Camden 23,015 0.4% 0.5% 0.4% 14.5%27 Jersey City 123,940 0.4% 0.6% 0.2% 46.2%27 Union City 31,077 0.4% 0.7% 0.0%* 41.1%30 Evesham 24,559 0.3% 0.1% 0.4% 3.2%30 Hamilton 44,312 0.3% 0.6% 0.0%* 3.5%30 Newark 104,438 0.3% 0.5% 0.1% 26.3%30 Westfield 13,840 0.3% 0.0%* 0.7% 15.4%34 Brick 35,346 0.2% 0.3% 0.1% 2.0%34 Cherry Hill 34,401 0.2% 0.2% 0.1% 6.4%34 Clifton 41,020 0.2% 0.2% 0.0%* 9.6%34 Franklin Township 31,256 0.2% 0.4% 0.0%* 7.1%34 Metuchen 6,768 0.2% 0.3% 0.2% 19.6%34 North Bergen 29,254 0.2% 0.4% 0.1% 31.0%34 Parsippany-Troy Hills 26,928 0.2% 0.2% 0.1% 3.5%34 Washington Township 23,776 0.2% 0.3% 0.1% 2.7%42 Bayonne 29,453 0.1% 0.2% 0.0%* 23.4%42 Cranford 11,526 0.1% 0.2% 0.0%* 11.2%42 East Orange 26,682 0.1% 0.1% 0.1% 23.4%42 Edison 48,827 0.1% 0.2% 0.0%* 13.4%42 Egg Harbor Township 20,803 0.1% 0.1% 0.0%* 2.2%42 Gloucester Township 32,501 0.1% 0.2% 0.0%* 5.8%42 Maplewood 11,651 0.1% 0.1% 0.1% 31.0%42 Middletown 31,248 0.1% 0.2% 0.1% 12.1%42 Old Bridge 32,674 0.1% 0.1% 0.2% 10.6%42 Phillipsburg 6,400 0.1% 0.2% 0.0%* 2.6%42 Piscataway 26,589 0.1% 0.2% 0.0%* 7.4%42 Vineland 25,268 0.1% 0.2% 0.0%* 1.7%42 Woodbridge 47,099 0.1% 0.2% 0.0%* 11.9%55 Chatham Borough 4,116 0.0%* 0.0%* 0.0%* 21.1%55 Glen Ridge 3,591 0.0%* 0.0%* 0.0%* 30.8%55 Paterson 53,857 0.0%* 0.1% 0.0%* 13.1%55 Raritan Township 11,215 0.0%* 0.0%* 0.0%* 3.3%55 Union Township 27,159 0.0%* 0.0%* 0.0%* 9.1%55 Vernon 12,293 0.0%* 0.0%* 0.0%* 1.1%

20
Table 4: Number of Bicycle Commuters Compared to the Results of VTC 2013 Study
Source: American Community Survey 5-Year Estimate, 2009-2013, Table S0801
Rank Municipality ACS Bicycle Commuters VTC Bike to Transit Count
3 Belmar 288 N/A6 Allenhurst 20 N/A8 Princeton 628 45
11 Bradley Beach 40 1412 Red Bank 76 2013 Hackensack 241 N/A14 New Brunswick 237 5114 Passaic 265 N/A16 Trenton 263 2918 Collingswood 52 3618 Elizabeth 394 N/A18 Hoboken 232 N/A18 Morristown 76 1523 Summit 57 3423 Montclair 93 1023 West Windsor 65 4523 Camden 92 N/A27 Jersey City 496 1127 Union City 124 N/A30 Hamilton 133 230 Newark 313 4530 Westfield 42 5234 Cherry Hill 69 N/A34 Clifton 82 N/A34 Metuchen 14 3034 North Bergen 59 N/A34 Parsippany-Troy Hills 54 N/A42 Bayonne 30 N/A42 Cranford 12 3342 East Orange 27 N/A42 Edison 49 N/A42 Egg Harbor Township 21 242 Maplewood 12 2842 Middletown 31 N/A42 Woodbridge 47 1555 Chatham Borough 0 1455 Glen Ridge 0 1655 Paterson 0 N/A55 Union Township 0 N/A

21
Figure 11: Commuting Bicycle Mode Share by Municipality
WildwoodWest Cape May
BelmarWildwood CrestSeaside Heights
AllenhurstAvon-by-the-Sea
PrincetonOcean City
Lower TownshipBradley Beach
Red BankHackensack
New BrunswickPassaic
LakewoodTrenton
CollingswoodElizabethHoboken
MorristownToms River
SummitMontclairPennsville
West WindsorCamden
Jersey CityUnion City
EveshamHamilton
NewarkWestfield
BrickCherry Hill
CliftonFranklin Township
MetuchenNorth Bergen
Parsippany-Troy HillsWashington Township
BayonneCranford
East OrangeEdison
Egg Harbor TownshipMaplewood
MiddletonOld Bridge
PhillipsburgPiscataway
VinelandWoodbridge
Chatham BoroughGlen Ridge
PatersonRaritan TownshipUnion Township
Vernon
14.4%
11.2% 9.1%
8.2%
0% 2% 4% 6% 8% 10% 12% 14% 16%
Source: American Community Survey 5-Year Estimate, 2009-2013, Table S0801
7.6%
7.3% 5.5%
4.6% 3.6%
0.7% 0.7% 0.7% 0.7% 0.7%
0.6% 0.5% 0.5% 0.5%
0.4% 0.4% 0.4% 0.3% 0.3% 0.3% 0.3% 0.2% 0.2% 0.2% 0.2% 0.2% 0.2% 0.2% 0.2% 0.1% 0.1% 0.1% 0.1%
0.1%
0.1%
0.1%
0.1%
0.1%
0.1%
0.1%
0.1%
1.9%
1.8% 1.2%
1.1% 1.0% 1.0% 0.8% 0.8%

22
SURVEY RESULTS
Education and AdvocacyAdult Education and Municipal Employee IncentivesSome of the municipalities that were surveyed offer bicycle education and outreach for adults (Figure 13). Four offer bicycle education courses for adults, while sixteen have held or plan to hold a Ciclovia or similar “open streets” event that promotes bicycling and other physical activi-ties. Nine have, or are planning to create, a bicycle sharing program. A few municipalities also offer their employees bicycling benefits: one offers reimbursement for employees who use bicycles rather than vehicles for work trips and eight municipalities participate in bike to work events. However, none offer incentives specifically to bicycle to work. Finally, none have completed an economic impact study that includes bicycling.
The Voorhees Transportation Center completed a report in 2012 called “The Economic Impacts of Active Transpor-tation in New Jersey” which found that active transporta-tion-related infrastructure, businesses, and events were estimated to have contributed $497.46 million to the New Jersey economy in 2011, supporting over 4,000 jobs. That report can be found on www.njbikeped.org.
Figure 13: Responses to Education and Advocacy Questions
Figure 12: Bicyclists at the New Brunswick Ciclovia
0 10 20 30 40 50 60
Does your city have adult bicycle
education courses?
Does your city participate in Bike-
to-work events?
Has your city hosted, or plans to host, street closure events to promote
bicycling and physical activity?
Has your city performed an economic impact study
that includes bicycling?
Do city employees receive any incentives for bicycling to work?
Does your city offer reimbursement for employees who use bicycles rather than city or personal vehicles for work trips?
YES
NO
Open Streets events, such as the New Brunswick Ciclovia, allow bicyclists of all ages and abilities to hit the road.
4
1
8
16
38
40
33
37
52
51
0
0

23
Table 5: Safe Routes to School Recognition Program Award Winners in 2013 and 2014
Safe Routes to SchoolThe survey found that numerous schools within the municipalities that were surveyed are involved in New Jersey Safe Routes to School (Tables 5 and 6). Nine are recognition program participants, seven have developed a school travel plan, and four have participated in Bike to School Day. Additionally, in 2013 or 2014, a number of schools within participant cities were awarded the Gold, Silver or Bronze level for their efforts to make bicycling to school safe for children.
Montclair has the most number of participant schools, with eleven awarded gold and one awarded silver. All of Brick Township has been awarded gold. Further, eight schools are located in Jersey City (six silver, two bronze), two in Maplewood (bronze), two in Bayonne (silver and bronze), two in Woodbridge (silver and bronze), and one each in the Chatham school district (silver), Union City (bronze), Collingswood (bronze), and Vineland (bronze).
Table 6: Municipalities Involved with Three Safe Routes to School Programs in 2013 and 2014
School City Gold Silver Bronze
Bradford Elementary School Montclair XCharles H. Bullock School Montclair XEdgemont Elementary School Montclair XEdgemont Montessori School Montclair XGlenfield Middle School Montclair XHillside Elementary School Montclair XTownship of Montclair Montclair XMount Hebron Middle School Montclair XNishuane School Montclair XNortheast Elementary School Montclair XWatchung School Montclair XChatham Middle School Chatham District XPS #3 - Robinson School Bayonne XPS #15 - Whitney M. Young, Jr. School Jersey City XPS #17 - Joseph H. Bresinger School Jersey City XPS #25 - Nicholas Copernicus School Jersey City XPS #3 - F.R. Conwell School Jersey City XPS #6 - Jotham Wakeman School Jersey City XPS #8 - Charles E. Trefurt School Jersey City XBradford School Montclair XRoss Street School #1 Woodbridge XMidtown Community School Bayonne XZane North Elementary Collingswood XPS #14 – O. Culbreth Jr. School Jersey City XPS #28 Christa McAuliffe School Jersey City XSeth Boyden Elementary Maplewood XTuscan Middle School Maplewood XColin Powell Elementary Union City XWallace Middle School Vineland XWoodbridge Township Woodbridge X
Recognition Program Participants
School Travel Plan
Bike to School Participants
Bayonne Brick Township Jersey CityBrick Township Camden MiddletownChatham District Chatham Borough MontclairEgg Harbor Township
Egg Harbor Township Vineland
Jersey City MontclairMaplewood NewarkMontclair Raritan TownshipTrentonVineland

24
NOTABLE COMMUNITY
Montclair Township received the Gold award from the 2014 Safe Routes to School Recognition Program, an improvement from the Bronze that it was awarded in 2013. Additionally, 11 of the schools within Montclair received Gold. Montclair is also recognized by the League of American Bicyclists as a Bicycle Friendly Community (Bronze). Montclair was the first municipality in New Jersey to pass a Complete Streets policy, and is located in Essex County which also has a Complete Streets policy, and is host to the highest number of municipal policies (14).
Completed in 2011, the South Park Street Improvement Project brought Complete Streets to one of Montclair’s commercial focus areas. Using a mixture of colorful paving materials, the Township sought to bring visual vibrancy to the street, both to generate interest and slow traffic. The project included sharrows, where cyclists can share the lane with slow-moving traffic.
Figure 14: Montclair Complete Street
Figure 15: Safe Routes to School Recognition Award Figure 16: Bicycle Parking Depot
October 2014 saw the opening of a 24-space bicycle parking depot at the Bay Street train station in Montclair. The depot offers secure parking, lockers, and an air pump for commut-ers transferring to trains. Photo source: NJ Advance Media for NJ.com
Students, faculty, and staff at Montclair’s Mount Hebron Middle School seen receiving a Safe Routes to School recog-nition award.

25
Funding and StaffingThirty-one municipalities reported that at least one staff member worked on bicycle planning, for a total of 98 staff. An average of two staff work at the 54 municipalities that responded. Ocean City has the most number of employees, with between seven and ten employees working on bicycle planning (this, and other recorded ranges of staff members, was coded as the average of the range [i.e., nine in Ocean City] in Figure 20), while six municipalities reported having the second most with five staff members: Camden, Cherry Hill, North Bergen, East Orange, Hoboken, and Vineland.
Because planning staff may be working on a variety of planning issues, municipalities were also asked for the number of “full time equivalent” (FTE) employees working on bicycle planning (Figure 24). Only 16 municipalities responded to this question, totaling 20 FTEs with an average of 0.4. The municipalities with the highest FTEs working on bicycle planning issues were Ocean City (6 FTEs), West Windsor (4), Hoboken (2), Trenton (2), Jersey City (1), Piscataway (1), Cherry Hill (1), and Parsippany-Troy Hills (1). Note that the municipal-ities left blank in both graphs are those municipalities whose responses were recorded as blank, ineligible, or zero.
Fourteen of the 54 respondents reported spending on bicycle infrastructure in 2013 (Table 7). Of those that did spend money, the median amount was $15,000. The munic-ipalities that reported spending the most money on bicycle infrastructure were Newark ($600,000), Elizabeth ($400,000), West Windsor ($350,000), Hoboken ($75,000), and Vineland ($40,000). West Windsor spent the most money per capita at $12.88 per person.
Only six municipalities reported funding bicycle education in 2013 (Table 8). Of these, the median amount spent was $1,000 and the average was $1,429. The municipalities that spent the most on bicycle education were Brick ($5,000), Cranford ($1,000), Maplewood ($1,000), New Brunswick ($1,000), and North Bergen ($1,000).
Table 7: Spending on Bicycle Infrastructure in 2013
Table 8: Spending on Bicycle Education in 2013
Municipality Amount Spent Amount Spent Per Capita
West Windsor $350,000 $12.88Elizabeth $400,000 $3.20Newark $600,000 $2.16Hoboken $75,000 $1.50Vineland $40,000 $0.66New Brunswick $20,000 $0.36Glen Ridge $2,000 $0.27Maplewood $5,000 $0.21Parsippany-Troy Hills $10,000 $0.19Brick $10,000 $0.13Montclair $2,000 $0.05Franklin Township $2,000 $0.03All other municipalities (each) $0 $0.00
Municipality Amount Spent Amount Spent Per Capita(Children under 18)
Belmar $500 $0.51Brick $5,000 $0.32Cranford $1,000 $0.18Maplewood $1,000 $0.15Morristown $500 $0.15New Brunswick $1,000 $0.09All other municipalities (each) $0 $0.00

26
NOTABLE COMMUNITY
Chatham Borough received a Gold award from the Safe Routes to School Recognition Program in 2013. Three Chatham District schools were also awarded Gold, and one received Silver in that same year. The municipality has also worked to ensure that all schools and libraries have bicycle parking. Chatham Borough passed a Complete Streets policy in 2012.
Children seen locking up their bicycles at the Lafayette School in Chatham. Photo Source: TransOptions
Figure 17: Lafayette School Bicycle Parking
Figure 18: Children Riding to School Figure 19: Parking at Businesses
Although Chatham is lacking in bicycle infrastructure, a high quality Safe Routes to School Program allows children to safely bicycle to school. Photo Source: TransOptions
Parked bicycles are a common sight at the Chatham Cinema.Photo Source: TransOptions

27
Figure 20: Number of Staff Devoted to Bicycle Planning in Each Municipality
Ocean CityCamden
Cherry HillEast Orange
HobokenNorth Bergen
VinelandMetuchen
MorristownPiscataway
BelmarCollingswood
ElizabethFranklin Township
Jersey CityMontclair
NewarkParsippany-Troy Hills
PrincetonTrenton
BrickCranford
MaplewoodNew Brunswick
Toms RiverWest Windsor
WoodbridgeAvon-By-The-Sea
EdisonGlen Ridge
HamiltonAllenhurst
BayonneBradley Beach
Chatham BoroughClifton
Gloucester TownshipHackensack
LakewoodLower Township
MiddletownOld Bridge
PatersonPennsville
Raritan TownshipRed Bank
Seaside HeightsSummit
Union CityUnion Township
VernonWashington Township
West Cape MayWildwood Crest
0 1 2 3 4 5 6 7 8 9 10
9
5
5
4
5
5
4
5
5
3
3
3
2 2 2 2 2 2 2
1 1 1 1
3
3
3
3
3
3 3
4

28
NOTABLE COMMUNITY
West Windsor can act as a model of bicycling investment within a suburban context. With a population of just 27,165, it reported spending $12.88 per person on bicycle infrastructure – far more than any other municipality that was surveyed – and has two full-time staff members who work on bicycle planning. The municipality has built almost 16 miles of on-street bicycle facilities, and over 3 miles of off-road trails. West Windsor was recognized by the League of American Bicyclists as a Bicycle Friendly Community (Bronze). West Windsor passed a Complete Streets policy in 2010, and is located in Mercer County, which also has a policy.
West Windsor is a suburban township, but that hasn’t stopped them from deploying an extensive bicycle network, such as on Southfield Road, pictured above.
The West Windsor Bicycle and Pedestrian Alliance has been active since 2006 in working to make the township and the surrounding areas safe for riding. In the picture above, they are seen teaching future bicyclists how to ride safely. Photo Source: West Windsor Bicycle and Pedestrian Alliance
The Princeton Junction train station in West Windsor has hundreds of bicycle parking spaces, including many bicycle lockers available for rent. Photo Source: Jerry Foster
Figure 22: Bicycling Classes
Figure 21: Suburban Bicycle Lane
Figure 23: Princeton Junction Bicycle Parking

29
Figure 24: Full-Time Equivalent Staff Devoted to Bicycle Planning in Each Municipality
Ocean CityWest Windsor
HobokenTrenton
Cherry HillJersey City
Parsippany-Troy HillsPiscataway
MorristownNew Brunswick
Glen RidgeElizabethPrinceton
Franklin TownshipVineland
AllenhurstAvon-By-The-Sea
BayonneBelmar
Bradley BeachBrick
CamdenChatham Borough
CliftonCollingswood
CranfordEast Orange
EdisonGloucester Township
HackensackHamilton
LakewoodLower Township
MaplewoodMetuchen
MiddletownMontclair
NewarkNorth Bergen
Old BridgePaterson
PennsvilleRaritan Township
Red BankSeaside Heights
SummitToms RiverUnion City
Union TownshipVernon
Washinton TownshipWest Cape MayWildwood Crest
Woodbridge
0 1 2 3 4 5 6 7
6
4 3
3
2 2
2
2
0.5 0.5
0.2
0.25
0.2 0.125 0.1
30
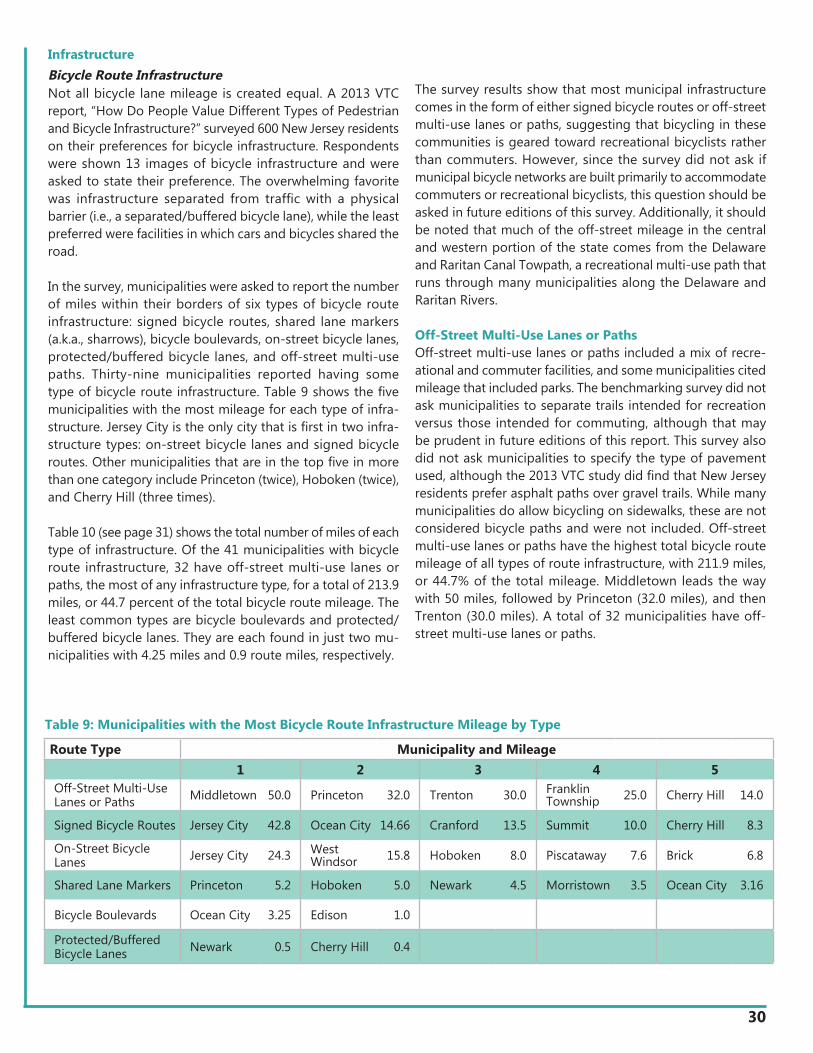
Table 9: Municipalities with the Most Bicycle Route Infrastructure Mileage by Type
InfrastructureBicycle Route InfrastructureNot all bicycle lane mileage is created equal. A 2013 VTC report, “How Do People Value Different Types of Pedestrian and Bicycle Infrastructure?” surveyed 600 New Jersey residents on their preferences for bicycle infrastructure. Respondents were shown 13 images of bicycle infrastructure and were asked to state their preference. The overwhelming favorite was infrastructure separated from traffic with a physical barrier (i.e., a separated/buffered bicycle lane), while the least preferred were facilities in which cars and bicycles shared the road.
In the survey, municipalities were asked to report the number of miles within their borders of six types of bicycle route infrastructure: signed bicycle routes, shared lane markers (a.k.a., sharrows), bicycle boulevards, on-street bicycle lanes, protected/buffered bicycle lanes, and off-street multi-use paths. Thirty-nine municipalities reported having some type of bicycle route infrastructure. Table 9 shows the five municipalities with the most mileage for each type of infra-structure. Jersey City is the only city that is first in two infra-structure types: on-street bicycle lanes and signed bicycle routes. Other municipalities that are in the top five in more than one category include Princeton (twice), Hoboken (twice), and Cherry Hill (three times).
Table 10 (see page 31) shows the total number of miles of each type of infrastructure. Of the 41 municipalities with bicycle route infrastructure, 32 have off-street multi-use lanes or paths, the most of any infrastructure type, for a total of 213.9 miles, or 44.7 percent of the total bicycle route mileage. The least common types are bicycle boulevards and protected/buffered bicycle lanes. They are each found in just two mu-nicipalities with 4.25 miles and 0.9 route miles, respectively.
The survey results show that most municipal infrastructure comes in the form of either signed bicycle routes or off-street multi-use lanes or paths, suggesting that bicycling in these communities is geared toward recreational bicyclists rather than commuters. However, since the survey did not ask if municipal bicycle networks are built primarily to accommodate commuters or recreational bicyclists, this question should be asked in future editions of this survey. Additionally, it should be noted that much of the off-street mileage in the central and western portion of the state comes from the Delaware and Raritan Canal Towpath, a recreational multi-use path that runs through many municipalities along the Delaware and Raritan Rivers.
Off-Street Multi-Use Lanes or PathsOff-street multi-use lanes or paths included a mix of recre-ational and commuter facilities, and some municipalities cited mileage that included parks. The benchmarking survey did not ask municipalities to separate trails intended for recreation versus those intended for commuting, although that may be prudent in future editions of this report. This survey also did not ask municipalities to specify the type of pavement used, although the 2013 VTC study did find that New Jersey residents prefer asphalt paths over gravel trails. While many municipalities do allow bicycling on sidewalks, these are not considered bicycle paths and were not included. Off-street multi-use lanes or paths have the highest total bicycle route mileage of all types of route infrastructure, with 211.9 miles, or 44.7% of the total mileage. Middletown leads the way with 50 miles, followed by Princeton (32.0 miles), and then Trenton (30.0 miles). A total of 32 municipalities have off-street multi-use lanes or paths.
Route Type Municipality and Mileage1 2 3 4 5
Off-Street Multi-Use Lanes or Paths Middletown 50.0 Princeton 32.0 Trenton 30.0 Franklin
Township 25.0 Cherry Hill 14.0
Signed Bicycle Routes Jersey City 42.8 Ocean City 14.66 Cranford 13.5 Summit 10.0 Cherry Hill 8.3
On-Street Bicycle Lanes Jersey City 24.3 West
Windsor 15.8 Hoboken 8.0 Piscataway 7.6 Brick 6.8
Shared Lane Markers Princeton 5.2 Hoboken 5.0 Newark 4.5 Morristown 3.5 Ocean City 3.16
Bicycle Boulevards Ocean City 3.25 Edison 1.0
Protected/Buffered Bicycle Lanes Newark 0.5 Cherry Hill 0.4

31
Protected/Buffered Bicycle LanesProtected/buffered bicycle lanes have only recently begun being built in the United States and are still rare in New Jersey: only two municipalities in the survey reported having one. Unlike off-road trails, protected lanes are usually created within the existing right-of-way, which decreases costs and does not require the acquisition of an additional right-of-ways. In the 2013 user preference survey, residents stated that they preferred protected bicycle lanes over standard lanes as it kept riders away from cars. Newark and Cherry Hill are the only municipalities that reported having protected/buffered bicycle lanes, with 0.5 miles and 0.4 miles, respectively. The 0.9 miles is only 0.2% of the total reported bicycle route infrastructure mileage.
On-Street Bicycle LanesOn-street bicycle lanes are more common than protected/buffered bicycle lanes, and are easier to install as they require less pavement and do not require moving on-street parking. While they do not offer physical protection from vehicles, they do give bicyclists an exclusive space on the road on which to navigate. Jersey City also has the greatest mileage of on-street bicycle lanes with 24.3 miles, or one-quarter of the 98.5 total miles within the surveyed municipalities. West Windsor has the second most with 15.8 miles, followed by Hoboken with 8.0 miles.
Shared Lane MarkersShared-lane markers (known also as “sharrows”) were found to be the least popular type of bicycle facility in the “How Do People Value...” report, as they do not separate bicyclists from drivers. However, they do serve to educate bicyclists on the correct place to ride, and remind motorists that bicycles should be expected in the lane. When a road is too narrow to add any other facility, shared-lane markers can be a positive addition, but there are concerns that municipalities may use them instead of safer, bicyclist-preferred infrastructure.
The municipalities surveyed reported having 331.8 miles of shared lane markers, 6.6% of the total bicycle route infra-structure. Princeton has the most with 5.2 miles, followed by Hoboken and Ocean City with 5.0 miles each.
Bicycle BoulevardsBicycle boulevards are similar to shared-lane markers except that they are deployed only on low-volume, residential streets along with other safety improvements for bicyclists. In many cases, they involve lower speed limits and traffic calming devices, which makes sharing a lane with motor vehicles safer and more comfortable than if only shared lane markers are used. Only two municipalities reported having bicycle boulevards: Edison and Ocean City. Combined, their infra-structure totals 4.25 miles, just 0.9% of the total bicycle route infrastructure.
Signed Bicycle RoutesSigned bicycle routes are the least sophisticated of bicycle infrastructure, as they exist only as signs on the side of the road. While they are helpful as a form of wayfinding for bicyclists, they do not provide safety benefits. The surveyed municipalities have a total of 129.6 miles of signed bicycle routes, or 27.1% of the total bicycle route mileage recorded in the survey; Jersey City has the most, with 42.8 miles, followed by Ocean City (14.66 miles) and Cranford (13.5 miles).
TotalsFigure 28 illustrates the total bicycle route infrastructure mileage in each municipality surveyed. Jersey City has the most, with 76 miles, followed by Middletown (54.0 miles), Princeton (37.2), and Franklin Township (37.0).
Table 10: Percent of and Total Mileage by Infrastructure Type
Type of Bicycle Route Infrastructure Total Mileage Percent of Total Mileage
Number of Municipalities with Infrastructure
Off-Street Multi-Use Lanes or Paths 213.9 44.7% 32
Signed Bicycle Routes 129.6 27.1% 19
On-Street Bicycle Lanes 98.5 20.6% 20
Shared Lane Markers 31.8 6.6% 14
Bicycle Boulevards 4.25 0.9% 2
Protected/Buffered Bicycle Lanes 0.9 0.2% 2
Total 478.9 100.0% 41

32
NOTABLE COMMUNITY
The City of Newark had the largest reported expenditure on bicycle infrastructure with $600,000 spent in 2013. The city spent $2.16 per person on bicycle infrastructure, and has installed green-painted, buffered bicycle lanes downtown, along with a solid network of sharrows. Newark passed a Complete Streets policy in 2012, and is located in Essex County which also passed a policy that same year.
Newark was one of only four municipalities in our survey to affirm that they have green-painted bicycle lanes, as show in this image. The use of green helps to highlight to all road users the presence of the bicycle lane and bicyclists using it. Newark has also added an additional buffer, where space is available, to further separate bicyclists from motor vehicles.
Figure 25: Green Bicycle Lane
Figure 26: Newark’s Sharrows Figure 27: Newark’s Waterfront Park
With 4.5 miles of sharrows, Newark has the 3rd longest shared-lane network in New Jersey. Newark has also placed the marking correctly in the center of the lane, and deployed them on streets where bicycle lanes cannot fit.
Although Newark does not yet have a network of off-road trails useful for bicycle commuting, an investment in parks has created a safe space to learn how to ride while enjoying a beautiful view of the city.

33
Figure 28: Total Bicycle Route Infrastructure Mileage
Jersey CityMiddletown
PrincetonFranklin Township
TrentonOcean CityCherry Hill
West WindsorPiscataway
CranfordHoboken
BrickSummitNewark
HamiltonLower Township
North BergenMorristown
LakewoodEdison
New BrunswickGlen Ridge
Wildwood CrestVernon
Toms RiverGloucester Township
CollingswoodBelmar
MetuchenCamdenVineland
MaplewoodBayonne
WoodbridgeWashington Township
West Cape MayHackensack
ElizabethRed BankMontclair
Avon-By-The-SeaUnion Township
Union CitySeaside Heights
Raritan TownshipPennsvillePaterson
Parsippany-Troy HillsOld Bridge
East OrangeClifton
Chatham BoroughBradley Beach
0 10 20 30 40 50 60 70 80 90
76
54
19
18 16
14 12
11 10 10
7 5
4
5
4
5
4
5 5 5
4 4 4
3 3
3
2 2 2 2 1 1 1 1 1
1
37
37
32
31 25

34
NOTABLE COMMUNITY
Hoboken is a notable community thanks to its infrastructure. The city has 13 miles of bicycle infrastructure on 35 miles of streets. This means that 37 percent of roads have bicycle infrastructure. Hoboken has also experimented with advance-stop lines (bicycle boxes) at intersections, and was the first municipality in New Jersey to pilot a bicycle share system. In 2015, the city plans to launch a full bicycle share system along with the neighboring municipality of Weehawken. Hoboken is recognized by the League of American Bicyclists as a Bicycle Friendly Community (Bronze), and has had a Complete Streets policy since 2010.
Hoboken has worked to install bicycle parking throughout the city, including on-street parking corrals near intersections. Hundreds of bicycles can be seen parked every day near the Hoboken Train Station, and the city has an interactive map avail-able showing the locations and capacity of their racks.
Figure 30: Hoboken Bicycle Path Figure 31: Hoboken’s Sharrows
Figure 29: Hoboken Bicycle Racks
Hoboken has beautified its waterfront with a series of parks. Connecting them is the Sinatra Drive Greenway which offers a separated bicycle path.
Along with 8-miles of bicycle lanes, Hoboken has installed 5-miles of sharrows on narrow roadways.

35
Road MilesThe 39 municipalities with bicycle route infrastructure have a total road length of 7,943.99 road miles (as measured from the centerline, not lane miles; and excluding major state and interstate highways). Of this, 1.6 percent have bicycle infra-structure (Table 11). By this measure, Hoboken has the highest percentage of roads with bicycle infrastructure at 37 percent.
Table 11: Percentage of Road Mileage with On-Street Bicycle Lanes
Note: Road length is the length of road centerlines (does not include highways). On-street bicycle lanes and sharrows are in each direction. Municipalities did not report whether streets had bicycle lanes or sharrows in both directions.Source: NJDOT
Suburban bicycle lane on Edinburg Road, in West Windsor
Figure 32: Edinburg Road, in West Windsor
Municipality Road Length (Miles) On-Street Bicycle Lane and Sharrow Mileage
Percentage of Road Mileage with On-Street Bicycle Lanes or Sharrows
Avon-By-The-Sea 14.4 0.5 3.5%Belmar 27.3 0.5 1.8%Brick 403.0 6.8 1.7%Camden 202.8 2.0 1.0%Cherry Hill 380.5 2.3 0.6%Edison 393.9 2.9 0.7%Franklin Township 354.1 5.0 1.4%Glen Ridge 25.2 0.6 2.4%Hamilton 444.2 3.0 0.7%Hoboken 35.1 13.0 37.0%Jersey City 268.2 25.8 9.6%Lower Township 208.3 3.5 1.7%Maplewood 67.7 2.0 3.0%Middletown 450.2 2.0 0.4%Montclair 109.3 0.5 0.5%Morristown 51.2 3.5 6.8%New Brunswick 102.4 3.5 3.4%Newark 465.1 10.0 2.2%Ocean City 135.2 7.5 5.5%Piscataway 267.8 7.6 2.8%Princeton 159.4 5.2 3.3%Red Bank 36.6 0.5 1.4%Trenton 216.5 2.0 0.9%Vineland 428.5 2.5 0.6%West Windsor 211.1 15.8 7.5%Wildwood Crest 32.8 1.0 3.0%Woodbridge 375.4 0.5 0.1%

36
NOTABLE COMMUNITY
Jersey City has the most bicycle route mileage of any surveyed municipality. It has 24.3 miles of on-street bicycle lanes, and 7.6 miles of off-street paths. Including shared-lane marking, 9.6 percent of Jersey City road mileage has bicycle infrastructure. Jersey City is also looking to join the Citi Bike bicycle share system, which currently exists in Manhattan and Brooklyn. Jersey City has three staff members that work on bicycle-related issues, and requires new developments to include a bicycle parking component. Jersey City adopted a Complete Streets policy in 2011, and Hudson County followed with their own policy in 2012.
The World Trade Center in lower Manhattan is visible behind this green-painted bicycle lane, which was created in 2014.
Figure 33: Jersey City’s Green-Painted Bicycle Lane Figure 34: Jersey City’s Main Street Bicycle Lane
Figure 35: Jersey City Bicycle Lane
Many streets in Jersey City now offer bicycle lanes, created a good network of bicycle infrastructure.
Another example of one of the many bicycle lanes in Jersey City.

37
Infrastructure MaintenanceMany of the municipalities surveyed do not have programs in place to ensure those responsible for the design and maintenance of city-owned roads are familiar with the latest design standards for accommodating bicyclists (Figure 36). Twenty-one municipalities reported that they do not have any programs that do this. Eighteen offer external training, six send staff to bicycle conferences, two require consultants to have a bicycle qualification, and one offers a Federal Highway Administration course. Twelve cited other examples of programs or trainings that they attend, including attending New Jersey Department of Transportation seminars and events, and following up-to-date National Association of City Transportation Officials (NACTO) and American Association of State Highway and Transportation Officials (AASHTO) guidelines.
Most municipalities also have municipal programs to remove obstructions from bicycle and traffic lanes; only six do not (Figure 37). Of those that do, 41 reported having a surface/pothole repair program of traffic lanes and shoulders. Forty-five have an on-street sweeping program, 14 have a surface/pothole repair program of on-street bicycle lanes (out of 20 that have such lanes), six have an off-street bicycle or multi-use path street sweeping program (out of 32 that have such paths), and 13 have a surface repair program of off-street bicycle or multi-use paths. Two have another program – replacement of grates – that assist in the maintenance of bicycle route facilities.
Figure 37: Which Programs Does Your City Have to Remove Obstructions from Traffic Lanes and Bicycle Facilities?
Figure 36: How Does Your City Ensure That Those Responsible for the Design and Maintenance of City-Owned Roads are Familiar with the Latest Design Standards for Accommodating Bicyclists?
0 2 4 6 8 10 12 14 16 18 20
0 5 10 15 20 25 30 35 40 45 50
External Training 18
Street Sweeping 45
Surface/pothole repair of on-street bicycle lanes 14
Other program 3
Surface repair of off-street bicycle or multi-use paths 13
Surface/pothole repair of traffic lanes and shoulders 41
Off-street bicycle or multi-use path sweeping 6
Send staff to bicycle conferences
6
Require that consultants have bicycle qualifications 2
Other 14
Offer FHWA course 1

38
NOTABLE COMMUNITY
Ocean City has established itself as one of the premiere shore towns for active transportation. Recognized by the League of American Bicyclists as a Bicycle Friendly Community (Bronze), the municipality is home to dedicated bicycle lanes, bicycle boulevards, and the only HAWK (high-intensity activated crosswalk) signal reported by respondents. This type of signal provides a safe place for pedestrians and bicyclists to cross a busy roadway. Ocean City has also experimented with various traffic calming techniques to keep bicycle riders safe, and has had a Complete Streets policy since 2011.
Ocean City has one of only two bicycle boulevards in the state. As seen on Haven Avenue, sharrows are accompanied by traffic calming and speed restrictions which create a safe and comfortable place to ride.
A recently installed HAWK signal stops traffic so pedestrians and bicyclists can safely cross the street and continue using an off-road trail.
Figure 38: Ocean City’s Bicycle Boulevard
Figure 39: Ocean City’s HAWK Signal Figure 40: Ocean City Cycle Track
An off-street section of the Haven Avenue bicycle boulevard.

39
No intersection bicycle infrastructure
Video detection
Buttons for bicyclists to activate signals at crossings
Other
Advanced stop lines (a.k.a. bicycle boxes}
Signals timed specifically for bicycles
Bicycle signal heads
0 5 10 15 20 25 30 35
Figure 41: What Infrastructure Does Your City Have to Accommodate Bicyclists at Intersections?
Other InfrastructureBicycle-friendly infrastructure at intersections, other than bicycle lanes, help bicyclists safely navigate them; however most municipalities (35) do not have this type of infrastructure (Figure 41). Only two have advanced stop lines for bicyclists (a.k.a. bicycle boxes), seven have video detection technology that senses when a bicyclist is present, six have user activated buttons of bicycle lights at crossings, and one has a traffic signal that is specifically designed for bicyclists. No municipality has bicycle signal heads.
Bicycle ParkingBicycle Parking InfrastructureBicycle racks come in all shapes and sizes, and the survey asked municipalities which types are locally in use. Around the country, municipalities and bicycle advocacy organizations have taken steps to identify which style of rack should or should not be used, but the survey did not ask if any such policy was in place. The District of Columbia, for example, states that comb/grid racks and wave racks are unacceptable, as the former can damage wheels and does not provide support for frames, while the latter does not allow for two locking points. Typically, the inverted-U style is considered preferable as it supports the bicycle frame in two places for safe locking, prevents the bicycle from tipping over, does not damage the bicycle, and can be securely installed.
The survey asked which types of bicycle racks are located in each municipality. The most common type is the comb/grid rack, with 37 respondents affirming that their municipalities have this type, followed by wave racks with 23 (Figure 42, see page 40). Other types of bicycle racks include inverted-U racks, “post and ring” racks, and coat hanger racks, among others. Six municipalities reported that they do not have any bicycle racks at all. Bicycle lockers are also found, with 12 municipalities reporting they have some available (this includes those at train stations). There are a total of 168 bicycle lockers throughout the 60 municipalities, with West Windsor having the most with 88.
The survey also asked where the bicycle racks are located (Figure 44, see page 41). Libraries have most bicycle racks, with 32 municipalities reporting that all or most libraries have them. Sixteen municipalities reported that all schools have bicycle racks and 11 said most do. On the other end of the spectrum, city buildings are the least likely to have bicycle racks present, with eight municipalities having none available, indicating a potential unmet need. Respondents were most likely to not know about the presence of bicycle racks at private offices. Overall, the survey shows that fre-quently-visited public spaces are most likely to have bicycle racks present. The survey did not ask about the placement of bicycle parking within the roadway, but some municipal-ities in New Jersey, such as New Brunswick, have begun to experiment with on-street bicycle corrals. Future editions of this report should include this question.
35
4
7
6
2
1

40
Comb/Grid
Wave
Inverted-U
Post & Ring
Coat Hanger
Spiral
Swing Arm-Secured
Artistic Rack
Tree Guard
Wall-Mounted Racks
Wheelwell-Secured
0 5 10 15 20 25 30 35 40
Figure 42: Number of Municipalities that have Different Types of Bicycle Racks
Figure 43: Types of Bicycle Racks
37
6
4
2
1
23
13
8
From left to right, a comb/grid rack, a wave rack, an inverted-U rack, and a post-and-ring rack. Although cited as most common in our survey, neither the grid style nor the wave style racks provide the security and structure that bicyclists need when parking their bicycle.Photo Source: Association of Pedestrian and Bicycle Professionals

41
Schools
Libraries
Parks and
Recreation Centers
City Buildings
State Buildings
Federal Buildings
Private Offices
Retail District or
Shopping Center
0 5 10 15 20 25 30 35
Figure 44: What Proportions of the Following Have Bicycle Racks in Your City?
All Most Most Do Not
Does Not Exist
Don’t KnowSome None Do
16
10 11
4 4
2 4
26 6
7 1
2 4
5
0
11 13
14 6
3 4
9 8
15 7
8 1
2
1 0
0 3
1 27
13
2 0 0
2 2
29 14
0 0
2 2
10 15
21
0
4 3
23 8
2 11

42
NOTABLE COMMUNITY
New Brunswick was the only municipality surveyed that has a local ordinance requiring drivers to give a safe distance when passing bicyclists. It also requires bicycle parking to be included in new office, retail, and multi-family developments, and has a bicycle map available to the public. New Brunswick has also experimented with innovative bicycle infrastructure, including installing seven public bicycle-parking corrals on municipal streets. The city also hosts the largest Ciclovia (open streets) event in the state three times a year. New Brunswick and Middlesex Counties have had a Complete Streets policy since 2012.
New Brunswick’s Ciclovias bring out thousands of bicyclists of all ages to city streets three times a year. By opening the streets to bicycles and pedestrians, the city hopes to expand community engagement and public health.
Figure 45: New Brunswick Ciclovia
Figure 46: Bicycle Corral Figure 47: New Brunswick Sharrow
Seven bicycle corrals were installed around New Brunswick in 2014. Aside from providing ample bicycle parking, they help create safer intersections by ensuring visibility at corners.
New Brunswick has been adding bicycle lanes and sharrows over the past two years, with additional lanes planned for 2015.

43
Zoning Policies that Require Bicycle Parking in New DevelopmentsAccess to safe and convenient bicycle parking is an important measure to promote bicycle use; it ensures bicyclists have a safe place to park their bicycles at both trip ends. Municipal ordinances addressing motor vehicle parking are common, but those requiring bicycle parking are less common. The survey reveals that some municipalities in New Jersey are standardizing bicycle parking in local ordinances. Eleven municipalities reported that they require bicycle parking for office buildings, 14 require it for retail districts, and 12 have a requirement for multi-family housing (Table 12).
Abandoned Bicycle PoliciesAbandoned bicycles use valuable bicycle parking spaces in high demand areas, such as train stations, making it difficult for riders to find a safe and secure place for their bicycle. As the abandoned bicycles deteriorate, they also become an eyesore, which in turn can make it more difficult to create additional parking areas due to community concerns. Fifteen municipalities indicated that they have a policy in place to address the removal of abandoned bicycles, while twenty-five reported they did not, and thirteen did not know.
The municipalities that have abandoned bicycle policies are the following:
The types of policies in place by municipalities vary. In most cases, the local police department collects abandoned bicycles and holds them for a period of time. If they are not claimed, they are then auctioned off. Collingswood uses bicycles that are not claimed to supplement their bicycle lending system.
Municipalities differ as to how they identify abandoned bicycles and how long they are stored. Hoboken provided the most complete response for how they handle these issues:
Parsippany-Troy Hills described an almost identical process. Union Township identified their “obstruction of public passage” ordinance as a means to deal with abandoned bicycles.
“Abandoned bicycles are reported by residents or city staff through the Hoboken 311 constituent feedback system, which is then routed to the Hoboken Police Department. The HPD then tags the bicycles in question, and if those bicycles are not removed by their owner within 7 days, the bicycles are clipped and impounded by HPD. After being impounded for 6 months, the bicycles become City of Hoboken property and are later auctioned off or given away to charity.”
Table 12: Municipalities that Require Bicycle Parking in New Developments
• Allenhurst• Belmar• Bradley Beach• Chatham Borough• Cranford• Glen Ridge• Hackensack• Hoboken
• Lower Township• Metuchen• Parsippany-Troy Hills• Princeton• Red Bank • Summit• Union Township
Municipality Office Buildings Retail or Shopping Districts Multi-Family Housing
Belmar Yes Yes YesBrick N/A Yes YesCherry Hill Yes Yes NoCollingswood Yes Yes YesCranford Yes Yes YesJersey City Yes Yes YesMaplewood No Yes NoMetuchen Yes Yes YesMontclair Yes Yes YesMorristown Yes Yes YesNew Brunswick Yes Yes YesPiscataway No Yes YesVineland Yes Yes YesWest Windsor Yes Yes Yes

44
Bicycle PoliciesSafe Passing LawsThere has been movement nationwide over the past few years to establish laws that require motor vehicles to give at least three feet of space when passing bicyclists. Twenty-six states currently require either three or four feet be given, while eight states have general “safe passing” laws that require drivers to pass bicyclists at a safe distance. Bills have been passed by the New Jersey state assembly that would establish a similar law, but those bills have yet to pass through the state senate and be signed into law by the governor. As no such state law exists, it is up to individual municipalities to set their own safe passing standards.
The purpose of the legislation is primarily to remind motorists to give more space when overtaking a bicycle. Legislators and police officers acknowledge that it is very difficult, if not impossible, to actively enforce such a law, but it does raise awareness of the dangers that passing too closely can create. The law can also be used as a prosecution tool in cases of collisions. Of the municipalities that completed our survey, only New Brunswick has such a law in place. Thirty-nine other municipalities stated that they do not, while 13 answered that they do not know.
Electric Bicycle PoliciesElectric bicycles are a relatively new addition to the bicycling scene, and as such, only the municipalities of North Bergen and Toms River stated that they have legislation affecting them. Nine municipalities stated that they do not know if a policy exists.
Cars Parked in Bicycle LanesOnly three cities affirmed that they actively ticket and enforce car illegally parked in bicycle lanes. They were West Windsor, Ocean City, and Hoboken. This is just 15 percent of all municipalities surveyed that have bicycle lanes.
Bicycle MapsOnly twelve municipalities reported that they have a bicycle map (paper or online) available. They are listed below.
Bicycling on Sidewalks In some situations, bicyclists can create an uncomfortable friction with pedestrians when sharing a sidewalk. The difference in speed between the two modes can cause collisions. Some municipalities have taken steps to prevent crashes by banning the use of sidewalks by adults on bicycles.
Fourteen municipalities ban the use of bicycles on all municipal sidewalks, while six stated that such a ban exists in specific areas (Table 13). Usually, bans on bicycling on the sidewalks in specific areas are implemented in popular commercial districts where sidewalks may be too narrow to share. Twenty-one municipalities have no ban, while twelve answered that they did not know if a ban exists.
Table 13: Municipalities that Prohibit Adults From Riding on Sidewalks
Bicycle Transportation Within Master PlansOne of the first steps to creating a bicycle lane network and promoting bicycle-friendly policies is to include those goals as part of the municipal master plan. Thirty-two municipal-ities said they do consider bicycles in their plan, while only eight stated that they do not. Ten others do not know or did not respond. Upon receiving this data, the project team double-checked online to see if the “did not know” municipal-ities have a bicycle element in their master plan. Of those ten, seven were found to have a bicycle element in their master plan and three were found to not. Of the four municipalities that left the question blank, two were found to have this and two were found to not. This brings the total number of municipalities with a bicycle element within their master plan to 41.
• Brick• Cherry Hill• Cranford• East Orange• Franklin Township• Hoboken• Jersey City
• Maplewood• Middletown• New Brunswick• Ocean City• Piscataway• Princeton• West Windsor
Everywhere Only in Specific AreasAllenhurst BelmarBayonne Bradley BeachEast Orange CranfordElizabeth Ocean CityGlen Ridge PrincetonHackensack VinelandJersey CityMetuchenMontclairMorristownNew BrunswickNorth Bergen Raritan TownshipSummit

45
Complete StreetsNew Jersey is a national leader in Complete Streets policy adoption. At the state level, the New Jersey Department of Transportation was among the first in the country to adopt a Complete Streets policy. As of March 31, 2015, seven of the 21 counties have Complete Streets policies, and of the 564 municipalities in New Jersey, 114 have Complete Streets policies. The following 29 municipalities were included in the survey and have Complete Streets policies (date of adoption):
The counties that have Complete Streets policies are:
Of the municipalities surveyed, 29 have adopted Complete Streets policies, while 25 have not. Thirty-two municipalities are located in a county that has passed its own resolution, while 22 are located in a county that has not.
Bicycle ShareBicycle sharing systems are an emerging tool that municipalities around the world use to supplement their local transportation systems. In New Jersey, no municipality currently operates a third-generation system, which relies heavily on technology to ensure that users return bicycles to docking stations; however, some municipalities have invested in small-scale rental systems. Belmar, Camden, Newark, Union City, and Montclair also either operate small lending systems or are in the process of planning larger systems as of December 31, 2014.
Collingswood operates a small bicycle share system that is maintained by volunteers and operates like a library. A resident can check out a bicycle, take it home, and keep it as long as they continue to use it. Use of the system costs $25 a year. The New Brunswick campus of Rutgers University operates a similar system for student use. In 2014, Princeton University launched a system with ten bicycles at the NJ TRANSIT “Dinky” stop. Operated by Zagster, membership costs $20 and allows free use of the bicycles for up to two hours. The system does rely on smartphone technology but does not utilize fixed docking stations.
Municipalities in northeastern New Jersey are moving forward with implementing more bicycle share systems. Jersey City is developing a 350-bicycle system to be launched in 2015 in a partnership with New York City’s Citi Bike share that will allow Jersey City bike share members to use Citi Bike bicycles as well. Hoboken, which operated a pilot system in 2013 similar Princeton’s, is working with Weehawken to launch a system within both cities; Weehawken is slated to receive 70 bicycles and Hoboken 230. It is expected to be rolled out in spring of 2015.
Bicycle Theft, Safety, and SecurityBicycle SecurityOver half of the municipalities that responded to the survey reported that at least some of their police are trained to use bicycles on patrol (Figure 51, see page 47). On average, 14 percent of police are trained. The municipalities with the highest share of police trained to ride bicycles were all shore communities. Belmar had the highest share of police trained (100%) followed by Red Bank (65%), Collingswood (30%), Seaside Heights (30%), and Ocean City (30%).
• Monmouth County (July 22, 2010)• Essex County (April 11, 2012)• Mercer County (April 26, 2012)• Hudson County (May 25, 2012)
• Middlesex County (July, 2012)• Camden County (December 19, 2013)• Passaic County (February 11, 2014)
• Camden (June 13, 2013)• Chatham Borough (March 21, 2012)• Cherry Hill (March 24, 2014)• Cranford (September 10, 2013)• East Orange (September 23, 2013)• Elizabeth (March 25, 2014)• Glen Ridge (September 10, 2012)• Gloucester Township (July 9, 2012)• Hackensack (June 11, 2012)• Hoboken (November 15, 2010)• Jersey City (May 25, 2011)• Lakewood (October 17, 2013)• Maplewood (February 21, 2012)• Metuchen (October 21, 2013)• Montclair (October 6, 2009)
• Morristown (July 17, 2012)• New Brunswick (May 6, 2012)• Newark (September 6, 2012)• Ocean City (October 13, 2011)• Princeton (March 12/13, 2012)• Raritan Township (February 6, 2013)• Red Bank (August 9, 2010)• Summit (June 4, 2014)• Toms River (July 24, 2014)• Trenton (March 1, 2012) • Union City (December 17, 2013)• Vineland (September 27, 2011)• West Windsor (July 19, 2010)• Woodbridge (July 12, 2011)

46
NOTABLE COMMUNITY
Approximately nine percent of commute trips in Belmar are made by bicycle, the second highest in the state. The popular shore town is the only municipality surveyed that has 100 percent of its police force trained to use bicycles. Belmar is also one of 14 municipalities that has bicycle parking requirements for new developments. Belmar is located in Monmouth County, which in 2010 was the first New Jersey County to pass a Complete Streets policy.
Figure 48: Belmar Beach Cruisers
Figure 49: Boardwalk Bicycle Parking Figure 50: Event Bicycle Parking
Although Belmar lacks in dedicated bicycle infrastructure, it offers many low stress streets connecting commerce, residential, and the ever-popular beach. Cruiser-style bicycles are a common way for residents and visitors to travel from their home to the oceanfront.
Bicycle on the Belmar Boardwalk.Picture Source: http://visitbelmarnj.com/
Bicycle parking for a large event.Picture Source: http://visitbelmarnj.com/

47
Figure 51: Percent of Police Trained to Use Bicycles on Patrol
BelmarRed Bank
Seaside HeightsOcean City
CollingswoodWashington Township
MontclairAvon-By-The-Sea
MetuchenGlen Ridge
CamdenNew Brunswick
MorristownSummit
PiscatawayParsippany-Troy Hills
North BergenGloucester Township
CranfordBradley Beach
AllenhurstToms River
West WindsorVineland
PrincetonHamilton
BrickLakewood
Union TownshipEdison
Chatham BoroughBayonne
Cherry HillClifton
East OrangeElizabeth
Franklin TownshipHackensack
HobokenJersey City
Lower TownshipMaplewoodMiddletown
NewarkOld Bridge
PetersonPennsville
Raritan TownshipTrenton
Union CityVernon
West Cape MayWildwood Crest
Woodbridge
0% 20% 40% 60% 80% 100% 120%
100%
65% 30% 30% 30%
25%
20%
25%
20%
25%
20%
15% 15%
10%
10%
10%
10% 10%
10%
10%
10%
6%
5%
5%
5%
5%
5%
2%
1% 1%
1%

48
Table 14: Fatalities and Injuries to Bicyclists, 2009-2013
Note: The crashes in this analysis are only those for which bicyclist injury severity was recorded in Plan4Safety. The total recorded number of bicycle-vehicle crashes during this time period was 5,465.Source: Plan4Safety
Municipality Killed Incapacitated Moderate Injury
Complaint of Pain TOTAL
Jersey City 3 7 24 311 412Newark 3 1 35 210 268Camden 0 6 44 131 196Lakewood 0 4 91 107 180Paterson 1 0 23 101 140Toms River 3 4 6 48 114Elizabeth 1 2 17 75 106Passaic 0 2 10 75 100New Brunswick 2 2 14 57 96Union City 1 2 18 67 93Edison 1 3 12 51 92Clifton 0 3 21 58 91Hamilton 0 4 28 44 90Brick 1 1 16 43 89Bayonne 0 1 3 60 83Woodbridge 0 1 10 41 77Hackensack 0 1 16 52 81Vineland 3 2 2 56 78Hoboken 0 1 42 51 76North Bergen 0 1 54 52 75Trenton 1 3 59 53 75Montclair 0 1 28 38 71Princeton 0 0 11 31 66Ocean City 0 0 22 24 64Franklin Township 1 2 12 34 61Cherry Hill 1 4 2 30 56Egg Harbor Township 2 5 37 32 56Belmar 0 2 22 27 53Union Township 0 2 23 36 53Middletown 0 1 6 23 52Lower 0 2 69 24 50East Orange 0 1 17 35 48Wildwood 0 2 23 12 48Gloucester Township 0 4 4 24 44Cranford 0 1 10 21 39Red Bank 0 0 4 17 35Piscataway 0 4 8 19 34Westfield 0 0 11 10 33Collingswood 0 2 30 16 28Evesham 0 3 28 12 27Morristown 0 0 32 13 27West Windsor 0 0 0 16 27Bradley Beach 0 1 24 9 26Parsippany-Troy Hills 0 1 11 14 25Washington Township 0 2 17 10 23Old Bridge 1 0 40 10 22Wildwood Crest 0 1 34 9 20Metuchen 0 0 7 12 18Seaside Heights 0 0 18 9 18Maplewood 0 0 24 9 16Phillipsburg 0 1 6 6 15Pennsville 1 1 38 6 14Summit 0 1 9 6 13Glen Ridge 0 0 24 3 7Raritan Township 1 0 4 2 7Chatham Borough 0 1 59 2 5Vernon 0 1 15 1 4Allenhurst 0 0 1 2 3Avon-by-the-Sea 0 0 1 0 3West Cape May 0 0 11 0 0TOTAL 27 97 1,352 2,347 3,823

49
Bicycle TheftMunicipalities were asked two questions regarding their experience with bicycle theft in their city. The first was if they offered a bicycle registration program with the police department or within city hall. Twenty-two municipalities affirmed that they offer an optional registration program within their police department. These programs usually involve informing the department about the model, color, and serial number of a bicycle, which can then be used to assist with recovery in the event of a theft.
Municipalities were also asked to rank the locations where bicycle theft most commonly occurred. Of the 34 municipalities who replied to this question, 19 reported that residences are the most common location for bicycle theft. Recreational and retail locations were also frequently cited as common locations for theft, while libraries and government buildings were the least. Frequency of theft at transit locations was mixed; cities with large amounts of bicycle parking at major transit stations, such as Newark, New Brunswick, and Chatham Borough, citied train and bus stops as the most common locations for theft. Shore towns, on the other hand, were least likely to rank transit locations highly.
Bicyclist Fatalities and InjuriesThe project team gathered safety data from Plan4Safety, a crash database housed at the Rutgers University Center for Advanced Infrastructure and Transportation. Between 2009 and 2013, 26 bicyclists were killed in the 60 municipalities and 3,803 were injured for a total of 3,829 crashes (Table 14, see page 48). Note that these crashes are only those for which bicyclist injury severity was recorded in Plan4Safety. The total number of reported bicycle-vehicle crashes during this time period was 5,465. Fatalities and injuries suffered by bicyclists using New Jersey’s transportation infrastructure are on a downward trend. Between 2009 and 2013, the number of bicycle-vehicle crashes within the sixty municipalities decreased by 180, from 1,176 to 996, a 15.3 percent decrease. (Note that, again, for consistency sake, these crashes are only those for which bicyclist injury severity was recorded.) This trend, however, is not as evident in national-level data. Nationally, 726 people died and 49,000 were injured in bi-cycle-vehicle crashes in 2012 (the most recent year data are available), while in 2008, 718 were killed and 52,000 injured. While fatalities increased by 1.1 percent, injuries decreased by 5.8 percent. Generally speaking, more crashes occur in urban areas, while higher rates of fatalities occur in rural and suburban areas.
New Jersey’s shore towns, renowned for their higher rates of bicycling, had fewer bicycle-vehicle crashes than non-shore towns, and were less severe. For example, West Cape May, Avon-by-the-Sea, West Cape May, and West Wildwood, had less severe injuries than many municipalities that did not have high bicycling mode shares; no bicyclists were incapacitated or killed. The lower numbers of injury and fatality in these towns, even given their comparatively higher rates of bicycling to work, may be due to many factors, including land use, the presence of bicycle infrastructure, and the increased visibility caused by the presence of a high number of bicyclists.
Investing in BicyclingEngagement at the state level to encourage bicycling within municipalities should start with an understanding of what is important to each community. Not all community officials may feel that there is public demand for bicycling but they may understand that investing in bicycling will increase residents’ quality of life. Increased bicycling activity has positive health impacts and also is an inexpensive mode of travel. There are other ancillary benefits such as reduced congestion, recre-ational benefits, and reduced parking needs.
The survey asked why municipalities invest in bicycling. The most frequently cited reason is improved public health with 31 affirmative responses, followed closely by improved quality of life with 30. Rounding out the top three reasons is community connectivity with 28 responses. The least cited reason is cooperation with adjacent communities with eight responses. The breakdown of the responses by municipality is shown in Table 15 (Appendix A). This information elucidates the motivations behind municipalities’ investment in bicycling infrastructure and programs. Many municipalities make the connection with health and quality of life but not necessarily with safety or do not believe there is sufficient public demand.
The responses to this question demonstrate some of the bicycling challenges within some New Jersey municipalities. Continued community engagement is needed with public officials who may not be aware of or understand the myriad benefits of municipal support of bicycling. Educating local officials about the benefits of bicycling programming and infrastructure could strengthen the case that bicycling should become a standard component of the transportation network.

50
CONCLUSION
This report summarizes the state of bicycling within New Jersey and highlights some of the most notable contributions to bicycle planning and programming by municipalities. To continue to increase the number of New Jersey residents who bicycle regularly, it is critical that New Jersey municipalities make a stronger push to improve their local infrastructure, enact more pro-bicycling policies, and invest in bicycle education and safety. This report shows that while the level of bicycling investment varies widely from municipality to municipality, cities that have demonstrated commitment to bicycling are not limited to a specific geographic area or size.
A number of New Jersey municipalities demonstrate how effective bicycle policies and infrastructure can be implemented across communities that differ widely from each other – from urban to suburban to rural to shore towns. Cities such as Jersey City show that dense, urban areas can introduce innovative bicycle infrastructure, but such innovation is not restricted to the urban core; suburban municipalities such as West Windsor show that lower densities need not be a barrier to building bicycle infrastructure. Indeed, West Windsor was named New Jersey’s first “Bicycle-Friendly Municipality” by the League of American Bicyclists. Meanwhile, the shore communities have the highest rates of bicycle ridership in the state, but aside from Ocean City, typically lack significant bicycle investment. With more investment, use of the bicycle in those communities could increase.
Bicyclists in Collingswood on a beautiful fall day Photo Source: Collingswood.com
Figure 52: Bicyclists in Collingswood
This benchmarking report is intended to highlight many of the benefits that come from the implementation of modern bicycle infrastructure and policies, and to inspire municipalities across New Jersey to critically examine their support of bicycling in comparison with some of their peers. While some municipalities were noted for their efforts in certain areas, no municipality excels in all areas. Further, some municipalities have done little to promote bicycle use and even the “Notable Communities” have areas in which they can improve.
Future editions of this benchmarking report should document changes over time, and identify trends among municipalities. The experience in putting this report together will also allow for improved methodology and data collection, especially with regards to standardization of records. The report has also served as a way to let municipal employees know what data are valuable, and the hope is that future requests for information will not come as a surprise.
The project team also hopes that municipalities that were not included within this study will take the initiative to provide data so that they can be compared with their peers, and also to complete the understanding of the current state of bicycling in New Jersey. Municipalities interested in being a part of the Benchmarking Report can contact the team to be included in future editions, or to provide other recommendations with regards to the report.

51
2013-2014 New Jersey Bicycling Benchmarking Report
APPENDIXES
Appendix A - Reasons for Investing in Bicycling . . . . . . . . . . . . . . . . . . . . . . . . . . . . . . . . . . . . . . . . . . . . . . . . . . . 52
Appendix B - Voorhees Transportation Center Reports Referenced in the Text. . . . . . . . . . . . . . . . . . . . . . . . . . . . 53
Appendix C - Survey Instrument. . . . . . . . . . . . . . . . . . . . . . . . . . . . . . . . . . . . . . . . . . . . . . . . . . . . . . . . . . . . . . . . 54

52
APPENDIX ATable 15: Reasons for Investing in Bicycling
Mun
icip
ality
Impr
oved
Q
ualit
y of
Li
fe
Impr
oved
Pu
blic
H
ealth
Com
mun
ity
Conn
ectiv
ityPr
ovid
e M
ore
Tran
spor
tatio
n O
ptio
ns
Dec
reas
e Tr
affic
Co
nges
tion
Incr
ease
d To
uris
mIn
crea
sed
Prop
erty
Va
lues
Coop
erat
ion
with
Adj
acen
t Co
mm
uniti
esPu
blic
D
eman
dEc
onom
ic
Dev
elop
men
tTr
affic
Sa
fety
Alle
nhur
stAv
on-B
y-Th
e-Se
aBe
lmar
XX
XX
XX
XX
Brad
ley
Beac
hBr
ick
XX
XX
XCa
mde
nX
XX
XX
XX
XX
XX
Chat
ham
Bor
ough
XX
Cher
ry H
illX
XX
XX
XX
XBa
yonn
eCl
ifton
Colli
ngsw
ood
XX
XX
XX
XX
XX
XCr
anfo
rdX
XX
East
Ora
nge
XX
XX
XX
XX
XX
Ediso
nX
XX
XX
Eliza
beth
XX
XX
XX
Fran
klin
Tow
nshi
pX
XX
Glou
cest
er T
owns
hip
Glen
Rid
geX
XX
XX
XX
XX
Hac
kens
ack
XX
Ham
ilton
X
XX
XX
Hob
oken
XX
XX
XX
XX
XX
Jers
ey C
ityX
XX
XX
Lake
woo
dLo
wer
M
aple
woo
dX
XX
XX
XX
Met
uche
nX
XX
XX
XX
XM
iddl
etow
nM
ontc
lair
XX
XX
XX
XX
XM
orris
tow
nX
XX
XX
XX
XX
New
Bru
nsw
ick
XX
XX
XX
XX
XN
ewar
kX
XX
XX
XX
Nor
th B
erge
nX
XX
XO
cean
City
XX
XX
XX
XX
XO
ld B
ridge
Pars
ippa
ny-T
roy
Hill
sX
Pate
rson
XX
Penn
svill
e Pi
scat
away
XX
XPr
ince
ton
XX
XX
Rarit
an T
owns
hip
Red
Bank
XX
XX
XX
XSe
asid
e H
eigh
tsSu
mm
itX
Tom
s Riv
erX
XX
XTr
ento
nX
XX
XX
XUn
ion
City
XX
XX
Unio
n To
wns
hip
Vern
onX
XX
XVi
nela
ndX
XX
Was
hing
ton
Tow
nshi
pW
est C
ape
May
Wes
t Win
dsor
XX
XX
XX
XX
XX
XW
ildw
ood
Cres
tW
oodb
ridge
XX
XX
Wes
t Win
dsor
TOTA
L30
3128
2923
1210
817
1021

53
APPENDIX BVoorhees Transportation Center Reports Referenced in the Text
BICYCLE TO RAIL TRANSIT BENCHMARKING REPORT
New Jersey Bicycle and Pedestrian Resource Center
NJBICYCLE & PEDESTRIAN
RESOURCE CENTER
Alan M. Voorhees Transportation Center
Pedestrian Safety atBus Stops Study
New Jersey Bicycle and Pedestrian Resource Center
SUBMITTED TO:
STATE OF NEW JERSEY
Department of Transportation
Trenton, New Jersey
1035 Parkway Avenue
P.O. Box 600
Trenton, NJ 08635-0600
SUBMITTED BY:
ALAN M. VOORHEES
TRANSPORTATION CENTER
Edward J. Bloustein School of
Planning and Public Policy
Rutgers, The State University of
New Jersey
33 Livingston Avenue
New Brunswick, NJ 08901
IN COORDINATION WITH:
MICHAEL BAKER JR., INC.
Bicycle to Rail Transit: Benchmarking Report The Economic Impacts of Active Transportation in New Jersey
Pedestrian Safety at Bus Stops How do People Value Different Types of Pedestrian and Bicycle Infrastructure?
Reports available on http://njbikeped.org/portfolio-page/

54
Survey InstrumentAPPENDIX C

55

56
57

58

59

60

61

62

63

64

65

66

67

68
Alan M. Voorhees Transportation CenterEdward J. Bloustein School of Planning and Public Policy
Rutgers, The State University of New Jersey33 Livingston Avenue
New Brunswick, NJ 08901