Fin Report 2011
8
Annual State of Local Governance Report 2011 FINANCIAL PERFORMANCE e-REPORT Province of Ilocos Norte, PY 2011 1. REVENUE GENERATION 1.1. Cost to Collect Revenues Interpretation Guide Indicator :Cost to Collect Revenues Computation : (cost in collecting revenues/total local revenues collected) x 100 Significance : Determines local revenue collection efficiency Desired performance : Should be lower than the average of LGUs with the same LGU type and income class Exceptional performance : Lower for both conditions: (1)average of LGUs with the same LGU type and income class, (2)national average of the same LGU type regardless of income class
-
Upload
ilocos-norte -
Category
Documents
-
view
213 -
download
1
description
Â
Transcript of Fin Report 2011
Annual State of Local Governance Report 2011 FINANCIAL PERFORMANCE e-REPORT
Province of Ilocos Norte, PY 2011
1. REVENUE GENERATION
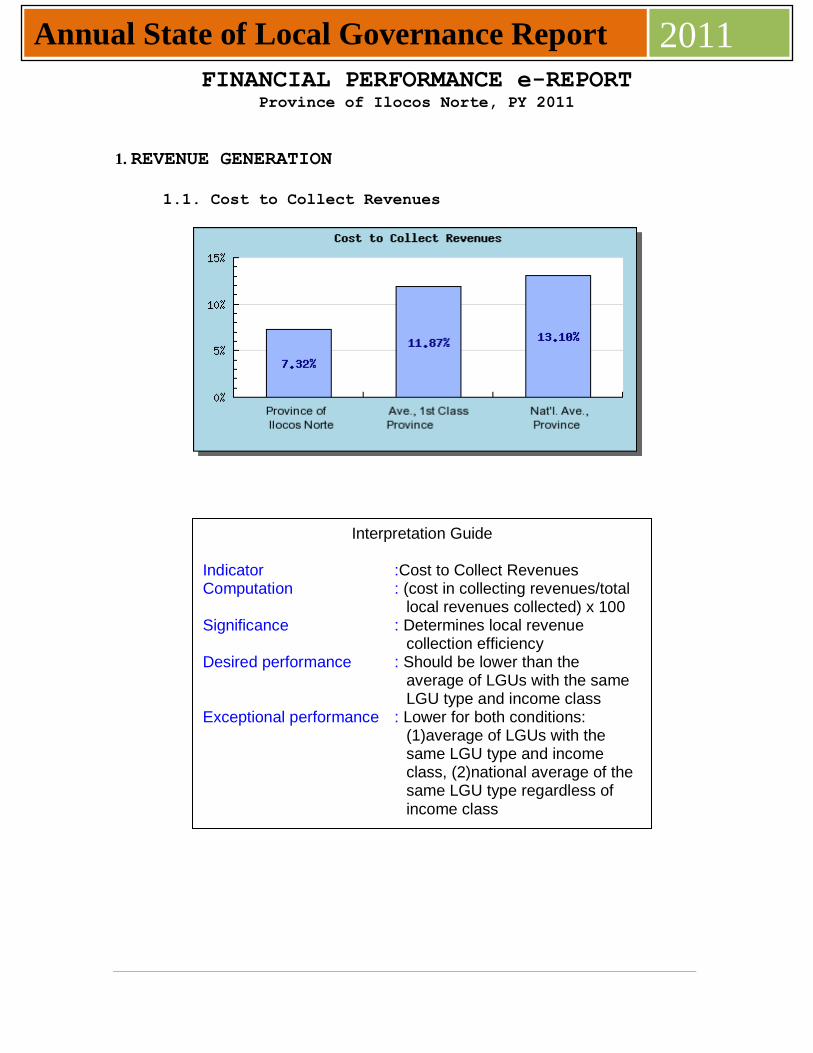
1.1. Cost to Collect Revenues
Interpretation Guide
Indicator :Cost to Collect Revenues Computation : (cost in collecting revenues/total
local revenues collected) x 100 Significance : Determines local revenue
collection efficiency Desired performance : Should be lower than the
average of LGUs with the same LGU type and income class
Exceptional performance : Lower for both conditions: (1)average of LGUs with the same LGU type and income class, (2)national average of the same LGU type regardless of income class
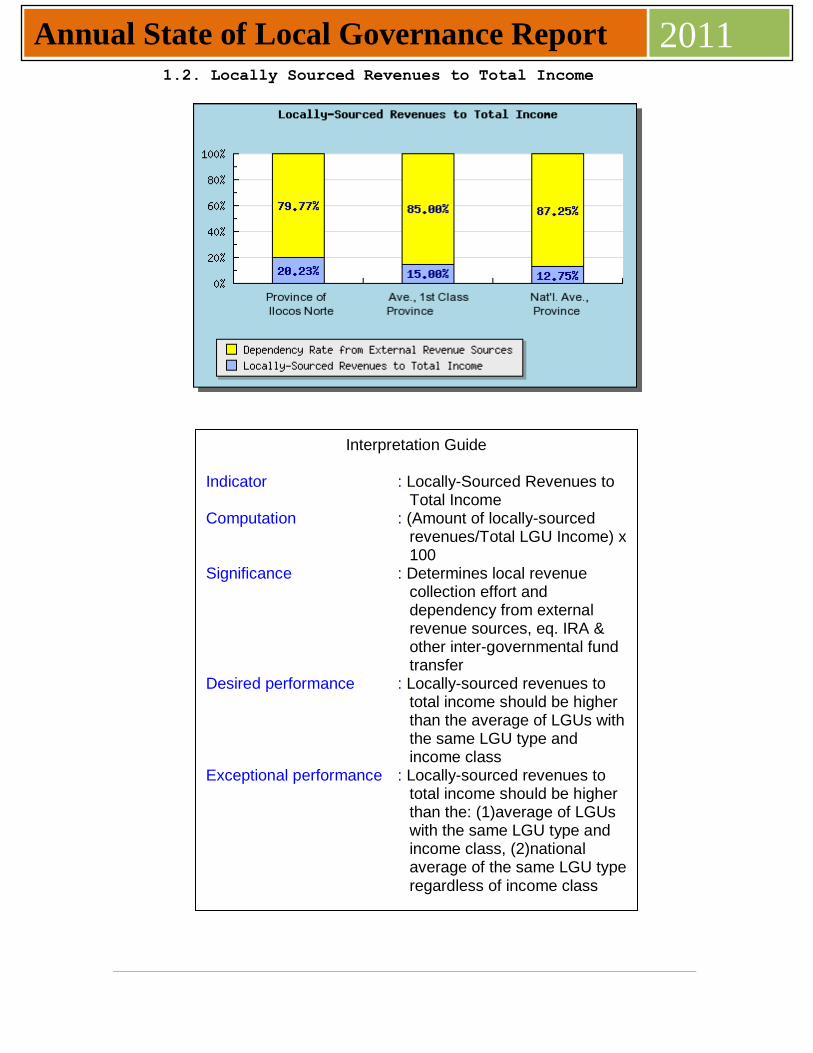
Annual State of Local Governance Report 2011 1.2. Locally Sourced Revenues to Total Income
Interpretation Guide
Indicator : Locally-Sourced Revenues to Total Income
Computation : (Amount of locally-sourced revenues/Total LGU Income) x 100
Significance : Determines local revenue collection effort and dependency from external revenue sources, eq. IRA & other inter-governmental fund transfer
Desired performance : Locally-sourced revenues to total income should be higher than the average of LGUs with the same LGU type and income class
Exceptional performance : Locally-sourced revenues to total income should be higher than the: (1)average of LGUs with the same LGU type and income class, (2)national average of the same LGU type regardless of income class
Annual State of Local Governance Report 2011
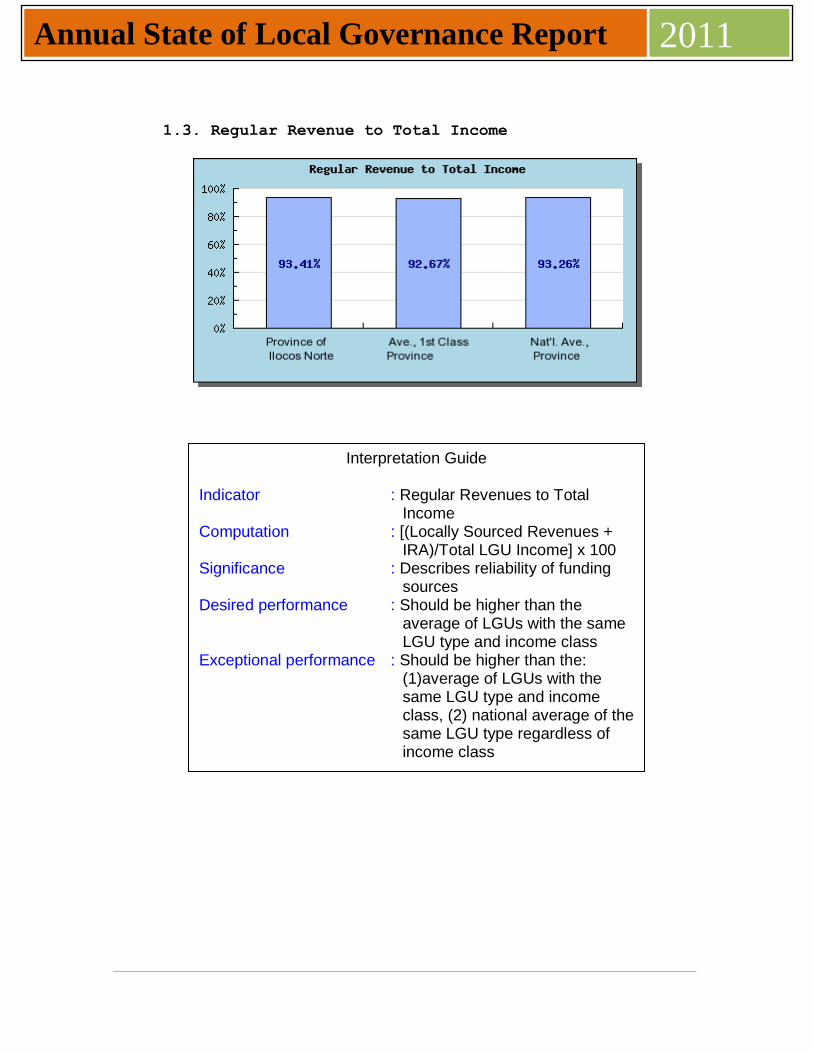
1.3. Regular Revenue to Total Income
Interpretation Guide
Indicator : Regular Revenues to Total Income
Computation : [(Locally Sourced Revenues + IRA)/Total LGU Income] x 100
Significance : Describes reliability of funding sources
Desired performance : Should be higher than the average of LGUs with the same LGU type and income class
Exceptional performance : Should be higher than the: (1)average of LGUs with the same LGU type and income class, (2) national average of the same LGU type regardless of income class
Annual State of Local Governance Report 2011
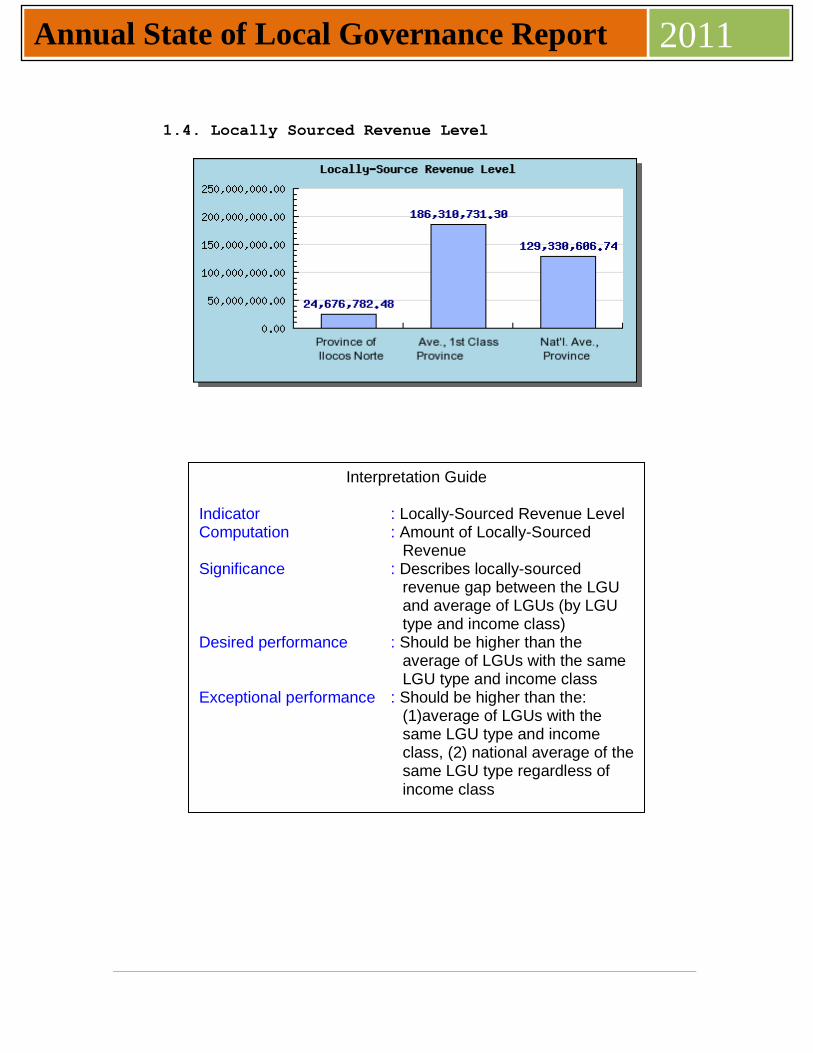
1.4. Locally Sourced Revenue Level
Interpretation Guide
Indicator : Locally-Sourced Revenue Level Computation : Amount of Locally-Sourced
Revenue Significance : Describes locally-sourced
revenue gap between the LGU and average of LGUs (by LGU type and income class)
Desired performance : Should be higher than the average of LGUs with the same LGU type and income class
Exceptional performance : Should be higher than the: (1)average of LGUs with the same LGU type and income class, (2) national average of the same LGU type regardless of income class
Annual State of Local Governance Report 2011
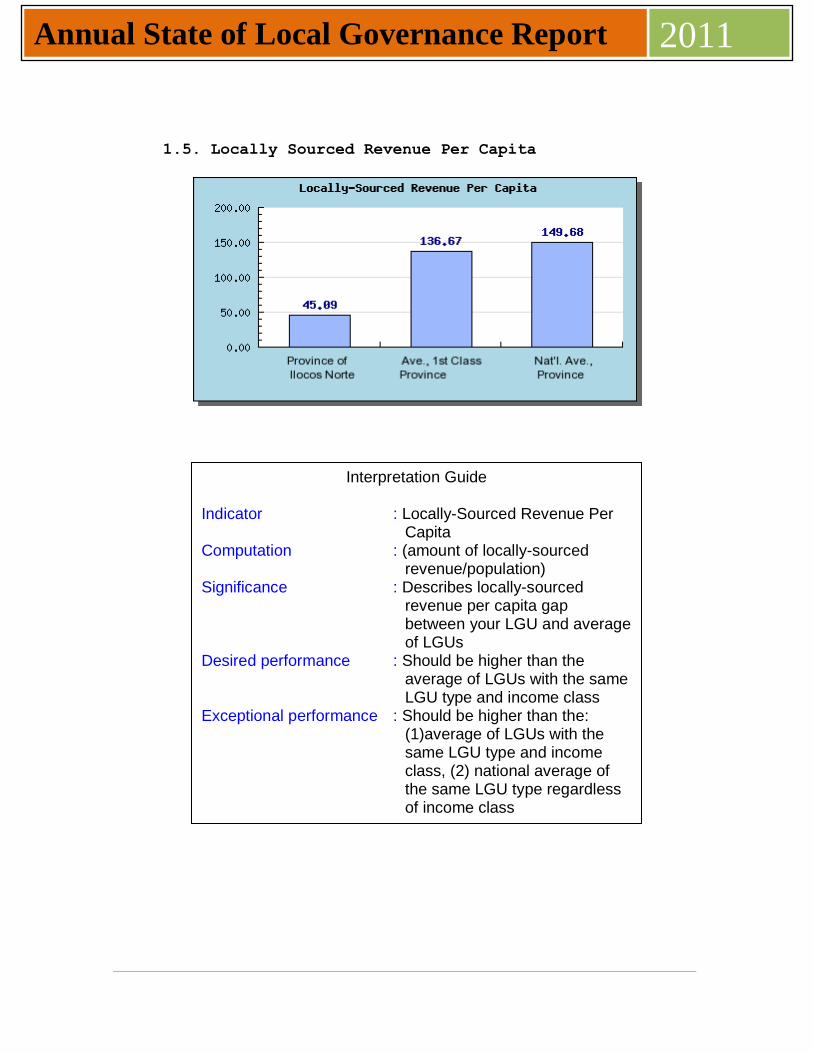
1.5. Locally Sourced Revenue Per Capita
Interpretation Guide
Indicator : Locally-Sourced Revenue Per Capita
Computation : (amount of locally-sourced revenue/population)
Significance : Describes locally-sourced revenue per capita gap between your LGU and average of LGUs
Desired performance : Should be higher than the average of LGUs with the same LGU type and income class
Exceptional performance : Should be higher than the: (1)average of LGUs with the same LGU type and income class, (2) national average of the same LGU type regardless of income class
Annual State of Local Governance Report 2011 2. RESOURCED ALLOCATION AND UTILIZATION
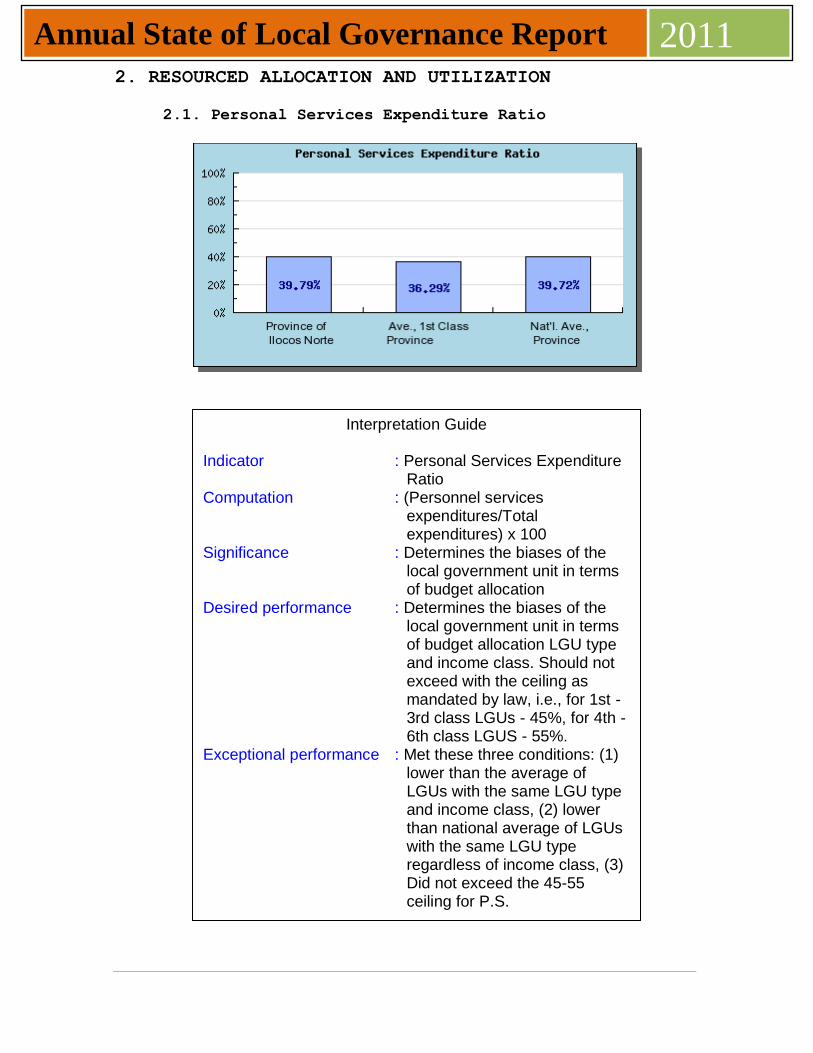
2.1. Personal Services Expenditure Ratio
Interpretation Guide
Indicator : Personal Services Expenditure Ratio
Computation : (Personnel services expenditures/Total expenditures) x 100
Significance : Determines the biases of the local government unit in terms of budget allocation
Desired performance : Determines the biases of the local government unit in terms of budget allocation LGU type and income class. Should not exceed with the ceiling as mandated by law, i.e., for 1st - 3rd class LGUs - 45%, for 4th - 6th class LGUS - 55%.
Exceptional performance : Met these three conditions: (1) lower than the average of LGUs with the same LGU type and income class, (2) lower than national average of LGUs with the same LGU type regardless of income class, (3) Did not exceed the 45-55 ceiling for P.S.
Annual State of Local Governance Report 2011
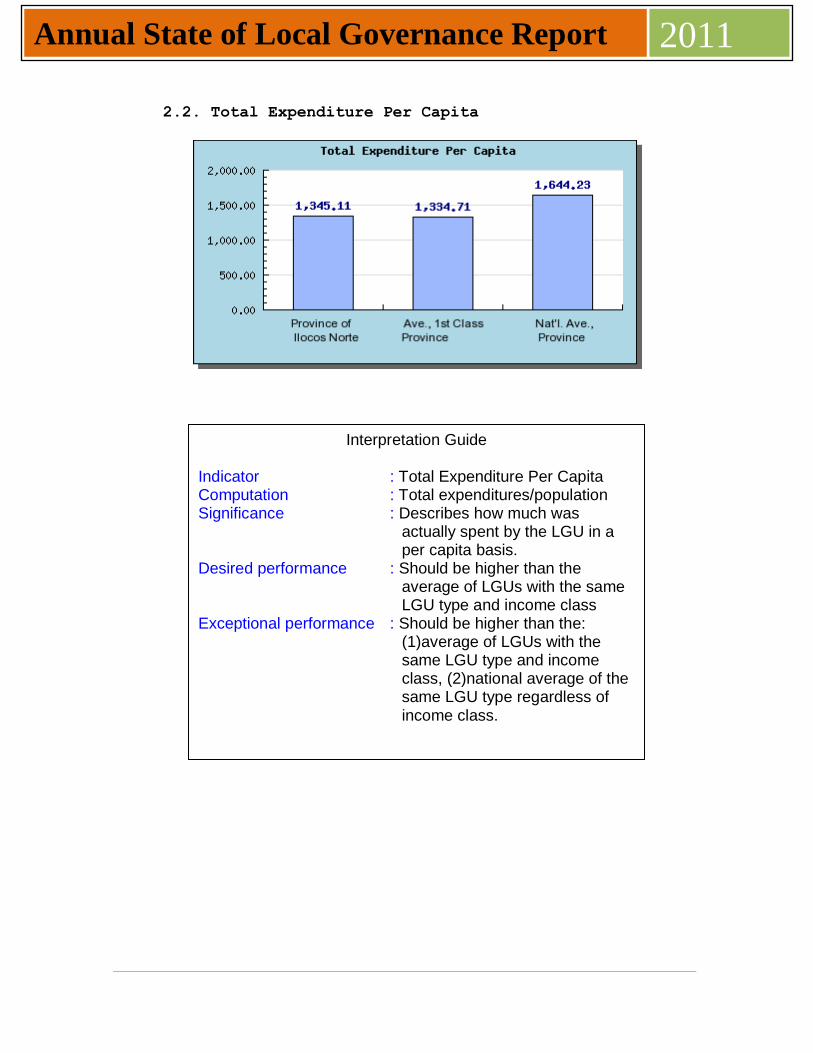
2.2. Total Expenditure Per Capita
Interpretation Guide
Indicator : Total Expenditure Per Capita Computation : Total expenditures/population Significance : Describes how much was
actually spent by the LGU in a per capita basis.
Desired performance : Should be higher than the average of LGUs with the same LGU type and income class
Exceptional performance : Should be higher than the: (1)average of LGUs with the same LGU type and income class, (2)national average of the same LGU type regardless of income class.
Annual State of Local Governance Report 2011
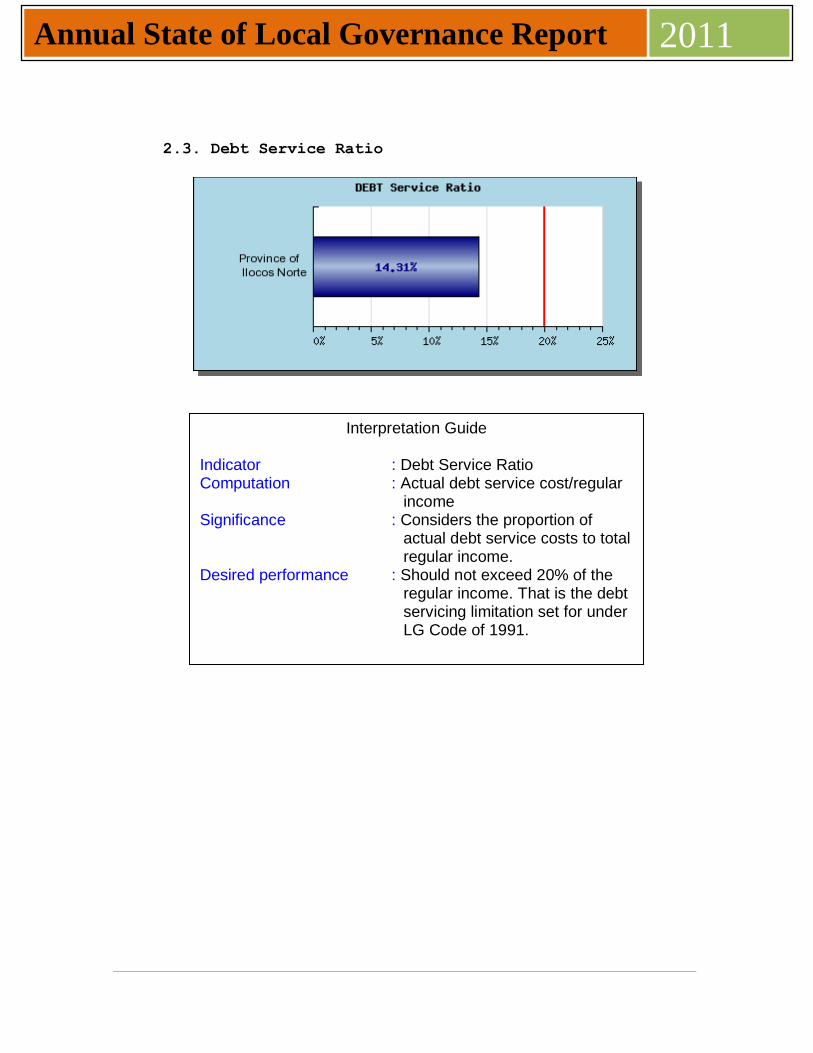
2.3. Debt Service Ratio
Interpretation Guide
Indicator : Debt Service Ratio Computation : Actual debt service cost/regular
income Significance : Considers the proportion of
actual debt service costs to total regular income.
Desired performance : Should not exceed 20% of the regular income. That is the debt servicing limitation set for under LG Code of 1991.