Filing at a Glance Schedule Item No. Schedule Item Status Exhibit Name Rule # or Page # Rate Action...
120
Filing at a Glance Companies: Chubb Indemnity Insurance Company Chubb National Insurance Company Great Northern Insurance Company Pacific Indemnity Company Vigilant Insurance Company Federal Insurance Company Product Name: Masterpiece State: Pennsylvania TOI: 04.0 Homeowners Sub-TOI: 04.0000 Homeowners Sub-TOI Combinations Filing Type: Rate/Rule Date Submitted: 12/06/2018 SERFF Tr Num: ACEH-131704470 SERFF Status: Assigned State Tr Num: State Status: Received Review in Progress Co Tr Num: 18-13556-RR Effective Date Requested (New): 04/29/2019 Effective Date Requested (Renewal): 06/13/2019 Author(s): Cindy Langston, Cindy Jacobowitz Reviewer(s): Xiaofeng Lu (primary), Michael McKenney Disposition Date: Disposition Status: Effective Date (New): Effective Date (Renewal): State Filing Description: SERFF Tracking #: ACEH-131704470 State Tracking #: Company Tracking #: 18-13556-RR State: Pennsylvania First Filing Company: Chubb Indemnity Insurance Company, ... TOI/Sub-TOI: 04.0 Homeowners/04.0000 Homeowners Sub-TOI Combinations Product Name: Masterpiece Project Name/Number: Home Rate Phase 3/18 13556 PDF Pipeline for SERFF Tracking Number ACEH-131704470 Generated 12/12/2018 02:51 PM
Transcript of Filing at a Glance Schedule Item No. Schedule Item Status Exhibit Name Rule # or Page # Rate Action...

Filing at a Glance
Companies: Chubb Indemnity Insurance CompanyChubb National Insurance CompanyGreat Northern Insurance CompanyPacific Indemnity CompanyVigilant Insurance CompanyFederal Insurance Company
Product Name: Masterpiece
State: Pennsylvania
TOI: 04.0 Homeowners
Sub-TOI: 04.0000 Homeowners Sub-TOI Combinations
Filing Type: Rate/Rule
Date Submitted: 12/06/2018
SERFF Tr Num: ACEH-131704470
SERFF Status: Assigned
State Tr Num:
State Status: Received Review in Progress
Co Tr Num: 18-13556-RR
Effective DateRequested (New):
04/29/2019
Effective DateRequested (Renewal):
06/13/2019
Author(s): Cindy Langston, Cindy Jacobowitz
Reviewer(s): Xiaofeng Lu (primary), Michael McKenney
Disposition Date:
Disposition Status:
Effective Date (New):
Effective Date (Renewal):
State Filing Description:
SERFF Tracking #: ACEH-131704470 State Tracking #: Company Tracking #: 18-13556-RR
State: Pennsylvania First Filing Company: Chubb Indemnity Insurance Company, ...
TOI/Sub-TOI: 04.0 Homeowners/04.0000 Homeowners Sub-TOI Combinations
Product Name: Masterpiece
Project Name/Number: Home Rate Phase 3/18 13556
PDF Pipeline for SERFF Tracking Number ACEH-131704470 Generated 12/12/2018 02:51 PM

General Information
Company and Contact
Project Name: Home Rate Phase 3 Status of Filing in Domicile:
Project Number: 18 13556 Domicile Status Comments:
Reference Organization: Reference Number:
Reference Title: Advisory Org. Circular:
Filing Status Changed: 12/07/2018
State Status Changed: 12/11/2018 Deemer Date:
Created By: Cindy Langston Submitted By: Cindy Langston
Corresponding Filing Tracking Number:
Filing Description:
We are filing, for your review and approval, revisions to our Masterpiece Program in Pennsylvania.
Each of the revisions submitted under this filing is explained in the Actuarial Filing Memorandum and the Description ofChange attached under Supporting Documentation. The manual pages that reflect the changes are attached in marked andfinal copy.
The effective date is April 29, 2019 for newlines and June 13, 2019 for renewals. Please contact me should you have anyquestions or require additional information. Your approval will be greatly appreciated.
Filing Contact InformationCindy Langston, State Filing Analyst III [email protected]
202 Hall's Mill Road
P.O. Box 1600
Whitehouse Station , NJ 08889
908-572-2873 [Phone]
908-572-4034 [FAX]
SERFF Tracking #: ACEH-131704470 State Tracking #: Company Tracking #: 18-13556-RR
State: Pennsylvania First Filing Company: Chubb Indemnity Insurance Company, ...
TOI/Sub-TOI: 04.0 Homeowners/04.0000 Homeowners Sub-TOI Combinations
Product Name: Masterpiece
Project Name/Number: Home Rate Phase 3/18 13556
PDF Pipeline for SERFF Tracking Number ACEH-131704470 Generated 12/12/2018 02:51 PM

Filing Company InformationChubb National InsuranceCompany
One American Square
202 N. Illinois St.
Suite 2600
Indianapolis, IN 46282
(908) 572-2000 ext. [Phone]
CoCode: 10052
Group Code: 626
Group Name: Chubb
FEIN Number: 22-3253301
State of Domicile: Indiana
Company Type: Stock
State ID Number:
Great Northern InsuranceCompany
One American Square
202 N. Illinois St.
Suite 2600
Indianapolis, IN 46282
(908) 572-2000 ext. [Phone]
CoCode: 20303
Group Code: 626
Group Name: Chubb
FEIN Number: 41-0729473
State of Domicile: Indiana
Company Type: Stock
State ID Number:
Federal Insurance Company
One American Square
202 N. Illinois St.
Suite 2600
Indianapolis, IN 46282
(908) 572-2000 ext. [Phone]
CoCode: 20281
Group Code: 626
Group Name: Chubb
FEIN Number: 13-1963496
State of Domicile: Indiana
Company Type: Stock
State ID Number:
Chubb Indemnity InsuranceCompany
55 Water Street
New York, NY 10041-2899
(908) 572-2000 ext. [Phone]
CoCode: 12777
Group Code: 626
Group Name: Chubb
FEIN Number: 22-3291862
State of Domicile: New York
Company Type: Stock
State ID Number:
Vigilant Insurance Company
55 Water Street
New York, NY 10041-2899
(908) 572-2000 ext. [Phone]
CoCode: 20397
Group Code: 626
Group Name: Chubb
FEIN Number: 13-1963495
State of Domicile: New York
Company Type: Stock
State ID Number:
Pacific Indemnity Company
Two Plaza East
Suite 1450
330 East Kilbourn Avenue
Milwaukee, WI 53202-3146
(908) 572-2000 ext. [Phone]
CoCode: 20346
Group Code: 626
Group Name: Chubb
FEIN Number: 95-1078160
State of Domicile: Wisconsin
Company Type: Stock
State ID Number:
SERFF Tracking #: ACEH-131704470 State Tracking #: Company Tracking #: 18-13556-RR
State: Pennsylvania First Filing Company: Chubb Indemnity Insurance Company, ...
TOI/Sub-TOI: 04.0 Homeowners/04.0000 Homeowners Sub-TOI Combinations
Product Name: Masterpiece
Project Name/Number: Home Rate Phase 3/18 13556
PDF Pipeline for SERFF Tracking Number ACEH-131704470 Generated 12/12/2018 02:51 PM

Filing Fees
State Specific
Fee Required? Yes
Fee Amount: $105.00
Retaliatory? Yes
Fee Explanation: Federal, Great Northern and Chubb National are domiciled in Indiana. Indiana fees are 35.00per rate/rule filing per company.
3 companies x 35.00 = $105.00
There are no filing fees for Pacific Indemnity, Vigilant, and Chubb Indemnity.
Per Company: Yes
Company Amount Date Processed Transaction #Great Northern Insurance Company $35.00 12/06/2018 152406405Chubb National Insurance Company $35.00 12/06/2018 152406685Federal Insurance Company $35.00 12/06/2018 152406686
*Filing Fee Amount: 105.00*Date Filing Fee Mailed: EFT*Filing Fee Check Number: EFT*Filing Fee Check Date: EFT*NAIC Number: 20281~ 20303~10052
SERFF Tracking #: ACEH-131704470 State Tracking #: Company Tracking #: 18-13556-RR
State: Pennsylvania First Filing Company: Chubb Indemnity Insurance Company, ...
TOI/Sub-TOI: 04.0 Homeowners/04.0000 Homeowners Sub-TOI Combinations
Product Name: Masterpiece
Project Name/Number: Home Rate Phase 3/18 13556
PDF Pipeline for SERFF Tracking Number ACEH-131704470 Generated 12/12/2018 02:51 PM

Rate Information Rate data applies to filing.
Filing Method: Prior Approval
Rate Change Type: Increase
Overall Percentage of Last Rate Revision: 0.000%
Effective Date of Last Rate Revision: 08/27/2018
Filing Method of Last Filing: Prior Approval
SERFF Tracking Number of Last Filing: ACEH131547623
Company Rate Information
Company
Name:
Overall %
Indicated
Change:
Overall %
Rate
Impact:
Written Premium
Change for
this Program:
Number of Policy
Holders Affected
for this Program:
Written
Premium for
this Program:
Maximum %
Change
(where req'd):
Minimum %
Change
(where req'd):Chubb IndemnityInsurance Company
18.300% 3.600% $244,171 1,642 $6,869,964 21.100% -6.300%
Chubb National InsuranceCompany
18.300% 7.500% $1,989,281 7,835 $26,581,877 27.300% -7.100%
Great Northern InsuranceCompany
18.300% 3.900% $1,688,890 10,234 $43,625,171 26.300% -7.200%
Pacific IndemnityCompany
18.300% 4.600% $406,865 2,667 $8,875,719 21.400% -5.800%
Vigilant InsuranceCompany
18.300% 3.800% $139,681 1,014 $3,671,317 18.200% -3.800%
Federal InsuranceCompany
18.300% 4.200% $242,592 1,940 $5,722,826 27.800% -5.900%
SERFF Tracking #: ACEH-131704470 State Tracking #: Company Tracking #: 18-13556-RR
State: Pennsylvania First Filing Company: Chubb Indemnity Insurance Company, ...
TOI/Sub-TOI: 04.0 Homeowners/04.0000 Homeowners Sub-TOI Combinations
Product Name: Masterpiece
Project Name/Number: Home Rate Phase 3/18 13556
PDF Pipeline for SERFF Tracking Number ACEH-131704470 Generated 12/12/2018 02:51 PM

Rate/Rule Schedule
Item
No.
Schedule Item
Status Exhibit Name Rule # or Page # Rate Action
Previous State
Filing Number Attachments1 Home and Contents: Rules Page 5.1 - 5.3 Replacement No State #~SERFF
#ACEH-130764825~Co #16-11049-RR
Home and Contents Rules04.29.19 FINAL.pdf
2 Home and Contents: Rules Discounts
Page 5a.1-5a.2 Replacement No State #~SERFF#ACEH131547623~Co #18-13184-RR
Home and Contents Rules –Discounts 04.29.19FINAL.pdf
3 Home and Contents: Rules Surcharges and Other RatingFactors
Page 5b.1 Replacement No State #~SERFF#CHUB-130107605~Co #15-9937-RR
Home and Contents Rules –Surcharges and and OtherRating Factors 04.29.19FINAL.pdf
4 Home and Contents: Rules Coverage Options
Page 5c.1 - 5c.3 Replacement No State #~SERFF#CHUB-130107605~Co #15-9937-RR
Home and Contents Rules –Coverage Options 04.29.19FINAL.pdf
5 Home and Contents Charts Page 7.1-7.19 Replacement No State #~SERFF#ACEH131547623~Co #18-13184-RR
Home and Contents Charts04.29.19 FINAL .pdf
SERFF Tracking #: ACEH-131704470 State Tracking #: Company Tracking #: 18-13556-RR
State: Pennsylvania First Filing Company: Chubb Indemnity Insurance Company, ...
TOI/Sub-TOI: 04.0 Homeowners/04.0000 Homeowners Sub-TOI Combinations
Product Name: Masterpiece
Project Name/Number: Home Rate Phase 3/18 13556
PDF Pipeline for SERFF Tracking Number ACEH-131704470 Generated 12/12/2018 02:51 PM

Home and Contents: Rules
04/29/19 Pennsylvania Masterpiece Manual Home and Contents: Rules Page 5.1
This manual is for policies insured with us for the applicable rates for Federal Insurance Company, Chubb Indemnity Insurance Company, Chubb National Insurance Company, Great Northern Insurance Company, Pacific Indemnity Company, and Vigilant Insurance Company.
Eligibility All homes, except city homes, must be used as one−family or two−family residences. A city home must be an owner occupied rowhouse with no more than one rental unit and must meet all of the following criteria: masonry construction built prior to 1940 renovated plumbing, heating and electrical systems. Contents coverage may be written for the owner occupied unit only. A vacation home must be an owner occupied house, other than a primary residence, but may be rented to others for up to 15 days in any given policy term.
Contents coverage may be written for a house owned by the insured only if house coverage is included in the policy.
Coverage options Property covered
Types of coverage
Payment basis (loss settlement)
House (dwelling only)
Deluxe (all risk) City home house (all risk) Vacation home (all risk)
Extended replacement cost, verified replacement cost or conditional replacement cost
Contents (with Deluxe house)
Deluxe (all risk) Standard (named perils) Fire (named perils, without theft)
Replacement cost or actual cash value Replacement cost or actual cash value Actual cash value
Contents (with City home house)
City home contents (all risk)
Replacement cost or actual cash value
Contents (with Vacation home house)
Deluxe (all risk) Standard (named perils)
Replacement cost or actual cash value
Contents (Condominium, Cooperative, or Renters)
Deluxe (all risk) Standard (named perils)
Replacement cost or actual cash value

Home and Contents: Rules
04/29/19 Pennsylvania Masterpiece Manual Home and Contents: Rules Page 5.2
Minimum amount These are the minimum amounts of coverage: Deluxe house or vacation home house amount with or without contents: $ 50,000 City home house amount with city home contents: $400,000* City home house amount without contents: $400,000** Condominium or cooperative: $ 15,000 Renters: $ 15,000 * City home contents coverage may not be less than 10% of City home house coverage. ** City home house without contents is only available if the renovation surcharge applies (house is being rebuilt/course of construction).
Base premium determination (not applicable to City home house) The base premium is calculated for:
$100,000 house coverage insured on an extended replacement cost basis, (or $40,000 condominium, cooperative, or renters contents coverage insured on a replacement cost basis);
$50,000 contents coverage insured on a replacement cost basis (for a Deluxe house with Deluxe or Standard contents coverage only);
$30,000 contents coverage insured on a replacement cost basis (for a vacation home house with deluxe or standard contents coverage only);
$20,000 other permanent structures coverage for a deluxe house or $10,000 other permanent structures coverage for a vacation home house (or $4,000 additions and alterations coverage for a condominium, cooperative, or renters);
$50,000 personal liability coverage; and
$500 deductible.
Fire protection The fire protection factor (not applicable to City home house) and fire protection code is determined by the type of coverage for the residence, the distance a fire hydrant or fire station is from the residence and whether the residence has a central station or direct reporting fire alarm. In lieu of a fire protection factor, a separate discount is available for fire protection if a city home has a direct or central station reporting fire alarm.
Value factor (not applicable to City home house) The value factor is determined by using the type of coverage for the location, the fire protection code, and the value of the building or contents. For a house, use the value of the highest valued building at the location (excluding contents) to determine the coverage amount. For a condominium, cooperative, or rental unit, use the value of contents to determine the amount of coverage.
Deductibles All homes and contents coverages must have the same deductible. If a policy has a deductible higher than $50,000, the deductible waiver will not apply. The following flat deductibles are available: $250 $500 $1,000 $2,500 $5,000 $7,500 $10,000 $25,000 $50,000 $100,000
Underinsured houses If a house is not insured to at least 90% of the amount of coverage we recommend, the payment basis will be conditional replacement cost. There is an undervalue surcharge when coverage is below 80% of the amount of coverage we recommend.

Home and Contents: Rules
04/29/19 Pennsylvania Masterpiece Manual Home and Contents: Rules Page 5.3
Renovated or newly constructed houses If new construction of a house or other permanent structures or additions, alterations or renovations to the existing house or other permanent structures occurs, the company must be notified.
Vacant houses If an insured house will be vacant (substantially empty of furnishings and contents) for more than 30 days, the company must be notified.
Personal liability Liability is rated in the state where the Primary residence (first location with liability) is located regardless of the location of any additional residence(s). If liability is not requested, we apply a discount for each location that building and/or contents coverage is provided.
Tiering The rating tier is determined at new line only and is based upon characteristics of the risk. Information including, but not limited to, the residence type, construction year, size of risk, losses, and insurance score is utilized to determine the rating tier.

Home and Contents: Rules – Discounts
04/29/19 Pennsylvania Masterpiece Manual Home and Contents: Rules – Discounts Page 5a.1
Applicable to house and contents, condominium, cooperative, and renters The following discounts are applied to house and contents, condominium, cooperative and renters coverage, if applicable. Burglar alarm – Applicable if the residence has a central station or direct reporting theft or burglar alarm. This discount is
not applicable to Deluxe house without contents or with fire contents. Fire resistive – Applicable if the house or the unit is in a building where exterior walls, floors, and roof are built of masonry
or other fire resistive materials with a rating of two hours or more. Suburban rating (not applicable to city homes) – Applicable to a residence if the following conditions are met:
the residence is within 3 miles of the first responding fire department which: has at least 2 pumpers; and brings at least 6,000 gallons of water; or brings at least 4,000 gallons of water and has dual response or mutual aid agreement(s) with fire department(s)
within 5 miles of the residence which will supply an additional 2,000 gallons of water; and the ISO protection class is not greater than 9. Gated community (not applicable to city homes) – Applicable if the residence is located in a gated community. A
residence is in a gated community if:
vehicle access is limited to entrances controlled by guards or locked gates at all times;
proper identification is required to enter; and
visitors are announced. This discount is not intended for high rise buildings. Gated community patrol service (not applicable to city homes) – Applicable if the residence in the gated community has
a fire and burglar alarm that when activated, alerts the community’s 24-hour patrol service to dispatch a guard to the residence. Premier client – Applicable in one of two ways, based on either customer tenure or risk tenure:
customer tenure - applied for a new location if the insured has another location insured by us for three or more consecutive years. The discount will apply to the new location for the first three policy terms. Once a location has a risk tenure of three years or more, the discount will be based on the risk tenure provided we did not pay any property claims for that location; or
risk tenure - applied for each location insured by us for three or more consecutive years that we did not pay any property claims for that location within the last three years. If a claim we paid is reimbursed in full through salvage and/or subrogation, that claim may be waived when determining eligibility for this discount. This discount is not applied if we paid any property claims for a location due to a loss caused by a catastrophe.
Portfolio discount – home with valuable articles – (not applicable to vacation home house) Applicable for a primary,
owner-occupied house, condominium,cooperative or a primary occupied rental unit when valuable articles coverage, meeting certain eligibility (see Charts section), is written on the same policy at the same location. Portfolio discount – home with auto – Applicable for a residence, if the residence is not seasonal, secondary or rented
to others, listed on the policy when the insured has a good standing active Masterpiece automobile policy with us. If the residence is a house, the house must have contents coverage listed on the policy. A city home may have up to one rental unit and still qualify for this discount. The automobile policy must have at least one private passenger vehicle with physical damage coverage garaged in the state of Pennsylvania at that location. Payment history – Applicable for a residence when the insured has paid the premium in full at least two years within the
past five years. Lien free (not applicable to renters) – Applicable if the residence has no mortgage or lien. This discount is not applied
if the residence is vacant, under the course of construction or rented to others.
Applicable to house and contents only The following additional discounts are applied to house and contents coverage, if applicable. Residential sprinkler system – Applicable if the living areas, basement and heating system area have an approved and
properly maintained sprinkler system. New house (not applicable to city homes) – Applicable if the house was built within the last fifteen years. Renovated house (not applicable to city homes) – Applicable if the house was renovated within the last six years. If this
renovated house discount applies, the new house discount cannot. To qualify as renovated, the plumbing and heating systems and the electrical system must have been completely upgraded including new wiring, receptacles, circuit boxes and conduits in exposed areas. The renovation must have been inspected and approved by licensed civil authorities in compliance with the local building codes. Superior protection (not applicable to city homes) – Applicable if one or more of the protection characteristics on the
superior protection discount chart apply.

Home and Contents: Rules – Discounts
04/29/19 Pennsylvania Masterpiece Manual Home and Contents: Rules – Discounts Page 5a.2
Applicable to City home house and City home contents The following additional discounts are applied to City home house and City home contents coverage, if applicable. Temperature monitoring system – Applicable if the city home has a temperature monitoring system which reports
directly into a central station or direct fire alarm. Restoration – Applicable if the city home underwent restoration of its plumbing or electrical systems,
heating/A.C./ventilating system, or its roof or façade repointing within the last ten years.
Applicable to condominium, cooperative, and renters The following additional discounts are applied to condominium, cooperative, and renters coverage, if applicable. Building security protection – Applicable to a condominium, cooperative, or rental unit meeting all of the following
criteria:
building entrances are at all times:
manned; or
locked and secured by a central station or direct reporting burglar alarm;
visitors are announced; and
elevators are either manned or key controlled or must be accessed through a locked door. Building fire protection – Applicable to a condominium, cooperative, or rental unit meeting all of the following criteria:
approved and properly maintained sprinkler systems have been installed throughout the building; and
common areas have a central station or direct reporting fire alarm or fire alarm which alerts the building security staff.

Home and Contents: Rules – Surcharges and Other Rating Factors
04/29/19 Pennsylvania Masterpiece Manual Home and Contents: Rules – Surcharges and Page 5b.1 Other Rating Factors
Applicable to house and contents, condominium, cooperative, and renters The following surcharges are applied to house and contents, condominium, cooperative, and renters coverage, if applicable. Claims rating factor – Applicable for each residence based on claims paid by us to an insured or on behalf of an insured.
The surcharge is based on the amount of house coverage or contents and additions and alterations coverage and the number of non-catastrophe claims if paid within the last three years for houses. This factor will be applied to each policy period for the three years after a payment for a claim has been paid. We may waive this surcharge if any claim has been reimbursed in whole through salvage or subrogation. Cancellation surcharge – Applicable for each residence that has its insurance cancelled by us for non-payment of
premium within the last three years on or after 12/07/2015. Rented to others (not applicable to city homes) – Applicable if the residence is rented to others by the insured. A home
does not qualify for the Vacation Home program if it is rented for more than 15 days in any given policy term.
Applicable to house and contents only The following additional surcharges are applied to house and contents coverage, if applicable. Vacation home house nonoccupancy – Applicable if a vacation home house is unoccupied for more than 90 consecutive
days in any given policy term. This surcharge does not apply if: there is a full time caretaker or equivalent service with an established maintenance company, or other full time non-rental
occupancy during the owner’s absence; or the house is located in a community with guard service; or the house is protected by central station or direct reporting fire and burglar alarm systems, and the responding fire and
police departments are within 5 miles of the house. Undervalue surcharge – Applicable for each 10% of coverage (or fraction) below 80% of the amount of coverage we
recommend. In this case, the payment basis for a house will be conditional replacement cost. This surcharge will be applied by the company. Renovation or construction (not applicable to city homes) - There is a surcharge during new construction of a house or
other permanent structures, or during construction of additions, alterations or renovations to an existing house or other permanent structures. The surcharge that applies is based on the extent of the construction or renovation – see the construction categories of “Minor” or “Major” in the Charts section. This surcharge will be removed when construction is completed, the house is owner occupied (applicable if the owner relocated during construction), and the amount of coverage has been adjusted to reflect the proper restoration cost. A Vacant house surcharge will also apply if the house is vacant for more than 30 days. This surcharge will be applied by the company. Vacant house – Applicable for a house with deluxe house coverage or City home house coverage that is vacant for more
than 30 days. A renovation or construction surcharge (deluxe house coverage) or renovation surcharge (City home house coverage) may also apply if construction is in progress. A home does not qualify for the Vacation Home program if it is vacant. This surcharge will be applied by the company.
Applicable to City home house and City home contents The following additional surcharges are applied to City home house and City home contents coverage, if applicable. Rental unit – Applicable if a unit in a city home is rented to others by the insured. A home does not qualify for the City
Home program if it has more than one rental unit or if it is not owner occupied. Renovation – There is a surcharge during construction of additions, alterations or renovations to the city home or other
permanent structures. The surcharge that applies is based on the extent of the construction or renovation – see the construction categories of “Minor” or “Major” in the Charts section. This surcharge will be removed when construction is completed, the city home is again owner occupied (applicable if the owner relocated during construction), and the amount of coverage has been adjusted to reflect the proper restoration cost. A Vacant house surcharge will also apply if the city home is vacant for more than 30 days. This surcharge will be applied by the company.

Home and Contents: Rules – Coverage Options
04/29/19 Pennsylvania Masterpiece Manual Home and Contents: Rules – Coverage Options Page 5c.1 .
Mold remediation expenses Mold remediation expense coverage is available in increments of 10%, 25%, 50%, 75% and 100% of the amount of coverage for the house or, if a condominium, cooperative or renters, the combined amount of coverage for contents and additions and alterations. This coverage is in addition to the $10,000 of mold remediation expense coverage provided in the policy. Mold remediation expense coverage also includes temporary relocation expenses, which is 20% of the amount of mold remediation expense coverage. The home and contents base deductible applies to mold remediation expenses but not to temporary relocation expenses.
Requests to add or increase to a higher increment of mold remediation expense coverage can only be made at new line inception or upon renewal and will be subject to underwriting acceptance. The amount of mold remediation expense coverage can be reduced to a lower increment or to $10,000 (the amount of coverage provided in the policy) at any time.
Sinkhole collapse coverage Sinkhole collapse coverage is available for an extra charge in:
Deluxe house coverage when Deluxe contents coverage or no contents coverage is purchased, City home house coverage when City home contents coverage or no contents coverage is purchased, or Vacation home house coverage when Deluxe contents coverage is purchased.
The amount of coverage available is equal to the house amount.
Earthquake coverage Type of coverage Earthquake
Deluxe house, City home house, and Vacation home house
Available*
Deluxe contents, condominium, cooperative, and renters, and City home contents
Included**
Standard contents, condominium, cooperative, and renters
Not available
Fire contents Not available
*Earthquake coverage must meet our underwriting guidelines and is only available, for an extra charge in:
Deluxe house coverage when Deluxe contents coverage or no contents coverage is purchased, City home house coverage when City home contents coverage or no contents coverage is purchased, or Vacation home house coverage when Deluxe contents coverage is purchased.
The deductible for earthquake coverage is 2% of the amount of coverage. **Earthquake coverage is not automatically included for deluxe contents with vacation home house coverage. This coverage is only included when earthquake coverage for Vacation home house is chosen.
Payment basis for other permanent structures If the payment basis for the house and other permanent structures is Extended replacement cost and the amount of coverage for other permanent structures is reduced to less than 20% of the amount of coverage for the house (Deluxe house coverage or City home house coverage applies) or is reduced to less than 10% of the amount of coverage for the house (Vacation home house coverage applies), Extended replacement cost payment basis is limited for other permanent structures. We will pay up to 25% more than the amount of coverage for other permanent structures, if necessary, for the reconstruction of other permanent structures subject to all other terms and conditions.
Homeowner or Unit assessments The premium for deluxe house, vacation home house, city home house, condominiums and cooperatives automatically includes coverage for homeowner/unit assessments of $50,000, but not more than $5,000 for any assessment that results from a deductible in the homeowner, condominium or cooperative association’s insurance. Homeowner assessments coverage (for any type of house) and Unit assessments coverage (for any type of condominium or cooperative), can be increased in two ways:
the assessments coverage can be increased in increments of $1,000; and/or
the amount of coverage for any assessment that results from a deductible in the homeowners, condominium, or cooperative association’s insurance can be increased in increments of $1,000, not to exceed the amount of coverage for assessments.

Home and Contents: Rules – Coverage Options
04/29/19 Pennsylvania Masterpiece Manual Home and Contents: Rules – Coverage Options Page 5c.2 .
Landscaping The premium for deluxe house and vacation home house automatically includes coverage for landscaping of 5% of the amount of house coverage, but not more than $10,000 for any one tree, shrub or plant. The premium for condominiums, cooperatives and renters automatically includes coverage for landscaping of 10% of the amount of contents coverage, but not more than $10,000 for any one tree, shrub or plant. Landscaping can be increased in two ways:
the percentage amount of landscaping coverage can be incrementally increased up to the amount of coverage for the house, or the amount of contents for a condominium, cooperative, or rental unit; and/or
the amount of coverage per tree, shrub or plant can be increased up to the total amount of coverage for landscaping coverage.
In addition, the following perils can be added to landscaping coverage:
wind and hail, and/or
sleet and weight of ice or snow.
City garden coverage The premium for city home house automatically includes coverage for city gardens of 5% of the amount of house coverage, but not more than $10,000 for any one tree, shrub or plant. City garden coverage can be increased in two ways: the percentage amount of city garden coverage can be incrementally increased up to the amount of coverage for the city home house; and/or the amount of coverage per tree, shrub or plant can be increased up to the total amount of coverage for city garden coverage. In addition, the following perils can be added to city garden coverage: wind and hail, and/or sleet and weight of ice and snow.
Business property The premium for contents automatically includes coverage for $25,000 of business property. The amount of on-premises business property can be increased in increments of $1,000 up to the amount of contents coverage on the policy. GreenWise
® upgrade coverage
GreenWise upgrade coverage is available for Deluxe house, City home house or Vacation home house coverage if the payment basis is extended replacement cost or verified replacement cost, and for condominium and cooperative coverage if the payment basis is replacement cost. However, GreenWise upgrade coverage does not apply to personal property (contents) under fire contents coverage. GreenWise upgrade coverage is available in increments of 10%, 25%, 50%, 75% and 100% of the amount of coverage for the house or, if condominium or cooperative, the combined amount of coverage for contents and additions and alterations. GreenWise upgrade coverage is not available for a condominium or cooperative if the amount of coverage for additions and alterations has been reduced to zero. If GreenWise upgrade coverage applies to a location that also has earthquake coverage, then earthquake coverage will apply to GreenWise upgrade coverage and a higher earthquake premium will apply.
Student additional living expenses coverage Student additional living expenses coverage includes student additional living expenses and extra tuition expenses. The minimum amount of student additional living expenses coverage that can be added to a policy is $5,000. The home and contents deductible does not apply to this coverage. This coverage cannot be added to house coverage without contents coverage or to Vacation home house coverage.
Assisted living care Assisted living care coverage includes coverage for contents of a relative-in-care, additional living expenses for the relative-in-care, and personal liability coverage, if personal liability coverage is on the policy. The minimum amount of contents for a relative-in-care that can be added to a policy is $5,000. A deductible of $500 applies to contents of a relative-in-care. This coverage is always rated at one residence regardless of the number of residences on the policy. This coverage cannot be added to house coverage with fire contents coverage or with no contents coverage or to Vacation home house coverage.

Home and Contents: Rules – Coverage Options
04/29/19 Pennsylvania Masterpiece Manual Home and Contents: Rules – Coverage Options Page 5c.3 .
Employment practices liability coverage Employment practices liability coverage includes coverage for employment practices liability and reputational injury. Employment practices liability coverage is only available on a policy with a personal liability limit of $1,000,000 or greater. The coverage is always rated at one residence regardless of the number of residences on the policy. A deductible applies to Employment practices liability. No deductible applies to Reputational injury.
Family Protection SM Coverage Family Protection Coverage is always rated at one residence regardless of the number of residences on the policy. The home and contents deductible does not apply to this coverage.

Home and Contents: Charts
04/29/19 Pennsylvania Masterpiece Manual Home and Contents: Charts Page 7.1
Base premium chart (not applicable to City home house)
Type of coverage
Base premium
Deluxe house/Vacation home house $ 1,318
Condominium/Cooperative $ 278
Renters $ 288
Coverage type chart (not applicable to City home house)
Coverage Factor
Deluxe house/deluxe contents 1.100
Deluxe house/standard contents 1.000
Deluxe house without contents or with fire contents* 0.750
Vacation home house with deluxe contents 0.990
Vacation home house with standard contents 0.900
Deluxe condominium or cooperative 1.350
Standard condominium or cooperative 1.000
Deluxe renters 1.350
Standard renters 1.000
*There is an additional charge for Fire contents coverage.
City home house base premium chart
Writing Company
Type of coverage
Rate per $100 all territories
Federal Insurance Company, Vigilant Insurance Company, Pacific Indemnity Company
City home house $ 0.312
Great Northern Insurance Company, Chubb Indemnity Insurance Company, Chubb National Insurance Company
City home house $ 0.294
Other permanent structures adjustment - City home house
For each 1% above 20% of house coverage: For each 1% below 20% of house coverage:
0.50% -0.25%
Sinkhole collapse coverage If sinkhole collapse coverage is requested for a house, the factor is 20%.

Home and Contents: Charts
04/29/19 Pennsylvania Masterpiece Manual Home and Contents: Charts Page 7.2
Discount Writing Company Charts (not applicable to City home house)
Deluxe house/ vacation home
house
Condominium or
cooperative
Renters
Vigilant Insurance Company 0.800 0.900 0.900
Pacific Indemnity Company 0.712 0.900 0.900
Great Northern Insurance Company, Chubb National Insurance Company, Chubb Indemnity Insurance Company
0.663 0.850 0.850
Territory relativity chart (not applicable to City home house)
Territory
Deluxe house/vacation
home house
Condominium or
cooperative
Renters
001 1.000 1.000 1.000
005 0.720 0.519 0.519
006 0.537 0.519 0.519
007 0.512 0.519 0.519
008 0.720 0.519 0.519
009 0.756 0.519 0.519
010 0.611 0.549 0.549
012 0.537 0.519 0.519
014 1.000 1.000 1.000
021 0.676 0.549 0.549
022 0.537 0.519 0.519
023 0.512 0.519 0.519
024 0.676 0.549 0.549
025 0.512 0.519 0.519
027 0.512 0.519 0.519
031 0.570 0.519 0.519
035 0.676 0.610 0.610
037 0.756 0.519 0.519
051 0.697 0.519 0.519
052 0.697 0.519 0.519
053 0.611 0.549 0.549
054 0.720 0.519 0.519
055 0.675 0.549 0.549
056 0.756 0.519 0.519
057 0.676 0.549 0.549
058 0.570 0.519 0.519
059 0.570 0.519 0.519
061 0.611 0.549 0.549
071 0.611 0.549 0.549
073 0.685 0.519 0.519
074 0.675 0.549 0.549
075 0.697 0.519 0.519
076 0.629 0.610 0.610
077 0.697 0.519 0.519
081 0.697 0.519 0.519
082 0.697 0.519 0.519
083 0.707 0.747 0.747
086 0.910 0.747 0.747
087 0.756 0.519 0.519
088 0.697 0.519 0.519
089 0.720 0.519 0.519
090 0.537 0.519 0.519
091 0.697 0.519 0.519
092 0.715 0.549 0.549

Home and Contents: Charts
04/29/19 Pennsylvania Masterpiece Manual Home and Contents: Charts Page 7.3
Territory relativity chart (not applicable to City home house) (continued)
Territory
Deluxe house/vacation
home house
Condominium or
cooperative
Renters
093 0.720 0.519 0.519
094 0.697 0.519 0.519
095 0.863 0.747 0.747
096 0.697 0.519 0.519
099 0.611 0.549 0.549
100 0.512 0.519 0.519
101 0.910 0.747 0.747
102 0.611 0.549 0.549
104 0.697 0.610 0.610
105 0.697 0.610 0.610
106 0.697 0.610 0.610
107 0.697 0.833 0.833
108 0.697 0.833 0.833
109 0.697 0.610 0.610
110 0.674 0.610 0.610
111 0.697 0.610 0.610
112 0.697 0.610 0.610
113 0.697 0.610 0.610
114 0.697 0.833 0.833
115 0.674 0.610 0.610
116 0.697 0.610 0.610
117 0.697 0.610 0.610
119 0.697 0.610 0.610
120 0.674 0.610 0.610
121 0.697 0.610 0.610
122 0.697 0.833 0.833
123 0.697 0.610 0.610
124 0.697 0.610 0.610
125 0.697 0.610 0.610
126 0.697 0.833 0.833
127 0.697 0.610 0.610
128 0.697 0.610 0.610
129 0.697 0.610 0.610
130 0.697 0.610 0.610
131 0.697 0.610 0.610
132 0.863 0.747 0.747
133 0.705 0.747 0.747
134 0.753 0.519 0.519
135 0.835 0.747 0.747
136 0.836 0.747 0.747
137 0.753 0.519 0.519
138 0.703 0.747 0.747
139 0.629 0.610 0.610
140 0.863 0.747 0.747
141 0.837 0.747 0.747

Home and Contents: Charts
04/29/19 Pennsylvania Masterpiece Manual Home and Contents: Charts Page 7.4
Coverage adjustments charts
Contents adjustment Additional deluxe or standard contents purchased:
Factor
For each 1% of contents above 50% of deluxe house coverage
0.50%
For each 1% of contents above 30% of vacation home house coverage
0.50%
Reduced deluxe or standard contents purchased:
Factor
For each 1% of the first 10% contents below 50% of deluxe house coverage
-0.35%
For each 1% of contents below 40% of deluxe house coverage
-0.25%
For each 1% of contents below 30% of vacation home house coverage
-0.25%
For deluxe house the only contents value available below 5% is zero. For vacation home house the contents cannot be reduced below 5%. Fire contents (not applicable to City home house). For every 1% of house coverage that is requested for the fire
contents amount, the factor is 0.45%
City home contents Writing Company
Amount of coverage
Rate per $100 all territories
Federal Insurance Company, Vigilant Insurance Company, Pacific Indemnity Company
50% or more of house coverage $ 0.317
40%-49% of house coverage $ 0.370
30%-39% of house coverage $ 0.423
20%-29% of house coverage $ 0.475
10%-19% of house coverage $ 0.529
Great Northern Insurance Company, Chubb Indemnity Insurance Company, Chubb National Insurance Company
50% or more of house coverage $ 0.298
40%-49% of house coverage $ 0.348
30%-39% of house coverage $ 0.396
20%-29% of house coverage $ 0.457
10%-19% of house coverage $ 0.497
Other permanent structures adjustment For each 1% above 20% of deluxe house coverage and above 10% of vacation home house coverage:
For each 1% below 20% of deluxe house coverage and below 10% of vacation home house coverage:
0.50% -0.25%

Home and Contents: Charts
04/29/19 Pennsylvania Masterpiece Manual Home and Contents: Charts Page 7.5
Additions and alterations adjustment
Additional additions and alterations coverage purchased:
For each 1% above 10% of additional additions and alterations coverage purchased:
First 20% 0.50%
Additional 20%+ 0.53%
Reduced additions and alterations coverage purchased. For every 1% of additions and alterations coverage below
10% of contents coverage, the factor is -0.50%.
Actual cash value adjustment
Actual cash value discount
Apply if actual cash value payment basis applies in lieu of replacement cost payment basis
Deluxe house/ vacation home house with deluxe or standard contents
City home house with City home contents
Condominium, cooperative, or renters
10% 10% 23%
Mold remediation expenses chart
Mold remediation expenses coverage
House Condominiums, cooperatives, or renters
Percentage of house coverage
Surcharge
Percentage of combined amount of contents and additions and alterations
Surcharge
10% 28% 10% 14% 25% 36% 25% 18% 50% 44% 50% 22% 75% 52% 75% 26% 100% 60% 100% 30%
GreenWise upgrade coverage - houses
Percentage of house coverage
Surcharge
10% 1%
25% 2%
50% 3%
75% 4%
100% 5%
GreenWise upgrade coverage – condominium or cooperatives
Percentage of combined amount of contents and additions and alterations
Surcharge
10% 1%
25% 2%
50% 3%
75% 4%
100% 5%
Home and Contents: Charts
04/29/19 Pennsylvania Masterpiece Manual Home and Contents: Charts Page 7.6
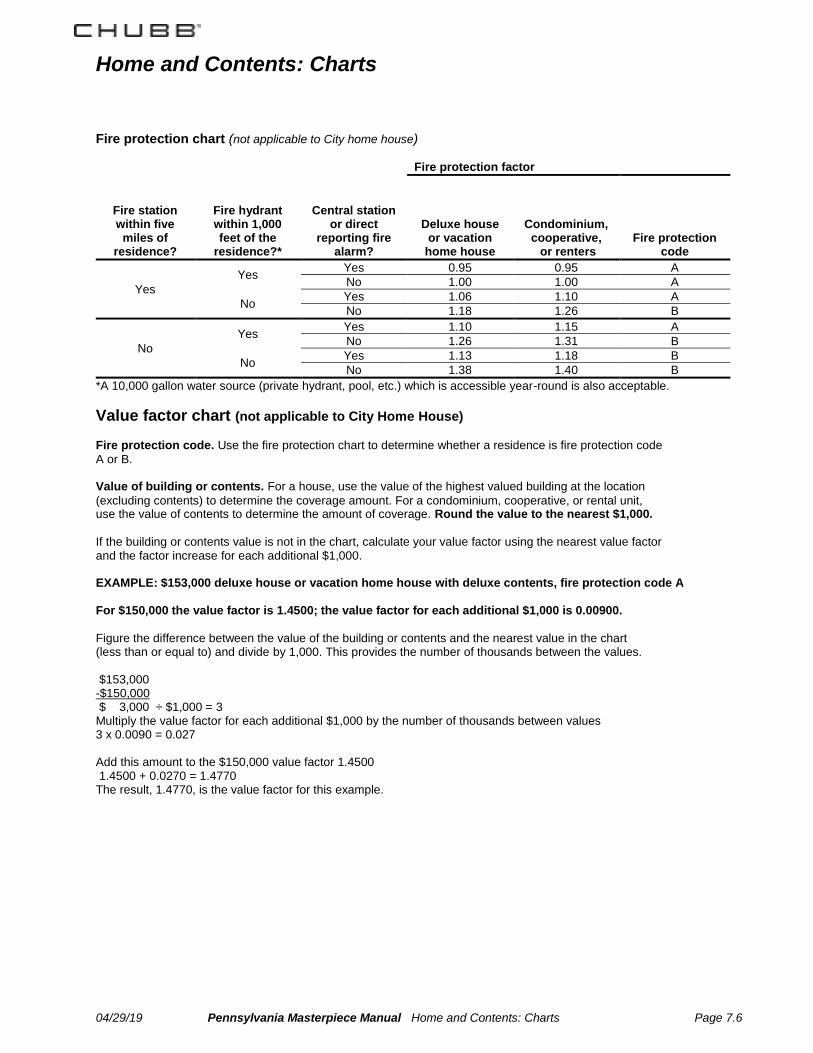
Fire protection chart (not applicable to City home house)
Fire protection factor
Fire station within five
miles of residence?
Fire hydrant within 1,000 feet of the
residence?*
Central station or direct
reporting fire alarm?
Deluxe house or vacation
home house
Condominium, cooperative, or renters
Fire protection code
Yes
Yes Yes 0.95 0.95 A
No 1.00 1.00 A
No Yes 1.06 1.10 A
No 1.18 1.26 B
No
Yes Yes 1.10 1.15 A
No 1.26 1.31 B
No Yes 1.13 1.18 B
No 1.38 1.40 B
*A 10,000 gallon water source (private hydrant, pool, etc.) which is accessible year-round is also acceptable.
Value factor chart (not applicable to City Home House) Fire protection code. Use the fire protection chart to determine whether a residence is fire protection code
A or B. Value of building or contents. For a house, use the value of the highest valued building at the location
(excluding contents) to determine the coverage amount. For a condominium, cooperative, or rental unit, use the value of contents to determine the amount of coverage. Round the value to the nearest $1,000.
If the building or contents value is not in the chart, calculate your value factor using the nearest value factor and the factor increase for each additional $1,000. EXAMPLE: $153,000 deluxe house or vacation home house with deluxe contents, fire protection code A For $150,000 the value factor is 1.4500; the value factor for each additional $1,000 is 0.00900.
Figure the difference between the value of the building or contents and the nearest value in the chart (less than or equal to) and divide by 1,000. This provides the number of thousands between the values. $153,000 -$150,000 $ 3,000 ÷ $1,000 = 3 Multiply the value factor for each additional $1,000 by the number of thousands between values 3 x 0.0090 = 0.027 Add this amount to the $150,000 value factor 1.4500 1.4500 + 0.0270 = 1.4770 The result, 1.4770, is the value factor for this example.

Home and Contents: Charts
04/29/19 Pennsylvania Masterpiece Manual Home and Contents: Charts Page 7.7
Value factor chart
(continued)
Deluxe house or vacation home house
Fire protection code A Fire protection code B
Value of building Value factor Each additional $1,000 Value factor Each additional $1,000
$ 50,000 0.5000 0.01000 0.5000 0.01000
$ 55,000 0.5500 0.01000 0.5500 0.01000
$ 60,000 0.6000 0.01000 0.6000 0.01000
$ 65,000 0.6500 0.01000 0.6500 0.01000
$ 70,000 0.7000 0.01000 0.7000 0.01000
$ 75,000 0.7500 0.01000 0.7500 0.01000
$ 80,000 0.8000 0.01000 0.8000 0.01000
$ 85,000 0.8500 0.01000 0.8500 0.01000
$ 90,000 0.9000 0.01000 0.9000 0.01000
$ 95,000 0.9500 0.01000 0.9500 0.01000
$ 100,000 1.0000 0.00900 1.0000 0.01126
$ 150,000 1.4500 0.00900 1.5630 0.01126
$ 250,000 2.3500 0.00760 2.6890 0.00950
$ 500,000 4.2500 0.00700 5.0640 0.00876
$ 700,000 5.6500 0.00600 6.8160 0.00750
$ 1,000,000 7.4500 0.00600 9.0660 0.00750
$ 1,500,000 10.4500 0.00600 12.8160 0.00750
$ 3,000,000 19.4500 0.00620 24.0660 0.00776
$ 5,000,000 31.8500 0.00640 39.5860 0.00800
$ 7,500,000 47.8500 0.00640 59.5860 0.00800
$10,000,000 63.8500 0.00640 79.5860 0.00800
$20,000,000+ 127.8500 0.00640 159.5860 0.00800
Condominium, cooperative, or renters
Fire protection codes A and B
Value of contents
Value factor
Each additional $1,000
$ 15,000 0.3550 0.02580
$ 30,000 0.7420 0.02580
$ 40,000 1.0000 0.02800
$ 150,000 4.0800 0.02580
$ 1,000,000 26.0100 0.02580
$ 1,500,000 38.9100 0.02580
$ 3,000,000 77.6100 0.02580
$ 5,000,000 129.2100 0.02580

Home and Contents: Charts
04/29/19 Pennsylvania Masterpiece Manual Home and Contents: Charts Page 7.8
Deductible factor charts
Deluxe house, Vacation home house, Condominium, Cooperative, or Renters:
Deluxe House, Vacation Home House
Base deductible
Value of building
$250 $500 $1,000 $2,500 $5,000 $7,500 $10,000 $25,000 $50,000 $100,000
$ 15,000 1.150 1.050 0.900 0.735 0.600 0.550 0.500 0.450 0.400 0.300
$ 50,000 1.150 1.050 0.900 0.735 0.600 0.550 0.500 0.450 0.400 0.300 $ 500,000 1.150 1.050 0.900 0.735 0.600 0.550 0.500 0.450 0.400 0.300 $ 1,000,000 1.200 1.150 0.950 0.800 0.625 0.550 0.520 0.450 0.400 0.330 $ 2,500,000 1.200 1.150 1.100 0.835 0.750 0.650 0.545 0.490 0.425 0.375 $ 5,000,000 1.500 1.250 1.100 0.900 0.800 0.750 0.620 0.535 0.450 0.400 $ 7,500,000 and greater
1.500 1.300 1.250 0.950 0.900 0.850 0.800 0.750 0.564 0.500
We interpolate between the closest lower and higher listed values where applicable.
Condominium, cooperative, or renters Value of Contents
Base deductible
and A&A combined
$250 $500 $1,000 $2,500 $5,000 $7,500 $10,000 $25,000 $50,000 $100,000
$ 15,000 1.150 1.050 0.900 0.735 0.600 0.550 0.500 0.450 0.400 0.300
$ 50,000 1.150 1.050 0.900 0.735 0.600 0.550 0.500 0.450 0.400 0.300 $ 500,000 1.150 1.050 0.900 0.735 0.600 0.550 0.500 0.450 0.400 0.300 $ 1,000,000 1.200 1.150 0.950 0.800 0.625 0.550 0.520 0.450 0.400 0.330 $ 2,500,000 1.200 1.150 1.100 0.835 0.750 0.650 0.545 0.490 0.425 0.375 $ 5,000,000 1.500 1.250 1.100 0.900 0.800 0.750 0.620 0.535 0.450 0.400 $ 7,500,000 and greater
1.500 1.300 1.250 0.950 0.900 0.850 0.800 0.750 0.564 0.500
We interpolate between the closest lower and higher listed values where applicable. City home house
Base deductible
Deductible
factors
Maximum amount
of change
$ 250 1.250 No Maximum
$ 500 1.120 No Maximum
$ 1,000 1.000 --
$ 2,500 0.875 $ 1,500
$ 5,000 0.750 $ 3,000
$ 7,500 0.688 $ 4,500
$ 10,000 0.625 $ 7,000
$ 25,000 0.563 $ 9,000
$ 50,000 0.500 $13,000
$100,000 0.410 $14,500
Discounts and surcharges charts
Burglar alarm Factor
Deluxe house or vacation home house with deluxe or standard contents 0.95
Deluxe house with fire contents or no contents 1.00
Deluxe or standard condominium, cooperative, or renters 0.95

Home and Contents: Charts
04/29/19 Pennsylvania Masterpiece Manual Home and Contents: Charts Page 7.9
Discounts
Deluxe house
or vacation home house
Condominium,
cooperative, or renters
Gated community 5% 5%
Gated community patrol service 5% 5%
Residential sprinkler system 10% N/A
Fire resistive 15% 15%
Suburban rating discount 10% 10%
Payment history
2 years paid in full; or
3+ years paid in full
3% 5%
3% 5%
Lien free* 2.5% 2.5%
Building security protection N/A 5%
Building fire protection N/A 5%
*Not applicable to Renters policies.
Portfolio discounts
Deluxe house,
City home house
Condominium, cooperative, or
renters
Home with auto 10.0% 10.0%
Home with valuable articles Minimum eligible amount of coverage
the total of all itemized and/or blanket valuable articles is at least $250,000; or
the total of all itemized and/or blanket valuable articles (excluding fine arts, if any) is at least $50,000
12.5% 12.5%
the total of all itemized and/or blanket valuable articles is at least $100,000; or
the total of all itemized and/or blanket valuable articles (excluding fine arts, if any) is at least $25,000
10.0% 10.0%
We will apply the highest percentage of discount for which the residence qualifies.
* Portfolio discounts are not applied to the 25% maximum total discount for City home house.
Discounts
City home house (A maximum total discount of 25% applies to City home house)*
Fire alarm 5%
Burglar alarm 5%
Temperature monitoring system 5%
Residential sprinkler system 10%
Fire resistive 15%
Payment history
2 years paid in full; or
3+ years paid in full
3% 5%
Lien free 2.5%
* Lien free and Payment history are not applied to the 25% maximum total discount for City home house.
Restoration discount for City home house *
Restoration completed within 5 years
Restoration completed within 6-10 years
Plumbing system 2% 1%
Electrical system 2% 1%
Heating/A.C./ventilating system 2% 1%
Roof 2% 1%
Façade repointing 2% 1%
* Restoration discounts are included in the 25% maximum total discount for City home house.

Home and Contents: Charts
04/29/19 Pennsylvania Masterpiece Manual Home and Contents: Charts Page 7.10
Superior protection
Superior protection discounts
Deluxe house
Vacation home
house
Security protection for the entire external perimeter of the house consisting of any one or more of the following:
closed circuit TV cameras monitored 24 hours a day;
detection system, external to the residence which is motion activated and monitored 24 hours per day;
24 hour on site security guard.
5% 5%
Full time caretaker who lives at the residence year round. This discount applies only if a 24 hour on site security guard is not present.
2% 4%
24 hour signal continuity protection for central station or direct fire and burglar alarm systems which activates the alarm when interrupted.
2% 2%
Perimeter gate where vehicular and pedestrian access is limited to entrances controlled by locked or electronic gates. This discount does not apply if any other Gated community discount applies.
2% 2%
Sprinkler system water flow alarm which activates a central station or direct alarm.
2% 2%
Temperature monitoring system, to protect against freezing, which activates a central station alarm.
2% 4%
Permanently installed, electrical power back−up generator capable of servicing heat, light, alarm and sprinkler systems.
5% 5%
Explosive gas leakage detector which activates a central station or direct fire alarm.
2% 2%
Automatic seismic shut−off valve to gas lines which activates automatically in the event of an earthquake.
2% 2%
Lightning protection system having a U.L. Master Label and installed by a certified Lightning Protection Institute installer. The system must include lightning rods and lightning arresters protecting the electrical wiring and all electronic devices of the entire house.
2% 2%
Water leak detection system having a U.L. Master Label. The system must monitor all areas containing plumbing devices and outlets. In the event of a leak, this system must:
• activate a central station or direct alarm; or 3% 3% • include a control system that closes the
master plumbing value; or 5% 5%
• include a control system that closes the master plumbing value and activates a central station or direct alarm.
8% 8%
The maximum total discount for Superior protection is 15%.

Home and Contents: Charts
04/29/19 Pennsylvania Masterpiece Manual Home and Contents: Charts Page 7.11
New house and Renovated house discounts (not applicable to City home house)
New house
Age of
dwelling
Renovated house
Years since oldest
renovation
31% 0 17% 0
31% 1 17% 1
28% 2 15% 2
25% 3 12% 3
22% 4 9% 4
19% 5 6% 5
16% 6 3% 6
12% 7
9% 8
8% 9
6% 10
4% 11
3% 12
2% 13
1% 14
0% 15+
Premier Client Discount
Risk Customer Loss free
tenure tenure No Yes
0 years 1 year 0.0% 0.0%
0 years 2 years 0.0% 0.0%
0 years 3 years -1.0% -1.0%
0 years 4 years -1.5% -1.5%
0 years 5 years -2.0% -2.0%
0 years 6 years -2.5% -2.5%
0 years 7 years -3.0% -3.0%
0 years 8 years -4.0% -4.0%
0 years 9+ years -5.0% -5.0%
1 year 1 year 0.0% 0.0%
1 year 2 years 0.0% 0.0%
1 year 3 years -1.0% -1.0%
1 year 4 years -1.5% -1.5%
1 year 5 years -2.0% -2.0%
1 year 6 years -2.5% -2.5%
1 year 7 years -3.0% -3.0%
1 year 8 years -4.0% -4.0%
1 year 9+ years -5.0% -5.0%

Home and Contents: Charts
04/29/19 Pennsylvania Masterpiece Manual Home and Contents: Charts Page 7.12
Discounts and surcharges charts (continued) Premier Client Discount
(continued)
Risk Customer Loss free
tenure tenure No Yes
2 years 2 years 0.0% 0.0%
2 years 3 years -1.0% -1.0%
2 years 4 years -1.5% -1.5%
2 years 5 years -2.0% -2.0%
2 years 6 years -2.5% -2.5%
2 years 7 years -3.0% -3.0%
2 years 8 years -4.0% -4.0%
2 years 9+ years -5.0% -5.0%
3 years 3+ years 0.0% -5.0%
4 years 4+ years 0.0% -5.8%
5 years 5+ years 0.0% -6.6%
6 years 6+ years 0.0% -7.5%
7 years 7+ years 0.0% -8.3%
8 years 8+ years 0.0% -9.1%
9+ years 9+ years 0.0% -10.0%
Surcharges
Deluxe house
or vacation home house
City
home house
Condominium, cooperative,
or renters
Cancellation surcharge 10% 10% 10%
Rented to others surcharge 25% N/A 25%
Rental unit N/A 5% N/A
Vacation home house nonoccupancy surcharge*
10% N/A N/A
Undervalue surcharge* 20% 20% N/A
Renovation or construction surcharge*
A renovation or construction surcharge applies for one of the following:
Minor construction
construction of additions, alterations, or renovations to the existing house or other permanent structures resulting in an increase in the amount of coverage for the house or other permanent structure by an amount less than 10% of the coverage amount for the structure or $500,000, whichever amount is less;
OR,
15%
15%
N/A
Major construction
new construction of a house or other permanent structures(not applicable to City home house); or
construction of additions, alterations, or renovations to the existing house or other permanent structures resulting in an increase in the amount of coverage for the house or other permanent structure which equals or exceeds 10% of the coverage amount for the structure or $500,000, whichever amount is less.
35%
35%
N/A
Vacant house surcharge (Deluxe house only)*
25% 25% N/A
*Applied by Company.

Home and Contents: Charts
04/29/19 Pennsylvania Masterpiece Manual Home and Contents: Charts Page 7.13
Discounts and surcharges charts (continued)
Claims rating factor
Amount of house coverage $1,000,000 or less
Risk tenure
Number of losses
0 1 2 3 4 5+
1 year 0.0% 20.0% 44.0% 72.5% 107.5% 150.0%
2 years 0.0% 16.0% 39.2% 66.8% 100.5% 141.3%
3 years -2.5% 12.0% 34.3% 61.2% 93.5% 132.7%
4 years -3.3% 8.0% 29.5% 55.5% 86.5% 124.0%
5 years -4.2% 5.3% 24.7% 49.7% 79.5% 115.5%
6 years -5.0% 2.7% 19.8% 43.8% 72.5% 107.0%
7 years -5.8% 0.0% 15.0% 38.0% 65.5% 98.5%
8 years -6.7% -2.5% 12.3% 32.0% 58.3% 89.8%
9+ years -7.5% -5.0% 9.5% 26.0% 51.0% 81.0%
Amount of house coverage equal to $2,000,000
Risk tenure
Number of losses
0 1 2 3 4 5+
1 year 0.0% 15.0% 35.5% 60.0% 89.0% 123.0%
2 years 0.0% 10.8% 30.7% 54.2% 82.2% 115.0%
3 years -2.5% 6.7% 25.8% 48.3% 75.3% 107.0%
4 years -3.3% 2.5% 21.0% 42.5% 68.5% 99.0%
5 years -4.2% 0.8% 17.0% 37.8% 62.8% 92.3%
6 years -5.0% -0.8% 13.0% 33.2% 57.2% 85.7%
7 years -5.8% -2.5% 9.0% 28.5% 51.5% 79.0%
8 years -6.7% -3.8% 5.8% 24.8% 47.0% 73.8%
9+ years -7.5% -5.0% 2.5% 21.0% 42.5% 68.5%
We interpolate for house coverage amounts between $1,000,001 and $1,999,999.
Amount of house coverage $5,000,000 or greater
Risk tenure
Number of losses
0 1 2 3 4 5+
1 year 0.0% 10.0% 26.5% 45.5% 67.5% 92.5%
2 years 0.0% 6.7% 22.7% 41.2% 62.5% 86.8%
3 years -5.0% 3.3% 18.8% 36.8% 57.5% 81.2%
4 years -5.8% 0.0% 15.0% 32.5% 52.5% 75.5%
5 years -6.6% -1.7% 11.7% 28.7% 48.0% 70.3%
6 years -7.5% -3.3% 8.3% 24.8% 43.5% 65.2%
7 years -8.3% -5.0% 5.0% 21.0% 39.0% 60.0%
8 years -9.1% -6.2% 2.5% 18.0% 35.5% 56.0%
9+ years -10.0% -7.5% 0.0% 15.0% 32.0% 52.0%
We interpolate for house coverage amounts between $2,000,001 and $4,999,999.

Home and Contents: Charts
04/29/19 Pennsylvania Masterpiece Manual Home and Contents: Charts Page 7.14
Discounts and surcharges charts (continued)
Claims rating factor (continued)
Amount of contents and additions and alterations coverage $250,000 or less
Risk tenure
Number of losses
0 1 2 3 4 5+
1 year 0.0% 20.0% 44.0% 72.5% 107.5% 150.0%
2 years 0.0% 16.0% 39.2% 66.8% 100.5% 141.3%
3 years -2.5% 12.0% 34.3% 61.2% 93.5% 132.7%
4 years -3.3% 8.0% 29.5% 55.5% 86.5% 124.0%
5 years -4.2% 5.3% 24.7% 49.7% 79.5% 115.5%
6 years -5.0% 2.7% 19.8% 43.8% 72.5% 107.0%
7 years -5.8% 0.0% 15.0% 38.0% 65.5% 98.5%
8 years -6.7% -2.5% 12.3% 32.0% 58.3% 89.8%
9+ years -7.5% -5.0% 9.5% 26.0% 51.0% 81.0%
Amount of contents and additions and alterations coverage equal to $500,000
Risk tenure
Number of losses
0 1 2 3 4 5+
1 year 0.0% 15.0% 35.5% 60.0% 89.0% 123.0%
2 years 0.0% 10.8% 30.7% 54.2% 82.2% 115.0%
3 years -2.5% 6.7% 25.8% 48.3% 75.3% 107.0%
4 years -3.3% 2.5% 21.0% 42.5% 68.5% 99.0%
5 years -4.2% 0.8% 17.0% 37.8% 62.8% 92.3%
6 years -5.0% -0.8% 13.0% 33.2% 57.2% 85.7%
7 years -5.8% -2.5% 9.0% 28.5% 51.5% 79.0%
8 years -6.7% -3.8% 5.8% 24.8% 47.0% 73.8%
9+ years -7.5% -5.0% 2.5% 21.0% 42.5% 68.5%
We interpolate for contents and additions and alterations coverage amounts between $250,001 and $499,999.
Amount of contents and additions and alterations coverage $1,000,000 or greater
Risk tenure
Number of losses
0 1 2 3 4 5+
1 year 0.0% 10.0% 26.5% 45.5% 67.5% 92.5%
2 years 0.0% 6.7% 22.7% 41.2% 62.5% 86.8%
3 years -5.0% 3.3% 18.8% 36.8% 57.5% 81.2%
4 years -5.8% 0.0% 15.0% 32.5% 52.5% 75.5%
5 years -6.6% -1.7% 11.7% 28.7% 48.0% 70.3%
6 years -7.5% -3.3% 8.3% 24.8% 43.5% 65.2%
7 years -8.3% -5.0% 5.0% 21.0% 39.0% 60.0%
8 years -9.1% -6.2% 2.5% 18.0% 35.5% 56.0%
9+ years -10.0% -7.5% 0.0% 15.0% 32.0% 52.0% We interpolate for contents and additions and alterations coverage amounts between $500,001 and $999,999.
Home and Contents: Charts
04/29/19 Pennsylvania Masterpiece Manual Home and Contents: Charts Page 7.15
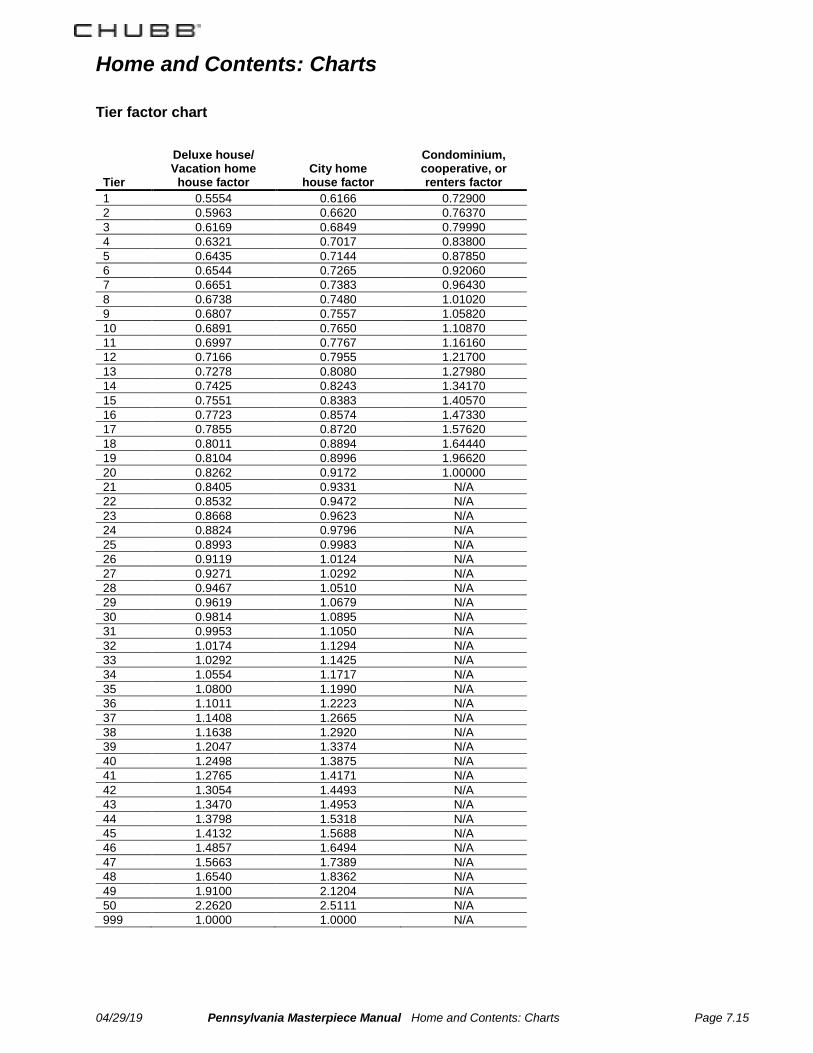
Tier factor chart
Tier
Deluxe house/ Vacation home
house factor
City home
house factor
Condominium, cooperative, or renters factor
1 0.5554 0.6166 0.72900
2 0.5963 0.6620 0.76370
3 0.6169 0.6849 0.79990
4 0.6321 0.7017 0.83800
5 0.6435 0.7144 0.87850
6 0.6544 0.7265 0.92060
7 0.6651 0.7383 0.96430
8 0.6738 0.7480 1.01020
9 0.6807 0.7557 1.05820
10 0.6891 0.7650 1.10870
11 0.6997 0.7767 1.16160
12 0.7166 0.7955 1.21700
13 0.7278 0.8080 1.27980
14 0.7425 0.8243 1.34170
15 0.7551 0.8383 1.40570
16 0.7723 0.8574 1.47330
17 0.7855 0.8720 1.57620
18 0.8011 0.8894 1.64440
19 0.8104 0.8996 1.96620
20 0.8262 0.9172 1.00000
21 0.8405 0.9331 N/A
22 0.8532 0.9472 N/A 23 0.8668 0.9623 N/A 24 0.8824 0.9796 N/A 25 0.8993 0.9983 N/A 26 0.9119 1.0124 N/A 27 0.9271 1.0292 N/A 28 0.9467 1.0510 N/A 29 0.9619 1.0679 N/A 30 0.9814 1.0895 N/A 31 0.9953 1.1050 N/A 32 1.0174 1.1294 N/A 33 1.0292 1.1425 N/A 34 1.0554 1.1717 N/A 35 1.0800 1.1990 N/A 36 1.1011 1.2223 N/A 37 1.1408 1.2665 N/A 38 1.1638 1.2920 N/A 39 1.2047 1.3374 N/A 40 1.2498 1.3875 N/A 41 1.2765 1.4171 N/A 42 1.3054 1.4493 N/A 43 1.3470 1.4953 N/A 44 1.3798 1.5318 N/A 45 1.4132 1.5688 N/A 46 1.4857 1.6494 N/A 47 1.5663 1.7389 N/A 48 1.6540 1.8362 N/A 49 1.9100 2.1204 N/A 50 2.2620 2.5111 N/A 999 1.0000 1.0000 N/A

Home and Contents: Charts
04/29/19 Pennsylvania Masterpiece Manual Home and Contents: Charts Page 7.16
Dollar adjustments charts
Liability Liability is rated in the state where the Primary residence (first location with liability) is located.
Primary location Each additional location Any liability Personal liability Excess only*
Is coverage provided for Building
and/or contents? Is coverage provided for Building and/or contents?
Amount of coverage
Yes
No
Yes
No
$ 50,000 $ 0 $ 15 $ 0 $ 15 N/A
$ 100,000 $ 58 $ 73 $ 14 $ 29 N/A
$ 200,000 $ 97 $ 112 $ 20 $ 35 N/A
$ 300,000 $ 131 $ 146 $ 26 $ 41 N/A
$ 500,000 $ 173 $ 188 $ 32 $ 47 N/A
$ 1,000,000 $ 190 $ 205 $ 38 $ 53 $ 22
$ 2,000,000 $ 225 $ 240 $ 43 $ 58 $ 26
$ 3,000,000 $ 248 $ 263 $ 45 $ 60 $ 28
$ 5,000,000 $ 278 $ 293 $ 54 $ 69 $ 32
$10,000,000 $ 359 $ 374 $ 57 $ 72 $ 43
*These premiums only apply when the insured requests building and/or contents coverage for one or more locations. No personal liability coverage. Subtract $15 for each location that building and/or contents coverage is provided if no
personal liability coverage is provided.
House replacement cost Subtract $5 if verified or conditional replacement cost payment basis applies in lieu of extended replacement cost payment basis. House replacement cost can only be applied by the Company.
Employment practices liability Add the amount from the following chart based on the amount of coverage selected. The coverage is always rated at one residence and the residence must be listed for Personal liability coverage.
Charge for Employment practices liability coverage with a $10,000 deductible
Employment practices liability Reputational injury
Code
Amount of coverage
Maximum annual amount of coverage
Amount of coverage
Maximum annual amount of coverage
Additional premium
A $250,000 $500,000 $25,000 $25,000 $ 650
B $500,000 $500,000 $50,000 $50,000 $ 975

Home and Contents: Charts
04/29/19 Pennsylvania Masterpiece Manual Home and Contents: Charts Page 7.17
Dollar adjustments charts
(continued)
Homeowner/unit assessments
For each additional $1,000 homeowner/unit assessments coverage over $50,000, add:
For each additional $1,000 coverage for an assessment due to a deductible in the homeowner, condominium, or cooperative association’s insurance over $5,000, add:
Deluxe house $2 $2
Vacation home house $2 $2
City home house $2 $2
Deluxe condominium or cooperative $2 $2
Standard condominium or cooperative $2 $2
Refer to Company for: a total amount of homeowner or unit assessments coverage greater than $500,000 or greater than the amount of
coverage for house, or the combined amount of coverage for additions and alterations and contents; or for an amount exceeding $50,000 for coverage for an assessment due to a deductible in the homeowners ,
condominium, or cooperative association’s insurance.
Landscaping
For each additional $1,000 landscaping coverage over 5% of the amount of house coverage and 10% of the amount of contents coverage, add:
For each additional $5,000 over $10,000 for any one tree, shrub, or plant, add:
Deluxe house $4 $50
Vacation home house $4 $50
Deluxe and standard condominium, cooperative, or renters
$4 $50
Refer to company to increase coverage for landscaping:
over $250,000 for the total amount of landscaping coverage; or
over $50,000 for the amount of coverage for any tree, shrub or plant.

Home and Contents: Charts
04/29/19 Pennsylvania Masterpiece Manual Home and Contents: Charts Page 7.18
Dollar Adjustments charts (continued)
Landscaping – wind and hail coverage
For each $1,000 landscaping coverage with the
perils of wind and hail included, add:
Deluxe house $15
Vacation home house $15
Deluxe and standard condominium, cooperative, or renters
$15
This increased coverage will be added by the Company.
Landscaping – sleet and weight of ice and snow coverage
For each $1,000 landscaping coverage with the
perils of sleet and weight of ice and snow included, add:
Deluxe house $15
Vacation home house $15
Deluxe and standard condominium, cooperative, or renters
$15
This increased coverage will be added by the Company.
City garden coverage For each additional $1,000
city garden coverage over 5% of the amount of city home house coverage, add:
For each additional $5,000 over $10,000 for any tree, shrub, or plant, add:
City home house $4 $50
Refer to company to increase coverage for landscaping:
over $250,000 for the total amount of landscaping coverage; or
over $50,000 for the amount of coverage for any tree, shrub or plant.
City garden coverage – wind and hail coverage For each $1,000 city garden coverage with the
perils of wind and hail included, add:
City home house $15
This increased coverage will be added by the Company.
City garden coverage – sleet and weight of ice and snow coverage
For each $1,000 city garden coverage with the
perils of sleet and weight of ice and snow included, add:
City home house $15
This increased coverage will be added by the Company.

Home and Contents: Charts
04/29/19 Pennsylvania Masterpiece Manual Home and Contents: Charts Page 7.19
Dollar Adjustments charts (continued)
Business property For each additional $1,000 on premises business
property coverage over $25,000, add:
Deluxe contents $5
Standard contents $5
Fire contents $5
City home contents $5
Deluxe condominium, cooperative, or renters $5
Standard condominium, cooperative, or renters $5
For a total amount of business property coverage greater than $250,000, refer to Company. The increased coverage will be applied by the Company.
Student additional living expenses For $5,000 student
additional living expenses coverage, add:
For each $1,000 student additional living expenses coverage, greater than $5,000, add:
Deluxe contents $25 $1.50
Standard contents $25 $1.50 Fire contents $25 $1.50 City home contents $25 $1.50 Deluxe condominium, cooperative, or renters $25 $1.50 Standard condominium, cooperative, or renters $25 $1.50 For a total amount of student additional living expenses coverage greater than $250,000, refer to Company. The increased coverage will be applied by the Company.
Assisted living care coverage – contents of a relative-in-care
For the first $5,000 assisted living care coverage – contents of a relative-in-care, add:
For each $1,000 assisted living care coverage – contents of a relative-in-care, greater than $5,000, add:
Deluxe contents $50 $5
Standard contents $50 $5 City home contents $50 $5 Deluxe condominium, cooperative, or renters $50 $5 Standard condominium, cooperative, or renters $50 $5 For a total amount of assisted living care coverage greater than $250,000, refer to Company. The increased coverage will be applied by the Company.
Family protection coverage The premium for Family protection coverage is $110.
Earthquake coverage For a house add $0.60 for every $1,000 of house coverage. For a house with GreenWise upgrade coverage, multiply the earthquake rate by 1.05.

Supporting Document Schedules Bypassed - Item: Authorization to File (PC)Bypass Reason: Not Applicable - we are filing on our own behalf.Attachment(s):Item Status:Status Date:
Satisfied - Item: Actuarial Explanatory Memorandum & Supporting Exhibits (PC)Comments: Attached is the Actuarial Filing Memorandum & Supporting Exhibits.
Attachment(s): L-CB PA HO Filing Packet (18 13556) 2018.12.03.pdfPA Filing Exhibits 2018.12.03 (18 13556).xlsx
Item Status:Status Date:
Satisfied - Item: Cover LetterComments: Attached is the filing cover letter.Attachment(s): PA 18 13556 RR Cover Letter.pdfItem Status:Status Date:
Satisfied - Item: Description of ChangeComments: Attached.Attachment(s): PA Desc of Change RR Revised 11-30.pdfItem Status:Status Date:
Satisfied - Item: Marked Copy of ManualComments: Attached.
Attachment(s):
Home and Contents Rules RR MOCKUP 11-30-18.pdfHome and Contents Rules – Discounts RR MOCKUP 11-30-18.pdfHome and Contents Rules – Surcharges and Other Rating Factors RR MOCKUP 11-30-18.pdfHome and Contents Rules – Coverage Options RR MOCKUP 11-30-18.pdfHome and Contents Charts RR MOCKUP 11-30-18.pdf
Item Status:Status Date:
SERFF Tracking #: ACEH-131704470 State Tracking #: Company Tracking #: 18-13556-RR
State: Pennsylvania First Filing Company: Chubb Indemnity Insurance Company, ...
TOI/Sub-TOI: 04.0 Homeowners/04.0000 Homeowners Sub-TOI Combinations
Product Name: Masterpiece
Project Name/Number: Home Rate Phase 3/18 13556
PDF Pipeline for SERFF Tracking Number ACEH-131704470 Generated 12/12/2018 02:51 PM

Attachment PA Filing Exhibits 2018.12.03 (18 13556).xlsx is not a PDF document and cannot bereproduced here.
SERFF Tracking #: ACEH-131704470 State Tracking #: Company Tracking #: 18-13556-RR
State: Pennsylvania First Filing Company: Chubb Indemnity Insurance Company, ...
TOI/Sub-TOI: 04.0 Homeowners/04.0000 Homeowners Sub-TOI Combinations
Product Name: Masterpiece
Project Name/Number: Home Rate Phase 3/18 13556
PDF Pipeline for SERFF Tracking Number ACEH-131704470 Generated 12/12/2018 02:51 PM

Pennsylvania
MASTERPIECE Rate and Rule Manual
Home and Contents Section
Index
Exhibit 1 Filing Memorandum Exhibit 2 Explanatory Notes to Indication Exhibit 3 Homeowners Rate Level Indication Exhibit 4 Loss Development Exhibits Exhibit 5 Trend Exhibits Exhibit 6 Catastrophe Loads Exhibit 7 Countrywide Unallocated Loss Adjustment Expense Exhibit Exhibit 8 Countrywide Underwriting Expense Exhibit Exhibit 9 Pennsylvania Expense Provisions Exhibit 10 Pennsylvania ROE Exhibit Exhibit 11 Pennsylvania Annual Statement Exhibit 12 Excess Shock Exhibits
Exhibit 13 Rate Level Effects by Territory Exhibit 14 Rate Level Effect Histograms

Exhibit 1.01
Pennsylvania
MASTERPIECE RATE AND RULE MANUAL HOME AND CONTENTS SECTION
This memorandum presents a revision of the Home and Contents sections of the MASTERPIECE Rate and Rule manual in the state of Pennsylvania for Federal Insurance Company (FED), Vigilant Insurance Company (VIG), Pacific Indemnity Company (PIC), Great Northern Insurance Company (GNI), Chubb National Insurance Company (CNI), and Chubb Indemnity Insurance Company (CII). This explanatory memorandum is provided for informational purposes only and does not modify any of our rules, rates, rating plans or manuals. The actual rating methodologies used by the member companies of CHUBB are outlined in the applicable rules. The overall Homeowners rate level effect resulting from the changes described in this memorandum is +4.9%, which is supported by our overall indication of +18.3%. The rate effect and indication is broken out by form/coverage below:
Form/Coverage Indication Rate Effect House/Vacation Home +16.4% +4.1% R/C/C +6.1% +2.2% City Home +8.0% +4.0% Home Primary Liability +105.1% +34.9% Homeowners Total +18.3%* +4.9%
*Homeowners Total indication is based on a weighted average of the indications of the forms/coverages.
Base Rates The base rates for all forms (House/Vacation Home, Condo/Co-Op, Renters and City Home) will be increased. For City Home, this includes revisions to Building and Contents rates. Please see the proposed rate and rule manual for details. Discounts and Surcharges For House/Vacation Home forms the New House Discount is being expanded to 15 years with credits ranging from 0% to 31%. The existing Renovation or Construction surcharge will be revised to a new two-tiered approach. We are introducing a Minor Renovation surcharge of 15% for House/Vacation Home and City Home forms.
• A renovation is considered minor when it increases the amount of coverage for the house or other permanent structures less than 10% or $500,000, whichever is less.
• Applies regardless of whether the home is vacant/unoccupied during renovation, or if the insured resides in the home.
The current Renovation surcharge of 35% will be renamed as “Major Renovation” surcharge. The rule for Major Renovation will be revised to make the surcharge applicable regardless of if the insured lives in or out of the house during renovation or construction. Also, this surcharge now only

Exhibit 1.02
applies when the increase in coverage for the house or other permanent structures equals or exceeds the criteria described above for Minor Renovation. Please see the proposed rate and rule manual for details. House/Vacation Home & City Home Tier Factors The existing Tier 1-19 Tier Factors will be increased by +5.9% for House/Vacation Home forms and +4.7% for City Home forms. House/Vacation Home & City Home Tier Methodology We are proposing several revisions to the Home Tier methodology introduced in Pennsylvania with the CHUB-127285877 filing effective 12/12/2011. The proposed changes are for House/Vacation Home and City Home forms only; R/C/C will continue to use the approved tiering approach. The new tier model will apply exclusively to new business and have little impact on existing customers. A summary of the proposed revisions is as follows:
1. We are expanding the number of tiers from 19 to 50.
2. In addition to considering Financial Stability, Pre-Chubb Losses, and Coverage Amount in the tier determination, we are now incorporating Construction Year as a new variable.
3. Every Pre-Chubb loss will now be assigned to one of five peril groups (Fire, Water, Theft, Other, Unknown), where each group has an associated number of ‘points’. The point value reflects how predictive a loss of that peril is of future claim activity. The greater the point value, the greater the impact on the tier calculation. This means the surcharge will now vary depending on the type of prior claims.
In-force House/Vacation Home and City Home policies rated with one of the existing 19 tiers will be mapped to one of the new 50 tiers at the next renewal. In performing this mapping, we selected the new tier whose corresponding tier factor is closest to the tier factor that would have been received under the old methodology. This procedure will minimize the tier factor change for each individual risk, and also minimize premium disruption. Please see the proposed rate and rule manual for the revised tier factor tables.
Homeowners Primary Liability For all forms, Homeowners Primary Liability surcharges will be revised. Please see the proposed rate and rule manual for details.

Exhibit 1.03
Rate Level Effects
The combined rate level effects for the above revisions for Pennsylvania are based on in-force written premium as of July 2018:
Premium Written Level Form/Coverage Contents Premium Effect Deluxe House / Vacation Home Deluxe 69,821,115 4.0% Standard 9,762,152 4.1% No/Fire 3,279,309 5.2% Total 82,862,576 4.1% Renter/Condo/Coop Deluxe 6,640,101 2.2% Standard 486,473 2.2% Total 7,126,574 2.2% City Home
Total 2,244,202 4.0%
Home Primary Liability Total 3,113,521 34.9% Homeowners Total 95,346,873 4.9%

Exhibit 2.01
CHUBB Pennsylvania
Explanatory Notes to House, R/C/C & City Home Indications Exhibits 3.01-3.03 are provided in support of changes to the "Home and Contents" section of the MASTERPIECE Rate and Rule manual. Below is an explanation of the information provided in the exhibits.
Column 4: On Level Earned Premium = Earned Premium at current rate level = Column 2 adjusted to reflect the
following overall rate changes during and since the experience period:
Effective Date Rate Change New
Business Renewal Business
House/Vacation Home
R/C/C
City Home
08/27/18 10/11/18 0.0% 0.0% 0.0% 04/23/18 06/07/18 2.3% 5.0% 3.0% 04/11/17 05/26/17 5.0% -0.1% 0.0% 12/07/15 01/21/16 2.9% -2.2% -0.1% 12/10/13 01/24/14 10.2% 0.1% 0.0% 12/10/12 01/24/13 5.6% 0.0% 0.0% 12/12/11 01/26/12 4.1% -0.3% 0.2%
Column 5: Reported incurred losses and ALAE = losses (including salvage and subrogation) and allocated loss
adjustment expenses incurred during each of the five accident years evaluated as of March 31, 2018. Column 6: Ex-cat Capped Losses and ALAE = Shock Adjusted Losses Excluding Catastrophes. For House forms,
the shock loss adjustment procedure takes individual ground-up fire losses (ground-up to avoid distortions due to the presence of varying deductibles) and caps them at a pre-determined percentage (10%) of the total coverage amount. See Exhibit 12.01. House non-fire, Vacation Home, and City Home losses are capped at 35% of the total coverage amount, and R/C/C losses are capped at 85% of the contents amount.
Column 7: Expected Excess Shock Loss = After capping the House fire losses, an expected excess loss amount
based on countrywide fire frequency and severity values was built back in for each policy for each year. The selected frequency and severity values are displayed in Exhibit 12.02. These values were then used to determine an expected annual loss amount for each risk. A state offset is then applied to account for a state’s long-term deviation from countrywide results. The selected offset for Pennsylvania is shown in Exhibit 12.03. This expected loss amount, representing a particular risk’s fire protection and size of risk was added to the capped losses for each year for indication purposes. The excess from capping House non-fire, Vacation Home all cause, R/C/C all cause, and City Home all cause large losses is spread to all years.
Column 8: Loss Development Factors
Loss and ALAE were developed to an ultimate settlement level using factors shown in Exhibits 4.01-
4.03.

Exhibit 2.02 Column 9: Loss Ratio Trend Factors
These factors, shown in Exhibits 5.08-5.09, are applied to the Column 6 capped loss & Column 7 excess shock loss, for each of the experience years.
Column 10: Ultimate Ex-cat Adjusted Loss & ALAE = Ex-cat Capped Loss & ALAE plus Expected Excess Shock
Loss developed to ultimate and trended. Column 11: Ultimate Ex-cat Adjusted incurred loss and ALAE Ratio = Col 10 / Col 4.
Column 12: CAT Loss/ALAE Ratio
A non-modeled catastrophe loss and ALAE ratio was developed by looking at the catastrophe losses since 1991. See Exhibit 6.01-6.09.
Column 13: Ultimate Adjusted Loss & ALAE Ratio = Column 11 + Column 12
Row 15: Projected Loss & ALAE Ratio = the weighted average of Column 13 using the following weights from Column 14.
Year Weight 2013 10.0% 2014 15.0% 2015 20.0% 2016 25.0% 2017 30.0%
Row 16: Modeled Cat Loss & ALAE Ratio is shown in Exhibit 6.10. Row 17: Unallocated Loss Adjustment Expenses
Unallocated loss adjustment expenses were estimated to be 5.7% of the developed incurred losses including allocated loss adjustment expenses. This estimate was based on 2015-2017 countrywide Chubb INA data as displayed in Exhibit 7.01.
Row 18: General and Other Acquisition expenses are based on 2015-2017 countrywide Chubb INA data from the Insurance Expense Exhibit (See Exhibit 8.01).
Row 19: Projected Loss, LAE & Fixed Expense Ratio = [(15) + (16)] * (17) + (18)

Exhibit 2.03 Row 20: Permissible Loss, LAE & Fixed Expense Ratio
The permissible loss, LAE & fixed expense ratio is based on the following breakdown of expenses: All Forms (1) Standard Commissions + GSC 17.0% (2) Taxes, Licenses & Fees 2.3% (3) Underwriting Profit 12.1% (4) Total Variable Expenses and Profit Provision 31.4% (5) Permissible Loss, LAE & Fixed Expense Ratio 68.6%
Notes: (1) & (2) Based on 2015-2017 Pennsylvania data from Page 15 of the Annual
Statement (see Exhibit 9.01) (3) Underwriting profit (See Exhibit 10.01) (4) (1) + (2) + (3) (5) [100% - (4)]
Row 21: Raw Indicated Rate Level Change = (19) / (20) – 1
Row 22: Credibility: See Exhibit 2.06.
Row 23: Complement of Credibility Loss and LAE Ratio: See Exhibit 2.06.
Row 24: Credibility Weighted Loss, LAE & Fixed Expense Ratio = (15)*(17)*(22) + (23)*[1 - (22)] + (16)*(17) + (18) Row 25: Credibility Weighted Indicated Rate Level Change = (24)/(20) -1

Exhibit 2.04 CHUBB
Pennsylvania Explanatory Notes to Homeowners Primary Liability Indication
Exhibit 3.04 is provided in support of changes to the "Home and Contents" section of the Pennsylvania MASTERPIECE Rate and Rule manual. Due to the low volume of Homeowners Primary Liability data in Pennsylvania, countrywide data is used in deriving the indication. Below is an explanation of the information provided in this exhibit. Column 3: On-level Factors = adjustment factors to apply to Earned Premium to reflect the countrywide rate
effects during and since the experience period. On-level factors were calculated using the standard parallelogram method.
Column 4: Premium Trend factors, shown in Exhibit 5.12, are applied to Earned Premium.
Column 5: Adjusted Earned Premium = (2) * (3) * (4)
Column 6: Uncapped Reported Loss/ALAE = Reported Losses incurred during each of the five calendar accident years evaluated as of March 31, 2018.
Column 7: Capped Reported Loss/ALAE = Reported Losses with each loss capped at $1M to avoid volatility in the experience period due to very large losses.
Column 8: Loss Development Factors to develop capped losses to an ultimate settlement level using factors
shown in Exhibit 4.04. Column 9: Pure Premium Trend factors, shown in Exhibit 5.12, are applied to the Column 7 capped loss for each
of the experience years. Column 10: Excess Loss Load factor, developed in Exhibit 12.04, applied to the Column 7 capped losses to build
back in the expected long term losses greater than $1M.
Column 11: Total Adjusted Ultimate Loss/ALAE Ratio = (7) * (8) * (9) * (10) / (5) Column 12: Unallocated loss adjustment expenses were estimated to be 5.7% of the developed incurred losses
including allocated loss adjustment expenses. This estimate was based on 2015-2017 countrywide Chubb INA data as displayed in Exhibit 7.01.
Column 13: Total Adjusted Ultimate Loss/LAE Ratio = (11) * (12)
Row 15: 5-Year Weighted Average Loss/LAE Ratio = the weighted average of Column 13 using the following weights from Column 14, as shown in this table:
Year Weight 2013 10.0% 2014 15.0% 2015 20.0% 2016 25.0% 2017 30.0%
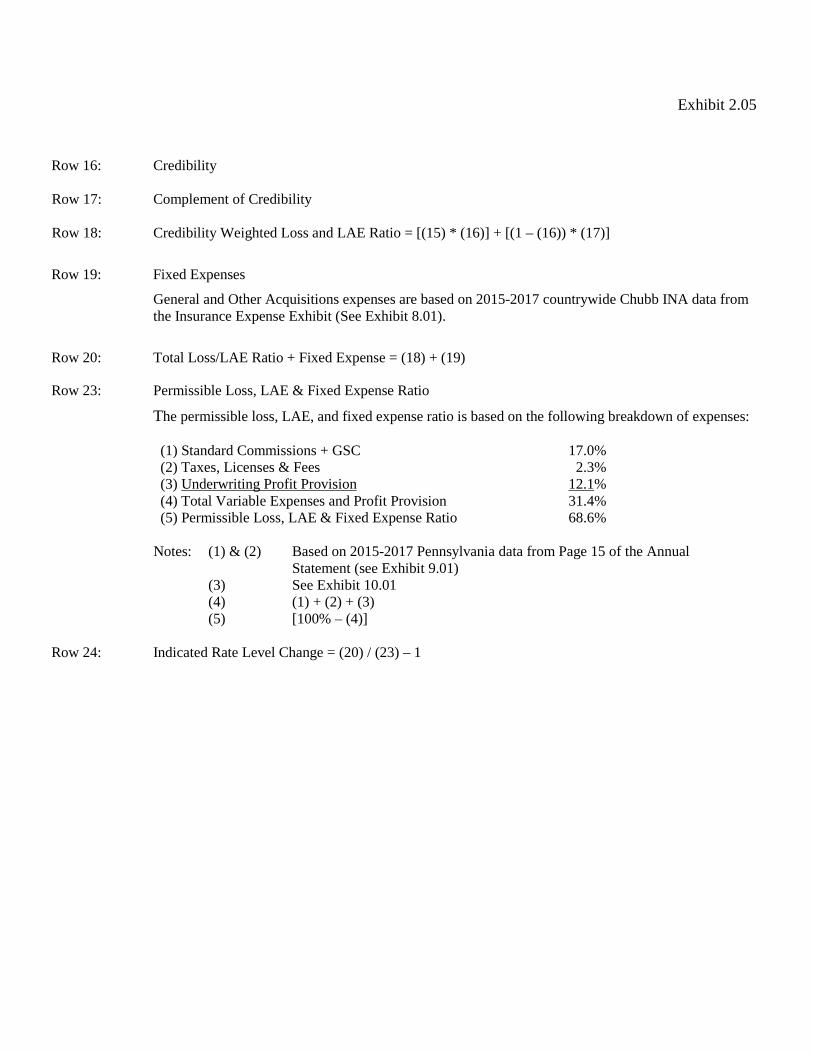
Exhibit 2.05
Row 16: Credibility Row 17: Complement of Credibility Row 18: Credibility Weighted Loss and LAE Ratio = [(15) * (16)] + [(1 – (16)) * (17)]
Row 19: Fixed Expenses
General and Other Acquisitions expenses are based on 2015-2017 countrywide Chubb INA data from the Insurance Expense Exhibit (See Exhibit 8.01).
Row 20: Total Loss/LAE Ratio + Fixed Expense = (18) + (19)
Row 23: Permissible Loss, LAE & Fixed Expense Ratio
The permissible loss, LAE, and fixed expense ratio is based on the following breakdown of expenses:
(1) Standard Commissions + GSC 17.0% (2) Taxes, Licenses & Fees 2.3% (3) Underwriting Profit Provision 12.1% (4) Total Variable Expenses and Profit Provision 31.4% (5) Permissible Loss, LAE & Fixed Expense Ratio 68.6%
Notes: (1) & (2) Based on 2015-2017 Pennsylvania data from Page 15 of the Annual
Statement (see Exhibit 9.01) (3) See Exhibit 10.01 (4) (1) + (2) + (3) (5) [100% – (4)]
Row 24: Indicated Rate Level Change = (20) / (23) – 1

Exhibit 2.06
House & Vacation HomeEarned House Years 109,240 Credibility Standard 40,000 Credibility [√(EHY/Cred Std)] 100.0%
R/C/CEarned House Years 27,434 Credibility Standard 20,000 Credibility [√(EHY/Cred Std)] 100.0%
City HomeEarned House Years 2,393 Credibility Standard 20,000 Credibility [√(EHY/Cred Std)] 34.6%
The Complement of Credibility for the statewide indication is the trended expected lossand LAE ratio less the Modeled Cat Loss & LAE ratio
House & Vacation Home, R/C/C Fully Credible
City Home(1) Expected Loss & LAE ratio: 59.8%(2) Annual Net Projection Trend: 2.5%(3) Projection Window (years) 2.95(4) Trended Expected Loss & LAE ratio = (1) * [1+(2)]^(3): 64.2%(5) Modeled Catastrophe Loss & ALAE Ratio: 5.3%(6) ULAE 1.057(7) Complement of Credibility = (4) - [(5) * (6)]: 58.6%
CHUBBPennsylvania HomeownersCalculation of Credibility
Calculation of Complement of Credibility

CHUBB Exhibit 3.01Pennsylvania HomeownersForm Indication = House and Vacation HomeCompanies = AllTerritory = AllEvaluated as of 03/2018
(1) (2) (3) (4) (5) (6) (7) (8) (9) (10) (11) (12) (13) (14)
=[(6)+(7)] =(10)/(4) =(11)+(12)* (8) * (9)
Calendar / Onlevel Ex-cat Expected Loss Loss Ratio Ultimate Ex-cat Ult. Ex-cat Adj. Cat Loss/ Ult. Adj. AccidentAccident Written Earned Onlevel Earned Reported Capped Excess Development Trend Adjusted Loss/ALAE ALAE Loss/ALAE Year
Year Premium Premium Factors Premium Loss/ALAE Loss/ALAE Shock Loss Factors Factors Loss/ALAE Ratio Ratio Ratio Weights2013 75,865,104 73,705,369 1.256 92,573,944 28,701,273 19,526,637 12,102,443 0.996 1.207 38,007,773 41.1% 14.1% 55.1% 10.0%2014 80,484,884 78,070,395 1.166 91,030,080 66,199,318 33,244,674 12,609,757 0.993 1.172 53,354,946 58.6% 14.1% 72.8% 15.0%2015 79,825,836 80,085,036 1.106 88,574,050 40,490,419 25,582,496 12,953,798 0.993 1.138 43,564,262 49.2% 14.2% 63.4% 20.0%2016 79,736,645 80,017,724 1.091 87,299,337 34,932,302 26,060,638 13,342,173 0.990 1.106 43,128,717 49.4% 14.2% 63.6% 25.0%2017 80,583,950 79,736,464 1.065 84,919,334 42,774,561 28,498,613 13,506,391 1.021 1.074 46,062,710 54.2% 14.0% 68.3% 30.0%
(15) Projected Loss & ALAE Ratio 65.5%
(16) Modeled Catastrophe Loss & ALAE Ratio 1.7%
(17) ULAE Load 1.057
(18) Fixed Expense Ratio 8.8%
(19) Projected Loss, LAE & Fixed Expense Ratio 79.8%
(20) Permissible Loss, LAE & Fixed Expense Ratio 68.6%
(21) Raw Indicated Rate Level Change 16.4%
(22) Credibility 100.0%
(23) Complement of Credibility Loss and LAE ratio N/A
(24) Credibility Weighted Loss & LAE + Modeled Cat Loss & LAE ratio + Fixed Exp =(15)*(17)*(22)+(23)*(1-(22))+(16)*(17)+(18) 79.8%
(25) Credibility Weighted Indicated Rate Level Change 16.4%
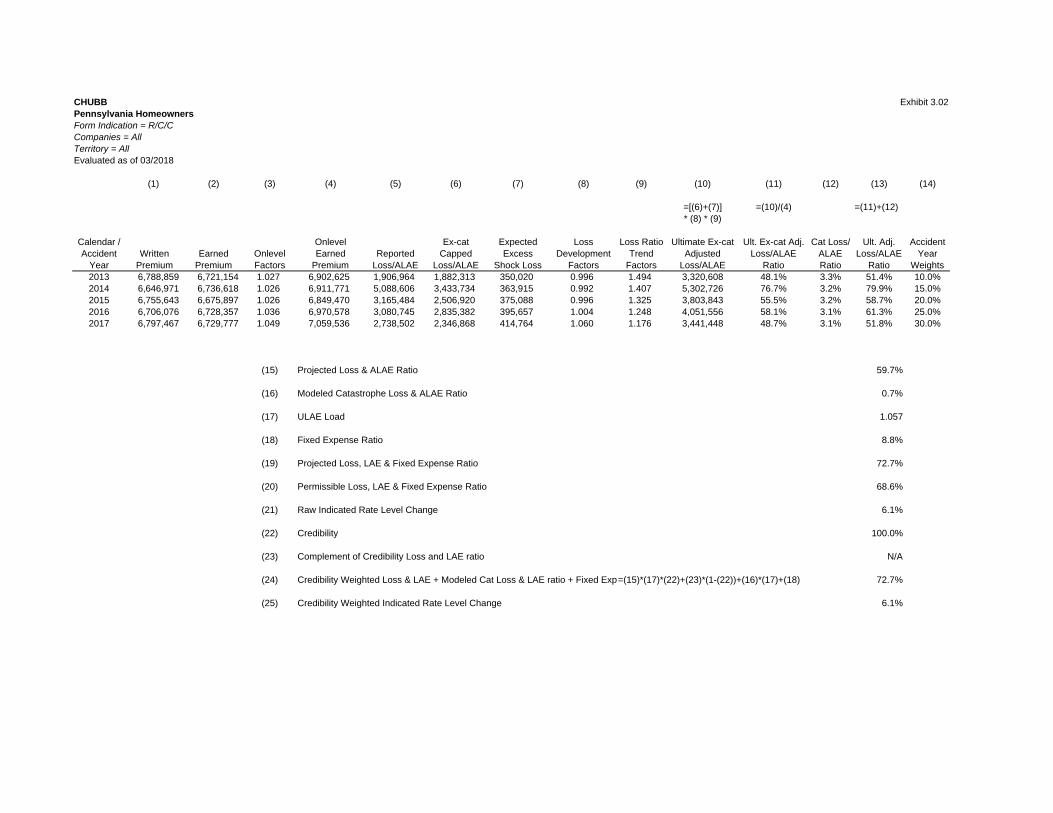
CHUBB Exhibit 3.02Pennsylvania HomeownersForm Indication = R/C/CCompanies = AllTerritory = AllEvaluated as of 03/2018
(1) (2) (3) (4) (5) (6) (7) (8) (9) (10) (11) (12) (13) (14)
=[(6)+(7)] =(10)/(4) =(11)+(12)* (8) * (9)
Calendar / Onlevel Ex-cat Expected Loss Loss Ratio Ultimate Ex-cat Ult. Ex-cat Adj. Cat Loss/ Ult. Adj. AccidentAccident Written Earned Onlevel Earned Reported Capped Excess Development Trend Adjusted Loss/ALAE ALAE Loss/ALAE Year
Year Premium Premium Factors Premium Loss/ALAE Loss/ALAE Shock Loss Factors Factors Loss/ALAE Ratio Ratio Ratio Weights2013 6,788,859 6,721,154 1.027 6,902,625 1,906,964 1,882,313 350,020 0.996 1.494 3,320,608 48.1% 3.3% 51.4% 10.0%2014 6,646,971 6,736,618 1.026 6,911,771 5,088,606 3,433,734 363,915 0.992 1.407 5,302,726 76.7% 3.2% 79.9% 15.0%2015 6,755,643 6,675,897 1.026 6,849,470 3,165,484 2,506,920 375,088 0.996 1.325 3,803,843 55.5% 3.2% 58.7% 20.0%2016 6,706,076 6,728,357 1.036 6,970,578 3,080,745 2,835,382 395,657 1.004 1.248 4,051,556 58.1% 3.1% 61.3% 25.0%2017 6,797,467 6,729,777 1.049 7,059,536 2,738,502 2,346,868 414,764 1.060 1.176 3,441,448 48.7% 3.1% 51.8% 30.0%
(15) Projected Loss & ALAE Ratio 59.7%
(16) Modeled Catastrophe Loss & ALAE Ratio 0.7%
(17) ULAE Load 1.057
(18) Fixed Expense Ratio 8.8%
(19) Projected Loss, LAE & Fixed Expense Ratio 72.7%
(20) Permissible Loss, LAE & Fixed Expense Ratio 68.6%
(21) Raw Indicated Rate Level Change 6.1%
(22) Credibility 100.0%
(23) Complement of Credibility Loss and LAE ratio N/A
(24) Credibility Weighted Loss & LAE + Modeled Cat Loss & LAE ratio + Fixed Exp=(15)*(17)*(22)+(23)*(1-(22))+(16)*(17)+(18) 72.7%
(25) Credibility Weighted Indicated Rate Level Change 6.1%

CHUBB Exhibit 3.03Pennsylvania HomeownersForm Indication = City HomeCompanies = AllTerritory = AllEvaluated as of 03/2018
(1) (2) (3) (4) (5) (6) (7) (8) (9) (10) (11) (12) (13) (14)
=[(6)+(7)] =(10)/(4) =(11)+(12)* (8) * (9)
Calendar / Onlevel Ex-cat Expected Loss Loss Ratio Ultimate Ex-cat Ult. Ex-cat Adj. Cat Loss/ Ult. Adj. AccidentAccident Written Earned Onlevel Earned Reported Capped Excess Development Trend Adjusted Loss/ALAE ALAE Loss/ALAE Year
Year Premium Premium Factors Premium Loss/ALAE Loss/ALAE Shock Loss Factors Factors Loss/ALAE Ratio Ratio Ratio Weights2013 1,803,218 1,763,816 1.029 1,814,966 607,115 607,115 0 0.984 1.207 720,752 39.7% 4.2% 43.9% 10.0%2014 1,829,851 1,794,998 1.029 1,847,053 2,622,400 2,424,109 0 0.976 1.172 2,773,467 150.2% 4.2% 154.3% 15.0%2015 1,912,034 1,863,116 1.029 1,917,147 356,349 345,929 0 0.970 1.138 382,103 19.9% 4.1% 24.0% 20.0%2016 2,071,416 1,981,022 1.029 2,038,472 300,191 241,163 0 0.973 1.106 259,563 12.7% 4.0% 16.7% 25.0%2017 2,122,519 2,090,862 1.030 2,153,587 1,262,528 1,252,425 0 1.105 1.074 1,486,549 69.0% 3.9% 72.9% 30.0%
(15) Projected Loss & ALAE Ratio 58.4%
(16) Modeled Catastrophe Loss & ALAE Ratio 5.3%
(17) ULAE Load 1.057
(18) Fixed Expense Ratio 8.8%
(19) Projected Loss, LAE & Fixed Expense Ratio 76.1%
(20) Permissible Loss, LAE & Fixed Expense Ratio 68.6%
(21) Raw Indicated Rate Level Change 10.9%
(22) Credibility 34.6%
(23) Complement of Credibility Loss and LAE ratio 58.6%
(24) Credibility Weighted Loss & LAE + Modeled Cat Loss & LAE ratio + Fixed Exp =(15)*(17)*(22)+(23)*(1-(22))+(16)*(17)+(18) 74.1%
(25) Credibility Weighted Indicated Rate Level Change 8.0%

Exhibit 3.04CHUBBCountrywide (ex TX & NC)Coverage Indication = Homeowners Primary LiabilityEvaluated as of 03/2018
(1) (2) (3) (4) (5) (6) (7) (8) (9) (10) (11) (12) (13) (14)= (2) * (3) * (4) = (7) * (8) * (9) * = (11) * (12)
(10) / (5)
Total TotalCalendar Adjusted Uncapped Capped Pure Excess Adj. Ult. Adj. Ult. AccAccident Written Earned Onlevel Premium Earned Reported Reported Capped Premium Loss Loss/ALAE Loss/LAE YearYear Premium Premium Factors Trend Premium Loss/ALAE Loss/ALAE LDF Trend Load Ratio ULAE Ratio Weights2013 37,850,342 37,025,376 1.504 1.035 57,650,282 41,298,881 39,778,212 1.053 1.298 1.200 1.131 1.057 120% 10.0%2014 41,555,131 39,767,502 1.400 1.030 57,351,451 41,097,979 40,292,340 1.094 1.248 1.200 1.150 1.057 122% 15.0%2015 44,134,484 42,736,155 1.288 1.025 56,420,030 42,371,639 41,220,189 1.246 1.199 1.200 1.310 1.057 138% 20.0%2016 48,730,279 46,290,572 1.182 1.020 55,804,082 32,038,976 27,190,986 1.583 1.153 1.200 1.067 1.057 113% 25.0%2017 50,310,144 49,566,262 1.084 1.015 54,526,213 24,345,322 20,060,320 2.950 1.108 1.200 1.443 1.057 152% 30.0%
(15) 5‐Year Weighted Average Loss/LAE Ratio 131.8%
(16) Credibility 100.0%(17) Complement of Credibility (Countrywide 5‐year L/LAE ratio) N/A(18) Credibility Weighted Loss and LAE Ratio 131.8%
(19) Fixed Expense Ratio 8.8%(20) Total Loss/LAE Ratio + Fixed Expense = (18) + (19) 140.6%
(21) Variable Expense Ratio 19.3%(22) Underwriting Profit Provision 12.1%(23) Permissible Ratio = 1.0 ‐ [(21) + (22)] 68.6%
(24) Indicated Rate Level Change = (20) / (23) ‐ 1.0 105.1%

Exhibit 4.01
Mid-Atlantic Zone*
House and VacationAll Causes
Non-cat Reported Losses and ALAE March 31st 2018
Loss Development
Loss
Year 15 27 39 51 63 75 87 99 111 123 Ultimate
2008 - - - - 227,845,084 223,756,242 224,178,536 223,622,069 223,632,040 223,637,568 223,637,568
2009 - - - 229,119,677 228,981,468 226,427,839 226,223,516 225,944,801 225,924,916 - 225,924,916
2010 - - 195,261,184 194,670,845 194,113,623 194,208,562 194,289,122 194,628,712 - - 194,628,712
2011 - 222,766,581 220,370,910 221,473,245 220,087,514 220,301,491 220,492,776 - - - 220,492,776
2012 180,341,566 185,633,640 183,386,080 185,943,219 185,277,602 184,906,232 - - - - 184,906,232
2013 177,279,273 184,598,575 187,073,525 186,854,914 186,328,833 - - - - - 185,542,064
2014 260,621,238 269,593,637 264,653,636 263,727,082 - - - - - - 261,803,118
2015 229,692,791 236,734,740 242,588,620 - - - - - - - 240,883,910
2016 203,874,535 206,189,093 - - - - - - - - 204,094,931
2017 207,985,531 - - - - - - - - - 212,353,310
2008 0.982 1.002 0.998 1.000 1.000
2009 0.999 0.989 0.999 0.999 1.000
2010 0.997 0.997 1.000 1.000 1.002
2011 0.989 1.005 0.994 1.001 1.001
2012 1.029 0.988 1.014 0.996 0.998
2013 1.041 1.013 0.999 0.997
2014 1.034 0.982 0.996
2015 1.031 1.025
2016 1.011
5 Point 1.029 0.999 1.002 0.997 0.994 1.001 0.999 1.000 1.000
5 Point Ex Hi/Lo 1.031 0.997 1.000 0.997 0.996 1.000 1.000 1.000 1.000
3 Point 1.025 1.007 1.003 0.996 1.000 1.000 0.999 1.000 1.000
Average 1.029 1.001 1.002 0.996 0.997 1.000 1.000 1.000 1.000
5 Yr. Wtd. Avg. 1.029 0.999 1.002 0.997 0.994 1.001 0.999 1.000 1.000
3 Yr. Wtd. Avg. 1.026 1.005 1.002 0.996 1.000 1.000 0.999 1.000 1.000
Selected 1.031 0.997 1.000 0.997 0.996 1.000 1.000 1.000 1.000
Cumulative 1.021 0.990 0.993 0.993 0.996 1.000 1.000 1.000 1.000
*Mid-Atlantic Zone consists of: DE, DC, MD, NJ, NY, PA, VA, WV
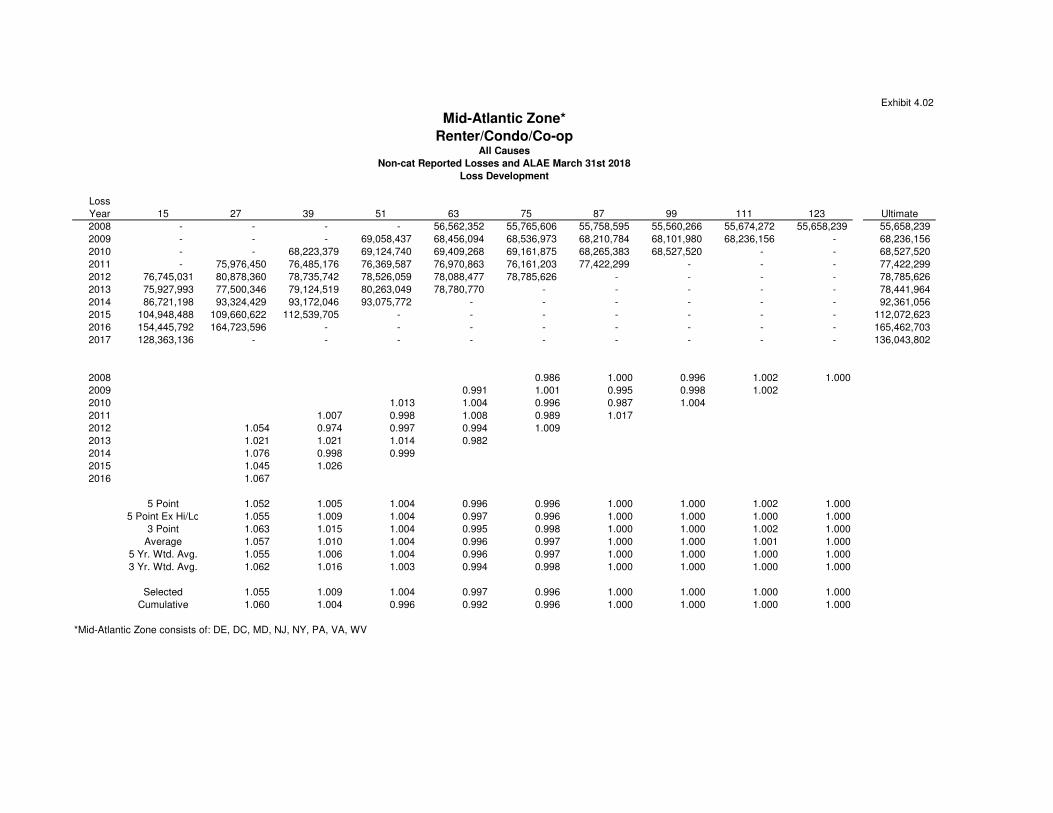
Exhibit 4.02
Mid-Atlantic Zone*
Renter/Condo/Co-opAll Causes
Non-cat Reported Losses and ALAE March 31st 2018
Loss Development
Loss
Year 15 27 39 51 63 75 87 99 111 123 Ultimate
2008 - - - - 56,562,352 55,765,606 55,758,595 55,560,266 55,674,272 55,658,239 55,658,239
2009 - - - 69,058,437 68,456,094 68,536,973 68,210,784 68,101,980 68,236,156 - 68,236,156
2010 - - 68,223,379 69,124,740 69,409,268 69,161,875 68,265,383 68,527,520 - - 68,527,520
2011 - 75,976,450 76,485,176 76,369,587 76,970,863 76,161,203 77,422,299 - - - 77,422,299
2012 76,745,031 80,878,360 78,735,742 78,526,059 78,088,477 78,785,626 - - - - 78,785,626
2013 75,927,993 77,500,346 79,124,519 80,263,049 78,780,770 - - - - - 78,441,964
2014 86,721,198 93,324,429 93,172,046 93,075,772 - - - - - - 92,361,056
2015 104,948,488 109,660,622 112,539,705 - - - - - - - 112,072,623
2016 154,445,792 164,723,596 - - - - - - - - 165,462,703
2017 128,363,136 - - - - - - - - - 136,043,802
2008 0.986 1.000 0.996 1.002 1.000
2009 0.991 1.001 0.995 0.998 1.002
2010 1.013 1.004 0.996 0.987 1.004
2011 1.007 0.998 1.008 0.989 1.017
2012 1.054 0.974 0.997 0.994 1.009
2013 1.021 1.021 1.014 0.982
2014 1.076 0.998 0.999
2015 1.045 1.026
2016 1.067
5 Point 1.052 1.005 1.004 0.996 0.996 1.000 1.000 1.002 1.000
5 Point Ex Hi/Lo 1.055 1.009 1.004 0.997 0.996 1.000 1.000 1.000 1.000
3 Point 1.063 1.015 1.004 0.995 0.998 1.000 1.000 1.002 1.000
Average 1.057 1.010 1.004 0.996 0.997 1.000 1.000 1.001 1.000
5 Yr. Wtd. Avg. 1.055 1.006 1.004 0.996 0.997 1.000 1.000 1.000 1.000
3 Yr. Wtd. Avg. 1.062 1.016 1.003 0.994 0.998 1.000 1.000 1.000 1.000
Selected 1.055 1.009 1.004 0.997 0.996 1.000 1.000 1.000 1.000
Cumulative 1.060 1.004 0.996 0.992 0.996 1.000 1.000 1.000 1.000
*Mid-Atlantic Zone consists of: DE, DC, MD, NJ, NY, PA, VA, WV

Exhibit 4.03
Mid-Atlantic Zone*
City HomesAll Causes
Non-cat Reported Losses and ALAE March 31st 2018
Loss Development
Loss
Year 15 27 39 51 63 75 87 99 111 123 Ultimate
2008 - - - - 7,009,494 6,866,246 6,814,329 6,814,329 6,814,329 6,814,329 6,814,329
2009 - - - 14,418,001 14,372,484 14,450,257 14,565,716 14,541,389 14,527,725 - 14,527,725
2010 - - 7,169,600 6,855,299 6,956,679 6,818,458 6,857,067 6,857,067 - - 6,857,067
2011 - 7,174,628 7,350,842 7,243,476 7,147,243 7,014,640 6,908,549 - - - 6,908,549
2012 7,685,821 7,861,690 8,810,401 9,531,899 9,239,705 9,144,675 - - - - 9,144,675
2013 14,969,905 18,797,152 18,161,965 18,398,702 18,271,598 - - - - - 17,974,948
2014 10,332,917 11,124,413 10,907,851 10,727,666 - - - - - - 10,471,352
2015 17,906,336 19,229,822 19,316,609 - - - - - - - 18,741,385
2016 19,545,619 25,704,621 - - - - - - - - 25,019,030
2017 51,886,632 - - - - - - - - - 57,340,344
2008 0.980 0.992 1.000 1.000 1.000
2009 0.997 1.005 1.008 0.998 0.999
2010 0.956 1.015 0.980 1.006 1.000
2011 1.025 0.985 0.987 0.981 0.985
2012 1.023 1.121 1.082 0.969 0.990
2013 1.256 0.966 1.013 0.993
2014 1.077 0.981 0.983
2015 1.074 1.005
2016 1.315
5 Point 1.149 1.019 1.004 0.992 0.987 0.998 0.999 1.000 1.000
5 Point Ex Hi/Lo 1.135 1.003 0.994 0.992 0.984 1.000 1.000 1.000 1.000
3 Point 1.155 0.984 1.026 0.983 0.984 1.000 0.999 1.000 1.000
Average 1.146 1.002 1.008 0.989 0.985 0.999 1.000 1.000 1.000
5 Yr. Wtd. Avg. 1.174 1.006 1.007 0.992 0.990 1.000 0.999 1.000 1.000
3 Yr. Wtd. Avg. 1.173 0.984 1.021 0.985 0.984 1.002 0.999 1.000 1.000
Selected 1.135 1.003 0.994 0.992 0.984 1.000 1.000 1.000 1.000
Cumulative 1.105 0.973 0.970 0.976 0.984 1.000 1.000 1.000 1.000
*Mid-Atlantic Zone consists of: DE, DC, MD, NJ, NY, PA, VA, WV

Exhibit 4.04
CHUBB
Homeowners Primary Liability
Countrywide (ex TX & NC)
Loss Development Factors
Losses Capped at $1M, Evaluated as of 3/2018
15 27 39 51 63 75 87 99 111 123 135
2007 20,246,639 29,482,772 34,684,928 38,547,938 40,786,722 43,852,540 44,441,189 44,443,835 44,298,833 44,373,834 44,568,834
2008 13,328,441 24,499,791 31,749,524 33,871,497 33,811,192 34,696,901 35,136,601 35,253,485 35,232,805 34,810,411
2009 14,150,115 30,901,343 39,120,843 44,991,417 47,521,135 50,698,914 50,124,529 50,836,459 50,851,460
2010 12,716,596 26,408,099 31,537,574 38,496,464 41,085,192 40,716,389 41,104,204 41,596,496
2011 16,594,713 34,080,660 40,418,547 42,804,733 42,796,534 44,124,028 44,587,603
2012 17,648,613 33,948,301 40,135,186 45,917,174 50,448,873 52,487,001
2013 11,419,121 23,609,331 33,316,078 39,295,321 38,513,293
2014 13,353,037 20,497,406 31,411,195 37,868,668
2015 15,138,076 29,493,777 38,796,035
2016 14,136,445 24,305,147
2017 18,908,912
15 - 27 27 - 39 39 - 51 51 - 63 63 - 75 75 - 87 87 - 99 99 - 111 111 - 123 123 - 135
2007 1.456 1.176 1.111 1.058 1.075 1.013 1.000 0.997 1.002 1.004
2008 1.838 1.296 1.067 0.998 1.026 1.013 1.003 0.999 0.988
2009 2.184 1.266 1.150 1.056 1.067 0.989 1.014 1.000
2010 2.077 1.194 1.221 1.067 0.991 1.010 1.012
2011 2.054 1.186 1.059 1.000 1.031 1.011
2012 1.924 1.182 1.144 1.099 1.040
2013 2.068 1.411 1.179 0.980
2014 1.535 1.532 1.206
2015 1.948 1.315
2016 1.719
Wtd avg 1.864 1.270 1.140 1.039 1.039 1.006 1.008 0.999 0.996 1.004
Last 5 1.839 1.325 1.162 1.040 1.031 1.007 1.007 0.999 0.995 1.004
5 pt ex hi lo 1.864 1.304 1.176 1.041 1.033 1.011
Average 1.880 1.284 1.142 1.037 1.038 1.007 1.007 0.999 0.995 1.004
Selected 1.864 1.270 1.140 1.039 1.039 1.006 1.008 0.999 0.996 1.004
To Ultimate 2.950 1.583 1.246 1.094 1.053 1.013 1.007 0.999 1.000 1.004

Exhibit 4.05
CHUBB
Homeowners Primary Liability
Countrywide (ex TX & NC)
Loss Development Factors
Losses Uncapped, Evaluated as of 3/2018
15 27 39 51 63 75 87 99 111 123 135
2007 26,331,640 38,166,924 42,464,567 47,405,158 50,162,730 52,489,751 53,078,399 53,081,046 52,936,044 53,011,044 53,206,044
2008 17,328,443 34,315,369 42,530,519 45,787,666 45,691,108 46,402,527 46,899,808 48,161,415 48,140,734 47,718,341
2009 16,447,243 48,125,918 61,722,858 69,280,088 73,613,974 78,957,363 78,395,059 78,903,842 78,918,842
2010 13,671,697 30,263,199 35,412,574 43,371,466 46,558,252 44,966,389 45,754,204 46,246,496
2011 16,623,936 42,256,355 49,245,793 50,629,024 50,618,477 51,945,972 52,409,546
2012 18,477,269 47,064,749 54,002,015 59,389,710 67,199,365 68,417,643
2013 11,419,121 26,143,518 35,133,985 40,815,991 40,033,962
2014 13,731,427 20,754,632 31,716,083 38,674,307
2015 15,138,076 29,508,813 39,947,485
2016 14,136,446 29,153,137
2017 23,193,914
15 - 27 27 - 39 39 - 51 51 - 63 63 - 75 75 - 87 87 - 99 99 - 111 111 - 123 123 - 135
2007 1.449 1.113 1.116 1.058 1.046 1.011 1.000 0.997 1.001 1.004
2008 1.980 1.239 1.077 0.998 1.016 1.011 1.027 1.000 0.991
2009 2.926 1.283 1.122 1.063 1.073 0.993 1.006 1.000
2010 2.214 1.170 1.225 1.073 0.966 1.018 1.011
2011 2.542 1.165 1.028 1.000 1.026 1.009
2012 2.547 1.147 1.100 1.131 1.018
2013 2.289 1.344 1.162 0.981
2014 1.511 1.528 1.219
2015 1.949 1.354
2016 2.062
Wtd avg 2.117 1.239 1.122 1.048 1.028 1.006 1.010 0.999 0.997 1.004
Last 5 2.072 1.308 1.147 1.050 1.020 1.008 1.011 0.999 0.996 1.004
5 pt ex hi lo 2.100 1.288 1.160 1.045 1.020 1.010
Average 2.147 1.260 1.131 1.043 1.024 1.008 1.011 0.999 0.996 1.004
Selected 2.117 1.239 1.122 1.048 1.028 1.006 1.010 0.999 0.997 1.004
To Ultimate 3.223 1.522 1.229 1.095 1.044 1.016 1.009 0.999 1.000 1.004

Exhibit 5.01CHUBB HOMEOWNERS PREMIUM TRENDS
Pennsylvania
(1) (2) (3) (4) (5) (6) (7)
Calendar Onleveled Onleveled Onleveled Onleveled Onleveled OnleveledQuarter Avg EP Avg WP Avg EP Avg WP Avg EP Avg WP
2012_Q1 3,503 3,562 4,007 4,090 1,283 1,3192012_Q2 3,508 3,448 4,013 3,927 1,277 1,2622012_Q3 3,490 3,399 3,996 3,899 1,269 1,2042012_Q4 3,472 3,476 3,980 4,018 1,260 1,2342013_Q1 3,462 3,543 3,973 4,081 1,246 1,3082013_Q2 3,462 3,461 3,975 3,957 1,252 1,2842013_Q3 3,470 3,447 3,994 3,985 1,246 1,1592013_Q4 3,487 3,562 4,016 4,112 1,249 1,2922014_Q1 3,497 3,534 4,028 4,086 1,258 1,3092014_Q2 3,492 3,426 4,027 3,935 1,252 1,2542014_Q3 3,489 3,442 4,025 3,971 1,250 1,1622014_Q4 3,482 3,526 4,017 4,074 1,248 1,2902015_Q1 3,472 3,498 4,006 4,076 1,247 1,2952015_Q2 3,476 3,472 4,016 3,999 1,249 1,2702015_Q3 3,496 3,535 4,043 4,086 1,253 1,1882015_Q4 3,510 3,543 4,065 4,133 1,261 1,2942016_Q1 3,521 3,598 4,084 4,202 1,261 1,3222016_Q2 3,542 3,540 4,111 4,114 1,269 1,2762016_Q3 3,553 3,554 4,132 4,124 1,274 1,2272016_Q4 3,561 3,584 4,146 4,192 1,282 1,3342017_Q1 3,573 3,647 4,164 4,295 1,288 1,3242017_Q2 3,584 3,604 4,185 4,218 1,288 1,3062017_Q3 3,605 3,611 4,216 4,217 1,299 1,2362017_Q4 3,609 3,612 4,230 4,256 1,296 1,343
Average Annual Rate of ChangeEstimation Period EP WP EP WP EP WPLatest 24 Quarters 0.6% 0.8% 1.0% 1.2% 0.4% 0.6%Latest 20 Quarters 0.9% 0.9% 1.3% 1.4% 0.9% 0.8%Latest 16 Quarters 1.0% 1.3% 1.5% 1.8% 1.1% 1.2%Latest 12 Quarters 1.5% 1.4% 2.0% 1.9% 1.6% 1.3%
House/Vac/City R/C/C(8) Selected Historical Premium Trend 1.5% 0.5%(9) Selected Prospective Premium Trend 2.0% 1.0%
(10) Premium TrendCal Year House/Vac/City RCC
2013 1.125 1.0512014 1.109 1.0452015 1.092 1.0402016 1.076 1.0352017 1.060 1.030
(10) Premium Trend = [(1 + (8)) ^ Historical Period] * [(1 + (9)) ^ Proj Period]Proj Period in Yrs: 2.95
All Forms House/Vacation/City R/C/C

Exhibit 5.02CHUBB
Homeowners Primary Liability Countrywide (ex TX & NC)
Premium Trends
Calendar YearAverage Onleveled Earned Premium Change
2006 151.462007 152.96 1.0%2008 152.31 -0.4%2009 153.64 0.9%2010 154.81 0.8%2011 155.92 0.7%2012 157.23 0.8%2013 157.74 0.3%2014 158.32 0.4%2015 158.81 0.3%2016 159.66 0.5%2017 160.22 0.4%
Average Annual Change Based On Exponential Curve of Best Fit% Change
Latest 12 Years 0.5%Latest 8 Years 0.5%
Selected 0.5%

Exhibit 5.03
New Arising LossCapped at 1,000,000
US Total Excluding TXRolling Year % Change % Change % Change
Ended Actual Over Prior Yr Actual Over Prior Yr Actual Over Prior Yr31-Mar-08 12,246 -- 17,975 -- 19,523 --30-Jun-08 12,780 -- 17,597 -- 18,873 --30-Sep-08 13,184 -- 17,882 -- 19,313 --31-Dec-08 12,489 -- 17,876 -- 20,057 --31-Mar-09 13,219 7.9% 19,194 6.8% 21,300 9.1%30-Jun-09 14,369 12.4% 20,678 17.5% 22,716 20.4%30-Sep-09 16,379 24.2% 20,849 16.6% 23,371 21.0%31-Dec-09 18,055 44.6% 21,804 22.0% 24,038 19.8%31-Mar-10 18,506 40.0% 20,424 6.4% 23,609 10.8%30-Jun-10 17,505 21.8% 20,017 -3.2% 23,429 3.1%30-Sep-10 17,744 8.3% 21,286 2.1% 23,979 2.6%31-Dec-10 17,479 -3.2% 21,275 -2.4% 24,415 1.6%31-Mar-11 17,757 -4.0% 21,849 7.0% 25,108 6.3%30-Jun-11 18,053 3.1% 21,299 6.4% 25,328 8.1%30-Sep-11 17,369 -2.1% 21,472 0.9% 25,979 8.3%31-Dec-11 17,235 -1.4% 22,113 3.9% 26,310 7.8%31-Mar-12 16,442 -7.4% 22,835 4.5% 26,347 4.9%30-Jun-12 16,974 -6.0% 23,818 11.8% 26,988 6.6%30-Sep-12 16,643 -4.2% 24,378 13.5% 27,255 4.9%31-Dec-12 17,305 0.4% 24,685 11.6% 27,106 3.0%31-Mar-13 18,488 12.4% 25,375 11.1% 27,686 5.1%30-Jun-13 17,940 5.7% 25,583 7.4% 28,366 5.1%30-Sep-13 19,159 15.1% 25,971 6.5% 28,782 5.6%31-Dec-13 18,567 7.3% 25,977 5.2% 29,360 8.3%31-Mar-14 19,877 7.5% 27,080 6.7% 31,330 13.2%30-Jun-14 20,700 15.4% 28,460 11.2% 32,675 15.2%30-Sep-14 21,271 11.0% 28,879 11.2% 33,766 17.3%31-Dec-14 23,181 24.9% 30,171 16.1% 34,914 18.9%31-Mar-15 22,237 11.9% 30,541 12.8% 35,260 12.5%30-Jun-15 22,972 11.0% 32,336 13.6% 37,061 13.4%30-Sep-15 25,811 21.3% 35,522 23.0% 38,604 14.3%31-Dec-15 25,428 9.7% 36,586 21.3% 40,564 16.2%31-Mar-16 26,173 17.7% 36,012 17.9% 40,287 14.3%30-Jun-16 26,568 15.7% 35,765 10.6% 40,340 8.8%30-Sep-16 24,375 -5.6% 34,751 -2.2% 41,346 7.1%31-Dec-16 26,678 4.9% 36,954 1.0% 41,483 2.3%31-Mar-17 28,164 7.6% 38,304 6.4% 43,096 7.0%30-Jun-17 32,767 23.3% 40,513 13.3% 44,125 9.4%30-Sep-17 32,906 35.0% 41,559 19.6% 44,933 8.7%31-Dec-17 32,150 20.5% 40,919 10.7% 45,907 10.7%31-Mar-18 34,216 21.5% 43,785 14.3% 46,628 8.2%
Average Annual Change Based On Exponential Curve of Best Fit% Change R Squared % Change R Squared % Change R Squared
Latest 37 Quarters 8.7% 86.1% 9.5% 95.8% 9.2% 97.2%Latest 29 Quarters 11.0% 91.5% 11.1% 97.9% 10.3% 97.7%Latest 21 Quarters 13.5% 94.8% 11.9% 96.4% 11.3% 97.2%Latest 15 Quarters 13.6% 88.3% 11.1% 91.3% 9.3% 96.5%
*Mid-Atlantic Zone consists of: DE, DC, MD, NJ, NY, PA, VA, WV
PA Mid-Atlantic Zone*
CHUBBHOMEOWNERS SEVERITY TRENDS
HOUSE, VACATION, & CITYCause of Loss = ALL
Ex Cat

Exhibit 5.04
New Arising Claim Frequency per 100 Earned House YearsUS Total Excluding TX
Rolling Year % Change % Change % ChangeEnded Actual Over Prior Yr Actual Over Prior Yr Actual Over Prior Yr
31-Mar-08 8.5321 -- 7.2446 -- 6.2995 --30-Jun-08 8.4657 -- 7.0265 -- 6.2366 --30-Sep-08 8.0837 -- 6.7982 -- 6.1986 --31-Dec-08 7.5743 -- 6.2096 -- 5.8847 --31-Mar-09 7.5053 -12.0% 6.1589 -15.0% 5.9583 -5.4%30-Jun-09 7.6670 -9.4% 6.2187 -11.5% 5.9540 -4.5%30-Sep-09 8.1341 0.6% 6.5049 -4.3% 6.0132 -3.0%31-Dec-09 8.6066 13.6% 6.6634 7.3% 6.0749 3.2%31-Mar-10 8.6870 15.7% 6.5684 6.6% 5.8608 -1.6%30-Jun-10 9.3473 21.9% 6.9073 11.1% 5.9976 0.7%30-Sep-10 9.3430 14.9% 6.7309 3.5% 5.8995 -1.9%31-Dec-10 9.3506 8.6% 6.7408 1.2% 5.8673 -3.4%31-Mar-11 9.3493 7.6% 6.8981 5.0% 6.0299 2.9%30-Jun-11 9.1850 -1.7% 6.9239 0.2% 6.2341 3.9%30-Sep-11 9.6189 3.0% 7.0218 4.3% 6.3073 6.9%31-Dec-11 10.1135 8.2% 7.3771 9.4% 6.4951 10.7%31-Mar-12 9.7465 4.2% 6.8222 -1.1% 5.9647 -1.1%30-Jun-12 8.9162 -2.9% 6.1923 -10.6% 5.3578 -14.1%30-Sep-12 8.1193 -15.6% 5.7594 -18.0% 5.0425 -20.1%31-Dec-12 7.1120 -29.7% 5.1467 -30.2% 4.6380 -28.6%31-Mar-13 6.7001 -31.3% 5.1512 -24.5% 4.7040 -21.1%30-Jun-13 6.6455 -25.5% 5.0925 -17.8% 4.6928 -12.4%30-Sep-13 6.3946 -21.2% 5.0707 -12.0% 4.6333 -8.1%31-Dec-13 6.3072 -11.3% 4.9702 -3.4% 4.5849 -1.1%31-Mar-14 7.0258 4.9% 5.2312 1.6% 4.7288 0.5%30-Jun-14 7.7656 16.9% 5.8900 15.7% 5.1318 9.4%30-Sep-14 7.7378 21.0% 5.9394 17.1% 5.1795 11.8%31-Dec-14 7.8391 24.3% 6.0158 21.0% 5.2441 14.4%31-Mar-15 6.9579 -1.0% 5.5058 5.2% 4.9499 4.7%30-Jun-15 6.3013 -18.9% 5.2215 -11.3% 4.8563 -5.4%30-Sep-15 6.3553 -17.9% 5.1939 -12.6% 4.8584 -6.2%31-Dec-15 6.3888 -18.5% 5.1911 -13.7% 4.8464 -7.6%31-Mar-16 6.2817 -9.7% 5.0955 -7.5% 4.8063 -2.9%30-Jun-16 5.9515 -5.6% 4.6050 -11.8% 4.4205 -9.0%30-Sep-16 5.6256 -11.5% 4.5277 -12.8% 4.3616 -10.2%31-Dec-16 5.6438 -11.7% 4.6253 -10.9% 4.3621 -10.0%31-Mar-17 5.6686 -9.8% 4.6532 -8.7% 4.3903 -8.7%30-Jun-17 5.5691 -6.4% 4.6526 1.0% 4.4159 -0.1%30-Sep-17 5.6985 1.3% 4.8052 6.1% 4.4862 2.9%31-Dec-17 5.8102 2.9% 4.8591 5.1% 4.5144 3.5%31-Mar-18 5.8288 2.8% 4.8636 4.5% 4.5074 2.7%
% Change R Squared % Change R Squared % Change R SquaredLatest 37 Quarters -5.7% 68.1% -4.5% 70.1% -4.0% 74.2%Latest 29 Quarters -7.5% 77.1% -5.3% 65.9% -4.3% 61.6%Latest 21 Quarters -4.8% 50.1% -3.0% 32.0% -2.0% 29.0%Latest 15 Quarters -8.2% 73.2% -6.2% 63.5% -4.7% 71.6%
*Mid-Atlantic Zone consists of: DE, DC, MD, NJ, NY, PA, VA, WV
CHUBBHOMEOWNERS FREQUENCY TRENDS
PA Mid-Atlantic Zone*
Average Annual Change Based On Exponential Curve of Best Fit
HOUSE, VACATION, & CITYCause of Loss = ALL
Ex Cat

Exhibit 5.05
New Arising LossCapped at 1,000,000
US Total Excluding TXRolling Year % Change % Change % Change
Ended Actual Over Prior Yr Actual Over Prior Yr Actual Over Prior Yr31-Mar-08 10,788 -- 17,747 -- 16,587 --30-Jun-08 11,104 -- 17,591 -- 16,431 --30-Sep-08 12,537 -- 17,572 -- 16,350 --31-Dec-08 11,826 -- 17,157 -- 16,646 --31-Mar-09 9,621 -10.8% 16,839 -5.1% 16,513 -0.4%30-Jun-09 9,629 -13.3% 17,292 -1.7% 16,898 2.8%30-Sep-09 13,957 11.3% 18,606 5.9% 17,934 9.7%31-Dec-09 13,260 12.1% 18,920 10.3% 17,465 4.9%31-Mar-10 14,915 55.0% 19,261 14.4% 17,956 8.7%30-Jun-10 15,672 62.8% 19,034 10.1% 18,046 6.8%30-Sep-10 10,394 -25.5% 18,556 -0.3% 17,815 -0.7%31-Dec-10 10,881 -17.9% 18,837 -0.4% 18,609 6.6%31-Mar-11 8,623 -42.2% 19,760 2.6% 18,891 5.2%30-Jun-11 9,383 -40.1% 20,365 7.0% 19,398 7.5%30-Sep-11 10,980 5.6% 21,061 13.5% 19,776 11.0%31-Dec-11 10,730 -1.4% 21,357 13.4% 19,795 6.4%31-Mar-12 11,664 35.3% 20,800 5.3% 19,391 2.6%30-Jun-12 10,802 15.1% 21,931 7.7% 20,240 4.3%30-Sep-12 10,705 -2.5% 22,601 7.3% 21,159 7.0%31-Dec-12 10,407 -3.0% 22,737 6.5% 21,416 8.2%31-Mar-13 9,490 -18.6% 24,718 18.8% 23,000 18.6%30-Jun-13 8,933 -17.3% 24,627 12.3% 23,013 13.7%30-Sep-13 8,264 -22.8% 24,908 10.2% 23,183 9.6%31-Dec-13 9,199 -11.6% 25,272 11.2% 23,643 10.4%31-Mar-14 10,764 13.4% 25,417 2.8% 24,432 6.2%30-Jun-14 13,019 45.7% 26,670 8.3% 25,715 11.7%30-Sep-14 13,335 61.4% 27,727 11.3% 26,196 13.0%31-Dec-14 14,473 57.3% 26,894 6.4% 26,130 10.5%31-Mar-15 17,241 60.2% 27,169 6.9% 26,323 7.7%30-Jun-15 18,722 43.8% 27,679 3.8% 27,066 5.3%30-Sep-15 19,136 43.5% 29,086 4.9% 28,393 8.4%31-Dec-15 19,291 33.3% 33,269 23.7% 31,102 19.0%31-Mar-16 18,516 7.4% 35,536 30.8% 32,277 22.6%30-Jun-16 18,269 -2.4% 35,749 29.2% 32,032 18.3%30-Sep-16 19,659 2.7% 37,733 29.7% 34,059 20.0%31-Dec-16 20,771 7.7% 42,287 27.1% 37,436 20.4%31-Mar-17 19,710 6.4% 42,800 20.4% 38,215 18.4%30-Jun-17 16,658 -8.8% 45,217 26.5% 40,219 25.6%30-Sep-17 15,861 -19.3% 48,522 28.6% 42,184 23.9%31-Dec-17 13,405 -35.5% 45,551 7.7% 40,376 7.9%31-Mar-18 21,233 7.7% 44,314 3.5% 38,866 1.7%
Average Annual Change Based On Exponential Curve of Best Fit% Change R Squared % Change R Squared % Change R Squared
Latest 37 Quarters 7.3% 42.7% 11.8% 94.0% 10.9% 95.8%Latest 29 Quarters 12.7% 67.2% 13.7% 94.0% 12.6% 96.6%Latest 21 Quarters 16.5% 59.6% 16.3% 92.6% 14.2% 95.5%Latest 15 Quarters 3.2% 5.5% 20.4% 92.8% 16.4% 93.7%
*Mid-Atlantic Zone consists of: DE, DC, MD, NJ, NY, PA, VA, WV
PA Mid-Atlantic Zone*
CHUBBHOMEOWNERS SEVERITY TRENDS
R/C/C Cause of Loss = ALL
Ex Cat

Exhibit 5.06
New Arising Claim Frequency per 100 Earned House YearsUS Total Excluding TX
Rolling Year % Change % Change % ChangeEnded Actual Over Prior Yr Actual Over Prior Yr Actual Over Prior Yr
31-Mar-08 3.7285 -- 3.8051 -- 3.2921 --30-Jun-08 3.8613 -- 3.7948 -- 3.3213 --30-Sep-08 4.0184 -- 3.9192 -- 3.4033 --31-Dec-08 4.8252 -- 4.6629 -- 4.0642 --31-Mar-09 5.2054 39.6% 5.2680 38.4% 4.5854 39.3%30-Jun-09 5.1933 34.5% 5.3080 39.9% 4.6029 38.6%30-Sep-09 5.6292 40.1% 5.4040 37.9% 4.7181 38.6%31-Dec-09 6.0056 24.5% 5.4263 16.4% 4.7053 15.8%31-Mar-10 5.9321 14.0% 5.2574 -0.2% 4.5731 -0.3%30-Jun-10 5.7114 10.0% 5.2647 -0.8% 4.5329 -1.5%30-Sep-10 5.0898 -9.6% 5.1852 -4.0% 4.4638 -5.4%31-Dec-10 4.7365 -21.1% 5.2350 -3.5% 4.5204 -3.9%31-Mar-11 4.4297 -25.3% 5.2490 -0.2% 4.4835 -2.0%30-Jun-11 4.6395 -18.8% 5.1810 -1.6% 4.4819 -1.1%30-Sep-11 5.1201 0.6% 5.3195 2.6% 4.5749 2.5%31-Dec-11 5.7670 21.8% 5.4991 5.0% 4.6751 3.4%31-Mar-12 5.9335 33.9% 5.4005 2.9% 4.5927 2.4%30-Jun-12 5.9338 27.9% 5.4627 5.4% 4.5623 1.8%30-Sep-12 5.7087 11.5% 5.2696 -0.9% 4.3992 -3.8%31-Dec-12 4.9115 -14.8% 4.9337 -10.3% 4.1623 -11.0%31-Mar-13 4.8931 -17.5% 5.0728 -6.1% 4.2369 -7.7%30-Jun-13 4.7084 -20.7% 4.9860 -8.7% 4.1389 -9.3%30-Sep-13 4.4625 -21.8% 4.9537 -6.0% 4.0888 -7.1%31-Dec-13 4.4748 -8.9% 4.9343 0.0% 4.0923 -1.7%31-Mar-14 4.4205 -9.7% 4.9383 -2.7% 4.1450 -2.2%30-Jun-14 4.5835 -2.7% 5.0501 1.3% 4.2862 3.6%30-Sep-14 4.5276 1.5% 4.9300 -0.5% 4.2410 3.7%31-Dec-14 4.5259 1.1% 4.8898 -0.9% 4.2010 2.7%31-Mar-15 4.2906 -2.9% 4.6913 -5.0% 3.9878 -3.8%30-Jun-15 4.2182 -8.0% 4.6328 -8.3% 3.9463 -7.9%30-Sep-15 4.1889 -7.5% 4.6188 -6.3% 3.9285 -7.4%31-Dec-15 4.0676 -10.1% 4.5930 -6.1% 3.8929 -7.3%31-Mar-16 4.0493 -5.6% 4.5982 -2.0% 3.9720 -0.4%30-Jun-16 4.0127 -4.9% 4.5597 -1.6% 3.9376 -0.2%30-Sep-16 3.8043 -9.2% 4.6361 0.4% 3.9624 0.9%31-Dec-16 3.8888 -4.4% 4.7292 3.0% 4.0143 3.1%31-Mar-17 3.7586 -7.2% 4.7489 3.3% 3.9274 -1.1%30-Jun-17 3.7196 -7.3% 4.6462 1.9% 3.8535 -2.1%30-Sep-17 3.8574 1.4% 4.4820 -3.3% 3.7405 -5.6%31-Dec-17 3.8675 -0.5% 4.4016 -6.9% 3.7148 -7.5%31-Mar-18 4.3067 14.6% 4.3464 -8.5% 3.8042 -3.1%
% Change R Squared % Change R Squared % Change R SquaredLatest 37 Quarters -4.5% 71.3% -2.3% 83.6% -2.5% 88.6%Latest 29 Quarters -5.1% 66.1% -2.8% 85.2% -2.8% 84.8%Latest 21 Quarters -4.3% 73.6% -2.5% 78.6% -2.2% 73.0%Latest 15 Quarters -3.9% 49.0% -2.2% 55.1% -2.6% 67.6%
*Mid-Atlantic Zone consists of: DE, DC, MD, NJ, NY, PA, VA, WV
Average Annual Change Based On Exponential Curve of Best Fit
CHUBBHOMEOWNERS FREQUENCY TRENDS
R/C/C Cause of Loss = ALL
Ex Cat
PA Mid-Atlantic Zone*

Exhibit 5.07
Historical Prospective Historical ProspectiveHouse, Vacation Home, & City Home
-5.0% -5.0% 10.0% 10.0%
R/C/C -3.0% -3.0% 10.0% 10.0%
CHUBBLoss Trend Selections
Frequency Trend Severity Trend

Exhibit 5.08CHUBBPennsylvania HomeownersForm Indication = House & Vacation Home, City HomeCompanies = AllTerritory = AllEvaluated as of 03/2018
Calculation of Loss Ratio Trend Factors
(1) (2) (3) (4) (5) Calendar / Loss
Accident Frequency Severity Premium RatioYear Trend Trend Trend Trend2013 0.700 1.939 1.125 1.2072014 0.737 1.763 1.109 1.1722015 0.776 1.603 1.092 1.1382016 0.817 1.457 1.076 1.1062017 0.860 1.325 1.060 1.074
(2) Based on Frequency Selections in Exhibit 5.07 and a projection period of 2.95 yrs(3) Based on Severity Selections in Exhibit 5.07 and a projection period of 2.95 yrs(4) Exhibit 5.01 (10)(5) = (2) * (3) / (4)

Exhibit 5.09CHUBBPennsylvania HomeownersForm Indication = R/C/CCompanies = AllTerritory = AllEvaluated as of 03/2018
Calculation of Loss Ratio Trend Factors
(1) (2) (3) (4) (5) Calendar / Loss
Accident Frequency Severity Premium RatioYear Trend Trend Trend Trend2013 0.809 1.939 1.051 1.4942014 0.834 1.763 1.045 1.4072015 0.860 1.603 1.040 1.3252016 0.887 1.457 1.035 1.2482017 0.914 1.325 1.030 1.176
(2) Based on Frequency Selections in Exhibit 5.07 and a projection period of 2.95 yrs(3) Based on Severity Selections in Exhibit 5.07 and a projection period of 2.95 yrs(4) Exhibit 5.01 (10)(5) = (2) * (3) / (4)
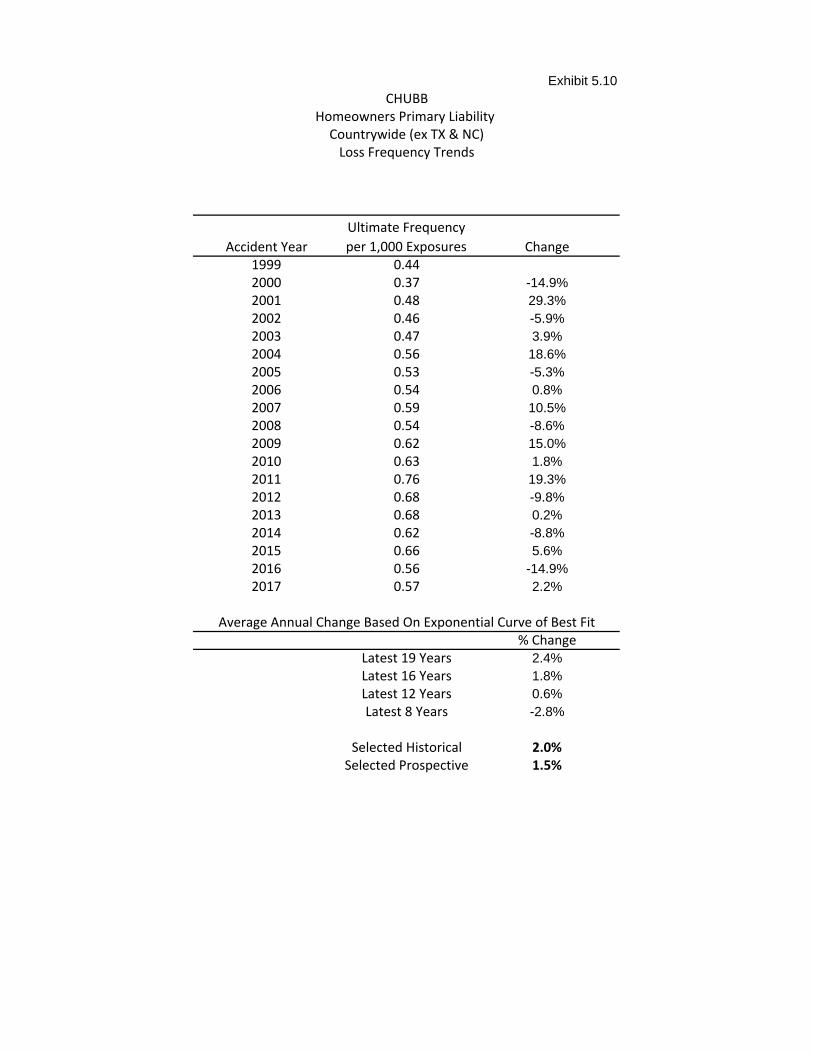
Exhibit 5.10CHUBB
Homeowners Primary Liability Countrywide (ex TX & NC)Loss Frequency Trends
Accident YearUltimate Frequency per 1,000 Exposures Change
1999 0.442000 0.37 -14.9%2001 0.48 29.3%2002 0.46 -5.9%2003 0.47 3.9%2004 0.56 18.6%2005 0.53 -5.3%2006 0.54 0.8%2007 0.59 10.5%2008 0.54 -8.6%2009 0.62 15.0%2010 0.63 1.8%2011 0.76 19.3%2012 0.68 -9.8%2013 0.68 0.2%2014 0.62 -8.8%2015 0.66 5.6%2016 0.56 -14.9%2017 0.57 2.2%
Average Annual Change Based On Exponential Curve of Best Fit% Change
Latest 19 Years 2.4%Latest 16 Years 1.8%Latest 12 Years 0.6%Latest 8 Years -2.8%
Selected Historical 2.0%Selected Prospective 1.5%

Exhibit 5.11CHUBB
Homeowners Primary Liability Countrywide (ex TX & NC)
Loss Severity Trends
Losses Capped at $1M
Accident YearUltimate Capped
Severity Change1999 156,6402000 111,404 -28.9%2001 166,096 49.1%2002 172,395 3.8%2003 192,989 11.9%2004 161,471 -16.3%2005 201,034 24.5%2006 182,844 -9.0%2007 194,624 6.4%2008 170,639 -12.3%2009 226,006 32.4%2010 188,004 -16.8%2011 171,304 -8.9%2012 222,407 29.8%2013 168,231 -24.4%2014 189,109 12.4%2015 212,071 12.1%2016 200,344 -5.5%2017 290,520 45.0%
Average Annual Change Based On Exponential Curve of Best Fit% Change
Latest 19 Years 2.3%Latest 16 Years 1.6%Latest 12 Years 2.1%Latest 8 Years 4.6%
Selected Historical 2.0%Selected Prospective 2.0%

Exhibit 5.12CHUBBPennsylvania HomeownersCoverage Indication = Homeowners Primary LiabilityEvaluated as of 03/2018
Calculation of Loss Ratio Trend Factors
(1) (2) (3) (4) (5) (6) Calendar / Pure Loss
Accident Frequency Severity Premium Premium RatioYear Trend Trend Trend Trend Trend2013 1.131 1.148 1.298 1.035 1.2542014 1.109 1.125 1.248 1.030 1.2112015 1.087 1.103 1.199 1.025 1.1702016 1.066 1.081 1.153 1.020 1.1302017 1.045 1.060 1.108 1.015 1.092
(2) Based on Frequency Selections in Exhibit 5.10 and a projection period of 2.95 yrs(3) Based on Severity Selections in Exhibit 5.11 and a projection period of 2.95 yrs(4) = (2) * (3)(5) Based on Premium Trend Selection in Exhibit 5.02 and a projection period of 2.95 yrs(6) = (4) / (5)

Exhibit 6.01
(A) (B) (C) (D) (E) (F) (G)Calendar/ EarnedAccident Insurance Catastrophe Earned Insurance Year Cat Factor
Year Years (000's) Losses 1-Yr 5-Yr 10-Yr 15-Yr 20-Yr(EIY) (B) / (A)
1988 - 10,615 1989 - 1,188,281 1990 - 130,906 1991 7,325,722 129,745 1992 7,791,935 2,418,328 1993 8,300,601 1,953,186 23.5%1994 8,685,332 13,318,816 153.3%1995 9,160,967 532,516 5.8%1996 9,902,801 10,342,648 104.4%1997 10,962,969 460,117 4.2% 56.6%1998 12,277,944 6,498,141 52.9% 61.1%1999 13,548,245 1,707,137 12.6% 35.0%2000 14,945,948 1,580,028 10.6% 33.4%2001 16,822,360 280,529 1.7% 15.4%2002 18,707,855 1,889,910 10.1% 15.7% 31.3%2003 20,494,675 6,946,966 33.9% 14.7% 32.1%2004 22,070,856 1,827,004 8.3% 13.5% 21.5%2005 23,342,801 1,475,636 6.3% 12.2% 20.2%2006 24,834,938 3,776,574 15.2% 14.5% 14.9%2007 26,184,076 5,304,935 20.3% 16.5% 16.2% 24.1%2008 26,890,588 1,242,680 4.6% 11.0% 12.5% 22.1%2009 26,925,378 3,027,281 11.2% 11.6% 12.4% 16.9%2010 26,540,169 29,019,728 109.3% 32.3% 23.5% 25.6%2011 26,422,680 4,164,450 15.8% 32.2% 24.2% 22.3%2012 26,965,178 1,526,680 5.7% 29.1% 23.3% 21.5% 25.9%2013 28,119,950 1,128,193 4.0% 28.8% 20.3% 18.9% 24.4%2014 29,159,580 22,771,249 78.1% 42.7% 27.7% 24.0% 25.5%2015 29,962,215 9,380,595 31.3% 27.7% 29.9% 25.1% 26.3%2016 30,835,057 2,927,244 9.5% 26.0% 29.0% 24.9% 23.4%2017 31,212,697 1,542,538 4.9% 25.3% 27.1% 24.0% 22.7%
All Years Weighted Average: 25.5%
CHUBBPA
Catastrophe Load Exhibit: All Cats Excl. Hurr. & Trop. StormsCalendar/Accident Year as of March 31, 2018
Historical Data: House & Vacation Homes

Exhibit 6.02
(A) (B) (C) (D) (E) (F) (G)Calendar/ Trended Earned TrendedAccident Insurance Catastrophe Earned Insurance Year Cat Factor
Year Years (000's) Losses 1-Yr 5-Yr 10-Yr 15-Yr 20-Yr(EIY) (B) / (A)
1988 - 166,608 1989 - 17,110,759 1990 - 1,729,351 1991 45,729,744 1,572,489 1992 45,658,377 26,889,692 1993 45,657,436 19,924,513 43.6%1994 44,845,124 124,647,405 278.0%1995 44,401,430 4,572,185 10.3%1996 45,054,745 81,469,747 180.8%1997 46,820,653 3,325,113 7.1% 103.2%1998 49,222,283 43,082,486 87.5% 111.6%1999 50,985,419 10,383,733 20.4% 60.4%2000 52,797,486 8,817,052 16.7% 60.1%2001 55,783,213 1,436,183 2.6% 26.2%2002 58,232,768 8,876,602 15.2% 27.2% 62.1%2003 59,884,067 29,934,659 50.0% 21.4% 62.3%2004 60,536,355 7,222,576 11.9% 19.6% 38.0%2005 60,100,334 5,351,868 8.9% 17.9% 37.1%2006 60,022,465 12,566,017 20.9% 21.4% 23.6%2007 59,403,882 16,193,966 27.3% 23.8% 25.4% 47.6%2008 57,267,035 3,480,214 6.1% 15.1% 18.1% 44.9%2009 53,826,115 7,778,089 14.5% 15.6% 17.6% 30.0%2010 49,803,715 68,404,865 137.3% 38.7% 28.0% 37.6%2011 46,543,791 9,005,852 19.3% 39.3% 29.8% 28.7%2012 44,587,694 3,028,926 6.8% 36.4% 29.5% 28.8% 44.9%2013 43,646,868 2,053,513 4.7% 37.9% 25.2% 23.9% 43.3%2014 42,486,078 38,025,463 89.5% 53.1% 32.0% 27.6% 35.0%2015 40,979,449 14,371,151 35.1% 30.5% 35.1% 28.7% 36.1%2016 39,588,020 4,114,278 10.4% 29.2% 34.8% 29.7% 28.8%2017 37,616,393 1,989,042 5.3% 29.6% 33.4% 29.6% 28.9%
All Years Weighted Average: 41.6%
Selected Cat Factor to EIYs: 33.6%
CHUBBPA
Catastrophe Load Exhibit: All Cats Excl. Hurr. & Trop. StormsCalendar/Accident Year as of March 31, 2018
Trended Data: House & Vacation Homes

Exhibit 6.03
(A) (B) (C) (D) (E) (F) (G)Calendar/ EarnedAccident Insurance Catastrophe Earned Insurance Year Cat Factor
Year Years (000's) Losses 1-Yr 5-Yr 10-Yr 15-Yr 20-Yr(EIY) (B) / (A)
1988 - - 1989 - 112 1990 - - 1991 - 1,202 1992 - 68,653 1993 - 22,533 1994 - 377,481 1995 - 6,207 1996 626,904 90,771 1997 693,393 27,393 1998 759,523 34,164 4.5%1999 800,224 40,484 5.1%2000 878,989 13,202 1.5%2001 975,496 26,576 2.7%2002 1,083,765 23,777 2.2% 3.1%2003 1,200,137 153,811 12.8% 5.2%2004 1,306,195 185,123 14.2% 7.4%2005 1,431,823 106,824 7.5% 8.3%2006 1,537,276 47,525 3.1% 7.9%2007 1,649,522 79,105 4.8% 8.0% 6.1%2008 1,745,132 8,666 0.5% 5.6% 5.4%2009 1,751,628 36,626 2.1% 3.4% 5.0%2010 1,760,613 215,447 12.2% 4.6% 6.1%2011 1,814,831 10,719 0.6% 4.0% 5.7%2012 1,838,599 30,719 1.7% 3.4% 5.5% 4.9%2013 1,915,204 24,651 1.3% 3.5% 4.4% 4.6%2014 1,991,263 439,869 22.1% 7.7% 5.7% 6.1%2015 2,052,337 529,012 25.8% 10.8% 7.9% 8.0%2016 2,164,925 82,108 3.8% 11.1% 7.8% 7.8%2017 2,269,464 - 0.0% 10.3% 7.1% 7.4% 6.8%
All Years Weighted Average: 6.8%
CHUBBPA
Catastrophe Load Exhibit: All Cats Excl. Hurr. & Trop. StormsCalendar/Accident Year as of March 31, 2018
Historical Data: Renters/Condos/Co-ops
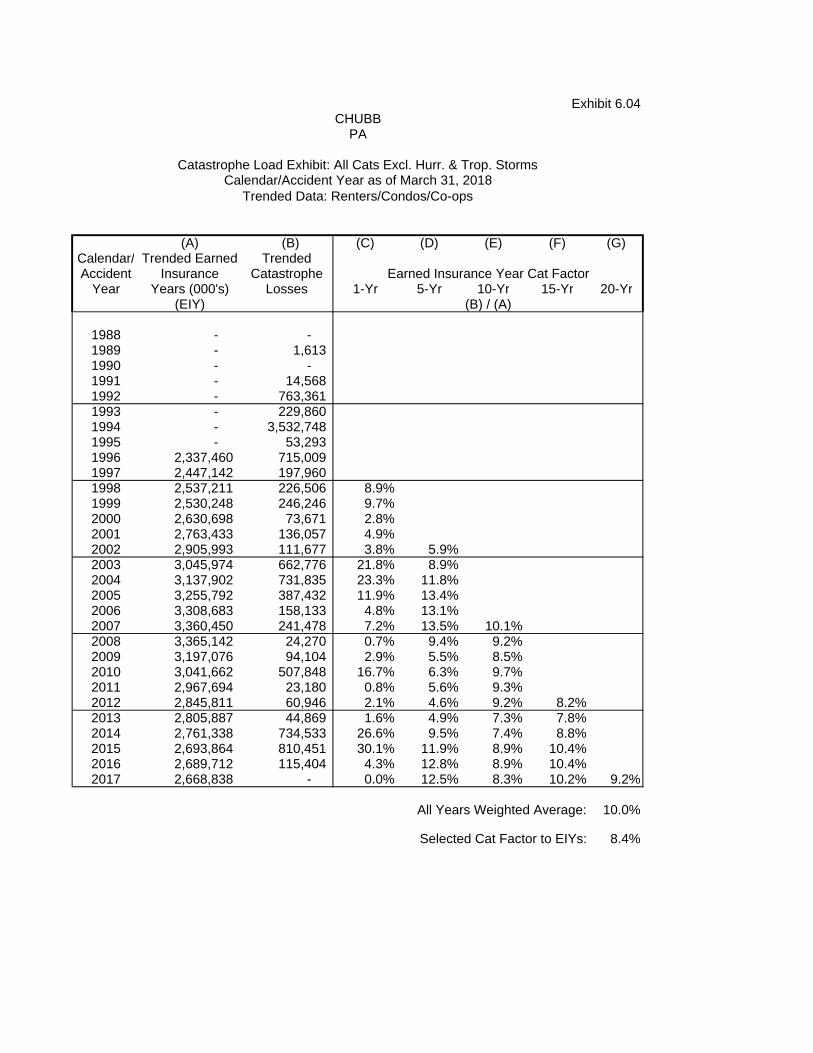
Exhibit 6.04
(A) (B) (C) (D) (E) (F) (G)Calendar/ Trended Earned TrendedAccident Insurance Catastrophe Earned Insurance Year Cat Factor
Year Years (000's) Losses 1-Yr 5-Yr 10-Yr 15-Yr 20-Yr(EIY) (B) / (A)
1988 - - 1989 - 1,613 1990 - - 1991 - 14,568 1992 - 763,361 1993 - 229,860 1994 - 3,532,748 1995 - 53,293 1996 2,337,460 715,009 1997 2,447,142 197,960 1998 2,537,211 226,506 8.9%1999 2,530,248 246,246 9.7%2000 2,630,698 73,671 2.8%2001 2,763,433 136,057 4.9%2002 2,905,993 111,677 3.8% 5.9%2003 3,045,974 662,776 21.8% 8.9%2004 3,137,902 731,835 23.3% 11.8%2005 3,255,792 387,432 11.9% 13.4%2006 3,308,683 158,133 4.8% 13.1%2007 3,360,450 241,478 7.2% 13.5% 10.1%2008 3,365,142 24,270 0.7% 9.4% 9.2%2009 3,197,076 94,104 2.9% 5.5% 8.5%2010 3,041,662 507,848 16.7% 6.3% 9.7%2011 2,967,694 23,180 0.8% 5.6% 9.3%2012 2,845,811 60,946 2.1% 4.6% 9.2% 8.2%2013 2,805,887 44,869 1.6% 4.9% 7.3% 7.8%2014 2,761,338 734,533 26.6% 9.5% 7.4% 8.8%2015 2,693,864 810,451 30.1% 11.9% 8.9% 10.4%2016 2,689,712 115,404 4.3% 12.8% 8.9% 10.4%2017 2,668,838 - 0.0% 12.5% 8.3% 10.2% 9.2%
All Years Weighted Average: 10.0%
Selected Cat Factor to EIYs: 8.4%
CHUBBPA
Catastrophe Load Exhibit: All Cats Excl. Hurr. & Trop. StormsCalendar/Accident Year as of March 31, 2018
Trended Data: Renters/Condos/Co-ops

Exhibit 6.05
(A) (B) (C) (D) (E) (F) (G)Calendar/ EarnedAccident Insurance Catastrophe Earned Insurance Year Cat Factor
Year Years (000's) Losses 1-Yr 5-Yr 10-Yr 15-Yr 20-Yr(EIY) (B) / (A)
1988 - - 1989 - - 1990 - - 1991 - - 1992 - - 1993 - - 1994 - - 1995 - - 1996 112,637 68,473 1997 127,807 - 1998 134,126 - 1999 148,583 - 2000 170,068 3,179 1.9%2001 191,974 999 0.5% 0.5%2002 241,406 - 0.5%2003 295,586 35,588 12.0% 3.8%2004 343,844 110,272 32.1% 12.1%2005 408,127 - 9.9%2006 492,539 - 8.2% 5.9%2007 558,006 885 0.2% 7.0% 5.1%2008 610,257 - 4.6% 4.4%2009 617,766 - 0.0% 3.8%2010 630,321 51,453 8.2% 1.8% 4.5%2011 650,913 4,896 0.8% 1.9% 4.2% 3.7%2012 676,704 - 1.8% 3.8% 3.4%2013 708,278 - 1.7% 2.9% 3.1%2014 759,864 198,291 26.1% 7.4% 4.2% 5.5%2015 807,504 10,420 1.3% 5.9% 4.1% 5.2%2016 875,736 59,028 6.7% 7.0% 4.7% 5.4%2017 950,330 10,103 1.1% 6.8% 4.6% 5.1% 4.7%
All Years Weighted Average: 5.3%
CHUBBPA
Catastrophe Load Exhibit: All Cats Excl. Hurr. & Trop. StormsCalendar/Accident Year as of March 31, 2018
Historical Data: City Homes

Exhibit 6.06
(A) (B) (C) (D) (E) (F) (G)Calendar/ Trended Earned TrendedAccident Insurance Catastrophe Earned Insurance Year Cat Factor
Year Years (000's) Losses 1-Yr 5-Yr 10-Yr 15-Yr 20-Yr(EIY) (B) / (A)
1988 - - 1989 - - 1990 - - 1991 - - 1992 - - 1993 - - 1994 - - 1995 - - 1996 326,943 539,367 1997 354,832 - 1998 356,172 - 0.0%1999 377,390 - 0.0%2000 413,162 17,740 4.3%2001 446,086 5,114 1.1%2002 536,539 - 0.0% 1.1%2003 628,367 153,350 24.4% 7.3%2004 699,146 435,931 62.4% 22.5%2005 793,739 - 0.0% 19.2%2006 916,220 - 0.0% 16.5%2007 992,831 2,702 0.3% 14.7% 10.0%2008 1,038,547 - 0.0% 9.9% 9.0%2009 1,005,574 - 0.0% 0.1% 8.2%2010 981,360 121,284 12.4% 2.5% 8.9%2011 969,318 10,588 1.1% 2.7% 8.5%2012 963,870 - 0.0% 2.7% 8.1% 6.7%2013 964,940 - 0.0% 2.7% 6.1% 6.4%2014 990,168 331,124 33.4% 9.5% 4.8% 8.7%2015 1,006,456 15,964 1.6% 7.3% 4.9% 8.3%2016 1,043,999 82,965 7.9% 8.7% 5.7% 8.5%2017 1,083,623 13,027 1.2% 8.7% 5.7% 8.3% 7.3%
All Years Weighted Average: 10.2%
Selected Cat Factor to EIYs: 7.8%
CHUBBPA
Catastrophe Load Exhibit: All Cats Excl. Hurr. & Trop. StormsCalendar/Accident Year as of March 31, 2018
Trended Data: City Homes

Exhibit 6.07CHUBBPennsylvania HomeownersForm Indication = House and Vacation HomeCompanies = AllTerritory = AllEvaluated as of 03/2018Catastrophe Loss and ALAE ratios
(1) (2) (3) (4) (5) (6) (7) (8) (9) (10) (11) (12)(1)*(2)*(3) (5)*(6) (7)*(8) (9)/(4) (10)+(11)
Calendar/ Trended Trended non-Modeled Expected non-Modeled Cat Modeled Cat Total CatAccident Earned On-level Premium On-level Earned Earned Catastrophe non-Modeled Loss&ALAE Loss&ALAE Loss&ALAE
Year Premium Factors Trend Premium Ins Years EIY Trend Ins Years Factor to EIY Catastrophe $'s Ratio Ratio Ratio2013 73,705,369 1.256 1.125 104,165,389 28,119,950 1.552 43,646,868 33.6% 14,665,347 14.1% 1.7% 15.8%2014 78,070,395 1.166 1.109 100,914,497 29,159,580 1.457 42,486,078 33.6% 14,275,322 14.1% 1.7% 15.9%2015 80,085,036 1.106 1.092 96,740,670 29,962,215 1.368 40,979,449 33.6% 13,769,095 14.2% 1.7% 15.9%2016 80,017,724 1.091 1.076 93,939,338 30,835,057 1.284 39,588,020 33.6% 13,301,575 14.2% 1.7% 15.9%2017 79,736,464 1.065 1.060 90,027,893 31,212,697 1.205 37,616,393 33.6% 12,639,108 14.0% 1.7% 15.7%
Total 391,614,988 485,787,787 149,289,498 204,316,807 33.6% 68,650,447 14.1% 1.7% 15.8%

Exhibit 6.08CHUBBPennsylvania HomeownersForm Indication = R/C/CCompanies = AllTerritory = AllEvaluated as of 03/2018Catastrophe Loss and ALAE ratios
(1) (2) (3) (4) (5) (6) (7) (8) (9) (10) (11) (12)(1)*(2)*(3) (5)*(6) (7)*(8) (9)/(4) (10)+(11)
Calendar/ Trended Trended non-Modeled Expected non-Modeled Cat Modeled Cat Total CatAccident Earned On-level Premium On-level Earned Earned Catastrophe non-Modeled Loss&ALAE Loss&ALAE Loss&ALAE
Year Premium Factors Trend Premium Ins Years EIY Trend Ins Years Factor to EIY Catastrophe $'s Ratio Ratio Ratio2013 6,721,154 1.027 1.051 7,251,479 1,915,204 1.465 2,805,887 8.4% 235,730 3.3% 0.7% 4.0%2014 6,736,618 1.026 1.045 7,224,962 1,991,263 1.387 2,761,338 8.4% 231,987 3.2% 0.7% 4.0%2015 6,675,897 1.026 1.040 7,124,217 2,052,337 1.313 2,693,864 8.4% 226,318 3.2% 0.7% 3.9%2016 6,728,357 1.036 1.035 7,214,112 2,164,925 1.242 2,689,712 8.4% 225,970 3.1% 0.7% 3.9%2017 6,729,777 1.049 1.030 7,269,829 2,269,464 1.176 2,668,838 8.4% 224,216 3.1% 0.7% 3.8%
Total 33,591,803 36,084,600 10,393,193 13,619,638 8.4% 1,144,221 3.2% 0.7% 3.9%

Exhibit 6.09CHUBBPennsylvania HomeownersForm Indication = City HomeCompanies = AllTerritory = AllEvaluated as of 03/2018Catastrophe Loss and ALAE ratios
(1) (2) (3) (4) (5) (6) (7) (8) (9) (10) (11) (12)(1)*(2)*(3) (5)*(6) (7)*(8) (9)/(4) (10)+(11)
Calendar/ Trended Trended non-Modeled Expected non-Modeled Cat Modeled Cat Total CatAccident Earned On-level Premium On-level Earned Earned Catastrophe non-Modeled Loss&ALAE Loss&ALAE Loss&ALAE
Year Premium Factors Trend Premium Ins Years EIY Trend Ins Years Factor to EIY Catastrophe $'s Ratio Ratio Ratio2013 1,763,816 1.029 1.125 2,042,223 708,278 1.362 964,940 8.5% 82,026 4.0% 5.3% 9.3%2014 1,794,998 1.029 1.109 2,047,614 759,864 1.303 990,168 8.5% 84,170 4.1% 5.3% 9.4%2015 1,863,116 1.029 1.092 2,093,910 807,504 1.246 1,006,456 8.5% 85,555 4.1% 5.3% 9.3%2016 1,981,022 1.029 1.076 2,193,519 875,736 1.192 1,043,999 8.5% 88,746 4.0% 5.3% 9.3%2017 2,090,862 1.030 1.060 2,283,142 950,330 1.140 1,083,623 8.5% 92,114 4.0% 5.3% 9.3%
Total 9,493,814 10,660,408 4,101,712 5,089,186 8.5% 432,611 4.1% 5.3% 9.3%

Exhibit 6.10
(1) (2) (3) (4) (5)Modeled Adjusted Inforce Prem. Onleveled HurricaneLoss Hurr. Losses at 11/30/17 Inforce Prem Loss & ALAE Ratio
House 1,295,532 1,434,477 80,250,593 84,066,669 1.7%
R/C/C 47,656 52,767 6,741,180 7,078,239 0.7%
City Home 103,701 114,823 2,122,339 2,186,009 5.3%Total 1,446,889 1,602,068 89,114,112 93,330,917 1.7%
*RMS RiskLink v17 Hurricane Model AAL using November 2017 data
(2) = (1) *ALAE load of 1.03 * Other Coverage Manual load of 1.075where the Other Coverage Manual load accounts for coverages not included in the RMS model
(4) = (3) * onlevel premium factor (1.048 for House, 1.050 for R/C/C, and 1.030 for City Home)
(5) = (2) / (4)
CHUBBPennsylvania HomeownersModeled Hurricane Losses

Exhibit 7.01
CHUBB INA Holdings CombinedHomeowners Insurance
Countrywide Unallocated Loss Adjustment Expense Exhibit
(1) (2) (3) (4)[(3)+(2)]/(2)
Incurred UnallocatedUnallocated Loss
Gross Incurred Losses Loss AdjustmentCalendar Including Allocated Adjustment Expenses Year Loss Adjustment Expenses Expenses Ratio *
2017 109,172 1.043
2016 89,388 1.063
2015 92,202 1.065
Average 1.057
Items (2) and (3) above are expressed in (000's) of dollars.* - To be applied to incurred losses including allocated loss adjustment expense.
2,562,610
1,427,845
1,420,153

Exhibit 8.01CHUBB INA Holdings Combined
Homeowners InsuranceCountrywide Underwriting Expense Exhibit
(1) (2) * (3) * (4) = (2) / (3)
General & Direct General &Calendar Other Acquisition Earned Other Acquisition
Year Expense Premium Expense
2017 206,451 2,757,236 7.5%
2016 237,678 2,622,742 9.1%
2015 238,339 2,369,707 10.1%
Average 8.8%
* - Items (2) and (3) are expressed in (000's) of dollars.

CHUBB Exhibit 9.01PENNSYLVANIA ANNUAL STATEMENT PAGE 15
Homeowners Commission, Guaranteed Supplemental Compensation (GSC) and Taxes
DIRECT STANDARD COMMISSIONS +CAL WRITTEN GUARANTEED SUPPLEMENTAL STATE
Company YEAR PREMIUM COMPENSATION % TAXES %Federal 2015 5,597,017 953,443 17.0% 117,193 2.1%
2016 5,453,784 912,745 16.7% 125,193 2.3%2017 5,630,269 958,667 17.0% 138,288 2.5%
Vigilant 2015 4,114,762 692,255 16.8% 101,436 2.5%2016 3,805,161 626,458 16.5% 103,124 2.7%2017 3,500,145 569,846 16.3% 107,246 3.1%
Great Northern 2015 45,543,018 7,603,812 16.7% 967,440 2.1%2016 43,643,143 7,226,138 16.6% 1,031,112 2.4%2017 42,167,036 6,982,407 16.6% 976,313 2.3%
Pacific Indemnity 2015 9,250,566 1,591,552 17.2% 216,087 2.3%2016 8,989,608 1,496,509 16.6% 226,772 2.5%2017 8,521,632 1,406,731 16.5% 219,578 2.6%
Chubb Indemnity 2015 7,033,803 1,233,789 17.5% 156,022 2.2%2016 6,787,714 1,160,663 17.1% 161,028 2.4%2017 6,620,986 1,136,550 17.2% 161,944 2.4%
Chubb National 2015 17,181,269 3,188,540 18.6% 369,825 2.2%2016 19,964,196 3,579,502 17.9% 438,774 2.2%2017 22,940,686 4,086,167 17.8% 527,188 2.3%
Total 2015 88,720,435 15,263,391 17.2% 1,928,003 2.2%2016 88,643,606 15,002,015 16.9% 2,086,003 2.4%2017 89,380,754 15,140,368 16.9% 2,130,557 2.4%
2015-2017 266,744,795 45,405,774 17.0% 6,144,563 2.3%
SELECTED PROVISIONS
STANDARD COMMISSIONS + GUARANTEED SUPPLEMENTAL COMPENSATION 17.0%TAXES, LICENSES AND FEES 2.3%SUBTOTAL 19.3%MANDATED, RESIDUAL MARKET LOAD, OR ASSESSMENT 0.0%U/W PROFIT PROVISION 12.1%TOTAL U/W PROFIT AND VARIABLE EXPENSE 31.4%

Exhibit 10.01
CHUBBPennsylvania Homeowners
Underwriting Profit Provision Calculation
The following calculation was used to calculate an appropriate underwriting profit provision given items(1) through (6) below:
ROE = (UW * PS) * (1 - CTX) + (II * PS) * (1 – ETX) + YS * (1 – ETX)
Item Description Value1 . ROE After-Tax Expected Statutory Return on Equity 12.5%2 . II Investment Income Yield on Policyholder Funds as a % of Premium (See Exhibit 11.01) 0.9%3 . PS Premium to Surplus Ratio (Based on three year average from Annual Statement) 74.0%4 . YS Investment Income Yield on Surplus (See Exhibit 11.01) 2.9%5 . CTX Corporate Tax Rate 21.0%6 . ETX Effective Tax Rate (See Exhibit 11.01) 3.3%
7 . UW Underwriting Profit as a Percentage of Premium Calculated 15.4%Selected 12.1%

Exhibit 11.01
CHUBB INA HOLDINGS COMBINED
STATE OF PENNSYLVANIA
ANNUAL STATEMENT LINE 4 -- HOMEOWNERS
CALCULATION OF INVESTMENT INCOME OFFSET
A. Direct Earned Premiums for Calendar Year 2017 (see Exhibit 11.02) 89,025,886
B. Unearned Premium Reserve Subject to Investment (see Exhibit 11.02)
1. Mean Unearned Premium Reserve for Calendar Year 2017
a. Unearned Premium Reserve as of 12/31/17 47,358,867
b. Unearned Premium Reserve as of 12/31/16 46,643,616
c. Mean Unearned Premium Reserve (a + b) ÷ 2 47,001,242
2. Deduction for Prepaid Expenses
a. Prepaid Expense Provisions:
1. Commissions, Brokerage & GSC 17.0%
2. General Expenses + Other Acquisition Expenses 8.8%
3. Taxes, Licenses, & Fees 2.3%
4. Total 28.1%
b. Deduction for Prepaid Expenses (B.1.c x B.2.a.4) 13,222,442
3. Deduction for Federal Taxes Payable (B.1.c x 4.2%) 1,974,052
(see Exhibit 11.02)
4. Deduction for Delayed Remission of Premiums
a. Average Agents' Balances Percentage (see Exhibit 11.02) 29.80%
b. Delayed Remission of Premiums (A x B.4.a) 26,529,714
5. Net Unearned Premium Reserve Subject to Investment 5,275,034
(B.1.c - B.2.b - B.3 - B.4.b)
C. Loss Reserves Subject to Investment (see Exhibit 11.02)
1. Expected Incurred Loss & LAE Ratio 59.8%
2. Average Reserve to Incurred Loss & LAE Ratio 0.426
3. Expected Mean Loss and Loss Adjustment Expense Reserve 22,666,988
(A x C.1 x C.2)
D. Net Subject to Investment (B.5 + C.3) 27,942,022
E. Average Rate of Return on Invested Assets (see Exhibit 11.02) 2.90%
F. Expected Investment Earnings (D x E) 810,319
G. Ratio of Investment Earnings to Earned Premium, 0.90%
equals Investment Income Offset (F ÷ A)
H. Effective Tax Rate on Investment Income 3.27%
I. After-tax Ratio of Investment Earnings to Earned Premium 0.87%
(G x (1 - H))

Exhibit 11.02
CHUBB INA HOLDINGS COMBINED
STATE OF PENNSYLVANIA
ANNUAL STATEMENT LINE 4 -- HOMEOWNERS
CALCULATION OF INVESTMENT INCOME OFFSET
Item A Earned premiums are from the CHUBB INA Holdings Combined Annual Statement for
Line 4 -- Homeowners : (Page 15, Line 4).
Item B.1 Unearned premium reserves are from the CHUBB INA Holdings Combined Annual Statement for
Line 4 -- Homeowners : (Page 15, Line 4).
Item B.2 Production costs and a significant portion of other underwriting expenses (excluding loss
adjustment expenses) are incurred as soon as the policy is written and before the premium
is earned. As a result, these monies are not available for investment.
Item B.3 The Tax Reform Act of 1986 taxes 20% of the unearned premium reserve. At a corporate
tax rate of 21%, this tax equals 4.2% (0.20 x 0.21 = 0.042) of the unearned premium
reserve. As a result, these monies are not available for investment.
Item B.4 The average agents' balances percentage is based on the following information
for all lines of business from the CHUBB INA Holdings Combined Annual Statement:
Dollars in Thousands 2017
1. Net Earned Premium (Page 4, Line 1) 11,824,478
2. Current Agents' Balances (Page 2, Lines 13.1 + 13.2) 3,522,144
3. Prior Agents' Balances (Page 2, Lines 13.1 + 13.2) 3,533,127
4. Mean Agents' Balances [(2) + (3)] ÷ 2 3,527,635
5. Average Agents' Balances Percentage (4) ÷ (1) 29.80%
Item C.1 The expected incurred loss & loss adjustment expense ratio is 1 - Total Expenses
where Total Expenses = B.2.a.4 + Profit & Cont
for Profit & Contingencies = 12.1%.
Item C.2 The average reserve to incurred ratio is based on the following information based on the CHUBB INA
Holdings Combined Annual Statement for Line 4 -- Homeowners : (Page 15, Line 4).
Dollars in Thousands 2015 2016 2017
1. Incurred Losses & LAE (000's) 1,512,355 1,517,233 2,671,782
2. Current Unpaid Losses and LAE (000's) 716,847 707,038 1,365,190
3. Prior Unpaid Losses and LAE (000's) 581,597 716,847 707,038
4. Mean Loss & LAE Reserves [(2) + (3)] ÷ 2 649,222 711,943 1,036,114
5. Ratio (4) ÷ (1) 0.429 0.469 0.388
6. Average Reserve to Incurred Ratio 0.429
7. Estimated Reserve Discount 3.59%
8. Federal Taxes Payable (% of Reserve) 0.008
[ (7) x 21% ]
9. (6) x [(1.000 - (8)] 0.4260
Item E The average rate of return on invested assets is based on the following information for all lines
of business from the CHUBB INA Holdings Combined Annual Statement.
Dollars in Thousands 2015 2016 2017
1. Net Investment Income Earned (Page 4, Line 9) 1,071,444 1,561,386 1,886,098
2. Cash and Invested Assets (Page 2, Line 10) 55,081,614 50,694,418 49,084,055
3. Rate of Return Percentage (1) ÷ (2) 1.90% 3.10% 3.80%
4. Selected Rate of Return on Invested Assets 2.90%

Exhibit 12.01
Excess Shock Loss Methodology Expected Annual Loss Amount Calculation
(Cap set at 10% of Written Coverage Amount) Capped Loss: For house fire losses only, the ground-up value of any loss and ALAE amount is capped at 10% of the written coverage amount (house and contents) and then the appropriate deductible is subtracted (this calculation includes the contemplation of a franchise deductible: the standard deductible is waived for losses exceeding $50,000). For all other causes of loss, there is no shock-adjustment. Expected Annual Loss: The expected annual loss for each policy is:
Capped Loss +
US
StateUS
EIY
EIYCapLosses %10 State Offset Factor
This is calculated as, Written Coverage Amount (Cov) = Coverage A + Coverage C
k
iii CovEHYEIY
where k = number of houses
Severity (Sev) =
US
US
US
US
EIY
EHY
CapofClaims
CapLosses
%10#
%10
Frequency per 1,000 Cov (Freq) = US
US
US
US
EHY
CapofClaims
EHY
CapofClaims %10#000,1
000,1
%10#
Freq x Sev =
US
US
EIY
CapLosses %10000,1
Expected Annual Loss = Capped Loss + [ (Freq/1,000 x Sev) x StateEIY ] x State Offset Factor
=Capped Loss +
State
US
US EIYEIY
CapLosses
000,1
%10000,1 State Offset Factor
= Capped Loss +
US
StateUS
EIY
EIYCapLosses %10State Offset Factor
State Offset Factor = Credibility Weighted 20 yr Raw Shock Loss Frequency/ US 20 yr Raw Shock Loss Frequency.

Exhibit 12.02 Selected Excess Fire Shock Loss Frequency and Severity Indices
Year Of
Construction
Fire Protection
Class
XS Frequency
Per 1,000 EHYs XS
Severity < 1920 A 0.5431 0.4869
B 0.7227 0.4381 C 0.8505 0.5845 D 1.7587 0.7548
1920 A 0.3892 0.5086 B 0.5178 0.4576 C 0.6094 0.6105 D 1.2602 0.7884
Total 0.4822 0.5119 Fire Protection Definitions: A Fire station within 5 miles, fire hydrant within 1000 feet, fire alarm B Fire station within 5 miles and fire hydrant within 1000 feet C Fire station within 5 miles and fire alarm OR fire hydrant within 1000 feet and fire alarm D Fire station within 5 miles OR fire hydrant within 1000 feet OR fire alarm OR no fire protection

Exhibit 12.03
Buhlmann BuhlmannActual Straub Straub Cred
Region Relativity Credibility RelativityPennsylvania 1.030 0.965 1.029Mid-Atlantic 0.924 0.989 0.925US Total 1.000 1.000
Selected 1.029
CHUBBHouse Insurance
Fire: State Offset FactorsBased on 20 year Credibility Weighted Frequency

Exhibit 12.04CHUBB
Homeowners Primary LiabilityCountrywide (ex TX & NC)
Calendar (1) (2) (3) (4)Accident Ultimate Loss + ALAEYear Uncapped Capped @ $1M Excess Factor1996 17,933,688 16,058,713 1,874,975 1.1171997 22,665,693 14,701,024 7,964,669 1.5421998 19,511,564 17,667,264 1,844,301 1.1041999 24,376,474 21,146,341 3,230,133 1.1532000 13,814,057 13,814,057 0 1.0002001 41,642,402 29,066,787 12,575,615 1.4332002 33,386,702 30,341,553 3,045,150 1.1002003 41,584,585 36,089,011 5,495,573 1.1522004 43,234,481 36,169,544 7,064,936 1.1952005 56,637,267 42,619,228 14,018,039 1.3292006 43,367,761 38,580,155 4,787,606 1.1242007 53,206,044 44,568,834 8,637,211 1.1942008 47,718,341 34,810,411 12,907,929 1.3712009 78,918,842 50,851,460 28,067,382 1.5522010 46,218,391 41,548,782 4,669,609 1.1122011 52,907,093 44,881,616 8,025,477 1.1792012 69,513,350 53,155,241 16,358,110 1.3082013 41,812,559 40,543,716 1,268,843 1.0312014 42,340,191 41,414,980 925,211 1.0222015 49,088,622 48,352,299 736,323 1.0152016 44,375,921 38,466,012 5,909,908 1.1542017 74,748,300 55,779,753 18,968,548 1.340
All year straight average 1.199All year weighted average 1.20315 year weighted average 1.19610 year weighted average 1.200
Selected 1.200
(3) = (1) ‐ (2)(4) = (1) / (2)*The Ultimate Capped and Uncapped L&ALAE are derived based on the Loss Development Factors shown in Exhibits 4.04 and 4.05, respectively.
Excess Load Derivation

Exhibit 13.01
(1) (2) (3) (4) (5) (6) (7) (8)
Proposed Territory
Total Locations
% Distribution
Current Base Rate
Proposed Base Rate
Base Rate Change
Premium At Current Rates
Proposed Premium
Overall Rate Effect
001 818 4.2% 1,283 1,318 2.7% 3,546,592 3,675,389 3.6%005 122 0.6% 924 949 2.7% 485,229 505,670 4.2%006 154 0.8% 689 708 2.7% 561,953 586,113 4.3%007 155 0.8% 657 675 2.7% 523,871 545,012 4.0%008 103 0.5% 924 949 2.7% 402,483 418,567 4.0%009 40 0.2% 970 996 2.7% 177,533 183,356 3.3%010 5 0.0% 784 805 2.7% 20,610 21,753 5.5%012 231 1.2% 689 708 2.7% 755,251 782,953 3.7%014 543 2.8% 1,283 1,318 2.7% 3,338,158 3,491,664 4.6%021 84 0.4% 867 891 2.7% 266,264 276,686 3.9%022 108 0.6% 689 708 2.7% 421,237 437,548 3.9%023 184 1.0% 657 675 2.7% 581,031 605,585 4.2%024 11 0.1% 867 891 2.7% 49,863 51,245 2.8%025 21 0.1% 657 675 2.7% 78,262 82,470 5.4%027 114 0.6% 657 675 2.7% 416,857 434,742 4.3%031 19 0.1% 731 751 2.7% 55,090 57,500 4.4%035 22 0.1% 867 891 2.7% 96,386 102,074 5.9%037 2 0.0% 970 996 2.7% 14,026 14,412 2.8%051 10 0.1% 894 919 2.7% 44,972 46,203 2.7%052 142 0.7% 894 919 2.7% 460,487 479,012 4.0%053 89 0.5% 784 805 2.7% 261,911 270,168 3.2%054 82 0.4% 924 949 2.7% 261,297 272,117 4.1%055 268 1.4% 866 890 2.7% 766,771 798,863 4.2%056 12 0.1% 970 996 2.7% 59,784 62,028 3.8%057 22 0.1% 867 891 2.7% 87,211 91,743 5.2%058 234 1.2% 731 751 2.7% 947,196 986,852 4.2%059 258 1.3% 731 751 2.7% 945,788 979,700 3.6%061 27 0.1% 784 805 2.7% 80,251 84,543 5.3%071 19 0.1% 784 805 2.7% 109,948 115,413 5.0%073 718 3.7% 879 903 2.7% 3,342,366 3,489,204 4.4%074 62 0.3% 866 890 2.7% 190,906 198,761 4.1%075 349 1.8% 894 919 2.7% 1,228,653 1,270,418 3.4%076 11 0.1% 807 829 2.7% 22,985 23,699 3.1%077 539 2.8% 894 919 2.7% 2,173,607 2,242,856 3.2%081 292 1.5% 894 919 2.7% 958,637 996,445 3.9%082 62 0.3% 894 919 2.7% 249,682 260,779 4.4%083 1,452 7.5% 907 932 2.7% 6,039,343 6,315,786 4.6%086 70 0.4% 1,168 1,199 2.7% 356,936 370,779 3.9%087 79 0.4% 970 996 2.7% 239,167 247,569 3.5%088 18 0.1% 894 919 2.7% 68,739 70,340 2.3%089 34 0.2% 924 949 2.7% 168,895 173,401 2.7%090 158 0.8% 689 708 2.7% 589,028 612,535 4.0%091 27 0.1% 894 919 2.7% 94,619 98,618 4.2%092 650 3.4% 917 942 2.7% 2,126,518 2,206,080 3.7%093 64 0.3% 924 949 2.7% 270,975 281,317 3.8%094 19 0.1% 894 919 2.7% 65,495 69,175 5.6%095 808 4.2% 1,107 1,137 2.7% 3,318,954 3,448,560 3.9%096 14 0.1% 894 919 2.7% 61,221 64,366 5.1%099 26 0.1% 784 805 2.7% 103,379 107,101 3.6%100 150 0.8% 657 675 2.7% 481,163 501,473 4.2%101 331 1.7% 1,168 1,199 2.7% 1,667,621 1,733,935 4.0%102 16 0.1% 784 805 2.7% 41,595 43,686 5.0%104 5 0.0% 894 919 2.7% 11,936 12,076 1.2%105 0 0.0% 894 919 2.7% 0 0 0.0%106 1 0.0% 894 919 2.7% 1,469 1,609 9.5%107 95 0.5% 894 919 2.7% 299,858 310,789 3.6%108 160 0.8% 894 919 2.7% 422,796 438,221 3.6%109 29 0.2% 894 919 2.7% 81,903 85,350 4.2%110 225 1.2% 865 888 2.7% 800,175 831,141 3.9%111 27 0.1% 894 919 2.7% 82,802 86,483 4.4%112 0 0.0% 894 919 2.7% 0 0 0.0%113 39 0.2% 894 919 2.7% 105,597 109,199 3.4%114 706 3.7% 894 919 2.7% 3,093,196 3,218,555 4.1%115 393 2.0% 865 888 2.7% 1,214,317 1,256,833 3.5%116 0 0.0% 894 919 2.7% 0 0 0.0%117 6 0.0% 894 919 2.7% 17,993 18,477 2.7%119 18 0.1% 894 919 2.7% 51,182 53,106 3.8%120 1,015 5.3% 865 888 2.7% 4,203,469 4,366,154 3.9%121 334 1.7% 894 919 2.7% 1,089,814 1,129,350 3.6%122 0 0.0% 894 919 2.7% 0 0 0.0%123 197 1.0% 894 919 2.7% 684,982 709,632 3.6%124 1 0.0% 894 919 2.7% 2,712 2,701 -0.4%125 22 0.1% 894 919 2.7% 71,324 73,588 3.2%126 0 0.0% 894 919 2.7% 0 0 0.0%127 0 0.0% 894 919 2.7% 0 0 0.0%128 1 0.0% 894 919 2.7% 1,834 1,883 2.7%129 1 0.0% 894 919 2.7% 2,828 2,904 2.7%130 0 0.0% 894 919 2.7% 0 0 0.0%131 117 0.6% 894 919 2.7% 364,872 377,907 3.6%132 850 4.4% 1,107 1,137 2.7% 5,007,831 5,233,055 4.5%133 379 2.0% 905 929 2.7% 1,783,562 1,857,918 4.2%134 907 4.7% 966 992 2.7% 4,696,493 4,899,680 4.3%135 1,979 10.2% 1,071 1,101 2.7% 10,068,950 10,491,706 4.2%136 632 3.3% 1,073 1,102 2.7% 3,244,205 3,376,906 4.1%137 957 5.0% 966 992 2.7% 3,905,993 4,053,784 3.8%138 124 0.6% 902 927 2.7% 656,503 680,683 3.7%139 102 0.5% 807 829 2.7% 325,781 335,279 2.9%140 13 0.1% 1,107 1,137 2.7% 69,877 74,110 6.1%141 143 0.7% 1,074 1,103 2.7% 821,526 866,438 5.5%
Total 19,326 100.0% 82,862,576 86,241,781 4.1%
(2) = (1) / (1 Tot)(5) = (4) / (3) -1(6) Premium based on inforce policies at current rates(7) Premium based on re-rating of the inforce policies with proposed changes(8) = (7) / (6) -1
Total In-Force Book
PennsylvaniaRate Level Effects By Territory
House & Vacation Forms

Exhibit 14.01
Rate Effect RangeTotal
Locations % Distn
Average Dollar Impact
Total Locations % Distn
Average Dollar Impact
Total Locations % Distn
Average Dollar Impact
Total Locations % Distn
Average Dollar Impact
Total Locations % Distn
Average Dollar Impact
Total Locations % Distn
Average Dollar Impact
Total Locations % Distn
Average Dollar Impact
LT -10% 0 0.0% 0 0 0.0% 0 0 0.0% 0 0 0.0% 0 0 0.0% 0 0 0.0% 0 0 0.0% 0-10% to -5% 43 0.2% -265 6 0.5% -317 0 0.0% 0 5 0.2% -262 16 0.2% -177 15 0.3% -303 1 0.1% -804-5% to 0% 1,115 5.8% -88 61 5.2% -80 33 4.4% -94 108 4.8% -59 387 4.8% -109 430 7.5% -59 96 7.7% -1620% to 5% 11,860 61.4% 120 875 74.2% 103 640 85.9% 118 1,656 73.0% 104 6,800 83.7% 126 878 15.3% 106 1,011 80.8% 1245% to 10% 6,138 31.8% 324 235 19.9% 425 69 9.3% 221 487 21.5% 219 901 11.1% 320 4,302 74.7% 333 144 11.5% 32010% to 20% 170 0.9% 479 3 0.3% 325 3 0.4% 295 13 0.6% 396 19 0.2% 342 132 2.3% 515 0 0.0% 020% to 30% 0 0.0% 0 0 0.0% 0 0 0.0% 0 0 0.0% 0 0 0.0% 0 0 0.0% 0 0 0.0% 0
GT 30% 0 0.0% 0 0 0.0% 0 0 0.0% 0 0 0.0% 0 0 0.0% 0 0 0.0% 0 0 0.0% 0Total 19,326 100.0% 175 1,180 100.0% 156 745 100.0% 119 2,269 100.0% 122 8,123 100.0% 137 5,757 100.0% 272 1,252 100.0% 124
Max % Change (1) 11.4% (3) 11.0% (5) 10.5% (7) 11.4% (9) 11.1% (11) 11.2% (13) 10.0%Max $ Impact (2) 5,759 (4) 5,759 (6) 719 (8) 1,502 (10) 3,233 (12) 4,182 (14) 3,172
*Rate effects based on residence premium(1) $1.11M house, $10,000 deductible, $984 increase (8) $5.88M house, $10,000 deductible, 8.7% increase(2) $8M house, $10,000 deductible, 8.4% increase (9) $0.73M house, $10,000 deductible, $346 increase(3) $0.4M house, $1,000 deductible, $290 increase (10) $26.54M house, $10,000 deductible, 8.5% increase(4) $8M house, $10,000 deductible, 8.4% increase (11) $1.18M house, $5,000 deductible, $496 increase(5) $0.3M house, $1,000 deductible, $230 increase (12) $16.72M house, $25,000 deductible, 8.9% increase(6) $1.06M house, $1,000 deductible, 9.0% increase (13) $1.28M house, $1,000 deductible, $496 increase(7) $1.11M house, $10,000 deductible, $984 increase (14) $8.02M house, $2,500 deductible, 9.5% increase
PennsylvaniaRate Level Effects Histogram
All Companies Federal Vigilant Pacific Indemnity Great Northern Chubb National Chubb Indemnity
House & Vacation Home Forms

Ms. Jessica Altman Insurance Commissioner Pennsylvania Insurance Department Deputy Office of Rate and Policy Information 1326 Strawberry Square Harrisburg, PA 17120 Re: Masterpiece
Homeowners Rate and Rule Revision
Company Filing No.: 18-13556-RR Chubb Indemnity Insurance Company
Chubb National Insurance Company Great Northern Insurance Company Pacific Indemnity Company Vigilant Insurance Company Federal Insurance Company
Dear Commissioner Altman: We are filing, for your review and approval, revisions to our Masterpiece Program in Pennsylvania. Each of the revisions submitted under this filing is explained in the Actuarial Filing Memorandum and the Description of Change attached under Supporting Documentation. The manual pages that reflect the changes are attached in marked and final copy. The effective date is April 29, 2019 for newlines and June 13, 2019 for renewals. Please contact me should you have any questions or require additional information. Your approval will be greatly appreciated.
Sincerely, Chubb
By: Cindy Langston Cindy Langston State Filings Specialist Chubb Personal Risk Services
Chubb 202 Hall’s Mill Road P.O. Box 1650 Whitehouse Station, NJ 08889-1600
O +908.572.2873 F +908.572.4034 [email protected]
December 5, 2018

Masterpiece Rate and Rule Change
Company Filing No.: 18-13556-RR
Effective Date: 04/29/19 State: Pennsylvania Applicable To: Describe Change
Home and Contents:
Rules Section : We revised Renovated or newly constructed houses rule to apply regardless whether the insured lives in or out of the house during renovation or construction. We relocated Tiering rule from Coverage Options. Rules Section -Discounts We revised Portfolio discount – home with valuable articles to not apply to vacation home house. We revised New House discount from 10 to 15 years. Rules Section – Surcharges and Other Rating Factors We revised:
• Claims rating factor period to within the last 3 years; • Renovation or construction to include categories of “Minor” or
“Major”; • Renovation for City home to include categories of “Minor” or
“Major”. Charts Section :
We revised: • New house discount to extend from 10 to 15 years; and • Renovation or construction surcharge to a 2-tier format (for
“Minor” and “Major”); • Tier factor chart from 19 to 50 tiers.
We editorially revised the Value factor chart to specify “Each additional $1,000”. Date: 11-30-18

Home and Contents: Rules This manual is for policies insured with us for the applicable rates for Federal Insurance Company, Chubb Indemnity Insurance Company, Chubb National Insurance Company, Great Northern Insurance Company, Pacific Indemnity Company, and Vigilant Insurance Company. Eligibility All homes, except city homes, must be used as one−family or two−family residences. A city home must be an owner occupied rowhouse with no more than one rental unit and must meet all of the following criteria: • masonry construction • built prior to 1940 • renovated plumbing, heating and electrical systems. Contents coverage may be written for the owner occupied unit only. A vacation home must be an owner occupied house, other than a primary residence, but may be rented to others for up to 15 days in any given policy term. Contents coverage may be written for a house owned by the insured only if house coverage is included in the policy. Coverage options Property covered
Types of coverage
Payment basis (loss settlement)
House (dwelling only)
Deluxe (all risk) City home house (all risk) Vacation home (all risk)
Extended replacement cost, verified replacement cost or conditional replacement cost
Contents (with Deluxe house)
Deluxe (all risk) Standard (named perils) Fire (named perils, without theft)
Replacement cost or actual cash value Replacement cost or actual cash value Actual cash value
Contents (with City home house)
City home contents (all risk)
Replacement cost or actual cash value
Contents (with Vacation home house)
Deluxe (all risk) Standard (named perils)
Replacement cost or actual cash value
Contents (Condominium, Cooperative, or Renters)
Deluxe (all risk) Standard (named perils)
Replacement cost or actual cash value
04/11/17 Pennsylvania Masterpiece Manual Home and Contents: Rules Page 5.1

Home and Contents: Rules Minimum amount These are the minimum amounts of coverage: Deluxe house or vacation home house amount with or without contents: $ 50,000 City home house amount with city home contents: $400,000* City home house amount without contents: $400,000** Condominium or cooperative: $ 15,000 Renters: $ 15,000 * City home contents coverage may not be less than 10% of City home house coverage. ** City home house without contents is only available if the renovation surcharge applies (house is being rebuilt/course of construction).
Base premium determination (not applicable to City home house) The base premium is calculated for: • $100,000 house coverage insured on an extended replacement cost basis, (or $40,000 condominium, cooperative, or
renters contents coverage insured on a replacement cost basis); • $50,000 contents coverage insured on a replacement cost basis (for a Deluxe house with Deluxe or Standard
contents coverage only); • $30,000 contents coverage insured on a replacement cost basis (for a vacation home house with deluxe or standard
contents coverage only); • $20,000 other permanent structures coverage for a deluxe house or $10,000 other permanent structures coverage for a
vacation home house (or $4,000 additions and alterations coverage for a condominium, cooperative, or renters); • $50,000 personal liability coverage; and • $500 deductible. Fire protection The fire protection factor (not applicable to City home house) and fire protection code is determined by the type of coverage for the residence, the distance a fire hydrant or fire station is from the residence and whether the residence has a central station or direct reporting fire alarm. In lieu of a fire protection factor, a separate discount is available for fire protection if a city home has a direct or central station reporting fire alarm. Value factor (not applicable to City home house) The value factor is determined by using the type of coverage for the location, the fire protection code, and the value of the building or contents. For a house, use the value of the highest valued building at the location (excluding contents) to determine the coverage amount. For a condominium, cooperative, or rental unit, use the value of contents to determine the amount of coverage. Deductibles All homes and contents coverages must have the same deductible. If a policy has a deductible higher than $50,000, the deductible waiver will not apply. The following flat deductibles are available: $250 $500 $1,000 $2,500 $5,000 $7,500 $10,000 $25,000 $50,000 $100,000 Underinsured houses If a house is not insured to at least 90% of the amount of coverage we recommend, the payment basis will be conditional replacement cost. There is an undervalue surcharge when coverage is below 80% of the amount of coverage we recommend.
04/11/17 Pennsylvania Masterpiece Manual Home and Contents: Rules Page 5.2

Home and Contents: Rules Renovated or newly constructed houses If new construction of a house or other permanent structures or additions, alterations or renovations to the existing house or other permanent structures occurs that results in the insured living out of the house, the company must be notified. Vacant houses If an insured house will be vacant (substantially empty of furnishings and contents) for more than 30 days, the company must be notified. Personal liability Liability is rated in the state where the Primary residence (first location with liability) is located regardless of the location of any additional residence(s). If liability is not requested, we apply a discount for each location that building and/or contents coverage is provided. Tiering The rating tier is determined at new line only and is based upon characteristics of the risk. Information including, but not limited to, the residence type, construction year, size of risk, losses, and insurance score is utilized to determine the rating tier.
04/11/17 Pennsylvania Masterpiece Manual Home and Contents: Rules Page 5.3

Home and Contents: Rules – Discounts Applicable to house and contents, condominium, cooperative, and renters The following discounts are applied to house and contents, condominium, cooperative and renters coverage, if applicable. Burglar alarm – Applicable if the residence has a central station or direct reporting theft or burglar alarm. This discount is not applicable to Deluxe house without contents or with fire contents. Fire resistive – Applicable if the house or the unit is in a building where exterior walls, floors, and roof are built of masonry or other fire resistive materials with a rating of two hours or more. Suburban rating (not applicable to city homes) – Applicable to a residence if the following conditions are met: • the residence is within 3 miles of the first responding fire department which:
• has at least 2 pumpers; and • brings at least 6,000 gallons of water; or • brings at least 4,000 gallons of water and has dual response or mutual aid agreement(s) with fire department(s)
within 5 miles of the residence which will supply an additional 2,000 gallons of water; and • the ISO protection class is not greater than 9. Gated community (not applicable to city homes) – Applicable if the residence is located in a gated community. A residence is in a gated community if: • vehicle access is limited to entrances controlled by guards or locked gates at all times; • proper identification is required to enter; and • visitors are announced. This discount is not intended for high rise buildings. Gated community patrol service (not applicable to city homes) – Applicable if the residence in the gated community has a fire and burglar alarm that when activated, alerts the community’s 24-hour patrol service to dispatch a guard to the residence. Premier client – Applicable in one of two ways, based on either customer tenure or risk tenure: • customer tenure - applied for a new location if the insured has another location insured by us for three or more
consecutive years. The discount will apply to the new location for the first three policy terms. Once a location has a risk tenure of three years or more, the discount will be based on the risk tenure provided we did not pay any property claims for that location; or
• risk tenure - applied for each location insured by us for three or more consecutive years that we did not pay any property claims for that location within the last three years. If a claim we paid is reimbursed in full through salvage and/or subrogation, that claim may be waived when determining eligibility for this discount. This discount is not applied if we paid any property claims for a location due to a loss caused by a catastrophe.
Portfolio discount – home with valuable articles (not applicable to vacation home house) – Applicable for a primary, owner-occupied house, condominium, cooperative or a primary occupied rental unit when valuable articles coverage, meeting certain eligibility (see Charts section), is written on the same policy at the same location. Portfolio discount – home with auto – Applicable for a residence, if the residence is not seasonal, secondary or rented to others, listed on the policy when the insured has a good standing active Masterpiece automobile policy with us. If the residence is a house, the house must have contents coverage listed on the policy. A city home may have up to one rental unit and still qualify for this discount. The automobile policy must have at least one private passenger vehicle with physical damage coverage garaged in the state of Pennsylvania at that location. Payment history – Applicable for a residence when the insured has paid the premium in full at least two years within the past five years. Lien free (not applicable to renters) – Applicable if the residence has no mortgage or lien. This discount is not applied if the residence is vacant, under the course of construction or rented to others. Applicable to house and contents only The following additional discounts are applied to house and contents coverage, if applicable. Residential sprinkler system – Applicable if the living areas, basement and heating system area have an approved and properly maintained sprinkler system. New house (not applicable to city homes) – Applicable if the house was built within the last ten fifteen years. Renovated house (not applicable to city homes) – Applicable if the house was renovated within the last six years. If this renovated house discount applies, the new house discount cannot. To qualify as renovated, the plumbing and heating systems and the electrical system must have been completely upgraded including new wiring, receptacles, circuit boxes and conduits in exposed areas. The renovation must have been inspected and approved by licensed civil authorities in compliance with the local building codes. Superior protection (not applicable to city homes) – Applicable if one or more of the protection characteristics on the superior protection discount chart apply.
08/27/18 Pennsylvania Masterpiece Manual Home and Contents: Rules – Discounts Page 5a.1

Home and Contents: Rules – Discounts Applicable to City home house and City home contents The following additional discounts are applied to City home house and City home contents coverage, if applicable. Temperature monitoring system – Applicable if the city home has a temperature monitoring system which reports directly into a central station or direct fire alarm. Restoration – Applicable if the city home underwent restoration of its plumbing or electrical systems, heating/A.C./ventilating system, or its roof or façade repointing within the last ten years. Applicable to condominium, cooperative, and renters The following additional discounts are applied to condominium, cooperative, and renters coverage, if applicable. Building security protection – Applicable to a condominium, cooperative, or rental unit meeting all of the following criteria: • building entrances are at all times:
• manned; or • locked and secured by a central station or direct reporting burglar alarm;
• visitors are announced; and • elevators are either manned or key controlled or must be accessed through a locked door. Building fire protection – Applicable to a condominium, cooperative, or rental unit meeting all of the following criteria: • approved and properly maintained sprinkler systems have been installed throughout the building; and • common areas have a central station or direct reporting fire alarm or fire alarm which alerts the building security staff.
08/27/18 Pennsylvania Masterpiece Manual Home and Contents: Rules – Discounts Page 5a.2

Home and Contents: Rules – Surcharges and Other Rating Factors Applicable to house and contents, condominium, cooperative, and renters The following surcharges are applied to house and contents, condominium, cooperative, and renters coverage, if applicable. Claims rating factor – Applicable for each residence based on claims paid by us to an insured or on behalf of an insured. The surcharge is based on the amount of house coverage or contents and additions and alterations coverage and the number of non-catastrophe claims if paid: within the last three years for houses; and
• on or after December 12, 2011 for condominiums, cooperatives and renters. This factor will be applied to each policy period for the three years after a payment for a claim has been paid. We may waive this surcharge if any claim has been reimbursed in whole through salvage or subrogation. Cancellation surcharge – Applicable for each residence that has its insurance cancelled by us for non-payment of premium within the last three years on or after 12/07/2015. Rented to others (not applicable to city homes) – Applicable if the residence is rented to others by the insured. A home does not qualify for the Vacation Home program if it is rented for more than 15 days in any given policy term. Applicable to house and contents only The following additional surcharges are applied to house and contents coverage, if applicable. Vacation home house nonoccupancy – Applicable if a vacation home house is unoccupied for more than 90 consecutive days in any given policy term. This surcharge does not apply if: • there is a full time caretaker or equivalent service with an established maintenance company, or other full time non-rental
occupancy during the owner’s absence; or • the house is located in a community with guard service; or • the house is protected by central station or direct reporting fire and burglar alarm systems, and the responding fire and
police departments are within 5 miles of the house. Undervalue surcharge – Applicable for each 10% of coverage (or fraction) below 80% of the amount of coverage we recommend. In this case, the payment basis for a house will be conditional replacement cost. This surcharge will be applied by the company. Renovation or construction (not applicable to city homes) - There is a surcharge during: new construction of a house or other permanent structures, or during construction of additions, alterations or renovations to the an existing house or other permanent structures that result in the insured living out of the house. The surcharge that applies is based on the extent of the construction or renovation – see the construction categories of “Minor” or “Major” in the Charts section. This surcharge will be removed when construction is completed, the house is owner occupied(applicable if the owner relocated during construction), and the amount of coverage has been adjusted to reflect the proper restoration cost. A Vacant house surcharge will also apply if the house is vacant for more than 30 days. This surcharge will be applied by the company. Vacant house – Applicable for a house with deluxe house coverage or City home house coverage that is vacant for more than 30 days. A renovation or construction surcharge (deluxe house coverage) or renovation surcharge (City home house coverage) may also apply if construction is in progress. A home does not qualify for the Vacation Home program if it is vacant. This surcharge will be applied by the company. Applicable to City home house and City home contents The following additional surcharges are applied to City home house and City home contents coverage, if applicable. Rental unit – Applicable if a unit in a city home is rented to others by the insured. A home does not qualify for the City Home program if it has more than one rental unit or if it is not owner occupied. Renovation – There is a surcharge during construction of additions, alterations or renovations to the city home or other permanent structures that result in the insured living out of the city home. The surcharge that applies is based on the extent of the construction or renovation – see the construction categories of “Minor” or “Major” in the Charts section. This surcharge will be removed when construction is completed, the city home is again owner occupied(applicable if the owner relocated during construction), and the amount of coverage has been adjusted to reflect the proper restoration cost. A Vacant house surcharge will also apply if the city home is vacant for more than 30 days. This surcharge will be applied by the company.
12/07/15 Pennsylvania Masterpiece Manual Home and Contents: Rules – Surcharges and Page 5b.1 Other Rating Factors

Home and Contents: Rules – Coverage Options Mold remediation expenses Mold remediation expense coverage is available in increments of 10%, 25%, 50%, 75% and 100% of the amount of coverage for the house or, if a condominium, cooperative or renters, the combined amount of coverage for contents and additions and alterations. This coverage is in addition to the $10,000 of mold remediation expense coverage provided in the policy. Mold remediation expense coverage also includes temporary relocation expenses, which is 20% of the amount of mold remediation expense coverage. The home and contents base deductible applies to mold remediation expenses but not to temporary relocation expenses. Requests to add or increase to a higher increment of mold remediation expense coverage can only be made at new line inception or upon renewal and will be subject to underwriting acceptance. The amount of mold remediation expense coverage can be reduced to a lower increment or to $10,000 (the amount of coverage provided in the policy) at any time. Sinkhole collapse coverage Sinkhole collapse coverage is available for an extra charge in:
• Deluxe house coverage when Deluxe contents coverage or no contents coverage is purchased, • City home house coverage when City home contents coverage or no contents coverage is purchased, or • Vacation home house coverage when Deluxe contents coverage is purchased.
The amount of coverage available is equal to the house amount. Earthquake coverage Type of coverage Earthquake Deluxe house, City home house, and Vacation home house
Available*
Deluxe contents, condominium, cooperative, and renters, and City home contents
Included**
Standard contents, condominium, cooperative, and renters
Not available
Fire contents Not available *Earthquake coverage must meet our underwriting guidelines and is only available, for an extra charge in:
• Deluxe house coverage when Deluxe contents coverage or no contents coverage is purchased, • City home house coverage when City home contents coverage or no contents coverage is purchased, or • Vacation home house coverage when Deluxe contents coverage is purchased.
The deductible for earthquake coverage is 2% of the amount of coverage. **Earthquake coverage is not automatically included for deluxe contents with vacation home house coverage. This coverage is only included when earthquake coverage for Vacation home house is chosen. Payment basis for other permanent structures If the payment basis for the house and other permanent structures is Extended replacement cost and the amount of coverage for other permanent structures is reduced to less than 20% of the amount of coverage for the house (Deluxe house coverage or City home house coverage applies) or is reduced to less than 10% of the amount of coverage for the house (Vacation home house coverage applies), Extended replacement cost payment basis is limited for other permanent structures. We will pay up to 25% more than the amount of coverage for other permanent structures, if necessary, for the reconstruction of other permanent structures subject to all other terms and conditions. Homeowner or Unit assessments The premium for deluxe house, vacation home house, city home house, condominiums and cooperatives automatically includes coverage for homeowner/unit assessments of $50,000, but not more than $5,000 for any assessment that results from a deductible in the homeowner, condominium or cooperative association’s insurance. Homeowner assessments coverage (for any type of house) and Unit assessments coverage (for any type of condominium or cooperative), can be increased in two ways: • the assessments coverage can be increased in increments of $1,000; and/or • the amount of coverage for any assessment that results from a deductible in the homeowners, condominium, or
cooperative association’s insurance can be increased in increments of $1,000, not to exceed the amount of coverage for assessments.
12/07/15 Pennsylvania Masterpiece Manual Home and Contents: Rules – Coverage Options Page 5c.1 .

Home and Contents: Rules – Coverage Options Landscaping The premium for deluxe house and vacation home house automatically includes coverage for landscaping of 5% of the amount of house coverage, but not more than $10,000 for any one tree, shrub or plant. The premium for condominiums, cooperatives and renters automatically includes coverage for landscaping of 10% of the amount of contents coverage, but not more than $10,000 for any one tree, shrub or plant. Landscaping can be increased in two ways: • the percentage amount of landscaping coverage can be incrementally increased up to the amount of coverage for the
house, or the amount of contents for a condominium, cooperative, or rental unit; and/or • the amount of coverage per tree, shrub or plant can be increased up to the total amount of coverage for landscaping
coverage. In addition, the following perils can be added to landscaping coverage: • wind and hail, and/or • sleet and weight of ice or snow. City garden coverage The premium for city home house automatically includes coverage for city gardens of 5% of the amount of house coverage, but not more than $10,000 for any one tree, shrub or plant. City garden coverage can be increased in two ways: the percentage amount of city garden coverage can be incrementally increased up to the amount of coverage for the city home house; and/or the amount of coverage per tree, shrub or plant can be increased up to the total amount of coverage for city garden coverage. In addition, the following perils can be added to city garden coverage: wind and hail, and/or sleet and weight of ice and snow. Business property The premium for contents automatically includes coverage for $25,000 of business property. The amount of on-premises business property can be increased in increments of $1,000 up to the amount of contents coverage on the policy. GreenWise® upgrade coverage GreenWise upgrade coverage is available for Deluxe house, City home house or Vacation home house coverage if the payment basis is extended replacement cost or verified replacement cost, and for condominium and cooperative coverage if the payment basis is replacement cost. However, GreenWise upgrade coverage does not apply to personal property (contents) under fire contents coverage. GreenWise upgrade coverage is available in increments of 10%, 25%, 50%, 75% and 100% of the amount of coverage for the house or, if condominium or cooperative, the combined amount of coverage for contents and additions and alterations. GreenWise upgrade coverage is not available for a condominium or cooperative if the amount of coverage for additions and alterations has been reduced to zero. If GreenWise upgrade coverage applies to a location that also has earthquake coverage, then earthquake coverage will apply to GreenWise upgrade coverage and a higher earthquake premium will apply. Student additional living expenses coverage Student additional living expenses coverage includes student additional living expenses and extra tuition expenses. The minimum amount of student additional living expenses coverage that can be added to a policy is $5,000. The home and contents deductible does not apply to this coverage. This coverage cannot be added to house coverage without contents coverage or to Vacation home house coverage. Assisted living care Assisted living care coverage includes coverage for contents of a relative-in-care, additional living expenses for the relative-in-care, and personal liability coverage, if personal liability coverage is on the policy. The minimum amount of contents for a relative-in-care that can be added to a policy is $5,000. A deductible of $500 applies to contents of a relative-in-care. This coverage is always rated at one residence regardless of the number of residences on the policy. This coverage cannot be added to house coverage with fire contents coverage or with no contents coverage or to Vacation home house coverage.
12/07/15 Pennsylvania Masterpiece Manual Home and Contents: Rules – Coverage Options Page 5c.2 .

Home and Contents: Rules – Coverage Options Employment practices liability coverage Employment practices liability coverage includes coverage for employment practices liability and reputational injury. Employment practices liability coverage is only available on a policy with a personal liability limit of $1,000,000 or greater. The coverage is always rated at one residence regardless of the number of residences on the policy. A deductible applies to Employment practices liability. No deductible applies to Reputational injury. Family Protection SM Coverage Family Protection Coverage is always rated at one residence regardless of the number of residences on the policy. The home and contents deductible does not apply to this coverage.
Tiering The rating tier is determined at new line only and is based upon mutually exclusive characteristics of the risk. The effect of the tiers is not duplicative of any other rating variable. Each residence will be assigned its own tier. Existing (renewal) business will be placed in a default (neutral) tier (Tier 20). Tier placement is based on mutually exclusive underwriting criteria on file at the company’s home office. No insured will be moved to a higher-rated tier at renewal. Accidents and violations used in tier placement are not used in any other rating variable.
12/07/15 Pennsylvania Masterpiece Manual Home and Contents: Rules – Coverage Options Page 5c.3 .

Home and Contents: Charts Base premium chart (not applicable to City home house)
Type of coverage
Base premium
Deluxe house/Vacation home house $ 1,283 Condominium/Cooperative $ 272 Renters $ 282
Coverage type chart (not applicable to City home house)
Coverage Factor Deluxe house/deluxe contents 1.100 Deluxe house/standard contents 1.000 Deluxe house without contents or with fire contents* 0.750 Vacation home house with deluxe contents 0.990 Vacation home house with standard contents 0.900 Deluxe condominium or cooperative 1.350 Standard condominium or cooperative 1.000 Deluxe renters 1.350 Standard renters 1.000
*There is an additional charge for Fire contents coverage. City home house base premium chart
Writing Company
Type of coverage
Rate per $100 all territories
Federal Insurance Company, Vigilant Insurance Company, Pacific Indemnity Company
City home house $ 0.307
Great Northern Insurance Company, Chubb Indemnity Insurance Company, Chubb National Insurance Company
City home house $ 0.289
Other permanent structures adjustment - City home house
For each 1% above 20% of house coverage: For each 1% below 20% of house coverage: 0.50% -0.25%
Sinkhole collapse coverage If sinkhole collapse coverage is requested for a house, the factor is 20%. Discount Writing Company Charts (not applicable to City home house)
Deluxe house/ vacation home
house
Condominium or
cooperative
Renters Vigilant Insurance Company 0.800 0.900 0.900 Pacific Indemnity Company 0.712 0.900 0.900 Great Northern Insurance Company, Chubb National Insurance Company, Chubb Indemnity Insurance Company
0.663 0.850 0.850
08/27/18 Pennsylvania Masterpiece Manual Home and Contents: Charts Page 7.1

Home and Contents: Charts Territory relativity chart (not applicable to City home house)
Territory
Deluxe house/vacation
home house
Condominium or
cooperative
Renters 001 1.000 1.000 1.000 005 0.720 0.519 0.519 006 0.537 0.519 0.519 007 0.512 0.519 0.519 008 0.720 0.519 0.519 009 0.756 0.519 0.519 010 0.611 0.549 0.549 012 0.537 0.519 0.519 014 1.000 1.000 1.000 021 0.676 0.549 0.549 022 0.537 0.519 0.519 023 0.512 0.519 0.519 024 0.676 0.549 0.549 025 0.512 0.519 0.519 027 0.512 0.519 0.519 031 0.570 0.519 0.519 035 0.676 0.610 0.610 037 0.756 0.519 0.519 051 0.697 0.519 0.519 052 0.697 0.519 0.519 053 0.611 0.549 0.549 054 0.720 0.519 0.519 055 0.675 0.549 0.549 056 0.756 0.519 0.519 057 0.676 0.549 0.549 058 0.570 0.519 0.519 059 0.570 0.519 0.519 061 0.611 0.549 0.549 071 0.611 0.549 0.549 073 0.685 0.519 0.519 074 0.675 0.549 0.549 075 0.697 0.519 0.519 076 0.629 0.610 0.610 077 0.697 0.519 0.519 081 0.697 0.519 0.519 082 0.697 0.519 0.519 083 0.707 0.747 0.747 086 0.910 0.747 0.747 087 0.756 0.519 0.519 088 0.697 0.519 0.519 089 0.720 0.519 0.519 090 0.537 0.519 0.519 091 0.697 0.519 0.519 092 0.715 0.549 0.549 093 0.720 0.519 0.519
08/27/18 Pennsylvania Masterpiece Manual Home and Contents: Charts Page 7.2

Home and Contents: Charts
Territory relativity chart (not applicable to City home house) (continued)
Territory
Deluxe house/vacation
home house
Condominium or
cooperative
Renters 094 0.697 0.519 0.519 095 0.863 0.747 0.747 096 0.697 0.519 0.519 099 0.611 0.549 0.549 100 0.512 0.519 0.519 101 0.910 0.747 0.747 102 0.611 0.549 0.549 104 0.697 0.610 0.610 105 0.697 0.610 0.610 106 0.697 0.610 0.610 107 0.697 0.833 0.833 108 0.697 0.833 0.833 109 0.697 0.610 0.610 110 0.674 0.610 0.610 111 0.697 0.610 0.610 112 0.697 0.610 0.610 113 0.697 0.610 0.610 114 0.697 0.833 0.833 115 0.674 0.610 0.610 116 0.697 0.610 0.610 117 0.697 0.610 0.610 119 0.697 0.610 0.610 120 0.674 0.610 0.610 121 0.697 0.610 0.610 122 0.697 0.833 0.833 123 0.697 0.610 0.610 124 0.697 0.610 0.610 125 0.697 0.610 0.610 126 0.697 0.833 0.833 127 0.697 0.610 0.610 128 0.697 0.610 0.610 129 0.697 0.610 0.610 130 0.697 0.610 0.610 131 0.697 0.610 0.610 132 0.863 0.747 0.747 133 0.705 0.747 0.747 134 0.753 0.519 0.519 135 0.835 0.747 0.747 136 0.836 0.747 0.747 137 0.753 0.519 0.519 138 0.703 0.747 0.747 139 0.629 0.610 0.610 140 0.863 0.747 0.747 141 0.837 0.747 0.747
08/27/18 Pennsylvania Masterpiece Manual Home and Contents: Charts Page 7.3

Home and Contents: Charts Coverage adjustments charts Contents adjustment Additional deluxe or standard contents purchased:
Factor For each 1% of contents above 50% of deluxe house coverage
0.50% For each 1% of contents above 30% of vacation home house coverage
0.50%
Reduced deluxe or standard contents purchased:
Factor For each 1% of the first 10% contents below 50% of deluxe house coverage
-0.35%
For each 1% of contents below 40% of deluxe house coverage
-0.25%
For each 1% of contents below 30% of vacation home house coverage
-0.25%
For deluxe house the only contents value available below 5% is zero. For vacation home house the contents cannot be reduced below 5%. Fire contents (not applicable to City home house). For every 1% of house coverage that is requested for the fire contents amount, the factor is 0.45% City home contents Writing Company
Amount of coverage
Rate per $100 all territories
Federal Insurance Company, Vigilant Insurance Company, Pacific Indemnity Company
50% or more of house coverage $ 0.312 40%-49% of house coverage $ 0.364 30%-39% of house coverage $ 0.416 20%-29% of house coverage $ 0.467 10%-19% of house coverage $ 0.520
Great Northern Insurance Company, Chubb Indemnity Insurance Company, Chubb National Insurance Company
50% or more of house coverage $ 0.293 40%-49% of house coverage $ 0.342 30%-39% of house coverage $ 0.390 20%-29% of house coverage $ 0.450 10%-19% of house coverage $ 0.489
08/27/18 Pennsylvania Masterpiece Manual Home and Contents: Charts Page 7.4

Home and Contents: Charts Other permanent structures adjustment For each 1% above 20% of deluxe house coverage and above 10% of vacation home house coverage:
For each 1% below 20% of deluxe house coverage and below 10% of vacation home house coverage:
0.50% -0.25% Additions and alterations adjustment
Additional additions and alterations coverage purchased:
For each 1% above 10% of additional additions and alterations coverage purchased:
First 20% 0.50% Additional 20%+ 0.53%
Reduced additions and alterations coverage purchased. For every 1% of additions and alterations coverage below 10% of contents coverage, the factor is -0.50%. Actual cash value adjustment
Actual cash value discount Apply if actual cash value payment basis applies in lieu of replacement cost payment basis
Deluxe house/ vacation home house with deluxe or standard contents
City home house with City home contents
Condominium, cooperative, or renters
10% 10% 23% Mold remediation expenses chart
Mold remediation expenses coverage House Condominiums, cooperatives, or renters Percentage of house coverage
Surcharge
Percentage of combined amount of contents and additions and alterations
Surcharge
10% 28% 10% 14% 25% 36% 25% 18% 50% 44% 50% 22% 75% 52% 75% 26% 100% 60% 100% 30%
GreenWise upgrade coverage - houses Percentage of house coverage
Surcharge
10% 1% 25% 2% 50% 3% 75% 4% 100% 5%
GreenWise upgrade coverage – condominium or cooperatives Percentage of combined amount of contents and additions and alterations
Surcharge
10% 1% 25% 2% 50% 3% 75% 4% 100% 5%
08/27/18 Pennsylvania Masterpiece Manual Home and Contents: Charts Page 7.5

Home and Contents: Charts Fire protection chart (not applicable to City home house)
Fire protection factor
Fire station within five
miles of residence?
Fire hydrant within 1,000 feet of the
residence?*
Central station or direct
reporting fire alarm?
Deluxe house or vacation home house
Condominium, cooperative, or renters
Fire protection code
Yes Yes Yes 0.95 0.95 A
No 1.00 1.00 A
No Yes 1.06 1.10 A No 1.18 1.26 B
No Yes Yes 1.10 1.15 A
No 1.26 1.31 B
No Yes 1.13 1.18 B No 1.38 1.40 B
*A 10,000 gallon water source (private hydrant, pool, etc.) which is accessible year-round is also acceptable. Value factor chart (not applicable to City Home House) Fire protection code. Use the fire protection chart to determine whether a residence is fire protection code A or B. Value of building or contents. For a house, use the value of the highest valued building at the location (excluding contents) to determine the coverage amount. For a condominium, cooperative, or rental unit, use the value of contents to determine the amount of coverage. Round the value to the nearest $1,000. If the building or contents value is not in the chart, calculate your value factor using the nearest value factor and the factor increase per for each additional $1,000. EXAMPLE: $153,000 deluxe house or vacation home house with deluxe contents, fire protection code A For $150,000 the value factor is 1.4500; the value factor per for each additional $1,000 is 0.00900. Figure the difference between the value of the building or contents and the nearest value in the chart (less than or equal to) and divide by 1,000. This provides the number of thousands between the values. $153,000 -$150,000 $ 3,000 ÷ $1,000 = 3 Multiply the value factor per for each additional $1,000 by the number of thousands between values 3 x 0.0090 = 0.027 Add this amount to the $150,000 value factor 1.4500 1.4500 + 0.0270 = 1.4770 The result, 1.4770, is the value factor for this example. 08/27/18 Pennsylvania Masterpiece Manual Home and Contents: Charts Page 7.6

Home and Contents: Charts Value factor chart (continued) Deluxe house or vacation home house Fire protection code A Fire protection code B Value of building Value factor Value factor per $1,000
Each additional $1,000 Value factor Value factor per $1,000
Each additional $1,000 $ 50,000 0.5000 0.01000 0.5000 0.01000 $ 55,000 0.5500 0.01000 0.5500 0.01000 $ 60,000 0.6000 0.01000 0.6000 0.01000 $ 65,000 0.6500 0.01000 0.6500 0.01000 $ 70,000 0.7000 0.01000 0.7000 0.01000 $ 75,000 0.7500 0.01000 0.7500 0.01000 $ 80,000 0.8000 0.01000 0.8000 0.01000 $ 85,000 0.8500 0.01000 0.8500 0.01000 $ 90,000 0.9000 0.01000 0.9000 0.01000 $ 95,000 0.9500 0.01000 0.9500 0.01000 $ 100,000 1.0000 0.00900 1.0000 0.01126 $ 150,000 1.4500 0.00900 1.5630 0.01126 $ 250,000 2.3500 0.00760 2.6890 0.00950 $ 500,000 4.2500 0.00700 5.0640 0.00876 $ 700,000 5.6500 0.00600 6.8160 0.00750 $ 1,000,000 7.4500 0.00600 9.0660 0.00750 $ 1,500,000 10.4500 0.00600 12.8160 0.00750 $ 3,000,000 19.4500 0.00620 24.0660 0.00776 $ 5,000,000 31.8500 0.00640 39.5860 0.00800 $ 7,500,000 47.8500 0.00640 59.5860 0.00800 $10,000,000 63.8500 0.00640 79.5860 0.00800 $20,000,000+ 127.8500 0.00640 159.5860 0.00800
Condominium, cooperative, or renters Fire protection codes A and B
Value of contents
Value factor
Value factor per $1,000 Each additional $1,000
$ 15,000 0.3550 0.02580 $ 30,000 0.7420 0.02580 $ 40,000 1.0000 0.02800 $ 150,000 4.0800 0.02580 $ 1,000,000 26.0100 0.02580 $ 1,500,000 38.9100 0.02580 $ 3,000,000 77.6100 0.02580 $ 5,000,000 129.2100 0.02580
08/27/18 Pennsylvania Masterpiece Manual Home and Contents: Charts Page 7.7

Home and Contents: Charts Deductible factor charts Deluxe house, Vacation home house, Condominium, Cooperative, or Renters:
Deluxe House, Vacation Home House Base deductible
Value of building
$250 $500 $1,000 $2,500 $5,000 $7,500 $10,000 $25,000 $50,000 $100,000
$ 15,000 1.150 1.050 0.900 0.735 0.600 0.550 0.500 0.450 0.400 0.300 $ 50,000 1.150 1.050 0.900 0.735 0.600 0.550 0.500 0.450 0.400 0.300 $ 500,000 1.150 1.050 0.900 0.735 0.600 0.550 0.500 0.450 0.400 0.300 $ 1,000,000 1.200 1.150 0.950 0.800 0.625 0.550 0.520 0.450 0.400 0.330 $ 2,500,000 1.200 1.150 1.100 0.835 0.750 0.650 0.545 0.490 0.425 0.375 $ 5,000,000 1.500 1.250 1.100 0.900 0.800 0.750 0.620 0.535 0.450 0.400 $ 7,500,000 and greater
1.500 1.300 1.250 0.950 0.900 0.850 0.800 0.750 0.564 0.500
We interpolate between the closest lower and higher listed values where applicable.
Condominium, cooperative, or renters Value of Contents
Base deductible
and A&A combined
$250 $500 $1,000 $2,500 $5,000 $7,500 $10,000 $25,000 $50,000 $100,000
$ 15,000 1.150 1.050 0.900 0.735 0.600 0.550 0.500 0.450 0.400 0.300 $ 50,000 1.150 1.050 0.900 0.735 0.600 0.550 0.500 0.450 0.400 0.300 $ 500,000 1.150 1.050 0.900 0.735 0.600 0.550 0.500 0.450 0.400 0.300 $ 1,000,000 1.200 1.150 0.950 0.800 0.625 0.550 0.520 0.450 0.400 0.330 $ 2,500,000 1.200 1.150 1.100 0.835 0.750 0.650 0.545 0.490 0.425 0.375 $ 5,000,000 1.500 1.250 1.100 0.900 0.800 0.750 0.620 0.535 0.450 0.400 $ 7,500,000 and greater
1.500 1.300 1.250 0.950 0.900 0.850 0.800 0.750 0.564 0.500
We interpolate between the closest lower and higher listed values where applicable. City home house
Base deductible
Deductible
factors
Maximum amount
of change $ 250 1.250 No Maximum $ 500 1.120 No Maximum $ 1,000 1.000 -- $ 2,500 0.875 $ 1,500 $ 5,000 0.750 $ 3,000 $ 7,500 0.688 $ 4,500 $ 10,000 0.625 $ 7,000 $ 25,000 0.563 $ 9,000 $ 50,000 0.500 $13,000 $100,000 0.410 $14,500
Discounts and surcharges charts
Burglar alarm Factor Deluxe house or vacation home house with deluxe or standard contents 0.95 Deluxe house with fire contents or no contents 1.00 Deluxe or standard condominium, cooperative, or renters 0.95
08/27/18 Pennsylvania Masterpiece Manual Home and Contents: Charts Page 7.8

Home and Contents: Charts Discounts and surcharges charts
(continued) Discounts
Deluxe house
or vacation home house
Condominium,
cooperative, or renters
Gated community 5% 5% Gated community patrol service 5% 5% Residential sprinkler system 10% N/A Fire resistive 15% 15% Suburban rating discount 10% 10% Payment history
• 2 years paid in full; or • 3+ years paid in full
3% 5%
3% 5%
Lien free* 2.5% 2.5% Building security protection N/A 5% Building fire protection N/A 5%
*Not applicable to Renters policies. Portfolio discounts
Deluxe house,
City home house
Condominium, cooperative, or
renters Home with auto 10.0% 10.0% Home with valuable articles Minimum eligible amount of coverage
• the total of all itemized and/or blanket valuable articles is at least $250,000; or
• the total of all itemized and/or blanket valuable articles (excluding fine arts, if any) is at least $50,000
12.5% 12.5%
• the total of all itemized and/or blanket valuable articles is at least $100,000; or
• the total of all itemized and/or blanket valuable articles (excluding fine arts, if any) is at least $25,000
10.0% 10.0%
We will apply the highest percentage of discount for which the residence qualifies. * Portfolio discounts are not applied to the 25% maximum total discount for City home house.
Discounts
City home house (A maximum total discount of 25% applies to City home house)*
Fire alarm 5% Burglar alarm 5% Temperature monitoring system 5% Residential sprinkler system 10% Fire resistive 15% Payment history
• 2 years paid in full; or • 3+ years paid in full
3% 5%
Lien free 2.5% * Lien free and Payment history are not applied to the 25% maximum total discount for City home house. Restoration discount for City home house *
Restoration completed
within 5 years Restoration completed within 6-10 years
Plumbing system 2% 1% Electrical system 2% 1%
Heating/A.C./ventilating system 2% 1% Roof 2% 1% Façade repointing 2% 1%
* Restoration discounts are included in the 25% maximum total discount for City home house.
08/27/18 Pennsylvania Masterpiece Manual Home and Contents: Charts Page 7.9

Home and Contents: Charts Superior protection
Superior protection discounts
Deluxe house
Vacation home house
Security protection for the entire external perimeter of the house consisting of any one or more of the following: • closed circuit TV cameras monitored 24
hours a day; • detection system, external to the residence
which is motion activated and monitored 24 hours per day;
• 24 hour on site security guard.
5% 5%
Full time caretaker who lives at the residence year round. This discount applies only if a 24 hour on site security guard is not present.
2% 4%
24 hour signal continuity protection for central station or direct fire and burglar alarm systems which activates the alarm when interrupted.
2% 2%
Perimeter gate where vehicular and pedestrian access is limited to entrances controlled by locked or electronic gates. This discount does not apply if any other Gated community discount applies.
2% 2%
Sprinkler system water flow alarm which activates a central station or direct alarm.
2% 2%
Temperature monitoring system, to protect against freezing, which activates a central station alarm.
2% 4%
Permanently installed, electrical power back−up generator capable of servicing heat, light, alarm and sprinkler systems.
5% 5%
Explosive gas leakage detector which activates a central station or direct fire alarm.
2% 2%
Automatic seismic shut−off valve to gas lines which activates automatically in the event of an earthquake.
2% 2%
Lightning protection system having a U.L. Master Label and installed by a certified Lightning Protection Institute installer. The system must include lightning rods and lightning arresters protecting the electrical wiring and all electronic devices of the entire house.
2% 2%
Water leak detection system having a U.L. Master Label. The system must monitor all areas containing plumbing devices and outlets. In the event of a leak, this system must:
• activate a central station or direct alarm; or 3% 3% • include a control system that closes the
master plumbing value; or 5% 5%
• include a control system that closes the master plumbing value and activates a central station or direct alarm.
8% 8%
The maximum total discount for Superior protection is 15%.
08/27/18 Pennsylvania Masterpiece Manual Home and Contents: Charts Page 7.10

Home and Contents: Charts New house and Renovated house discounts (not applicable to City home house)
New house
Age of
dwelling
Renovated house
Years since oldest
renovation 31% 0 17% 0 31% 1 17% 1 28% 2 15% 2 25% 3 12% 3 22% 4 9% 4 19% 5 6% 5 16% 6 3% 6 12% 7 9% 8 8% 9 6% 10 4% 11 3% 12 2% 13 1% 14 0% 15
Premier Client Discount
Risk Customer Loss free tenure tenure No Yes 0 years 1 year 0.0% 0.0% 0 years 2 years 0.0% 0.0% 0 years 3 years -1.0% -1.0% 0 years 4 years -1.5% -1.5% 0 years 5 years -2.0% -2.0% 0 years 6 years -2.5% -2.5% 0 years 7 years -3.0% -3.0% 0 years 8 years -4.0% -4.0% 0 years 9+ years -5.0% -5.0% 1 year 1 year 0.0% 0.0% 1 year 2 years 0.0% 0.0% 1 year 3 years -1.0% -1.0% 1 year 4 years -1.5% -1.5% 1 year 5 years -2.0% -2.0% 1 year 6 years -2.5% -2.5% 1 year 7 years -3.0% -3.0% 1 year 8 years -4.0% -4.0% 1 year 9+ years -5.0% -5.0%
08/27/18 Pennsylvania Masterpiece Manual Home and Contents: Charts Page 7.11

Home and Contents: Charts Discounts and surcharges charts (continued) Premier Client Discount (continued)
Risk Customer Loss free tenure tenure No Yes 2 years 2 years 0.0% 0.0% 2 years 3 years -1.0% -1.0% 2 years 4 years -1.5% -1.5% 2 years 5 years -2.0% -2.0% 2 years 6 years -2.5% -2.5% 2 years 7 years -3.0% -3.0% 2 years 8 years -4.0% -4.0% 2 years 9+ years -5.0% -5.0% 3 years 3+ years 0.0% -5.0% 4 years 4+ years 0.0% -5.8% 5 years 5+ years 0.0% -6.6% 6 years 6+ years 0.0% -7.5% 7 years 7+ years 0.0% -8.3% 8 years 8+ years 0.0% -9.1%
9+ years 9+ years 0.0% -10.0%
08/27/18 Pennsylvania Masterpiece Manual Home and Contents: Charts Page 7.12

Home and Contents: Charts Discounts and surcharges charts
(continued) Surcharges
Deluxe house or vacation home
house
City home house
Condominium, cooperative,
or renters Cancellation surcharge 10% 10% 10% Rented to others surcharge 25% N/A 25% Rental unit N/A 5% N/A Vacation home house nonoccupancy surcharge*
10% N/A N/A
Undervalue surcharge* 20% 20% N/A Renovation or construction surcharge* A renovation or construction
surcharge applies for one of the following: Minor construction • construction of additions, alterations,
or renovations to the existing house or other permanent structures resulting in an increase in the amount of coverage for the house or other permanent structure by an amount less than 10% of the coverage amount for the structure or $500,000, whichever amount is less;
______________OR,_________________ Major construction • new construction of a house or other
permanent structures(not applicable to City home house); or
• construction of additions, alterations, or renovations to the existing house or other permanent structures resulting in an increase in the amount of coverage for the house or other permanent structure which equals or exceeds 10% of the coverage amount for the structure or $500,000, whichever amount is less.
15%
35%
15%
35%
N/A
N/A
Renovation surcharge* N/A 35% N/A Vacant house surcharge (Deluxe House only)*
25% 25% N/A
*Applied by Company. Claims rating factor
Amount of house coverage $1,000,000 or less Risk tenure
Number of losses 0 1 2 3 4 5+
1 year 0.0% 20.0% 44.0% 72.5% 107.5% 150.0% 2 years 0.0% 16.0% 39.2% 66.8% 100.5% 141.3% 3 years -2.5% 12.0% 34.3% 61.2% 93.5% 132.7% 4 years -3.3% 8.0% 29.5% 55.5% 86.5% 124.0% 5 years -4.2% 5.3% 24.7% 49.7% 79.5% 115.5% 6 years -5.0% 2.7% 19.8% 43.8% 72.5% 107.0% 7 years -5.8% 0.0% 15.0% 38.0% 65.5% 98.5% 8 years -6.7% -2.5% 12.3% 32.0% 58.3% 89.8% 9+ years -7.5% -5.0% 9.5% 26.0% 51.0% 81.0%
08/27/18 Pennsylvania Masterpiece Manual Home and Contents: Charts Page 7.13

Home and Contents: Charts Discounts and surcharges charts (continued) Claims rating factor
Amount of house coverage equal to $2,000,000 Risk tenure
Number of losses 0 1 2 3 4 5+
1 year 0.0% 15.0% 35.5% 60.0% 89.0% 123.0% 2 years 0.0% 10.8% 30.7% 54.2% 82.2% 115.0% 3 years -2.5% 6.7% 25.8% 48.3% 75.3% 107.0% 4 years -3.3% 2.5% 21.0% 42.5% 68.5% 99.0% 5 years -4.2% 0.8% 17.0% 37.8% 62.8% 92.3% 6 years -5.0% -0.8% 13.0% 33.2% 57.2% 85.7% 7 years -5.8% -2.5% 9.0% 28.5% 51.5% 79.0% 8 years -6.7% -3.8% 5.8% 24.8% 47.0% 73.8% 9+ years -7.5% -5.0% 2.5% 21.0% 42.5% 68.5%
We interpolate for house coverage amounts between $1,000,001 and $1,999,999.
Amount of house coverage $5,000,000 or greater Risk tenure
Number of losses 0 1 2 3 4 5+
1 year 0.0% 10.0% 26.5% 45.5% 67.5% 92.5% 2 years 0.0% 6.7% 22.7% 41.2% 62.5% 86.8% 3 years -5.0% 3.3% 18.8% 36.8% 57.5% 81.2% 4 years -5.8% 0.0% 15.0% 32.5% 52.5% 75.5% 5 years -6.6% -1.7% 11.7% 28.7% 48.0% 70.3% 6 years -7.5% -3.3% 8.3% 24.8% 43.5% 65.2% 7 years -8.3% -5.0% 5.0% 21.0% 39.0% 60.0% 8 years -9.1% -6.2% 2.5% 18.0% 35.5% 56.0% 9+ years -10.0% -7.5% 0.0% 15.0% 32.0% 52.0%
We interpolate for house coverage amounts between $2,000,001 and $4,999,999.
Amount of contents and additions and alterations coverage $250,000 or less Risk tenure
Number of losses 0 1 2 3 4 5+
1 year 0.0% 20.0% 44.0% 72.5% 107.5% 150.0% 2 years 0.0% 16.0% 39.2% 66.8% 100.5% 141.3% 3 years -2.5% 12.0% 34.3% 61.2% 93.5% 132.7% 4 years -3.3% 8.0% 29.5% 55.5% 86.5% 124.0% 5 years -4.2% 5.3% 24.7% 49.7% 79.5% 115.5% 6 years -5.0% 2.7% 19.8% 43.8% 72.5% 107.0% 7 years -5.8% 0.0% 15.0% 38.0% 65.5% 98.5% 8 years -6.7% -2.5% 12.3% 32.0% 58.3% 89.8% 9+ years -7.5% -5.0% 9.5% 26.0% 51.0% 81.0%
08/27/18 Pennsylvania Masterpiece Manual Home and Contents: Charts Page 7.14

Home and Contents: Charts Discounts and surcharges charts (continued) Claims rating factor (continued)
Amount of contents and additions and alterations coverage equal to $500,000 Risk tenure
Number of losses 0 1 2 3 4 5+
1 year 0.0% 15.0% 35.5% 60.0% 89.0% 123.0% 2 years 0.0% 10.8% 30.7% 54.2% 82.2% 115.0% 3 years -2.5% 6.7% 25.8% 48.3% 75.3% 107.0% 4 years -3.3% 2.5% 21.0% 42.5% 68.5% 99.0% 5 years -4.2% 0.8% 17.0% 37.8% 62.8% 92.3% 6 years -5.0% -0.8% 13.0% 33.2% 57.2% 85.7% 7 years -5.8% -2.5% 9.0% 28.5% 51.5% 79.0% 8 years -6.7% -3.8% 5.8% 24.8% 47.0% 73.8% 9+ years -7.5% -5.0% 2.5% 21.0% 42.5% 68.5%
We interpolate for contents and additions and alterations coverage amounts between $250,001 and $499,999.
Amount of contents and additions and alterations coverage $1,000,000 or greater Risk tenure
Number of losses 0 1 2 3 4 5+
1 year 0.0% 10.0% 26.5% 45.5% 67.5% 92.5% 2 years 0.0% 6.7% 22.7% 41.2% 62.5% 86.8% 3 years -5.0% 3.3% 18.8% 36.8% 57.5% 81.2% 4 years -5.8% 0.0% 15.0% 32.5% 52.5% 75.5% 5 years -6.6% -1.7% 11.7% 28.7% 48.0% 70.3% 6 years -7.5% -3.3% 8.3% 24.8% 43.5% 65.2% 7 years -8.3% -5.0% 5.0% 21.0% 39.0% 60.0% 8 years -9.1% -6.2% 2.5% 18.0% 35.5% 56.0% 9+ years -10.0% -7.5% 0.0% 15.0% 32.0% 52.0%
We interpolate for contents and additions and alterations coverage amounts between $500,001 and $999,999.
08/27/18 Pennsylvania Masterpiece Manual Home and Contents: Charts Page 7.15

Home and Contents: Charts
Tier factor chart
Tier
Deluxe house/
Vacation home City home house factor house factor
Condominium, cooperative, or renters factor
1 0.62890 xxxx 0.72900 2 0.66680 xxxx 0.76370 3 0.70710 xxxx 0.79990 4 0.75050 xxxx 0.83800 5 0.79760 xxxx 0.87850 6 0.84530 xxxx 0.92060 7 0.89680 xxxx 0.96430 8 0.95060 xxxx 1.01020 9 1.00770 xxxx 1.05820 10 1.06960 xxxx 1.10870 11 1.13410 xxxx 1.16160 12 1.20320 xxxx 1.21700 13 1.28630 xxxx 1.27980 14 1.36580 xxxx 1.34170 15 1.44970 xxxx 1.40570 16 1.53710 xxxx 1.47330 17 1.66510 xxxx 1.57620 18 1.76530 xxxx 1.64440 19 2.17950 xxxx 1.96620 20 1.00000 xxxx 1.00000 21 N/A 22 23 24 25 26 27 28 29 30 31 32 33 34 35 36 37 38 39 40 41 42 43 44 45 46 47 48 49 50 999
08/27/18 Pennsylvania Masterpiece Manual Home and Contents: Charts Page 7.16

Home and Contents: Charts Dollar adjustments charts Liability Liability is rated in the state where the Primary residence (first location with liability) is located.
Primary location Each additional location Any liability Personal liability Excess only* Is coverage provided for
Building and/or contents? Is coverage provided for Building and/or contents?
Amount of coverage
Yes
No
Yes
No
$ 50,000 $ 0 $ 15 $ 0 $ 15 N/A $ 100,000 $ 43 $ 58 $ 10 $ 25 N/A $ 200,000 $ 72 $ 87 $ 15 $ 30 N/A $ 300,000 $ 97 $ 112 $ 19 $ 34 N/A $ 500,000 $ 128 $ 143 $ 24 $ 39 N/A $ 1,000,000 $ 141 $ 156 $ 28 $ 43 $ 22 $ 2,000,000 $ 167 $ 182 $ 32 $ 47 $ 26 $ 3,000,000 $ 184 $ 199 $ 33 $ 48 $ 28 $ 5,000,000 $ 206 $ 221 $ 40 $ 55 $ 32 $10,000,000 $ 266 $ 281 $ 42 $ 57 $ 43
*These premiums only apply when the insured requests building and/or contents coverage for one or more locations. No personal liability coverage. Subtract $15 for each location that building and/or contents coverage is provided if no personal liability coverage is provided. House replacement cost Subtract $5 if verified or conditional replacement cost payment basis applies in lieu of extended replacement cost payment basis. House replacement cost can only be applied by the Company. Employment practices liability Add the amount from the following chart based on the amount of coverage selected. The coverage is always rated at one residence and the residence must be listed for Personal liability coverage.
Charge for Employment practices liability coverage with a $10,000 deductible Employment practices liability Reputational injury Code
Amount of coverage
Maximum annual amount of coverage
Amount of coverage
Maximum annual amount of coverage
Additional premium
A $250,000 $500,000 $25,000 $25,000 $ 650 B $500,000 $500,000 $50,000 $50,000 $ 975
08/27/18 Pennsylvania Masterpiece Manual Home and Contents: Charts Page 7.17

Home and Contents: Charts Dollar adjustments charts (continued)
Homeowner/unit assessments
For each additional $1,000 homeowner/unit assessments coverage over $50,000, add:
For each additional $1,000 coverage for an assessment due to a deductible in the homeowner, condominium, or cooperative association’s insurance over $5,000, add:
Deluxe house $2 $2 Vacation home house $2 $2 City home house $2 $2 Deluxe condominium or cooperative $2 $2 Standard condominium or cooperative $2 $2 Refer to Company for: a total amount of homeowner or unit assessments coverage greater than $500,000 or greater than the
amount of coverage for house, or the combined amount of coverage for additions and alterations and contents; or
for an amount exceeding $50,000 for coverage for an assessment due to a deductible in the homeowners , condominium, or cooperative association’s insurance.
Landscaping For each additional
$1,000 landscaping coverage over 5% of the amount of house coverage and 10% of the amount of contents coverage, add:
For each additional $5,000 over $10,000 for any one tree, shrub, or plant, add:
Deluxe house $4 $50 Vacation home house $4 $50 Deluxe and standard condominium, cooperative, or renters
$4 $50
Refer to company to increase coverage for landscaping: • over $250,000 for the total amount of landscaping coverage; or • over $50,000 for the amount of coverage for any tree, shrub or plant. Landscaping – wind and hail coverage For each $1,000 landscaping coverage with the
perils of wind and hail included, add: Deluxe house $15 Vacation home house $15 Deluxe and standard condominium, cooperative, or renters
$15
This increased coverage will be added by the Company. Landscaping – sleet and weight of ice and snow coverage For each $1,000 landscaping coverage with the
perils of sleet and weight of ice and snow included, add:
Deluxe house $15 Vacation home house $15 Deluxe and standard condominium, cooperative, or renters
$15
This increased coverage will be added by the Company. 08/27/18 Pennsylvania Masterpiece Manual Home and Contents: Charts Page 7.18

Home and Contents: Charts Dollar Adjustments charts (continued) City garden coverage For each additional $1,000
city garden coverage over 5% of the amount of city home house coverage, add:
For each additional $5,000 over $10,000 for any tree, shrub, or plant, add:
City home house $4 $50 Refer to company to increase coverage for landscaping: • over $250,000 for the total amount of landscaping coverage; or • over $50,000 for the amount of coverage for any tree, shrub or plant. City garden coverage – wind and hail coverage For each $1,000 city garden coverage with the
perils of wind and hail included, add: City home house $15 This increased coverage will be added by the Company. City garden coverage – sleet and weight of ice and snow coverage For each $1,000 city garden coverage with the
perils of sleet and weight of ice and snow included, add:
City home house $15 This increased coverage will be added by the Company. Business property For each additional $1,000 on premises business
property coverage over $25,000, add: Deluxe contents $5 Standard contents $5 Fire contents $5 City home contents $5 Deluxe condominium, cooperative, or renters $5 Standard condominium, cooperative, or renters $5 For a total amount of business property coverage greater than $250,000, refer to Company. The increased coverage will be applied by the Company. Student additional living expenses For $5,000 student
additional living expenses coverage, add:
For each $1,000 student additional living expenses coverage, greater than $5,000, add:
Deluxe contents $25 $1.50 Standard contents $25 $1.50 Fire contents $25 $1.50 City home contents $25 $1.50 Deluxe condominium, cooperative, or renters $25 $1.50 Standard condominium, cooperative, or renters $25 $1.50 For a total amount of student additional living expenses coverage greater than $250,000, refer to Company. The increased coverage will be applied by the Company. 08/27/18 Pennsylvania Masterpiece Manual Home and Contents: Charts Page 7.19

Home and Contents: Charts Dollar Adjustments charts (continued) Assisted living care coverage – contents of a relative-in-care
For the first $5,000 assisted living care coverage – contents of a relative-in-care, add:
For each $1,000 assisted living care coverage – contents of a relative-in-care, greater than $5,000, add:
Deluxe contents $50 $5 Standard contents $50 $5 City home contents $50 $5 Deluxe condominium, cooperative, or renters $50 $5 Standard condominium, cooperative, or renters $50 $5 For a total amount of assisted living care coverage greater than $250,000, refer to Company. The increased coverage will be applied by the Company. Family protection coverage The premium for Family protection coverage is $110. Earthquake coverage For a house add $0.60 for every $1,000 of house coverage. For a house with GreenWise upgrade coverage, multiply the earthquake rate by 1.05.
08/27/18 Pennsylvania Masterpiece Manual Home and Contents: Charts Page 7.20