FILATEX INDIA LIMITED CIN No.L17119DN1990PLC000091 · Pursuant to Regulation 30(2) of the SEBI...
36
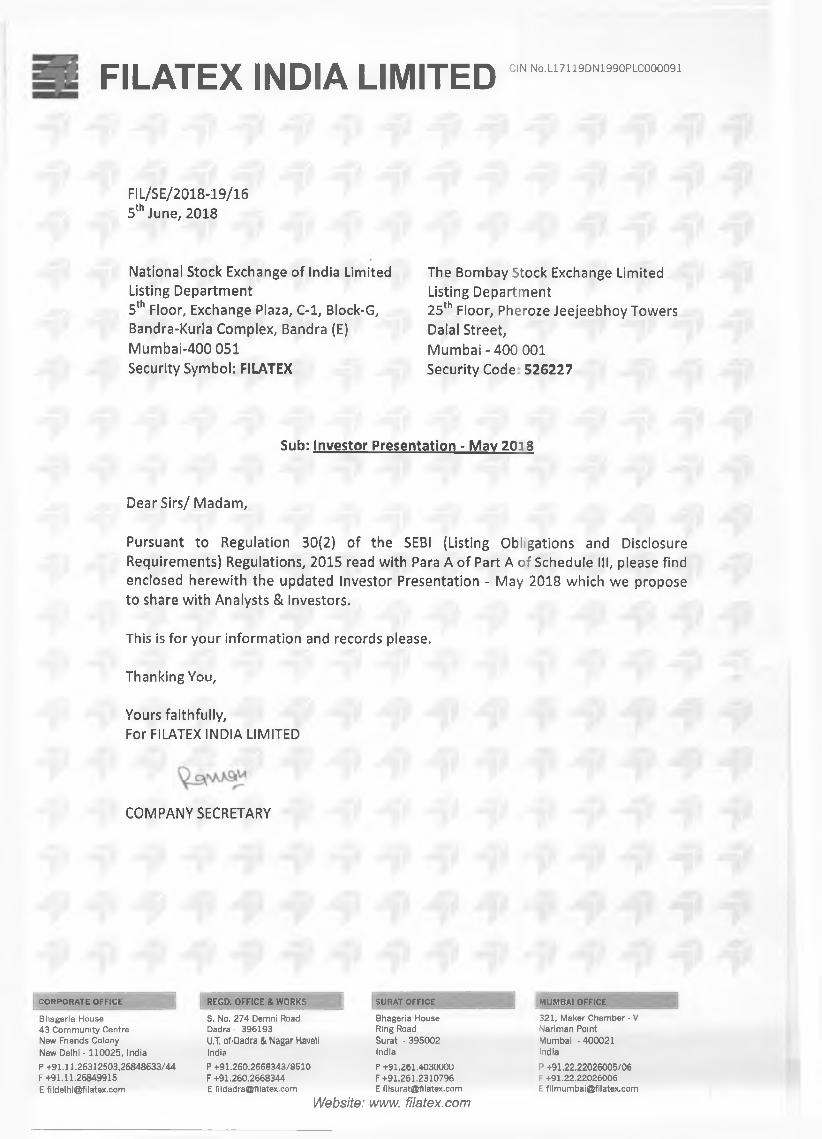
FILATEX INDIA LIMITED CIN No.L17119DN1990PLC000091 FIL/S E/2018-19/16 5th June, 2018 National Stock Exchange of India Limited Listing Department 5th Floor, Exchange Plaza, C-l, Block-G, Bandra-Kurla Complex, Bandra (E) Mumbai-400 051 Security Symbol: FILATEX The Bombay Stock Exchange Limited Listing Department 25th Floor, Pheroze Jeejeebhoy Towers Dalai Street, Mumbai - 400 001 Security Code 526227 Sub: Investor Presentation - Mav 20i8 Dear Sirs/ Madam, Pursuant to Regulation 30(2) of the SEBI (Listing Obligations and Disclosure Requirements) Regulations, 2015 read with Para A of Part A of Schedule III, please find enclosed herewith the updated Investor Presentation - May 2018 which we propose to share with Analysts & Investors. This is for your information and records please. Thanking You, Yours faithfully, For FILATEX INDIA LIMITED COMPANY SECRETARY CORPORATE OFFICE REGD. OFFICE & WORKS SURAT OFFICE MUMBAI OFFICE Bhageria House 43 Community Centre New Friends Colony New Delhi - 110025, India S. No. 274 Demni Road Dadra- 396193 U.T. of'Dadra & Nagar Haveli India Bhageria House Ring Road Surat • 395002 India 321, Maker Chamber - V Nariman Point Mumbai ■400021 India P +91.11.26312503,26848633/44 P +91.260.2668343/8610 F +91.11.26849915 F +91.260.2668344 P +91.261.4030000 F+91.261.2310796 P +91.22.22026005/06 F +91.22.22026006 E [email protected] E [email protected] E [email protected] E [email protected] Website: w w w .filatex.com
Transcript of FILATEX INDIA LIMITED CIN No.L17119DN1990PLC000091 · Pursuant to Regulation 30(2) of the SEBI...
FILATEX INDIA LIMITED CIN No.L17119DN1990PLC000091
FIL/S E/2018-19/16 5th June, 2018
National Stock Exchange of India Limited Listing Department5th Floor, Exchange Plaza, C -l, Block-G, Bandra-Kurla Complex, Bandra (E) Mumbai-400 051 Security Symbol: FILATEX
The Bombay Stock Exchange Limited Listing Department25th Floor, Pheroze Jeejeebhoy Towers Dalai Street,Mumbai - 400 001 Security Code 526227
Sub: Investor Presentation - Mav 20i8
Dear Sirs/ Madam,
Pursuant to Regulation 30(2) of the SEBI (Listing Obligations and Disclosure Requirements) Regulations, 2015 read with Para A of Part A of Schedule III, please find enclosed herewith the updated Investor Presentation - May 2018 which we propose to share with Analysts & Investors.
This is for your information and records please.
Thanking You,
Yours faithfully,For FILATEX INDIA LIMITED
COMPANY SECRETARY
CORPORATE OFFICE REGD. OFFICE & WORKS SURAT OFFICE MUMBAI OFFICE
Bhageria House 43 Community Centre New Friends Colony New Delhi - 110025, India
S. No. 274 Demni Road Dadra- 396193 U.T. of'Dadra & Nagar Haveli India
Bhageria House Ring Road Surat • 395002 India
321, Maker Chamber - V Nariman Point Mumbai ■ 400021 India
P +91.11.26312503,26848633/44 P +91.260.2668343/8610F +91.11.26849915 F +91.260.2668344
P +91.261.4030000 F +91.261.2310796
P +91.22.22026005/06 F +91.22.22026006
E [email protected] E [email protected] E [email protected] E [email protected]
Website: www.filatex.com

Filatex India LimitedInvestor Presentation
May 2018

FIL | Investor Presentation | May 2018
DisclaimerThis presentation and the accompanying slides (the “Presentation”), which have been prepared by Filatex India Limited (the “Company”), have been prepared solely forinformation purposes and do not constitute any offer, recommendation or invitation to purchase or subscribe for any securities, and shall not form the basis or be relied on inconnection with any contract or binding commitment what so ever. No offering of securities of the Company will be made except by means of a statutory offering documentcontaining detailed information about the Company.
This Presentation has been prepared by the Company based on information and data which the Company considers reliable, but the Company makes no representation orwarranty, express or implied, whatsoever, and no reliance shall be placed on, the truth, accuracy, completeness, fairness and reasonableness of the contents of thisPresentation. This Presentation may not be all inclusive and may not contain all of the information that you may consider material. Any liability in respect of the contents of,or any omission from, this Presentation is expressly excluded.
Certain matters discussed in this Presentation may contain statements regarding the Company’s market opportunity and business prospects that are individually andcollectively forward-looking statements. Such forward-looking statements are not guarantees of future performance and are subject to known and unknown risks,uncertainties and assumptions that are difficult to predict. These risks and uncertainties include, but are not limited to, the performance of the Indian economy and of theeconomies of various international markets, the performance of the industry in India and world-wide, competition, the company’s ability to successfully implement itsstrategy, the Company’s future levels of growth and expansion, technological implementation, changes and advancements, changes in revenue, income or cash flows, theCompany’s market preferences and its exposure to market risks, as well as other risks. The Company’s actual results, levels of activity, performance or achievements coulddiffer materially and adversely from results expressed in or implied by this Presentation. The Company assumes no obligation to update any forward-looking informationcontained in this Presentation. Any forward-looking statements and projections made by third parties included in this Presentation are not adopted by the Company and theCompany is not responsible for such third party statements and projections.
2

FIL | Investor Presentation | 2017-18
Co
nte
nt
Company Overview 04
Textile Market 15
Growth Drivers 18
Results Summary 21
Financial Overview 26
Shareholder Information 34

Company Overview

FIL | Investor Presentation | May 2018
About Us
About UsFILATEX INDIA LIMITED is in the business of manufacturing of synthetic filament yarns having a wide range of products. It has been an interesting journey as the promoters made a successful transition from trading of different varieties of synthetic yarns to manufacturing. After two decades of trading activities of yarns, Filatex India was incorporated on 8 August 1990 to enter into manufacturing and now successfully running 2 production facilities in Dadra & Nagar Havelli(UT) and Dahej (Gujarat).
Our vision
To be one of the leading polyester yarns manufacturing by producing products comparable to international standards, to be customer-focused through better quality, latest technology and continuous innovation.
Our mission
Integrity and Honesty in Business
Our values
Customer Satisfaction &
Delight
Encourage Creativity &
Innovation to drive people,
product & processes
To promote safe work practices
To protect the environment &
community
5
To attain highest level of good quality, integrity and honesty
To manufacture at an effective cost that provides our customers a competitive advantage
To encourage people's ownership, empowerment and working under team structure
Strive to maintain an edge over its competitors due to consistent product quality and low operating cost

FIL | Investor Presentation | May 2018
Key Facts And Figures
79
157
2 0 1 5 2 0 1 8
EBIDTA
10
60
2 0 1 5 2 0 1 8
PAT
Employees
~2000
Countries global export
34
Manufacturing units
2
Production Capacity(FY 2018-19)
328,300 TPA
Production Capacity(FY 2017-18)
237,000 MT
6
1,573 1,928
2 0 1 5 2 0 1 8
REVENUE ( N e t O f E x c i s e D u t y )(₹ in Crore)
FIL | Investor Presentation | May 2018
History/ Milestone
1990
1994
1996
1998
2008
2012
2016
2018
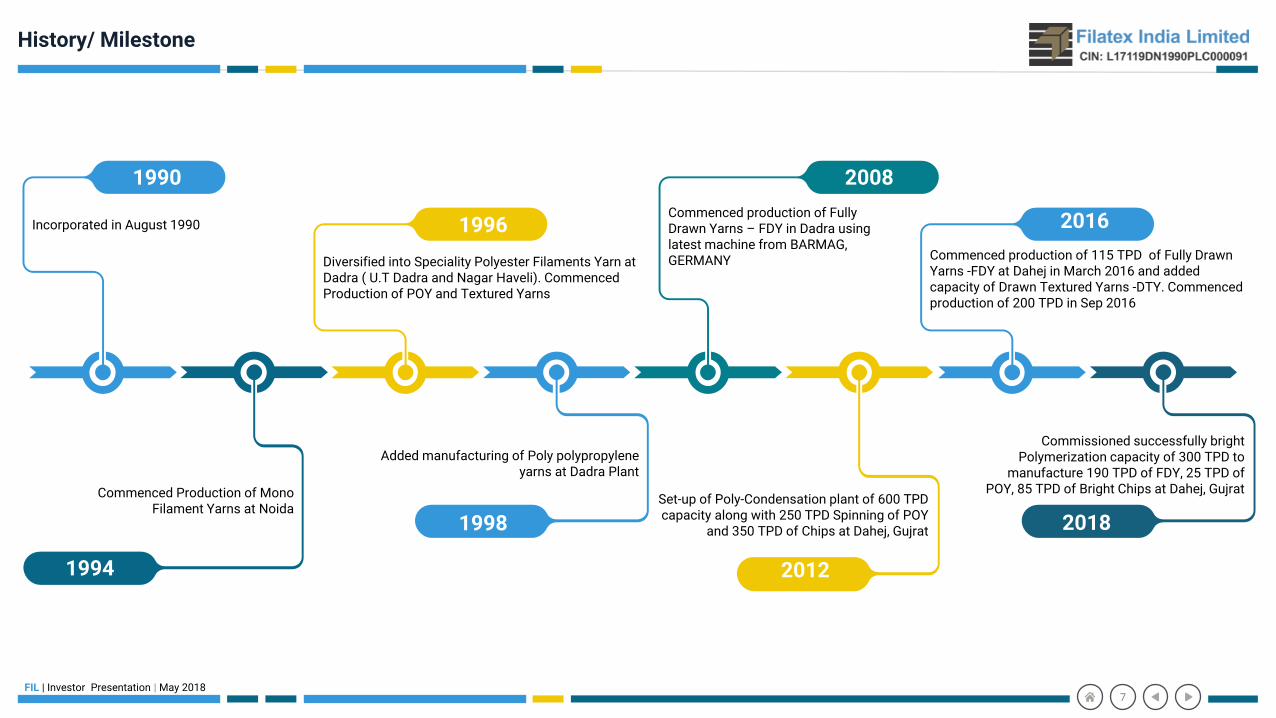
Commissioned successfully bright Polymerization capacity of 300 TPD to
manufacture 190 TPD of FDY, 25 TPD of POY, 85 TPD of Bright Chips at Dahej, Gujrat
Commenced production of 115 TPD of Fully Drawn Yarns -FDY at Dahej in March 2016 and added capacity of Drawn Textured Yarns -DTY. Commenced production of 200 TPD in Sep 2016
Commenced production of Fully Drawn Yarns – FDY in Dadra using latest machine from BARMAG, GERMANYDiversified into Speciality Polyester Filaments Yarn at
Dadra ( U.T Dadra and Nagar Haveli). Commenced Production of POY and Textured Yarns
Incorporated in August 1990
Set-up of Poly-Condensation plant of 600 TPD capacity along with 250 TPD Spinning of POY
and 350 TPD of Chips at Dahej, Gujrat
Added manufacturing of Poly polypropylene yarns at Dadra Plant
Commenced Production of Mono Filament Yarns at Noida
7

FIL | Investor Presentation | May 20188
Production Process Flowchart
MEG PTA
RAW MATERIALS TO FINISHED PRODUCTS AT DAHEJ PLANT
PTA PASTE TANK
ESTERIFICATIONREACTOR-1
900 TPD
Catalyst
ESTERIFICATIONREACTOR-2
PRE POLYREACTOR
FINISHER
CHIPS FDY
BRIGHT STREAM
BaSo4
300 TPD
85 TPD 190 TPD
ESTERIFICATIONREACTOR-2
PRE POLYREACTOR
FINISHERREACTOR
CHIPS
DTY
TiO2
600 TPD
SEMI DULL STREAM
180 TPD
POY
280 TPD
200 TPD
POY PARTIALLY ORIENTED YARNDTY DRAW TEXTURIZING YARNSFDY FULLY DRAWN YARN
POY
25 TPD
FDY
140 TPD
FIL | Investor Presentation | May 2018
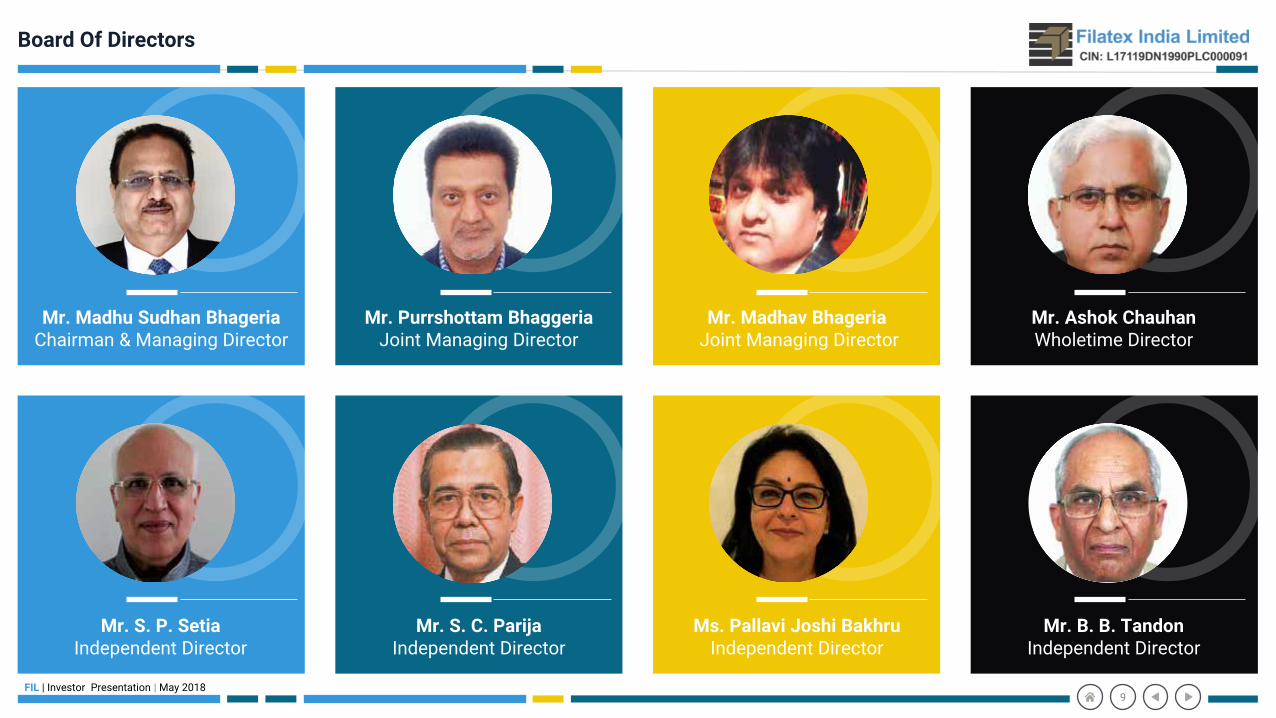
Board Of Directors
Mr. Madhu Sudhan BhageriaChairman & Managing Director
Mr. Purrshottam BhaggeriaJoint Managing Director
Mr. Madhav BhageriaJoint Managing Director
Mr. Ashok Chauhan Wholetime Director
Mr. S. P. SetiaIndependent Director
Mr. S. C. ParijaIndependent Director
Ms. Pallavi Joshi BakhruIndependent Director
Mr. B. B. TandonIndependent Director
9

FIL | Investor Presentation | May 2018
Geographical Presence
Canada
USA
Colombia
Peru
Brazil
Argentina
Portugal
Morocco
AlgeriaEgypt
Turkey
Iran
Poland
Latvia
Kenya
Nepal
Bangladesh
Thailand
South Korea
New Delhi
Dahej
Surat Dadra
Mumbai
Exporting to
34 countries across the
Globe
Over 50% of DTY
production areexported
Exports contributed
~20% to overall
Revenues as on FY18
Capacity increased
From 500MTPA
To 328,300MTPA
Dadar & Nagar Havelli (UT)
Dahej (Gujarat)
Manufacturing Facilities : 2
New Delhi
Surat
Mumbai
Marketing Office : 3
New Delhi
Corporate Office
10
Mexico
Chile
Domican RepublicDubai
Ecuador
Germany
Italy
Indonesia
S. Africa
Spain
UK
Uzbekistan
Vietnam
Slovenia
FIL | Investor Presentation | May 2018
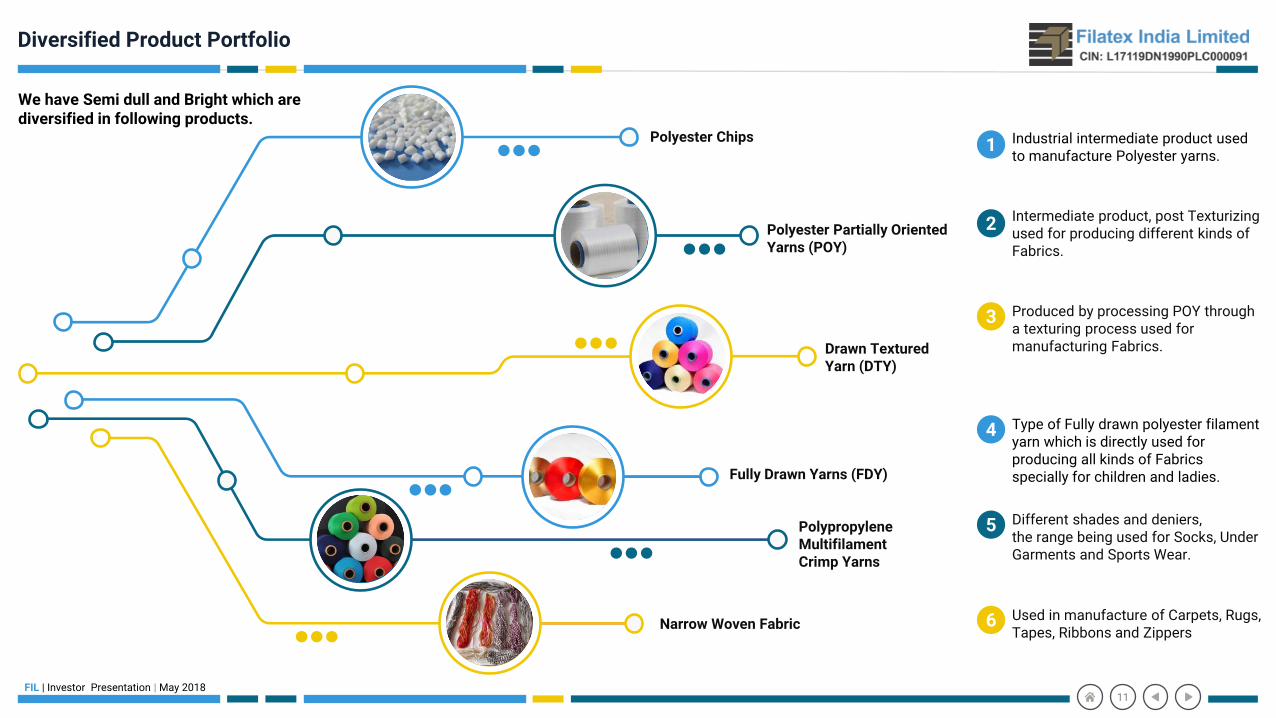
Diversified Product Portfolio
Drawn Textured Yarn (DTY)
Polyester Partially Oriented Yarns (POY)
Polypropylene Multifilament Crimp Yarns
Fully Drawn Yarns (FDY)
Narrow Woven Fabric
Polyester Chips
11
Intermediate product, post Texturizing used for producing different kinds of Fabrics.
2
5 Different shades and deniers,the range being used for Socks, UnderGarments and Sports Wear.
6 Used in manufacture of Carpets, Rugs, Tapes, Ribbons and Zippers
4 Type of Fully drawn polyester filament yarn which is directly used for producing all kinds of Fabrics specially for children and ladies.
Industrial intermediate product used to manufacture Polyester yarns.
1
Produced by processing POY through a texturing process used for manufacturing Fabrics.
3
We have Semi dull and Bright which are diversified in following products.

FIL | Investor Presentation | May 2018
Catering To Diverse End Users
Polyester Filament Yarns are extensively used in apparels – Trousers, Shirts, Suitings & Sarees. PFY is a strong filament that can withstand strong & repetitive movements. Colour Fastness of Polyester Fiber is excellent. Its wear resistant, water resistant, wrinkle resistant and hydrophobic properties make it ideal for all kinds of apparels.
Fully Drawn Yarn of Polyester are being used for Home Furnishings, Fashion Fabrics, Terry Towels, Bed Sheets, Curtains & Carpets. Other growing applications are Upholstery Fabrics. Stain resistance makes it ideal for carpets.
Home Textiles & Furnishings
Sportswear
Apparel
Women Wear & Under Garments
The preferred material for sportswear is Polyester Yarn. Sports leisure clothingsrequire a fabric that’s not only strong & durable but also abrasion resistant. Ease of washing & corrosion resistance make them easy to maintain with longer usage life.
In these garments, seam softness is critical. The Textured Micro Denier have met the expected requirements and are being used in Lingerie, Performance garments - Active wear, Yoga wear, lowshrinkage to ensure no seam distortion after washing & soft feel make these yarns ideal choice.
12
FIL | Investor Presentation | May 2018
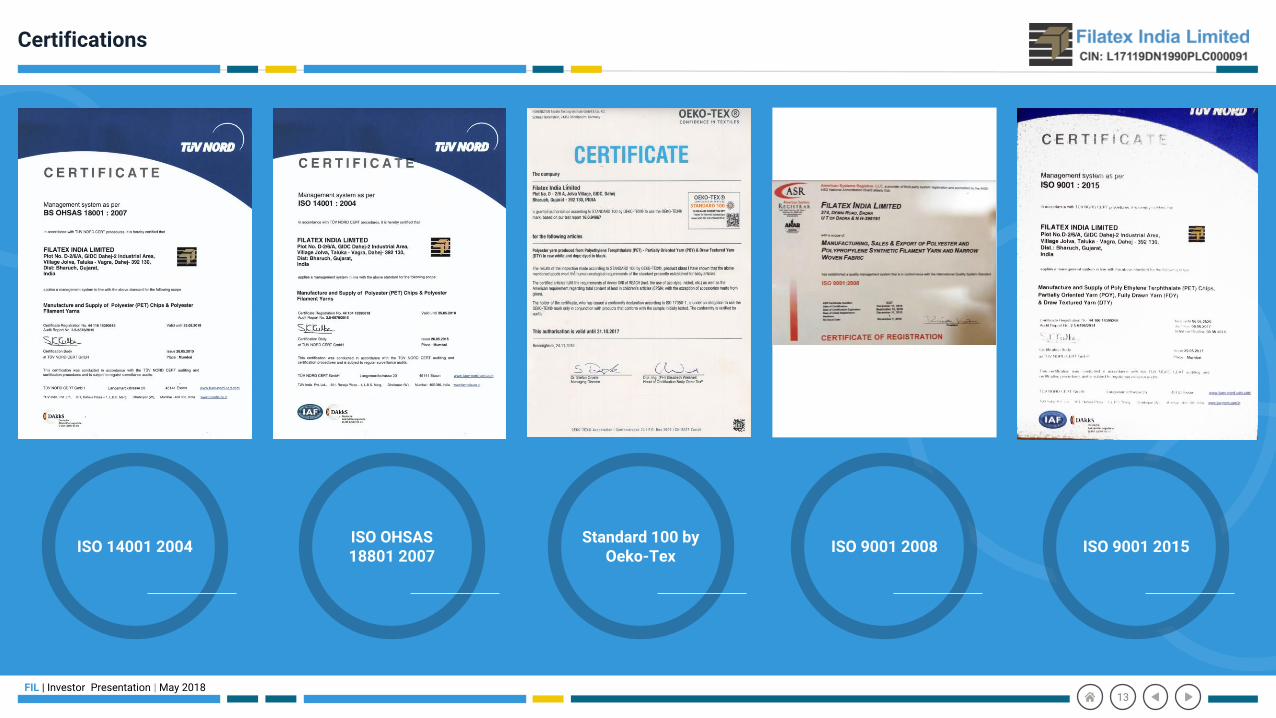
Certifications
ISO 14001 2004ISO OHSAS 18801 2007
Standard 100 by Oeko-Tex
ISO 9001 2008
13
ISO 9001 2015

FIL | Investor Presentation | May 2018
Production Capacities
Net Capacity (Post Expansion Net of Captive)PRODUCTION CAPACITIES - FY 2018-19
Products (MTPA) Production Captive Net %age
Polyester Chips - Semi Dull 64,600 22,900 41,700 12.7%
Polyester Chips - Bright 31,000 13,300 17,700 5.4%
Polyester POY - Semi Dull 123,700 76,000 47,700 14.5%
Polyester POY - Bright 9,000 - 9,000 2.7%
Polyester DTY - Semi Dull 75,900 1,100 74,800 22.8%
Polyprobplyne DTY- Semi Dull 4,800 - 4,800 1.5%
Polyester FDY - Semi Dull 50,300 - 50,300 15.3%
Polyester FDY - Bright 81,200 1,400 79,800 24.3%
Narrow Woven Fabrics 2,500 - 2,500 0.8%
Grand Total 443,000 114,700 328,300 100.0%
13%
5%
15%
3%
23%
1%
15%
24%
1%
Polyester Chips - Semi Dull Polyester Chips - Bright Polyester POY - Semi Dull
Polyester POY - Bright Polyester DTY - Semi Dull Polyprobplyne DTY- Semi Dull
Polyester FDY - Semi Dull Polyester FDY - Bright Narrow Woven Fabrics
14
3,28,300 TPA

Textile Market

FIL | Investor Presentation | May 2018
Textile Industry
Global Textile industry is projected to reach US$ 1600 billion by 2025 from US$ 745 billion in 2017.
Source - IBEF, Textilemates.com, Grand View Research, Inc.
Favorable India
India and China have complete value chain of textile business i.e. from fibre to finished products. Bangladesh and Vietnam have strong garment manufacturing capacity but very limited backward linkages to support the competitiveness.
India is one of the most cost competitive textile manufacturing base for entire value chain of Textiles & Apparels. Labour cost in India is lower than most of the competing countries except Bangladesh, Ethiopia and Kenya. Although power cost is on the higher side but still cheaper than China and Cambodia. Importers look at India as an alternative of China due to quality, its cost competitiveness, better adherence to compliance and political stability. This can be seen as structural changes are in favour of India
GDP
4% Industrial
Production
14%
IIP
14% Country’s total
exports
15%
2nd largest
manufacturing capacity in the
world
Market share of major exporting nations
39%
5%5%4%4%
3%3%
3%
34%
China India Italy
Germany Turkey USA
Bangladesh Vietnam Others
16
The Textile industry in India is projected to reach US$ 250 billion by 2019 from US$ 150 billion in 2017.
Indian Textile Industry Contribution
(Data as on 2017)

FIL | Investor Presentation | May 2018
Global Apparel Industry
355
230165
110
60
46
4530
25 80
2013
o The current Global apparel market is estimated atapproximately US$ 1.15 trillion which forms nearly 1.8%of the world GDP.
o Almost 75% of this market is concentrated in EU-27, USA,China and Japan.
o The next largest markets are Brazil, India, Russia, Canada,and Australia, in descending order with a share ofapproximately 18%.
Global Apparel Market Size (in US$ billion)
Global Apparel Market is expected to grow at 5% where as Indian Apparel Market is expected to grow at 12%.
37 122 163287 300
703 725885 887
1,131
I N D I A C H I N A G L O B A L B R A Z I L R U S S I A E U - 2 7 U S A J A P A N C A N A D A A U S T R A L I A
Per Capita Spend on Apparel (in US$)o The lowest per capita spending is on apparel among
these markets is of India (US$ 37).
o Australian per capita spending on apparel is highest onewith US$1131.If we compare, then Indian people spendonly 4% compared with Australian per capita spend onapparel.
CAGR: ~5%
EU-27 USA China Japan Brazil India Russia Canada Australia Rest of the world
440
285
540
150
100
200
105
5045
195
2025
17
Source - IBEF, Textilemates.com, Grand View Research, Inc.

Growth Drivers

FIL | Investor Presentation | May 2018
Growth drivers (1/2)
o India’s per capita disposable income increased from ₹ 73,476 in fiscal 2012 to ₹ 107,817 in Fiscal 2016 (base year Fiscal 2012, at current prices, inclusive of other current transfers (net) from rest of the world).
o Increased disposable income simulated the demand for value-added products. The demand for premium apparel is likely to increase adding to the ‘feel good’ factor, catalyzing polyester demand.
o According to projections, an estimated 140 million Indians could move to cities by 2020 and 700 million by 2050.
o Besides, the number of cities with population above one million could nearly double with increase in the number of mega-cities (above five million) to 10 by 2021 and 36 by 2051.
o Urbanization is expected to result in a growing demand for fashionable products, durable garments and fabric that meet aesthetic requirements.
o The new indirect tax regime is expected to enhance compliance, uniform tax rates and structure with the removal of cascading taxes resulting in lower transaction costs.
o The polyester yarn industry is likely to benefit. Major yarn producers are likely to cater the fabric and garment sector after rationalization of GST.
o Now, Fabric and Garment sector will see a good investment from organized sector.
Increasing Per Capita Income Rapid Urbanization Government Policies
19

FIL | Investor Presentation | May 2018
Growth drivers (2/2)
o Exports to China were only USD 9 billion in FY2015-16, but imports totaled USD 61.7 billion.
o India is probing an inspection and likely to impose an anti-dumping policy that could drive the domestic synthetic yarn sector.
o Anti-dumping duties provide a level playing field to the local industry against cheap imports.
o Capacity built over years has led to low cost of production per unit in India’s textile industry; this has lent a strong competitive advantage to the country’s textile exporters relative to key global peers.
o The sector has also witnessed increasing outsourcing over the years as Indian players moved up the value chain from being mere converters to vendor partners of global retail giants.
o Textile exports witnessed a growth (CAGR) of 6.89 per cent over the period of FY06 to FY17. In the coming decades, Africa and Latin America could very well turn out to be key markets for Indian textiles.
o India’s home textile industry is expected to expand at a CAGR of 8.3 per cent during 2014–21 to US$ 8.2 billion in 2021 from US$ 4.7 billion in 2014.
o India accounts for 7 per cent of global home textiles trade. Superior quality makes companies in India a leader in the US and the UK, contributing two-third to their exports.
o The growth in the home textiles would be supported by growing household income, increasing population and growth of end use sectors like housing, hospitality, healthcare, etc.
Anti-dumping Increasing Exports Home Textile Industry
20

Results Summary

FIL | Investor Presentation | May 2018
Result Summary – Q4FY18
448.75
578.93
Q 4 F Y 1 7 Q 4 F Y 1 8
REVENUE (Net Of Excise Duty)
37.79
46.55
Q 4 F Y 1 7 Q 4 F Y 1 8
EBIDTA
13.47
17.46
Q 4 F Y 1 7 Q 4 F Y 1 8
PAT
22
113.26 113.81
Q 4 F Y 1 7 Q 4 F Y 1 8
EXPORTS
41,215
54,517
Q 4 F Y 1 7 Q 4 F Y 1 8
YARN (MTPA)
9,093
10,287
Q 4 F Y 1 7 Q 4 F Y 1 8
CHIPS (MTPA)
(₹ in Crore)On standalone basis

FIL | Investor Presentation | May 2018
Result Summary – FY18
1,551.01
1,928.04
2 0 1 7 2 0 1 8
REVENUE (Net Of Excise Duty)
133.17
156.96
2 0 1 7 2 0 1 8
EBIDTA
40.53
60.05
2 0 1 7 2 0 1 8
PAT
23
300.26
378.87
2 0 1 7 2 0 1 8
EXPORTS
165,344
187,863
2 0 1 7 2 0 1 8
YARN (MTPA)
29,368
33,559
2 0 1 7 2 0 1 8
CHIPS (MTPA)
(₹ in Crore)On consolidated basis

FIL | Investor Presentation | May 2018
Production Split by Volume
35%
24%
25%
2%
13%1%
FY17
Polyester POY Fully Drawn Yarn Drawn Textured Yarn
Polypropylene Yarn Polyester Chips Other
1,89,945 MT
15%
1%
23%
0%
32%
1%1%
18%
8% 1%
0%
FY18
Polyester Chips - Semi Dull Polyester Chips - Bright Polyester POY - Semi Dull
Polyester POY - Bright Polyester DTY - Semi Dull Polypropylene POY- Semi Dull
Polypropylene DTY Polyester FDY - Semi Dull Polyester FDY - Bright
Narrow Woven Fabrics Monofilament Yarns
2,21,422 MT
24

FIL | Investor Presentation | May 2018
Profit & Loss – Q4FY18 & FY18
ParticularsQ4FY18Aaudited
Q4FY17Audited
Y-o-Y (%)FY18
AuditedFY17
AuditedY-o-Y (%)
Net Income from Operations 578.93 448.75 29.01% 1928.04 1551.01 24.30%
Expenses 532.38 410.96 29.55% 1771.04 1417.81 24.91%
Profit from Operations before Other Income, Finance Costs and Exceptional Item
46.55 37.79 23.18% 157 133.2 17.87%
Other Income 1.94 3.81 -49.08% 10.64 12.15 -12.43%
Profit from ordinary activities before Finance Costs,Depreciation and Exceptional Item
48.49 41.6 16.56% 167.64 145.35 15.34%
Depreciation 8.34 7.61 9.59% 30.82 28.97 6.39%
Finance costs 12.14 12.77 -4.93% 44.1 58.64 -24.80%
Profit from ordinary activities before exceptional item and tax 28.01 21.22 32.00% 92.72 57.74 60.58%
Exceptional item - 3.44 - - 3.44 -
Profit from ordinary activities before tax 28.01 17.78 57.54% 92.72 54.3 70.76%
Tax 10.55 4.31 144.78% 32.94 13.74 139.74%
Net Profit for the period 17.46 13.47 29.62% 59.78 40.56 47.39%
Other Comprehensive Income/(Loss)
Items not to be reclassified to profit or loss 0.47 0.29 0.48 0.01
Income tax relating to items not to be reclassified to profit or loss -0.16 -0.1 -0.17 -0.01
Total Comprehensive Income for the Period (Comprising Profit/(Loss) and other comprehensive Income for the period
17.77 13.66 30.09% 60.09 40.56 48.15%
(₹ in Crore)
25
On standalone basis
Financial Overview
FIL | Investor Presentation | May 2018
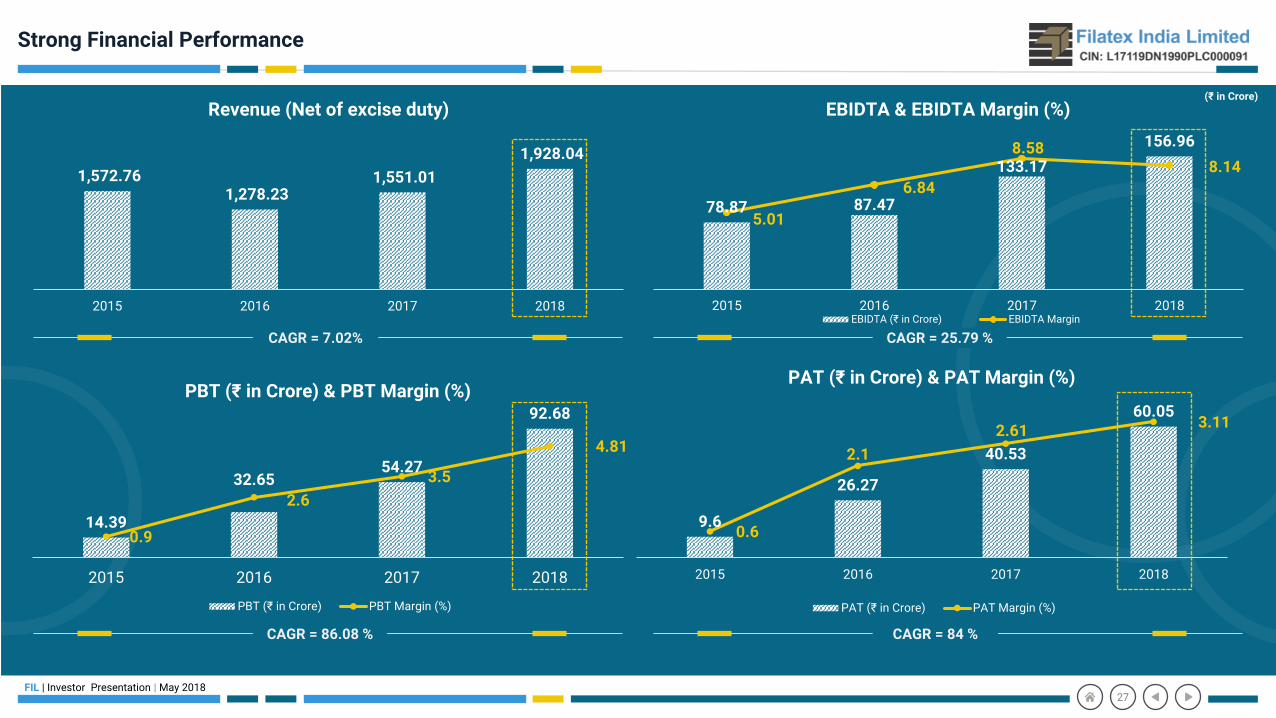
Strong Financial Performance
78.87 87.47
133.17
156.96
5.01
6.84
8.588.14
0
1
2
3
4
5
6
7
8
9
10
0
20
40
60
80
100
120
140
160
180
2015 2016 2017 2018
EBIDTA & EBIDTA Margin (%)
EBIDTA (₹ in Crore) EBIDTA Margin
1,572.76 1,278.23
1,551.01
1,928.04
2015 2016 2017 2018
Revenue (Net of excise duty)
14.39
32.6554.27
92.68
0.9
2.6
3.5
4.81
0
1
2
3
4
5
6
0
10
20
30
40
50
60
70
80
90
100
2015 2016 2017 2018
PBT (₹ in Crore) & PBT Margin (%)
PBT (₹ in Crore) PBT Margin (%)
9.6
26.27
40.53
60.05
0.6
2.1
2.613.11
0
0.5
1
1.5
2
2.5
3
3.5
0
10
20
30
40
50
60
70
2015 2016 2017 2018
PAT (₹ in Crore) & PAT Margin (%)
PAT (₹ in Crore) PAT Margin (%)
CAGR = 7.02% CAGR = 25.79 %
CAGR = 86.08 % CAGR = 84 %
(₹ in Crore)
27

FIL | Investor Presentation | May 2018
Strong Financial Performance
46.43
75.53
103.61
120.71
2015 2016 2017 2018
Net Working Capital
244.03
308.68
412.62
465.50
2015 2016 2017 2018
Net Worth
0.77 0.820.74
0.58
2015 2016 2017 2018
Debt to Equity (X)
Note: Unsecured loans from Promoter's associates are taken as quasi equity
(₹ in Crore)
28
6.77
14.4915.53
16.82
11.39
11.5512.86
15.73
0.00
2.00
4.00
6.00
8.00
10.00
12.00
14.00
16.00
18.00
2015 2016 2017 2018
ROE (%) & ROCE (%)
ROE (%) ROCE (%)
(Note: Current liabilities excluding current maturity of long term loans & capital creditors and Current assets including assets held for sales)
(Note:ROE: Shareholders equity excluding reserves created for specific purpose.ROCE: Including short term borrowings)
(Note: Including unsecured loans taken as quasi equity)
FIL | Investor Presentation | May 2018
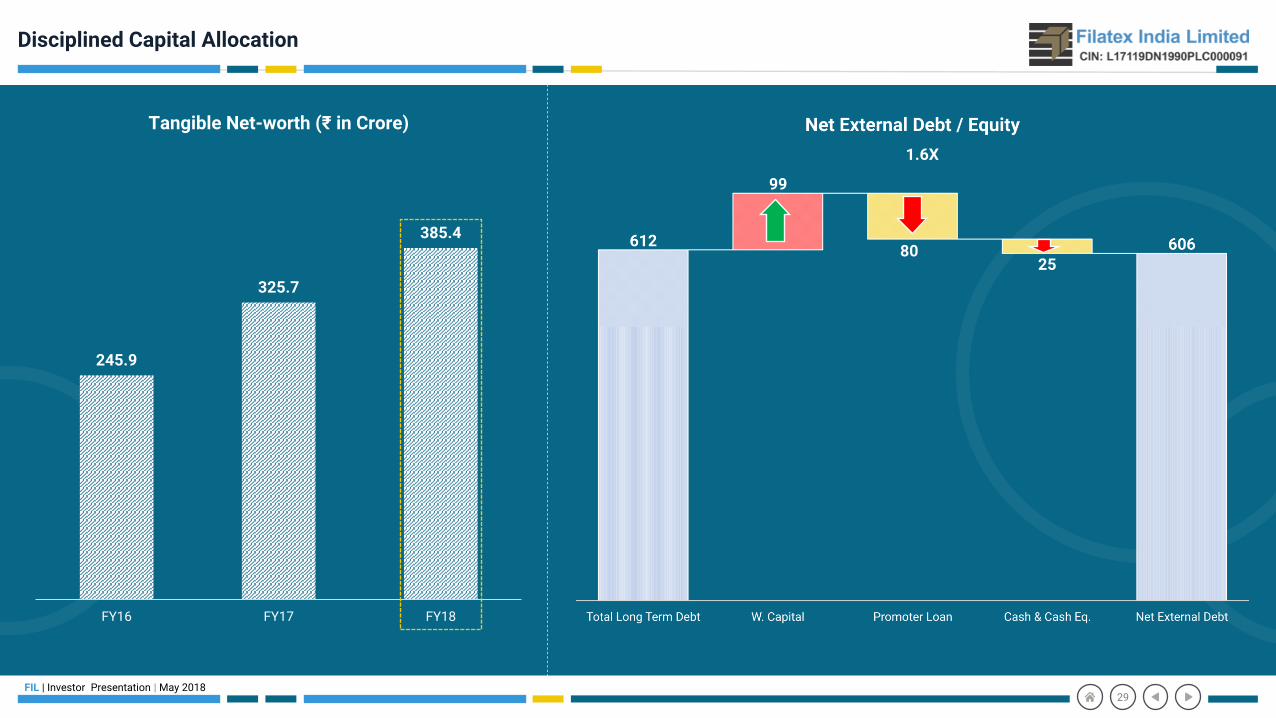
Disciplined Capital Allocation
245.9
325.7
385.4
FY16 FY17 FY18
Tangible Net-worth (₹ in Crore)
29
8025
1.6X
FIL | Investor Presentation | May 2018
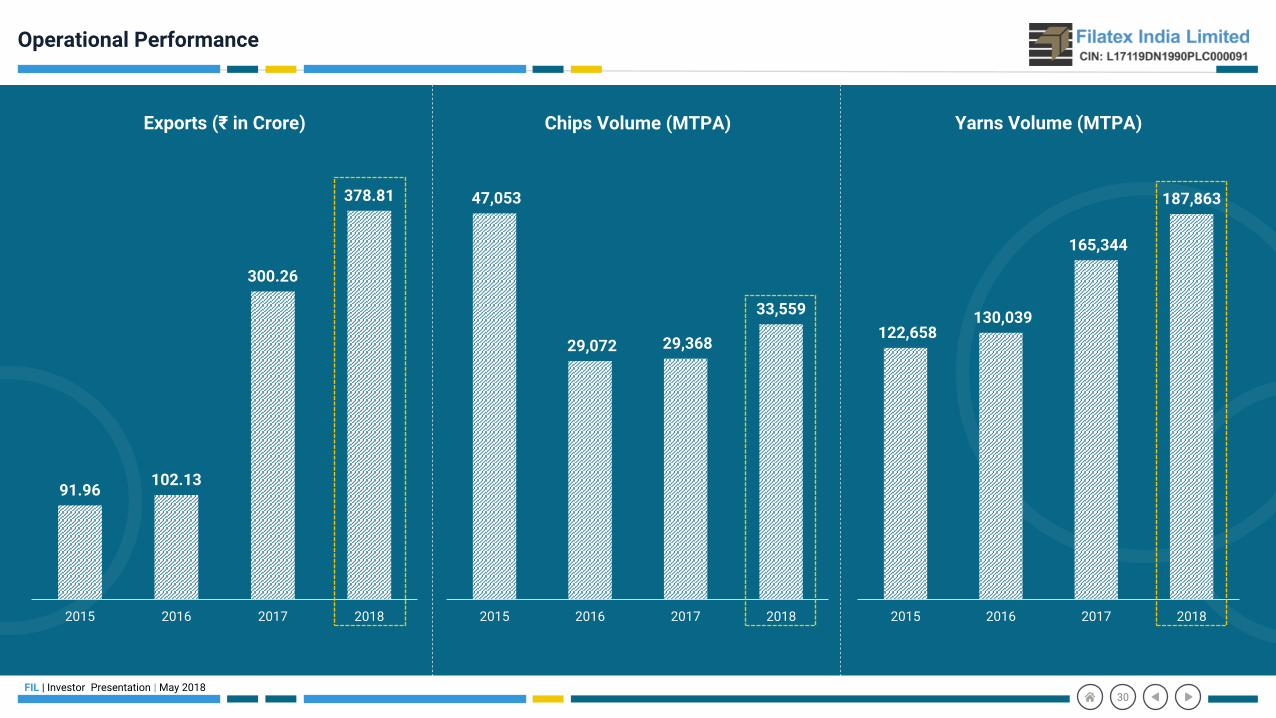
Operational Performance
91.96102.13
300.26
378.81
2015 2016 2017 2018
Exports (₹ in Crore)
47,053
29,072 29,368
33,559
2015 2016 2017 2018
Chips Volume (MTPA)
122,658 130,039
165,344
187,863
2015 2016 2017 2018
Yarns Volume (MTPA)
30

FIL | Investor Presentation | May 2018
Balance Sheet (1/2)
Particulars 2015 2016 2017 2018
Equity & Liabilities
Shareholders' Fund
Share Capital 32.00 32.00 43.50 43.5
Other Equity-Reserves & Surplus 138.33 164.55 281.52 341.87
Money received against share warrants 12.94
Total Shareholders Fund 170.33 209.48 325.02 385.37
Non - Current Liabilities
Long term borrowings 145.43 208.38 248.75 461.47
Unsecured borrowings/ Quasi equity 73.30 99.19 87.60 80.13
Deferred tax liability (Net) 16.69 23.07 27.76 41.18
Other Long term liabilities 3.31 5.31 16.40 26.89
Long term provisions 3.69 4.68 5.64 5.16
Total Non Current Liabilities 242.82 340.63 386.15 614.83
Current Liabilities
Short term borrowings 157.63 137.81 143.51 98.53
Trade Payables 83.66 120.38 111.29 224.06
Other current liabilities 18.59 26.44 36.25 38.18
Current maturity of long term loans 42.68 45.06 55.42 70.66
Short term provisions 0.77 0.97 1.28 2.31
Current Tax Liabilities 1.12
Total Current Liabilities 303.33 330.68 347.75 434.86
Liabilities directly associated with assets classified as held for sale 0.40 2.4
Total 716.48 880.79 1059.32 1437.46
(₹ in Crore)
31
On consolidated basis

FIL | Investor Presentation | May 2018
Balance Sheet (2/2)
Particulars 2015 2016 2017 2018
ASSETS
Non - Current Assets
Fixed Assets
Tangible assets 388.21 492.31 628.38 944.46
Intangible assets 0.08 0.05 0.15 0.42
Capital work in progress 2.36 18.02 5.73 6.41
Non-current Investments 0.00 0.01 0.01 0
Long term loans and advances 17.93 14.02 0.75 0.7
Other non-current assets 0.84 1.02 30.82 10.03
Total Non Current Assets 409.40 525.44 665.84 962.02
Current Assets
Inventories 118.52 98.57 149.14 193.7
Trade receivables 149.10 216.36 199.45 170.53
Cash & bank balances 15.44 12.54 14.86 25.55
Short term loans & advances 12.21 21.12 0.47 0.6
Other current assets 11.81 6.77 22.63 71.66
Total Current Assets 307.07 355.35 386.55 462.04
Asset Classiffied as held for sale 6.93 13.4
Total 716.48 880.79 1059.32 1437.46
(₹ in Crore)
32
On consolidated basis

FIL | Investor Presentation | May 2018
Profit & Loss
Particulars 2015 2016 2017 2018
Revenue from operations (gross) 1,730.59 1,418.80 1,709.68 1,974.90
Less : Excise duty 157.83 140.57 158.67 46.86
Revenue from operations (net) 1,572.76 1,278.23 1,551.01 1,928.04
Other Income 9.70 10.67 12.15 10.64
Total Revenue 1,582.46 1,288.90 1,563.16 1,938.68
Expenses
Cost of material consumed 1,093.56 966.71 1,232.67 1,529.85
Purchases of traded goods 263.87 83.82 38.04 34.80
(Increase)/decrease in Inventories of finished goods work in progress & stock in trade -7.43 1.22 -45.41 -13.51
Employee benefits expense 35.39 40.01 46.97 48.75
Finance cost 53.60 51.19 58.64 44.10
Depreciation & amortization expense 20.57 21.27 28.97 30.82
Other Expenses 108.50 99.06 145.57 171.19
Total Expenses 1,568.06 1,263.27 1,505.45 1,846.00
Profit/(loss) before exceptional items & tax - 14.39 25.63 57.71
Exceptional Items [Profit/(Loss)] - 6.97 -3.44 -
Profit/(loss) before tax 14.39 32.60 54.27 92.68
Tax Expense:
Current tax (MAT) 3.01 6.96 11.78 19.68
MAT credit entitlement -3.01 -6.96 - -
Taxation for earlier years 0.02 - - -
Deferred tax 4.78 6.38 1.96 13.26
Total tax expense 4.80 6.38 13.74 32.94
Net profit/(loss) after tax 9.60 26.22 40.53 59.74
Other Comprehensive Income/(Loss)
Items not to be reclassified to profit or loss - - 0.01 0.48
Income tax relating to items not to be reclassified to profit or loss - - -0.01 -0.17
Comprehensive Profit/(Loss) for the Period 9.60 26.22 40.53 60.05
Earnings Per Share (EPS) in Rupees
-Basic 3.12 8.19 10.20 13.73
-Diluted 3.12 8.06 9.29 13.52
(₹ in Crore)
33
On consolidated basis

FIL | Investor Presentation | May 2018
Shareholder Information
Market Capitalization (₹) 952 Cr.
Shares Outstanding 4.35 Cr.
Free Float 1.26 Cr.
Symbol (NSE/ BSE) FILATEX / 526227
Average Daily Volume (3 months) 1,96,054
Stock Data (As on 07th May 2018)
34
57.99%
36.84%
5.17%Shareholding Pattern
Promoters
Non-Institution
DomesticInstitutionalInvestors
(As on 31st march 2018)
Source: BSE , Thomson Reuters Filatex India Limited Sensex
Base = 100
Filatex India Limited
BHAGERIA HOUSE, 43 Community Centre,New Friends Colony, New Delhi – 110025Ph: +91-11-26312503Fax: +91-11-26849915Email: [email protected]: L17119DN1990PLC000091
Thank You
S-ANCIAL TECHNOLOGIES PVT. LTDRonak [email protected]
215, Shivshakti Industrial Estate, J. R. Boricha Marg,Lower Parel (E), Mumbai – 400011, Tel: 022 6536 1001
Investor Relations Advisors: