Figure ES-1. Difficulty Getting Care on Nights, Weekends, Holidays Without Going to ER Percent...
23
Figure ES-1. Difficulty Getting Care on Nights, Weekends, Holidays Without Going to ER Percent saying “very” or “somewhat difficult” 53 60 32 42 70 56 59 32 44 60 0 25 50 75 100 Australia Canada N ew Zealand U nited K ingdom U nited States Below average incom e Above average incom e * Significant difference between below and above average income groups within country at p<.05. Source: Commonwealth Fund 2004 International Health Policy Survey. *
-
Upload
seth-garza -
Category
Documents
-
view
214 -
download
0
Transcript of Figure ES-1. Difficulty Getting Care on Nights, Weekends, Holidays Without Going to ER Percent...
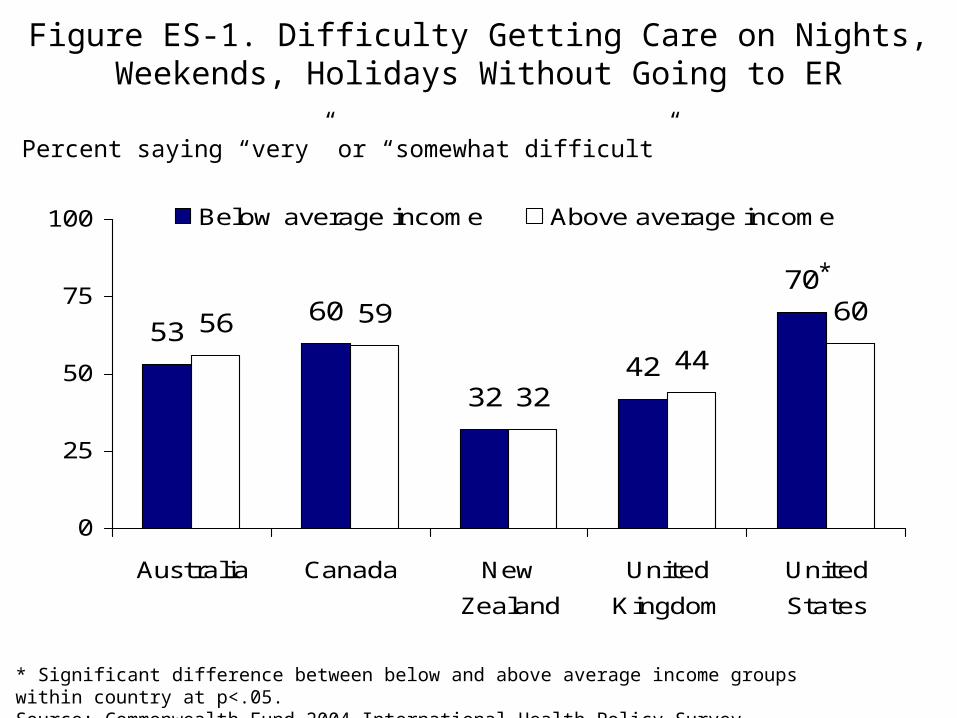
Figure ES-1. Difficulty Getting Care on Nights, Weekends, Holidays Without Going to ER
Percent saying “very” or “somewhat difficult”
5360
3242
70
56 59
3244
60
0
25
50
75
100
Australia Canada New
Zealand
United
Kingdom
United
States
Below average income Above average income
* Significant difference between below and above average income groups within country at p<.05.Source: Commonwealth Fund 2004 International Health Policy Survey.
*

Figure ES-2. Under 65: Lab Test Errors—Comparisons with U.S. Insured and Uninsured
9 12 159
16 13
27
0
25
50
75
AUS CAN NZ UK Total Insured Uninsured
Percent given wrong result or delay in receiving abnormal test result
United States
Base: Under 65 who have had lab tests in past two years
* *
*
* Significantly different from U.S. insured at p<.05.Uninsured = uninsured at time of survey or any time during the year.Source: Commonwealth Fund 2004 International Health Policy Survey.

Figure 1. Insurance and Cost-Sharing Policiesin Four Countries with Universal Public Coverage
AUS CAN NZ UK
Private insurancefor services covered by public
Permitted only for hospital services
Prohibited for core services in most
provincesPermitted Permitted
Percent with private coverage
49%
79.9%
(to cover benefits excluded from ‘free-of charge’
public plan)
33% 12%
Public Plan Patient Cost-Sharing
Variable depending on
service type and provider
None for core services
Copayments for many services
None for basic services (except Rx and optical)
Prescription Drugs Covered
Publicly covered for social
assistance beneficiaries and in most provinces for
seniors
Covered Covered
Source: B. K. Frogner and G. F. Anderson, Multinational Comparisons of Health Systems Data, 2005(New York: The Commonwealth Fund, Apr. 2006).

Figure 2. Private Insurance in Four Countrieswith Universal Coverage
3036
1911
63
81
57
35
0
25
50
75
100
Australia Canada New Zealand United
Kingdom
Below average income Above average income
Percent who have private insurance in addition to public
**
*
* Significant difference between below and above average income groups within country at p<.05.Source: Commonwealth Fund 2004 International Health Policy Survey.
*

Figure 3. Insurance Profile of U.S. Adults by Income
12
40
88
58
0 25 50 75 100
Above
average
income
Below
average
income
Uninsured Insured all year
* *
Uninsured = uninsured at time of survey or any time during the year.Below average income numbers do not add up to 100% because of not sure/decline to answer.* Significant difference between below and above average income groups within country at p<.05.Source: Commonwealth Fund 2004 International Health Policy Survey.

Figure 4. Spent More than US$1,000 Out-of-Pocketfor Medical Care in Past Year, by Income
8 104 2
2421
126 5
32
0
25
50
75
Australia Canada New
Zealand
United
Kingdom
United
States
Below average income Above average income
**
*
Percent
* Significant difference between below and above average income groups within country at p<.05.Source: Commonwealth Fund 2004 International Health Policy Survey.

Figure 5. Health Status by Income
Percent: AUS CAN NZ UK US
Fair/Poor Health:
Below Average 22* 19* 22* 24* 30*
Above Average 7 7 6 8 6
Any of 6 Chronic Illnesses:^
Below Average 63* 58* 62* 64* 62*
Above Average 41 42 40 39 42
^ Chronic illnesses include: hypertension, heart disease, diabetes, arthritis, lung problems, and depression.* Significant difference between below and above average income groups within country at p<.05.Source: Commonwealth Fund 2004 International Health Policy Survey.

7
25
3
14
24
5
24
3
12 13
0
25
50
75
Australia Canada New
Zealand
United
Kingdom
United
States
Below average income Above average income
Figure 6. Access to Doctor When Sick orNeed Medical Attention, by Income
Percent waited six days or more for appointment when sick
* Significant difference between below and above average income groups within country at p<.05.Source: Commonwealth Fund 2004 International Health Policy Survey
*

12
21
6 6
19
914
6 511
0
25
50
75
Australia Canada New
Zealand
United
Kingdom
United
States
Below average income Above average income
Figure 7. ER Visit for Condition a Primary CareDoctor Could Have Treated if Available, by Income
Percent
Source: Commonwealth Fund 2004 International Health Policy Survey.

Figure 8. Difficulty Getting Care on Nights, Weekends, Holidays Without Going to ER
Percent saying “very” or “somewhat difficult”
5360
3242
70
56 59
3244
60
0
25
50
75
100
Australia Canada New
Zealand
United
Kingdom
United
States
Below average income Above average income
* Significant difference between below and above average income groups within country at p<.05.Source: Commonwealth Fund 2004 International Health Policy Survey.
*

3526
44
12
57
25
6
29
12
24
0
25
50
75
Australia Canada New
Zealand
United
Kingdom
United
States
Below average income Above average income
Figure 9. Cost-Related Access Problems, by Income
Percent reporting any of three access problems because of costs^
^ Access problems include: Had a medical problem but did not visit a doctor; skipped a medical test, treatment, or follow-up recommended by a doctor; or did not fill a prescription because of cost.* Significant difference between below and above average income groups within country at p<.05.Source: Commonwealth Fund 2004 International Health Policy Survey.
*
*
*
*
*

Figure 10. Care Coordination, by Income
26 29 27 26
3628 25 23 24 27
0
25
50
75
Australia Canada New
Zealand
United
Kingdom
United
States
Below average income Above average income
^ Coordination problems include: Test results or medical records not available at time of appointment, received conflicting information from different doctors, or doctor ordered duplicate medical test.* Significant difference between below and above average income groups within country at p<.05.Source: Commonwealth Fund 2004 International Health Policy Survey.
Percent reporting any of three care coordination problems^
Base: Have seen a doctor in past two years
*

Figure 11. Did Not Receive Test Resultsor Results Not Clearly Explained, by Income
1928
23 23 25
11
3024
20 17
0
25
50
75
Australia Canada New
Zealand
United
Kingdom
United
States
Below average income Above average income
* Significant difference between below and above average income groups within country at p<.05.Source: Commonwealth Fund 2004 International Health Policy Survey.
Base: Adults with test in past two yearsPercent
**

Figure 12. Percent of Patients Whose DoctorHas Not Reviewed All Medications, by Income
27 25 2838
2935
2332 35
21
0
25
50
75
Australia Canada New
Zealand
United
Kingdom
United
States
Below average income Above average income
Source: Commonwealth Fund 2004 International Health Policy Survey.
Base: Adults taking prescriptions regularly
Percent
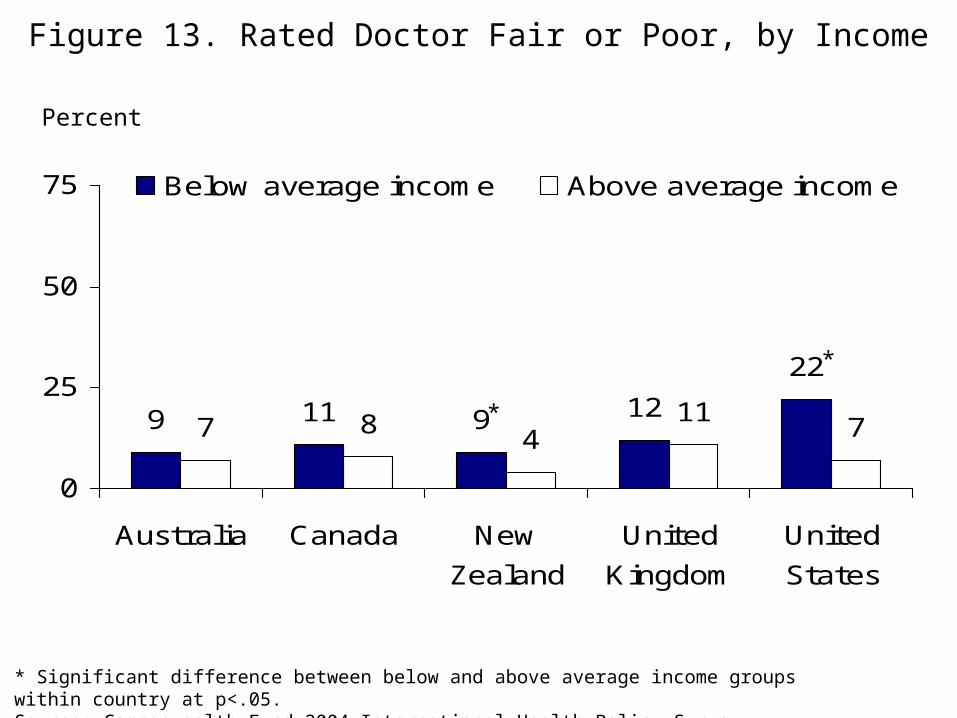
9 11 9 12
22
7 84
117
0
25
50
75
Australia Canada New
Zealand
United
Kingdom
United
States
Below average income Above average income
Percent
* Significant difference between below and above average income groups within country at p<.05.Source: Commonwealth Fund 2004 International Health Policy Survey.
Figure 13. Rated Doctor Fair or Poor, by Income
*
*

Figure 14. Had Blood Pressure Check in Past Year,by Income
85
72777983
91
6170
8279
0
25
50
75
100
Australia Canada New
Zealand
United
Kingdom
United
States
Below average income Above average incomePercent
**
*
* Significant difference between below and above average income groups within country at p<.05.Source: Commonwealth Fund 2004 International Health Policy Survey.

Figure 15. Had Pap Test in Past Three Years,by Income
8673716975
84 84 84 8293
0
25
50
75
100
Australia Canada New
Zealand
United
Kingdom
United
States
Below average income Above average income
Base: Women ages 25–64
* Significant difference between below and above average income groups within country at p<.05.Source: Commonwealth Fund 2004 International Health Policy Survey
Percent
* * * **

Figure 16. Under 65: ER Use—Comparisons with U.S. Insured and Uninsured
29
39
2630
3427
46
0
25
50
75
AUS CAN NZ UK Total Insured Uninsured
Percent under 65 with ER visit in past two years
United States
* Significantly different from U.S. insured at p<.05.Uninsured = uninsured at time of survey or any time during the year.Source: Commonwealth Fund 2004 International Health Policy Survey.
**

Figure 17. Under 65: Coordination Problem— Comparisons with U.S. Insured and Uninsured
3026 26 26
3328
44
0
25
50
75
AUS CAN NZ UK Total Insured Uninsured
Percent under 65 with at least one of three coordination problems^
United States
^ Coordination problems include: Test results or medical records not available at time of appointment, received conflicting information from different doctors, or doctor ordered duplicate medical test.* Significantly different from U.S. insured at p<.05.Uninsured = uninsured at time of survey or any time during the year.Source: Commonwealth Fund 2004 International Health Policy Survey.
*

Figure 18. Under 65: Lab Test Errors—Comparisons with U.S. Insured and Uninsured
9 12 159
16 13
27
0
25
50
75
AUS CAN NZ UK Total Insured Uninsured
Percent given wrong result or delay in receiving abnormal test result
United States
Base: Under 65 who have had lab tests in past two years
* *
*
* Significantly different from U.S. insured at p<.05.Uninsured = uninsured at time of survey or any time during the year.Source: Commonwealth Fund 2004 International Health Policy Survey.

Figure 19. Health Care Experiences by Incomeand Insurance: U.S. Adults Ages 19–64
27
27
23
76
6
10
8
22
14
15
7
44
0 25 50 75 100
Uninsured
Insured: Below average income
Insured: Above average income
* Significantly different from insured below average income group at p<.05.Uninsured = uninsured at time of survey or any time during the year.Source: Commonwealth Fund 2004 International Health Policy Survey.
Rated doctorfair/poor
Lab error
Access problembecause of cost
Duplicationof tests
*
*
*
*
*
*

General access
(4)
Access becauseof cost
(4)Coordination
(9)
Doctor–Patient
(8)Prevention
(5)Total(30)
AUS 0 0 0 0 1 1
CAN 2 0 3 0 1 6
NZ 0 0 1 1 0 2
UK 0 0 2 1 3 6
US 2 4 3 7 0 16
Source: Commonwealth Fund 2004 International Health Policy Survey.
Figure 20. Ranking of Below Average Income Adults’ Experiences by Country
Number of Measures Where Below Average Income Adults’ Experiences in Country Was the Worst Compared with
Below Average Income Adults in the Other Four Countries

* Inequity counted when significant difference between income groupswhere p .05 and gap of >5%; for U.S. p<.05 and gap>5%, or gap>5%.
Generalaccess
(4)
Accessbecauseof cost
(4)Coordination
(9)
Doctor–Patient
(8)Prevention
(5)Total(30)
AUS 0 3 1 0 0 4
CAN 0 4 1 0 0 5
NZ 0 4 1 3 0 8
UK 0 1 0 0 0 1
US 3 4 5 7 2 21
Source: Commonwealth Fund 2004 International Health Policy Survey.
Figure 21. Inequity Summary:Number of Measures Where Below Average Income Adults
Have More Negative Experiences