FIGURE 6 - wiredspace.wits.ac.za
32
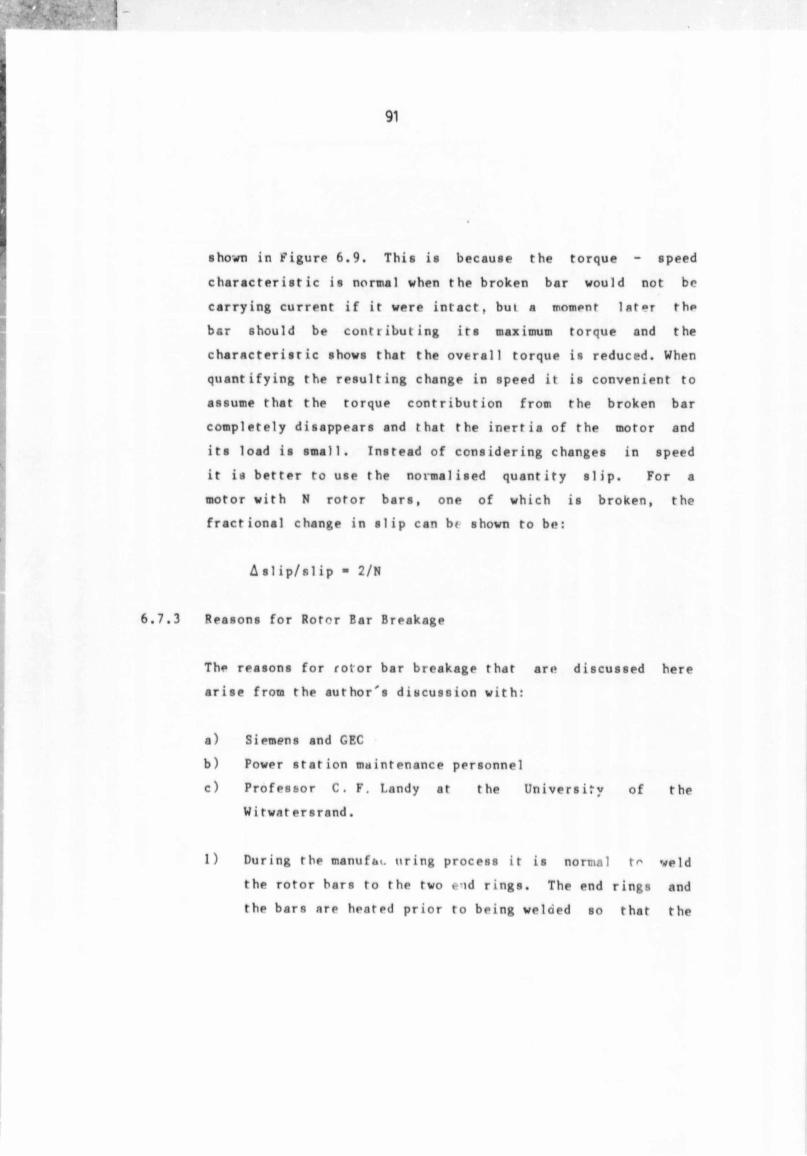
FIGURE 6.7
Transcript of FIGURE 6 - wiredspace.wits.ac.za

FIGURE 6.7

89
6.7.2 Theory
6.7.2.1 Vibration
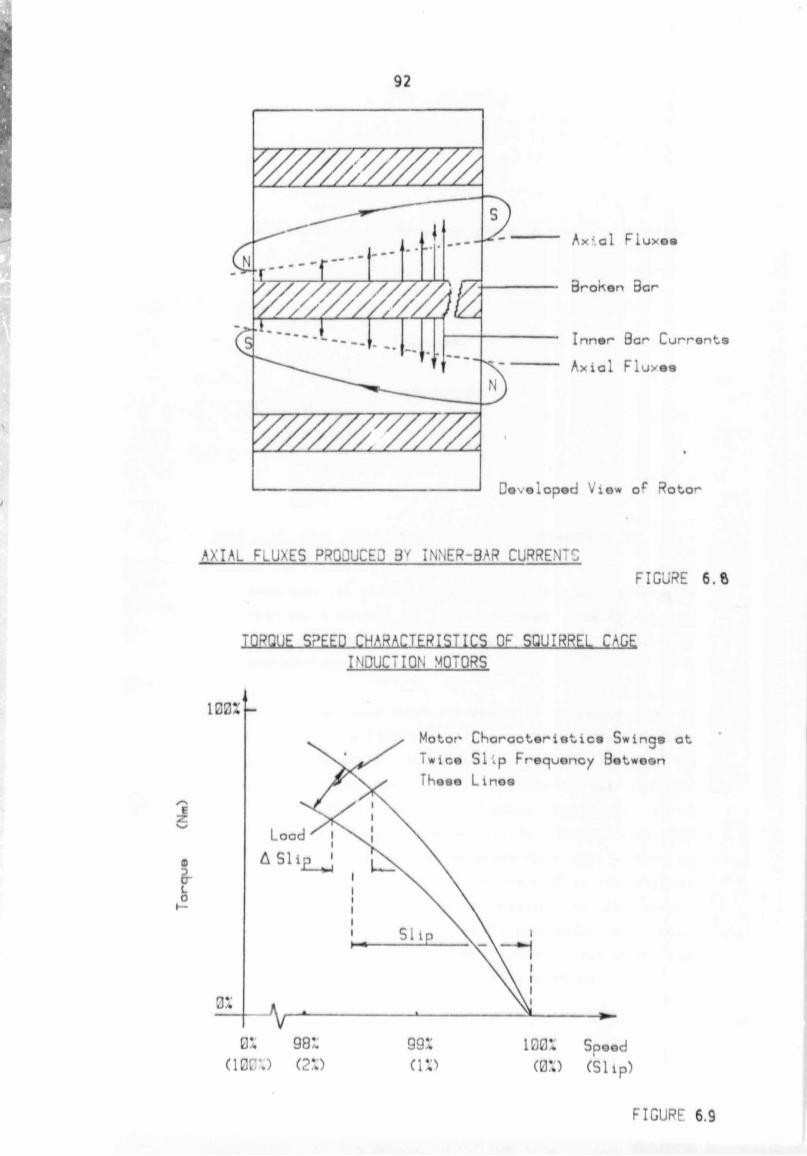
A very common fault with squirrel cage induction motors is
that of broken bars near one end ring. When this occurs
substantial inter-bar currents may exist between the broken
bar and adjacent bars. The current is more concentrated at
the end where the bar is broken. The inter-box currents flow
tangentially from the broken bar to the adjacent bars and
consequently they establish axial fluxes as shown in
Figure 6.8. This gives rise to four axial poles which are
not symmetrically located around the circumference. Due to
the inevitable changes in the permeability that theso four
poles will encounter with each revolution of the rotor, a
four times running speed vibration component is produced with
a large modulation at twice slip frequency. The slip
frequency is defined as the difference between line
synchronous frequency and motor speed. Landy (33).
This four timeB running speed vibration component will be
totally current dependent. This means thnt if a broken bar
exists, then the 4 x RPM axial vibration of the motor must
increase with load due to the associated increase in the
rotot currents.
6.7.2.2 Current (Hargis et al (34))
It may be shown that if a contiguous group of bars subtending
electrical angle is open circuit, and the machine apced
remains constant,, the ratio of the magnitude of this
component to current to that of supply current is given
approximately by:

90
Sin (*.)/2p(2tt -«.)
- 2 irnp/N
p ■ number of pole pair*
N ■ number of si of 8
n " number of broken contiguous bars
n « N
This cyclic variation in current produces a torque variation
at twice slip frequency. This results in a sp*ed variation
dependent upon the system inertia, which is generally not
negligible. Consequently there is a reduction in the
magnitude of the current component at w(l-2s) and a component
appears at w(l+2s), enhanced by modulation of the third
time-harmonic flux in the stator, Where s represents slip.
The stator current inherently reflects the overall condition
of the rotor, and is not capable of providing information on
the configuration of non-contiguout broken bars.
Present slip is defined as (wf - w r )/wj x 100
where wf ■ *ynchronoua speed of the rotating field.
w r m speed of the rotor.
For a typical induction motor the value of slip at full load
is about 2Z - 61. The small X slip present manifests itself
as sidebands around the 1 times and 2 times RPM components.
6.7.2.3 Speed (hargis (34))
The torque speed relationship for a motor with a broken bar
oscillates at twice slip frequency between the two limits
R8
where
91
shown in figure 6.9. This is because the torque - speed
characteristic is normal when the broken bar would not be
carrying current if it were intact, but a moment 1at*»r the
bar should be contributing its maximum torque and the
characteristic shows that the overall torque is reduced. When
quantifying the resulting change in speed it is convenient to
assume that the torque contribution from the broken bar
completely disappears and that the inertia of the motor and
its load is small. Instead of considering changes in speed
it is better to use the normalised quantity slip. For a
motor with N rotor bars, one of which is broken, the
fractional change in slip can bt shown to be:
A si ip/si ip ■ 2/N
6.7.3 Reasons for Rotor Ear Breakage
The reasons for rotor bar breakage that are discussed here
arise from the author's discussion with:
a) Siemens and GEC
b) Power station maintenance personnel
c) Professor C. F, Landy at the University of the
W i twnt ersrand.
1) During the manufa<. uring process it is normal t* veld
the rotor bars to the two e-jd rings. The end rings and
the bars are heated prior to being welded so that the
92
AXIAL FLUXES PRODUCED 3Y INNER-BAR CURRENTS
FIGURE 6. ft
JQRQUE SPEED CHARACTERISTICS OF SQUIRREL CAGE
INDUCTION MOTORS
(10C*.) (2%) (IP (0**) (Slip)
FIGURE 6.9
93
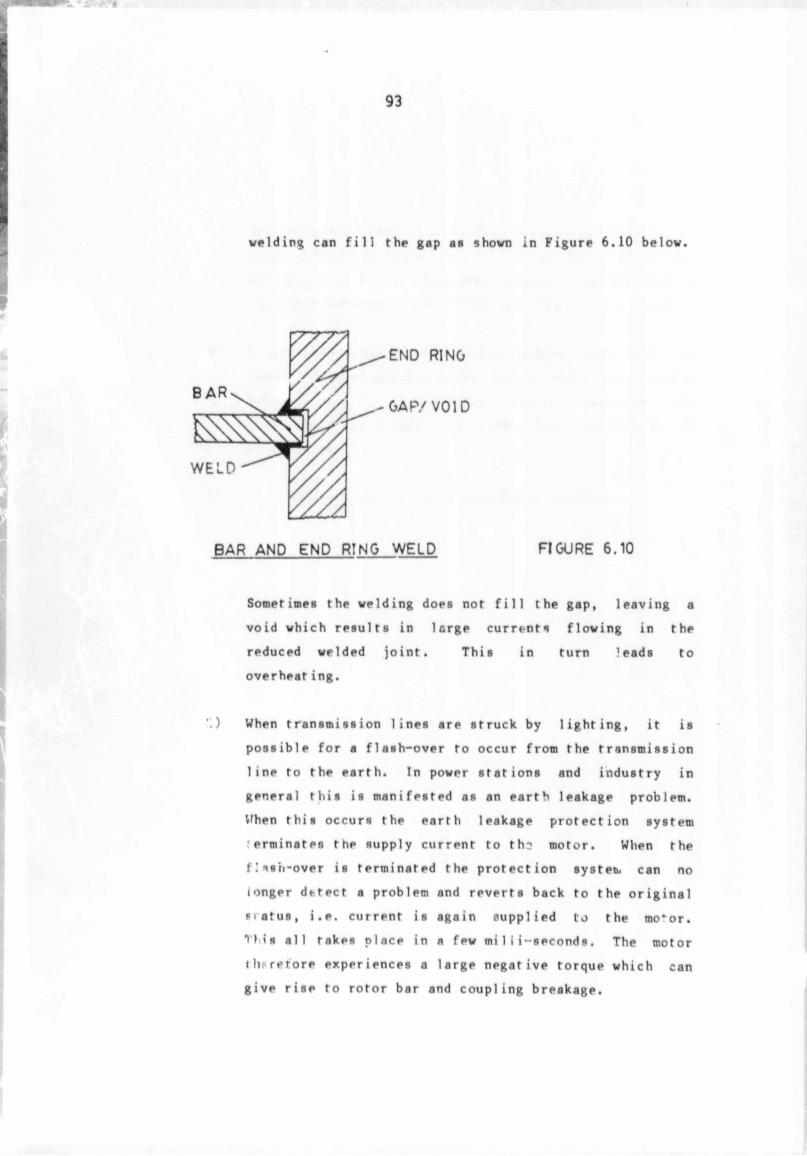
welding can fill the gap as shown in Figure 6.10 below.
END RING
G A P /V O ID
BAR AND END RING WELD FIGURE 6.10
Sometimes the welding does not fill the gap, leaving a
void which results in large currents flowing in the
reduced welded joint. This in turn leads to
overheat ing.
'.) When transmission lines are struck by lighting, it is
possible for a flash-over to occur from the transmission
line to the earth. In power stations and industry in
general this is manifested as an earth leakage problem.
When this occurs the earth leakage protection system
erminates the supply current to th? motor. When the
fl^s'h-over is terminated the protection system can no
longer d*-tect a problem and reverts back to the original
hiatus, i.e. current is again supplied to the mo‘or.
T M s all takes place in n few mi 1 1 i-seconds. The motor
therefore experiences a large negative torque which can
give rise to rotor bar and coupling breakage.

94
3) Switching the motor on and off repeatedly, results in
large induced currents in the rotor bars which are
dissipated as heat. This heat induces large stresses in
the rotor between the end rinRS and the cooling rings.
4) Flashes can occur between rotor copper bars and the
laminated steel plates. Weak spots are then created
between the bar end plate which decreases the
cross-sectional area of the bar resulting in
overheat ing.
5) In some cases rotors are simply badly designed.

95
6.8 VIBRATION MONITORING CRITERIA FOR EARLY DETECTION OF TURBINE
ROTCR CRACKS
6.8.1 Introduction
Turbo-generator shaft cracking is a serious problem of
concern to turbo-generator manufacturers and power supply
utilities. In spite of steadily improved materials and
methods of stress analysis, new incidents of cracked rotors
still occur throughout the world. Several examples include
I.P. rotor shafts in the 500 MW Lurbines at Ferrybridge "C"
Power Station during the period May 19/2 to March 1974, the
T.P. rotor coupling in the 650 MW turbine at Cumberland Steam
Plant in September 1976 and the Tennessee Valley Authority
Gallatin Unit 7 turbine burst. ESCOM is no exception
examples are, cracked generator rotor at Camden, cracked
turbine rotor at Kriel and a cracked turbine rotor at Vaal
Power Station. Figure 6.11 illustrates the destructive power
ot a cracked rotor. These photographs, taken in 1939 at the
old Vaal i ver Station show the buildings after the turbine
disintegrated as a result of a cracked rotor.
Since the consequences of catastrophic failure are very
serious, every precaution must be taken to ensure such
failures are avoided. Since the vibration pattern of the
rotor reflects most mechanical changes in the rotor system it
also offers the best means of monitoring a propagating crack.
6.8.2 Vibration Monitoring Criteria
Most critical machines within ESCOM are equipped with a
standard safety-related vibration measurement system.
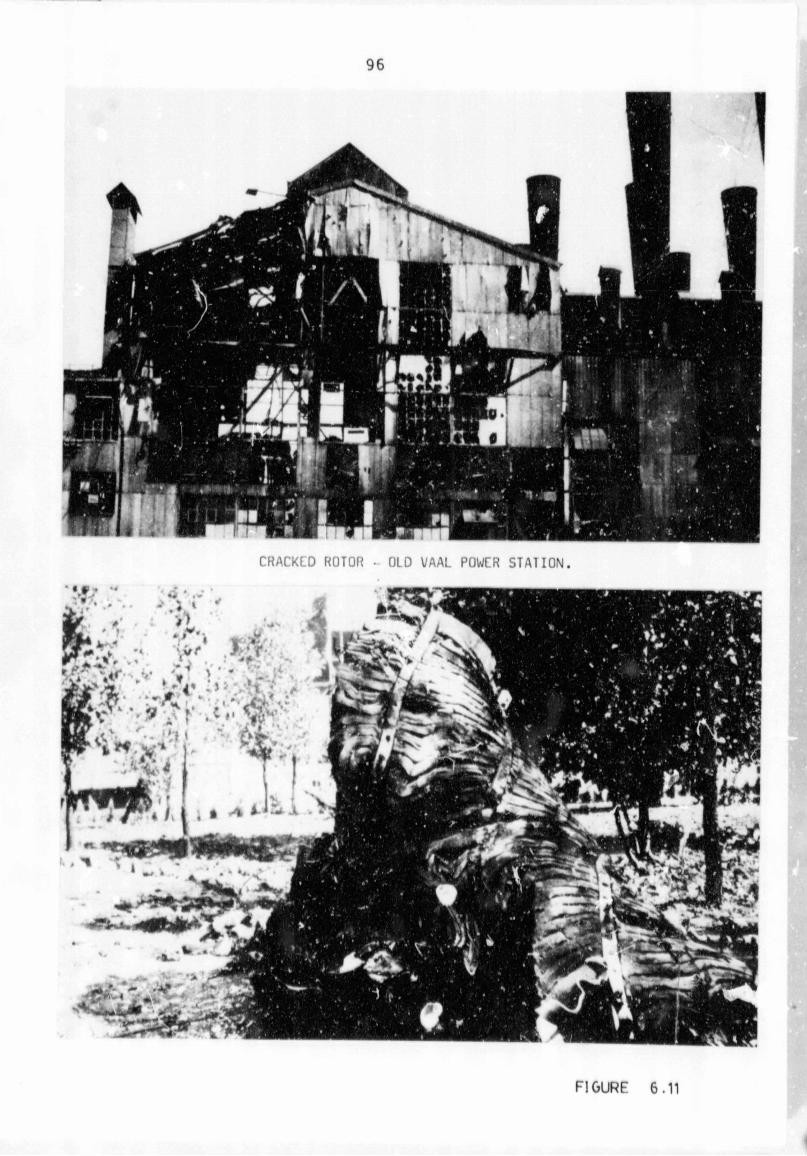
96
CRACKL'D ROTOR • OLD VAAL POWCR S T A T IO N .
FIGURE 6.11

97
Turbo-generator sets have one vertical seismic p>obe on each
bearing pedestal. The main feedwater pump has two proximity
probes located ♦ 45° from the vertical at each bearing. The
draught group fans have one horizontal velocity transducer on
the Nl) and NDE bearing pedestal. These systems have alarm
and trip functions for specified levels of vibration.
The smooth operation of these machines, is altered through
many influences which originate from operating procedures and
operational disturbances as well as from the appearance of
rotor cracks. & nee the vibration monitoring equipment has
proven satisfactory over many years of safe machine
operation, it is the author's view that it would be
advantageous to utilise this same equipment to detect
cross-sectional cracks.
•
Accurate knowledge of the natural vibration amplitude changes
caused by external •♦’fluonces such as back pressure and
various operating conditions, is undoubtedly an important
pre-requisite for the formulation of the transverse crack
detection criteria. A specific "dead band" of vibration
amplitude changes must be interpreted normal and thus
al1 owed.
To eliminate spurious fluctuations, it is necessary to
formulate mean values from measured vibration values, perhaps
on a daily basis. This procedure of averaging the values
does not overshadow the expected amplitude change following
the formation of a transverse crack, since the laws of crack
propagation can be applied over longer periods of time, for
instance ever several days or weeks. The amplitude changes
are progressive as the relative crack depth grows.

VIBRATION
AMPLITUDES
(x)
This behaviour has to be incorporated into the crack
indicating criteria in which a regression curve is determined
as shown in Figure 6.12, from the averaged measured values
over a given time interval.
R Regression Line for I ime Period t ̂ (Fr< '' Values)
B a tan(H*) “ Slope
Time (t)
SCHEMATIC REPRESENTATION OF THF CRACK-INDICATING CRITERIA FOR A TURBINE-GENERATOR
FIGURE 6.12
The progressive change is obtained from the difference in the
last two amplitudes, which likewise mubt exceed a given
value. Mean derivation final step change in amplitude and

99
time interval for the regression calculations must be so
adapted as to not only eliminate false indications caused by
the aforementioned operating influences, but also to
incorporate the required sensitivity to ensure timely
detection of transverse cracks before the occurrence cf
serious damage.
As depicted in Figure 6.12, the regression curves for a given
time period are determined from the average of five measured
’ues. The monitoring criteria used eie the slope of the
„ression line, Bj and the absolute step change in v last
o measured vibration values (AAj). A crack indica is
given when the limit value for both of these criteria is
simultaneously exceeded.
Extensive vibration measv. rements of many large turbine
generators performed by Baumgartner and Ziebarth (35) over a
two month period indicate that limit values Bj B 5
micrometers/day and A A - 5 micrometers are reasonable so thaf
normal operation will not be interrupted through a false
indication of a retor crack.
A propagating transverse crack normally causes changes it? the
once per revolution and twice per revolution vvhration
components. The magnitude of the changes depend’ on the
senstivity of the rotor to excitations with once and twice
per rotational frequency in the axial position where the
crack is situated and cf course on the position where the
vibration components are measured. There can also be changes
in the three times rotational frequency and higher order
vibrations, but in normal turbo-generators these vibrations
are more heavily damped and therefore of less interest.

100
It is very important to consider vector changes of vibration
and not only changes in vibration amplitude which could be
considerably smaller due to phase shift.
The existence or growth of a crack can be detected from the
vibration of ?he shaft when running below the main critical
speed provided that the mode shape corresponding to the
critical speed is such ts to cause a bending moment at the
soction containing the crack.
Du>-irg coastdown, advantage can be taken of the dynamic
magnification of vibration components at the shaft critical
frequency. In the case of horizontal shafts balanced to
ISO 1940 (36) the combination of gravity and a crack will
result in a resonance at the mtin critical speed which will
dominate the resonance due to out-of-balance. Henry (37)
suggests this will occur when the crack factor has reached
about 2X.
crack factor ■ (t*^-^)/*2
where and wj represent the natural angular frequencies of
the shaft in the x and y directions respectively.
6.9 SHAFT ORBITAL ANALYSIS
6.9.1 Introduction
9 •
The use of proximity probes for measuring the dynamic motion
of rotating machinery has gain<d universal acceptance. An
important aspect in determining the mechanical integrity of a
rotating system involves the measurement of shaft relative
motion. Since the proximity probe is essentially a DC

101
voltage versus gap transducer, the shaft position measurement
is provided using the DC voltage while the dynamic motion
measurement is provided using the AC voltage.
Shaft orbital analysis employs two proximity probes, at each
bearing, located ♦_ 45° from th* vertical.
A pair of probes can determine the shaft position at any
instant. Signals from these probes are coupled, to an
oscilloscope which displays this position visually. A third
proximity probe can read out the angular position of the
shaft at its maximum deflection. This probe is mounted in
some convenient plane and signals the passage of a timing
mark on the shaft. A keyway or key on the shaft makes a good
liming mark. The output from the keyphasor probe is coupled
to the oscilloscope's beam intensity input. As the mark
passes the probe a bright spot appears on the orbit display
to indicate vectorially which way the shaft deflects at that
instant.
The most common machinery vibration problems are she.ft
related e.g. imbalance rubs, misalignment *nd oil
instability. Shaft measurements are generally more reliable
than shaft absolute motion measured on the bearing pedestal,
for overall machine protection monitoring systems or periodic
machine measurements. They provide more meaningful
information than shaft absolute motion for malfunction
diagnosis. Many rotating machines, particularly these with
fluid film bearings and large casing to rotor mass ratios,
generate much more shaft motion relative to the bearing or
bearing housing than absolute bearing casing motion.

102
The only major limitation when using proximity probes
concerns the quality and nature of the shaft surface to be
observed. Ideally, the probe should observe a surface equal
iu finish to the shaft bearing journal. Surface
imperfections such as scratches, dents, rust and
out-of-roundness produce mechanical runout, which appears as
a noise component on the output signal of the probe. In
addition, the proximity transducer system is affected by
changes in magnetic and conductive properties of the ehaft
surface material. If surfacc conductive (resistivity)
properties change significantly from one point on the shaft
circumference to snother, this may also cause electrical
runout. Such changes in surface resistivity may originate
from metallurgical changes, surface hardn s variations, heat
treatments, certain grinding finishing techniques and plating
op spray metalising processes. Slow roll vector subtraction
and surface treatment can be used to solve mechanical and
electrical runout problems respectively. Slow roll vector
subtraction stores the profile of the shaft w.th its dents,
scratches and out of roundness at a "slow-roll" speed of
approximately 100 RPM. Since out of roundness, scratches and
dents will manifest themselves as a vibration problem, it is
necessary to eliminate this false vibration. This is exactly
what slow roll vector subtraction achieves. Slow roll vector
subtraction subtracts the profile of the shaft at the
"slow-roll" speed from the absolute shaft vibration at the
operational rotational speed of the machine.
Dsta obtained from proximity probes can be in the form of
transient and steady state data. Typically, transient data
is acquired during machine atart-up or coastdown when rotor
speed is changing as a function of time. L ady state data
is acquired when the machine is at a constant operating
condition, such as constnnt rotor speed, flow and load.

103
The Tutuka, Lethabo and Matimba feed pumps, at ESCOM's new
power stations, will have two permanently installed proximity
probes mounted at each bearing. They will also have a fifth
permanently installed proximity probe which will be used a a
keyphasor reference. Since the pumps have the five
permanently installed proximity probes each, for periodic
monitoring, shaft orbital and phase analysis can be performed
by the maintenance personnel.
6.9.2 Shaft Orbital Analysis Using Steady State Data
Since an orbit is an exact representation of dynamic shaft
motion, this display can be very informative of mechanical
condition and the presence of specific malfunctions.
Additional information can be obtained by introducing a
phase-indicating mark on the wave Torti of the orbit.
Orbits and the corresponding time base plots for various
malfunctions are illustrated in Figure 6.13.
To make the interpretation of transient shaft orbits less
confusing it was decided by ’ie author to simulate shaft
orbito using a computer. A computer programme was generated
to simulate shaft orbits for varying phase angles and,
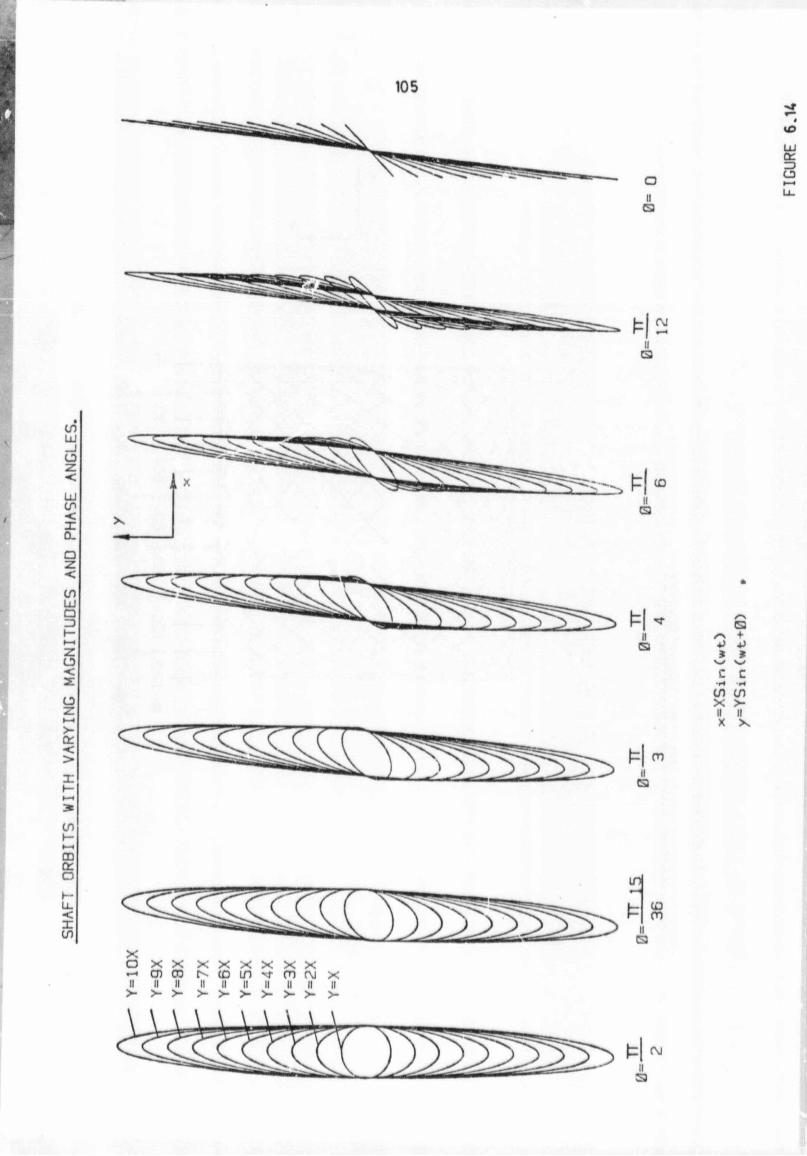
vertical and horizontal magnitudes. Figure 6.14 shows shaft
orbits with varying magnitudes and phase angles. These
orbits can be very useful in determining the magnitudes of
the vertical or horizontal vibration components as well as
the phase angle between these two components. Figure 6.15
shows typical orbits with eqial vertical and horizontal
components but varying phase angles. The phase angles vary
from 0° to 180°.

ORBITS & TIME BASE PLOTS FOR VARIOUS MALFUNCTIONS104
MALFUNCTION TIME BASE X -Y PLOT DIAGNOSIS
•
MISALIGNMENT
1 / i
( 7
TYPICAL OF SEVEREMISALIGNMENT
OIL W H IR L
©
WHIRL FREQUENCY < 0,5 SHAFT
SPEED
RUB Vo
CONTACTPRODUCES SPIKE SUPERIMPOSED ON NORMAL ORBIT
UNBALANCE OR BENT SHAFT
- 1 /
6 )
OVAL X - Y PLOT
FIGURE 6.13
105
I
UJcr
3C3
10
cn
CM
CO
UJ
o
LlI
CP<X0.
a
:
<
CO
UJa3
zo<
CD
>-QC
<>
CO
GJ
1=1II
CS
s
/>*>i
(S3+4}*
c c•H -H
cn cnx >-
X X
CDa .a
h-Ll
<Xcn
X X X Xt". cd in -*
> >- > >■
s

106 if:
LUcr
u
inoon
in
in
ino
inm
o
CD
O
CP
o
OJ
inco
u
a
ain
aaoT—«UC3
EJy - \ +* > •P* *Vc c■r» •ri
cn toX > >it II IIX X X
SHAFT
ORBITS
WITH
VARYING
PHASE
ANGLES.

107
6.9.3 Shaft Orbital Analysi* Ujing Transient Data
Shaft orbital analysis is a very useful tool for determining
shaft criticals and resonances during a start-up or coastdovn
of a machine.
Normally during a start-up or coastdovn of a machine the
displacements from thy four proximity probes as well as the
pulse from the keyphasor proximity probe are stored on a tape
recorder for later analysis. The analysis of the above data
would take the form of filtered Bede and Nyquist plots of the
one times rotative speed component and harmonics thereof, to
determine shaft criticals and structural resonances. The
displacements from the two NDE or DE proximity probes and the
pulse from the keyphasor probe can be viewed on a dual
channel oscilloscope to obtain orbits.
The facility to store transient data and to perform detailed
analysis as mentioned above requires sophisticated equipment,
like multi-channel tape recorders, digital vector filters and
FFT analysers, which cannot be duplicated at each power
station. Even without sophisticated equipment the
maintenance personnel at the power station will still be able
to perform limited transient data analysis..
If a speed indicator is available and the orbits are
carefully viewed on the oscilloscope shaft criticals and
resonances can be approximately determined. Shaft criticals
and resonances are characterised by maximum vibration
amplitude Coupled with a phase chang*-. By noting the speed,
on the speed indicator, at which this phenomenon occurs one
can obtain the shaft criticals or structural resonances.
It was decided by the author to generate transient shaft
orbits with varying horizontal and vertical stiffness ratios.
108
Th,» reasons for generating these orbits were:
a) It is very difficult to ascertain phase changes and
maximum vibration amplitudes, accurately on an
oscilloscope during a run-up or coastdown of a machine.
b) Unless a keyphasor is visible on the orbit it is
difficult to determine shaft criticals or resonance.
c) It ia advantageous to see the variations of the
magnitudes of the orbits and the changing of the
keyphasor during a run-up or ccastdown of a machine,
all on one plot.
Typical computer predicted transient shaft orbits from a
start-up or corstdown with varying horizon and vertical
stiffness ratios can be seen in Figures 6.16 an<’ 6.17.
When ky ■ 0,8 kx the orbits start off in an elliptical
fashion, reach a maximum at w * ky/m and change phase. The
same p. oedure is repeated at ■ kx/m. (See Appendix 2
for the derivation of th^se shaft orbits). These are typical
orbits that one could expect when passing through a critical
or resonance. Notice that when the horizontal and vertical
stiffnesses ar» the same there is only one resonance, but
when the stiffnesses are unequal then two resonances exists.
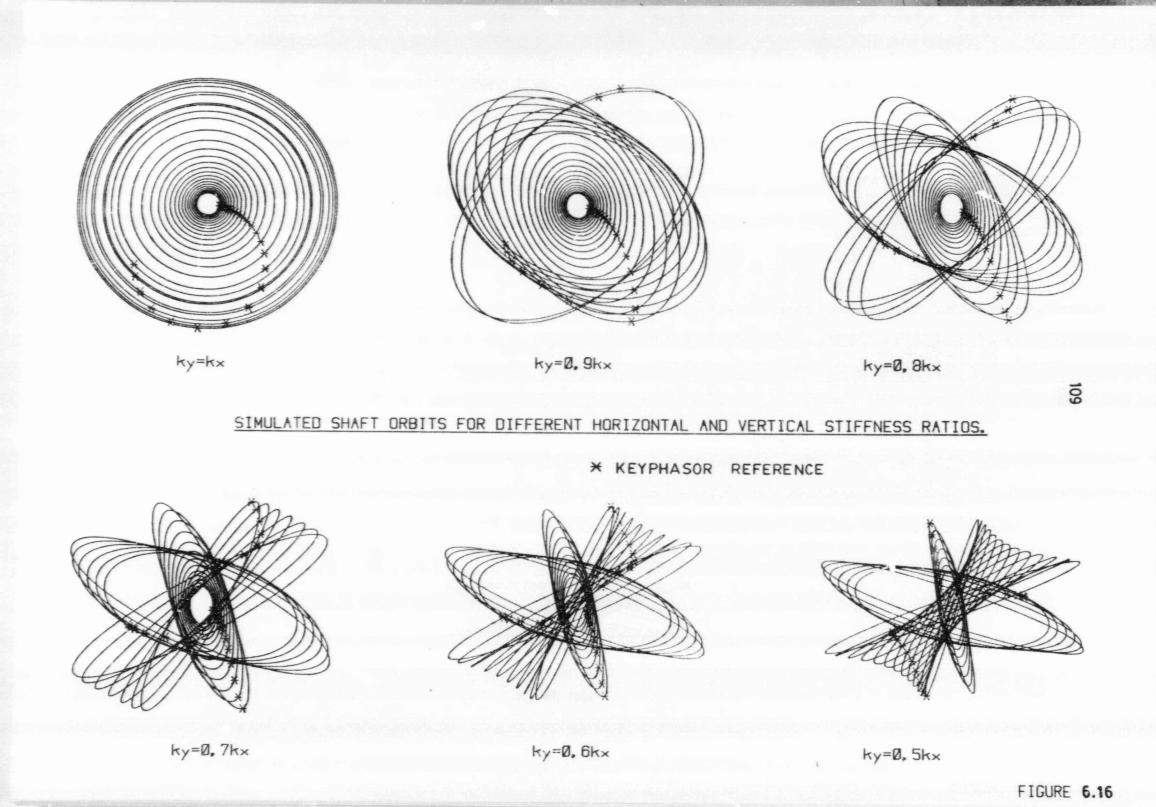
FIGURE 6.16

FIGURE G .17

111
6.10 DIAGNOSIS OF SUB-SYNCHRONOUS ROTOR DYNAMIC
INSTABILITIES USING SHAFT ORBITAL ANALYSIS
6.10.1 Introduction
Two of the most important energy transformers on rotating
machinery are the oil vhirl and oil whip phenomena. The oil
whirl energy transformer mechanism may express itself in any
non-compressible fl- id bearing or quasi-bearing wherein the
shaft surface drags Che lubricating fluid around in the
direction of rotation.
It is necessary to maintain an oil film for prevention of
direct contact between the rotating surface and non-rotating
surface. The oil film also assists in removing dissipated
energy from the bearing area. However, it is exactly this
fluid drag mechanism which can act as .he energy transformer
which may under certain conditions, convert useful torque
energy into energy devoted to creating radial dynamic
orbiting, forward whirl nr whip of the rotor system.
6.10.2 Theory Holmes (38)
Often shafts are supported by oil-lubricated journal
bearings, the load carried b hydrodynamirally-ganerated
pressures in the oii film. Wit reference to Figure 6.18 if
a journal of this type of bearing is rotated at a constant
angular velocity , about its own centre, the centre being
fixed at a distance e from the bush centre, it will
experience a constant force F at angle V to the displacement
e .
The magnitudes of the force F and the angle 'ty depend upon
the eccentricity ratio ^ ■ 6 /c. Figure 6.19 illustrate* a
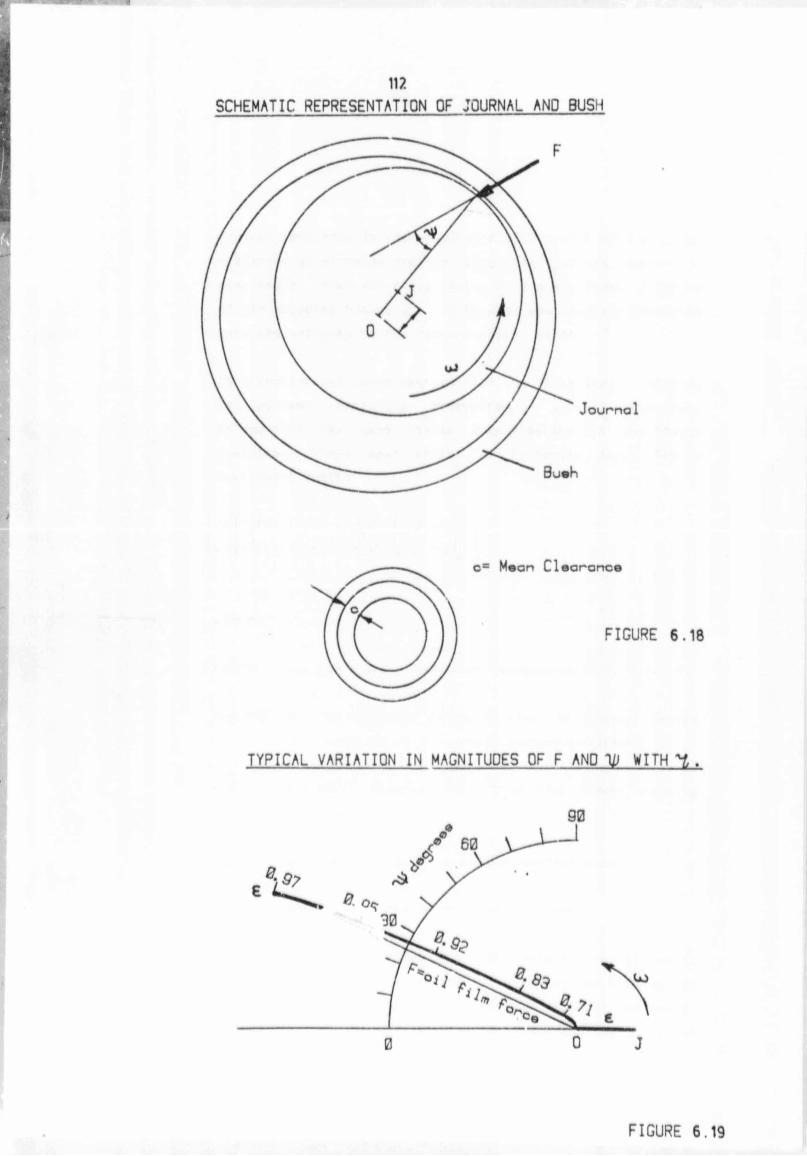
SCHEMATIC REPRESENTATION OF JOURNAL AND BUSH
112
c= Meart Clearanc*
FIGURE 6.18
TYPICAL VARIATION IN MAGNITUDES OF F AND M) WITH
90
FIGURE 6.19
113
typical variation in the magnitudes of F and'V *ith -y , for
a bearing of circular profile when the journal centre is
stationary. Thus the force vector F is a non-linear function
of the posit ion vector c. . It is also non-linearly dependent
upon the velocity of the journal centre dc/dt.
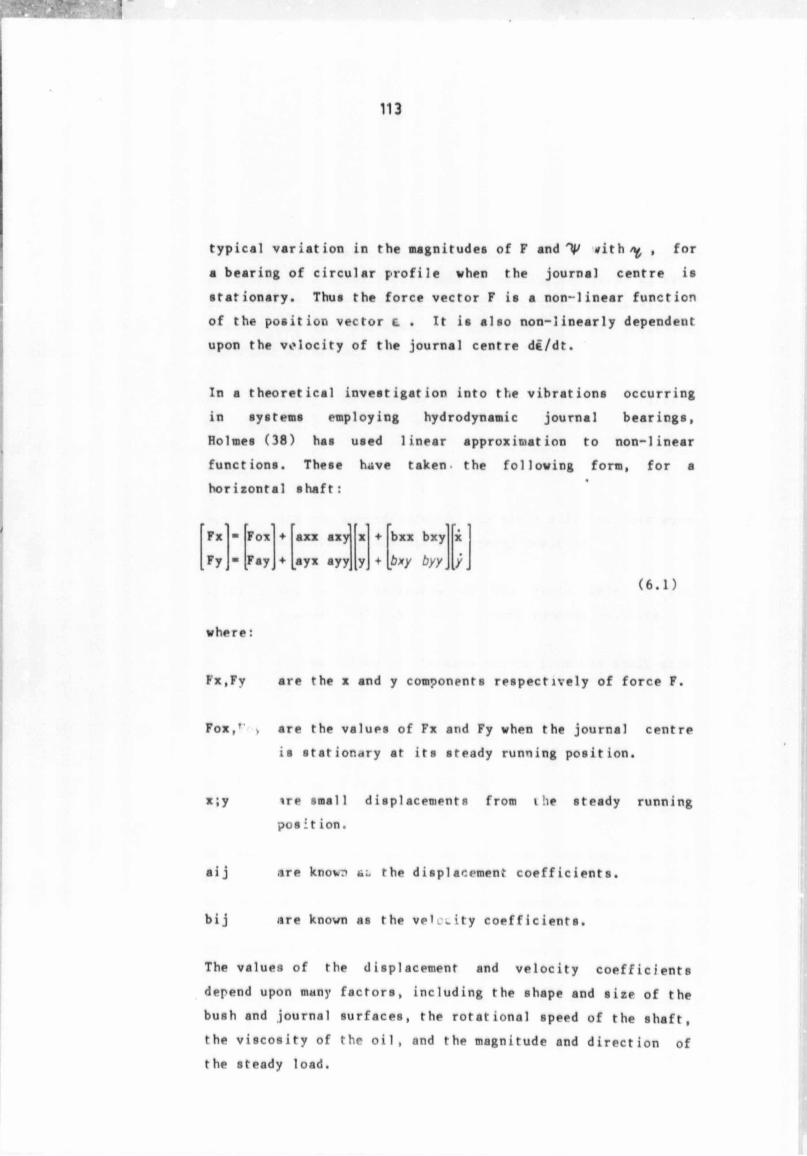
In a theoretical investigation into the vibrations occurring
in systems employing hydrodynamic journal bearings,
Holmes (38) has used linear approximation to non-linear
functions. These h«ive taken- the following form, for a
horizontal shaft:
Fx - Fox ♦ axx axy X ♦ bxx bxy X
- F * y♦ ayx ayy y + pxy byy
( 6 . 1 )
where:
F x ,Fy are the x and y components respectively of force F.
Fox,r > are the values of Fx and Fy when the journal centre
is stationary at its steady running position.
x;y tre small displacements from ihe steady running
pos it ion.
aij are known the displacement coefficients.
bij are known as the v e r i t y coefficients.
The values of the displacement and velocity coefficients
depend upon many factors, including the shape and size of the
bush and journal surfaces, the rotational speed of the shaft,
the viscosity of the oil, and the magnitude and direction of
the steady load.
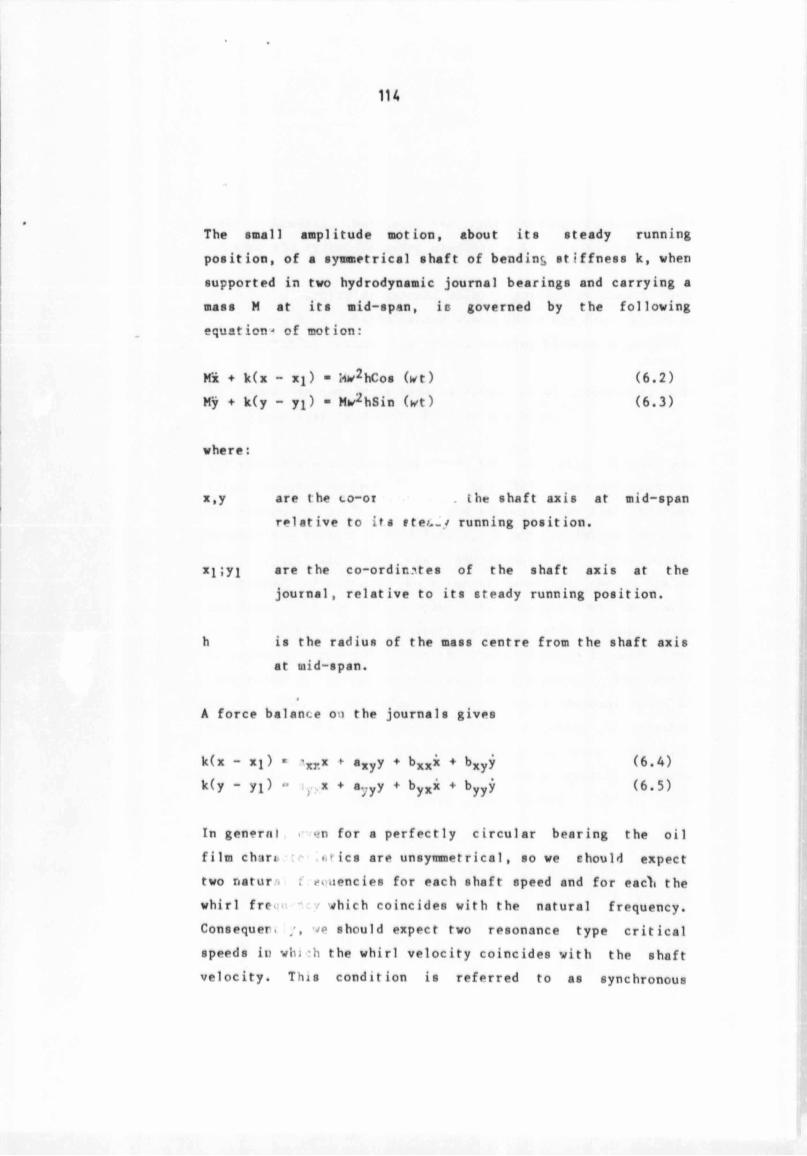
The small amplitude motion, about its steady running
position, of a symmetrical shaft of bending stiffness k, when
supported in two hydrodynamic journal bearings and carrying a
mass M at its mid-span, ie governed by the following
equation-* of motion:
M'x ♦ k(x - xj) ■ I-w^hCos (wt)
My ♦ k(y - yj) - Mw^hSin (*t)
where:
x,y are the co-or . ihe shaft axia at mid-span
relative to its fte>._/ running position.
xj;yj are the co-ordinstes of the shaft axis at the
journal, relative to its steady running position.
h is the radius of the mass centre from the shaft axis
at mid-span.
A force balance on the journals gives
k(x - x!> ■ ’xrx + axyy ♦ bxxi ♦ bxyy (6.A)
k(y - yi) " x ♦ *yyy + byx* + byyy (6.5)
In general . «n for a perfectly circular bearing the oil
film charj *.» ics are unsynrnetrical, so we should expect
two natur ; fluencies for each shaft speed and for eacli the
whirl frc #hich coincides with the natural frequency.
Consequer. ;, mp should expect two resonance type critical
speeds in whi -h thp whirl velocity coincides with the shaft
velocity. This condition is referred to as synchronous
( 6 . 2 )
(6.3)

115
whirl. However, there are two complicating factors which
prevent the system behaving completely in this manner:
<) for a particular system, under a particular steady load
fh>«re is a rotation speed above which the free motion is
unstable, because the system damping becomes n e g a t i v e .
b) when the amplitude becomes large, as at resonance, the
linearised equations (6.1) do not hold.
The unntable motion arising from the oil film forces vas
first reported by Newkirk and Taylor (39). They referred to
the phenomenon at' "oil whip", and reported that the vibration
or whirling frequency bore little, if any, relation to the
shaft speed and that the phenomenon was practically
independent of balance. More recent investigations by Pinkus
a~d Tondl (40) and ('»1) respectively indicate that the ratio
%
of free whirl velocity to shaft velocity takes values which
decrease from about 0,i when the shaft velocity is much less
than twice the lowest natural angular frequency. The whirl
velocity takes the value of the lowest natural angular
frequency of the rotor when the shaft velocity is greater
than twice that value. That is, for a rigid rotor the free
whirl velocity is about half thi* shaft velocity. This
condition has been called "half-speed whirl" or
"sub-synchronous whirl".
The speed at which this action takei place is defined in the
following manner. The velocity of the rotor film at the
non-rotating surface of the bearing is zer>. The velocity of
the oil film at the rotating surface of the shaft in the
bearing is the velocity of the surface. Assuming laminar
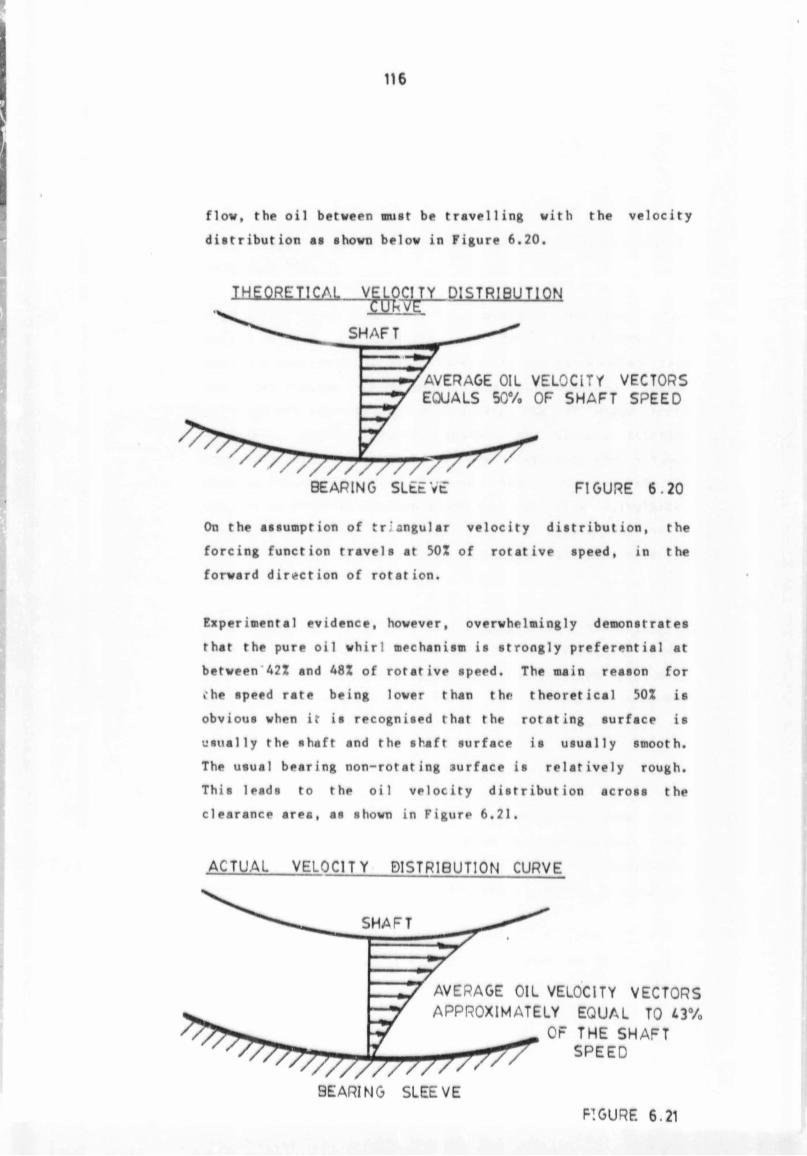
116
flow, the oil between must be travelling with the velocity
distribution as shown below in Figure 6.20.
On the assumption of triangular velocity distribution, the
forcing function travels at 50Z of rotative speed, in the
forward direction of rotation.
Experimental evidence, however, overwhelmingly demonstrates
that the pure oil whirl mechanism is strongly preferential at
between 42Z and 48Z of rotative speed. The main reason for
>he speed rate being lower than the theoretical 50Z is
obvious when it is recognised that the rotating surface is
usually the shaft and the shaft surface is usually smooth.
The usual bearing non-rotating 3urface is relatively rough.
This leads to the oil velocity distribution across the
clearance area, as shown in Figure 6.21.
IHE0RET1CAL V£,Upcrnr_PiSTR] T1QN
AVERAGE OIL VELOCITY VECTORS EQUALS 50V. OF SHAFT SPEED
BEARING SLEEVE FIGURE 6 .20
ACTUAL VELOCITY DISTRIBUTION CURVE
SHAFT
7
AVERAGE OIL VELOCITY VECTORS APPROXIMATELY EQUAL TO *3%
_ OF THE SHAFT i i ~ ^ SPEED
BEARING SLEEVEFIGURE 6.21

117
The average oil velocity with this concave distribution is
less than 50X.
Figure 6.22 shows the ^.laition, velocity and the forces
acting in an oil whirl action, and Figure 6.23 shows the
action a quarter of an orbit later. It may be observed from
the above Figures that as soon as the oil properties, speed,
pre-load and clearance are appropriate, the oil wedge force
component, acting directly against the viscous friction
component, overcome but does not eliminate the viscous
damping force. Once this happens, the rotor proceeds to
vibrate at whatever average speed the oil fiim circulates,
usually near 431 of the shaft rotative speed, and in a
forward circular orbit. This mochanism is presented in
theoretical form by Kirk et al (42).
Lacking any influence other than average oil velocity, the
oil whirl tracks a fairly constant ratio of rotative speed.
If the rotor system has a resonance below rotative speed such
as a balance resonance, oil whirl and resonance inter-act
with each other. When this occurs it is called oil whip.
Most of the critical machines in a power station have sleeve
bearings, e.g. the main turbo generator set, the steam and
electric feedwater units and the draught group fans. Oil
whirl and whip could becomr a problem in these machines, and
hence it is vitally importai.t that a condition monitoring
team knov what the symptoms of oil whirl and whip are and how
to diagnosis the problem.
Detailed tests wer- performed by the author on the Bently
Nevada rotor kit to simulate oil whirl and oil whip.
Spectrums, orbits «tnd vuterfall plots were obtained to
demonstrate the symptoms of oil whirl and whip.

OIL WEDGE
VISCOUS
DAMPING
FORCE
VISCOUS DAMPING
FORCE
ANTI-VISCOUS
COMPONENT OF
OIL WEDGE FORCE
OIL
WEDGE
ANTI-VISCOUS
COMPONENT OF
OIL WEDGE FORCE
OIL VHDGE
' 2i »-* ft
s:*
I
£ 1
Preeent time here
OIL WHIRL i SHAFT AT 06H00
FIGURE 6.22
Present time here
OIL WHIRL . SHAFT AT 09H00
FIGURE 6.23

Author Ducci PP
Name of thesis Vibration Analysis And Diagnostic Techniques, With Reference To The Implementation Of A Vibration
Condition Monitoring Programme. 1987
PUBLISHER: University of the Witwatersrand, Johannesburg
©2013
LEGAL NOTICES:
Copyright Notice: All materials on the Un i ve r s i t y o f the Wi twa te r s rand , Johannesbu rg L ib ra ry website are protected by South African copyright law and may not be distributed, transmitted, displayed, or otherwise published in any format, without the prior written permission of the copyright owner.
Disclaimer and Terms of Use: Provided that you maintain all copyright and other notices contained therein, you may download material (one machine readable copy and one print copy per page) for your personal and/or educational non-commercial use only.
The University of the Witwatersrand, Johannesburg, is not responsible for any errors or omissions and excludes any and all liability for any errors in or omissions from the information on the Library website.