Figure 1 Getting Ready for Health Reform: An Overview of Health Coverage for People with HIV/AIDS...
36
Figure 1 Getting Ready for Health Reform: An Overview of Health Coverage for People with HIV/AIDS Jeffrey S. Crowley, M.P.H. Senior Research Scholar Health Policy Institute, Georgetown University [email protected] / (202) 687-0652 ADAP Advocacy Association December 4, 2008
-
Upload
iliana-reddick -
Category
Documents
-
view
213 -
download
0
Transcript of Figure 1 Getting Ready for Health Reform: An Overview of Health Coverage for People with HIV/AIDS...

Figure 1
Getting Ready for Health Reform: An Overview of Health Coverage for People with HIV/AIDS
Jeffrey S. Crowley, M.P.H.
Senior Research Scholar
Health Policy Institute, Georgetown University
[email protected] / (202) 687-0652
ADAP Advocacy Association
December 4, 2008

Figure 2
Goals for this session
• Provide a background on how people with HIV/AIDS obtain health insurance coverage
• Describe the role of private insurance--and key issues as we approach a national debate on health care reform
• Describe the role of Medicaid and Medicare and discuss current policy issues
• Discuss the role of the Ryan White programs in filling in gaps left by private insurance, Medicaid, and Medicare

Figure 3
How Americans Obtain Health Insurance Coverage, 2007
SOURCE: Kaiser Commission on Medicaid and the Uninsured and Urban Institute analysis of March 2008 Current Population Survey.
Population = 298 Million

Figure 4
People with HIV/AIDS: Insurance Coverage (HIVRN), 2002
Uninsured29%
Medicare14%
Duals4%Private
17%
Medicaid36%
SOURCE: Kaiser Family Foundation based on Fleishman JA et al., “Hospital and Outpatient Health Services Utilization Among HIV-Infected Adults in Care 2000-2002, Medical Care, Vol 43 No 9, Supplement, September 2005.; Fleishman JA, Personal Communication, July 2006
Of those in care

Figure 5
Health Insurance Coverage of the Low-Income Nonelderly Population by Race/Ethnicity, 2005
20% 24%33%
21% 26%
3%4%
10%
1%5%
33%
45%22%
35%
49%
28%
44%
28%36%
43%
21%
32%
9%
32%
White, Non-Hispanic
Hispanic AfricanAmerican,
Non-Hispanic
Asian orPacific
Islander
AmericanIndian/Alaska
Native
Two or MoreRaces
Uninsured
Medicaid orOther PublicIndividual
Employer
42.8 million 23.7 million 17.8 million 3.8 million 0.9 million 1.7 million
Notes: Low-income is defined as family income less than 200% of the federal poverty level, or $39,942 for a family of four in 2005. Nonelderly includes individuals up to age 65. “Other Public” includes Medicare and military-related coverage. Data source is the March 2005 Current Population Survey. Source: Urban Institute and Kaiser Commission on Medicaid and the Uninsured estimates.

Figure 6
18%
28%
17%
40%
41%
61%
43%
25%
50%
18%
43%
17%
47%
39%
22%
17%
42%
33%
Uninsured Medicaid/Other Public Employer/Other Private
Poor
Near-Poor
(<100% Poverty)
(100-199% Poverty)
Poor
Near-Poor
(<100% Poverty)
(100-199% Poverty)
Poor
Near-Poor
(<100% Poverty)
(100-199% Poverty)
Children
Parents
Adults without children
Notes: Medicaid also includes SCHIP and other state programs, Medicare and military-related coverage. The federal poverty level was $19,971 for a family of four in 2005. Data may not total 100% due to rounding.Source: Kaiser Commission on Medicaid and the Uninsured and Urban Institute analysis of March 2006 Current Population Survey.
Health Insurance Coverage of Low-Income Adults and Children, 2005

Figure 7
Non-Elderly Uninsured, by Age and Employment Status, 2005
Children 18 and Under
16%
Adults 19-6484%
Non Workers19%
Part Time Workers
11%
At Least 1 Full Time Worker
70%
SOURCE: Urban Institute and Kaiser Commission on Medicaid and the Uninsured estimates based on the Census Bureau's March 2005 and 2006 Current Population Survey (CPS: Annual Social and Economic Supplements).
46.1 Million Uninsured
Age Employment Status

Figure 8
U.S. Population and People with HIV/AIDS: Income & Unemployment
8%5%
45%
62%
Income<$10,000
Unemployed
US Population
People withHIV/AIDS
SOURCE: Kaiser Family Foundation based on US Census Bureau, 2006; Kaiser State Health Facts Online; Cunningham WE et al. “Health Services Utilization for People with HIV Infection Comparison of a Population Targeted for Outreach with the U.S. Population in Care.” Medical Care, Vol. 44, No. 11, November 2006. NOTE: US income data from 2005, US unemployment data from 2006. 1998 estimates were also 8% and 5%, respectively, rounded to nearest decimal; HCSUS data from 1998.

Figure 9
In Care/HAART
55%
Not In Care30%
In Care/No HAART
15%
In & Not in Care: Receipt of HAART by Those Eligible for HAART, 2003
SOURCE: Teshale EH et al., “Estimated Number of HIV-infected Persons Eligible for and Receiving HIV Antiretroviral Therapy, 2003--United States”, Abstract #167, 12th Conference on Retroviruses and Opportunistic Infections; February 2005.
Of those aged 15-49 estimatedto be eligible for HAART

Figure 10
Dynamics of Health Coverage• Health insurance coverage is not static
• 45 million uninsured in 2004, vs. 80 million uninsured over two-year period
• Approximately 2 million Americans lose health insurance every month – often for a short period
• Coverage options can change with…
– Loss or change of job– Change in family status (e.g. divorce, death of spouse)– Birthday (e.g. 19th)– Move– Change in health status
SOURCE: Karen Pollitz “Private Health Insurance 101” Tutorial, available from www.KaiserEDU.org.

Figure 11
Many Policy Makers Seek to Expand Access to Private Coverage
…but not all health insurance is created equal
• Employer-sponsored coverage:
– Often comprehensive, but not always– Variation in benefits covered as well as premium and deductible
costs
• Individually-purchased policies:
– Typically less comprehensive • Less coverage of maternity, mental health and prescription
drugs• Can have high deductibles as well
– Generally unavailable or unaffordable to people with HIV/AIDS
SOURCE: Karen Pollitz “Private Health Insurance 101” Tutorial, available from www.KaiserEDU.org.

Figure 12
Health Conditions Denied by Individual Market Insurers
• Always deniedo Cancer o Multiple Sclerosiso HIV/AIDS o Pregnancyo Diabetes o Stroke
• Often deniedo Overweight o High blood pressureo Cancer history o Asthma
• Sometimes deniedo Acne o Hay fever
Pollitz, K., Sorian, R., and Thomas, K. How Accessible is Individual Health Insurance for Consumers in Less Than Perfect Health?, Kaiser Family Foundation, June 2001.

Figure 13
Take Aways on Private Insurance• Private insurance is mainstay of health coverage for most
Americans, but…
– Access, affordability, adequacy of coverage not guaranteed
– Complex, with high administrative costs
• Difficulty of getting/keeping private coverage increases with health problems, especially during coverage transitions
• Regulation to limit risk selection involves tradeoffs: access vs. adequacy vs. affordability
• Additional public policy responses needed to subsidize and expand coverage
SOURCE: Karen Pollitz “Private Health Insurance 101” Tutorial, available from www.KaiserEDU.org.

Figure 14
Public Coverage is Often More Efficient and Targeted than Private Coverage
Kaiser Commission on Medicaid and the Uninsured (KCMU) conducted an extensive review of research literature on health coverage for low-income Americans. Key findings include:
• Role of Public Coverage: Expanding publicly sponsored health insurance offers the most targeted and efficient strategy for expanding health coverage among low-income populations
• Eligibility: Basing eligibility for publicly sponsored health coverage on having a low income, without categorical restrictions, could substantially reduce the number of uninsured Americans
SOURCE: Health Coverage for Low-Income Americans: An Evidence-Based Approach to Public Policy, Kaiser Commission on Medicaid and the Uninsured, January 2007.

Figure 15
Role of Public Coverage (continued)• Use of Premiums: Premiums can be expected to depress participating
among people living at or near poverty• Use of Cost-Sharing: Even at low levels, cost-sharing can adversely
affect access to care for low-income people• Scope of Benefits: The relatively poor health status of low-income
Americans, combined with their limited ability to pay for care out-of-pocket mean that comprehensive benefits are important to meet the diverse needs of this population
• Financing: A federal-state financing partnership that takes into account national trends, countercyclical pressures at the state level, and the federal government’s greater fiscal capacity could provide a strong and sustainable source of support for a health coverage program for low-income Americans
SOURCE: Health Coverage for Low-Income Americans: An Evidence-Based Approach to Public Policy, Kaiser Commission on Medicaid and the Uninsured, January 2007.

Figure 16
The Institute of Medicine Endorsed Expanded Public Coverage for HIV/AIDS
• Many individuals with HIV/AIDS experience delays in treatment access … there are missed opportunities to reduce mortality, morbidity, and disability among individuals with HIV infection
• The Committee’s principal recommendation to address system deficiencies is the establishment of a new federal program for financing HIV care … the program would entitle individuals based on HIV infection rather than AIDS, and by specifying a set of benefits that meet the standard of care for HIV.
SOURCE: Public Financing and Delivery of HIV/AIDS Care: Securing the Legacy of Ryan White, Institute of Medicine, 2004.
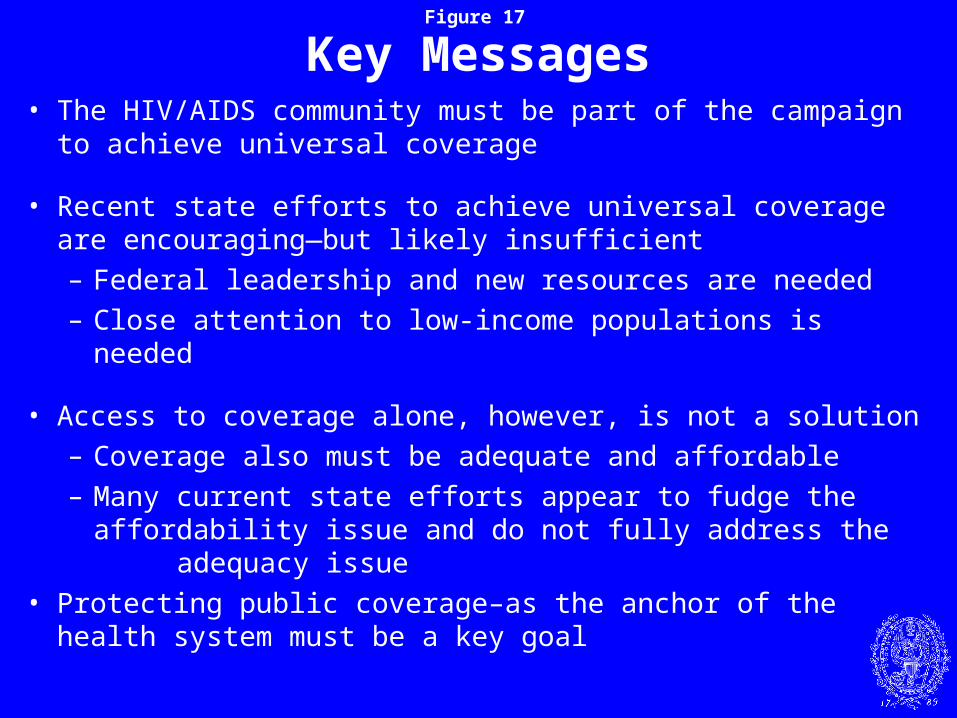
Figure 17
Key Messages• The HIV/AIDS community must be part of the campaign to
achieve universal coverage
• Recent state efforts to achieve universal coverage are encouraging—but likely insufficient– Federal leadership and new resources are needed– Close attention to low-income populations is needed
• Access to coverage alone, however, is not a solution– Coverage also must be adequate and affordable– Many current state efforts appear to fudge the
affordability issue and do not fully address the adequacy issue
• Protecting public coverage–as the anchor of the health system must be a key goal

Figure 18
Medicaid Anchors the Rest of the Health System
• Nation’s largest health care program in terms of enrollment:
• In FY 2005, covered 59 million low-income Americans• 29.4 million non-disabled children, • 15.2 million non-disabled adults, • 6.1 million seniors, and • 8.3 million children and adults with disabilities
• Largest source of health coverage for people with HIV/AIDS (≈195,000 Medicaid beneficiaries with HIV/AIDS, at a federal cost of $5.4 billion in 2004)
• Provides health and long-term services coverage to 15% of the U.S. population
SOURCE: Urban Institute analysis of CMS MSIS data for the Kaiser Commission on Medicaid and the uninsured.
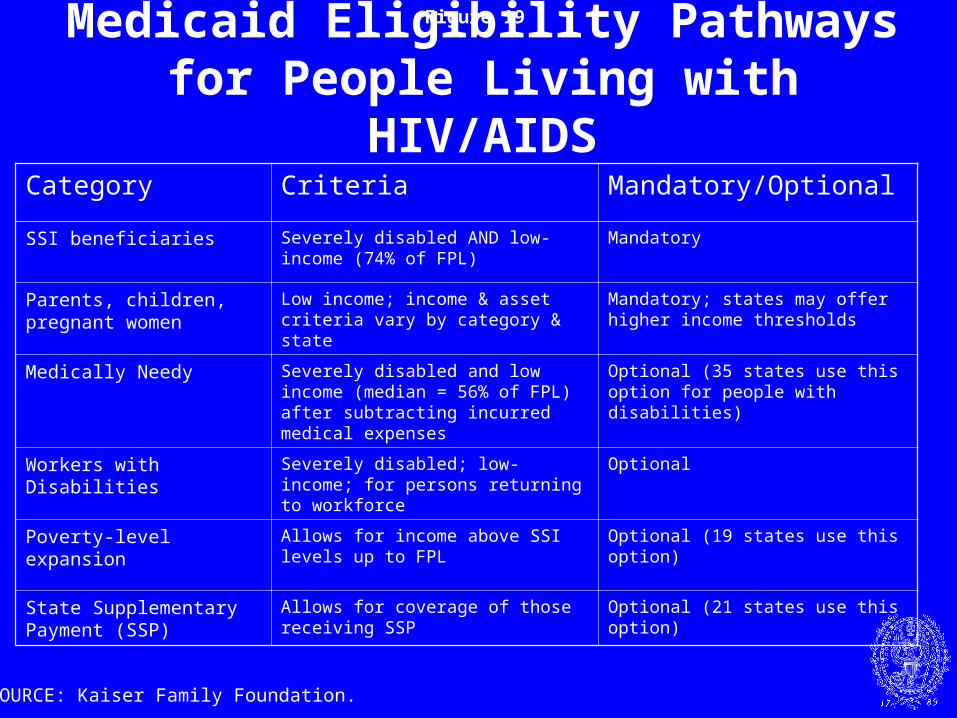
Figure 19
Medicaid Eligibility Pathways for People Living with HIV/AIDS
Category Criteria Mandatory/Optional
SSI beneficiaries Severely disabled AND low-income (74% of FPL)
Mandatory
Parents, children, pregnant women
Low income; income & asset criteria vary by category & state
Mandatory; states may offer higher income thresholds
Medically Needy Severely disabled and low income (median = 56% of FPL) after subtracting incurred medical expenses
Optional (35 states use this option for people with disabilities)
Workers with Disabilities Severely disabled; low-income; for persons returning to workforce
Optional
Poverty-level expansion Allows for income above SSI levels up to FPL
Optional (19 states use this option)
State Supplementary Payment (SSP)
Allows for coverage of those receiving SSP
Optional (21 states use this option)
SOURCE: Kaiser Family Foundation.

Figure 20
Medicaid is a Major Source of Financing for Health Services
• Second largest health care program (after Medicare) in terms of spending: – Federal government matches states spending under a formula
based on state per capita income. Federal share can vary from 50-83% of total costs. In FY 2008, 13 states have a federal share of only 50%, and MS has the highest match, with the federal government paying 76.29% of total costs.
– In FY 2006, the program spent $303.9 billion, with the federal government paying 57% of the cost and the states paying the remainder.
• Responsible for 15% of national health expenditures in 2006.
SOURCES: Urban Institute analysis for the Kaiser Commission on Medicaid and the Uninsured of CMS-64 Reports, July 2007 and National Health Expenditure Accounts, 2008, CMS Office of the Actuary.

Figure 21
Medicaid has a unique role in relation to private coverage and Medicare
• Catastrophic needs: Assists people with extensive needs at all stages of life
• Essential public role: Shoulders uniquely public responsibilities, such as covering children in foster care
• Integrates acute and long-term services: By contrast, private insurance and Medicare mostly cover acute care or short-term rehabilitation
• Critical safety net: Private insurance and Medicare not designed to meet the needs of some populations with extensive needs

Figure 22
Medicaid Serves a Diverse Population
Note: “Poor” defined as <100% of federal poverty level, which was $19,971 for a family of four in 2005. Source: Estimates by Kaiser Commission on Medicaid and the Uninsured and Urban Institute; birth data from MCH Update, National Governors Association.
60%
44%
20%
50%
22%
41%
40%
26%
20%
19%
Nursing Home Residents
People Living with HIV/AIDS
People with Severe Disabilities
Medicare Beneficiaries
Births (Pregnant Women)
Low-Income Adults
Low-Income Children
All Children
Near Poor
Poor
Percent with Medicaid:
Families
Seniors and People with Disabilities

Figure 23
A large share of Medicaid spendingis for dual eligibles
Other Aged & Disabled
Dual Eligibles
Adults25%
Children50%
14%
SOURCE: Kaiser Commission on Medicaid and the Uninsured estimates based on CMS data and Urban Institute analysis of data from MSIS.
Total = 51 Million
Medicaid Enrollment
10%
Medicaid Spending
Total = $232.8 Billion (42% on Duals)
Spending on Other Groups
Prescription Drugs
Long-Term Care
Medicare Premiums
27%
58%
6%
2%
Other Acute Care
6%
(2003)
Figure 24
Small Share of Population Accounts for Large Share of Expenditures
SOURCE: Sommers and Cohen, Medicaid’s High Cost Enrollees: How Much Do They Drive Program Spending? Kaiser Commission on Medicaid and the Uninsured, March 2006. Based on MSIS 2001 data.
Enrollees Expenditures
Adults 1%Disabled25%
Total = 46.9 million Total = $180.0 billion
Elderly20%
<$25,000 in Costs
96%
Children 3%
<$25,000 in Costs
52%>$25,000 in
Costs
Adults 0.1%Disabled 2%Elderly 2%
Children 0.2%
>$25,000 in Costs
3.6%
49%

Figure 25
Medicare Today• Covers 44 million people
– ~37.4 million seniors– ~6.6 million non-elderly people with disabilities– Second largest source of HIV/AIDS coverage (≈85,000 Medicare
beneficiaries with HIV/AIDS, includes ≈ 55,000 dual eligibles; at a cost of ≈ $2.5 billion in 2004)
• Net Federal cost of $459.4 billion in 2008
• Program now has 4 parts A,B,C, and D
– Part A – Hospital and skilled nursing care– Part B – Physician and outpatient hospital care– Part C – Medicare Advantage (voluntary managed care alternative to Parts
A and B)
– Part D – Outpatient prescription drug coverage
Source: CBO Medicare Baseline, March 2008.

Figure 26
Medicare Eligibility Pathways for People Living with HIV/AIDS
Category Criteria
Individuals age 65 and over Sufficient number of work credits to qualify for Social Security payments
Individuals under age 65 with permanent disability
Sufficient number of work credits to qualify for SSDI payments due to disability; also includes spouses and adults disabled since childhood
Have been receiving SSDI payments for at least 24 months
Individuals with End-Stage Renal Disease, any age
Sufficient number of work credits to qualify for Social Security payments
SOURCE: Kaiser Family Foundation.

Figure 27
Qualifying for Medicare Individuals under age 65 can qualify for Medicare on the basis
of disability if they have a sufficient work history and after a waiting period
1. SSA determines that an individual has a disability;
2. To ensure that disability is permanent or long-lasting, individuals must then wait 5 months before they start receiving SSDI;
3. Starting when they first receive SSDI, individuals must wait an additional 24 months to start receiving Medicare
Individuals with disabilities since childhood can receive Medicare based on the work history of a parent. These individuals are called disabled adult children (DACs), and are subject to the 24 month waiting period when they turn 18 (or develop a disability before age 22)

Figure 28
Percent of Total Medicare Population:
SOURCE: Medicare Current Beneficiary Surveys 2003 and 2002.
Low-Income <150% FPL ($14,700 in 2006)
Enrolled in Medicaid (“Dual Eligibles”)
Cognitive/Mental Impairment
Nursing Home Resident
3+ Chronic Conditions
Under-65 Disabled
Medicare Covers a Population with Diverse Needs and Significant Vulnerabilities
Fair/Poor Health
Age 85+
39%
35%
31%
27%

Figure 29
MMA Out-of-Pocket Drug Spending in 2008
+ ~$304 in annual premiums
New Medicare Legislation
Deductible $275
No Coverage
CatastrophicCoverage
PartialCoverage
up to Limit
$2,510
$5,726 (equivalent to $4,050 inout-of-pocket spending)
25%
$3,216 Gap
Out-of-Pocket Spending
Medicare Part D Benefit
SOURCE: Kaiser Family Foundation.
Individual Pays 5%
Plan Pays 15%
Medicare Pays 80%
Plan Pays 75%

Figure 30
Limitations of Medicare
In addition to prescription drug affordability issues, gaps in Medicare coverage that shift costs and responsibilities onto Medicaid and Ryan White include:
– Long-term services and supports
– Dental care and dentures
– Hearing aids
– Routine eye care and eyeglasses
– Routine foot care
– Limited mental health services

Figure 31
Thoughts on Expanding Health Insurance Coverage
• Efforts to expand access to health coverage—and achieve universal coverage—are important
• Recent state efforts to achieve universal coverage are encouraging—but likely insufficient– Federal leadership and new resources are needed– Close attention to low-income populations is needed – Focus has been on working people, with little to no
attention on needs of people with chronic conditions
• Access to coverage alone, however, is not a solution– Coverage also must be adequate and affordable– Many current state efforts appear to fudge the
affordability issue and do not fully address the adequacy issue

Figure 32
In Any Reformed Health System, the Ryan White Programs Are Still Needed
• The Ryan White programs fill in gaps left by private coverage, Medicaid, and Medicare
• If a major universal coverage initiative were enacted, the gaps to be filled by Ryan White programs may change, but these programs would still be necessary
• Nearly all universal coverage initiatives are predicated on building on existing financing and delivery systems—i.e. they assume the Ryan White programs are here to stay
• Nearly all so-called universal coverage proposals leave gaps related to HIV/AIDS care: consider access, adequacy, and affordability

Figure 33
Will we be on offense or defense in the coming year?
—Reform and expansion or retrenchment?
• Many believe that universal coverage will be built on three legs: bolstering existing employer-sponsored insurance, asking individuals to fairly contribute to the cost of their care, and targeting expansions of public programs for low-income and costly/complex populations
• Severe economic downturn will likely lead to temporary increase in Medicaid FMAP (Many policy makers would prefer to build this into law to deal with counter-cyclical nature of program)
• As states face budget pressures and cut back, we will likely hear Medicaid scapegoated

Figure 34
Medicaid Issues to ConsiderMedicaid’s Role in the Broader Health System• Remove categorical distinctions and cover all poor people or all
poor seniors and people with disabilities?
• Re-think medically needy coverage to better permit people with catastrophic needs to spenddown into Medicaid?
Flexibility versus Uniformity• Is the current variation across states acceptable?
• How do we improve the delivery system across 50+ programs?
Long-Term Services Policy and Medicare• Medicaid is our de facto national long-term care program, not
intended to play this role—how do we expand other sources of financing for long-term care?
• How do we rebalance LTC to expand community services?
• What is the proper responsibility of Medicaid for Medicare beneficiaries (huge burden from waiting period and LTC)

Figure 35
Medicare Issues to Consider
Does the program match the populations it serves• Is the benefits package appropriate for a population of seniors and
people with disabilities?
• Can modest changes be made to meet LTC needs?
Financing• How do we deal with cost pressures and demographic change?
• Do we believe the program is too generous or do we need to broaden financing?
• Leveling the playing field between traditional Medicare and Medicare Advantage
Delivery system improvements• How do we adopt evidence-based practices and new technology?
• What are model approaches for integrating care for duals?

Figure 36
Opportunities in Health Reform• Major role for the HIV/AIDS community: There are
significant efforts underway to enact major health reform legislation. Many people want to assume people with disabilities are protected. HIV/AIDS advocates need to fight for a role in the debate.
• Potential to expand Medicaid eligibility: Policy makers are considering options ranging from moving all people into private coverage and eliminating Medicaid to expanding Medicaid to all low-income people without categorical distinctions.
• Need to tell policy makers why Medicaid often works better than private insurance: Policy makers do not understand Medicaid’s unique roles. We must tell the good news story about how Medicaid can be improved, but that it works.