FIELD TESTING AND LOAD RATING REPORT RIDOT#896 NORTH ... · the RIDOT LRFR Guidelines. The main...
94
FIELD TESTING AND LOAD RATING REPORT: RIDOT#896 – NORTH KINGSTOWN, RI SUBMITTED TO: AECOM USA, Inc. 10 Orms Street, Suite 405 Providence RI 0290 www.aecom.com SUBMITTED BY: BRIDGE DIAGNOSTICS, INC. 1965 57 th Court North, Suite 106 Boulder, CO 80301 303.494.3230 www.bridgetest.com November 2009
Transcript of FIELD TESTING AND LOAD RATING REPORT RIDOT#896 NORTH ... · the RIDOT LRFR Guidelines. The main...

FIELD TESTING AND LOAD RATING REPORT: RIDOT#896 – NORTH KINGSTOWN, RI
SUBMITTED TO:
AECOM USA, Inc.
10 Orms Street, Suite 405 Providence RI 0290
www.aecom.com
SUBMITTED BY:
BRIDGE DIAGNOSTICS, INC. 1965 57th Court North, Suite 106
Boulder, CO 80301 303.494.3230
www.bridgetest.com
November 2009
LOAD TESTING AND LOAD RATING REPORT – NORTH KINGSTOWN, RI BRIDGE 896 2
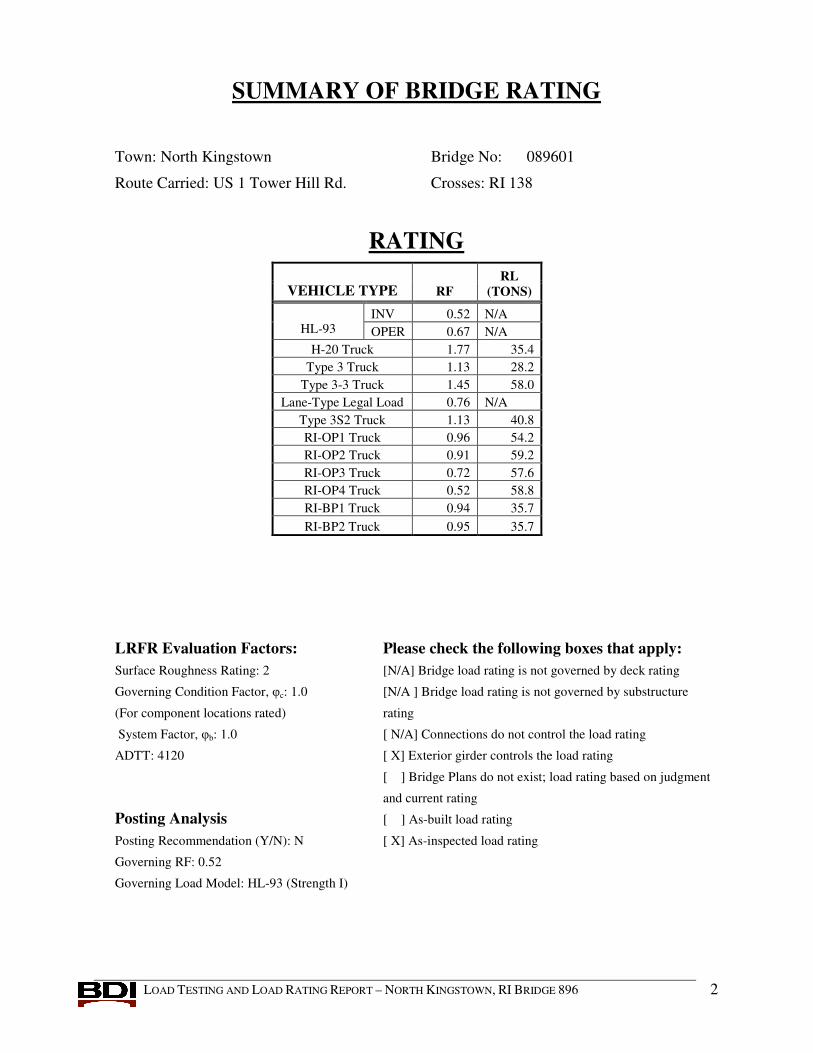
SUMMARY OF BRIDGE RATING
Town: North Kingstown Bridge No: 089601
Route Carried: US 1 Tower Hill Rd. Crosses: RI 138
RATING
VEHICLE TYPE RF RL
(TONS)
INV 0.52 N/A HL-93 OPER 0.67 N/A
H-20 Truck 1.77 35.4 Type 3 Truck 1.13 28.2
Type 3-3 Truck 1.45 58.0 Lane-Type Legal Load 0.76 N/A
Type 3S2 Truck 1.13 40.8 RI-OP1 Truck 0.96 54.2 RI-OP2 Truck 0.91 59.2 RI-OP3 Truck 0.72 57.6 RI-OP4 Truck 0.52 58.8 RI-BP1 Truck 0.94 35.7 RI-BP2 Truck 0.95 35.7
LRFR Evaluation Factors: Please check the following boxes that apply: Surface Roughness Rating: 2 [N/A] Bridge load rating is not governed by deck rating
Governing Condition Factor, c: 1.0 [N/A ] Bridge load rating is not governed by substructure
(For component locations rated) rating
System Factor, b: 1.0 [ N/A] Connections do not control the load rating
ADTT: 4120 [ X] Exterior girder controls the load rating
[ ] Bridge Plans do not exist; load rating based on judgment
and current rating
Posting Analysis [ ] As-built load rating
Posting Recommendation (Y/N): N [ X] As-inspected load rating
Governing RF: 0.52
Governing Load Model: HL-93 (Strength I)
LOAD TESTING AND LOAD RATING REPORT – NORTH KINGSTOWN, RI BRIDGE 896 3
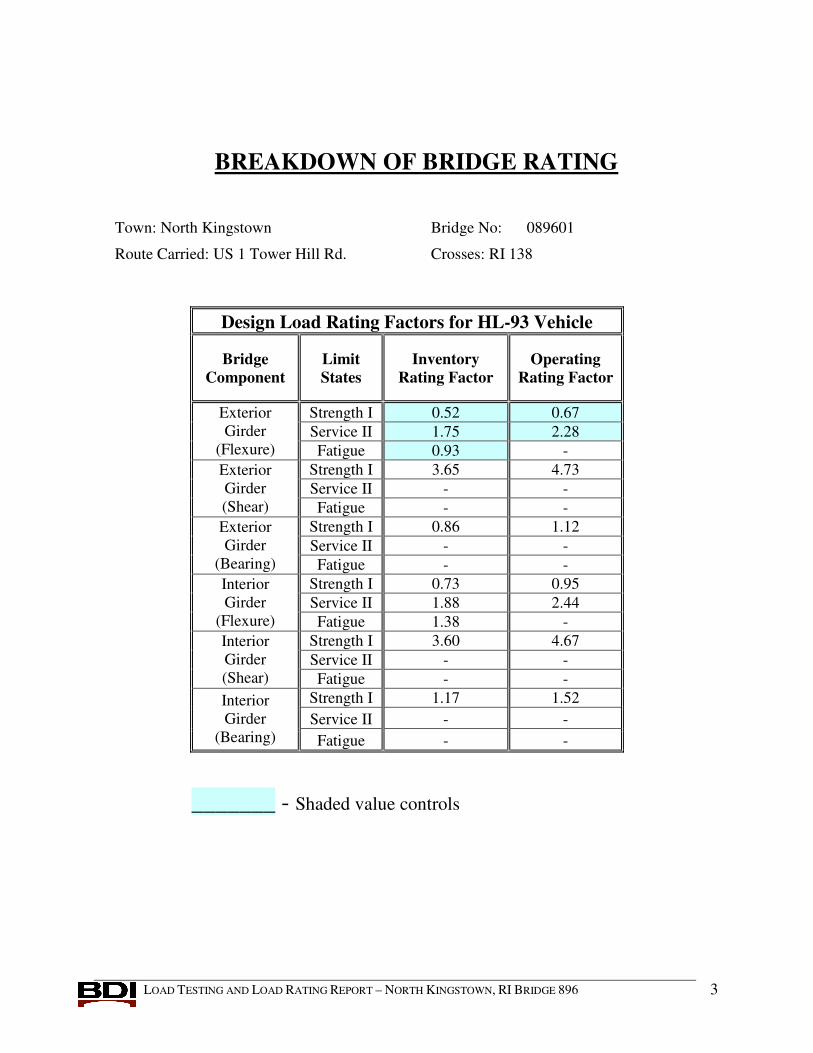
BREAKDOWN OF BRIDGE RATING
Town: North Kingstown Bridge No: 089601
Route Carried: US 1 Tower Hill Rd. Crosses: RI 138
Design Load Rating Factors for HL-93 Vehicle
Bridge Component
Limit States
Inventory Rating Factor
Operating Rating Factor
Strength I 0.52 0.67 Service II 1.75 2.28
Exterior Girder
(Flexure) Fatigue 0.93 - Strength I 3.65 4.73 Service II - -
Exterior Girder (Shear) Fatigue - -
Strength I 0.86 1.12 Service II - -
Exterior Girder
(Bearing) Fatigue - - Strength I 0.73 0.95 Service II 1.88 2.44
Interior Girder
(Flexure) Fatigue 1.38 - Strength I 3.60 4.67 Service II - -
Interior Girder (Shear) Fatigue - -
Strength I 1.17 1.52 Service II - -
Interior Girder
(Bearing) Fatigue - -
_______ - Shaded value controls
LOAD TESTING AND LOAD RATING REPORT – NORTH KINGSTOWN, RI BRIDGE 896 4
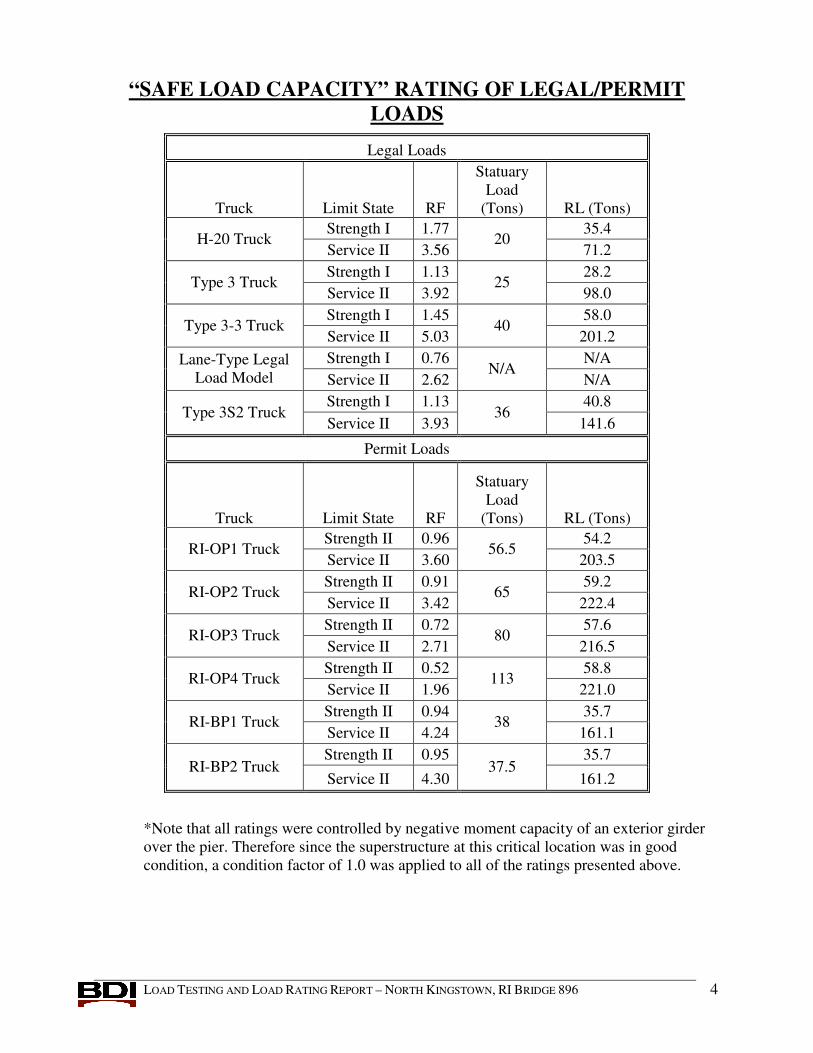
“SAFE LOAD CAPACITY” RATING OF LEGAL/PERMIT LOADS
Legal Loads
Truck Limit State RF
Statuary Load
(Tons) RL (Tons) Strength I 1.77 35.4
H-20 Truck Service II 3.56
20 71.2
Strength I 1.13 28.2 Type 3 Truck
Service II 3.92 25
98.0 Strength I 1.45 58.0
Type 3-3 Truck Service II 5.03
40 201.2
Strength I 0.76 N/A Lane-Type Legal Load Model Service II 2.62
N/A N/A
Strength I 1.13 40.8 Type 3S2 Truck
Service II 3.93 36
141.6
Permit Loads
Truck Limit State RF
Statuary Load
(Tons) RL (Tons) Strength II 0.96 54.2
RI-OP1 Truck Service II 3.60
56.5 203.5
Strength II 0.91 59.2 RI-OP2 Truck
Service II 3.42 65
222.4 Strength II 0.72 57.6
RI-OP3 Truck Service II 2.71
80 216.5
Strength II 0.52 58.8 RI-OP4 Truck
Service II 1.96 113
221.0 Strength II 0.94 35.7
RI-BP1 Truck Service II 4.24
38 161.1
Strength II 0.95 35.7 RI-BP2 Truck
Service II 4.30 37.5
161.2
*Note that all ratings were controlled by negative moment capacity of an exterior girder over the pier. Therefore since the superstructure at this critical location was in good condition, a condition factor of 1.0 was applied to all of the ratings presented above.

LOAD TESTING AND LOAD RATING REPORT – NORTH KINGSTOWN, RI BRIDGE 896 5
EXECUTIVE SUMMARY In July of 2009, Bridge Diagnostics, Inc. (BDI) was contracted by AECOM, Inc. in
coordination with Rhode Island Department of Transportation (RIDOT) to perform live load testing and load rating on RIDOT Bridge #896 in North Kingston, RI. The goal of the live-load testing was to obtain and then utilize field measurements to verify an analytical model from which accurate load ratings could be obtained.
A wireless structural testing system was used for measuring strains at 54 locations on the superstructure while the bridge was subjected to a moving truck load. The response data was then used to “calibrate” an analytical finite element model of the structure which was in turn used to develop load ratings using the AASHTO Load and Resistance Factor Rating (LRFR) approach.
Based on the calibrated model, the structural component that consistently controlled the load rating was the negative moment capacity of the exterior girders over the center pier. The controlling rating factors for the appropriate load conditions are provided in the tables on the previous pages.
A significant increase in live-load capacity was obtained as a result of the load testing and evaluation procedures described in this report. When comparing the “field calibrated” finite element rating factors to those from the previous load ratings (performed by United International Corporation (UIC)), it was found that the allowable loads increased by approximately 100% for the HL-93 design ratings (inventory and operating). The primary reasons for the rating increases were as follows: a more realistic model and load distribution generated by the integrated approach used by BDI; since the condition of the girders at the pier (i.e., the critical rating location) was good and not poor (as the superstructure condition rating indicates) a condition factor of 1.0 was used instead of the 0.85 factor used by UIC; and a riding surface rating of 2 allowed the reduction of the impact factor from 33% to 20% for the legal and permit loads as per the RIDOT LRFR Guidelines.
The main body of this report contains the results relating to the field test procedures, analysis approach, and the development of the load rating factors, while the details used for completing each of these phases are provided in the Appendices.

LOAD TESTING AND LOAD RATING REPORT – NORTH KINGSTOWN, RI BRIDGE 896 6
TABLE OF CONTENTS EXECUTIVE SUMMARY ......................................................................................................................................5
TABLE OF CONTENTS .........................................................................................................................................6
1. STRUCTURAL TESTING PROCEDURES....................................................................................................1
2. PRELIMINARY INVESTIGATION OF TEST RESULTS ...........................................................................9 PRELIMINARY INVESTIGATION OF TEST RESULTS: ...........................................................................................9
3. MODELING, ANALYSIS, AND DATA CORRELATION..........................................................................17 MODEL CALIBRATION RESULTS.....................................................................................................................18
4. LOAD RATING PROCEDURES AND RESULTS.......................................................................................21
5. CONCLUSIONS AND RECOMMENDATIONS ..........................................................................................32
A. APPENDIX A - MEASURED AND COMPUTED STRAIN COMPARISONS .........................................33
B. APPENDIX B – FIELD NOTES (SCANNED)...............................................................................................58
C. APPENDIX C - FIELD TESTING PROCEDURES .....................................................................................68
D. APPENDIX D – EQUIPMENT SPECIFICATIONS.....................................................................................73 SPECIFICATIONS: BDI STRAIN TRANSDUCERS ...............................................................................................73 SPECIFICATIONS: BDI WIRELESS STRUCTURAL TESTING SYSTEM .................................................................74 SPECIFICATIONS: BDI AUTOCLICKER ............................................................................................................75
E. APPENDIX E - MODELING AND ANALYSIS: THE INTEGRATED APPROACH..............................76
F. APPENDIX F - LOAD RATING PROCEDURES ........................................................................................82
APPENDIX I - REFERENCED MATERIAL......................................................................................................88

LOAD TESTING AND LOAD RATING REPORT – NORTH KINGSTOWN, RI BRIDGE 896 1
1. STRUCTURAL TESTING PROCEDURES
Bridge #896 is a 2-span continuous bridge that carries Tower Hill Road over Rhode Island Highway 138 in North Kingston, Rhode Island. The superstructure consists of six wide-flange steel girders continuous over the two spans. Each span is approximately 83.5 feet long and the structure has a roadway width of about 46.8 feet and carries three lanes of northbound traffic. Note that there is an adjacent structure with the same geometry carrying southbound traffic that was not tested. The girders have steel cover plates top and bottom over the pier and on the bottom flange only in the midspan regions. The deck consists of a 7-inch concrete slab with an asphalt wearing surface. Based on the positive moment cover plate configuration and the shear connector specifications in the design plans, it was apparent that the girders were intended to act composite with the deck in positive moment. It was noted that the structure appeared to be good condition except for the bearings and end of girders. Extensive pack and laminar rust was noted at these regions. Note that no in-depth visual inspection was performed by BDI.
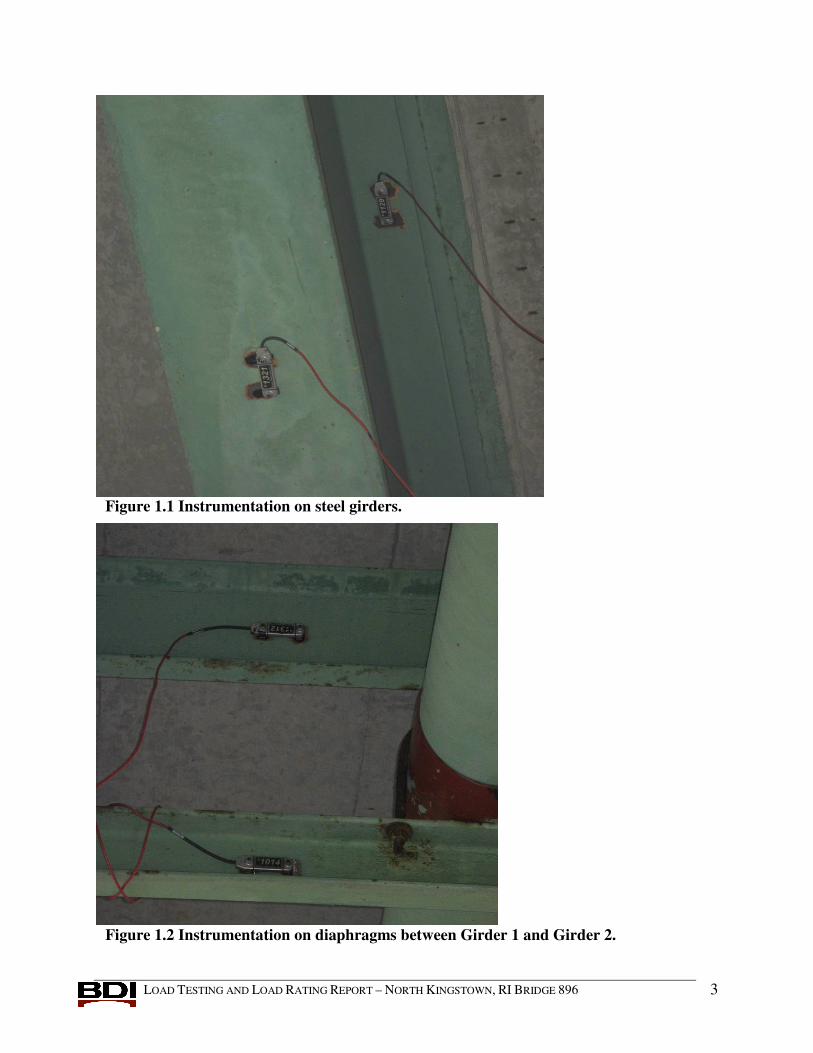
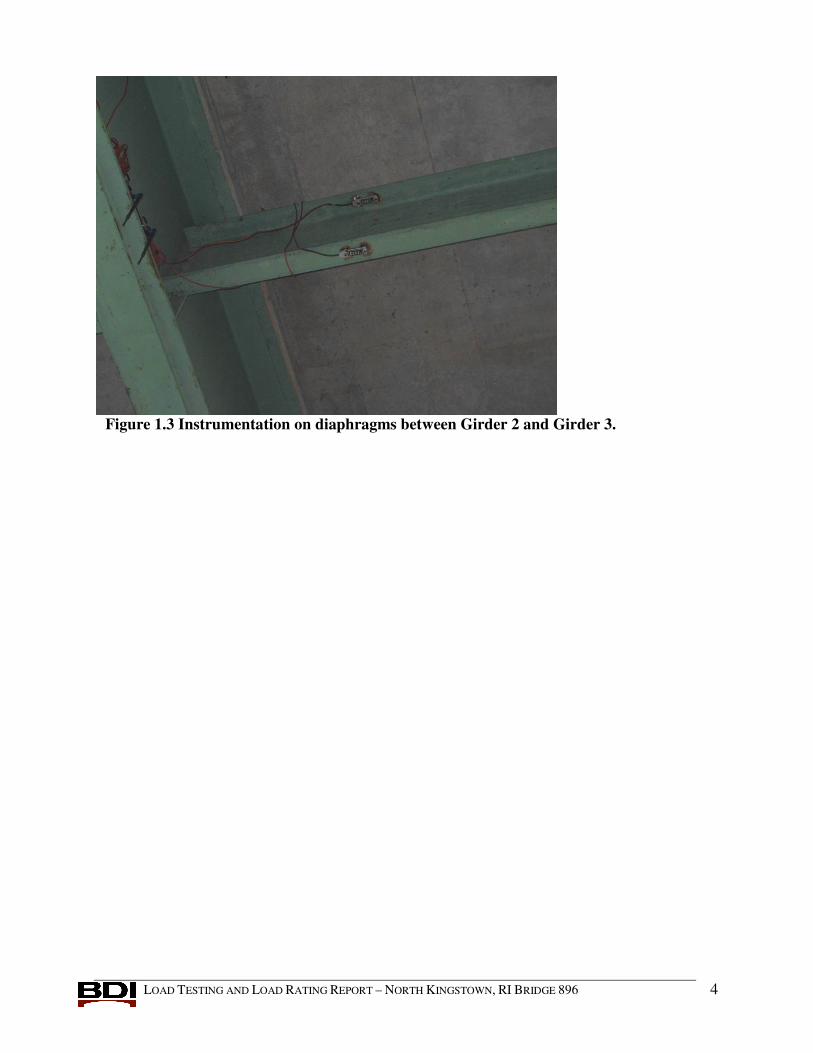
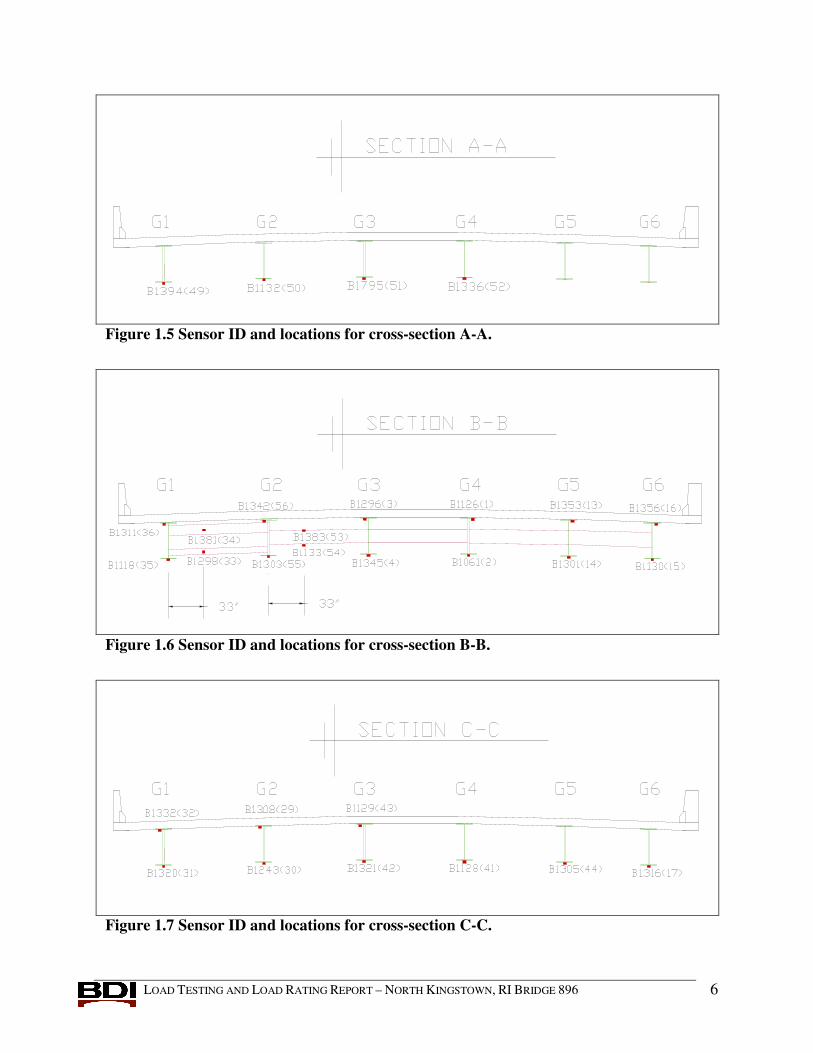
The structure was instrumented with 54 surface-mounted strain transducers as shown in Figure 1.4 through Figure 1.9. Semi-static load tests were performed with a 3-axle dump truck along four lateral load positions. Strain measurements and truck position were recorded continuously at a sample rate of 33 Hz as the test truck was driven across the bridge at approximately 5 mph. One high-speed load test was also performed with the dump truck by recording data at 100 Hz as the truck crossed approximately at approximately 50 mph while centered on the bridge (Y3).
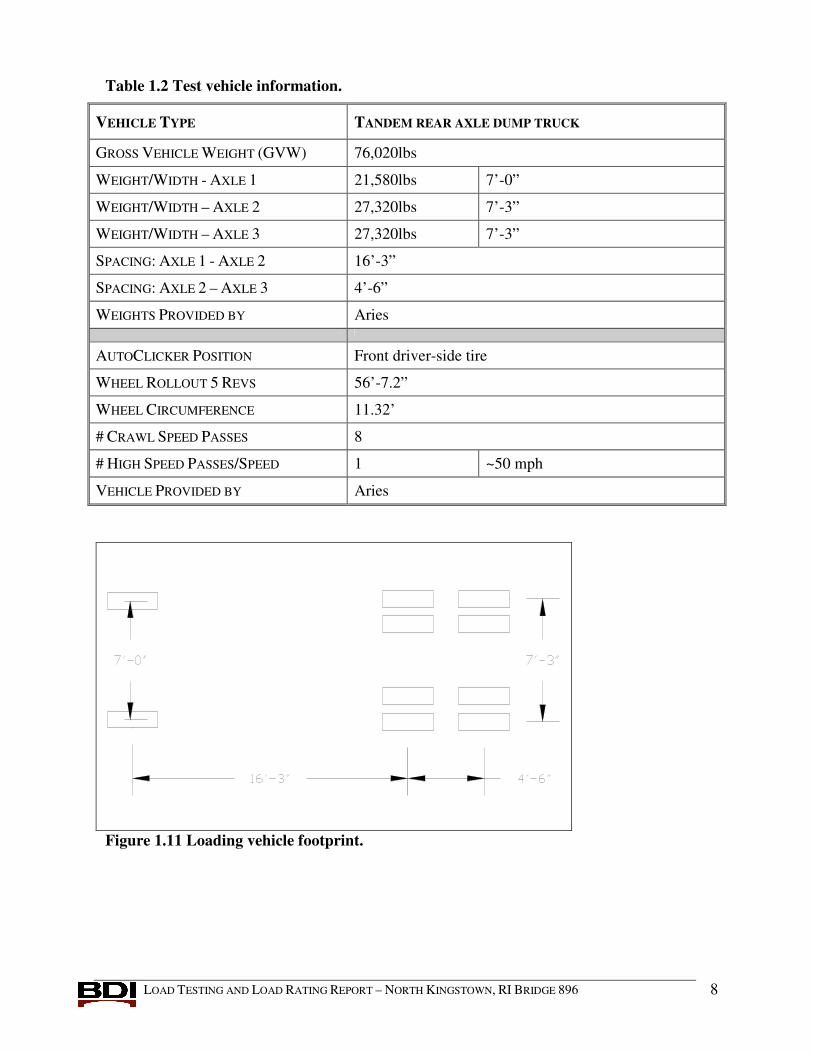
Information specific to this load test can be found in Table 1.1 and the field notes in Appendix B. The test vehicle’s gross weight and a wheel rollout distance (required for position tracking) are provided in Table 1.2. A “footprint” of the vehicle including wheel weights is shown in Figure 1.11. The vehicle axle weights were obtained from the scales at the Holliston Sand Company, Inc.
Please see Appendix C for an outline of the general field testing procedures, and Appendix D for the specifications on the strain transducers and the wireless structural testing system.
Table 1.1 Structure description & testing notes ITEM Description
STRUCTURE NAME Tower Hill Road (US Route 1) over RI 138
BDI Project Number 09-0501RI
TESTING DATE July 14, 2009
CLIENT’S STRUCTURE ID # 896
LOCATION/ROUTE Tower Hill Road (US Route 1) over RI 138
STRUCTURE TYPE 2-Span continuous composite-steel girder, 6 girders total
TOTAL NUMBER OF SPANS 2
SPAN LENGTHS Each Span: 83’-6 1/4” (expansion-fixed-expansion)
SKEW Perpendicular

LOAD TESTING AND LOAD RATING REPORT – NORTH KINGSTOWN, RI BRIDGE 896 2
ITEM Description
STRUCTURE/ROADWAY WIDTHS Structure: 50’-2 3/8” / Roadway: 46’-10”
WEARING SURFACE Asphalt
OTHER STRUCTURE INFO N/A
SPANS TESTED Spans 1 & 2 (from south end)
TEST REFERENCE LOCATION (X=0,Y=0)
Outside southeast corner of structure
TEST VEHICLE DIRECTION North
TEST BEGINNING POINT Front axle at X = -15.66’
LATERAL LOAD POSITIONS Y1 = 10’-10”(D), Y2 = 19’-0”(P), Y3 = 31’-3”(D), Y4 = 43’-4” Measurements to test reference location
NUMBER/TYPE OF SENSORS 54 strain transducers
SAMPLE RATE Crawl Speed Rate: 33 Hz High Speed Rate: 100 Hz
NUMBER OF TEST VEHICLES 1
STRUCTURE ACCESS TYPE Manlift
STRUCTURE ACCESS PROVIDED BY Aries
TRAFFIC CONTROL PROVIDED BY Aries
TOTAL FIELD TESTING TIME 1 Day
FIELD NOTES See Appendix B
ADDITIONAL NDT INFO N/A
TEST FILE INFORMATION FILE NAME LATERAL POSITION FIELD COMMENTS
RI_896_1.dat Y1 Good test.
RI_896_2.dat Y1 Good test.
RI_896_3.dat Y2 Good test.
RI_896_4.dat Y2 1st click truck is backing up ~4” west of Y2 at beginning of test.
RI_896_5.dat Y3 Good test.
RI_896_6.dat Y3 Good test. Actual position ~2” west of Y3.
RI_896_7.dat Y4 Good test.
RI_896_8.dat Y4 Good test.
RI_896_HS_1.dat Y3 Good test. Click 1 before bridge. Click 2 at start line. Click 3 off bridge.
LOAD TESTING AND LOAD RATING REPORT – NORTH KINGSTOWN, RI BRIDGE 896 3
Figure 1.1 Instrumentation on steel girders.
Figure 1.2 Instrumentation on diaphragms between Girder 1 and Girder 2.
LOAD TESTING AND LOAD RATING REPORT – NORTH KINGSTOWN, RI BRIDGE 896 4
Figure 1.3 Instrumentation on diaphragms between Girder 2 and Girder 3.

LOAD TESTING AND LOAD RATING REPORT – NORTH KINGSTOWN, RI BRIDGE 896 5
Figure 1.4 Instrumentation plan with gage locations & truck paths
LOAD TESTING AND LOAD RATING REPORT – NORTH KINGSTOWN, RI BRIDGE 896 6
Figure 1.5 Sensor ID and locations for cross-section A-A.
Figure 1.6 Sensor ID and locations for cross-section B-B.
Figure 1.7 Sensor ID and locations for cross-section C-C.

LOAD TESTING AND LOAD RATING REPORT – NORTH KINGSTOWN, RI BRIDGE 896 7
Figure 1.8 Sensor ID and locations for cross-section D-D.
Figure 1.9 Sensor ID and locations for cross-section E-E.
Figure 1.10 Sensor ID and locations for cross-section F-F.
LOAD TESTING AND LOAD RATING REPORT – NORTH KINGSTOWN, RI BRIDGE 896 8
Table 1.2 Test vehicle information.
VEHICLE TYPE TANDEM REAR AXLE DUMP TRUCK
GROSS VEHICLE WEIGHT (GVW) 76,020lbs
WEIGHT/WIDTH - AXLE 1 21,580lbs 7’-0”
WEIGHT/WIDTH – AXLE 2 27,320lbs 7’-3”
WEIGHT/WIDTH – AXLE 3 27,320lbs 7’-3”
SPACING: AXLE 1 - AXLE 2 16’-3”
SPACING: AXLE 2 – AXLE 3 4’-6”
WEIGHTS PROVIDED BY Aries
AUTOCLICKER POSITION Front driver-side tire
WHEEL ROLLOUT 5 REVS 56’-7.2”
WHEEL CIRCUMFERENCE 11.32’
# CRAWL SPEED PASSES 8
# HIGH SPEED PASSES/SPEED 1 ~50 mph
VEHICLE PROVIDED BY Aries
Figure 1.11 Loading vehicle footprint.

LOAD TESTING AND LOAD RATING REPORT – NORTH KINGSTOWN, RI BRIDGE 896 9
2. PRELIMINARY INVESTIGATION OF TEST RESULTS All of the field data was first examined graphically to determine its quality and to provide a
qualitative assessment of the structure's live-load response. Some of the indicators of data quality included reproducibility between identical truck crossings, elastic behavior (strains returning to zero after truck crossing), and any unusual-shaped responses that might indicate nonlinear behavior or possible gage malfunctions.
In addition to providing a data "quality check", the information obtained during the preliminary investigation was used to determine appropriate modeling procedures and helped establish the direction that the analysis should take. Several representative response histories are provided below to illustrate specific structural behavior. Additional data plots including comparisons with analysis results are provided in Appendix A. .
PRELIMINARY INVESTIGATION OF TEST RESULTS:
• REPRODUCIBILITY AND LINEARITY: Responses from identical truck paths were very reproducible as shown in Figure 2.1. In addition, all strains appeared to be linear with respect to load magnitude (truck position) and all strains returned to zero, indicating that the structure was acting in a linear-elastic manner. Figure 2.1 displays the response history for a mid-span gage on Span 2 for all four lateral (“Y”) positions. All of the strain histories had a similar degree of reproducibility and linearity indicating that the collected data is of good quality.
• CONSISTENT COMPOSITE BEHAVIOR: Measurements taken at midspan of the girders verified the presence of composite behavior between the deck and the girders. The field measured neutral axis locations at midspans range from the upper portion of the girder web to bottom portion of the deck. Figure 2.2 shows the top and bottom flange stresses for Girders 4, 5, and 6 at midspan for truck path Y2. These responses are consistent with composite behavior and a good indication that the shear studs are performing as intended; therefore, all subsequent load rating calculations were based on composite behavior for positive moment.
• PARAPET CONTRIBUTION: As with most bridge that are similar in design, the concrete parapets added a noticeable amount of overall stiffness to the exterior edges of the structure. This was determined by examining the measured exterior girder neutral axis locations which indicated that they were significantly higher than those measured on the interior girders. For example, the N.A location measured from the bottom of Girder 1 (exterior) under the loading of path Y1 was 40.19 inches (i.e., in the bottom potion of the deck), while the N.A location of Girder 3 (interior) under loading of path Y3 was 34.43 inches (i.e., in the upper portion of the girder web). This observation meant that the parapets would need to be including in the analytical model.
• ABUTMENT END RESTRAINT: – Even though the bearings at the abutments were designed to be simple supports that allow expansion and contraction, the responses measured near the abutments indicated that a significant amount of end restraint was present at these locations. This was most likely due to the extensive pack rust at the abutment bearings causing friction between the bottom flange of the girders and the bearing pads. Figure 2.3 shows the response history of gage B1347 (bottom of an interior girder near abutment 1) under the loading of path Y2. This response history shows negative flexure at the cross-section while the truck was still in Span 1. Since the horizontal friction force due to the rust was applied

LOAD TESTING AND LOAD RATING REPORT – NORTH KINGSTOWN, RI BRIDGE 896 10
eccentrically from the girder’s neutral axis, a rotational end-restraint was generated. As shown by the other responses from transducer B1124, the degree of end-restraint appeared to fluctuate from beam to beam and there was evidence that it may have changed with truck position as well. This variation in end-restraint is an indication that slipping occasionally occurred between the beam and the bearing. Therefore, while it will be important to represent this response as well as possible so that the remaining portions of the structure can be accurately modeled, all observed end-restraint should be ignored for the actual load rating calculations.
• LIVE LOAD DISTRIBUTION – The lateral live load distribution of this structure was examined by plotting the midspan bottom flange stress values for all of the girders for all four truck paths. The apparent lateral distribution showed significant symmetry even when considering the truck paths were not perfectly symmetric about the bridge’s cross-section. Figure 2.4 and Figure 2.5 show the lateral strain distribution for Spans 1 and Span 2, respectively. As seen, when the truck was near the parapets, the majority of load was carried by the two girders under the truck (75%-80%) while the farthest girder didn’t respond at all. When the truck was near the center of the bridge (i.e., load paths Y2 and Y3), the majority of the load (75%-80%) was carried by the three girders nearest the truck (paths Y2 and Y3 straddle one girder and have wheel lines near the two adjacent beams). The peak stresses were similar regardless of path, which was an indication that the composite sections near the exterior girders were significantly stiffer than the interior girder section.
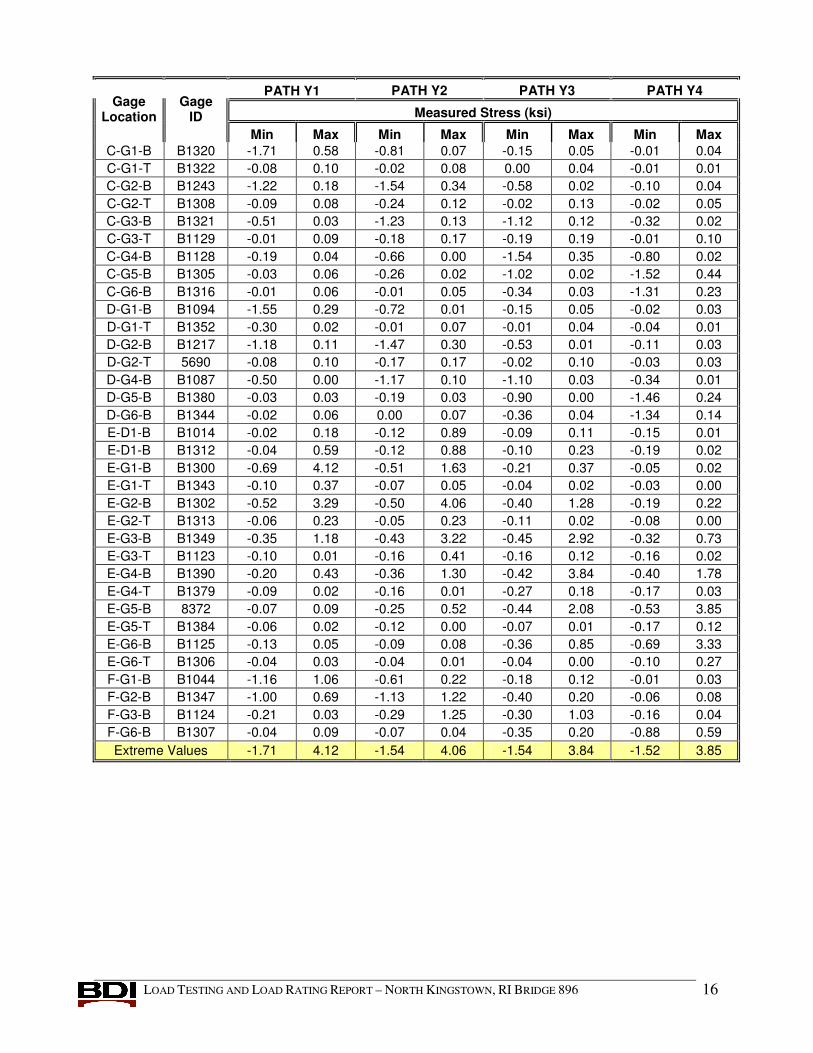
• MAXIMUM LIVE LOAD STRESSES - Table 2.1 provides the minimum and maximum stress values that were recorded at each gage location on the superstructure. The maximum measured stress on the steel girders due to the 76-kip test truck was 4.12 ksi.
• IMPACT/DYNAMIC EFFECTS: Data was recorded from the high-speed truck crossing (~50mph) along Path Y3. A direct comparison of the high- and slow-speed crossings was made to provide a qualitative assessment of the dynamic effects. The intent of this test was not to obtain a field based impact factor, but rather to indicate the extent of conservatism applied by the design code impact factors. It should be noted that a considerable amount of additional testing including different vehicles and vehicle speeds would be required to obtain a realistic impact factor. Figure 2.6 shows the largest midspan stress histories for Girder 4 in Spans 1 and 2. As seen in the figure, both the slow and high-speed responses produced similar peak stress values, but this was not considered to be relevant since there could be slight variations in the truck paths and the static and dynamic responses are often not in phase. Overall, the dynamic component of the stress history was approximately 15% of the static portion of the response which meant that the LRFD specification of 33% for dynamic amplification would be conservative if used in the load rating process. Note that since a riding surface rating of 2 was used as per the RIDOT LRFR Guidelines, an impact factor of 20% was used in the rating of the legal and permit loads.
• STRESS IN DIAPHRAGMS: Load responses in the diaphragms between Girder 1 and Girder 2 and in between Girder 2 and Girder 3 were recorded during testing. Note that due to utilities running in between Girder 1 and Girder 2 along the length of the bridge, there were two steel channel sections functioning as diaphragms in between these girders. This was in contrast to the rest of the bays which had a single larger steel channel diaphragm as illustrated in Figure 1.6 and Figure 1.9. The stresses in the top and bottom diaphragms at midspan of Span 2 between Girder 1 and Girder 2 (truck path Y1) are shown in Figure 2.7. Similarly, the stresses in the top and bottom of the diaphragm, at midspan of Span 2, in between Girder 2

LOAD TESTING AND LOAD RATING REPORT – NORTH KINGSTOWN, RI BRIDGE 896 11
and Girder 3 under the loading of truck path Y1 are shown in Figure 2.8. Note that in both these figures the blue and green responses correspond to the top and bottom gages, respectively. As illustrated in these figures, the diaphragms under direct loading went into tension, as expected, during testing. When the load was positioned on the other side of the bridge (i.e., when diaphragms were under indirect loading), small compression stresses were also observed in the bottom gages. It was noted that all of the stresses in these secondary members recorded during testing were less than 1 ksi which is typical for these types of measurements. Also, while helpful in understanding the secondary stresses in the structure, the diaphragm measurements were not used in the refinement of the “field validated” model due to difficulties in properly modeling the diaphragm connections in the quasi-3D modeling method used.
Figure 2.1 Linear elastic behavior and reproducibility of test results.

LOAD TESTING AND LOAD RATING REPORT – NORTH KINGSTOWN, RI BRIDGE 896 12
Figure 2.2 Example of composite behavior at midspan – Span 2.
Figure 2.3 End restraint at abutments – Interior girder responses near Abutment 1.

LOAD TESTING AND LOAD RATING REPORT – NORTH KINGSTOWN, RI BRIDGE 896 13
Figure 2.4 Lateral load distribution at midspan of Span 1 for all paths.
Figure 2.5 Lateral load distribution at midspan of Span 2 for all paths.

LOAD TESTING AND LOAD RATING REPORT – NORTH KINGSTOWN, RI BRIDGE 896 14
Figure 2.6 Comparison of slow and high-speed responses (impact/dynamic effects)
Figure 2.7 Stresses in top and bottom midspan diaphragms - in between G1 and G2.

LOAD TESTING AND LOAD RATING REPORT – NORTH KINGSTOWN, RI BRIDGE 896 15
Figure 2.8 Stresses in top and bottom of midspan diaphragm - in between G2 and G3.
Table 2.1 Stress envelopes for superstructure sensor locations. PATH Y1 PATH Y2 PATH Y3 PATH Y4
Measured Stress (ksi) Gage
Location Gage
ID Min Max Min Max Min Max Min Max
A-G1-B B1336 -0.02 0.05 -0.21 0.11 -0.60 1.94 -0.32 0.29 A-G2-B B1795 -0.18 0.12 -0.59 0.93 -0.55 0.79 -0.15 0.10 A-G3-B B1132 -0.66 0.95 -0.78 1.67 -0.24 0.15 -0.03 0.03 A-G4-B B1394 -1.71 1.04 -0.81 0.36 -0.17 0.12 -0.04 0.07 B-D1-B B1298 -0.02 0.21 -0.14 0.94 -0.09 0.09 -0.15 0.02 B-D1-T B1381 -0.08 0.96 -0.21 1.32 -0.12 0.25 -0.29 0.04 B-D2-B B1133 -0.02 0.32 -0.03 0.34 -0.22 0.04 -0.10 0.04 B-D2-T B1383 0.00 0.05 -0.15 0.04 -0.12 0.04 -0.01 0.08 B-G1-B B1118 -0.76 3.85 -0.54 1.70 -0.22 0.39 -0.05 0.03 B-G1-T B1311 -0.13 0.70 -0.08 0.11 -0.01 0.01 -0.02 0.02 B-G2-B B1303 -0.52 2.88 -0.52 3.62 -0.37 1.17 -0.15 0.26 B-G2-T B1342 -0.08 0.27 -0.08 0.34 -0.04 0.01 -0.07 0.02 B-G3-B B1061 -0.20 0.47 -0.38 1.27 -0.44 3.72 -0.40 1.87 B-G3-B B1345 -0.37 1.23 -0.49 2.98 -0.47 2.75 -0.29 0.83 B-G3-T B1296 -0.04 0.04 -0.06 0.18 -0.02 0.08 -0.08 0.02 B-G4_T B1126 -0.06 0.01 -0.07 0.00 -0.04 0.15 -0.07 0.02 B-G5-B B1301 -0.08 0.10 -0.24 0.46 -0.43 1.87 -0.49 3.54 B-G5-T B1353 -0.04 0.02 -0.08 0.00 -0.04 0.10 -0.07 0.38 B-G6-B B1130 -0.09 0.06 -0.09 0.08 -0.33 0.75 -0.59 2.78 B-G6-T B1356 -0.02 0.02 -0.02 0.01 -0.03 0.05 -0.11 0.37
LOAD TESTING AND LOAD RATING REPORT – NORTH KINGSTOWN, RI BRIDGE 896 16
PATH Y1 PATH Y2 PATH Y3 PATH Y4
Measured Stress (ksi) Gage
Location Gage
ID Min Max Min Max Min Max Min Max
C-G1-B B1320 -1.71 0.58 -0.81 0.07 -0.15 0.05 -0.01 0.04 C-G1-T B1322 -0.08 0.10 -0.02 0.08 0.00 0.04 -0.01 0.01 C-G2-B B1243 -1.22 0.18 -1.54 0.34 -0.58 0.02 -0.10 0.04 C-G2-T B1308 -0.09 0.08 -0.24 0.12 -0.02 0.13 -0.02 0.05 C-G3-B B1321 -0.51 0.03 -1.23 0.13 -1.12 0.12 -0.32 0.02 C-G3-T B1129 -0.01 0.09 -0.18 0.17 -0.19 0.19 -0.01 0.10 C-G4-B B1128 -0.19 0.04 -0.66 0.00 -1.54 0.35 -0.80 0.02 C-G5-B B1305 -0.03 0.06 -0.26 0.02 -1.02 0.02 -1.52 0.44 C-G6-B B1316 -0.01 0.06 -0.01 0.05 -0.34 0.03 -1.31 0.23 D-G1-B B1094 -1.55 0.29 -0.72 0.01 -0.15 0.05 -0.02 0.03 D-G1-T B1352 -0.30 0.02 -0.01 0.07 -0.01 0.04 -0.04 0.01 D-G2-B B1217 -1.18 0.11 -1.47 0.30 -0.53 0.01 -0.11 0.03 D-G2-T 5690 -0.08 0.10 -0.17 0.17 -0.02 0.10 -0.03 0.03 D-G4-B B1087 -0.50 0.00 -1.17 0.10 -1.10 0.03 -0.34 0.01 D-G5-B B1380 -0.03 0.03 -0.19 0.03 -0.90 0.00 -1.46 0.24 D-G6-B B1344 -0.02 0.06 0.00 0.07 -0.36 0.04 -1.34 0.14 E-D1-B B1014 -0.02 0.18 -0.12 0.89 -0.09 0.11 -0.15 0.01 E-D1-B B1312 -0.04 0.59 -0.12 0.88 -0.10 0.23 -0.19 0.02 E-G1-B B1300 -0.69 4.12 -0.51 1.63 -0.21 0.37 -0.05 0.02 E-G1-T B1343 -0.10 0.37 -0.07 0.05 -0.04 0.02 -0.03 0.00 E-G2-B B1302 -0.52 3.29 -0.50 4.06 -0.40 1.28 -0.19 0.22 E-G2-T B1313 -0.06 0.23 -0.05 0.23 -0.11 0.02 -0.08 0.00 E-G3-B B1349 -0.35 1.18 -0.43 3.22 -0.45 2.92 -0.32 0.73 E-G3-T B1123 -0.10 0.01 -0.16 0.41 -0.16 0.12 -0.16 0.02 E-G4-B B1390 -0.20 0.43 -0.36 1.30 -0.42 3.84 -0.40 1.78 E-G4-T B1379 -0.09 0.02 -0.16 0.01 -0.27 0.18 -0.17 0.03 E-G5-B 8372 -0.07 0.09 -0.25 0.52 -0.44 2.08 -0.53 3.85 E-G5-T B1384 -0.06 0.02 -0.12 0.00 -0.07 0.01 -0.17 0.12 E-G6-B B1125 -0.13 0.05 -0.09 0.08 -0.36 0.85 -0.69 3.33 E-G6-T B1306 -0.04 0.03 -0.04 0.01 -0.04 0.00 -0.10 0.27 F-G1-B B1044 -1.16 1.06 -0.61 0.22 -0.18 0.12 -0.01 0.03 F-G2-B B1347 -1.00 0.69 -1.13 1.22 -0.40 0.20 -0.06 0.08 F-G3-B B1124 -0.21 0.03 -0.29 1.25 -0.30 1.03 -0.16 0.04 F-G6-B B1307 -0.04 0.09 -0.07 0.04 -0.35 0.20 -0.88 0.59 Extreme Values -1.71 4.12 -1.54 4.06 -1.54 3.84 -1.52 3.85

LOAD TESTING AND LOAD RATING REPORT – NORTH KINGSTOWN, RI BRIDGE 896 17
3. MODELING, ANALYSIS, AND DATA CORRELATION Note that all of the information in the Preliminary Investigation of Test Results section was
determined by simply viewing the field data and was used by an engineer to help generate a representative finite element model as seen below in Figure 3.1. Details regarding the structure model and analysis procedures are provided in Table 3.1.
Figure 3.1 Finite element model of superstructure and substructure.
Once the model was developed, the load testing procedures were essentially "reproduced" on
a PC using BDI WinSAC structural analysis and correlation software. A two-dimensional "footprint" of the loading vehicle was applied to the model along the same paths that the actual test vehicle crossed the bridge. A direct comparison of strain values was then made between the analytical predictions and the experimentally-measured results. The initial model was then "calibrated" by modifying various properties and boundary conditions until the results matched those measured in the field. A complete outline of this process is provided in Appendix G.
The goal of the finite element analysis was to obtain a model that could simulate the structural responses obtained during the load test and then provide a basis for load rating standard design and rating loads. An iterative process of response comparison and model calibration was done until an acceptable match was obtained. The process of model calibration included identification of various aspects of the structural behavior such as the effective lateral stiffness, continuity of the concrete deck and parapets over the piers, effective end-restraint and general consistency of behavior at various points. The primary limitation in the analysis was that it was linear-elastic. Fortunately bridge structures are generally linear-elastic up to the Operating limit, which is well beyond the design loads.
In this case, the majority of the model calibration effort was spent in simulating the support conditions at the abutments and at the continuous sections over the pier. A primary concern was to determine how much end-restraint was generated by the expansion joint girder bearings. The horizontal resistance of the pier also had a significant influence on the response histories for the strains measured near the pier. Accurately simulating the lateral load distribution provided by the concrete deck and the steel diaphragms was another significant effort along with reproducing the edge stiffness provided by the concrete parapets.

LOAD TESTING AND LOAD RATING REPORT – NORTH KINGSTOWN, RI BRIDGE 896 18
Table 3.1 Analysis and model details. ANALYSIS TYPE - Linear-elastic finite element - stiffness method. MODEL GEOMETRY - 3D composed of shell elements, frame elements, and springs. NODAL LOCATIONS - Nodes placed at all bearing locations.
- Nodes at all four corners of each plate element and ends of each frame element.
MODEL COMPONENTS - Plates for all slab elements. - Frame elements for girders, diaphragms, and parapets. - Eccentric translational springs at abutment and pier bearing
locations. LIVE-LOAD - 2-D footprint of test truck consisting of 10 vertical point loads.
Truck paths simulated by series of load cases with truck moving at 3 ft increments.
DEAD-LOAD - Self-weight of structure - 36 psf for asphalt wearing surface
TOTAL NUMBER OF STRAIN COMPARISONS
- 48 measurement locations x 156 load positions = 7488 Strain Comparisons
MODEL STATISTICS - 3648 Nodes - 4650 Elements - 19 Cross-section/Material types - 156 Load Cases - 48 Gage locations
ADJUSTABLE PARAMETERS FOR MODEL CALIBRATION
1. Young’s Modulus: Slab, Slab over pier, Parapets, Parapets over pier (E) 2. Translational springs at abutment and pier supports (Fx)
MODEL CALIBRATION RESULTS
Various stiffness parameters were modified to obtain the best possible match between the measured and computed responses. In this case, the model was calibrated based on strain measurements only. The goal of the calibration was to be able to accurately match the response value at every gage location for every load condition since the ability of the model to match the minor load responses is just as important as matching the maximum values. This would ensure the model had the same load transfer characteristics as the real structure. The optimization process relied on an engineer’s ability to determine what stiffness values might be different than what was initially assumed and to define reasonable upper and lower limits for each variable. This process entailed visual examination of the response comparison histories and determining what structural parameters would influence the response behavior so as to obtain a better correlation. An optimization algorithm built into the WinSAC analysis program automated the iterations so as to obtain the stiffness values that provide the best solution. There were many manual-iterations required to determine the correct set of properties to adjust and it was a function of the complexity of the structure. The following outline describes what stiffness parameters were adjusted along with discussions on their effects on the overall structural performance. Following the optimization procedures, the model produced a 0.965 correlation coefficient, which can be considered a good match for this structure considering the non-linear

LOAD TESTING AND LOAD RATING REPORT – NORTH KINGSTOWN, RI BRIDGE 896 19
variations near the abutments. The parameter and model accuracy values used in the initial model and obtained for the final model are provided in Table 3.2. See Appendix G for a description of each error value.
Table 3.2 Model accuracy & parameter values.
MODELING PARAMETER INITIAL MODEL VALUE
FINAL MODEL VALUE
1. Abutment Details - Abutment Interior Girder Spring Fx [kip/in] - Abutment Exterior Girder Spring Fx [kip/in]
0 0
1204 1962
2. Pier Details - Pier Spring Fx [kip/in]
0
300
4. Deck Details - Slab Stiffness E [ksi] - Slab Stiffness over pier E [ksi]
3,200 3,200
4,800 171.9
5. Girder Eccentricities - Exterior Girders ecc [in] - Interior Girders ecc [in]
22.5 22.5
22.5 23.5
6. Parapet Details - Parapet Stiffness E [ksi] - Parapet Stiffness over pier E [ksi]
3,200 3,200
4,888 189.6
ERROR PARAMETERS INITIAL MODEL VALUE
FINAL MODEL VALUE
Absolute Error 26,349.4 15,047.2
Percent Error 34.8% 7.5%
Scale Error 7.5% 2.2%
Correlation Coefficient 0.9034 0.9650
• Deck stiffness: Modeling of R/C elements must take into account the variability of properties such as crack quantity and density, depth of rebar, actual strength of concrete, etc. As a result, the stiffness properties are the “effective properties”, and may not be the “actual” material properties. For example, Young’s Modulus of the deck concrete was probably in the range of 4,000 ksi, but due to the presence of an asphalt wearing surface and the possibility of a slightly thicker deck than modeled (7”), an “effective” modulus of 4,800 ksi was obtained. Due to the nature of the optimization process, the “effective modulus” can compensate for any dimensional errors or any other factors that might alter the overall stiffness.

LOAD TESTING AND LOAD RATING REPORT – NORTH KINGSTOWN, RI BRIDGE 896 20
The deck stiffness directly over the pier reduced to a very low modulus indicating the presence of cracks in the deck. The negligible stiffness of the shell elements over the pier essentially simulated a non-composite condition, which corresponds to the intended design.
• Parapet stiffness: The resulting parapet modulus was also substantially higher than the original value. This is a result of inexact modeling of the curb and guardrail detail and their effect on the overall stiffness of the bridge. The “effective” stiffness was higher than the original value to help improve the midspan lateral distribution and increase exterior girder stiffness. The section of parapet directly over pier reduced to essentially zero stiffness indicating either a contraction joint was present at the pier or the parapet had cracked at the peak negative moment location.
• Abutment Supports: As with all “simply supported structures”, this bridge had a measurable amount of end-restraint at the abutments. In this case, end-restraint was caused by friction between the girders’ bottom flanges and the bearing pads. To represent this reaction, an eccentric translational spring was inserted into the model. Since the horizontal reaction has a vertical offset from the girder neutral axis locations, moment restraint is generated at the ends of the girders which was verified through the load test measurements. The degree of end-restraint varied from beam to beam. In general the exterior beams had greater resistance, probably as a result of the wing walls attached to the abutment walls. Comparisons between the model and the load test results also indicated the friction resistance was non-linear and likely a function of the vertical force on the bearings. In general, the resistance appeared to increase when the truck was directly over the bearings and was less or non-existent when the truck was further away from the bearing. The resulting values therefore provided a reasonable average value. The need to represent these values was to improve the ability to evaluate other structural parameters. For example it was necessary to not have the beam stiffness increase to compensate for the presence of end-restraint. While the presence of end-restraint was verified and reasonably well defined, it should be eliminated from the load rating model since it would not be a reliable value.
• Pier Supports: The degree of horizontal stiffness provided by the piers could be determined by comparing the relative magnitudes in negative moment near the piers as the truck traveled from one span to the other. The resulting pier stiffness that provided the best response comparisons near the pier was an Fx value of 300 kip/in given to each girder. This value was comparable to the theoretical restraint provided by the three RC columns at the pier (using K = 12EI/L3). This stiffness predicted strains near midspan and piers, but did not predict the strain responses near the abutments well. It was possible to get a better prediction of the strain responses near the abutments (and a better correlation) by increasing the end restraint at the pier; however this was at the expense of the model’s accuracy in predicting strain responses at both the midspan and pier locations.
• Girder Eccentricities: The design haunch depth for bridge 896 is two inches. The interior girder eccentricities were changed to account for the possibility of a larger actual haunch depth. It was found that the interior girder strain responses at midspan were better modeled assuming a three inch haunch. The exterior girder eccentricities were not changed in order to better model their interaction between the overhang slab (which has a 9” depth), and instead the increase in parapet stiffness was used to optimized the composite exterior girder section stiffness.

LOAD TESTING AND LOAD RATING REPORT – NORTH KINGSTOWN, RI BRIDGE 896 21
4. LOAD RATING PROCEDURES AND RESULTS The goal of producing an accurate model was to predict the structure's actual live load
behavior when subjected to design or rating loads. This approach is essentially identical to standard load rating procedures except that a "field verified" model is used instead of a typical girder analysis combined with load distribution factors. Please see Appendix F for a detailed outline of the load rating procedures.
Once the finite element model has been calibrated to field conditions, engineering judgment must be used to address any optimized parameters that may change over time or that may be unreliable with heavy loads or future damage. In this case, the final optimized values that were considered unreliable for load rating purposes were the following:
• Support conditions: The horizontal resistance of the abutment springs was removed from the model. The abutment springs were removed because their resistance was mostly due to friction caused by the extensive pack rust. Since this friction would be highly variable, it could not be relied upon for rating purposes. The horizontal resistance of the pier springs, however, was not removed from the model as they were representative of the translational resistance of the R/C columns at the pier.
• Deck and Curb Stiffnesses: The Young’s Modulus of the deck and parapet was reduced to 4000 ksi to further ensure a conservative rating. Future cracking in the deck, as well as the removal of the asphalt wearing surface, could reduce the present stiffness value. Likewise, any future damage to the parapet has the potential to decrease its stiffness contribution as well.
The interior girder eccentricities, modeling a 3 inch haunch depth, were kept in the load rating model. Even though actual haunch depths were not measured in the field, it was decided that this haunch depth was a reliable assumption given the “field verified” model results.
An important point to make at this stage is that running a live load test without performing an analysis would not allow the engineer to understand what measurements were different than expected. For example, stresses at midspan can be easily recorded, but only through quantifying values like deck stiffness and end-restraints can it be understood why the measurements are those particular values. This is especially important with data abnormalities and irregularities such as seen in the inconsistent nonlinear end restraint at the abutments.
Capacities were calculated using the AASHTO LRFD Bridge Design Specifications 3rd Edition- 2004 (with 2005 & 2006 Interims). Plans for the original structure, as well as a structural evaluation report, were provided by AECOM. Based on the age of the structure, information provided by AECOM, and steel properties given in the eighth edition of the AISC Steel Construction Manual, the A441 structural steel yield strengths were taken to be 50 ksi for the W-sections and 46 ksi for the cover plates. The concrete was conservatively assumed to have a compressive strength of 3 ksi, which was the design strength denoted in the bridge plans. These material values should be verified with previous load ratings and bridge data as they are the key factors on the member capacity calculations and have a significant impact on the resulting load ratings. Table 4.1 through Table 4.4 summarize the basic variables used for calculations, and contain the calculated capacities used for rating the superstructure. Positive moment capacities of the different girder sections were based on composite behavior while the reinforcing steel in the deck was neglected in the negative moment capacity calculations. The
LOAD TESTING AND LOAD RATING REPORT – NORTH KINGSTOWN, RI BRIDGE 896 22
critical bearing capacity at the interior pier was calculated based on resistance provided by the vertical bearing stiffeners at this location according to LRFD 6.10.11.2.
In order to get a realistic value of dead load in the critical sections of the superstructure it was necessary to create two additional models. In the first model, the rating model was altered to model the non- composite dead load effects (i.e., girder, diaphragm, slab and haunch weights to the time of the pouring of the deck). The second model contained the composite dead load effects (i.e., parapet and asphalt weight after the deck was composite with the steel girders). In the composite dead load model, the weights of the girders, diaphragms, slab and haunch were set to zero. Therefore the dead load effects modeled were only that applied to the composite section (A 70 lb/ft2 was applied in the roadway width for the 6” asphalt wearing surface). In order to model the non-composite dead load at the time of the pouring of the deck: the parapets and wearing surface were removed; the deck stiffness was set to a very low value while the self-weight of the slab was set to zero; the dead load of the slab and haunch were applied to the interior and exterior girders as line loads, and the eccentricities of the girders were set to zero. With the use of both these models, the total dead load at the critical locations was determined.
Load ratings were performed on the revised calibrated model according to AASHTO LRFR methods (see Table 4.5 for load factors and impact factors corresponding to the applicable limit states). Note that the live-load factors for the legal and permit loads were based on a conservative ADTT of 5000. This was because the value given in the 2008 inspection report of 4120 was based on data measured in 2006. An impact factor of 20 percent was applied to all live-load responses with the expectation of the HL-93 loading. An impact factor of 15% was used for HL-93 Fatigue loading while an impact factor of 33% was used for the rest of the HL-93 loading cases. The impact factor of 20% was used since the riding surface rating of 2 was chosen as per the RIDOT LRFR guidelines. Note that a simplified dynamic test was performed in the field that yielded an impact factor of approximately 15%. While the single high-speed crossing was insufficient to define an actual dynamic amplification, it was performed to ensure that the impact factor used was reasonable and conservative.
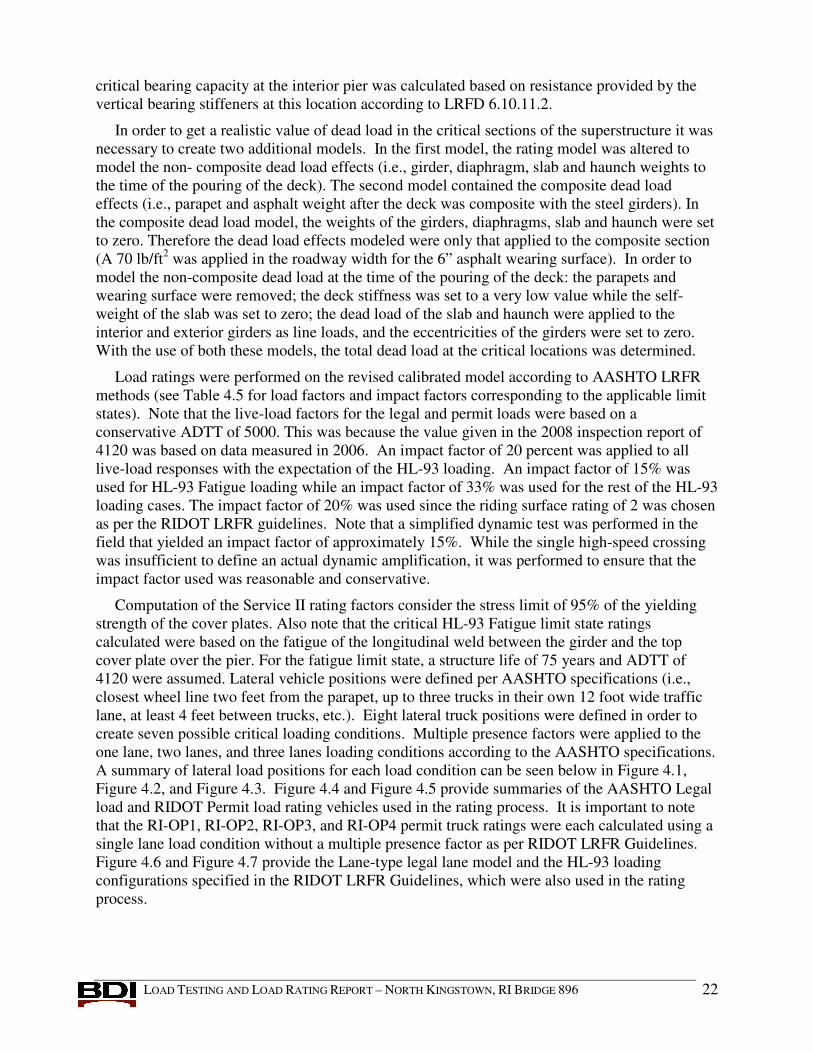
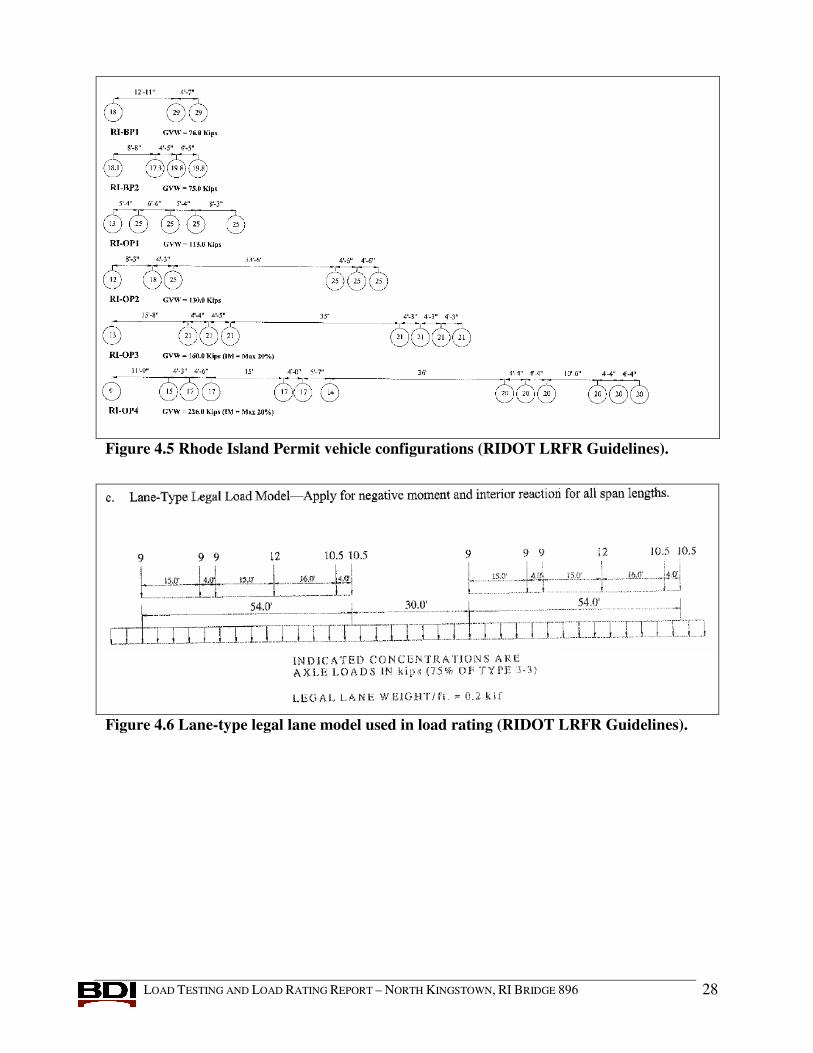
Computation of the Service II rating factors consider the stress limit of 95% of the yielding strength of the cover plates. Also note that the critical HL-93 Fatigue limit state ratings calculated were based on the fatigue of the longitudinal weld between the girder and the top cover plate over the pier. For the fatigue limit state, a structure life of 75 years and ADTT of 4120 were assumed. Lateral vehicle positions were defined per AASHTO specifications (i.e., closest wheel line two feet from the parapet, up to three trucks in their own 12 foot wide traffic lane, at least 4 feet between trucks, etc.). Eight lateral truck positions were defined in order to create seven possible critical loading conditions. Multiple presence factors were applied to the one lane, two lanes, and three lanes loading conditions according to the AASHTO specifications. A summary of lateral load positions for each load condition can be seen below in Figure 4.1, Figure 4.2, and Figure 4.3. Figure 4.4 and Figure 4.5 provide summaries of the AASHTO Legal load and RIDOT Permit load rating vehicles used in the rating process. It is important to note that the RI-OP1, RI-OP2, RI-OP3, and RI-OP4 permit truck ratings were each calculated using a single lane load condition without a multiple presence factor as per RIDOT LRFR Guidelines. Figure 4.6 and Figure 4.7 provide the Lane-type legal lane model and the HL-93 loading configurations specified in the RIDOT LRFR Guidelines, which were also used in the rating process.

LOAD TESTING AND LOAD RATING REPORT – NORTH KINGSTOWN, RI BRIDGE 896 23
Table 4.1 Bearing resistance at pier (b(Rsb)n, kips).
Member Area of projecting elements, Apn (in2)
Yield Strength, Fy (ksi)
Factored Bearing Resistance (kips)
Bearing Stiffeners At Pier 7.18 46 462.4
Table 4.2 Girder shear capacity (Vn, kips).
Member
Web Width, b_web
(in)
Web Height, h_web
(in)
Yield Strength, Fy (ksi)
Determined Cv
Factored Shear
Capacity (kips)
Girder All sections 0.6 32.125 50 1.0 578.25
Table 4.3 Girder positive moment capacities (Mn, k-in).
Member Yield
Strength, Fy (ksi)
Effective Deck
Width, E (in)
N.A distance,
ybar_bott (in)
Section Modulus,
S (in3)
Factored Moment Capacity (kip-in)
Girder
(No Cover Plate)
(+) 50 90 32.69 660 33,112
Girder at Midspan
(Bottom Cover Plate)
(+) 46/50 90 31.96 871 40,607
Girder over Pier
(Top/Bottom Cover Plates)
(+) N/A N/A N/A N/A N/A
Table 4.4 Girder negative moment capacities (Mn, k-in).
Member Yield
Strength, Fy (ksi)
Section Modulus,
S (in3)
Unbraced Length, Lb (in)
Factored Moment Capacity (kip-in)
Girder (No Cover Plate)
(-) 50 439 273.125 17,158
Girder at Midspan (Bottom Cover Plate)
(-) N/A N/A N/A N/A
Girder over Pier (Top/Bottom Cover Plates)
(-) 46 1046 273.125 37,029

LOAD TESTING AND LOAD RATING REPORT – NORTH KINGSTOWN, RI BRIDGE 896 24
Table 4.5 Applied load and impact factors.
LIMIT STATE DESCRIPTION LOAD/IMPACT
FACTOR
DC (Structural Component) 1.25 DW (Field-Verified Wearing Surface) 1.25 LL (Design Load - Inventory Level) 1.75 LL (Design Load - Operating Level) 1.35
LL (Legal Loads) 1.8 Design Load Impact Factor 33%
Strength I
Legal Load Impact Factor 20% DC (Structural Component) 1.25
DW (Field-Verified Wearing Surface) 1.25 LL (Single Trip Permit) 1.5 LL (Blanket Permit) 1.8
Impact Factor (<150kips) 20%
Strength II
Impact Factor (>150 Kips) 20% DC (Structural Component) 1 DW (Wearing Surface) 1 LL INV / LEGAL LOADS 1.3 LL OPER / PERMIT LOADS 1.0
Service II
Impact Factor 20% Dead Load (Structural Component) 0
Dead Load (Wearing Surface) 0 Live Load 0.75
Fatigue
Impact Factor 15%

LOAD TESTING AND LOAD RATING REPORT – NORTH KINGSTOWN, RI BRIDGE 896 25
Figure 4.1 One lane loaded truck positions.
Figure 4.2 Two lanes loaded truck positions.

LOAD TESTING AND LOAD RATING REPORT – NORTH KINGSTOWN, RI BRIDGE 896 26
Figure 4.3 Three lanes loaded truck positions.

LOAD TESTING AND LOAD RATING REPORT – NORTH KINGSTOWN, RI BRIDGE 896 27
Figure 4.4 AASHTO Design Live load truck configurations.
LOAD TESTING AND LOAD RATING REPORT – NORTH KINGSTOWN, RI BRIDGE 896 28
Figure 4.5 Rhode Island Permit vehicle configurations (RIDOT LRFR Guidelines).
Figure 4.6 Lane-type legal lane model used in load rating (RIDOT LRFR Guidelines).
LOAD TESTING AND LOAD RATING REPORT – NORTH KINGSTOWN, RI BRIDGE 896 29
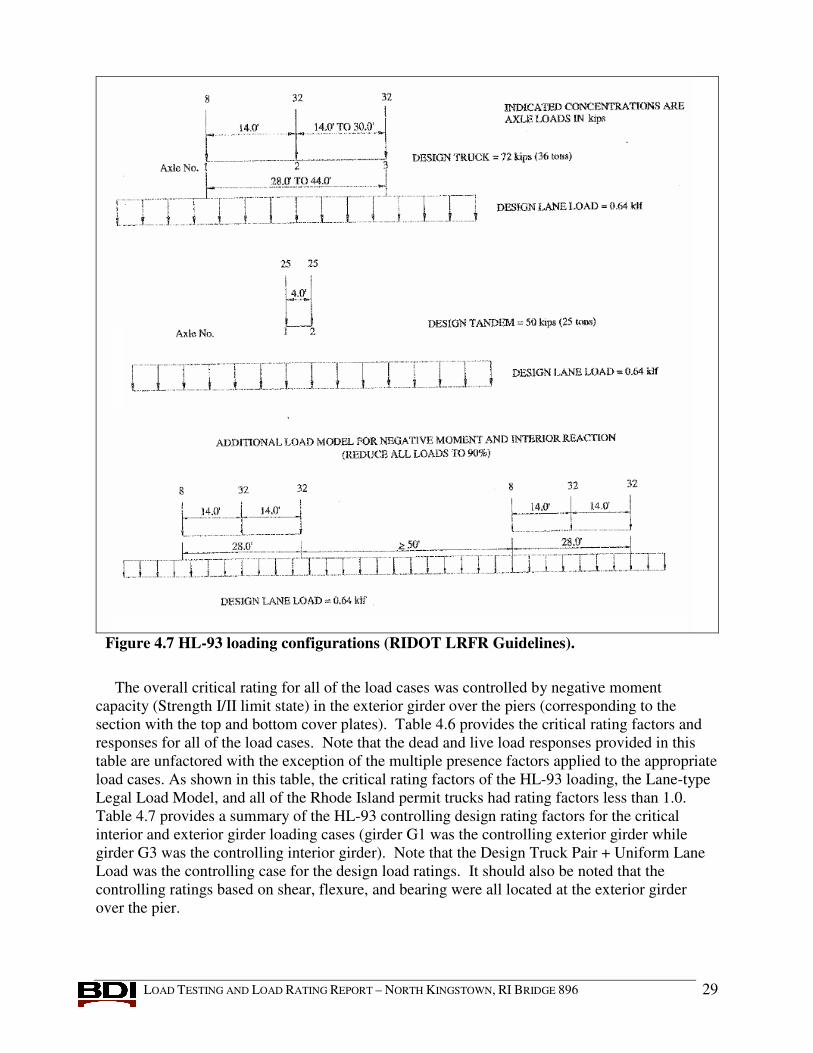
Figure 4.7 HL-93 loading configurations (RIDOT LRFR Guidelines).
The overall critical rating for all of the load cases was controlled by negative moment
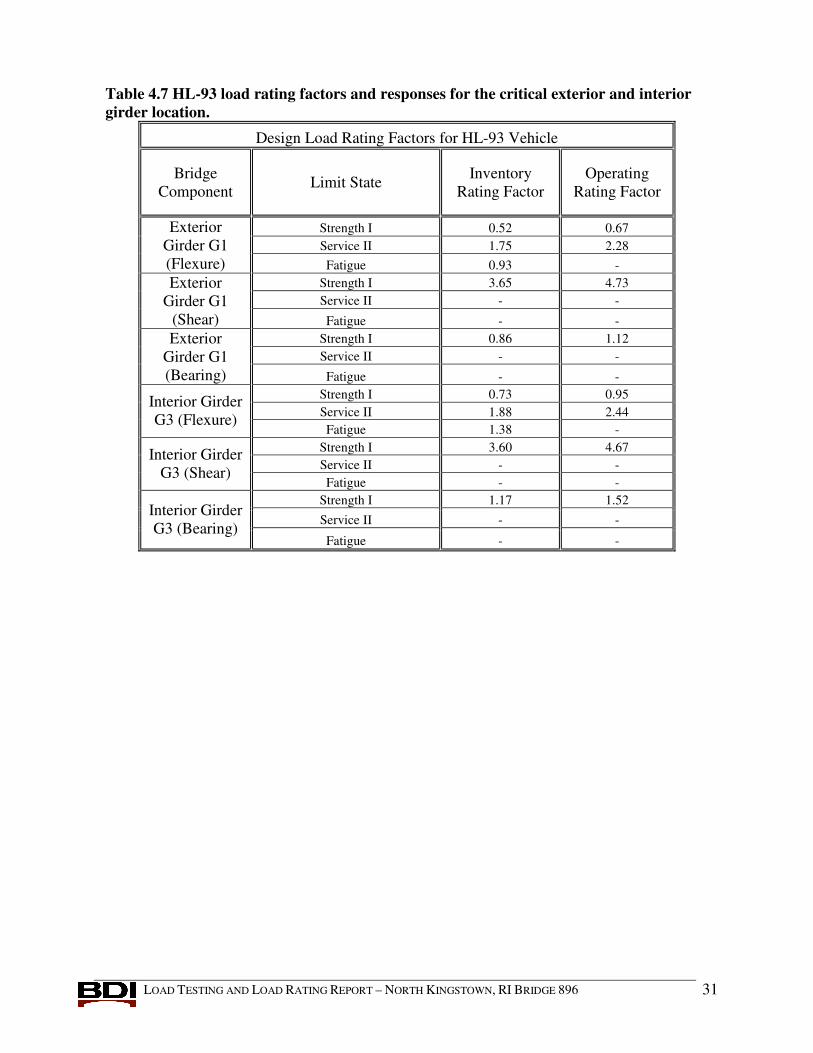
capacity (Strength I/II limit state) in the exterior girder over the piers (corresponding to the section with the top and bottom cover plates). Table 4.6 provides the critical rating factors and responses for all of the load cases. Note that the dead and live load responses provided in this table are unfactored with the exception of the multiple presence factors applied to the appropriate load cases. As shown in this table, the critical rating factors of the HL-93 loading, the Lane-type Legal Load Model, and all of the Rhode Island permit trucks had rating factors less than 1.0. Table 4.7 provides a summary of the HL-93 controlling design rating factors for the critical interior and exterior girder loading cases (girder G1 was the controlling exterior girder while girder G3 was the controlling interior girder). Note that the Design Truck Pair + Uniform Lane Load was the controlling case for the design load ratings. It should also be noted that the controlling ratings based on shear, flexure, and bearing were all located at the exterior girder over the pier.

LOAD TESTING AND LOAD RATING REPORT – NORTH KINGSTOWN, RI BRIDGE 896 30
Table 4.6 Critical load rating factors and responses for applied load conditions.
Live Load Response*
Dead Load Response*
Loading Case Critical Case/Location
Critical Rating Factor (kip-in) (kip-in)
HL-93 Loading Inventory
Negative Moment/ Exterior Girder over pier 0.52
HL-93 Loading Operating
Negative Moment/ Exterior Girder over pier 0.67
Truck/Lane -7307.09/-
653.24 -22071
H-20 Truck Negative Moment/
Exterior Girder over pier 1.77 -2472.26 -22071
Type 3 Truck Negative Moment/
Exterior Girder over pier 1.13 -3868.28 -22071
Type 3-3 Truck Negative Moment/
Exterior Girder over pier 1.45 -3014.06 -22071 Lane-Type Legal
Load Model Negative Moment/
Exterior Girder over pier 0.76 -5788.39 -22071
Type 3S2 Truck Negative Moment/
Exterior Girder over pier 1.13 -3852.85 -22071
RI-OP1 Truck Negative Moment/
Exterior Girder over pier 0.96 -5471.59 -22071
RI-OP2 Truck Negative Moment/
Exterior Girder over pier 0.91 -5759.15 -22071
RI-OP3 Truck Negative Moment/
Exterior Girder over pier 0.72 7282.87 -22071
RI-OP4 Truck Negative Moment/
Exterior Girder over pier 0.52 -10078.03 -22071
RI-BP1 Truck Negative Moment/
Exterior Girder over pier 0.94 -4647.69 -22071
RI-BP2 Truck Negative Moment/
Exterior Girder over pier 0.95 -4585.38 -22071 * Both the Live Load and Dead Load Responses are the non-factored responses (Multiple presence factor applied before loading if applicable).
LOAD TESTING AND LOAD RATING REPORT – NORTH KINGSTOWN, RI BRIDGE 896 31
Table 4.7 HL-93 load rating factors and responses for the critical exterior and interior girder location.
Design Load Rating Factors for HL-93 Vehicle
Bridge Component Limit State Inventory
Rating Factor Operating
Rating Factor
Strength I 0.52 0.67 Service II 1.75 2.28
Exterior Girder G1 (Flexure) Fatigue 0.93 -
Strength I 3.65 4.73 Service II - -
Exterior Girder G1
(Shear) Fatigue - - Strength I 0.86 1.12 Service II - -
Exterior Girder G1 (Bearing) Fatigue - -
Strength I 0.73 0.95 Service II 1.88 2.44
Interior Girder G3 (Flexure)
Fatigue 1.38 - Strength I 3.60 4.67 Service II - -
Interior Girder G3 (Shear)
Fatigue - - Strength I 1.17 1.52 Service II - -
Interior Girder G3 (Bearing)
Fatigue - -
LOAD TESTING AND LOAD RATING REPORT – NORTH KINGSTOWN, RI BRIDGE 896 32
5. CONCLUSIONS AND RECOMMENDATIONS Examination of the load test data indicated that the live load responses were typical of a steel
girder structure. It was apparent that the measurements were of good quality and there were no equipment or sensor malfunctions. The majority of the structural responses appeared to be linear-elastic and a high level of symmetry was observed. The only measurable non-linear behavior in the collected data was due to the end-restraint at the abutments which was most likely caused by friction between the girders’ bottom flange and bearing plates due to the extensive pack rust found in these areas. Although this end-restraint was always present and it has the effect of decreasing positive moment near midspan, it was not considered reliable enough to use in the load rating process.
Load rating results from the field-verified model indicated that RIDOT Bridge #896 had sufficient live-load capacity for all of the standard AASHTO rating vehicles. The HL-93 design loading, the Lane-type Legal Load Model, and all of the Rhode Island permit trucks had rating factors less than 1.0. The results were controlled by the strength limit state of exterior girder G1 over the pier under edge loadings (either one or two lanes loaded condition depending on whether or not multiple lane loadings were applicable). The results provided about a 100% increase in HL-93 design rating factors over the previous load ratings (performed by United International Corporation). The primary reasons for the rating increases were as follows: a more realistic model and load distribution generated by the integrated approach used by BDI; since the condition of the girders at the pier (i.e., the critical rating location) is good and not poor (as the superstructure condition rating indicates) a condition factor of 1.0 was used instead of the 0.85 factor used by UIC; and a riding surface rating of 2 allowed the reduction of the impact factor from 33% to 20% for the legal and permit loads as per the RIDOT LRFR Guidelines.
As with many bridges evaluated using the “Integrated Approach”, engineering judgment was used to reduce the stiffness values that were related to properties that could change over time, such as the spring constants representing bearing friction at the abutments and the effective stiffness of the deck. As a result, it is very likely that the rating factors provided in this report are still conservative for this structure. Furthermore, all load ratings are based on AASHTO lane configurations rather than the actual lane definition. Since all load limits are controlled by the exterior girder, a significant increase in loading can be achieved by assuming all trucks will remain in their proper lane designation. While this may not be desirable for the design load situation, it could be beneficial in permit load situations where some control on load paths is attainable.
The load rating factors and conclusions presented in this report are provided as recommendations based on the structure's response behavior and condition at the time of load testing. Any structural degradation must be considered in future load ratings.

LOAD TESTING AND LOAD RATING REPORT – NORTH KINGSTOWN, RI BRIDGE 896 33
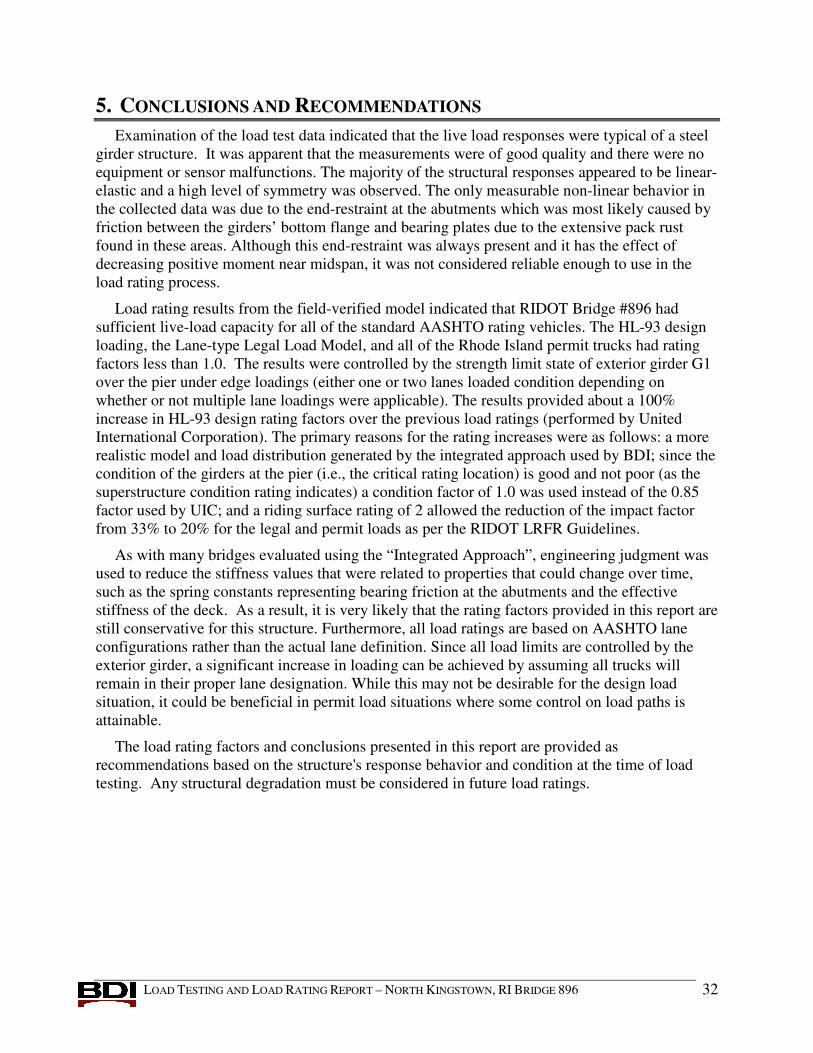
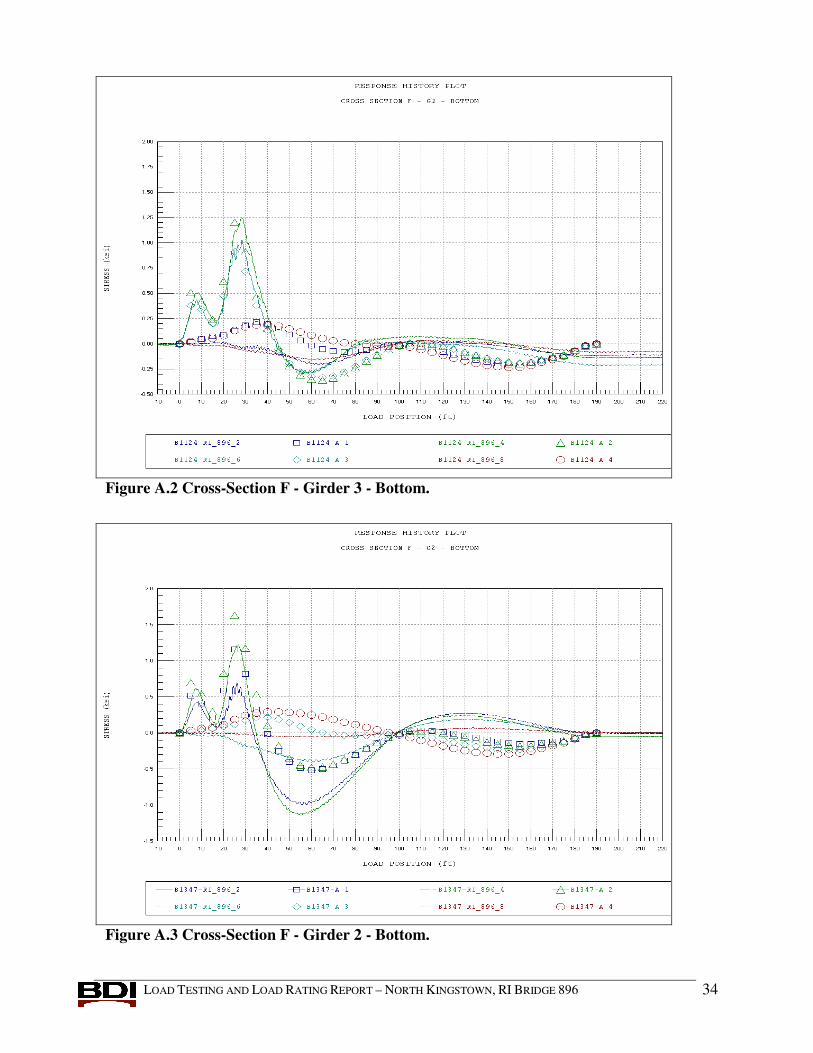
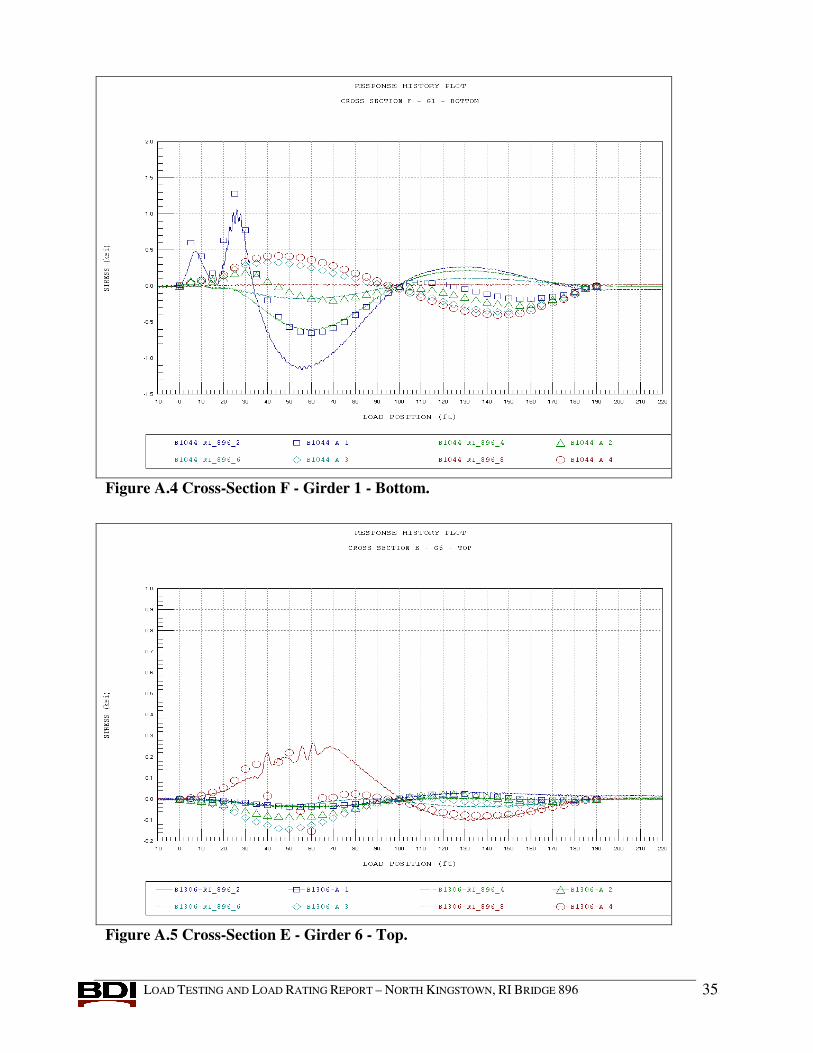
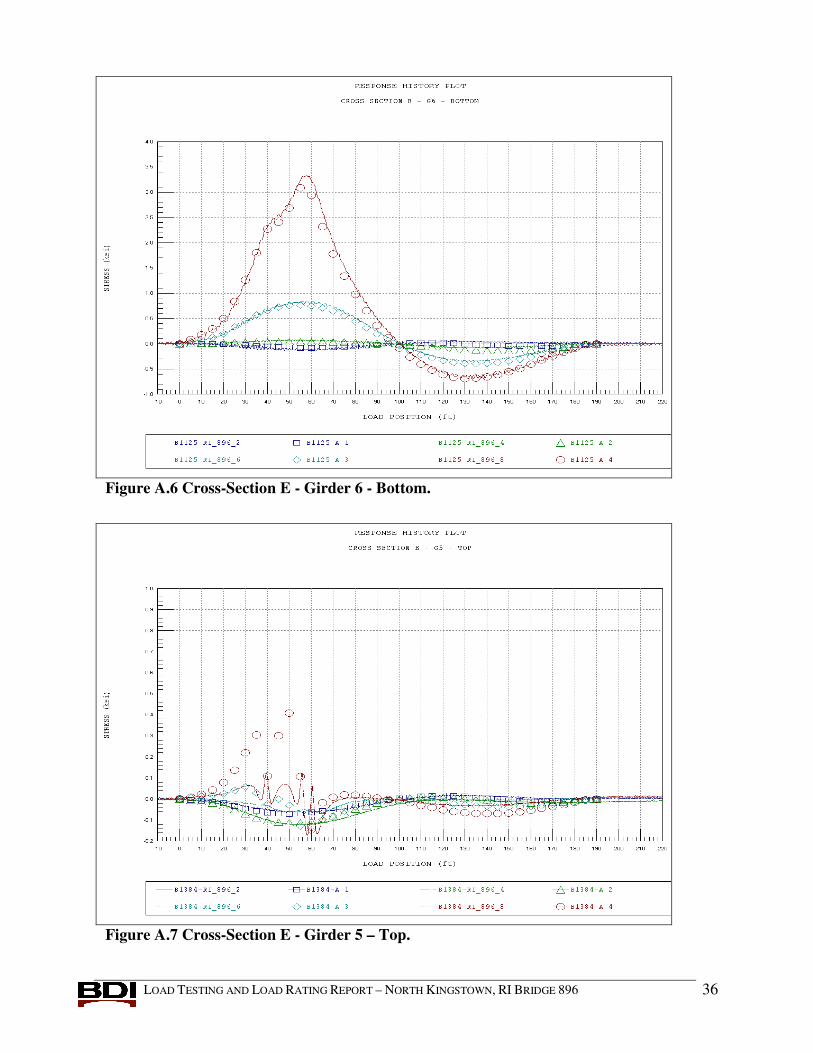
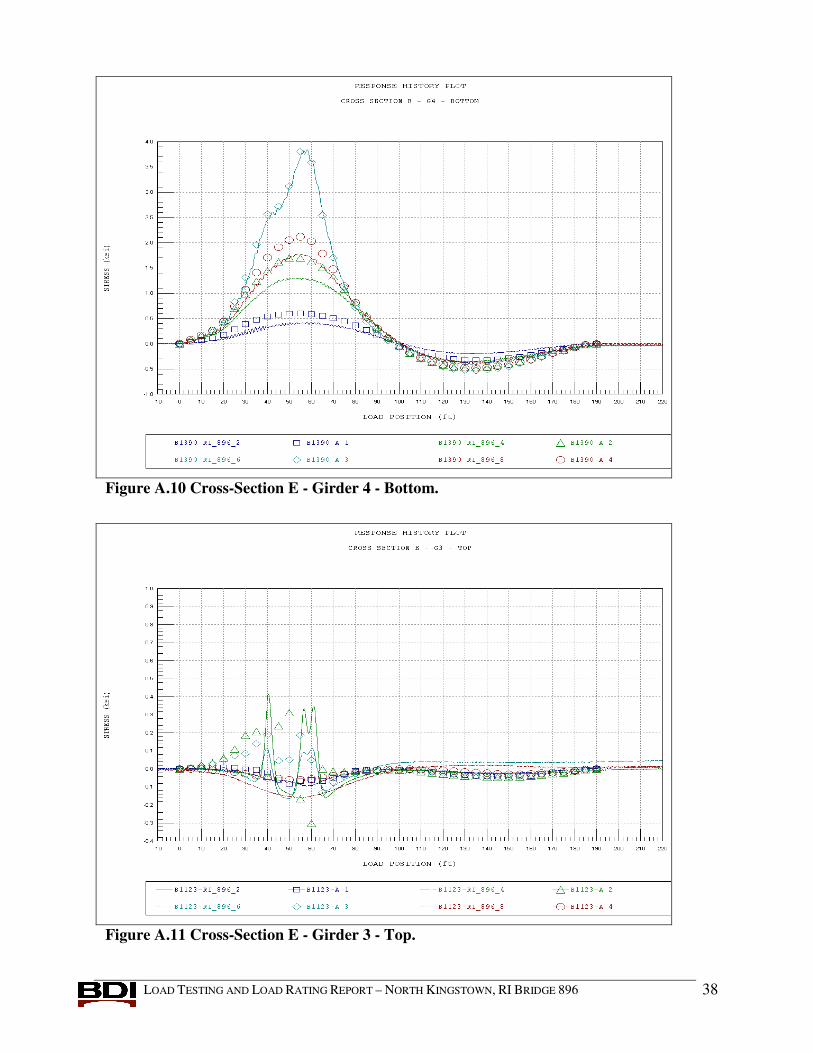
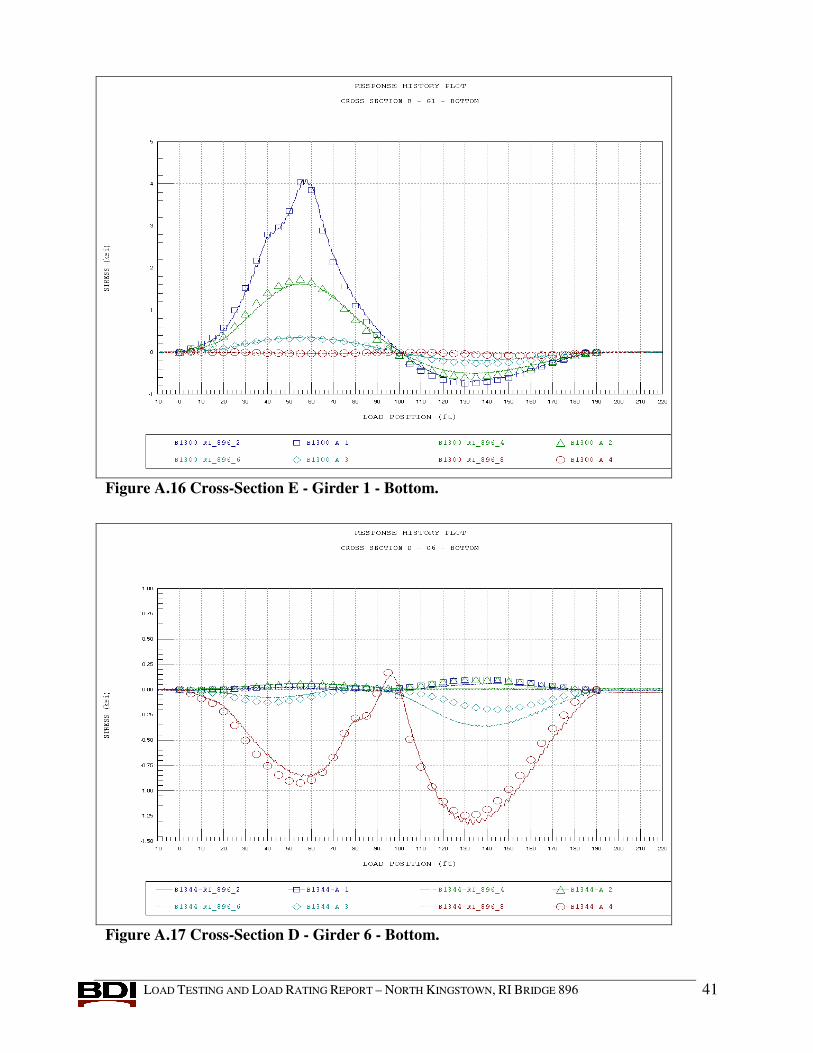
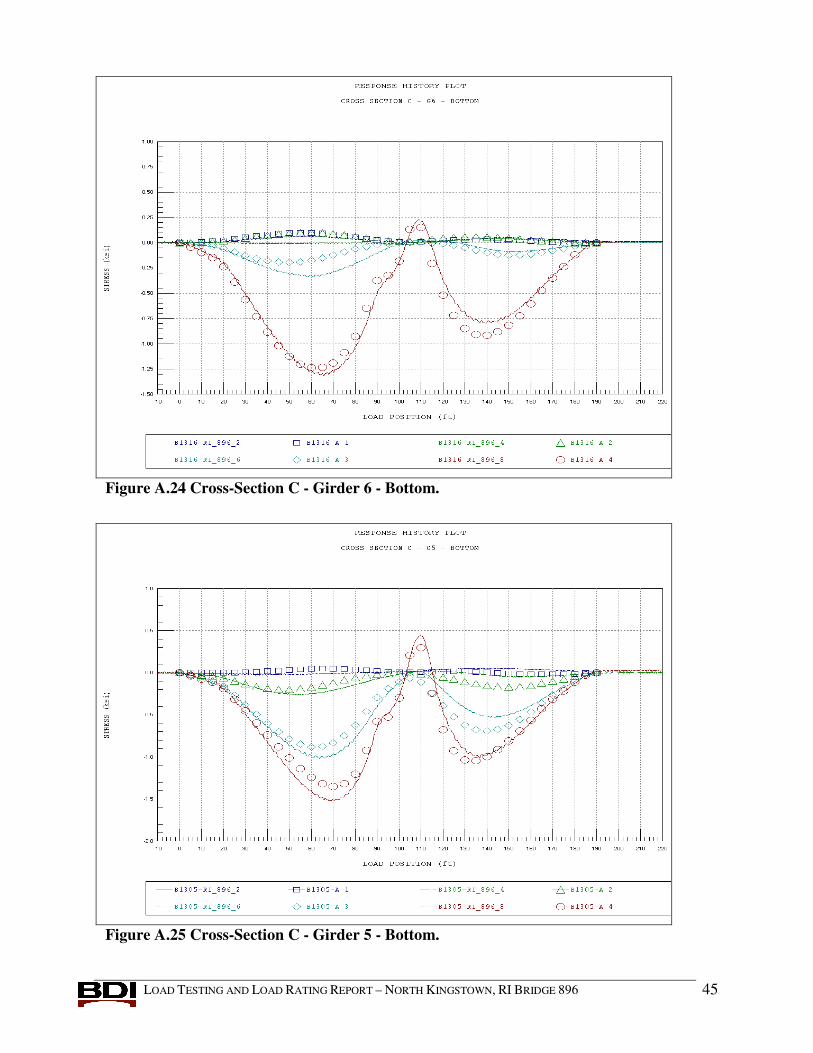
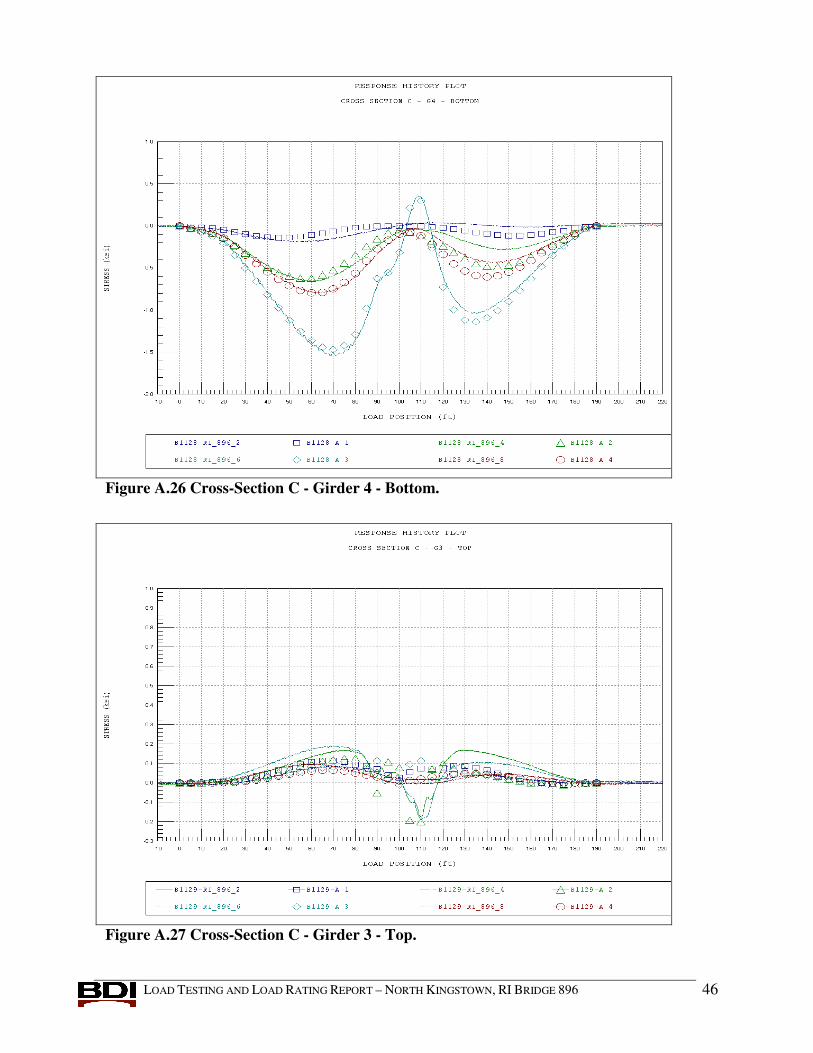
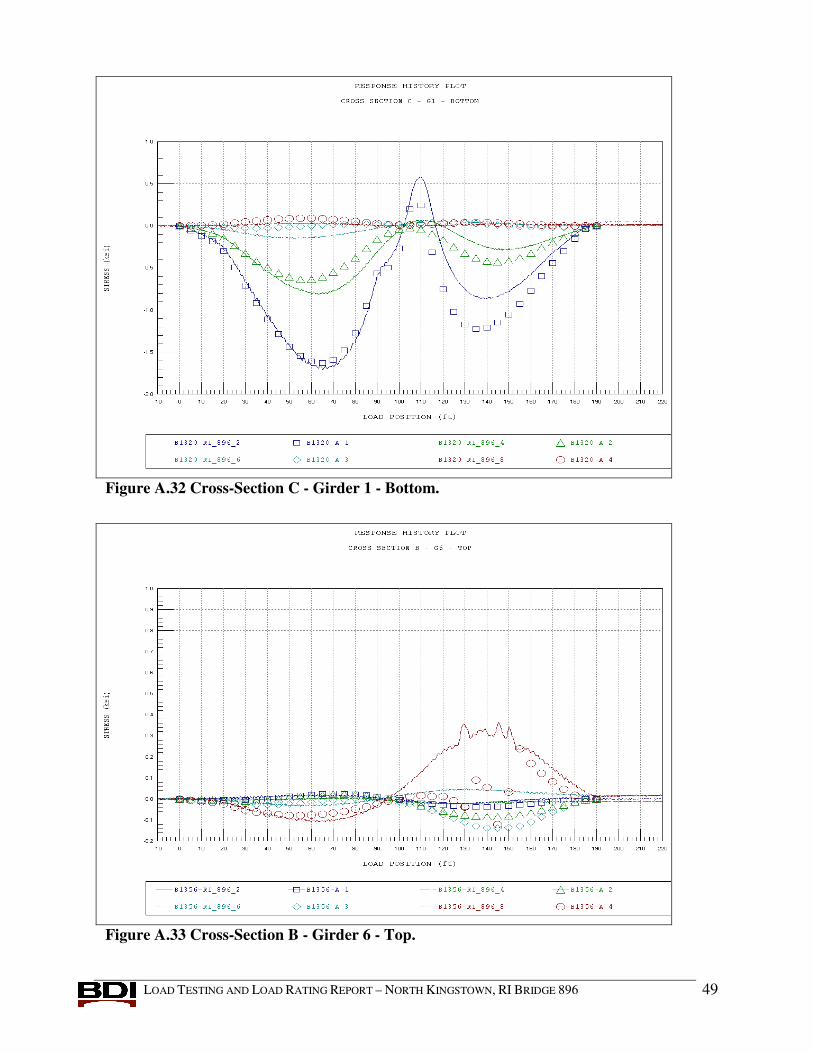
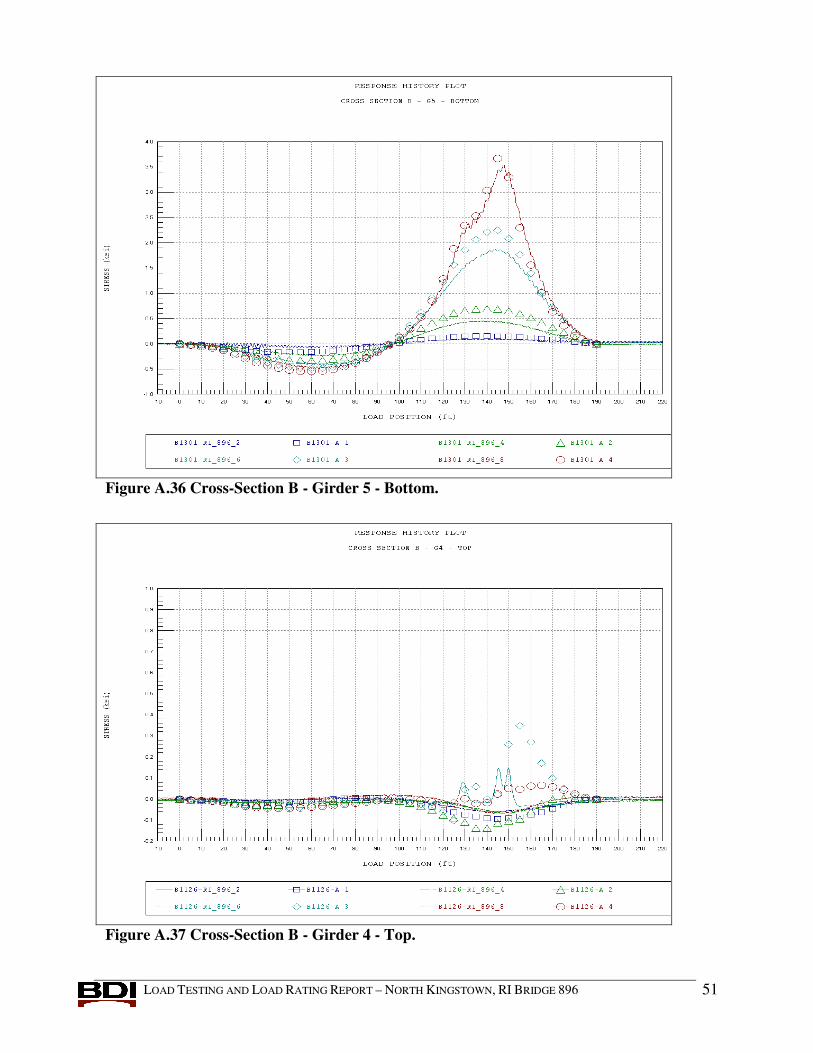
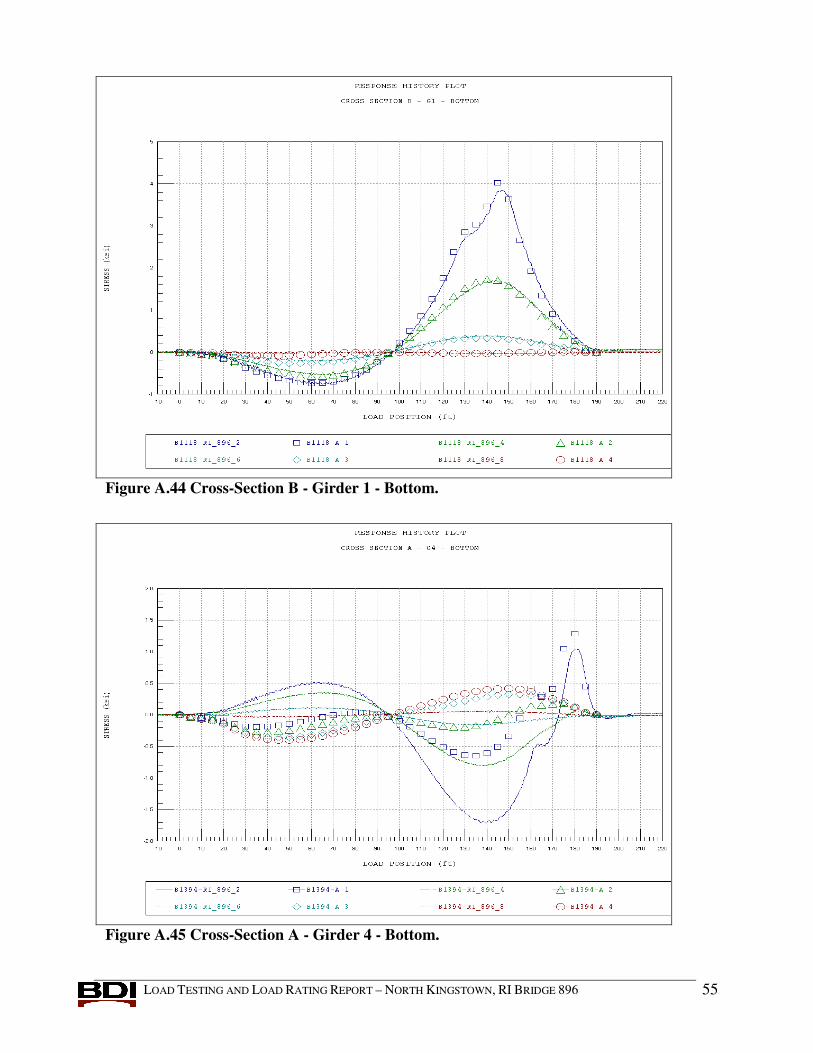
A. APPENDIX A - MEASURED AND COMPUTED STRAIN COMPARISONS While statistical terms provide a means of evaluating the relative accuracy of various
modeling procedures or help determine the improvement of a model during a calibration process, the best conceptual measure of a model's accuracy is by visual examination of the response histories. The following graphs contain measured and computed stress histories from each truck path. In each graph the continuous lines represent the measured stress at the specified gage location as a function of truck position as it traveled across the bridge. Computed stresses are shown as markers at discrete truck intervals. Remember that due to the non-linearity and inconsistency of the end restraint at the abutments, the accuracy of the midspan and pier stresses took precedent over the accuracy of the stresses near the abutments. Therefore, the majority of the measured and computed stresses near the abutments shown below do not match well.
Figure A.1 Cross-Section F - Girder 6 - Bottom.
LOAD TESTING AND LOAD RATING REPORT – NORTH KINGSTOWN, RI BRIDGE 896 34
Figure A.2 Cross-Section F - Girder 3 - Bottom.
Figure A.3 Cross-Section F - Girder 2 - Bottom.
LOAD TESTING AND LOAD RATING REPORT – NORTH KINGSTOWN, RI BRIDGE 896 35
Figure A.4 Cross-Section F - Girder 1 - Bottom.
Figure A.5 Cross-Section E - Girder 6 - Top.
LOAD TESTING AND LOAD RATING REPORT – NORTH KINGSTOWN, RI BRIDGE 896 36
Figure A.6 Cross-Section E - Girder 6 - Bottom.
Figure A.7 Cross-Section E - Girder 5 – Top.

LOAD TESTING AND LOAD RATING REPORT – NORTH KINGSTOWN, RI BRIDGE 896 37
Figure A.8 Cross-Section E - Girder 5 - Bottom.
Figure A.9 Cross-Section E - Girder 4 - Top.
LOAD TESTING AND LOAD RATING REPORT – NORTH KINGSTOWN, RI BRIDGE 896 38
Figure A.10 Cross-Section E - Girder 4 - Bottom.
Figure A.11 Cross-Section E - Girder 3 - Top.

LOAD TESTING AND LOAD RATING REPORT – NORTH KINGSTOWN, RI BRIDGE 896 39
Figure A.12 Cross-Section E - Girder 3 - Bottom.
Figure A.13 Cross-Section E - Girder 2 - Top.

LOAD TESTING AND LOAD RATING REPORT – NORTH KINGSTOWN, RI BRIDGE 896 40
Figure A.14 Cross-Section E - Girder 2 - Bottom.
Figure A.15 Cross-Section E - Girder 1 - Top.
LOAD TESTING AND LOAD RATING REPORT – NORTH KINGSTOWN, RI BRIDGE 896 41
Figure A.16 Cross-Section E - Girder 1 - Bottom.
Figure A.17 Cross-Section D - Girder 6 - Bottom.

LOAD TESTING AND LOAD RATING REPORT – NORTH KINGSTOWN, RI BRIDGE 896 42
Figure A.18 Cross-Section D - Girder 5 - Bottom.
Figure A.19 Cross-Section D - Girder 3 - Bottom.

LOAD TESTING AND LOAD RATING REPORT – NORTH KINGSTOWN, RI BRIDGE 896 43
Figure A.20 Cross-Section D - Girder 2 - Top.
Figure A.21 Cross-Section D - Girder 2 - Bottom.

LOAD TESTING AND LOAD RATING REPORT – NORTH KINGSTOWN, RI BRIDGE 896 44
Figure A.22 Cross-Section D - Girder 1 - Top.
Figure A.23 Cross-Section D - Girder 1 - Bottom.
LOAD TESTING AND LOAD RATING REPORT – NORTH KINGSTOWN, RI BRIDGE 896 45
Figure A.24 Cross-Section C - Girder 6 - Bottom.
Figure A.25 Cross-Section C - Girder 5 - Bottom.
LOAD TESTING AND LOAD RATING REPORT – NORTH KINGSTOWN, RI BRIDGE 896 46
Figure A.26 Cross-Section C - Girder 4 - Bottom.
Figure A.27 Cross-Section C - Girder 3 - Top.

LOAD TESTING AND LOAD RATING REPORT – NORTH KINGSTOWN, RI BRIDGE 896 47
Figure A.28 Cross-Section C - Girder 3 - Bottom.
Figure A.29 Cross-Section C - Girder 2 - Top.

LOAD TESTING AND LOAD RATING REPORT – NORTH KINGSTOWN, RI BRIDGE 896 48
Figure A.30 Cross-Section C - Girder 2 - Bottom.
Figure A.31 Cross-Section C - Girder 1 - Top.
LOAD TESTING AND LOAD RATING REPORT – NORTH KINGSTOWN, RI BRIDGE 896 49
Figure A.32 Cross-Section C - Girder 1 - Bottom.
Figure A.33 Cross-Section B - Girder 6 - Top.

LOAD TESTING AND LOAD RATING REPORT – NORTH KINGSTOWN, RI BRIDGE 896 50
Figure A.34 Cross-Section B - Girder 6 - Bottom.
Figure A.35 Cross-Section B - Girder 5 - Top.
LOAD TESTING AND LOAD RATING REPORT – NORTH KINGSTOWN, RI BRIDGE 896 51
Figure A.36 Cross-Section B - Girder 5 - Bottom.
Figure A.37 Cross-Section B - Girder 4 - Top.

LOAD TESTING AND LOAD RATING REPORT – NORTH KINGSTOWN, RI BRIDGE 896 52
Figure A.38 Cross-Section B - Girder 4 - Bottom.
Figure A.39 Cross-Section B - Girder 3 - Top.

LOAD TESTING AND LOAD RATING REPORT – NORTH KINGSTOWN, RI BRIDGE 896 53
Figure A.40 Cross-Section B - Girder 3 - Bottom.
Figure A.41 Cross-Section B - Girder 2 - Top.

LOAD TESTING AND LOAD RATING REPORT – NORTH KINGSTOWN, RI BRIDGE 896 54
Figure A.42 Cross-Section B - Girder 2 - Bottom.
Figure A.43 Cross-Section B - Girder 1 - Top.
LOAD TESTING AND LOAD RATING REPORT – NORTH KINGSTOWN, RI BRIDGE 896 55
Figure A.44 Cross-Section B - Girder 1 - Bottom.
Figure A.45 Cross-Section A - Girder 4 - Bottom.

LOAD TESTING AND LOAD RATING REPORT – NORTH KINGSTOWN, RI BRIDGE 896 56
Figure A.46 Cross-Section A - Girder 3 - Bottom.
Figure A.47 Cross-Section A - Girder 2 - Bottom.

LOAD TESTING AND LOAD RATING REPORT – NORTH KINGSTOWN, RI BRIDGE 896 57
Figure A.48 Cross-Section A - Girder 1 - Bottom.

LOAD TESTING AND LOAD RATING REPORT – NORTH KINGSTOWN, RI BRIDGE 896 58
B. APPENDIX B – FIELD NOTES (SCANNED)
Figure B.1 Scanned Notes- Page 1.
LOAD TESTING AND LOAD RATING REPORT – NORTH KINGSTOWN, RI BRIDGE 896 59
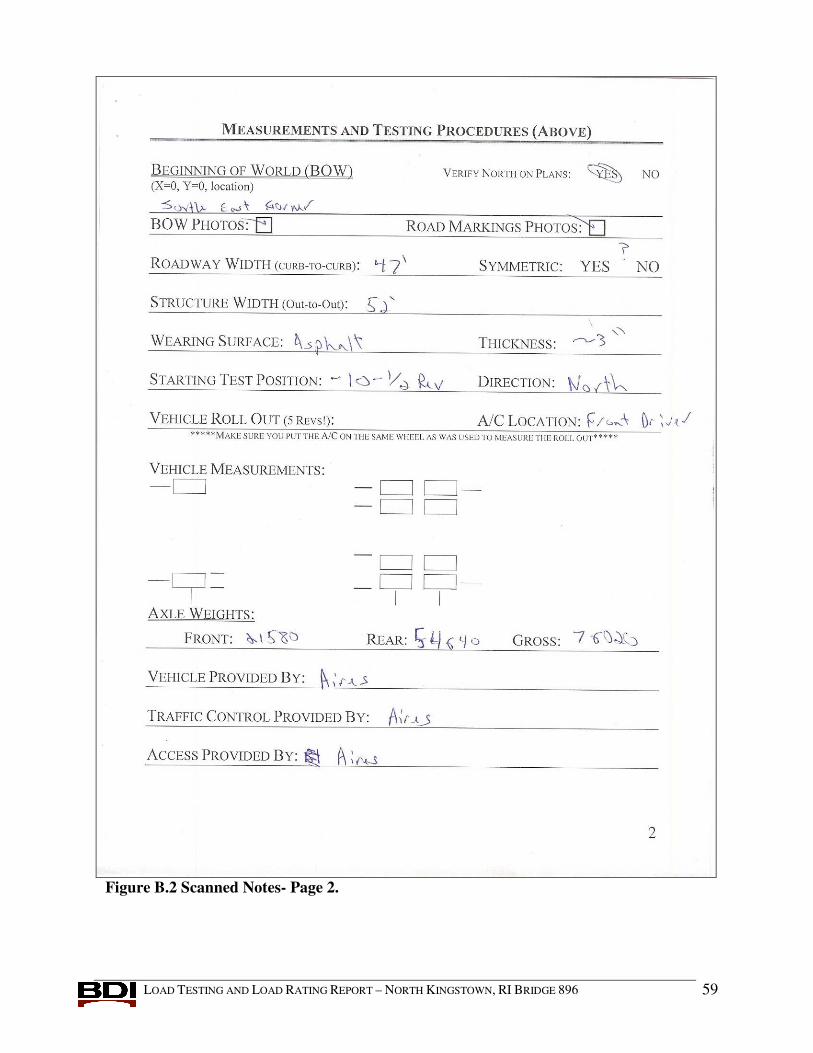
Figure B.2 Scanned Notes- Page 2.

LOAD TESTING AND LOAD RATING REPORT – NORTH KINGSTOWN, RI BRIDGE 896 60
Figure B.3 Scanned Notes- Page 3.

LOAD TESTING AND LOAD RATING REPORT – NORTH KINGSTOWN, RI BRIDGE 896 61
Figure B.4 Scanned Notes- Page 4.

LOAD TESTING AND LOAD RATING REPORT – NORTH KINGSTOWN, RI BRIDGE 896 62
Figure B.5 Scanned Notes- Page 5.
LOAD TESTING AND LOAD RATING REPORT – NORTH KINGSTOWN, RI BRIDGE 896 63
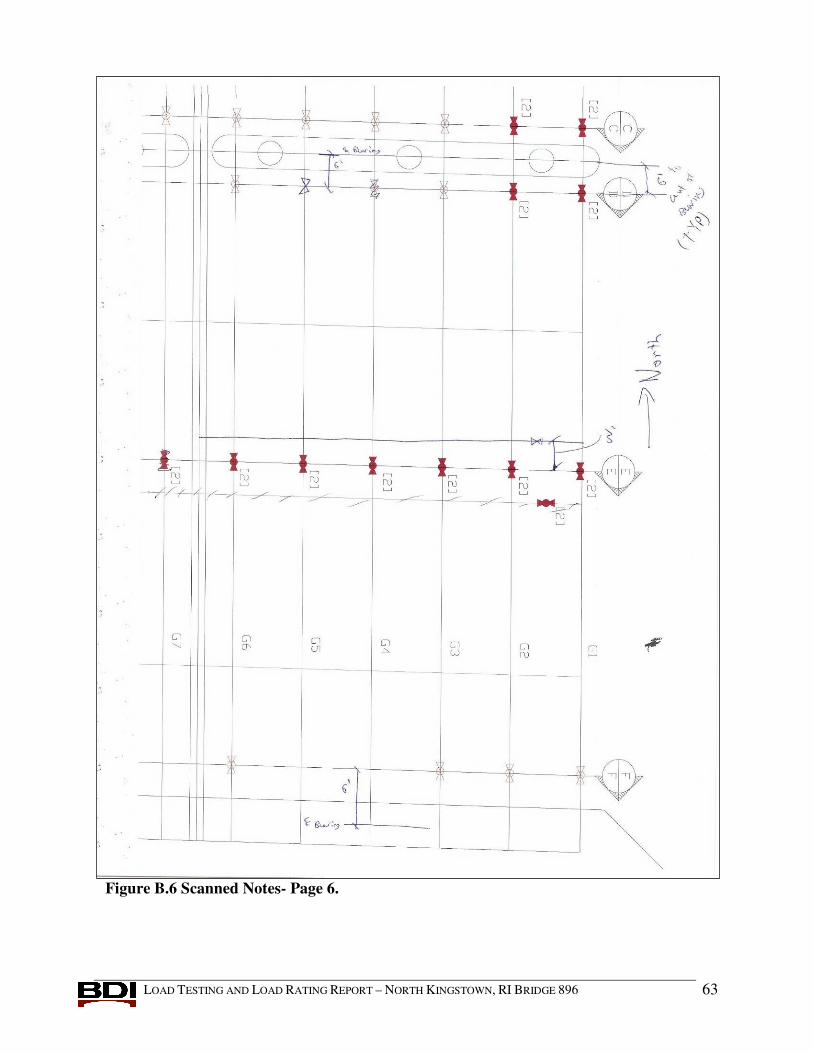
Figure B.6 Scanned Notes- Page 6.
LOAD TESTING AND LOAD RATING REPORT – NORTH KINGSTOWN, RI BRIDGE 896 64
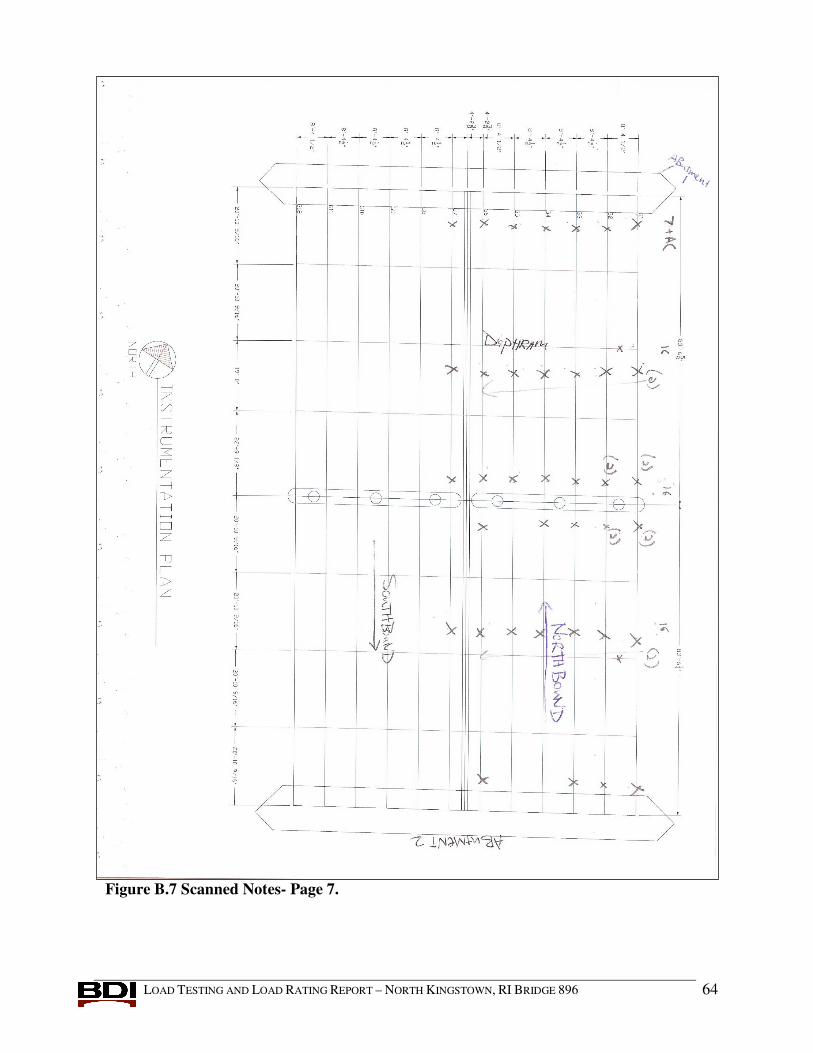
Figure B.7 Scanned Notes- Page 7.
LOAD TESTING AND LOAD RATING REPORT – NORTH KINGSTOWN, RI BRIDGE 896 65
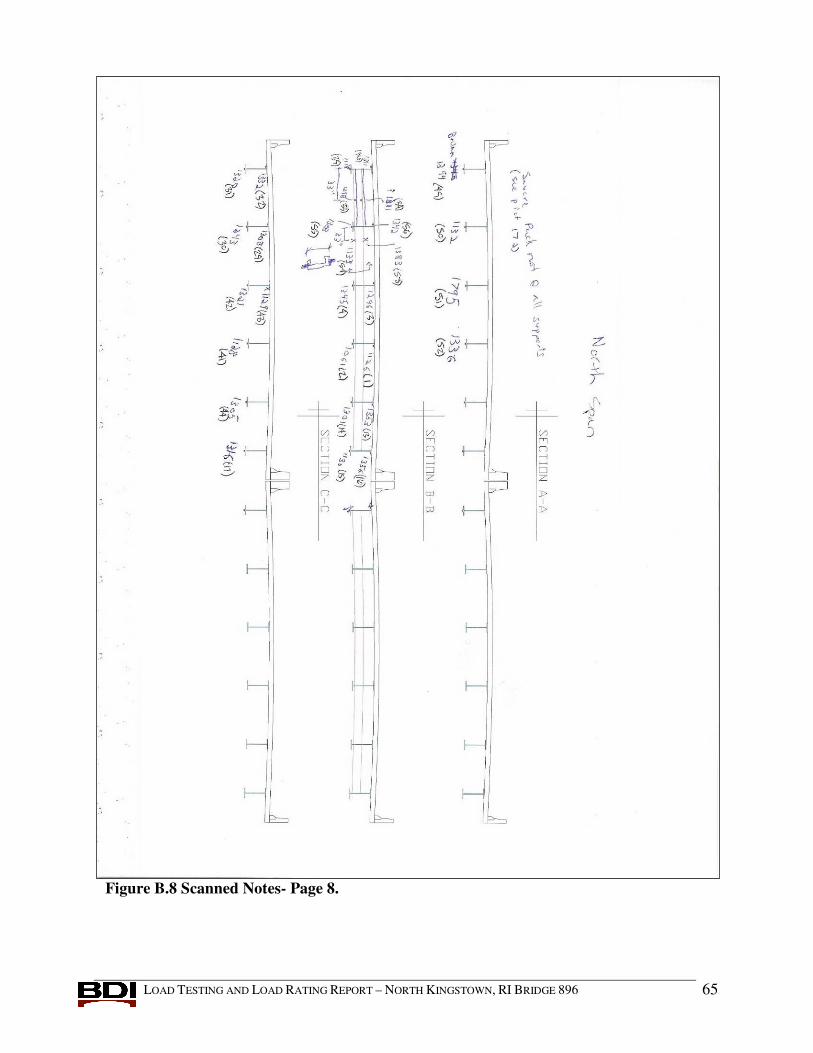
Figure B.8 Scanned Notes- Page 8.

LOAD TESTING AND LOAD RATING REPORT – NORTH KINGSTOWN, RI BRIDGE 896 66
Figure B.9 Scanned Notes- Page 9.
LOAD TESTING AND LOAD RATING REPORT – NORTH KINGSTOWN, RI BRIDGE 896 67
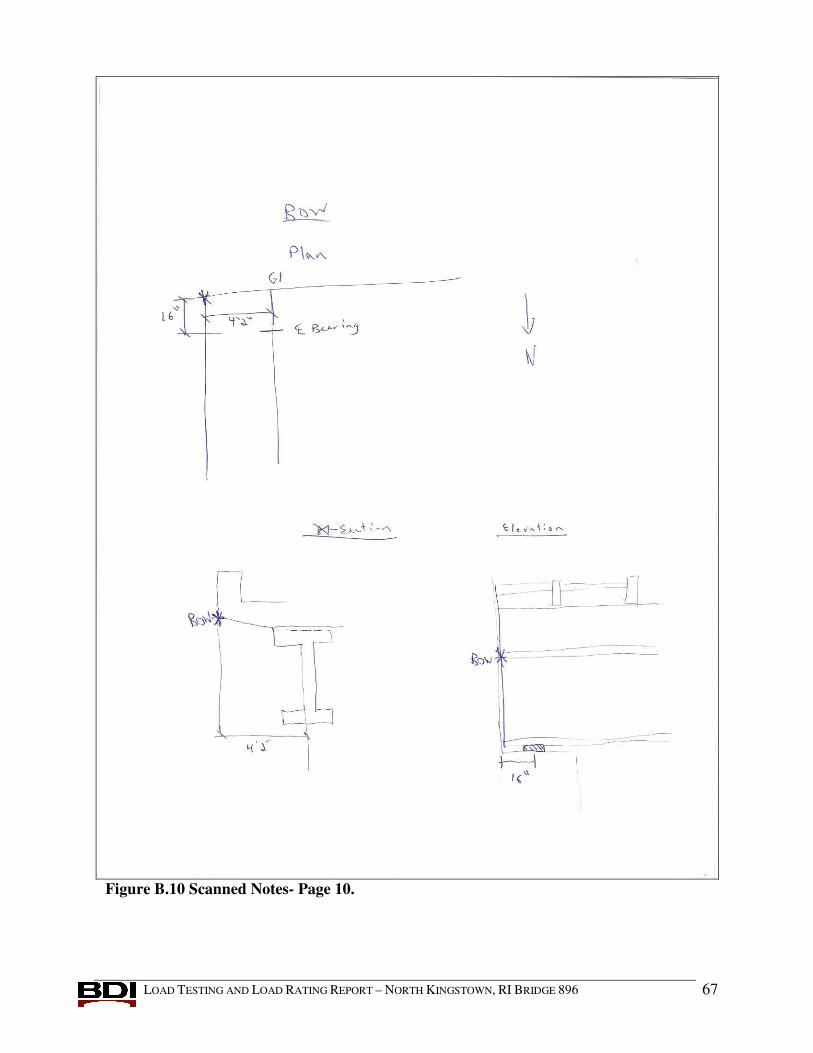
Figure B.10 Scanned Notes- Page 10.

LOAD TESTING AND LOAD RATING REPORT – NORTH KINGSTOWN, RI BRIDGE 896 68
C. APPENDIX C - FIELD TESTING PROCEDURES
BACKGROUND
The motivation for developing a relatively easy-to-implement field-testing system was to allow short and medium span bridges to be tested on a routine basis. Original development of the hardware was started in 1988 at the University of Colorado under a contract with the Pennsylvania Department of Transportation (PennDOT). Subsequent to that project, the Integrated Technique was refined on another study funded by the Federal Highway Administration (FHWA) in which 35 bridges located on the Interstate system throughout the country were tested and evaluated. Further refinement has been implemented over the years through testing and evaluating hundreds of bridges, lock gates, and other structures.
STRUCTURAL TESTING HARDWARE
The real key to being able to complete the field-testing quickly is the use of strain transducers (rather than standard foil strain gages) that can be attached to the structural members in just a few minutes. These sensors were originally developed for monitoring dynamic strains on foundation piles during the driving process. They have been adapted for use in structural testing through special modifications, have very high accuracy, and are periodically re-calibrated to NIST standards. Please refer to Appendix D for specifications on the BDI Strain Transducers.
In addition to the strain sensors, the data acquisition hardware has been designed specifically for structural live load testing which means it is extremely easy to use in the field. Please see Appendix E for specifications on the BDI Structural Testing System. Briefly, some of the features include military-style connections for quick assembly and self-identifying sensors that dramatically reduce bookkeeping efforts. The WinSTS testing software has been written to allow easy hardware configuration and data recording operation. Other enhancements include the BDI AutoClicker which is an automatic load position indicator that is mounted directly on the vehicle. As the test truck crosses the structure along the preset path, a communication radio sends a signal to the STS that receives it and puts a mark in the data. This allows the field strains to be compared to analytical strains as a function of vehicle position, not only as a function of time. Refer to Appendix F for the AutoClicker specifications. The end result of using all of the above-described components is a system that can be used by people other than computer experts or electrical engineers. Typical testing times with the STS is usually anywhere from 20 to 60 channel tests being completed in one day, depending on access and other field conditions.
The following general directions outline how to run a typical diagnostic load test on a short- to medium-span highway bridge up to about 200 ft (60m) in length. With only minor modifications, these directions can be applied to railroad bridges (use a locomotive rather than a truck for the load vehicle), lock gates (monitor the water level in the lock chamber), amusement park rides (track the position of the ride vehicle) and other structures in which the live load can be applied easily. The basic scenario is to first instrument the structure with the required number of sensors, run a series of tests, and then removing all the sensors. These procedures can often be completed within one working day depending on field conditions such as access and traffic.
LOAD TESTING AND LOAD RATING REPORT – NORTH KINGSTOWN, RI BRIDGE 896 69
INSTRUMENTATION OF STRUCTURE
This outline is intended to describe the general procedures used for completing a successful field test on a highway bridge using the BDI-STS. For a detailed explanation of the instrumentation and testing procedures, please contact BDI and request a copy of the Structural Testing System (STS) Operation Manual.
ATTACHING STRAIN TRANSDUCERS
Once a tentative instrumentation plan has been developed for the structure in question, the strain transducers must be attached and the STS prepared for running the test. There are several methods for attaching the strain transducers to the structural members depending on whether they are steel, concrete, timber, FRP, or other. For steel structures, quite often the transducers can be clamped directly to the steel flanges of rolled sections or plate girders. If significant lateral bending is assumed to be present, then one transducer may be clamped to each edge of the flange. In general, the transducers can be clamped directly to painted surfaces. The alternative to clamping is the tab attachment method that involves cleaning the mounting area and then using a fast-setting cyanoacrylate adhesive to temporarily install the transducers. Small steel “tabs” are used with this technique and they are removed when testing is completed, and touch-up paint can be applied to the exposed steel surfaces.
Installation of transducers on pre-stressed concrete (PS/C) and FRP members is usually accomplished with the tab technique outlined above, while readily-available wood screws and a battery-operated hand drill are used for timber members. Installing transducers on reinforced concrete (R/C) is more complex in that gage extensions are used and must be mounted with concrete studs.
If the above steps are followed, it should be possible to mount each transducer in approximately five to ten minutes. The following figures illustrate transducers mounted on both steel and reinforced concrete members.

LOAD TESTING AND LOAD RATING REPORT – NORTH KINGSTOWN, RI BRIDGE 896 70
Figure C.1 Strain Transducers Mounted on Steel Girder
Figure C.2 Transducers w/Gage Extensions Mounted On R/C Slab
LOAD TESTING AND LOAD RATING REPORT – NORTH KINGSTOWN, RI BRIDGE 896 71
ASSEMBLY OF SYSTEM
Once the transducers have been mounted, they are connected to the four-channel STS units which are also located on the bridge. The STS units can be easily clamped to the bridge girders, or if the structure is concrete and no flanges are available to set the STS units on, transducer tabs glued to the structure and plastic zip-ties or small wire can be used to mount them. Since the transducers will identify themselves to the system, there is no special order that they must be plugged into the system. The only information that must be recorded is the transducer serial number and its location on the structure. Signal cables are then used to connect STS units together either in series or in a “tree” structure through the use of cable splitters. If several gages are in close proximity to each other, then the STS units can be plugged directly to each other without the use of a cable.
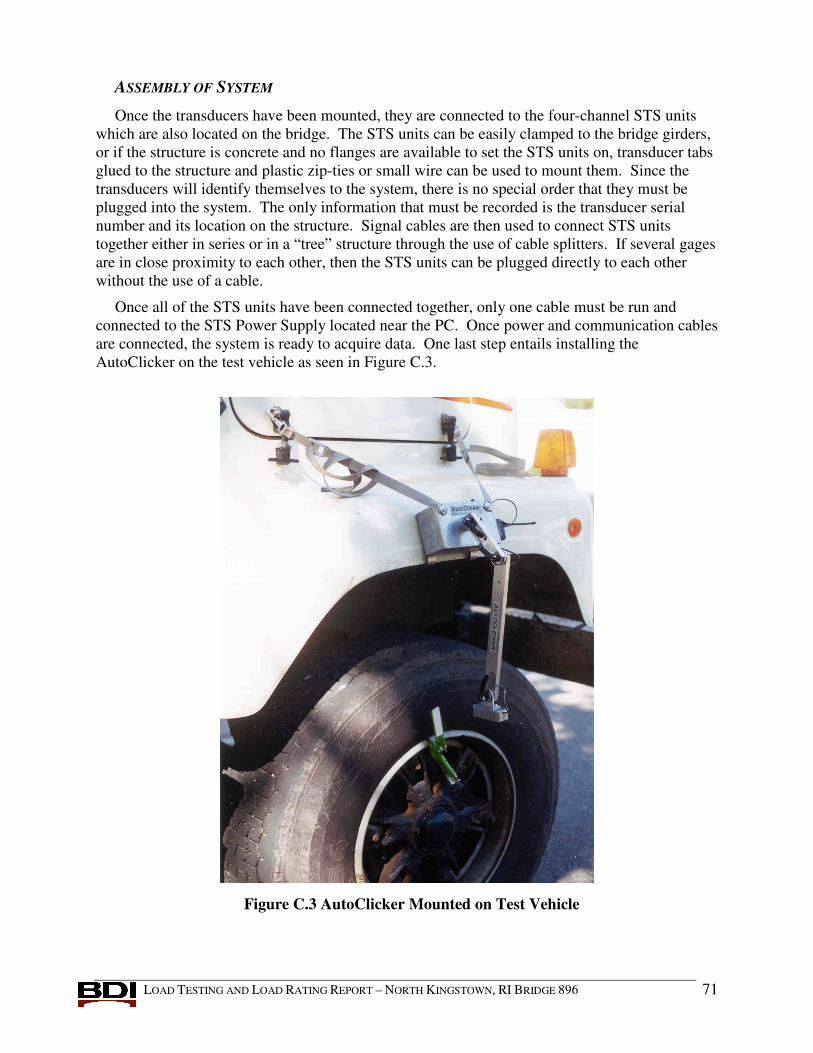
Once all of the STS units have been connected together, only one cable must be run and connected to the STS Power Supply located near the PC. Once power and communication cables are connected, the system is ready to acquire data. One last step entails installing the AutoClicker on the test vehicle as seen in Figure C.3.
Figure C.3 AutoClicker Mounted on Test Vehicle

LOAD TESTING AND LOAD RATING REPORT – NORTH KINGSTOWN, RI BRIDGE 896 72
ESTABLISHING LOADING VEHICLE POSITIONS
Once the structure is instrumented and the loading vehicle prepared, some reference points must be established on the deck in order to determine where the vehicle will cross. This process is important so that future analysis comparisons can be made with the loading vehicle in the same locations as it was in the field. Therefore, a “zero” or initial reference point is selected and usually corresponds to the point on the deck directly above the abutment bearing and the centerline of one of the fascia girders. All other measurements on the deck will then be related to this zero reference point. For concrete T-girders, box girders, and slabs, this can correspond to where the edge of the slab or the girder web meets the face of the abutment. If the bridge is skewed, the first point encountered from the direction of travel is used. In any case, it should be a point that is easily located on the drawings for the structure.
Once the zero reference location is known, the lateral load paths for the vehicle are determined. Often, the painted roadway lines are used for the driver to follow if they are in convenient locations. For example, for a two-lane bridge, a northbound shoulder line will correspond to Y1 (passenger-side wheel), the center dashed line to Y2 (center of truck), and the southbound shoulder line to Y3 (driver’s side wheel). Often, the structure will be symmetrical with respect to its longitudinal center line. If so, it is good practice is to take advantage of this symmetry by selecting three Y locations that are also symmetric. This will allow for a data quality check since the response should be very similar, say, on the middle girder if the truck is on the left side of the bridge or the right side of the bridge. In general, it is best to have the truck travel in each lane (at least on the lane line) and also as close to each shoulder or sidewalk as possible. When the deck layout is completed, the loading vehicle’s axle weights and dimensions are recorded.
RUNNING THE LOAD TESTS
After the structure has been instrumented and the reference system laid out on the bridge deck, the actual testing procedures are completed. The WinSTS software is initialized and configured. When all personnel are ready to commence the test, traffic control is initiated and the Run Test option is selected which places the system in an activated state. When the truck passes over the first deck mark, the AutoClicker is tripped and data is being collected at the specified sample rate. An effort is made to get the truck across with no other traffic on the bridge. When the rear axle of the vehicle completely crosses over the structure, the data collection is stopped and several strain histories evaluated for data quality. Usually, at least two passes are made at each “Y” position to ensure data reproducibility, and then if conditions permit, high speed or dynamic tests are completed.
The use of a moving load as opposed to placing the truck at discrete locations has two major benefits. First, the testing can be completed much quicker, meaning there is less impact on traffic. Second, and more importantly, much more information can be obtained (both quantitative and qualitative). Discontinuities or unusual responses in the strain histories, which are often signs of distress, can be easily detected. Since the load position is monitored as well, it is easy to determine what loading conditions cause the observed effects. If readings are recorded only at discreet truck locations, the risk of losing information between the points is great. The advantages of continuous readings have been proven over and over again.
When the testing procedures are complete, the instrumentation is removed and any touch-up work completed.

LOAD TESTING AND LOAD RATING REPORT – NORTH KINGSTOWN, RI BRIDGE 896 73
D. APPENDIX D – EQUIPMENT SPECIFICATIONS
SPECIFICATIONS: BDI STRAIN TRANSDUCERS
Effective gage length: 3.0 in (76.2 mm). Extensions available for use on R/C structures. Overall Size: 4.4 in x 1.2 in x 0.5 in (110 mm x 33 mm x 12 mm). Cable Length: 10 ft (3 m) standard, any length available. Material: Aluminum Circuit: Full wheatstone bridge with four active 350Ω foil gages, 4-wire hookup. Accuracy: ± 2%, individually calibrated to NIST standards. Strain Range: Approximately ±4000 µε. Force req’d for 1000 µε: Approximately 9 lbs. (40 N). Sensitivity: Approximately 500 µε/mV/V, Weight: Approximately 3 oz. (88 g), Environmental: Built-in protective cover, also water resistant. Temperature Range: -60°F to 250°F (-50°C to 120°C ) operation range. Cable: BDI RC-187: 22 gage, two individually-shielded pairs w/drain. Options: Fully waterproofed, Heavy-duty cable, Special quick-lock connector. Attachment Methods: C-clamps or threaded mounting tabs & quick-setting adhesive.
LOAD TESTING AND LOAD RATING REPORT – NORTH KINGSTOWN, RI BRIDGE 896 74
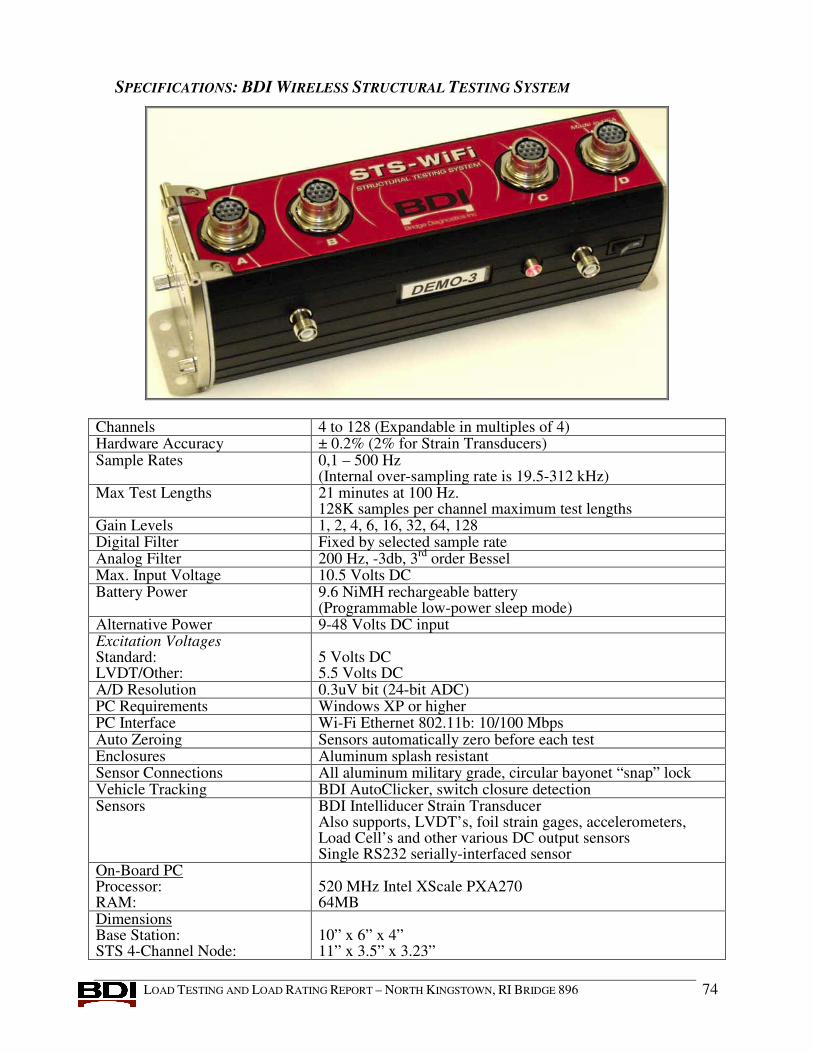
SPECIFICATIONS: BDI WIRELESS STRUCTURAL TESTING SYSTEM
Channels 4 to 128 (Expandable in multiples of 4) Hardware Accuracy ± 0.2% (2% for Strain Transducers) Sample Rates 0,1 – 500 Hz
(Internal over-sampling rate is 19.5-312 kHz) Max Test Lengths 21 minutes at 100 Hz.
128K samples per channel maximum test lengths Gain Levels 1, 2, 4, 6, 16, 32, 64, 128 Digital Filter Fixed by selected sample rate Analog Filter 200 Hz, -3db, 3rd order Bessel Max. Input Voltage 10.5 Volts DC Battery Power 9.6 NiMH rechargeable battery
(Programmable low-power sleep mode) Alternative Power 9-48 Volts DC input Excitation Voltages Standard: LVDT/Other:
5 Volts DC 5.5 Volts DC
A/D Resolution 0.3uV bit (24-bit ADC) PC Requirements Windows XP or higher PC Interface Wi-Fi Ethernet 802.11b: 10/100 Mbps Auto Zeroing Sensors automatically zero before each test Enclosures Aluminum splash resistant Sensor Connections All aluminum military grade, circular bayonet “snap” lock Vehicle Tracking BDI AutoClicker, switch closure detection Sensors BDI Intelliducer Strain Transducer
Also supports, LVDT’s, foil strain gages, accelerometers, Load Cell’s and other various DC output sensors Single RS232 serially-interfaced sensor
On-Board PC Processor: RAM:
520 MHz Intel XScale PXA270 64MB
Dimensions Base Station: STS 4-Channel Node:
10” x 6” x 4” 11” x 3.5” x 3.23”

LOAD TESTING AND LOAD RATING REPORT – NORTH KINGSTOWN, RI BRIDGE 896 75
SPECIFICATIONS: BDI AUTOCLICKER
3 Handheld Radios Motorola P1225 2-Channel (or equal) modified for both “Rx” and “Tx”. Power 9V battery Mounting Universal front fender mounting system Target Retroreflective tape mounted on universal wheel clamp Bands/Power VHF/1 Watt or UHF/2 Watt Frequencies User-specified Data Acquisition System Requirements
TTL/CMOS input (pull-up resistor to 5V)
Output Isolated contact closure (200V 0.5A max switch current)
LOAD TESTING AND LOAD RATING REPORT – NORTH KINGSTOWN, RI BRIDGE 896 76
E. APPENDIX E - MODELING AND ANALYSIS: THE INTEGRATED APPROACH
INTRODUCTION
In order for load testing to be a practical means of evaluating short- to medium-span bridges, it is apparent that testing procedures must be economic to implement in the field and the test results translatable into a load rating. A well-defined set of procedures must exist for the field applications as well as for the interpretation of results. An evaluation approach based on these requirements was first developed at the University of Colorado during a research project sponsored by the Pennsylvania Department of Transportation (PennDOT). Over several years, the techniques originating from this project have been refined and expanded into a complete bridge rating system.
The ultimate goal of the Integrated Approach is to obtain realistic rating values for highway bridges in a cost effective manner. This is accomplished by measuring the response behavior of the bridge due to a known load and determining the structural parameters that produce the measured responses. With the availability of field measurements, many structural parameters in the analytical model can be evaluated that are otherwise conservatively estimated or ignored entirely. Items that can be quantified through this procedure include the effects of structural geometry, effective girder stiffness, realistic support conditions, effects of parapets and other non-structural components, lateral load transfer capabilities of the deck and transverse members, and the effects of damage or deterioration. Often, bridges are rated poorly because of inaccurate representations of the structural geometry or because the material and/or cross-sectional properties of main structural elements are not well defined. A realistic rating can be obtained, however, when all of the relevant structural parameters are defined and implemented in the analysis process.
One of the most important phases of this approach is a qualitative evaluation of the raw field data. Much is learned during this step to aid in the rapid development of a representative model.
INITIAL DATA EVALUATION
The first step in structural evaluation consists of a visual inspection of the data in the form of graphic response histories. Graphic software was developed to display the raw strain data in various forms. Strain histories can be viewed in terms of time or truck position. Since strain transducers are typically placed in pairs, neutral axis measurements, curvature responses, and strain averages can also be viewed. Linearity between the responses and load magnitude can be observed by the continuity in the strain histories. Consistency in the neutral axis measurements from girder to girder and as a function of load position provides great insight into the nature of the bridge condition. The direction and relative magnitudes of flexural responses along a girder line are useful in determining if end restraints play a significant role in the response behavior. In general, the initial data inspection provides the engineer with information concerning modeling requirements and can help locate damaged areas.
Having strain measurements at two depths on each girder cross-section, flexural curvature and the location of the neutral axis can be computed directly from the field data. Figure E.1 illustrates how curvature and neutral axis values are computed from the strain measurements.

LOAD TESTING AND LOAD RATING REPORT – NORTH KINGSTOWN, RI BRIDGE 896 77
Figure E.1 Illustration of Neutral Axis and Curvature Calculations
The consistency in the N.A. values between girders indicates the degree of consistency in
girder stiffness. Also, the consistency of the N.A. measurement on a single girder as a function of truck position provides a good quality check for that girder. If for some reason a girder’s stiffness changes with respect to the applied moment (i.e. loss of composite action or loss of effective flange width due to a deteriorated deck), it will be observed by a shift in the N.A. history.
Since strain values are translated from a function of time into a function of vehicle position on the structure and the data acquisition channel and the truck position tracked, a considerable amount of book keeping is required to perform the strain comparisons. In the past, this required manipulation of result files and spreadsheets which was tedious and a major source of error. This process in now performed automatically by the software and all of the information can be verified visually.
FINITE ELEMENT MODELING AND ANALYSIS
The primary function of the load test data is to aid in the development of an accurate finite element model of the bridge. Finite element analysis is used because it provides the most general tool for evaluating various types of structures. Since a comparison of measured and computed responses is performed, it is necessary that the analysis be able to represent the actual response behavior. This requires that actual geometry and boundary conditions be realistically represented. In maintaining reasonable modeling efforts and computer run times, a certain amount of simplicity is also required, so a planar grid model is generated for most structures and linear-elastic responses are assumed. A grid of frame elements is assembled in the same geometry as the actual structure. Frame elements represent the longitudinal and transverse members of the bridge. The load transfer characteristics of the deck are provided by attaching plate elements to the grid. When end restraints are determined to be present, elastic spring elements having both translational and rotational stiffness terms are inserted at the support locations.

LOAD TESTING AND LOAD RATING REPORT – NORTH KINGSTOWN, RI BRIDGE 896 78
Loads are applied in a manner similar to the actual load test. A model of the test truck, defined by a two-dimensional group of point loads, is placed on the structure model at discrete locations along the same path that the test truck followed during the load test. Gage locations identical to those in the field are also defined on the structure model so that strains can be computed at the same locations under the same loading conditions.
EVALUATION OF ROTATIONAL END RESTRAINT
A common requirement in structural identification is the need to determine effective spring stiffnesses that best represent in-situ support conditions. Where as it is generally simple to evaluate a spring constant in terms of moment per rotation, the value generally has little meaning to the engineer. A more conceptual approach is to evaluate the spring stiffness as a percentage of a fully restrained condition. For example: 0% being a pinned condition and 100% being fixed. This is best accomplished by examining the ratio of the girder or slab stiffness to the rotational stiffness of the support.
As an illustration, a point load is applied to a simple girder with elastic supports, see Figure E.2. By examining the moment diagram, it is apparent that the ratio of the end moment to the mid-span moment (Me/Mm) equals 0.0 if the rotational stiffness (Kr) of the springs is equal to 0.0. Conversely, if the value of Kr is set to infinity (rigid) the moment ratio will equal 1.0. If a fixity term is defined as the ratio (Me/Mm), which ranges from 0 to 100 percent, a more conceptual measure of end restraint can be obtained.
The next step is to relate the fixity term to the actual spring stiffness (Kr). The degree to which the Kr effects the fixity term depends on the girder or slab stiffness to which the spring is attached. Therefore the fixity term must be related to the ratio of the girder/spring stiffness. Figure E.3 contains a graphical representation of the end restraint effect on a simple girder. Using the graph, a conceptual measure of end-restraint can be defined after the girder and spring constants are evaluated through structural identification techniques.
P
L/2 L/2
M e
M m
K r EI
Figure E.2 Moment Diagram of Girder with Rotational End Restraint.

LOAD TESTING AND LOAD RATING REPORT – NORTH KINGSTOWN, RI BRIDGE 896 79
End Restraint Fixity Terms
0
0.1
0.2
0.3
0.4
0.5
0.6
0.7
0.8
0.9
1
0 1 2 3 4 5 6 7 8 9 10
(EI)/(KL) - Radians
End
- M
idsp
an M
omen
t Rat
io (M
end
/ Mm
id)
Figure E.3 Relationship Between Spring Stiffness and Fixity Ratio.
MODEL CORRELATION AND PARAMETER MODIFICATION
The accuracy of the model is determined numerically by the analysis using several statistical relationships and through visual comparison of the strain histories. The numeric accuracy values are useful in evaluating the effect of any changes to the model, where as the graphical representations provide the engineer with the best perception for why the model is responding differently than the measurements indicate. Member properties that cannot be accurately defined by conventional methods or directly from the field data are evaluated by comparing the computed strains with the measured strains. These properties are defined as variable and are evaluated such that the best correlation between the two sets of data is obtained. It is the engineer’s responsibility to determine which parameters need to be refined and to assign realistic upper and lower limits to each parameter. The evaluation of the member property is accomplished with the aid of a parameter identification process (optimizer) built into the analysis. In short, the process consists of an iterative procedure of analysis, data comparison, and parameter modification. It is important to note that the optimization process is merely a tool to help evaluate various modeling parameters. The process works best when the number of parameters is minimized and reasonable initial values are used.

LOAD TESTING AND LOAD RATING REPORT – NORTH KINGSTOWN, RI BRIDGE 896 80
During the optimization process, various error values are computed by the analysis program that provides a quantitative measure of the model accuracy and improvement. The error is quantified in four different ways, each providing a different perspective of the model's ability to represent the actual structure; an absolute error, a percent error, a scale error and a correlation coefficient.
The absolute error is computed from the absolute sum of the strain differences. Algebraic differences between the measured and theoretical strains are computed at each gage location for each truck position used in the analysis; therefore, several hundred strain comparisons are generally used in this calculation. This quantity is typically used to determine the relative accuracy from one model to the next and to evaluate the effect of various structural parameters. It is used by the optimization algorithm as the objective function to minimize. Because the absolute error is in terms of micro-strain (mε) the value can vary significantly depending on the magnitude of the strains, the number of gages and number of different loading scenarios. For this reason, it has little conceptual value except for determining the relative improvement of a particular model.
A percent error is calculated to provide a better qualitative measure of accuracy. It is computed as the sum of the strain differences squared divided by the sum of the measured strains squared. The terms are squared so that error values of different sign will not cancel each other out, and to put more emphasis on the areas with higher strain magnitudes. A model with acceptable accuracy will usually have a percent error of less than 10%.
The scale error is similar to the percent error except that it is based on the maximum error from each gage divided by the maximum strain value from each gage. This number is useful because it is based only on strain measurements recorded when the loading vehicle is in the vicinity of each gage. Depending on the geometry of the structure, the number of truck positions, and various other factors, many of the strain readings are essentially negligible. This error function uses only the most relevant measurement from each gage.
Another useful quantity is the correlation coefficient, which is a measure of the linearity between the measured and computed data. This value determines how well the shapes of the computed response histories match the measured responses. The correlation coefficient can have a value between 1.0 (indicating a perfect linear relationship) and -1.0 (exact opposite linear relationship). A good model will generally have a correlation coefficient greater than 0.90. A poor correlation coefficient is usually an indication that a major error in the modeling process has occurred. This is generally caused by poor representations of the boundary conditions or the loads were applied incorrectly (i.e. truck traveling in wrong direction).
The following table contains the equations used to compute each of the statistical error values:

LOAD TESTING AND LOAD RATING REPORT – NORTH KINGSTOWN, RI BRIDGE 896 81
Table E.1 Error Functions
ERROR FUNCTION EQUATION
Absolute Error |c - m| εε
Percent Error ( ) )2m( / c - m2 εεε
Scale Error
|gagem|
|gagec - m|
ε
εεmax
max
Correlation Coefficient
)2c - c()2m - m(
)c - c)(m - m(
εεεε
εεεε
In addition to the numerical comparisons made by the program, periodic visual comparisons of the response histories are made to obtain a conceptual measure of accuracy. Again, engineering judgment is essential in determining which parameters should be adjusted so as to obtain the most accurate model. The selection of adjustable parameters is performed by determining what properties have a significant effect on the strain comparison and determining which values cannot be accurately estimated through conventional engineering procedures. Experience in examining the data comparisons is helpful; however, two general rules apply concerning model refinement. When the shapes of the computed response histories are similar to the measured strain records but the magnitudes are incorrect this implies that member stiffness must be adjusted. When the shapes of the computed and measured response histories are not very similar then the boundary conditions or the structural geometry are not well represented and must be refined.
In some cases, an accurate model cannot be obtained, particularly when the responses are observed to be non-linear with load position. Even then, a great deal can be learned about the structure and intelligent evaluation decisions can be made.
LOAD TESTING AND LOAD RATING REPORT – NORTH KINGSTOWN, RI BRIDGE 896 82
F. APPENDIX F - LOAD RATING PROCEDURES A load-rating factor is a numeric value indicating a structure’s ability to carry a specific load.
Load rating factors were computed by applying standard design loads along with the structure’s self-weight and asphalt overlay. Rating factors are computed for various structural components and are equal to the ratio of the component’s live load capacity and the live load applied to that component; including all appropriate load factors. A load-rating factor greater than 1.0 indicates a member’s capacity exceeds the applied loads with the desired factors of safety. A rating factor less than 1.0 indicates a member is deficient such that a specific vehicle cannot cross the bridge with the desired factor of safety. A number near 0.0 indicates the structure cannot carry its own dead weight and maintain the desired safety factor. The lowest component rating-factor generally controls the load rating of the entire structure. Additional factors are applied to account for variability in material, load application, and dynamic effects. Two levels of load rating are performed for the bridge. An Inventory Level rating corresponds to the design stress levels and/or factors of safety and represents the loads that can be applied on a daily basis. The Operating Rating levels correspond to the maximum load limits above which the structure may experience damage or failure.
For borderline bridges (those that calculations indicate a posting is required), the primary drawback to conventional bridge rating is an oversimplified procedure for estimating the load applied to a given beam (i.e. wheel load distribution factors) and a poor representation of the beam itself. Due to lack of information and the need for conservatism, material and cross-section properties are generally over-estimated and beam end supports are assumed to be simple when in fact even relatively simple beam bearings have a substantial effect on the midspan moments. Inaccuracies associated with conservative assumptions are compounded with complex framing geometries. From an analysis standpoint, the goal here is to generate a model of the structure that is capable of reproducing the measured strains. Decisions concerning load rating are then based on the performance of the model once it is proven to be accurate.
The main purpose for obtaining an accurate model is to evaluate how the bridge will respond when standard design loads, rating vehicles or permit loads are applied to the structure. Since load testing is generally not performed with all of the vehicles of interest, an analysis must be performed to determine load-rating factors for each truck type. Load rating is accomplished by applying the desired rating loads to the model and computing the stresses on the primary members. Rating factors are computed using the equation specified in the AASHTO Manual for Condition Evaluation of Bridges - see Equation (1).
It is important to understand that diagnostic load testing and the integrated approach are most applicable to obtaining Inventory (service load) rating values. This is because it is assumed that all of the measured and computed responses are linear with respect to load. The integrated approach is an excellent method for estimating service load stress values but it generally provides little additional information regarding the ultimate strength of particular structural members. Therefore, operating rating values must be computed using conventional assumptions regarding member capacity. This limitation of the integrated approach is not viewed as a serious concern, however, because load responses should never be permitted to reach the inelastic range.
Operating and/or Load Factor rating values must also be computed to ensure a factor of safety between the ultimate strength and the maximum allowed service loads. The safety to the public is of vital importance but as long as load limits are imposed such that the structure is not damaged then safety is no longer an issue.

LOAD TESTING AND LOAD RATING REPORT – NORTH KINGSTOWN, RI BRIDGE 896 83
Following is an outline describing how field data is used to help in developing a load rating for the superstructure. These procedures will only complement the rating process, and must be used with due consideration to the substructure and inspection reports.
1. Preliminary Investigation: Verification of linear and elastic behavior through continuity of
strain histories, locate neutral axis of flexural members, detect moment resistance at beam supports, and qualitatively evaluate behavior.
2. Develop representative model: Use graphic pre-processors to represent the actual geometry
of the structure, including span lengths, girder spacing, skew, transverse members, and deck. Identify gage locations on model identical to those applied in the field.
3. Simulate load test on computer model: Generate 2-dimensional model of test vehicle and
apply to structure model at discrete positions along same paths defined during field tests. Perform analysis and compute strains at gage location for each truck position.
4. Compare measured and initial computed strain values: Various global and local error
values at each gage location are computed and visual comparisons made with post-processor. 5. Evaluate modeling parameters: Improve model based on data comparisons. Engineering
judgment and experience is required to determine which variables are to be modified. A combination of direct evaluation techniques and parameter optimization are used to obtain a realistic model. General rules have been defined to simplify this operation.
6. Model evaluation: In some cases it is not desirable to rely on secondary stiffening effects if
it is likely they will not be effective at higher load levels. It is beneficial, though, to quantify their effects on the structural response so that a representative computer model can be obtained. The stiffening effects that are deemed unreliable can be eliminated from the model prior to the computation of rating factors. For instance, if a non-composite bridge is exhibiting composite behavior, then it can conservatively be ignored for rating purposes. However, if it has been in service for 50 years and it is still behaving compositely, chances are that very heavy loads have crossed over it and any bond-breaking would have already occurred. Therefore, probably some level of composite behavior can be relied upon. When unintended composite action is allowed in the rating, additional load limits should be computed based on an allowable shear stress between the steel and concrete and an ultimate load of the non-composite structure.
7. Perform load rating: Apply HS-20 and/or other standard design, rating and permit loads to
the calibrated model. Rating and posting load configuration recommended by AASHTO are shown in Figure 4.
8. The same rating equation specified by the AASHTO - Manual for the Condition
Evaluation of Bridges is applied:
( ) ( ) ( )( )IMLL
PDW DC- C = RF
L
PDWDC
+±−
(1)
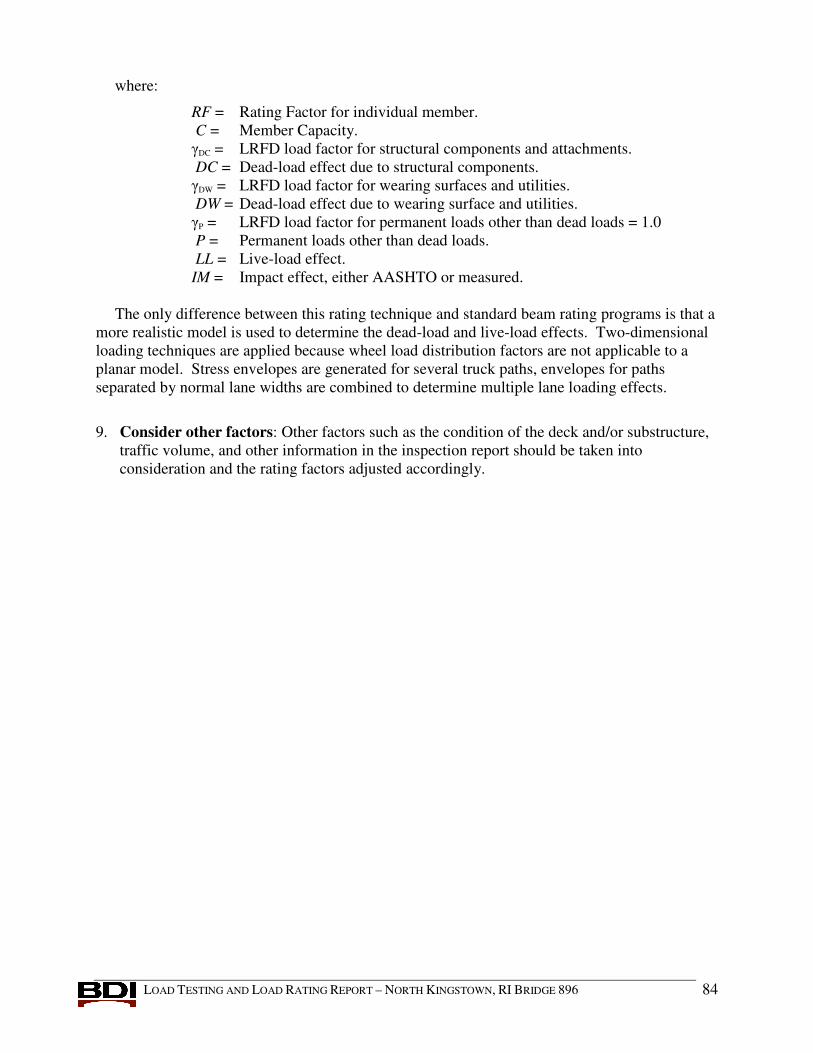
LOAD TESTING AND LOAD RATING REPORT – NORTH KINGSTOWN, RI BRIDGE 896 84
where:
RF = Rating Factor for individual member. C = Member Capacity. DC = LRFD load factor for structural components and attachments. DC = Dead-load effect due to structural components. DW = LRFD load factor for wearing surfaces and utilities. DW = Dead-load effect due to wearing surface and utilities.
P = LRFD load factor for permanent loads other than dead loads = 1.0 P = Permanent loads other than dead loads. LL = Live-load effect. IM = Impact effect, either AASHTO or measured. The only difference between this rating technique and standard beam rating programs is that a
more realistic model is used to determine the dead-load and live-load effects. Two-dimensional loading techniques are applied because wheel load distribution factors are not applicable to a planar model. Stress envelopes are generated for several truck paths, envelopes for paths separated by normal lane widths are combined to determine multiple lane loading effects.
9. Consider other factors: Other factors such as the condition of the deck and/or substructure,
traffic volume, and other information in the inspection report should be taken into consideration and the rating factors adjusted accordingly.
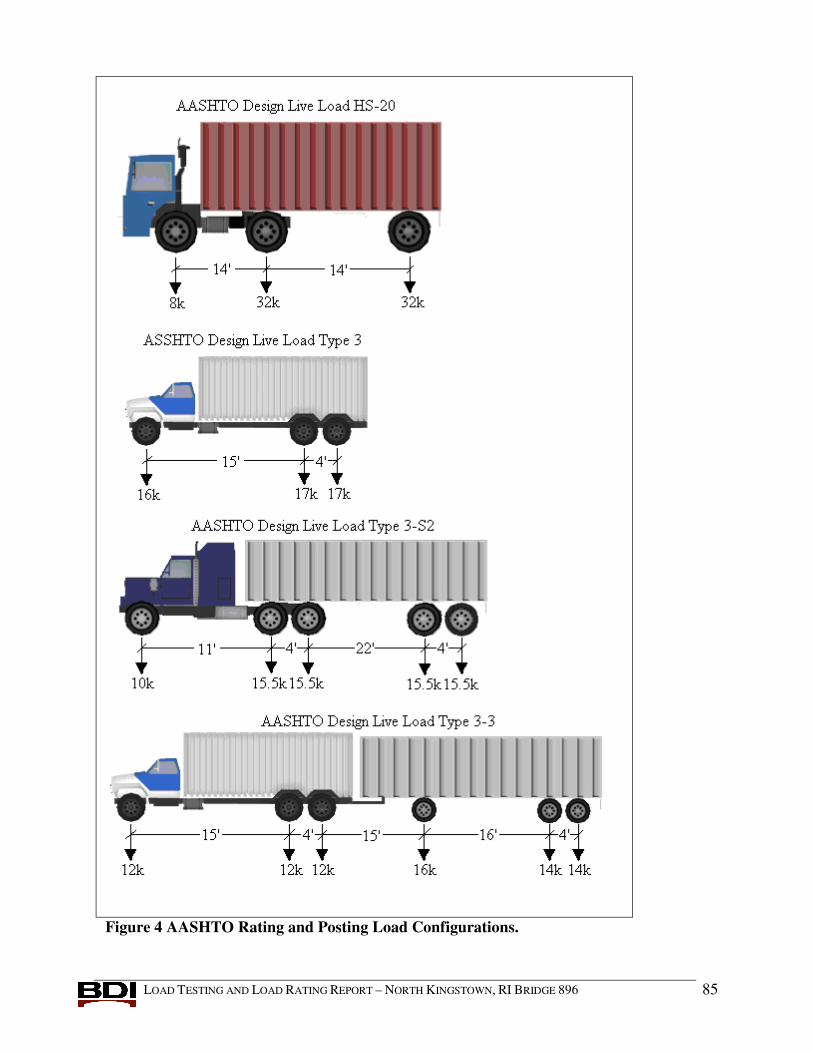
LOAD TESTING AND LOAD RATING REPORT – NORTH KINGSTOWN, RI BRIDGE 896 85
Figure 4 AASHTO Rating and Posting Load Configurations.

LOAD TESTING AND LOAD RATING REPORT – NORTH KINGSTOWN, RI BRIDGE 896 86
Table 2 Limit states and load factors for load rating (AASHTO LRFR 2003)
Table 3 Condition and system factors for LRFR load rating
Good or Satisfactory 1.00
Fair 0.95 Condition Factor, c
Poor 0.85
Welded Members in Two-Girder/Truss/Arch Bridges 0.85
Riveted Members in Two-Girder/Truss/Arch Bridges 0.90
Multiple Eyebar Members in Truss Bridges 0.90
Three-Girder Bridges with Girder Spacing 6 ft. 0.85
Four-Girder Bridges with Girder Spacing 4 ft. 0.95
All other Girder Bridges and Slab Bridges 1.00
Floorbeams with Spacing > 12 ft. and Non-Continuous Stringers 0.85
System Factor, s
Redundant Stringers Subsystems Between Floorbeams 1.00

LOAD TESTING AND LOAD RATING REPORT – NORTH KINGSTOWN, RI BRIDGE 896 87
Table 4 LRFD Resistance Factors
Capacity Steel
Resistance Factor
R/C Resistance
Factor
PS/C Resistance
Factor Flexure, b 1.00 0.90 1.00
Shear, v 1.00 0.90 0.90

LOAD TESTING AND LOAD RATING REPORT – NORTH KINGSTOWN, RI BRIDGE 896 88
APPENDIX I - REFERENCED MATERIAL
AASHTO (2004). "AASHTO LRFD Bridge Design Specifications." Washington,D.C. AASHTO, (2008). "The Manual for the Bridge Evaluation", Washington,D.C. Commander,B., (1989). "An Improved Method of Bridge Evaluation: Comparison of Field Test Results with Computer Analysis." Master Thesis, University of Colorado, Boulder, CO. Gerstle, K.H., and Ackroyd,M.H. (1990). "Behavior and Design of Flexibly-Connected Building Frames." Engineering Journal, AISC, 27(1),22-29. Goble,G., Schulz,J., and Commander,B. (1992). "Load Prediction and Structural Response." Final Report, FHWA DTFH61-88-C-00053, University of Colorado, Boulder, CO. Lichtenstein,A.G.(1995). "Bridge Rating Through Nondestructive Load Testing." Technical Report, NCHRP Project 12-28(13)A. Schulz,J.L. (1989). "Development of a Digital Strain Measurement System for Highway Bridge Testing." Masters Thesis, University of Colorado, Boulder, CO. Schulz,J.L. (1993). "In Search of Better Load Ratings." Civil Engineering, ASCE 63(9),62-65.