
Field Studies 5 (1987), 619-655 THE RAINFALL RUNOFF...
40
THE RAINFALL_RUNOFF RELATIONSHIP IN A SMALL CATCHMENT HEATHER HOWCROFT The LeonardWills Field Cente,Nettlecombe Court,lVilliton, Taunton, Somerset TA4 4HT and ALEC \f ILLIS Vessex Water Authority, King Square,Bridgwater, Somerset TA6 3EA ABSTRACT Following Gregory and walling (1971), who described how relatively simple equip- ment can be used to monitor processes in a small drainage basin, experiments were started in rhe catchmenr close to the Leonard'Wills Field Centre (grid reference ST 0537) in 1973.The purpose ofthese experiments was to provide a set oflong-term data which could be easily incorporated into sixth form coursesand which would illustrate the hydrological principles included in A-level syllabuses. This paper outlines the results collected over the last twelve years and provides an interpretation ofboth the water balance within the catchment and also the long and short term responses of the streamto rainfall. INrRooucrroN Wernn is of vital importance to man and the study of hydrology encompasses the relation- ship of water, in all its forms, between the atmosphere, the land and the sea. These relationships are rarely simple. S7hen precipitation falls over landmasses only a small proportion enters surface water bodies directly. The remainder reaches streams' rivers and lakes via the vegetation, soils and rocks of the surrounding area; processes which take a variable amount of time and during which large volumes of water may return to the atmosphere through evaporation and transpiration. The amount of water enter- ing streams and rivers may, therefore, only be a small proportion of that which fell as precipitation. The processes by which precipitation reachesa stream are shown diagrammatically in Fig. L Only a small proportion of it enters the stream directly as channel precipitation, the remainder falls onto the surrounding land. Of this, some will be intercepted by the vegetation cover) the degree of interception depending on the type of vegetation' the time of year and the intensity of the precipitation. Some of the intercepted water will evaporate but the rest will reach the ground either by flowing along stems, branches and trunks of vegetarion (stemflow) or by falling from the leaves to the ground (throughfall). On reaching the ground the water moves into the soil, a processknown asinfiltration and resulting from the pull of both gravitational and capillary forces. The rate of infiltration dependson the hydraulic conductiaityof the soil-its porosity and permeability. The porosity describes the water-holding capacity and is controlled by the number of voids or pores present. The permeability is the extent to which the soil allows movement of water and, although influenced by porosity, it is the size of the pores, rather than their number which is important. When investigating the movement of water in soil, it is necessary to consider three sets of forces:- molecularJ capillary and gravitational. Molecular forces hold a thin volume of water to the area immediately surrounding each soil particle and they are so powerful that 6t9
Transcript of Field Studies 5 (1987), 619-655 THE RAINFALL RUNOFF...

Field Studies 5 (1987), 619-655
THE RAINFALL_RUNOFF RELATIONSHIPIN A SMALL CATCHMENT
HEATHER HOWCROFTThe LeonardWills Field Cente,Nettlecombe Court,lVilliton, Taunton, Somerset TA4 4HT
and ALEC \f ILLIS
Vessex Water Authority, King Square, Bridgwater, Somerset TA6 3EA
ABSTRACT
Following Gregory and walling (1971), who described how relatively simple equip-
ment can be used to monitor processes in a small drainage basin, experiments were
started in rhe catchmenr close to the Leonard'Wills Field Centre (grid reference ST
0537) in 1973. The purpose ofthese experiments was to provide a set oflong-term data
which could be easily incorporated into sixth form courses and which would illustrate
the hydrological principles included in A-level syllabuses. This paper outlines the
results collected over the last twelve years and provides an interpretation ofboth the
water balance within the catchment and also the long and short term responses of the
stream to ra infa l l .
INrRooucrroN
Wernn is of vital importance to man and the study of hydrology encompasses the relation-
ship of water, in all its forms, between the atmosphere, the land and the sea. These
relationships are rarely simple. S7hen precipitation falls over landmasses only a
small proportion enters surface water bodies directly. The remainder reaches streams'
rivers and lakes via the vegetation, soils and rocks of the surrounding area; processes
which take a variable amount of time and during which large volumes of water may return
to the atmosphere through evaporation and transpiration. The amount of water enter-
ing streams and rivers may, therefore, only be a small proportion of that which fell as
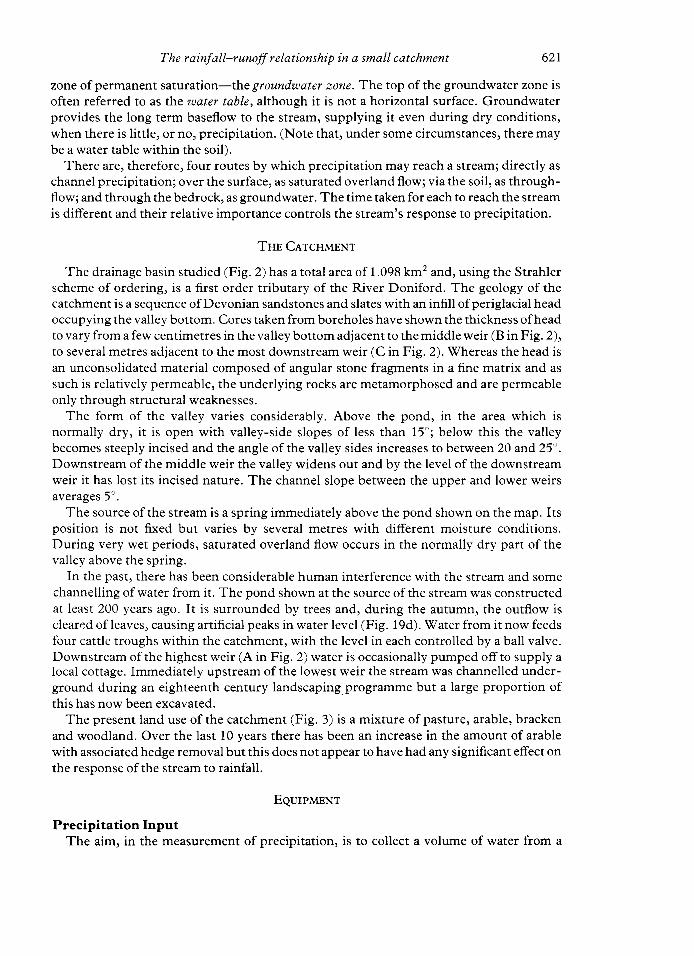
precipitation.The processes by which precipitation reaches a stream are shown diagrammatically in
Fig. L Only a small proportion of it enters the stream directly as channel precipitation,
the remainder falls onto the surrounding land. Of this, some will be intercepted by the
vegetation cover) the degree of interception depending on the type of vegetation' the time
of year and the intensity of the precipitation. Some of the intercepted water will evaporate
but the rest will reach the ground either by flowing along stems, branches and trunks of
vegetarion (stemflow) or by falling from the leaves to the ground (throughfall). On reaching
the ground the water moves into the soil, a process known as infiltration and resulting from
the pull of both gravitational and capillary forces.The rate of infiltration depends on the hydraulic conductiaity of the soil-its porosity and
permeability. The porosity describes the water-holding capacity and is controlled by the
number of voids or pores present. The permeability is the extent to which the soil allows
movement of water and, although influenced by porosity, it is the size of the pores, rather
than their number which is important.When investigating the movement of water in soil, it is necessary to consider three sets of
forces:- molecularJ capillary and gravitational. Molecular forces hold a thin volume of
water to the area immediately surrounding each soil particle and they are so powerful that
6t9

620 H. J. HowcnoFr AND A. Wrrrrs
P R E C I P I T A T I O NI N P O T
TRIXSPIR/{TJO]V LOSS
I n f i l t r a c i o n
EVAPORATION LOSS
Incercepc ion,rf!,inlll',,
IIIIt ?',Sf'V,
4,#
)
'f
"rornor^lr, \
Diagrammatic r"r- .rli".'J;r," hydrological cycte.
this hygroscopic water can be ignored in the hydrological system. Capillary forces acrslightly further away from the soil particle, exerting a suction effect which draws watertowards the particle even against the force of gravity. Gravity itself operates in largepotes (mauopores), where soil particles are sufficiently far apart for capillary forces to beineffective, causing water to move down through the soil profile.
Most soils show a decrease in permeability with depth. This results in the downslopemovement of water within the surface layers, sometimes in pipes; a process known asthroughflow. A similar effect may be caused by a decrease in permeability at the junctionbetween soil and bedrock. The throughflow thus generated contributes to the runoffof thestream but the time taken is highly variable, depending on the prevailing moisture con-ditions. However, this downslope movement does result in a relatively high moisturecontent at the base ofthe slope leading to early saturation ofthis area in the event ofheavyrainfall, partly from local rainfall and partly from throughflow arriving from upslope.Under these conditions rain may well fall at a faster rate than infiltration can take place withthe result that water flows over the surface as saturated oaerlandflow,resulting in an almostimmediate transfer of rainwater to stream runoff. This saturated zone is normally restric-ted to the flat floodplain area adjacent to the stream, and to the valley head. It is oftenreferred to as the partial contributing area. Tlnis is a dynamic zone, whose size variesaccording to the moisture conditions and it may extend to the valley sides if, for example,surface saturation of the soil is maintained by throughflow from higher up the slope.However, movement over the surface will not occur until all irregularities in the groundhave filled with water (depression storage) and start to overflow. This idea of a partialcontributing area is in contrast to Horton's ( I 945) suggestion that overland flow, resultingfrom an excess of precipitation over infiltration, commonly occurs over most of thedrainage basin.
Finally, mainly in winter, some water will percolate from the base of the soil, into andthrough the underlying bedrock, the rate ofpercolation being controlled by the porosityand the permeability of the rock itself. The water moves slowly downwards towards the
The rainfall-runofl relationship in a small catchment 621
zone of permanent saturation-thegroundwater zone.Tlire top of the groundwater zone isoften referred to as the water table, although it is not a horizontal surface. Groundwaterprovides the long term baseflow to the stream, supplying it even during dry conditions,when there is little, or no, precipitation. (Note that, under some circumstances) there maybe a water table within the soil).
There are, therefore, four routes by which precipitation may reach a stream; directly aschannel precipitation; over the surface, as saturated overland flow; via the soil, as through-flow; and through the bedrock, as groundwater. The time taken for each to reach the streamis different and their relative importance controls the stream's response to precipitation.
Tun CarcnmnNr
The drainage basin studied (Fig.2) has a total area of 1.098 km2 and, using the Strahlerscheme of ordering, is a first order tributary of the River Doniford. The geology of thecatchment is a sequence of Devonian sandstones and slates with an infill of periglacial headoccupying the valley bottom. Cores taken from boreholes have shown the thickness of headto vary from a few centimetres in the valley bottom adjacent to the middle weir (B in Fig. 2),to several metres adjacent to the most downstream weir (C in Fig. 2). Vhereas the head isan unconsolidated material composed of angular stone fragments in a fine matrix and assuch is relatively permeable, the underlying rocks are metamorphosed and are permeableonly through structural weaknesses.
The form of the valley varies considerably. Above the pond, in the area which isnormally dry, it is open with valley-side slopes of less than l5'; below this the valleybecomes steeply incised and the angle of the valley sides increases ro between 20 and 25' .Downstream of the middle weir the valley widens out and by the level of the downstreamweir it has lost its incised nature. The channel slope between the upper and lower weirsaverages 5".
The source of the stream is a spring immediately above the pond shown on the map. Itsposition is not fixed but varies by several metres with different moisture conditions.During very wet periods, saturated overland flow occurs in the normally dry part of thevalley above the spring.
In the past, there has been considerable human interference with the stream and somechannelling of water from it. The pond shown at the source of the stream was constructedat least 200 years ago. It is surrounded by trees and, during the autumn, the outflow iscleared of leaves, causing artificial peaks in water level (Fig. l9d). \Water from it now feedsfour cattle troughs within the catchment, with the level in each controlled by a ball valve.Downstream of the highest weir (A in Fig. 2) water is occasionally pumped offto supply alocal cottage. Immediately upstream of the lowest weir the stream was channelled under-ground during an eighteenth century landscaping.programme but a large proportion ofthis has now been excavated.
The present land use of the catchment (Fig. 3) is a mixture of pasture, arable, brackenand woodland. Over the last l0 years there has been an increase in the amount of arablewith associated hedge removal but this does not appear to have had any significant effect onthe resDonse ofthe stream to rainfall.
EqurnmeNr
Precipitation InputThe aim, in the measurement of precipitation, is to collect a volume of water from a

622 H. J. HowcnoFr AND A. u7Irus
N E T T L E C O M B EC O U R T
..'- -_1----:/--
s ' ! ! 9/ ' \ !
/ o/ lt)
/ c !
/III\\
-l zoo\\\\ z s\\\t
a n n I
n
r
\ - '\ - /
SCALE0 . 2 k m .
KEY
FrG.2 .Map of the catchment, showing the position of the equipment.
CATCHMENT I'ATERSHED
METEOROLOGICAL STATIONS
POTENTIAL EVAPOTRANSPIROMITIR
V - NOTCH UJIIRS
t
O
!

The rainfall-runoff relationship in a small catchment 623
\: \
/: l',
t / t '
\tIIIIII
I
II
ln\Y,
CATCHMENT UJATERSHLD
[]
E]
q i A r f0 0 . 2 k m .
[Jood]and
I - lK E Y l " " l P a s t u r e
Fa\ Bracken1... \ |
F rc .3 .Map of the catchment, showing lmd use

624 H. J. HowcnoFr AND A. Wrrrrs
known area and to express it as units of depth, usually millimetres. The area over which theprecipitation is collected is defined by the collecting funnel or raingauge rim and it isassumed that the depth of water collected by the gauge is the same as that falling on thesurrounding area. There are a number of problems associated with this assumption. A tallraingauge acts as an obstacle to the flow of wind (and may result in falling rain being carriedpast the gauge-leading to an underestimate). Alternatively, if the rim is very close to theground, insplashing may occur giving rise to an overestimate. The Meteorological Officehas standardised by issuing raingauges which are 127 mm in diameter and placed so thatthe rim is 305 mm offthe ground.
The standard meteorological raingauge is emptied and the precipitation measuredand recorded every 24 hours at 0900 GMT. If the intensity and duration of the rainfallare required then it is necessary to instal an autographic raingauge. Those used in thisexperiment are of the self-syphoning type, fitted with daily charts on which I mm of rain isrepresented by a rise of l0 mm on the chart (Fig. 4).
The location of raingauges is also important, as the value of all data collected depends onthe extent to which the sites chosen are representative of the surrounding area. Ideally, anetwork of gauges should cover the entire basin. The monitoring of such a network isimpractical for the Field Centre and measurements are made at iust two sites, one situatedjust below the catchment at 100 m and the other on the watershed of the River Doniford at270 m (Fig. 2). Over the twelve year period of this study, rainfall at the higher site has been10o,, greater than that at the lower but, throughout the results, averages of the two siteshave been calculated. Both sites are official climatological stations, recording data for theMeteorological Office and for the Wessex Water Authority, and include both standard andautographic raingauges.
Strearnflow OutputStream discharge is the volume of water moving per unit of time, for small streams
normally expressed as l itres per second (l s I). This can be measured in a number of ways,the simplest being to multiply the cross sectional area of the channel by the "averagevelocity of the stream". This method is relatively straightforward and is frequently used infieldwork but it is difficult to obtain accurate results especially on small streams. Variationsof200ou have been obtained by groups ofsixth form students!
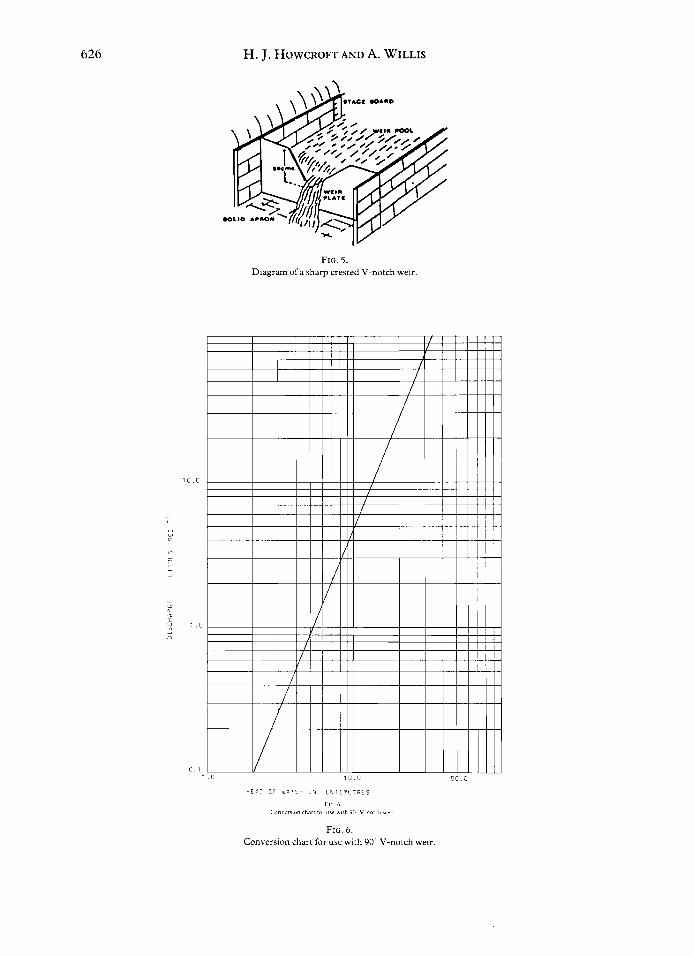
For long term records it is necessary to adopt a more accurate method, made possible bythe construction of a V-notch weir (Fig. 5). The weir is formed by cutting a sharp-edgedtriangular notch into a metal plate and installing it in a watertight manner across thestream. The angle of the notch is chosen to suit the size of the stream. In this study angles of90'' were used. The stream is channelled to flow through the notch and the height of waterover the V, measurable anywhere in the weir pool, is proportional to the discharge.For a 90' notch this relationship can be written mathematically as:
Q:0 '015 11? a8 (Gregory and Wal l ing, l97 l )where
Q is the stream discharge in litres per second.FI is the head of water over the notch in centimetres.
The equation can be plotted as a line on logarithmic graph paper from which the head ofwater can be converted directly to discharge (Fig. 6).
Three 90' weirs were installed on the stream draining the Nettlecombe basin; the onenearest the source positioned immediately downstream of the pond (A in Fig. 2) with adrainage area of 0.505 km2; the middle (B in Fig. 2) anarcaof 0.721km2; and the farthest

The rainfall-runofl relationship in a small catchment 625
!
@
H I
u
7
a
o
nI
EO{@
I
626 H. J. HowcnoFr AND A. $7nrrs
Ftc . 5 .Diagrm of a sharp crested V-notch weir
1 0 . 0
f [ ! ' - i L r f ] ! a r ! F I l t E l T I f l l r R L S
F r c . 6 .( - o n \ e r s r n c h a i i h r u s e s ' r h q 0 V n o t L h { e r
F r c . 6 .Conversion chart for use with 90' V-notch weir
r . 0 5 0 . c
The rainfall-runoff relationship in a small catchment 627
downstream (C in Fig. 2) an area of 1.098 km2. At the start of the experiment all three weirs
were read daily between 0900 and 1000 GMT with the inevitable result that several stormpeaks were left unrecorded. This situation was gradually rectified with the installation of
water level recorders at all three weirs. All are fitted with weekly charts but they record
varying changes in level. The one at present installed on the upstream weir records changes
of up to I foot (300 mm); that on the middle weir of up to 500 mm and that on the lower weir
of up to I m. The ratio at the lower weir is such that small changes in level do not show.
The Water TableDuring the first year of the experiment, instead of the expected increase in discharge
downstream, the data showed a decrease during the summer months when the discharge
was less than 5ls-1. To investigate this in relation to the water table, seven 30mmdiameter boreholes were drilled to varying depths across the valley adjacent to the lower
weir (Fig. 20a). Each borehole was lined with perforated plastic piping and the position of
the water table was measured using a conductivity probe, consisting of two electrodes
between which a current flows only on contact with a water surface. Measurements were
raken monthly.
Evapotranspiration LossesFor the first five years of the experiment, an attempt was made to measure the losses by
evaporation and transpiration. Both parameters are notably difficult to measure accurately
and are often considered together as evapotranspiration. Attempts to measure potential
rather than actual rates have been most successful where potential evapotranspiration rates
assume a constant supply of moisture, sufficient to meet the transpiration needs of the
vegetation cover. In other words, potential rates assume that the soil is constantly at fieldcapacity; where field capacity can be defined as the state of the soil after rainfall' when
excess moisture has had time to drain away and the rate of downward movement has
materially decreased. In reality, unless there really is constant rainfall, some of this
moisture is taken up by plants in transpiration, gradually depleting the supply and creating
a soil moisture deficit ( SMD ). The SMD is calculated as the amount of moisture required
to bring the soil back to field capacity and is greatest during the summer months. Potential
rates of evapotranspiration therefore tend to be overestimates of actual rates, the
discrepancy increasing with increasing SMD.One method of measuring potential evapotranspiration is to record water losses from
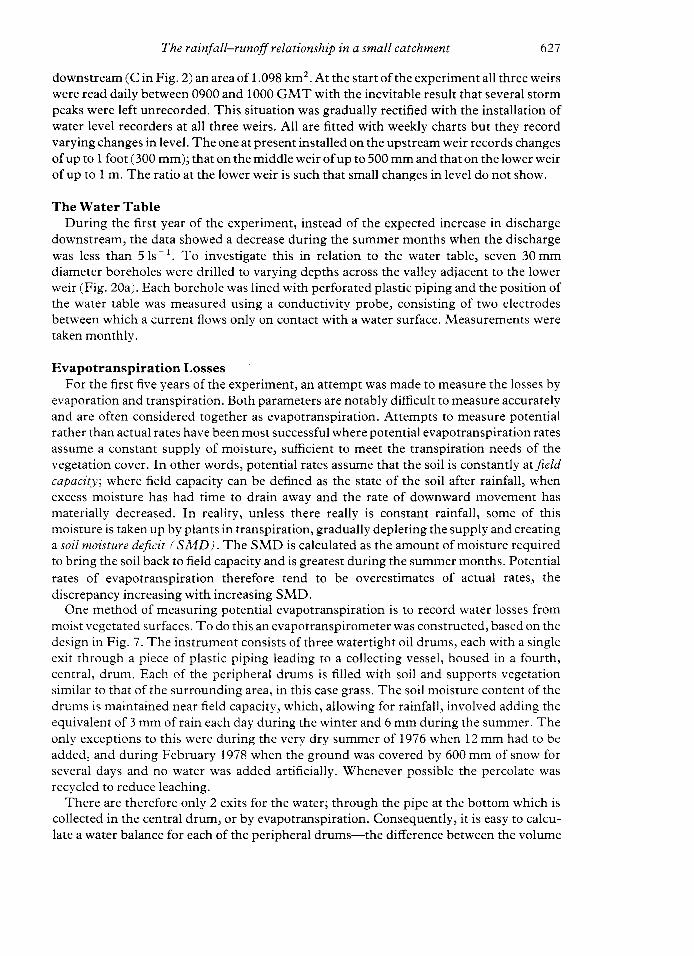
moist vegetated surfaces. To do this an evapotranspirometer was constructed, based on the
design in Fig. 7. The insrrument consists of three watertight oil drums, each with a single
exit through a piece of plastic piping leading to a collecting vessel, housed in a fourth,
cenrral, drum. Each of the peripheral drums is fi l led with soil and supports vegetation
similar to thar of the surrounding area, in this case grass. The soil moisture content of the
drums is maintained near field capacity, which, allowing for rainfall, involved adding the
equivalent of 3 mm of rain each day during the winter and 6 mm during the summer. The
only exceptions to this were during the very dry summer of 1976 when l2 mm had to be
added, and during February 1978 when the ground was covered by 600mm ofsnow for
several days and no water was added artif icially. Whenever possible the percolate was
recycled to reduce leaching.There are therefore only 2 exits for the waterl through the pipe at the bottom which is
collected in the central drum, or by evapotranspiration. Consequently, it is easy to calcu-
late a water balance for each of the peripheral drums-the difference between the volume
628 H. J. HowcnoFr AND A. N7Irus
Diagram of m ev"po,.-roi.o-.lll rlo*ing ,*o of ,ne three soil tanks.
of collected water and the water added gives a measure of potential evapotranspiration;potential since the drums are kept at field capacity. The readings were taken daily and anaverage for the three drums calculated. To express the loss as an equivalent depth ofrainfall, the volume was divided by the surface area of the drum. Daily figures were used rocalculate monthly totals.
The accuracy of this method depended on the success with which the drums were kept atfield capacity and the extent to which they were representative of the catchment area.Although changes in soil moisture storage are important on a daily basis, their importanceis negligible in the long term; a fact illustrated by the daily variation in the thrce drumscancelling out in the monthly totals. The three drums were sited on a flat piece of groundwhere there were no obstructions to precipitation. They, and the surrounding land, wereall covered by grass.
When using the results in the water balance equation, the biggest drawback was rhedifference between potential and actual rates-especially during the summer months.
In 1978 the evapotranspirometer began to give spurious results; probably one or more ofthe drums had rusted through. In the same year the Meteorological Office introduced theirRainfall and Evaporation Calculation System (MORECS) in which potential and actualrates of evapotranspiration are calculated using the Penman variables for 40 km by 40 kmgrid squares. The method of calculation was modified slightly in May 1981. The figurescalculated are for grassland, based on one soil type which is assumed to have a typical wateravailability. These figures, although calculated for a large area, have been used in the waterbalance equation since 1978. The potential rather than actual rates have been used in orderto keep the methods as consistent as possible; however, it is difficult to make any directcomparison between the two as, out of the five years of data collected using the evapotrans-pirometer, two were the exceptionally hot and dry summers of 1975 and 1976.
Rssurrs
The Water BalanceThe \Water Balance for any drainage basin may be summarized by
P :Q+r ' r+ r swhere P is precipitation (mm).
I is stream discharge expressed as a depth of runoff(mm).EI is loss by evapotranspiration (mm).A S is changes in srorage (mm).
In a "typical" year there is a balance between the input into the catchment (that is theprecipitation), and the output from the catchment (that is the sum of evapotranspirationand streamflow output as runoff). Most hydrological data is calculated for the warcr yearwhich starts on I October and ends on 30 September. This practice assumes that storage in
The rainfall-runoff relationship in a small catchment 629
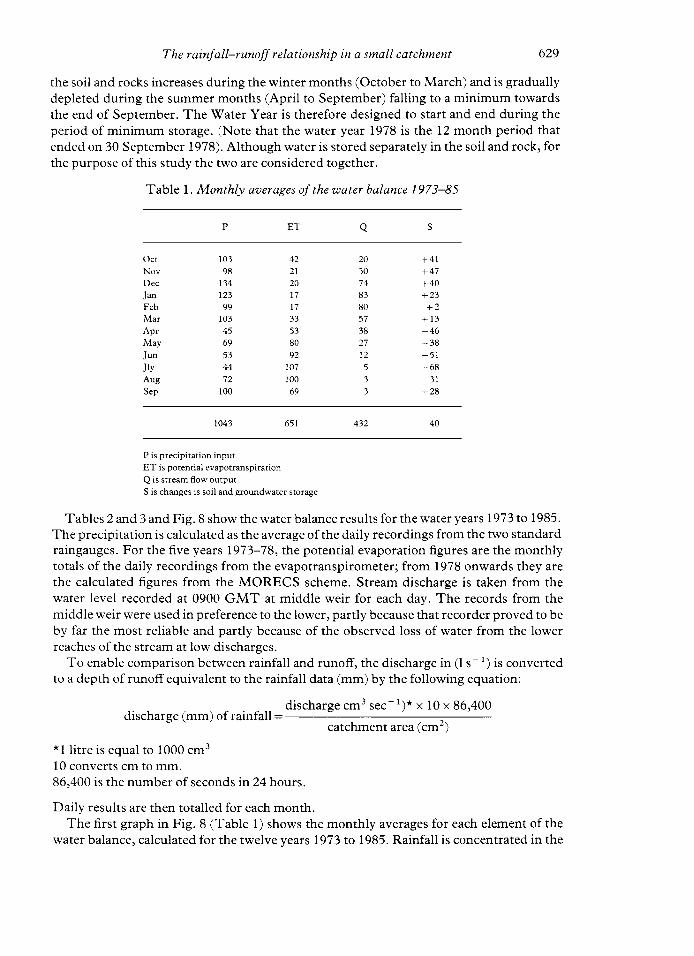
the soil and rocks increases during the winter months (October to March) and is graduallydepleted during the summer months (April to September) falling to a minimum towardsthe end of September. The Water Year is therefore designed to start and end during theperiod of minimum storage. (Note that the water year 1978 is the 12 month period thatended on 30 September 1978). Although water is stored separately in the soil and rock, forthe purpose of this study the two are considered together.
Table l. Monthly aaerages of the water balance 1973-85
10398
13412399
103456953
72100
Oct
Nov
Dec
JmFeb
Mar
Apr
May
Jun
Jl-vAug
Sep
422 l201 7t 733538092
10710069
2030
8380
38271 2533
+ 4 1+47+40+ 2 3
+ 1 3-46-38
- 6 8
+28
40651to43
P is precipitation input
ET is potential evapotranspiratiun
Q is stream flow output
S is chmges is soil and groundwater storage
Tables 2 and3 and Fig. 8 show the water balance results for the water years 1973 to 1985.The precipitation is calculated as the average of the daily recordings from the two standardraingauges. For the five years 1973-78, the potential evaporation figures are the monthlytotals of the daily recordings from the evapotranspirometerl from 1978 onwards they arethe calculated figures from the MORECS scheme. Stream discharge is taken from thewater level recorded at 0900 GMT at middle weir for each day. The records from themiddle weir were used in preference to the lower, partly because that recorder proved to beby far the most reliable and partly because of the observed loss of water from the lowerreaches ofthe sffeam at low discharges.
To enable comparison between rainfall and runoff, the discharge in (l s - 1) is converted
to a depth of runoff equivalent to the rainfall data (mm) by the following equation:
discharge (mm) of rainfall:discharge cm3 sec- t)* r l0 x 861400
catchment area (cmz)
*l l i tre is equal to 1000 cm310 converts cm to mm.86,400 is the number of seconds in 24 hours.
Daily results are then totalled for each month.The first graph in Fig. 8 (Table 1) shows the monthly averages for each element of the
water balance, calculated for the twelve years 1973 to 1985. Rainfall is concentrated in the

630 H. J. HowcnoFr AND A. \Wrrus
Table 2. The water balance for each water year I 973-85
t97H 1974-5
aETa
Oct
Nov
Dcc
JanFeb
Mar
Apr
Mav
Jun
Jl-vAug
Sep
5 3 8
53.4
7 3 . 9
l 88 .5
1 8 9 . 2
6 l . 3
19.2
94.)
64.5
43.1
90.5
204.8
1 1 3 6 . 5
P
24.513 .919.432 .133 .312.928.065.288.093.976 .1
529.6
+26 .3+ 3 6 . 1+37 .6+49 .1- 8 . 1- l . i
- 30.0+ 1 1 . 1- 35.1
55.9+ 1 1 . 5
| 148 .0
+ 189 .5
S
72.6122 .5105 .9159.629.982.45 l . 520.88 .3
53.638.4
l 5 l . 9
897.4
P
5 l . 865.562.397 .768.7
27.6t 7 . 76 .84 . 11 . 81 . 2
447.5
a\
+ 18 .0+ 46.8
46.8+22 .8
10 .060.699.7
28.3+ ?0.8
69.6
S
t .0
1 .11 6 . 9
107 .3
164.0
49.5
21.2
1 8 . 0
I 1 . 6
5 . 1
2 . 9
t4.5
117.4
t975-6
a
22.00.9
25.61 5 . 18 .0
1 7 . 333.963 .7
1o1.287.064.979.9
519 .5
197 6-7ET
(Jct
Nov
Dec
JanFeb
Mar
Apr
Ma-r
Jun
J l yArg
Sep
3 6 0
7 3 . 9
53.9
5 t .2,18.6
82.9
6 . 8.15.0
l 3 . 8
8 . 7
53.i
2 0 9 . 1
6 8 3 . 6
P
25 .026 .932 .521.416 .81 8 . 715 .877 . 5
108 .8I 86.5210..1I 3.1.5
8S7.8
ET
+ 10 .8+47 .O+ 8 .7
I 1 8 . 0+ 1 5 . 1+ 42.8
50.7- 40.2
98.2178.7r 56 .8
- 308.7
S
211.41o7.4133.5126.5t7 4 .910,1.032.851.291.720.3
117 .522.2
1227.1
P
89.,155.130.90 .0
25 .75 1 . 845.397.995.3
107 .6126.267 .8
197 .3
105 .547 .9
108 .290.0Lz i . 962.639.31 5 . 59. ,1) . 4
3 . 33 .9
618 .9
* , 18 .5+ 4 . 1+ 5 .6
+ 36.5+21.3- 10 .4- 55 .8
62 .2u ,0
, 9 2 . 7
- 12.0
19.5
- 1 8 8 . 8
S
0 .20 .0
t2 .78 .8
16.721.421.77 .7
0 .90 . 1l . l
91 .5
I S77-8 I 978-9 (calculation of ET
changed to MORECS system)
E T A
Oct
Nov
Dec
JanFeb
.\{ar
Apr
Ma-r
Jun
J lyAug
Sep
68.0
1 0 s . 0
1 0 6 . 9
1 5 0 . 2
2 3 2 . 5
1 1 2 . 0,19 .6
t 8 . 1
33.6
I 1 9 . 6
89.0
l 8 . 0
I 1 4 6 . 5
73.00 .0
17.72 i . 20 .0
60.932 .58.1.86.1.0
126.1t21 .283.6
690.0
2 , 6
11.7
49.4
65.9
1 0 9 . 6
8 3 . 6
51.2
36.0
i 1 . 9
7 . 5
7 . 3
441.9
- 7 . 6
+94.3+ 43.8+ 5 7 1
+ 122 .9
34.162 .7
- 14 .0
69.8
+ 12.6
6 .256 .6
207.1I 1 4 . 672 .8
131.383 .0
t23 .333 .321.9104.023 .0
979.4
4026l 9t'722
67687i
1058 l62
626
1 . 80 .8
t5.370.382 .884.764.520.63 r . 09..11 .92 .2
387.3
-15 .6
+29 .8+ 173.1+27 .3-32 .0
+ 6 .6.18.5
+ 34.7r'1. r'
. - .92.5
+ l 9 . l11.2
-33 .9
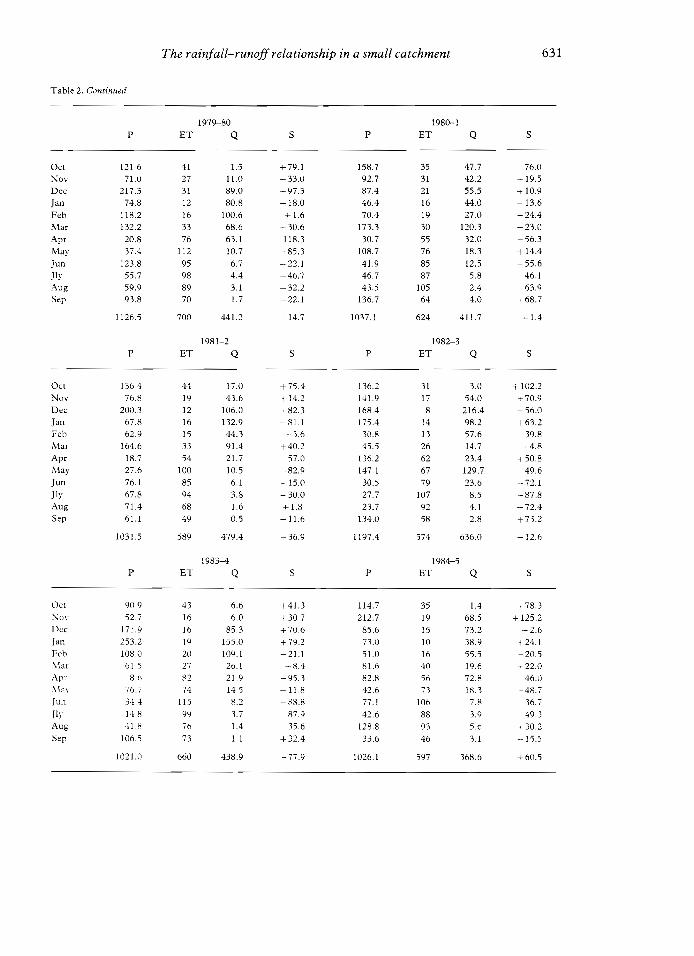
The rainfall-runoff relationship in a small catchment 631
Table 2. Continued
1979-80E T A
1980-1ET r.l
Oct
Nov
Dec
JanFeb
N{ar
Ma,r
Jlr'
S e n
t21.67 1 . 0
21,7.371.8
11,8.2132.220.8
123.855.759.993.8
t 1 2 6 . 5
P
+79 .1+ 33.0+ 97.3
18 .0+ 1 .6
+ 30.6- I 18 .3- 85 .3+ 22 .1- 46.7-32 .2
+ 2 2 . 1
- t1.7
S
158 .792.787.446.470.4
173.310.7
108 .74t .916.743.5
136.7
1037. I
P
351 t21,l o
l 93055768587
10564
624
C I
4'1.7
55.544.027.0
t20 .332.Ol8 .3t2 .55 .8
4.0
41t .7
cJ
+76 .O+ 19 .5+ 10 .9
13.6L ) L L
+23 .0
+ ) ,4.4
46.163.9
+ 68.7
+ 1 . 4
S
4 1 1 . 527 I 1 . 01t 89.012 80.816 100.633 68.676 63 .1
t t 2 10 .795 6 .798 1.489 3 .170 1 .7
700 441.2
1981-2 19B2-3
aET
Oct
Nov
Dec
JanFeb
Mar
May
Jun
Jl,v
116 4
7 6 . 8
200.3
67.8
6 2 . 9
164.6
1 8 . 7
z l - o
7 6 . 1
6?.8
7 1 . 1
6 t . l
r 0 3 1 . 5
l'
+ l 4 )
+82.38 1 . 1
+ 1 .6| 10.2- 57 .0.-82.9- 1 5 . 0- 30.0+ 1 . 8+ 1 1 . 6
36.9
S
116.21.1 I .9168 .4t75.430.8
136.2147 .130.527 . 723 .7
13.1.0
t197.4
P
3 l1 78
1 4t 126626779
1079258
574
14 17.0
l9 43.6
1 2 1 0 6 . 0
16 132.9
15 11.3
33 91 .4
54 21 .7
1 0 0 1 0 . 5
8 5 6 . 1
9 4 3 . 8
6 8 r . 6
4 9 0 . 5
589 479.1
1983-4
E-I- A
616.0
1984-5
E T A
3.0 + 102.254.0 +70.9216.4 - 56.098.2 +63.257.6 39.811.7 + 4.821.4 | 50.8129.7 49.623 .6 - 7 2 .L8 .5 - 87 .8
4 .1 72 .42 .8 +73 .2
t2 .6
)
uct
Nov
Dcc
JanFeb
Nlar
\la1
Jun
Jlr'Aug
Sep
90.9
l 7 l . 9
253.2
108.0
6 1 . 5
8 . b
i 6 . i
1 .1 .u
4 l . 8
1 0 6 . 5
1 0 2 1 . 0
6 . 6
6 . 0
8 5 . 3
1 5 5 . 0
1 0 9 . I
2 6 . 1
2L9
1 4 . 5
8 . 2
3.', l
I . 4
l . t
138.9
+11 .3+ 30.7+ 70.6
- 2 1 . 1
+ 8. ,1- 95.3
l l , 888 .887 .9
+ 32.4
- 7 7 . 9
I 14.72 t2 .785 .673.05 1 . 08 l . 682 .812.67 7 . l42 .6
r 28 .831.6
1026. I
1 . 468.573.238.955 .519 .672 .81 8 . 37 .83 .95 .6t . l
168.6
+ 78 .1! l r i )
- 2 . 6+ 24.1-20 .5
+ 22.0,16.0
- ,18.7
16. t'49.i
* 10.2
+ 60.5
l 6
l 6
l 9
2t)
2 i
8 2
71
l t 5
99
i6
73
660
35l 9l 51 0l 6.10
5673
106889346
597

632 H. J. HowcnoFr AND A. lVrrrrs
Table 3. Monthly and yearly runofl totals conaerted from the discharge at the middle weir
t'971'1 1974-5 \9754 1,976-7 1977-8 1978-9 1979-80 1980-1 l98l-Z 1982-3 1983-4 1984-5 Total Mean
Oc t 3 .0 5 l . 8Nov 3.4 65.5Dec 16.9 62.3Jan 107.3 97 .7Feb 164.0 68.7Mar 49.5 42.3Apr 21.2 27 .6May 18.0 17.7Jun I 1.6 6.8J l y 5 .1 4 . rAug 2.9 1.8Sep 14.5 1.2Year 417 .4 447 .5Average 34.8 37.3
o.2 105.5 2.60.0 47.9 14.7
t2.7 108.2 49.48.8 90.0 65.9
16.7 r27 .9 109.62 t . 4 62 .6 83 .621.7 39.3 5t .27.7 15.5 i6.03 .2 9 .4 I 1 . 90 .9 5 .4 7 . 50 .1 3 .3 7 . 3l . r 3 . 9 4 .2
94.5 618.9 443.97 . 9 5 r . 6 37 . 0
1 . 8 1 . 50 .8 I 1 . 0
r5.3 89.070.3 80.882.8 100.684.7 68.664.5 63.120.6 10.73 1 . 0 6 . 79 .4 4 .43 .9 3 .12 .2 1 .7
187 .3 441.232.3 36.8
47 .7 17 . 042.2 43.655.5 106.014.O t)?.927.0 44.1
120.3 9r .432 .0 21 .718 .3 10 .5t2 .5 6 .15 .8 3 .82 .4 1 .64.0 0.5
411.7 479.431.3 40.0
3 .0 6 .654.0 6.0
216.1 85.398.2 155.057 .6 109 .114.7 26.r23.4 21.9129.7 14.523.6 8.2
6 . t t - /
4 . t 1 . 42 . 8 l . t
616.O 418.953.0 )6.6
1 .4 242 .168.5 357.673.2 890.238.9 989.855.5 963.819.6 684.872.8 460.418.3 317.57 .8 138 .83.9 62.55 .6 37 . 53.1 40.3
368 .6 5185 .330.7 432.1
20.2?9.8
82.580.357 . 138.426 .5I 1 . 65 .23 . 13.4
Table 4. Monthly and yearly rainfall totols taken as the average of the twl meteorologicalstations
Month l97H 1974-5 19754 1976-7 1977-8 19?8-9 1979-80 1980-1 1981-2 1982-3 1983-1 198,t-5 Total Mem
Oct 53 .8 72 .6Nov 53.4 122.5Dec 73.9 105.9
Jan 188.5 159.6Feb 189.2 29.9Mar 61.3 82.4Apr 19 .2 51 .5May 94.3 20.8
Jun 64.5 8.3jly 41.r 53.6Aus 90 .5 ?8 .4Sep 204.8 1,51.9Year 1136.5 897.4Average 94.7 74.a
36.0 243.1 68.0 6.273.9 t07.4 109.0 56.653.9 t13.5 t06.9 207.45t .2 126.5 150.2 114.648.6 174.9 232.5 72.882.9 10,1.0 ll2.O 133.36.8 32.8 49.6 83.0
45.0 51.2 58.1 123.313.8 93.7 33.6 33.38.7 20.3 119.6 21.9
51.7 117.5 89.0 104.0209.1 22.2 18.0 23.0683.6 1227.4 1146.5 979.457 .0 102.1 95.5 81.6
121 .6 158 .771 .0 92 .7
2 t7 .3 87 .474.8 46.4
118.2 70.4132.2 t73.320.8 30.737.4 108.7
123.8 41.955.7 46.759.9 43.493.8 136.7
1126.5 1037.093.9 86.4
136.4 136.276.8 r11.9
20q.1 168.467 .8 r 75 .462.9 10.8
164.6 45.518.7 136.227 .6 147 . l76.1 30.567.8 27 .77 t . 4 23 .761 . I 134 .0
r03t.5 tt97 .486.0 9S.8
90.9 t t4.752.7 212.7
171 .9 85 .6253.2 73.0108 .0 51 .06 1 . 5 8 1 . 68.6 82.8
76.7 42.634.1 77.114.8 42.64 l . 8 128 .8
106.5 31.61021 .0 1026 .1
6 1 . I 6 ) - )
1238.5 103.2tt70.6 97.61612.4 r14.4148t.2 123.4I 189 .2 9S .11234.6 102.9540.7 15.1832.8 69.4631 .0 52 .6) zz . ) +J . )862 . r 71 .8
1,194.7 99.6r25r0.3 1042.51042.5
winter months, with the seven months, September to March showing above averageamounts. Potential evapotranspiration is greatest during the summer months) with theincrease in temperatures and the growth of vegetation, and all six months from April toSeptember show above average amounts. The amount of water leaving the basin as runoffwas highest in the winter with above average quantities in the four months December toMarch but with very low amounts in the four months June to September. In theory, thestorage component of the water balance equation should show a surplus of water entering

633
=g
q lx li l n
r'1 T1L - . . - - - ] - - l - r - . - 1
,l-_JH L - r - 1t- -Tl
t tt )/l r{
f l -H _
'r--!-----r_-----"1*-1
=
@
c
a
d !
D U, a
a =! ; -
- c
6 :r !
? F
> 6
r o q
b zs i
! c! e
e uo !
; FE i
: Tk ; ia 5
- o
) r
! B
A E
a
3
5o -
ta------
F - - - - i 1 - l. f - - - | -
'r-1 -fiN TD Er - 1 n! U
= I- - - .+= .....- - l-r-l LI.-t Lr___.{ r__-Jn n H
r . 1 Y H + L JI-t tl *i q .-t r,-.1I f l - d H Ht 1 t H r . i , r - . It r c t l
a
.n
+f-rrFE
q
,4F
=;:=6
--l
: l5 l
r lI'q
rItr-tE
?
a5
Jq. l F
TT-I3 f f i: l---f---l
a f E
R 3
;
;
=
T'_-lt-T-1l /c=I H
ft----l-r--Tr------1
8
e
The rainfall-runofl relationship in a small catchmenl
d11---;lT
- r--l-
i3 -=
]_-qq
d
n
..I"".."".."-----F:--
634 H. J. HowcnoFr AND A. Wrrrrs
storage during the winter months) October to March, and an overall removal from storage(deficit) during the summer months, April to September. The results show the expectedpattern with the exception of a surprisingly large surplus in September, due to theunexpectedly high rainfall in several Septembers. This is illustrated by the facts that in twoof the years during the study period, September was the wettest month and in six out of thetwelve years it had over 100 mm of rain. The overall balance shows an average loss of40 mm per year) an amount at least partially explained by the excess of potential over actualrates of evapotranspiration during the summer months. It is important to remember that itis during the summer, when the soil moisture deficit is highest, that there will be thegreatest difference between potential and actual rates. Another problem concerning thereliability of the potential evapotranspiration figures arises from the change in methodfrom measurement to calculation at the start of the 1979 water year.
Results for the individual water years (Fig. 8 and Table 2) show some interestingpatterns. 1975 had a low total rainfall of 897.7 mm resulting in a significant soil andgroundwater deficit at the end of the year. Under normal conditions this deficit wouldhave been largely replenished by winter rainfall but in the winter of 1975-6 this waswell below average with only 347 mm falling during October to March-compared toa twelve year average of 660.4 mm. This, combined with an unusually hot summer in1976 with resulting high rates of evapotranspiration, reduced the depleted storage and,consequently, the stream discharge to such an extent that only 94.5 mm left the drainagebasin as runoff compared to a twelve year average of 432.3 mm. Both these years show asignificant total annual loss of water from storage in excess of 200 mm.
Several other water years showed slight losses and only 1974 a significant gain. Theseresults, although demonstrating general trends, need to be viewed with an awarenessof potential inaccuracies in measurement, especially with respect to the estimates ofevapotranspiration.
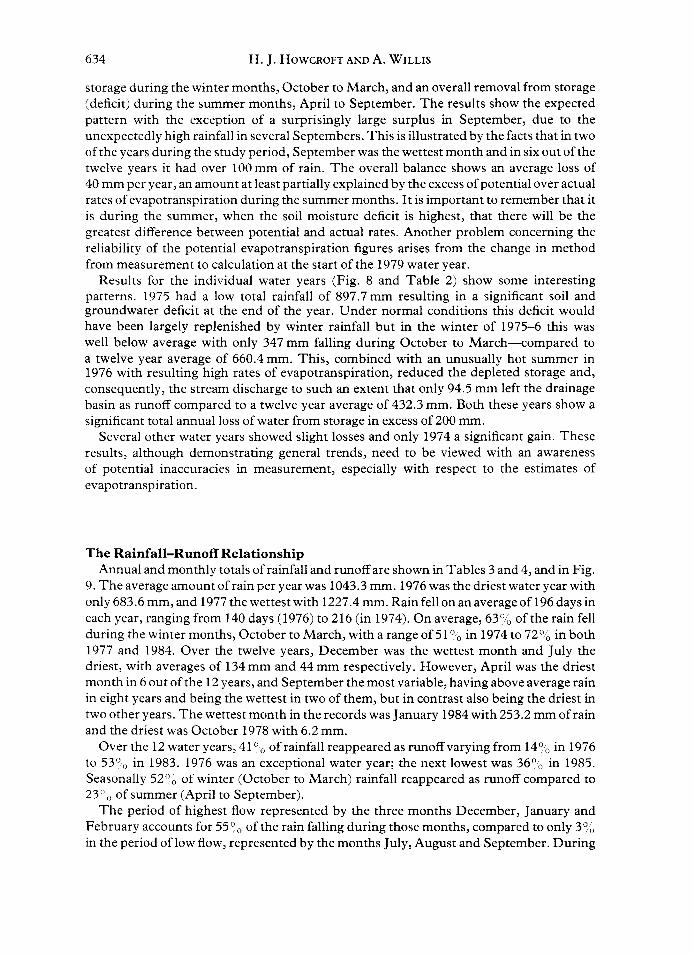
The Rainfall-Runoff RelationshipAnnual and monthly totals of rainfall and runoffare shown in Tables 3 and4, and in Fig.
9. The average amount of rain per year was 1043.3 mm. 1976 was the driest water year withonly 683.6 mm, and 1977 the wettest with 1227 .4 mm. Rain fell on an average of 196 days ineach year, ranging from I 40 days ( I 976) to 216 (in 197 4). On average, 63 u,'o of the rain fellduring the winter months, October to March, with a range of 5l l:o in l974to 720,6 in both1977 and 1984. Over the twelve years, December was the wettest month and July thedriest, with averages of 134 mm and 44mm respectively. However, April was the driestmonth in 6 out of the l2 years, and September the most variable, having above average rainin eight years and being the wettest in two of them, but in contrast also being the driest intwo other years. The wettest month in the records was January 1984 with 253.2 mmof rainand the driest was October 1978 with 6.2mm.
Over the 12 water years, 4 I o;o of rainfall reappeared as runoff varying from 149; in 197 6to 53o-u in 1983. 1976 was an exceptional water year; the next lowest was 369.; in 1985.Seasonally 52o ,, of winter (October to March) rainfall reappeared as runoff compared to23oo of summer (April to September).
The period of highest flow represented by the three months December, January andFebruary accounts for 559o of the rain falling during those months, compared to only 3o.,.'oin the period of low flow, represented by the months July, August and September. During
The rainfall-runoff relationship in a small catchment 635
R a i nn m s .1 2 0 0
1 0 0 0
8 0 0
6 0 0
4 0 0
2 0 0
X
Runoff
mms .
BO0
ea
R a i nm m 5 .1 8 0 0
1 6 0 0
1 4 0 0
1 2 0 0
'1 000
8 0 0
6 0 0
4 0 0
2 0 0
O N O J F I Y I A M J J A S O N O J F ! ] A I Y I J J
F r c .9 .(a) Annual rainfall totals. (b) Annual runofftotals. (c) Monthly rainfall totals. (d) Monthly runofftotals
these months, water loss by evaporation and transpiration is greatest but large amounts of
rainfall remainr held in the soil and rocks as storage.Taking the rwelve years as a wholer 199.n of all runoffoccurs in January representing
the equivalent of 989.8 mm of rain. The lowest proportion 0.7o:o occurs in August,
representing 37.9 mrlj.
80?g'73 74 ?5 ',76 ?? ?B ?S
1a 1s 1a 1t 1a is Bo

636 H. J. HowcnoFr AND A. \Wrrus
2@
2&
@
a
t &
a 1 6
€ r €E r r
&&&b
2&
2@
t &
a ! @
g r &
E , -&&
M
t &
a l @
.9 reE .^^E
&
@
20
o
260
26
? r @
5 t €
E r :ol , -
&
t @
eo
&
? *; -? €
50
t @
to
&
70
? 6 0
i a
? &
$
2b
1 0
o
2@
2&
no
2@
! &
? 1 @
3 r -
&
NETTLEWATER month ly regress ion
NETTLEWATER monthly regressiond
NETTLEWATER monthly regressionb
r = + , 1 2 i 9 8 ? o
1 9 ? 8 0
NETTLEWATER monthly regressionJ6
l r c 1 0
i20 r@ 2@ 24 o & & r 2 0 ! @ 2 6
E ob..ru.d ru.or Ehtuu (hh)
E.i lmai.o ru.ofr
o & & r 2 0 1 @ 2 @ 2 & O & &Elnroil (nml
o Ob..e.d rurorr - j !.fmot.d run.fr o Ob..R.d runorl
NETTLEWATER monthly regressionFd
NETTLEWATER monthly regression
o 4 & 1 2 0 1 @ 2 @
Flntoil (hh)B O b . . d . d r . o l l - E . d 6 o t 6 d r L n . l r
NETTLEWATER month ly regress ion&'
2@
24
1 &
5 r €
! ' -
&4
120 t& 2& 2S
o Ob..dd tunolt
& 120 t@ 2@ 2s
rchrot (dh)o
NETTLEWATER monthly regressionuov
o / & & l r o 1 @ 2 @
Etarot (6h)o Ob..ryd tuno'l . E.f-or.d tuioii
r = + . 2 8
d ,,,/
./.-';O E
;
-2'.+
B
T he r ainf al l-runoff r e I ati ons hip i n
NETTLEWATER monthly regressionJu^
.---*-4_s--.--_
o & & t t o r @ 2 @ 2 4
dnr6[ (6m,o Obrryd tunoll - E.tl6.l.d d6olt
a small catchmenl 637
t @
co
&
? &
; e
E o&
o
t @
eo
60
? e
; &e €
&
b
i o
ao
? " o
i *z e
&
t o
e !20
Fhtox (hh)
t { 2@ ,4
F
9 '
E -T €
$
t o
NETTLEWATER monthly regression
J:-r--
NETTLEWATER monthly regression*
o & & 1 2 0 t & 2 6 2 4
6lnt.( (FF)o ob{tud ru^olt E.i lmor.d dn6rf
o & & 1 bEl.toll rhh)
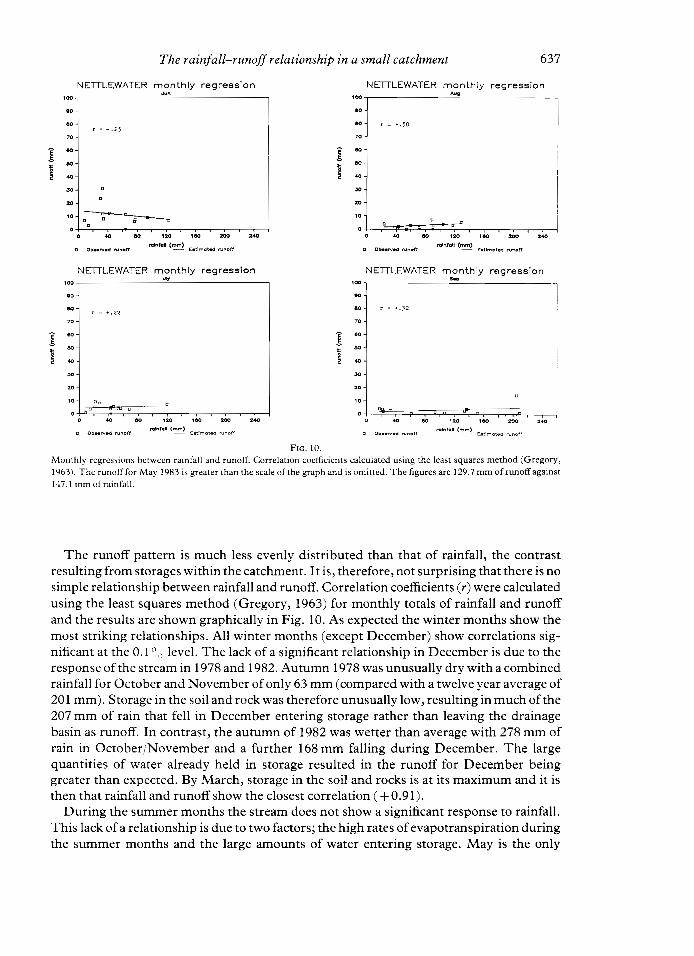
F tc . 10 .Monthly regressions between rainfall and runoff. Correlation coefficients calculated using the leasr squares method (Gregory,1963). The runofffor May 1983 is greater than the scale ofthe graph and is omitred. The figures are 129.7 mm ofrunoffagainst147.1 mm of ra in fa l l .
The runoff pattern is much less evenly distributed than that of rainfall, the contrastresulting from storages within the catchment. It is, therefore, not surprising that there is nosimple relationship between rainfall and runoff. Correlation coemcients (r) were calculatedusing the least squares method (Gregory, 1963) for monthly totals of rainfall and runoffand the results are shown graphically in Fig. 10. As expected the winter months show themost striking relationships. All winter months (except December) show correlations sig-nificant at the 0.1",, level. The lack of a significant relationship in December is due to theresponse of the stream in 1978 and1982. Autumn 1978 was unusually dry with a combinedrainfall for October and November of only 63 mm (compared with a twelve year average of201 mm). Storage in the soil and rock was therefore unusually low, resulting in much of the207 mm of rain that fell in December entering storage rather than leaving the drainagebasin as runoff. In contrast, the autumn of 1982 was wetter than average with 278 mm ofrain in October/November and a further l68mm fall ing during December. The largequantities of water already held in storage resulted in the runoff for December beinggreater than expected. By March, storage in the soil and rocks is at its maximum and it isthen that rainfall and runoffshow the closesr correlation ( +0.91).
During the summer months the stream does not show a significant response to rainfall.This lack of a relationship is due to two factorsl the high rates of evapotranspiration duringthe summer months and the large amounts of water entering storage. May is the only
NETTLEWATER monthly regression

EE
o
* 200o
45
40
a q
zc
20
1 5
6
n
NETTLEWATER summerJ u n e J u I y A u g u s t
regressron
r = + . 0 2
t r o
on _- U
tr
40 E0 120 160 200 240
rolnfoll (mm)Observed runof f Est imoted runof f
NETTLEWATTR winter reqression
zEO
D Observed runof froinfoll (mm)
Est imoted runof f
F r c . 1 l .(a) I?inter regression between rainfall and runoff, calculated using the sum of the totals for the months December, Jmuary andFebruary. (b) Sumer regression between rainfall and runoff, calculated using the sum of the monthly totals for June, July andAugust.

The rainfall-runoff relationship in a
NETTLEWATTR onnuol
small catchment
reg ression
639
E
o
t
0 .9 1 .1(Thouaonds)
rolnfoll (mm)Estimoted runoff
F r c . 1 2 .Annual regression between rainfall and runoff, calculated using the sum of the rotals for all twelve months.
month to show a significant relationship (at the 0.5oo level), largely resulting from theconditions in 1983. In that year April had had an unusually high total rainfall (736.2mr-;',compared with a twelve year average of 45.1 mm) followed by 147.1 mm in May (comparedwith an average of 69.4mm). As a result) the soil moisture deficit was considerably lessthan normal for the time of year, resulting in less rainfall entering the soil and rock asstorage and, consequently, a high level of runoff. Seasonal aggregates of monthly totalsshow similar results; the totals for December, January and February give a correlationcoefficient of + 0.76, significant at the 0.1 ',,, level (Fig. I I a), whereas those for June, Julyand August give a coefficient of + 0.02,showing no association between rainfall and runoffduring those months (Fig. l lb). The annual totals show a correlation significant at the0.1'iu level with a coefficient of +0.87 (Fig. l2).
The seasonal variations within a catchment are known astheriver regime. Most rivers inBritain have a simple regime of one period of high runoff followed by one period of lowrunoff. Although it is normal practice to demonstrate a regime with a run of data at least 30years long, the mean monthly runofffor the years 1973 to 1985 has been used to constructFig. 13. Mean monthly rainfall is included for comparison. Runoff shows the expectedpattern whereas rainfall is less regular.
0.5 0.7
O Observed runoff

640 H. J. HowcnoFr AND A. Wrrus
Regime diagrm, showing the seasonal variation in ra,"r",, "llt
*U. The monthly figures are rtre averages for the twelve yearsr97?-1985.
The variability in both rainfall and runoffis shown in Fig. 14, where the average for eachmonth is expressed as a fraction of the average for all 144 months in the l2 years, referred toas the overall average (Table 5). A figure of 1 therefore represents a monthly average equalto the overall average. The results show a range in rainfall from 0.5 to 1.6 times the overallmean but, although there is a winter maximum and a summer minimum, the pattern isirregular. Runoff shows a much greater variability, with monthly figures falling as low as0.09 times the overall mean in August and September and rising to 2.3 times the overallmean in January, but with a more regular distribution.
Rainfal l
Runoff

The rainfall-runofl relationship in a small catchment 641
monthly meanoveral] mean
2 . 5
2 . 0
1 . 0
0 . 5
Rainfa l l
Frc. 14.Variabilit-v in rainfall and runoff. The average for each month is expressed as a fraction of the average for all 144 months. Thefigures are shown in Table 5.
Table 5. Variability in rainf all and runoff for the twelve water ))ears1973-85
overall mean (of l. l , l months) for rainfall 86.9 mm
overall mean (of 1,1,1months) for runoff36.0 mmOcr Nov Dec Jan Feb Mar SepAugApr May Jun Jul
1. Mean monthlv rainfall| . 103.2 97 .62 . 1 . 2 1 . 1
3. Mean monthly runoffi . 20.2 29.8.1. 0.6 0.8
2. Mean monthly rainfallioverall mean131.1 t23.4 99.1 102.9 45.1
1 .6 1 . , 1 1 .2 r . 2 0 .5
4. Mean monthl,v runoffioverall meani4.2 82.5 80.3 57. t 38. .12 . 1 2 . 3 2 . 2 1 . 6 1 . 1
69.4 52.60 .8 0 .6
26.4
0 . 7
43.5 71.8 99.60 .5 0 .8 ) , . 2
1 1 . 6 5 . 2 1 . 1 3 . 4
0 . 3 0 . 1 0 . 0 9 0 . 0 9
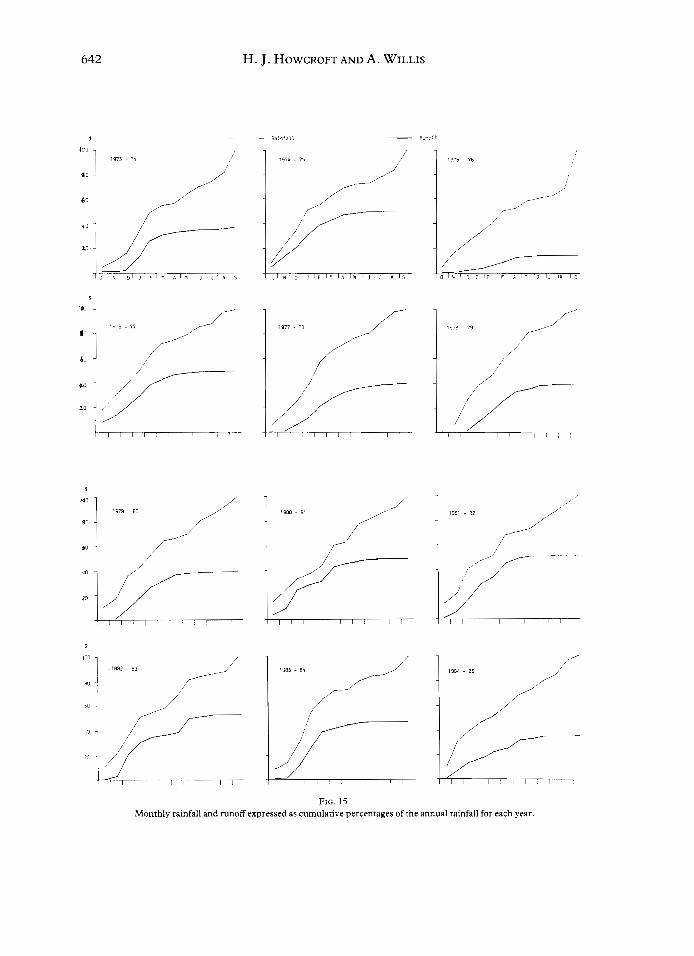
This same pattern is shown in Fig. 15, where monthly rainfall and runoffare expressedas cumulative percentages of the annual rainfall for each year. Whereas rainfall shows afairly regular increase, runoff has reached it maximum level by March or April in everyyear except 1983, when May showed a secondary rise. In every case these graphs representthe increased loss of water by evapotranspiration and the influence of storage during thesummer months. As discussed in the water balance section, the unusual pattern of runoffduring the 1976 water year, reflects both the soil moisture deficit which was carried overfrom the previous year and the small amount of rainfall during that year itself.
642 H. J. HowcnoFr AND A. Wrrus
I - R a i r r a l l _ Rlnoft
l c a
6 .
+ 0
€
1.
lo
I
0o
6a
D
1
t00
a!
r l
t c
L-
/
1 9 8 0 - 8 1 / .
-//-
4-I ,,,r-u,
-_-/
) ia/ .'--
| / . /1 , ' / , , , ,
, ,Frc . 15 .
Monthly rainfall and ruoffexpressed as cmulative percentages of the amual rainfall for each year.
a-tt
The rainfall-runoff relationship in a small catchment 643
Flow DurationSo far, the discussion has dealt entirely with stream discharge converted to a runoff
equivalent of rainfall, but a considerable amount of extra information is available from thedischarges themselves. Ahydrograph is a graph ofrunoffand the annual hydrographs forthe years 1973 to 1985 are shown in Fig. 16. From them it can be seen that the stream'sresponse to rainfall is highly variable and shows no standard pattern. However, it ispossible to separate flow entering the stream directly from flow delayed through storage,by identifying the greatest flow sustained by the stream without additional rainfall. Fromthe hydrographs this can be seen to be 16.5 Is- 1, reached in February and March 1980.
The variability in flows can be demonstratedby theflow duration curvewhich shows thepercentage of time by which individual flows are equalled or exceeded. As this curve itselfgives no indication of season its usefulness can be increased by combining it with a simpleregime diagram. The flow duration diagram in Fig. l7 represents all flows from 1973 tor985.
From this diagram it can be seen that the discharge ofthe stream varied from 124 ls - 1, to
nil, the latter reflecting occasional periods when the stream dried out. Discharges are lessthan 16.5 ls-1 for 80o,'o of the time, representing the period when the strearn is largelymaintained by sub-surface, delayed ffow, contributions. The 2091o of time when flows arein excess of 16'5ls*1, represents the period when baseflow is augmented by quickflowand rapid throughflow, conditions which occur mainly during the winter months andespecially during December, January and February. Flows greater than 80 ls
- I were onlyrecorded on 33 occasoins, representing 0.8o,i, of the time and all associated with periods ofheavy rainfall or storm events.
Storrn HydrographsIn many ways, the influence of drainage basin characteristics on runoffis best illustrated
by the response of the stream to storms) the effect often being intense but short term. Thisresponse is recorded inthe storm hydrograph and, although largely determined by the basincharacteristics, it is also influenced by the spatial and temporal distribution of the rainfall.
Storm hydrographs are often characterized by an almost immediate response to heavyrainfall shown by a rapid rise in discharge followed by an almost equally rapid decline. Thispeak is referred to asthe quichflow peak andresults from channel precipitation and overlandflow, two water sources which are speedily depleted. The time interval between the mostintense rainfall and the quickflow peak is referred to as the lag time, and the rise in dischargeas the peak rise. Following the quickflow peak there is often a second, slower, rise indischarge resulting from throughflow, especially under high moisture conditions, andreferred to as delayedTioza. Rises in groundwater also contribute to delayed flow. On thehydrograph itself the two types of flow can be separated by drawing a line from the start ofthe hydrograph rise to an inflection point on the recession limb. Although this techniquehas been used in this study, the identification of these points is to some extent arbitrary.
The response of the stream to storms is well illustrated by three storm hydrographsrecorded during the water year 1983. The storms in question occurred in December 1982,May 1983 and September 1983. Those in December and May were very similar in both theinitial amount of rain and its distribution, although the situation in December was compli-cated by several heavy falls subsequent to the first storm. The rainfall in September,although similar in quantity, was spread over a much longer period of time, and was,

H. J. HowcnoFr AND A. Wrrus644
o
; t + o
L ] :
u 6
6
l:- .
i
6
a
u 6
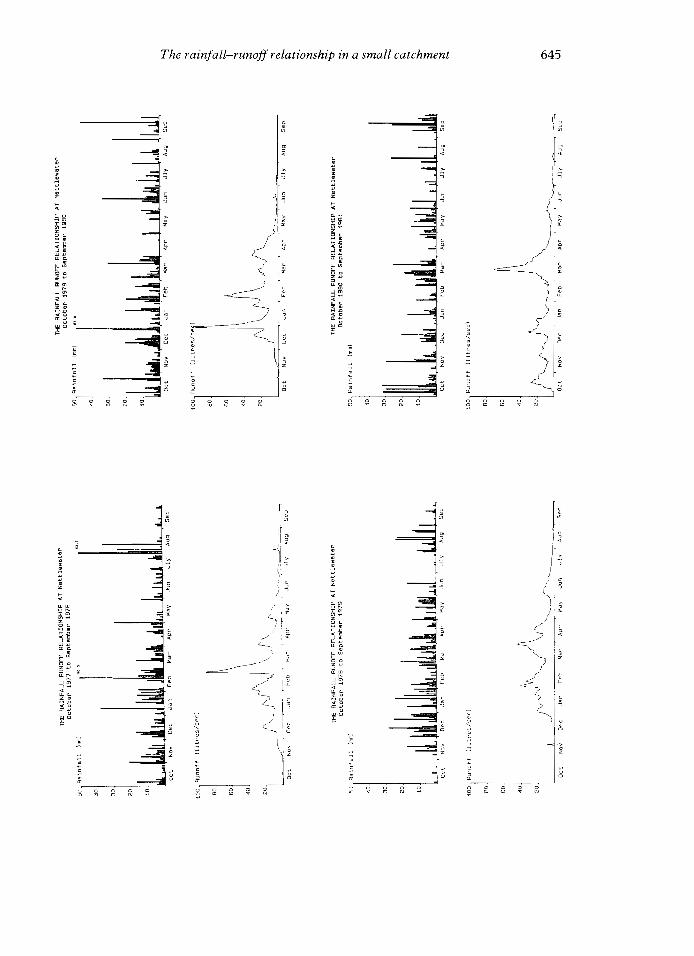
645The rainfall-runofl relationship in a small catchment
)
Id
Jii,
a
;
u d
z
t
__.*_c
J
--l.I
I_-
d5
-_€-=-_*t
: - f6 <
-= €E J
? E5 - - - _ - l - ' |o <
8 9 3 3 e
i!
--={_E
1I
:--€
---4
------€f-::
---d
II
a

H. J. HowcnoFr AND A. \Wrrus646
!
FerF)
o
3
E!
"d!
p
E
o
A a
a
!
- o- . E
6 ! !
o s* o
u 6
- a 3v o
: U
F Oa >
I
t "
3
E
.A
g
:
F
E
;
r
d o

oq
N ETTLEWAIE Rpercen loge o f t ime do i l y f low exceeded
Ftc . 17 .
Flow duration curve for the middle weir for the twelve vears 1973_85
:,]
I' l
, : ]
HYDROLOGlCALLY EFFECTIVE RAINFALL 1 2 3 5T0Rm5
I 3_-ft
I'lrL-l
{
I- MOISTURE DEFICIT ,f
Jt
o c T I N o v l g E c I t n r u l r e a l m n n c t l A p R I L l 1 1 A y l : u r u e l r u . . 1 | o r o l r . o ,
Frc. 18.!ileekly estimates of hydrologically effective rainfall and soil moisture deficit calculated by MORECS (Meteorological OfficeRainfall md Evaporation Calculation System), for the water year 1982-8).

648 H. J. HowcnoFr AND A. STrrus
therefore, of considerably lower intensity. The relationship of these storms to antecedentmoisture conditions can be seen in Fig. 18, which shows the weekly estimates of the soilmoisture deficit calculated by MORECS.
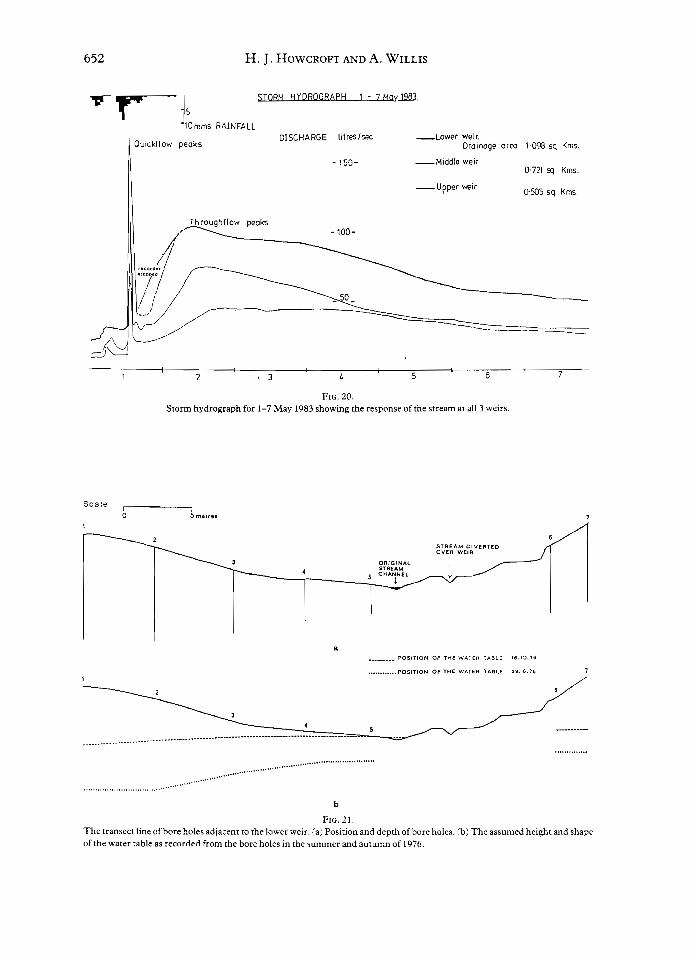
Of these three storms, the May response (Fig. l9a) is most typical of a single storm evenroccurring under relatively high moisture conditions. This storm is therefore discussedfirst, before the one which occurred in the preceding December. In the 30 days prior to thestorm, there had been 136 mm of rain,8l mm of which had fallen in the preceding l0 days.On I May, 31.5 mm of rain fell over a period of l0 hours with a maximum intensity of6 .5mmh-1 . S t reamd ischa rgea t thes ta r to f t hes to rmwas l 8 l s - l .W i th in twohou rso fthe maximum rainfall intensity, the stream had reached a quickflow peak of a 130 ls-1,a peak rise of l12ls-1. This peak resulted from channel precipitation and saturatedoverland flow. It was one of the rare occasions when water could be seen flowing over thefloodplain (Plate 1). During the quickflow peak the concenrration of suspended loacincreased visibly (Plate 2), but unfortunately was not measured. The sources of thisquickflow were rapidly depleted and within one hour the stream had fallen to 36 ls
- 1; theamount of water which had left the drainage basin as quickflow was equivalent to 0.41 mm,or 1.3"u of the rainfall. Following this fall in discharge, the stream rose gradually overthe next 2l hours reaching a secondary throughflow peak24 hours after the period ofmaximum rainfall intensity. Five days later the discharge of the stream levelled off at2 8 l s - 1 .
The December storm (Fig. l9b) occurred at a time of year when moisture conditionswere generally higher than in the succeeding May, although the period immediatelypreceding the storm had been considerably drier. In the 30 days prior ro the srormj1 1 4.6 mm of rain had fallen but only 20 .7 mm of this fell in the previous I 0 days . 29 .9 mmof rain fell, over a period of I I hours, on 9 December with a maximum intensity of 7.3 mmh
- t. The intensity and duration of the rainfall was, therefore, reasonably similar to that ofthe May storm) although spread over a slightly longer period. However, the response of thestream was complicated by further heavy falls on succeeding days. The discharge of thestream before the storm was the same as in May, l8 ls 1 .
The initial response of the stream was in many ways comparable to that described forMay. The lag time to the quickflow peak was two hours although the peak rise was only66 ls
- 1. However the quickflow peak lasted considerably longer than the one in May, sixhours compared with two. During the quickflow peak, the runoffwas equivalent to 0.9 mmor 3.0'),, of the rainfall. The differences in the response of the stream to the two storms isprobably related to the rainfall in the l0 days preceding the storm and in the temporaldistribution of the rain during the storm itself. There is no simple throughflow peakcomparable to that which occurred in May, but the increased discharge resulting fromthroughflow continued for several weeks due to continued replenishment by repeatedrainfall. However, it should be pointed out that the plateau nature shown by the through-flow component of this hydrograph is unusual and probably results from an equipmentfailure or l imitation.
In contrast to both these, the storm in September occurred after a fairly prolonged dryper iod,whenonly82mmofra inhadfa l len intwomonths. l3 .gmmfel l in the30dayspr iorto the storm with 9.1 mm in the preceding l0 days. The discharge of the srream before thestorm was 1 . I ls
- r . The storm itself was more prolonged than either of the other two, with38 mm of rain falling over a period of 26 hours with a maximum intensity of 6 mm h
- r.
The stream rose to two quickflow peaks, each one half hour after a period of heavyrainfall. The first peak reached a discharge of 7.7 and the second 4.5 ls- r; in both cases

The rainfall-runoff relationship in a small catchment 649
T T t r
l ' l ' lf r A Y 1 9 8 1
Frc 19(a).Stom hydrograph for 1-7 May 1983. Middle weir
| 1 2 |
[cE@R i982
Frc. l9(b) .Storm hydrograph for 9-15 December 1983. Middle weir
D I
650 H. J. HowcnoFr AND A. tVrlus
"t -r-Tp--
L '
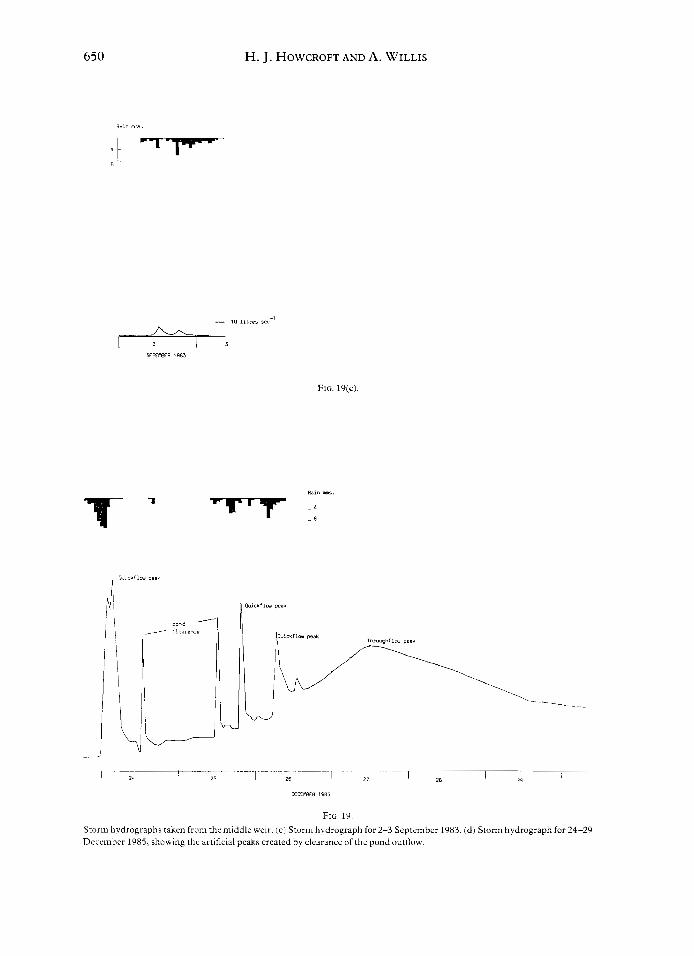
Frc . l9 (c ) .
trcE@R 193s
F I C , I 9 .
Storm hvdrographs taken from the middle weir . (c) Storm h1'drograph for 2-3 September 1983. (d) Storm hydrograph for 24-29
December I 985, showing rhe art i f ic ial peaks created bl c learance of the pond outf low.
--l^\--l'\--l--..-r-.-l ? l
$EMR 1981
The rainfall-runofl relationship in a small catchment 6 5 1
these peaks will have represented channel precipitation alone. There was no throughflowpeak, a situation typical of summer storms) and again, illustrating the importance of
evaporation, transpiration and storage during summer months.From these three storms a number of assumptions can be made concerning the drainage
basin. As saturated overland flow is a relatively rare occurrence in the catchment, a signifi-
cant part of the quickflow peak must result from direct channel precipitation. Other small
catchment studies have come to similar conclusions (Troake and Walling,1973; Weyman,1974).In a sample of ten storms occurring at all t imes of the year, an average of only l.6f uof the rainfall left the drainage basin as quickflow, varying from 0.19n in a July storm to
4.69 u in a December storm. When saturated overland flow does occur it can only be from a
relatively small proportion of the catchment and is probably largely restricted to the flat
floodplain areas adjacent to the stream; and the hollow at the source, where moisture
conditions are high and saturation occurs relatively easily.Throughflow is probably too slow to contribute to the quickflow peak directly, although
it may contribute indirectly by feeding the saturated area at the base of the slope. It
does, however, provide a significant contribution to delayed flow, especially in periods of
high antecedent moisture conditions, as shown by the May and December hydrographs.
Although the soils throughout the catchment show poor horizon differentiation the
upper part is underlain by relatively impermeable metamorphosed rock which encouragesthe lateral movement of throughflow at the junction between the soil and the rock,
thereby increasing the throughflow contribution. In contrast the lack of a secondarypeak on the September and other summer hydrographs demonstrates the importance of
evapotranspiration and storage during the summer months.The response of the stream to storm rainfall is undoubtedly complicated by the pond at
its source, but to date, no attempt has been made to quantify that influence. However, it can
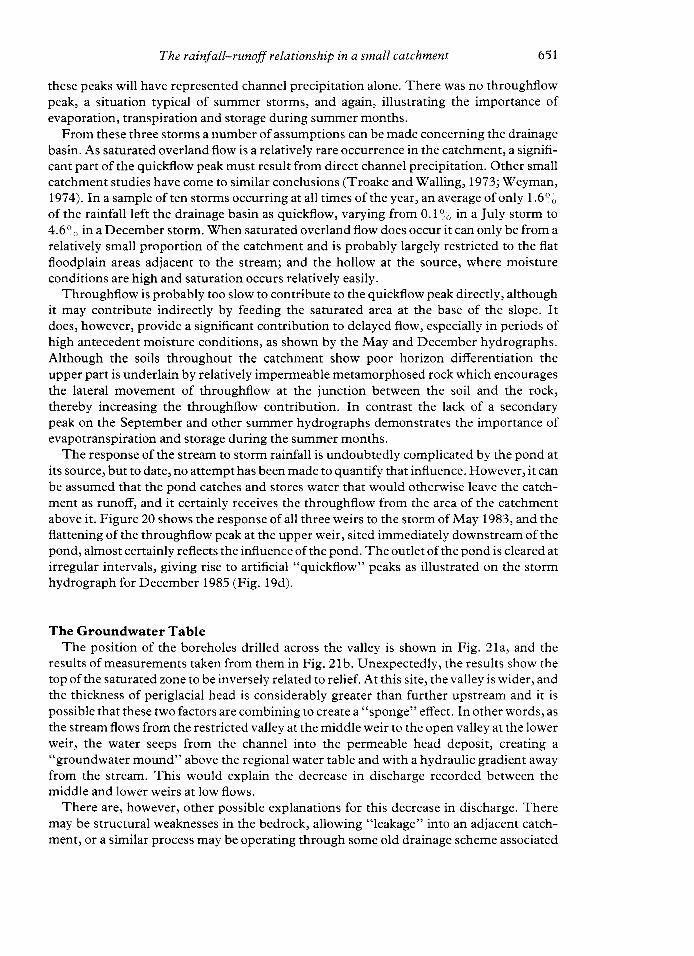
be assumed that the pond catches and stores water that would otherwise leave the catch-ment as runoff, and it certainly receives the throughflow from the area of the catchmentabove it. Figure 20 shows the response of all three weirs to the storm of May 1983, and theflattening of the throughflow peak at the upper weir, sited immediately downstream of thepond, almost certainly reflects the influence of the pond. The outlet of the pond is cleared atirregular intervals, giving rise to artificial "quickflow" peaks as illustrated on the stormhydrograph for December 1985 (Fig. l9d).
The Groundwater TableThe position of the boreholes dril led across the valley is shown in Fig. 2la, and the
results of measurements taken from them in Fig. 2lb. Unexpectedly, the results show thetop of the saturated zone to be inversely related to relief. At this site, the valley is wider, andthe thickness of periglacial head is considerably greater than further upstream and it ispossible that these two factors are combining to create a "sponge" effect. In other words, asthe stream flows from the restricted valley at the middle weir to the open valley at the lowerweir, the water seeps from the channel into the permeable head deposit, creating a
"groundwater mound" above the regional water table and with a hydraulic gradient awayfrom the stream. This would explain the decrease in discharge recorded between themiddle and lower weirs at low flows.
There are, however) other possible explanations for this decrease in discharge. Theremay be structural weaknesses in the bedrock, allowing "leakage" into an adjacent catch-ment, or a similar process may be operating through some old drainage scheme associated
652 H. J. HowcnoFr AND A. $7rrus
rF.---l1 l s. J lomms
RAINFALL
0u ick l low peoksOI SC HA RGE
1983
-Lower welr.0roinogb oreo
_Midd le we i r
- Upper v€ir
1 098 sq Kms.
0 721 sq Kms.
0505 sq Kms
/
2 r 3 4 5 6
Frc.20.Stom hydrograph for t-7 May 1983 showing the response ofthe sream ar all 3 weirs
S c a l e
1
0 S m o r r e r
- _ _ - - _ _ - _ P O S T T T O N O F I B E W A r € n T A g ! € r 0 . r O . r 6
. . . , . . . . . . . , P O S t t t o N O F l H E W A T E A l A a t E 2 9 , 0 . 1 6
b
F r c . 2 l .The ransect line ofbore holes adjacent to the lower weir. (a) Position and depth ofbore holes. (b) The assumed height and shapeof the water table as recorded from the bore holes in the summer md autumn of 1926.
S T A E A M O I V E I I E O

The rainfall-runoff relationship in a small catchment 653
with the landscaping of the estate. It is known that the stream was channelled undergroundduring the eighteenth century, but as yet the full extent of the scheme has not beendiscovered.
CoNcrusroN
Although some of the methods in this study are open to criticism (shedding doubt on thecalculated results-especially with regard to the water balance), the experiments weredesigned to illustrate techniques and provide background data. In this context the resultshave been invaluable for both geographical and ecological freshwater courses at theLeonard Wills Field Centre. In spite of the inaccuracies associated with the water balance,interesting patterns have been identified-especially the highly seasonal variation inrunoff, reflecting the importance of both evapotranspiration and storage during thesummer months.
This relationship is illustrated even more clearly by the detailed information concerningrainfall and runoff shown in the annual and storm hydrographs, the flow duration curveand the seasonal totals. The storm hydrographs enable separation ofquickflow and delayedflow, and show that quickflow (which results mainly from channel precipitation and satur-ated overland flow) accounts for a relatively small proportion of total runoff. Throughflowmakes a significant contribution during periods of high moisture conditions, but duringperiods with a soil moisture deficit, large amounts of moisture are lost by evapotrans-piration. Infiltrating rainfall is held in storage and does nor generate runoff.
These trends are reflected in the monthly and seasonal comparisons between rainfall andrunoff with significant correlations during the winter months and a lack of correlationduring the summer months.
The results all suggest that there is considerable storage potential in the soils of thecatchment, and the need for detailed information concerning both this and the movementof water within the soil has become apparent. Consequently a grid of soil moisturetensiometers accompanied by several throughflow troughs has been established during1984 and 1985 and it is hoped that the results now being collected from these will helpprovide a more detailed explanation of the streams response to rainfall.
Grosseny
baseflowWater which maintains the flow of streams and rivers, even during periods of no rainfall, bythe slow release from storage within the rocks. Baseflow may be loosely equated withthroughflow (q.v.).
channel precipitationPrecipitation which falls directly into the stream or river channel.
depression storageWater held in hollows on the ground surface.
delagedflowPrecipitation reaching the stream via the soil and/or rocks.

654 H. J. HowcnoFr AND A. Wrrus
effectiae rainfallThe proportion of rainfall that reaches the stream or river directly, i.e. the proportion thatgenerates quickflow.
eztapotranspirationWater loss from evaporation of water used in transpiration from the leaf surfaces of thevegetation cover) as well as that lost by direct evaporation.
field capacityThe state of the soil after rainfall, when excess moisture has had time to drain away and therate of downward movement has materially decreased.
flout duration curueA graph showing the percentage of time when individual flows are equalled or exceeded.
groundwaterWater held in the rock and contributing the baseflow of the stream or river.
hydrographA graph of runoffagainst t ime.
hggroscopic waterWater held in the area surrounding individual soil particles by strong molecular forces.
interceptionPrecipitation caught by the vegetation cover some of which is evaporared directly back tothe atmosphere.
lag timeIn a storm the lag time is the time interval between the most intense rainfall and thequickflow peak discharge.
peak riseIn a storm the peak rise is the rise in discharge from the start ofthe storm to the quickflowmaximum.
permeabilityThe capacity of soil or rock to allow the movement of water.
porositgThe water holding capacity of soil or rock.
pot en tial ea apot ranspi rat ionThe rate at which evaporation and transpiration would take place if the soil was constantlyatfield capacit!.
quickflow peakThe initial peak in srream discharge following heavy rain.

The rainfall-runofl relationship in a small catchment o))
runoflStream or river discharge.
s atur ated ozt er land flowSurface runoff resulting from saturation of the surface layers, usually in the areaimmediately adjacent to the stream or river.
soil moisture deJicitThe amount of water needed to return the soil to field capacity.
stemflowPrecipitation intercepted by the vegetation cover which reaches the ground by flowingdown plant stemsJ tree trunks, etc.
throughfallPrecipitation intercepted by the vegetation cover which reaches the ground by drippingthrough the canopy.
throughflowThe downslope movement of water through soil.
AcxNowr-socEMENTS
The recording for this study has been undertaken by many staff at the Leonard WillsField Centre. We would like to extend our thanks to all of them and in particular to theWarden, Dr J. H. Crothers. The recordings obtained from the boreholes were madepossible thanks to the staff of the Department of Civil Engineering and Construction,Hatfield Polytechnic.
RrpnnBNcesGnrconv, K. J. & t#arrrNc, D. E. (1971). Field Measurements in the Drainage Basin. Geography,561277-292.Gnrconv, K. J. & WenrNG, D. E. (1971). Drainage Basin Form and Processl a geomorphological approach (lst
edition). Edward Arnold Ltd, London.GnrconY, S. (1963). Staristical Methods and rhe Geographer, Longmans, Green and Co Ltd, London.HoRroN, R. E. (1945). Erosional development ofstreams and their drainage basins: hydrophysical approach to
quantitative morphology. G e o logy S oci e ty of Ameri ca B ulletin, 56, 27 5-37 0.Howcnorr ,H.J.Q977).ThehydrologyofaSmal lCatchment. F ie ldStudies,4,555-573.Iursox, A. C. & tVeno, R. C. (1972). The Output of a Lowland Catchment. Joarnal of Hydrology,17,145-159,
Jon, D. A. (1982). Runoffand Sediment Output from a Small Lowland Catchment-the example of PrestonMontford Brook, Shropshir e. F ield S tudie s, 5, 685-7 29.
The Meteorological Office Rainfall and Evaporation System MORECS 1981. Hydrotogical Memorandun No. 45.McCurrecH, P. (1974). Science in Geography 4. Data (Jse and Interpretation. Ed. Fitzgerald, B. P. Oxford
University Press, London.Ptrrs, G. E. (1983). Rroers. But terworths, London.SHew, E. M. (1983). Hydrology itt Practice. Van Nostrand Reinhold (UK) Co. Ltd.Srn,qsLrn, A. N. (1964). Quantitative geomorphology of drainage basins and channel networks. In Handbook oJ
Applied Hydrology, Ed. V. T. Chow. Section 4-11.Wnnn, R. C. (1975). Principles of Hydrology (2nd edition). McGraw Hill, Maidenhead.Wano, R. C. (1981). River Systems and River Regimes.lo British Riuers.Ed. Lewin, J. George Allen & Unwin,
London.Vrvr'taN, D. R. (1974). RunoffProcess, contributing area and streamflow in a small upland catchment .ln Flupial
Processes in Instrumented Watersheds. Eds. Gregory, K. J. & Walling, D. E. Institute of British GeographersSpecial Publication, No. 6.
\7EvMAN, D. R. (i975). Runoff Processes and Streamflou Modelling. OUP London.

The rainfall-runoff relationship in a small catchment
PLATE 1(b).The usual appearmce of Nettlecombe Coun, Late April 19g5. (photo: J. H. Crothers)
PLArE l(a).Saturated overland flow md the swollen stream in the Nettlecombe valley, 1 May 1983. (Photo: D. H. Dalby)

H. J. HowcnoFr AND A. $Trrrrs
Pr-ers 2(a).The lower V-notch weir in the Nettlecombe valley, showing the high level of suspended load on I May 1983.
PLArE 2(b).
The lower V-notch in hte April 1985. The cover has been removed from the water level recorder. (Photo: J. H. Crothers)
(Photo: H. J. Howcroft)


![arctic-council.orgarctic-council.org/arr/wp-content/uploads/2016/10... · Web viewNäätämö River - Skolt Sami salmon fishing and river restoration - Finland [Resilience] What](https://static.fdocuments.us/doc/165x107/5a76c0287f8b9a93088d609a/arctic-a-doc-fileaa-web-viewnaatama-river-skolt-sami.jpg)