
Field Sampling Plan - Butte County, California · PDF fileField Sampling Plan Prepared for ......
41
10540 White Rock Road, Suite 180 Rancho Cordova, CA 95670 Field Sampling Plan Prepared for Butte County Department of Water and Resource Conservation March 24, 2016 148430
Transcript of Field Sampling Plan - Butte County, California · PDF fileField Sampling Plan Prepared for ......

10540 White Rock Road, Suite 180
Rancho Cordova, CA 95670
Field Sampling Plan
Prepared for Butte County
Department of Water and Resource Conservat ion March 24, 2016
148430

ii
DRAFT for review purposes only.
PROJECT STAFF
Butte County Department of Water and Resource Conservation Director
Paul Gosselin
Project Manager Christina Buck, Ph.D.
Brown and Caldwell
Project Manager Jeff Bold, Ph.D.
GIS/Geodatabase
Tina Crawford
Field Investigation Staff Chuck Frey Chris Silva
EMKO Environmental, Incorporated President/Principal Hydrogeologist Andrew Kopania, Ph.D., P.G., CHG
ML Davisson & Associates, Inc. President/Principal Hydrogeologist
Lee Davisson, P.G.
Kleinfelder Senior Principal Hydrogeologist
Joseph Turner, P.G., CHG

iii
DRAFT for review purposes only.
Table of Contents
1. Introduction ............................................................................................................................................... 1-1 1.1 Objectives ....................................................................................................................................... 1-1 1.2 Document Organization ................................................................................................................. 1-2
2. Background ............................................................................................................................................... 2-1 2.1 Overview of Stable Isotope Geochemistry of Water ..................................................................... 2-1 2.2 Summary of Existing Stable Isotope Data .................................................................................... 2-2
3. Data Quality Objectives ............................................................................................................................ 3-1 3.1 Rationale ........................................................................................................................................ 3-1 3.2 Focus Area Definition ..................................................................................................................... 3-1 3.3 Hydrogeologic Conditions .............................................................................................................. 3-1 3.4 Media to be Sampled ..................................................................................................................... 3-2
3.4.1 Surface Water .................................................................................................................. 3-3 3.4.2 Stormwater Runoff ........................................................................................................... 3-3 3.4.3 Groundwater ..................................................................................................................... 3-3
3.5 Sampling Frequency ...................................................................................................................... 3-3 3.6 Analytical Parameters .................................................................................................................... 3-4
3.6.1 Stable Isotopes ................................................................................................................ 3-4 3.6.2 General Chemical Parameters ........................................................................................ 3-4
4. Sampling Locations .................................................................................................................................. 4-1 4.1 Identify Data Gaps ......................................................................................................................... 4-1 4.2 Potential Sampling Locations ........................................................................................................ 4-1
4.2.1 Surface Water Sampling Locations ................................................................................. 4-1 4.2.2 Stormwater Sampling Locations ..................................................................................... 4-2 4.2.3 Groundwater Sampling Locations ................................................................................... 4-2
4.3 Sampling Frequency ...................................................................................................................... 4-3 5. Field Methods ........................................................................................................................................... 5-1
5.1 Roles and Responsibilities ............................................................................................................ 5-1 5.2 Field Readiness Review ................................................................................................................. 5-1 5.3 Laboratory Coordination ................................................................................................................ 5-2
5.3.1 Isotopic Analysis ............................................................................................................... 5-2 5.3.2 General Chemical Parameters Analysis ......................................................................... 5-2
5.4 Field Equipment ............................................................................................................................. 5-3 5.4.1 Surface Water Sampling Equipment............................................................................... 5-3 5.4.2 Groundwater Sampling Equipment ................................................................................. 5-3 5.4.3 Stormwater Runoff Sampling Equipment ....................................................................... 5-4

Field Sampling Plan Table of Contents
iv
DRAFT for review purposes only.
5.5 Documentation and Forms ............................................................................................................ 5-4 5.6 Standard Operating Procedures – Surface Water and Stormwater ........................................... 5-4
5.6.1 Surface Water Grab Samples .......................................................................................... 5-4 5.6.2 Dipping Cup Surface Water Samples ............................................................................. 5-4
5.7 Standard Operating Procedures – Groundwater ......................................................................... 5-4 5.8 Quality Assurance/Quality Control Methods and Procedures ..................................................... 5-5
5.8.1 Stable Isotope Analysis .................................................................................................... 5-5 5.8.2 General Chemistry Data .................................................................................................. 5-6
6. Data Management .................................................................................................................................... 6-1 6.1 Electronic Data Transfer ................................................................................................................ 6-1 6.2 Data Quality Review ....................................................................................................................... 6-1
7. Reporting ................................................................................................................................................... 7-1 8. References ................................................................................................................................................ 8-1
Figures ................................................................................................................................................................ 1
Tables ................................................................................................................................................................. 1
Appendix A: Compilation of Existing Stable Isotopes, Oxygen 18 TM .............................................................. A
Appendix B: Standard Operating Procedures ................................................................................................... B
Appendix C: Example Field Safety Plan (Brown and Caldwell, 2013) ............................................................ C
Appendix D: Quality Systems Manual for Environmental Analytical Service, Calscience .............................. D
Appendix E: DoD, DOE Consolidated Quality Systems Manual (QSM) for Environmental Laboratories ........E
List of Figures Figure 1-1. Site Location
Figure 3-1. Focus Area Groundwater Wells & Surface Water
Figure 3-2. Hydrogeologic Cross Section
Figure 4-1. Recommended Sampling Locations
List of Tables Table 3-1. Analytical Laboratory Methods, Bottle, Sample Volume, Preservative and Holding Time
Table 4-1. Recommended Groundwater Sample Locations

Field Sampling Plan Table of Contents
v
DRAFT for review purposes only.
List of Abbreviations
‰ parts per thousand
BC Brown and Caldwell
BCDWRC Butte County Department of Water and Resource Conservation
bgs below ground surface
Ca calcium
CD compact disk
COC chain-of-custody
del or delta
D deuterium
DWR California Department of Water Resources
ft feet
ft2/day feet2 per day
FSP Field sampling plan
GIS Geographic Information System
gpm gallons per minute
H hydrogen
HCO3 bicarbonate
K potassium
LCS Laboratory control sample
LCSD Laboratory control sample duplicate
LTA Project Lower Tuscan Aquifer Monitoring, Recharge, and Data Management Project
mg/L milligrams per liter
MSD matrix spike duplicates
Na sodium
O oxygen
PDF Portable Document Format electronic document files
Qd Quaternary deposits
RPD Relative percent difference
SMOW Standard Mean Ocean Water
TDS total dissolved solids
TSC Technical Steering Committee
µmhos/cm micromhos per centimeter


1-1
DRAFT for review purposes only.
Section 1
Introduction This report presents the Field Sampling Plan (FSP) prepared for water samples collected as part of the Butte County Stable Isotope Recharge Study. The primary purpose of this study is to develop a better understanding of the mixing of recharge sources and contributions of local precipitation and river water to the groundwater basin, with a primary focus on the area along Butte Creek south of Chico. Figure 1-1 shows the approximate boundaries of the Focus Area. This report is being submitted in accordance with Attachment III of the County of Butte Contract Number X21825, dated September 15, 2015 between Butte County and Brown and Caldwell (BC). Task 1.2 of the project scope includes development of the FSP for the project.
The specific deliverables under Task 1.2 are: Electronic copies of the Draft FSP in Word and PDF format; and The Final FSP (10 hard copies and electronic version in PDF format).
This document is the Draft FSP prepared as part of Task 1.2. This Draft FSP provides the rationale for the sampling and analysis program, a description of analytical methods and laboratory quality control procedures, an overview of data evaluation methodologies, standard operating procedures for field methods, and data management protocols. The Final FSP will be prepared and distributed after it is reviewed by County staff and the Technical Steering Committee, and comments from these parties are addressed.
To provide the maximum benefit to the public, Butte County may choose to add additional information to supplement the Final FSP for future studies. As future data needs change beyond the scope of this current study, Butte County may add to or revise this FSP as new information and new objectives emerge.
1.1 Objectives The FSP is a critical component in ensuring that representative and defensible data are collected for the project. The specific objectives of this FSP include:
1. Identify specific Data Quality Objectives (DQOs) for the sampling program;
2. Develop the rationale for a sampling program that satisfies the DQOs; and 3. Specify the procedures for collection of defensible data.
To achieve these objectives, the FSP includes maps outlining the project area and identifying the sampling locations along with narrative descriptions of sampling frequency, field methods for collection, handling and preservation of samples, analytical procedures, quality control/quality assurance (QA/QC) procedures, and data management. The FSP also includes standard operating procedures (SOPs) that specify field methods and procedures for collecting water samples from surface waters and groundwater monitoring wells for the project.

Field Sampling Plan Section 1
1-2
DRAFT for review purposes only.
1.2 Document Organization Following this introduction, Section 2 presents a brief overview of stable isotopes and a summary of existing stable isotope data in the project vicinity. Section 3 provides the DQOs for the field sampling, including rationale, media to be sampled, and the analytical parameters. Section 4 includes maps showing the project area, potential data gaps, and sampling locations. Section 5 presents the details of the field methods to be used. Section 6 addresses data management, including appropriate data quality review procedures. Section 7 describes reporting methods and requirements. References cited are listed in Section 8.

2-1
DRAFT for review purposes only.
Section 2
Background Task 1.1 of the project scope included preparation of a Technical Memorandum (BC, 2016) that presents a discussion of the use of stable isotopes in groundwater studies and provides a compilation of existing stable isotope data in the northern Sacramento Valley (see Appendix A). The Lower Tuscan Aquifer (LTA) Investigation (BC, 2013) included limited sampling and analysis of stable isotope data from groundwater and surface water. The current project is based, in part, on the recommendations from the LTA Investigation and builds on the available body of regional stable isotope data. When linked with a sufficient understanding of the hydrogeologic system, stable isotope studies can provide insight into the mechanisms and primary locations of groundwater recharge. The LTA Investigation provides the appropriate understanding of the hydrogeologic system. New data obtained for this project will provide additional insight into the interactions between surface water and groundwater in the project area, with an emphasis on recharge.
2.1 Overview of Stable Isotope Geochemistry of Water This section presents a summary of the discussion presented in the Task 1.1 Technical Memorandum (Appendix A). Stable isotope analysis of water samples is based on the principal that the hydrogen and oxygen atoms that form water molecules contain different isotopic forms. Stable isotopes are those that do not undergo radioactive decay and, thus, do not change composition over time. The most prevalent stable isotopes in water are hydrogen (H) and oxygen-16 (16O), which make up ≥99.8 percent of all of the hydrogen and oxygen on earth. The next most prevalent stable isotopes in water are deuterium (2H or D) and oxygen-18 (18O). D and 18O are present in water at 150 parts per million and 2 parts per thousand range.
D and 18O have atomic masses that are greater than those of the most common isotopes, H and 16O. It is this difference in mass that allows stable isotope analysis to provide important insight into the sources of recharge for groundwater. As water vapor moves inland from the ocean and yields precipitation, the ratios of the stable isotopes (e.g. H vs D) in the water is affected by the temperature, altitude and distance from the ocean. Since D and 18O have higher masses, they preferentially form precipitation that falls at lower latitudes, near the coast, and/or lower altitudes having a higher proportion of the D and 18O compared to precipitation that falls farther to the north, farther inland, and at higher altitudes.
The isotopic values are generally reported in the “delta” or “del” of the less abundant stable isotope, using the prefix “” (for example, 2H, D, or 18O). The “del” value is based on the ratio of the stable isotopes in a sample divided by the ratio of the stable isotopes defined in an internationally recognized standard. For almost all studies, the standard is referred to as Vienna Standard Mean Ocean Water (VSMOW). Most D and 18O data from water samples are negative numbers because the heavier isotope becomes depleted compared to the VSMOW standard as water passes through the hydrologic cycle.
Stable isotope studies can also be conducted on other elements that are part of minerals or other chemicals that become dissolved in water. Other elements with stable isotopes that have been studied in water include sulfur, nitrogen, helium, and boron. As discussed further in Section 3.6, stable isotopes of elements other than hydrogen and oxygen will not provide additional insight for the objectives of this project and, therefore, will not be tested as part of this study.

Field Sampling Plan Section 2
2-2
DRAFT for review purposes only.
Hydrogen also contains a radioactive (i.e. unstable) isotope referred to as tritium (3H). Tritium, sometimes in conjunction with the isotopes of other elements such as helium and radioactive carbon (14C), can be used to estimate the approximate age of a water sample. Interpretation of groundwater age-dating data, however, is complicated and requires careful interpretation to avoid misleading or confusing results. Groundwater age-dating is based on steady decay of a radioactive isotope, which operates like a clock. The clock begins to countdown at the time when groundwater becomes isolated from its original radioactive isotope source. It is sometimes the case where an age date for a groundwater sample is published and the result is misinterpreted as the time that the water molecules have been present in the aquifer, or the time it takes an aquifer to recharge. Such an interpretation is an oversimplification of the actual hydrologic cycle and the history of that water sample. Due to the study objectives and potential misinterpretation and misrepresentation of age data, groundwater age dating will not be conducted as part of this project.
2.2 Summary of Existing Stable Isotope Data The Technical Memorandum (see Appendix A of this FSP) provides a detailed presentation of existing stable isotope data in the northern Sacramento Valley. This section provides a brief overview of the existing data. The map accompanying the Technical Memorandum (Appendix A) presents the available 18O data that has been compiled for this project to date. Review of the available data and comparison of the results from the earlier LTA Study reveal the following observations:
The 18O data from southern Butte County and vicinity (including Yuba County), especially the large number of samples collected east of the Feather River by DWR, suggest recharge of low elevation, isotopically heavy groundwater, with samples ranging from approximately -7 to -9‰ 18O.
USGS groundwater samples collected west of the Sacramento River, west of Butte County (including in Yolo, Colusa and Glenn counties), have reported 18O of approximately -9‰ +/- 1‰ with surprising consistency, indicating the potential for consistent recharge mechanisms on the west side of the Sacramento Valley.
USGS, LTA and some unpublished data collected from groundwater wells near Butte Creek and along the Sacramento River generally appear to be indicative of recharge of higher elevation, isotopically lighter water ranging from -9 to -10‰ 18O. There also is an apparent trend toward isotopically lower waters toward the south, with 18O values ranging from -10 to -11‰ or lower. There are, however, some notable exceptions (USGS, RICE wells) of reported higher -6 to -8‰ 18O.
The LTA data tend to suggest a strong influence of groundwater depth, and thus stratigraphy, on the isotopic signature.
Groundwater samples collected adjacent to Deer and Mill Creeks in northern Butte and Tehama counties consistently have the highest elevation (i.e. isotopically lightest) water varying from -10 to -11.5‰ 18O, which is consistent with the isotopic signatures in the surface water collected from these two creeks as part of the LTA Study.
The data collected for this project will be used, in part, to verify or modify the above observations.

3-1
DRAFT for review purposes only.
Section 3
Data Quality Objectives In the context of this FSP, data quality objectives (DQOs) refer to the systematic planning process to ensure that the data collected are consistent with the project objectives and adequate for the intended use.
3.1 Rationale The DQO process provides quantitative and qualitative criteria to help: Clarify study objectives;
Define appropriate types of data to collect; and
Specify the tolerable levels of potential errors, both in the data collection and analysis and in the decisions that are made from those data.
The objectives for this FSP are listed in Section 1.1 above. The overall project purpose, however, is to better understand the mixing of recharge sources and contributions of local precipitation and river water to the groundwater basin. Recharge sources can include local rainfall, stormwater runoff from adjacent areas, surface water in creeks and rivers that are sourced from higher elevations outside of the groundwater basin, and irrigation water (either surface water diversions or groundwater pumped from various depths and aquifer zones). For this study, the groundwater basin is limited to an area within Butte County south of the City of Chico along Butte Creek. The Focus Area for the study is shown on Figure 1-1.
3.2 Focus Area Definition The focus of the project is the Durham Dayton and Esquon area south of Chico along Butte Creek. The reach of Butte Creek extends from the Sierra, along Honey Run Road in the foothills, to Nelson Road in the valley. Other minor surface water features (Little Dry Creek, Little Chico Creek or other local ephemeral drainages) may also be included. Figure 1-1 shows the general extent of the Focus Area. Data acquisition will occur primarily within this area, although some samples (e.g. from the Sacramento River) will be obtained from outside of this area.
3.3 Hydrogeologic Conditions A detailed discussion of the hydrogeologic conditions in the vicinity of the project area is presented in the Final Report for the LTA Investigation (BC, 2013) and in Turner et al (2012). As discussed in these reports, the principal aquifer units in Butte County are developed within the Tuscan Formation. The Tuscan Formation includes a sequence of clay, sand, and gravel beds that may be partially cemented, potentially affecting infiltration and movement of groundwater. The Tuscan Formation consists predominantly of purple volcanic debris flow deposits and interbedded fluvial (river) deposits rich in eroded volcanic material. In many areas, clasts of granitic material derived from the bedrock within the Sierra Nevada are common, with occasional volcanic ash beds (referred to as “tuffs”) being present.
The presence of both the fluvial gravel deposits and the eroded volcanic material suggests that debris flows related to volcanic events in the mountains to the east episodically choked the ancestral stream/river systems of the area (Blair et. al., 1991). In the project area, aquifers formed within the

Field Sampling Plan Section 3
3-2
DRAFT for review purposes only.
distal portions of the LTA composed predominantly of unconsolidated fluvial material with some hard cemented reworked volcanic mudflow units (referred to as “lahars”).
Overlying the Tuscan Formation are numerous Quaternary deposits. The base of the Quaternary deposits can easily be distinguished in drill cuttings where pumice-like materials from the tuff members of the Tuscan Formation are encountered. Where the base of the Quaternary deposits is not underlain by a tuff member, the Tuscan Formation is identified by the presence of gravel clasts and/or sand grains with greater than 50 percent andesite, andesitic basalt, and/or dacite. Geologic units underlying the Tuscan Formation within the project area include the Eocene Ione Formation. The Ione Formation consists of variably cemented, fine to coarse sandstone, siltstone, lignite (low-grade coal), and claystone with variegated colors including red, yellow, white, blue, gray, orange, and black. In drill cuttings, the Ione Formation is easily identified from the overlying Tuscan Formation by its multicolored nature.
Figure 3-2 is a hydrostratigraphic cross section originally presented in the LTA report (BC, 2013). As seen on Figure 3-2 the Tuscan Formation appears to down-cut through part of the Ione Formation, forming a paleo-valley. Aquifer material from the Tuscan Formation is juxtaposed against units of the Ione Formation in many instances.
Aquifer properties and interconnections in the vicinity of the project Focus Area were assessed during the LTA investigation through an aquifer test conducted at the Esquon Ranch (Figure 3-1). This aquifer test demonstrated that the primary LTA system is hydraulically connected to the aquifer within the upper Ione Formation but that water from these two zones follow indirect pathways. The test also indicated that the shallow and deep portions of the Lower Tuscan may not be hydraulically connected.
Stable isotope data for groundwater samples collected from the monitoring well completed for the LTA investigation at the Chico State University (CSU) Farm facility (well 21N01E13L on Figure 3-1) indicate a different source of recharge for the upper screened zone (240 to 340 feet bgs) compared to the deep screened zone (735 to 760 feet bgs) and intermediate intermediate screened zone (540 to 560 feet bgs). The shallow screened interval for this well has an isotope signature that suggests recharge may be occurring locally from Butte Creek or diversions from Butte Creek, through the shallow alluvium, and into Upper Tuscan Aquifer. The deep screened interval for this well has an isotope signature suggesting recharge is primarily from local precipitation near the east edge of the valley and lower foothills. The intermediate screened interval for this well is indicative of a somewhat higher recharge elevation than the deep zone, but may be the result of mixing between zones. However, the aquifer test, as discussed above, suggests that there is not a hydraulic connection between the shallow zone and deeper zones, which would suggest that the water in the intermediate interval is not a result of mixing of the shallow and deeper intervals.
The complex stratigraphy requires knowledge of the physical characteristics of the Tuscan and Ione Formations and an understanding of the conditions in which they were deposited. Predicting the water flow through a mixture of fluvial deposits and partially cemented tuffs, lahars and other volcanic mudflows is not possible based on identification of the formation alone. The use of the stable isotope monitoring techniques provides insight into the movement of water flow through these complex geologic formations. This work will build on the findings of the LTA to further clarify groundwater flow paths and hydraulic connections between different parts of the aquifer system.
3.4 Media to be Sampled The primary objective of this stable isotope recharge study is to develop a better understanding of recharge processes, including identifying recharge sources, contributions of local precipitation and river water to the groundwater basin, with a primary focus on the area along Butte Creek south of Chico (Figure 3-2). To accomplish this objective, the media sampled will include surface water, storm water

Field Sampling Plan Section 3
3-3
DRAFT for review purposes only.
runoff, and groundwater. A brief discussion of the data quality objectives for samples collected from each of these media is presented in the following sections.
3.4.1 Surface Water
The primary DQO for surface water is to obtain representative samples from rivers, creeks and other surface water bodies in and around the Focus Area. Surface water samples from different locations will be compared to groundwater data to assess recharge sources and mixing in different parts of the focus area. Several rivers and creeks flow through the Focus Area, providing ideal sampling points.
The existing data from the LTA investigation (BC, 2013) provides good quality stable isotope and general chemical analyses from Butte Creek and Little Dry Creek for 2011 and 2012 (Appendix A). Surface water samples were collected in areas where the creeks crossed over outcrops of the Lower Tuscan Formation to assess direct recharge to the LTA in these areas. Isotopic data suggested that water from Little Dry Creek is primarily from precipitation that fell at relatively low elevations near the edge of the valley floor or lower part of the foothills to the east. Isotopic data from Butte Creek is indicative of runoff from mid- to high-elevations. Results of stream gauging conducted for the LTA investigation (BC, 2013) indicated that recharge along these reaches is minimal and not a significant source of water for the LTA.
Prior to collection of surface water samples, the specific locations should be mapped for the presence of other inlets or drainage channels flowing into the area to allow the best interpretation of the data. Based on this mapping, additional samples could be added to the program.
3.4.2 Stormwater Runoff
There are no existing stormwater samples collected and analyzed for stable isotopes or any other parameters in the Focus Area. Groundwater data within the LTA has an isotope signature suggesting recharge at many locations is primarily from local precipitation near the east edge of the valley and lower foothills. Collecting stormwater runoff samples from the eastern edge of the valley and lower foothills will contribute to confirming or refuting this recharge mechanism.
3.4.3 Groundwater
The primary DQO for groundwater is to collect representative groundwater samples from LTA hydrostratigraphic units within the Tuscan aquifer to compare with surface water, stormwater and groundwater from different hydrostratigraphic units to evaluate recharge mechanisms. Wells with known construction features and geologic boring logs to show that screen intervals are within separate aquifer zones and do not cross numerous aquifer zones are a top priority. Wells with long screen zones crossing numerous aquifer zones will not be sampled as part of this project.
3.5 Sampling Frequency The LTA study (BC, 2013) noted that there is the possibility for seasonal variability in the stable isotope data. This is most likely in streams that have watersheds that span large areas. Winter storms may produce runoff from lower elevations, while the higher elevation precipitation remains in the watershed as snowfall. The spring runoff, however, may consist primarily of higher-elevation snowmelt in the absence of specific storm events. Repeated sampling of surface water and groundwater over a period of one to two years will help assess the potential influence on seasonal variations on the stable isotope signature from surface water. Therefore, quarterly sampling for all media is appropriate for stable isotopes.
The general chemical parameters (see Section 3.6.2) will only be used to assess specific recharge pathways that are indicated by the stable isotope data. Therefore, general chemical samples will only be

Field Sampling Plan Section 3
3-4
DRAFT for review purposes only.
collected once near the end of the project, and only from specific locations that are potentially part of a continuous recharge pathway.
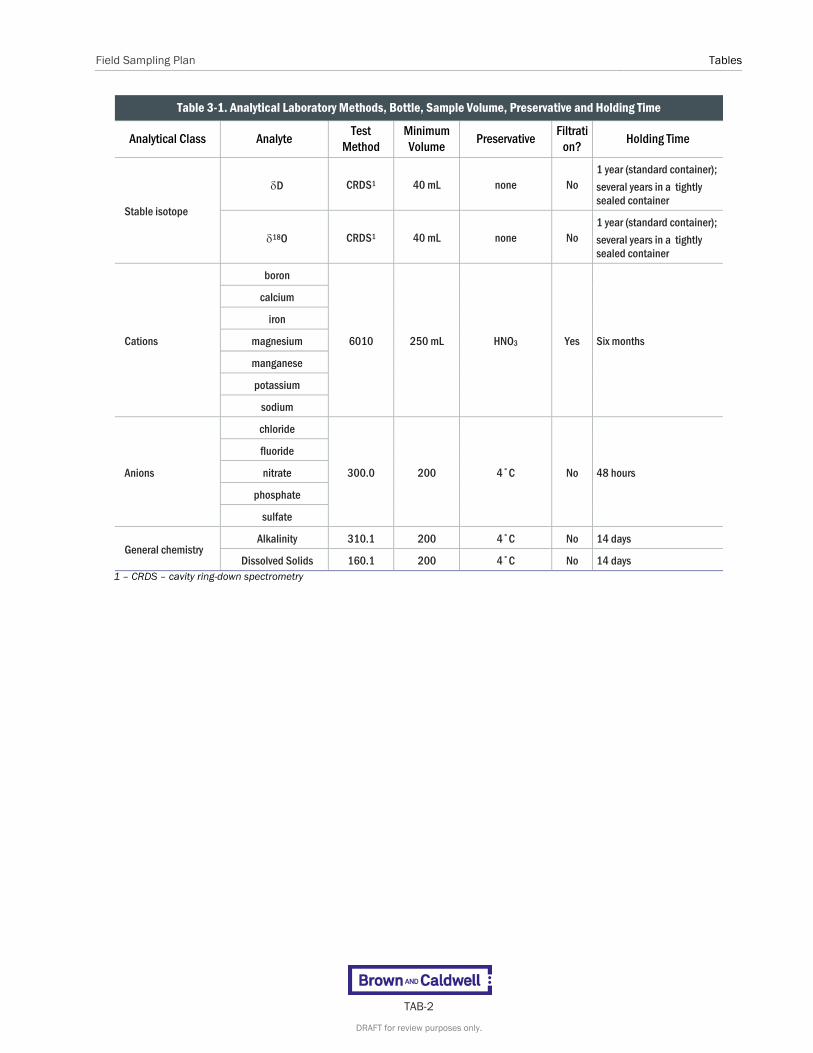
3.6 Analytical Parameters Based on our understanding of the hydrogeologic system in the Focus Area, the D and 18O stable isotopes are selected as the primary analytical parameters of interest. D and 18O analyses in stormwater runoff, surface water and groundwater samples help to reveal groundwater recharge mechanisms from precipitation and infiltration of surface and irrigation water. General chemical parameters including cations and anions, pH, total dissolved solids (TDS) and other inorganic parameters are secondary, but important analytes that provide basic characteristics of the surface water or groundwater quality.
3.6.1 Stable Isotopes
Stable isotopes of D and 18O in groundwater and surface water samples are the primary analytical parameters. As described in Section 2, the stability of the D and 18O along with the simplicity of sampling, preservation and analysis of D and 18O make these isotopes the ideal tracer of the original source of meteoric or agricultural water recharging groundwater.
Other stable isotopes of sulfur (S), nitrogen (N), helium (He) and boron (B) may be of some value in understanding fate and transport of particular constituents or age dating of groundwater, but this FSP focuses on gathering data that leads to a better understanding of recharge, rather than transport of constituents or specific age of groundwater. As a result, isotopes other than D and 18O will not be analyzed as part of this FSP. If other isotopes are needed for special studies that also require special sampling techniques, additional SOPs can be added to this FSP.
3.6.2 General Chemical Parameters
General inorganic parameters, including TDS, pH, anions and cations, supplement stable isotope data and may provide additional support for identifying a particular source of recharge or water bearing groundwater zone. General inorganic parameters provide standard analytical information that can be used to visualize surface water and groundwater quality in the form of trilinear (Piper), Stiff and other diagrams. Where stable isotopic data might suggest a specific link between a surface water body and one or more aquifer zones, the general mineral data can be used to determine if those points have the same water chemistry and are, thus, part of the same hydrodynamic system. Specifically, if each sample location has similar general mineral chemistry, then the individual samples might represent a recharge pathway. Alternatively, if the sample locations have very different water chemistries, then those points would not represent a recharge pathway.
TDS provides an indicator of the degree of contact between rainfall and surface soils or the aquifer solids, with higher TDS concentration supporting increased infiltration through soils. Boron can be an indicator of certain stratigraphic formations (i.e., the Ione Formation). Nitrate is typically not a naturally occurring constituent in most surface water or groundwater and typically can indicate agricultural, septic or wastewater impacts. Iron and manganese are not typically present in surface water. In groundwater, iron and manganese typically indicate low dissolved oxygen content due to naturally occurring organic matter, iron sulfides, or manmade industrial organic chemicals, hydrocarbons or landfill impacts. High pH and alkalinity (bicarbonate/carbonate) occur naturally in some valley soils. Rainfall in equilibrium with atmospheric carbon dioxide is slightly acidic (pH 5.5 to 6) but as stormwater passes over surface soils and rocks, hydrolysis reactions drive surface water toward neutral. All of these general chemical parameters can support some aspect of recharge.
General chemical parameters include:

Field Sampling Plan Section 3
3-5
DRAFT for review purposes only.
Cations (calcium [Ca], magnesium [Mg], sodium [Na], potassium [K], boron [B], manganese [Mn] and iron [Fe])
Anions (chloride [Cl], sulfate [SO4], phosphate [PO4], nitrate [NO3-N] and fluoride [F])
Alkalinity - bicarbonate [HCO3]/carbonate [CO3],
TDS Field parameters (pH, electrical conductance [EC], temperature, oxidation reduction potential [ORP],
dissolved oxygen [DO])


4-1
DRAFT for review purposes only.
Section 4
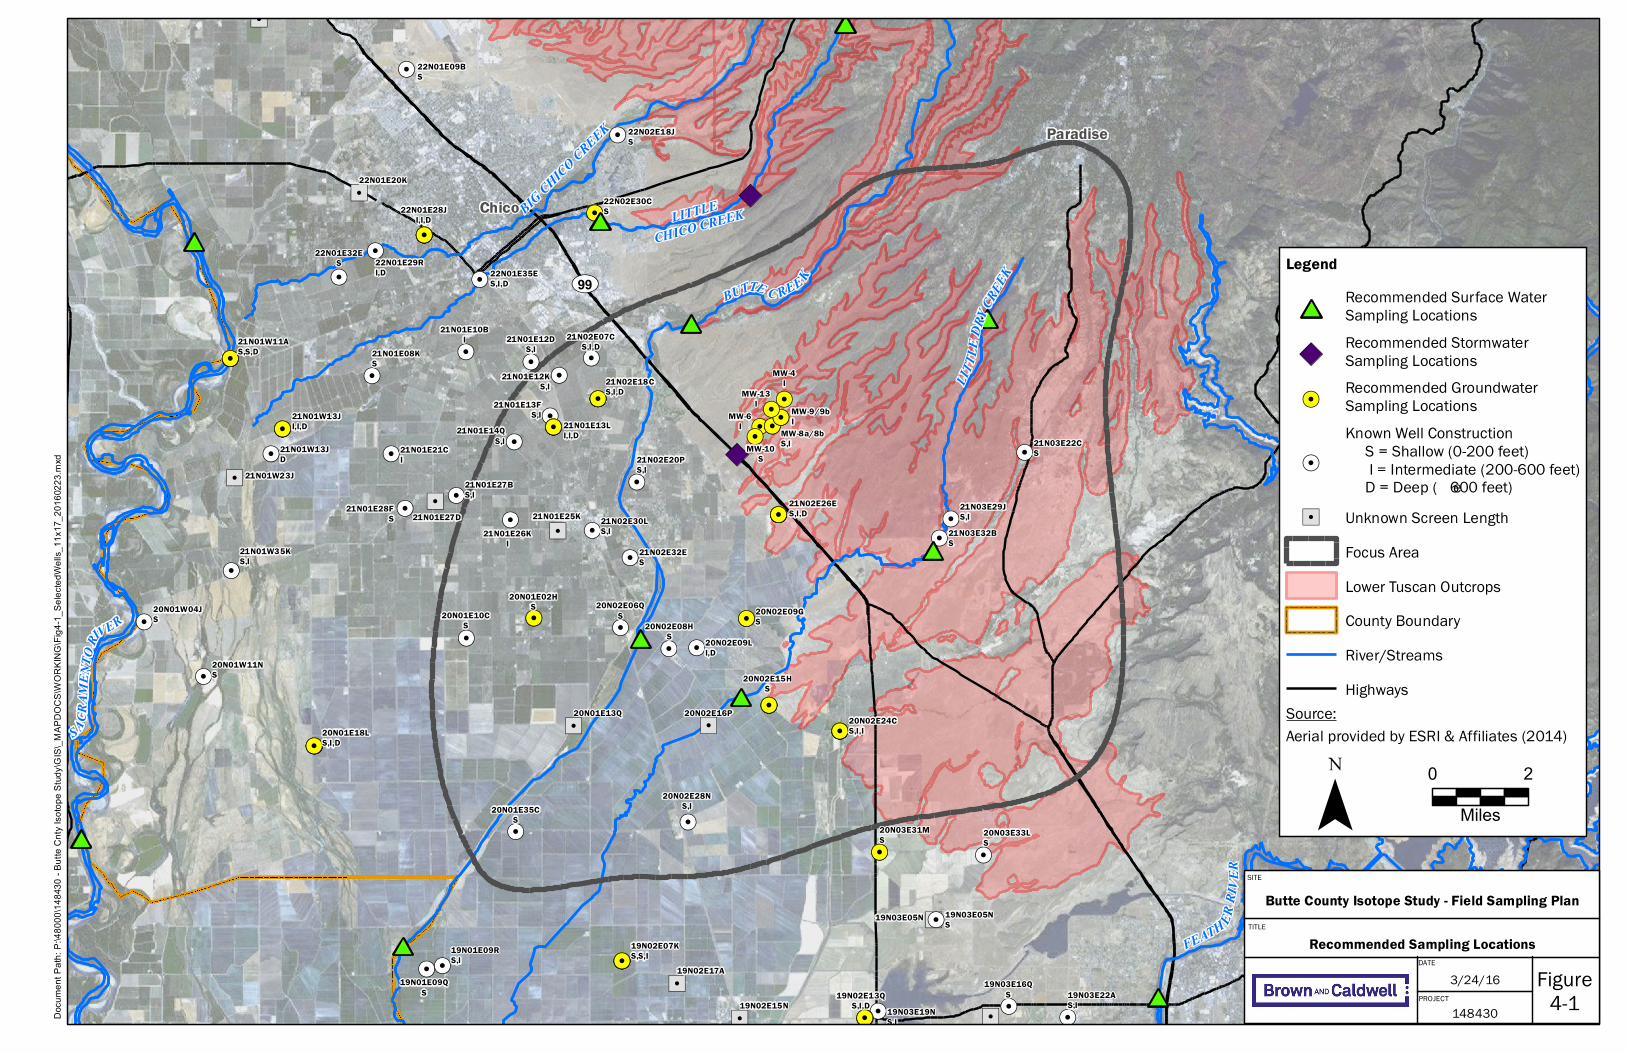
Sampling Locations This section integrates previous data, the DQOs for each media and translates these factors into specific proposed sampling locations in and around the project area. Figure 4-1 presents the proposed sampling locations.
4.1 Identify Data Gaps Appendix A presents a summary of the existing 18O isotope data in and around the Focus Area. Based on the DQOs presented in Section 3, the following data gaps in and around the Focus Area include:
Groundwater samples from monitoring wells with known construction, known lithology (with detailed boring logs), and screen intervals isolated to specific aquifer zones.
Groundwater samples from monitoring wells with multiple screened zones in a single location provide insight into potential recharge sources for each aquifer zone.
Additional groundwater samples adjacent to Butte Creek analyzed for stable isotopes. Seasonal fluctuations in stable isotope chemistry for surface water and groundwater samples.
A contributing factor to these data gaps is that there are many wells in and near the Focus Area for which well completion reports or other information identifying the actual screened interval (and aquifer zones) are not available. Although considerable 18O data in surface water and groundwater was compiled in the Focus Area, few wells had known well construction information, limiting the identification of the depth of the aquifer zone for each groundwater sample. The hydrogeologic setting and DQO discussion presented above stresses the importance of collecting data from known hydrostratigraphic units and requires wells with known construction.
4.2 Potential Sampling Locations Figure 4-1 summarizes the proposed sampling locations for surface water, groundwater and stormwater. These proposed locations are primarily within the Focus Area but are not restricted to the precise area boundaries. For example, surface waters including the Sacramento and Feather Rivers, and Little Chico Creek are outside the Focus Area, but have the potential to influence portions of the Focus Area groundwater. Table 4-1 includes a list of candidate groundwater monitoring wells with known well construction, screened in aquifer zones that meet project criteria. Not all of the wells listed on Table 4-1 need to be sampled, and some wells may be added to or subtracted from this list based on resources, access and availability of new wells. For stormwater samples, two locations are proposed; one from the Neal Road Landfill stormwater ponds and the other from Little Chico Creek bypass.
4.2.1 Surface Water Sampling Locations
Potential surface water sample locations are straightforward and may include: Multiple locations along Butte Creek and Little Dry Creek. Locations that cross the LTA outcrops and
other downstream locations that cross over the quaternary alluvium.
Locations along Little Chico Creek adjacent to the project Focus Area.
Diversions from Butte Creek. Ditches or inlets into the creeks.

Field Sampling Plan Section 4
4-2
DRAFT for review purposes only.
Areas of long term ponding such as the nature preserve at Esquon Ranch.
Feather River, Sacramento River
Recommended potential locations for these sampling points are shown on Figure 4-1.
4.2.2 Stormwater Sampling Locations
To evaluate the potential influence of stormwater runoff on recharge, and the isotopic signature of surface water that may recharge groundwater, two sampling locations have been selected. On the north side of the Focus Area, is a storm drainage channel that diverts water from Little Chico Creek into Butte Creek. The drainage channel is located just east of Highway 99. As described in Section 4.2.1, surface water samples will be collected along both Little Chico Creek and Butte Creek. Samples will also be collected from the drainage channel so that the influence of this diversion on the isotopic signature of water that percolates from Butte Creek can be assessed. The purpose of this assessment is to determine whether the isotopic signature of recharge from Butte Creek over the Lower Tuscan Formation outcrop, which is generally located upstream of the drainage channel, is measurably different from the isotopic signature of recharge from Butte Creek over the Quaternary deposits, which are generally located downstream of the drainage channel.
The second location from which stormwater will be collected is the stormwater retention pond at Neal Road Landfill. The presence of contaminants in the groundwater beneath the landfill demonstrates that recharge is occurring in this part of the Focus Area. Collecting samples from the stormwater retention pond will allow a direct comparison of the isotopic signature of the stormwater at the landfill site with the isotopic signature present in the first two aquifer zones beneath the landfill.
4.2.3 Groundwater Sampling Locations
The proposed list of groundwater monitoring wells developed for this Focus Area is based on a conceptual model developed from the LTA investigation including the results of previous isotopic analysis. Based on the hydrostratigraphic model and the groundwater DQOs, wells with screen intervals that monitor specific aquifer zones will provide very useful insight into recharge sources.
Well samples with long screened intervals that cross multiple aquifer zones will not be used for this study.
Potential groundwater monitoring network should include the following: Wells completed at or near the water table. To assess influence of recharge from Butte Creek
through the shallow alluvium, wells will be selected in this zone at varying distances from the creek. Wells with screen intervals isolated to specific aquifer zones and not wells that screen multiple
zones within the Tuscan Formation.
Wells screened in or near the contact with the Ione Formation.
Candidate wells are presented in Figure 4-1.
Figure 4-1 includes wells located at the Neal Road Landfill that were installed to monitor potential groundwater impacts from this municipal solid waste facility. These wells are selected because they have good lithologic descriptions. Each well is screened within a discrete aquifer zone, but there are wells screened within two different depth intervals, including the water table aquifer and a deeper aquifer zone. These wells are also sampled on a quarterly basis for monitoring of the site and it is suggested that the facility be requested to add collection of the isotopes and other analytes listed in Section 3.5.
BCDWRC will coordinate with landfill personnel to collect samples during the normal sampling period of these landfill monitoring wells. This approach will alleviate the concern of BCDWRC being responsible

Field Sampling Plan Section 4
4-3
DRAFT for review purposes only.
for the handling and disposal of purge water. If other wells are selected from environmental sites, care must be taken that BCDWRC is not responsible for the handling or disposal of any purge water.
4.3 Sampling Frequency One of the primary objectives of the Project is to evaluate seasonal variability of the stable isotope data. To accomplish this evaluation, stable isotope samples will be collected four times. It is recommended that samples be collected for stable isotopes only in April, July, and October 2016. The October 2016 samples will provide an important point of comparison with samples collected in October 2015 by BCDWRC. The October 2015 samples were obtained to provide a baseline data set prior to an anticipated El Nino winter. Although the sampling was conducted prior to preparation of this FSP, the sampling methods, equipment used, and sampling locations for the October 2015 sampling event are consistent with the FSP.
After the October 2016 laboratory analysis is completed, the PM will forward the available isotope data from the four sampling rounds (October 2015, April 2016, July 2016, and October 2016) to BC for review. BC will evaluate the data to provide preliminary identification of potential recharge areas and pathways between these areas and specific groundwater wells. Based on the identified potential recharge pathways, BC will provide the PM with recommendations for a final sampling round to be conducted in January 2017. The final sampling round will include stable isotopes and general chemical parameters at specifically identified locations to refine the identification of recharge areas and pathways, as discussed in Section 3.6.2.
Based on this sampling frequency, it is anticipated that the draft Final Report will be provided to BCDWRC and the TSC in April 2017. The Final Report would then be released for public review in May 2017, and final TSC and public meetings would be conducted in May and June 2017.


5-1
DRAFT for review purposes only.
Section 5
Field Methods This section provides a summary of field sampling preparation and execution described in this FSP. Additional details for each individual task are provided in Appendix B – Standard Operating Procedures.
5.1 Roles and Responsibilities The key personnel for planning and executing each sampling task to meet the DQOs stated in Section 3 are described below: Butte County Project Manager (PM) – obtains direction from management that one or more
sampling event has been authorized. Responsibilities include:
Communicating the scope, schedule and budget to the Field Manager to initiate work.
Responsible for addressing safety; either by 1) preparing a Field Safety Plan (Safety Plan); or 2) by addressing safe work practices and potential physical hazards. An example Safety Plan prepared by BC for the LTA is attached as Appendix C.
Ensuring that the Field Manager has the necessary background, understands the project objectives, the FSP, the media-specific DQOs, sample rationale and proposed sample locations for each particular sampling event.
Scheduling and conducting a ‘readiness review’ with the Field Manager 2 to 4 days before the field work is initiated to ensure that the field staff is prepared to execute the sampling task.
Supporting the Field Manager, while the field work is being conducted should emergencies or changed conditions occur in the field.
Butte County Field Manager (FM) – has received direction from the PM to initiate, supervise and ensure the completion of a specific task. Responsibilities include:
Reading and understanding the FSP with particular attention to the DQOs, sample locations and SOPs that relate to the specific field task authorized.
Reading and understanding the safety issues as directed by the PM.
Collecting the samples in the manner described in the FSP, the Standard Operating Procedures (SOPs) and documenting significant departures from the FSP. Obtaining assistance and supervising others when needed to carry out the authorized tasks.
Communicating with the PM to resolve problems or changed conditions encountered in the field.
Maintains custody of the samples during and after collection until the samples are safely packed and sealed in the sample cooler and custody is relinquished to the courier.
Ensuring that clear accurate instructions are given to the laboratory including instructions on the custody form identifying the PM as the ultimate recipient of the data.
5.2 Field Readiness Review Approximately three weeks prior to sample collection, the PM will review the list of sample locations, media to be sampled and review the analytes to be requested. After confirming the number of samples
Field Sampling Plan Section 5
5-2
DRAFT for review purposes only.
and analytical parameters, the PM will meet with the FM to conduct a ‘readiness review’ ensuring that all needed equipment, supplies and communication with laboratories and land owners to ensure that the DQO identified in this FSP are satisfied. The readiness reviews ensure that all parties (PM, FM, staff, well, property owners, laboratories) have communicated and understand their roles and have completed the planning and preparation required to complete their responsibilities for each field sampling event. SOP 7 summarizes the details and the scope of the field ‘readiness review’. The highlights of SOP 7 includes the following:
PM responsibilities:
Ensures that the FM understands that DQOs, sample rationale and sample locations identified in this FSP for that particular sampling task.
Initiates the ‘readiness review’ with the FM or assistant to confirm that staff is familiar with the Safety Plan, understands sampling objectives, DQOs and sample locations from the FSP and has communicated with landowners and laboratories to obtain access, and prepare for sample delivery to the lab
FM responsibilities:
Is familiar with the Safety Plan, FSP and the specific DQOs and sample locations for the specific tasks.
Contacts the well/land owner, communicates with the laboratory, and procures all equipment needed to conduct the sampling.
Assembles all equipment, supplies, sample containers, coolers prior to packing the vehicle. Makes sure all equipment is workable and calibrated, as necessary.
5.3 Laboratory Coordination Two laboratories will be used for this study: Isotech will be used for analysis of stable isotopes D and 18O; Calscience will be used for analysis of all other general chemical parameters. Separate laboratory control procedures will be used for the different labs because the isotopic analysis will be conducted on several occasions from a relatively large number of locations whereas general chemical parameters will only be sampled once, near the end of the study, from a limited set of sample locations.
5.3.1 Isotopic Analysis
When the sample locations are established by the PM and communicated to the FM, the FM shall contact Isotech to notify them of the pending submittal of the samples. Samples are to be collected in 60 milliliter (mL) glass bottles without preservative. Bottles should be obtained by the FM prior to the sampling event from Qorpak (item #GLC-0129, http://www.qorpak.com/ ).
5.3.2 General Chemical Parameters Analysis
When the sample locations and analytical parameters are established by the PM and communicated to the FM, the FM contacts Calscience approximately one to two weeks before the sampling event. Calscience will prepare for the incoming samples and prepare the appropriate bottle sets for general chemical parameters. Table 5-1 summarizes the analytes, minimum volume, preservatives and holding time recommended for each sample.
Calscience will prepare the “standard bottle set” which includes: one 250 mL poly unpreserved - anions,
one 250 mL poly HNO3 preserved - cations; this sample requires filtration
one 1 L poly unpreserved - TDS

Field Sampling Plan Section 5
5-3
DRAFT for review purposes only.
one 1 L poly HNO3 preserved – alkalinity.
two 1 L wide-mouthed poly – for transferring samples, filtering samples.
Additional bottle sets should be ordered in case of damage.
Some groundwater wells will have restricted access and require a smaller volume. To match the small volume samples, the FM will contact Calscience and request the same sample analyte list using a “limited volume bottle set”. This bottle set is subject to change but at this time includes:
one 200 mL poly unpreserved - anions, one 200 mL poly HNO3 preserved - cations; this sample requires filtration
one 200m L poly unpreserved - TDS
one 200 mL poly HNO3 preserved – alkalinity one 1 L wide-mouthed poly – for transferring samples, filtering samples.
5.4 Field Equipment Surface water and stormwater sampling will require minimal equipment in addition to sample containers and sample forms. Groundwater sampling may require additional equipment to be rented or purchased in advance as referenced in the SOPs (Appendix B).
5.4.1 Surface Water Sampling Equipment
Two sampling procedures will be used;
1) Direct grab sample – detailed in SOP-1 Standard sample container set (described in Section 5.3.2) Tubing, connectors and filtration equipment
Global positioning system (GPS)
Myron field analytical meter (pH, EC, temp, ORP). Additional wide-mouth sample containers to transfer samples.
2) Dipping cup surface water sample – Detailed in SOP-1
Standard sample container set (described in Section 5.3) Tubing, connectors and filtration equipment (power source is usually provided by a standard
cigarette lighter in the vehicle)
GPS Dip sampler – telescoping or solid aluminum/PVC pole with removable dip cup
Dipping cup – a disposable wide-mouth container attached to the pole.
Myron field analytical meter (pH, EC, temp, ORP).
5.4.2 Groundwater Sampling Equipment
Field equipment for groundwater sampling is provided on SOP-2. Three basic scenarios for groundwater sampling for this study are anticipated:
1) Scenario 1 - Wells with existing pumps that can be sampled directly from existing discharge lines. 2) Scenario 2 - Wells with no existing pumps that will be purged prior to sampling using portable
pump. 3) Scenario 3 – Wells with no existing pump that will be sampled using the Hydrasleeve® sampling
method.

Field Sampling Plan Section 5
5-4
DRAFT for review purposes only.
For all three scenarios, properly calibrated field instruments to measure pH, temperature, electrical conductivity and other parameters such as oxidation-reduction potential will be required. Section 5.6 describes the procedures to be used for each of these three scenarios.
5.4.3 Stormwater Runoff Sampling Equipment
The stormwater runoff sample will be collected as a surface water sample and will use similar methods as described above and in SOP-1.
5.5 Documentation and Forms Forms are essential to document records of groundwater, surface water and stormwater runoff. These forms and procedures used to document field conditions and field data are provided in SOP-6. Chain-of-custody (COC) forms and sample labels should be assembled and filled out in advance if possible. Once bottles are received, labels can be partially completed. The shipping address and telephone number of the laboratory is indicated on the COC form.
5.6 Standard Operating Procedures – Surface Water and Stormwater For a complete description of the field methods associated with surface water and stormwater sampling refer to SOP-1 (Appendix B). There are two methods of collecting surface water samples described in this section; grab samples and dipping cups. Stormwater runoff samples are collected with the identical method described in surface water grab samples.
5.6.1 Surface Water Grab Samples
Grab samples are simple and require no equipment other than nitrile gloves and a clean, wide mouth container that the sampler uses to transfer the water sample into the labeled sample containers. The sampler can be located on a safe location on the side of a creek, river, pond or lake, or can wear rubber boots of hip waders and if the conditions are safe, enter the surface water body and collect the sample upstream of their location with minimal disturbance of sediment.
The sampler collects one to four grab water samples with a clean wide-mouth poly container sampler, and collects a portion of the sample for field parameters. The sampler then transfers the water sample from wide-mouth containers into the sample containers in accordance with Section 5.3 and SOP-1 (Appendix B).
5.6.2 Dipping Cup Surface Water Samples
When larger water bodies are sampled, there is not always a safe location to collect a grab water sample. In such situations, the dipping cup sampling method should be used, in accordance with the Safety Plan. A clean sample container is secured to the end of an aluminum or PVC pipe allowing the sampler to dip the wide-mouth container into a flowing, clean portion of the surface water body from a safe location. This technique allows the collection of a relatively clean, low solids sample that is transferred into the sample containers. Additional details about surface water sampling are presented in SOP-1 (Appendix B).
5.7 Standard Operating Procedures – Groundwater Three potential scenarios are anticipated for groundwater and all preparation, equipment, methods, and documentation for each scenario are presented in SOP-2.

Field Sampling Plan Section 5
5-5
DRAFT for review purposes only.
Scenario 1) - a fully equipped shallow, intermediate or deep well with pump and surface sample port with less than 200 gallons of purge water or less than 4 hours to purge the well. Scenario 1) requires the least equipment for groundwater sampling and satisfies the DQOs.
Scenario 2) - a shallow (0 to 200 feet bgs), intermediate (200 to 600 feet bgs) or deep (>600 feet bgs) well without a dedicated pump, and at least 2 inch diameter. Based on calculations, this well would require less than 200 gallons of purge water and less than 4 hours to purge the well. This type of well may have transducers or other equipment that can be removed prior to sampling. Scenario 2) requires more equipment but allows for conventional purging of three to five casing volumes of water prior to sampling, and satisfies the DQOs.
Scenario 3) - a shallow, intermediate or deep well with obstructions that provide 1-2 inches of continuous access or an unobstructed well that would require more than 200 gallons or more than 4 hours to purge the well. For Scenario 3 purging three to five casing volumes may not be practical; therefore an EPA approved alternative sampling method using a Hydrasleeve is recommended. SOP-2 provides the details regarding the Hydrasleeve sampler and field techniques. There are three steps to using the Hydrasleeve:
1) Ordering the Hydrasleeve sampler and measuring the exact length of nylon cord needed to suspend the sampler at the desired depth, attaching the Hydrasleeve bag sampler and weight.
2) Placing the Hydrasleeve sampler into the well, securing the nylon cord at the surface of the well housing and allowing the Hydrasleeve to equilibrate with the groundwater for 24-48 hours.
3) Returning to the well, removing the Hydrasleeve from the well and transferring the sample into a 100 mL bottle for stable isotope analysis and/or the “low volume container set” described in Section 5.3.2 for general chemistry analysis.
Given the expense and logistics associated with Scenario 2) the PM may choose to test both the conventional purge sampling technique compared to the Hydrasleeve method, which requires much less equipment and no purge water management. BC recommends comparing both conventional purge and Hydrasleeve sampling methods on the CSU Chico wells (21NO2E18C) because this well has 3 nested wells in one location and has previous D, 18O and general chemical parameters collected during the LTA (BC, 2013). We also recommend that the PM select two other groundwater wells that were sampled as part of the LTA for testing of the Hydrasleeve method. If the results are similar to those from the LTA (BC, 2013), then the Hydrasleeve technique may provide equivalent data with less equipment and labor required.
5.8 Quality Assurance/Quality Control Methods and Procedures 5.8.1 Stable Isotope Analysis
Precision is determined by the laboratory using duplicate analysis of samples and internal standards. The laboratory reports an overall precision for the method of ±0.3 per mil for 18O and ±1 per mil for D. Accuracy is established by measuring VSMOW or using internal standards and check standards whose isotope abundance was determined by direct comparison with VSMOW.
Often the laboratory will produce data with a precision better than what is generally reported and it is useful to establish the actual data precision. This can be achieved by submitting blind triplicate samples to the lab included in a batch of collected samples submitted for analysis. Blind triplicates are made by filling three bottles with the same water samples and labeling two of the three containers with fictitious sample IDs documented in the field notes but not identified as triplicate samples on the COC. The reported data for these three sample analysis can be compared and a standard deviation computed to determine the precision for the sample analysis batch. Additional blind triplicates can be submitted for later sample batches and compared to earlier ones to establish a batch-to-batch precision.

Field Sampling Plan Section 5
5-6
DRAFT for review purposes only.
The frequency of preparing these blind triplicate samples should be approximately 5 percent (one triplicate samples for every 20 samples submitted to the laboratory). If fewer than 20 samples are collected and submitted to the laboratory in one sample shipment, we recommend at least one duplicate sample per batch of 5-10 samples.
Accuracy within the precision range can be established by submitting a blind internal standard that Butte County prepares. This internal standard can be as simple as filling either a large volume air-tight bottle or a large set of individual bottles of a sampled groundwater. One of the samples would be submitted to Isotech Laboratories for standard D-18O analyses. Another one of the samples can be submitted to a different laboratory and analysis results from each lab can be compared and verified. All other subsequent batches submitted to Isotech can include one of the blind internal standards to monitor data accuracy over time.
5.8.2 General Chemistry Data
Quality control samples, consisting of blind duplicate samples, will be collected in the field according to procedures discussed in SOP-1 for surface water and stormwater and SOP-2 for groundwater, at a minimum frequency of 5 percent of the total amount of samples collected for each sampling round. Duplicate samples will be submitted for the same analysis as the primary samples.
The quality assurance/quality control procedures that will be conducted by Calscience for sample analysis are discussed in Appendix D. If another laboratory is used, it must be a California certified laboratory that meets or exceeds the requirements of the Quality Systems Manual for Environmental Analytical Services provided in Appendix E.
During sample collection, sufficient volume will be collected for each sample to allow the analytical laboratory to run matrix spike/matrix spike duplicate (MS/MSD) analysis. The MS/MSD samples assess laboratory accuracy, precision, and matrix interference. Following shipment of the samples to the laboratory, the laboratory prepares MS and MSD samples and calculates the percent recovery and relative percent difference in concentrations between the samples to measure the precision of the analytical method.
Analytical performance will be assessed on a "batch QC" basis, that is, by evaluating the quality control (QC) sample results for groups of samples that were prepared and analyzed together. The assessment steps will include the following:
Reviewing chain-of-custody documentation. Checking holding time compliance.
Determining whether adequate or required batch QC samples were analyzed and reported according to method and project specifications (i.e., method blanks, laboratory control samples, and matrix spikes).
Assessing laboratory control samples (LCS) and laboratory control sample duplicate (LCSD) recoveries and relative percent differences (RPD).
Assessing matrix spike duplicates (MSD) recoveries and MSD recoveries and RPDs.
Influences from field conditions, cross-contamination, and assessment of matrix interferences.
QC samples will be associated with the field samples by sampling date, shipment cooler, sampling equipment, location, matrix, or other conditions related to sample collection and handling, as appropriate.

6-1
DRAFT for review purposes only.
Section 6
Data Management 6.1 Electronic Data Transfer Prior to contracting with the laboratory, the Butte County Project Manager will request that the laboratories provide an electronic report in addition to the hard copy (or pdf) of the laboratory report. The Butte County Project manager should request that the laboratory provide an electronic data deliverable (EDD) compatible with EQuIS, the industry standard data management software. EQuIS uses standardized format, simplifying electronic data deliverable formats, integration with other software (e.g., Excel, GIS, CADD), production of tables and figures, and production of regulatory electronic data deliverable formats. EQuIS has a number of standard electronic QA/QC checks which minimize efforts to maintain data base integrity.
The Butte County Project Manager will compile and maintain the data base until the results of the study are complete.
6.2 Data Quality Review The goal of a data quality review is to establish that reported data meets the precision and accuracy requirements of data analysis.
When the data are received, the Butte County Project Manager compiles one month’s worth of electronic data reports and transmits data in batches to Brown and Caldwell for a limited Level II completeness and accuracy check. The BC data reviewer will compile the data into the project database and document any issues with the Butte County Project Manager. If necessary the Butte County Project Manager will work with Isotech Laboratories which hold all samples for one month after analysis and will re-analyze any of those samples that the customer feels has not met data quality standards.

7-1
DRAFT for review purposes only.
Section 7
Reporting Butte County will assemble the data in electronic form and provide a copy to BC to prepare the Final Report. The PM will also provide all field notes and records of water samples to BC. The PM will provide the field parameters (pH, EC, Temperature, ORP and DO) to BC in electronic form.
When these data are received BC will prepare a draft Report for Butte County to review. The content of this report is outlined in Attachment III of the County of Butte Contract Number X21825. This report will review the QA/QC of the results and provide an interpretation of recharge mechanisms observed in the Focus Area, addressing the project objectives and DQOs identified in this FSP.
BC will meet with the TSC and address Butte County’s comments on the draft Report. When comments have been addressed, BC will produce copies of the Final Report for public review. BC will provide support to Butte County in public meetings to communicate the results of these findings to the public.
BC understands that Butte County may decide to expand the list of surface water, stormwater and groundwater sampling locations identified in this FSP, after BC completes the Final Report. If Butte County decides to continue or expand stable isotope sampling, we recommend that Butte County document the locations where water samples were collected. To ensure that the data is documented properly, we suggest that Butte County present the results of the analytical program on an annual basis in the form of a Technical Memorandum or an Annual Report.


8-1
DRAFT for review purposes only.
Section 8
References Brown and Caldwell, 2016. Compilation of Existing Stable Isotope Data - Technical Memorandum, February
Brown and Caldwell, 2013. Lower Tuscan Aquifer Investigation, Final Report
Turner, J.B., T. Godwin, P. Gosselin, and A. Kopania, 2012. Case Study – Analysis of Aquifer Effects During Large Scale Agricultural Pumping in Managing Irrigation Systems in Today’s Environment, USCID Water Management Conference, Reno, NV November 13-16.
Blair, T.C., Baker, F.G., and Turner, J.B., 1991, Cenozoic Fluvial-Facies Architecture and Aquifer Heterogeneity, Oroville, California, Superfund Site and Vicinity, in A.D. Miall and N. Tyler, eds., The Three-Dimensional Facies Architecture of Terrigenous Clastic Sediments and Its Implications for Hydrocarbon Discovery and Recovery, SEPM, Concepts in Sedimentology and Paleontology, Volume 3, 1991.


Field Sampling Plan
FIG-1
DRAFT for review purposes only.
Figures
Figure 1-1. Site Location
Figure 3-1. Focus Area Groundwater Wells & Surface Water
Figure 3-2. Hydrogeologic Cross Section
Figure 4-1. Recommended Sampling Locations

Butte County Isotope Study - Field Sampling PlanDATE SITE
TITLEFigure
1-12/22/16
Site Location
Docu
ment
Path:
bcsa
c01 P
:\480
00\1
4843
0 - Bu
tte Cn
ty Iso
tope S
tudy\G
IS\_M
APDO
CS\W
ORKIN
G\Fig
1-1_S
iteMa
p_8x
11_2
0160
222.m
xd
PROJECT
148430
Focus Area
Legend
Focus AreaSource: ESRI & Affiliates
0 40
Miles¯

"/
"/
"/
"/
"/ "/
"/
"/"/
"/
"/
"/
!ñ!ñ !ñ!ñ!ñ
!ñ!ñ!ñ
!ñ
!ñ!ñ !ñ
!ñ!ñ
!ñ!ñ!ñ
!ñ
!ñ
!ñ
!ñ!ñ
!ñ
!ñ
!ñ!ñ!ñ!ñ!ñ
!ñ
!ñ !ñ
!ñ!ñ !ñ
!ñ
!ñ!ñ!ñ!ñ
!ñ!ñ
!ñ!ñ
!ñ
!ñ!ñ!ñ
!ñ!ñ!ñ!ñ
!ñ
!ñ
!ñ!ñ!ñ
!ñ
!ñ!ñ!ñ!ñ!ñ
!ñ
!ñ
!ñ!ñ
!ñ
!ñ!ñ!ñ!ñ
!ñ !ñ
!ñ
!ñ
!ñ!ñ!ñ!ñ!ñ!ñ!ñ!ñ!ñ!ñ!ñ
LITT
LEDR
Y CRE
EK
BIG CHICO CREEK
BUTTE C REE K
FEATH ERRI
VER
19N02E13Q
20N02E15H
19N01E09Q 19N01E09R19N02E07K
19N03E05N
19N03E16Q19N03E19N 19N03E22A
20N01E02H
20N01E10C
20N01E35CS
20N02E06Q
20N02E08H
20N02E09G
20N02E09L
20N02E24C
20N02E28N
20N03E31M 20N03E33L
21N01E10B21N01E12D
21N01E12K
21N01E13F
21N01E13L21N01E14Q21N01E21C
21N01E26K
21N01E27B21N01E28F
21N02E07C
21N02E18C
21N02E20P
21N02E26E21N02E30L
21N02E32E
21N03E22C
21N03E29J
21N03E32B
22N01E09B
22N01E28J22N01E29R
22N01E35E
22N02E18J
22N02E30C
19N02E15N
19N02E17A
19N03E05N
19N03E21C
20N01E13Q 20N02E16P
21N01E25K21N01E27D
21N01E08K
UV99
LITTLE
CHICO CREEK
MW-4
MW-6MW-7
MW-8a/8bMW-9/9b
MW-10MW-11
MW-12
MW-13
21N01W23J
21N01W35K
20N01E18L
20N01W04J
20N01W11N
21N01W11A
21N01W13J
21N01W13J
22N01E32E
22N01E20K
Chico
Paradise
S ACRA
MEN
TORIV
ER
Docu
ment
Path:
P:\4
8000
\1484
30 - B
utte C
nty Is
otope
Stud
y\GIS\
_MAP
DOCS
\WOR
KING\
Fig3-1
_GW
SW_1
1x17
_201
6022
4.mxd
2/23/16
Focus Area Groundwater Wells & Surface Water
Butte County Isotope Study - Field Sampling Plan
Figure3-1
TITLE
SITE
PROJECT
DATE
148430
¯ 0 2Miles
Legend
!ñ Known Well Construction"/ Unknown Screen Length
Focus AreaLower Tuscan OutcropsCounty BoundaryRiver/StreamsHighways
Aerial provided by ESRI & Affiliates (2014)Source:

Butte County Isotope Study - Field Sampling PlanDATE SITE
TITLEFigure
3-2
2/24/16
Hydrogeologic Cross Section
Doc
u men
t Pat
h: b
csac
01 P
:\48
000
\ 14
843
0 - B
utte
Cnt
y Is
otop
e St
udy\
GIS
\_M
APD
OCS
\ WO
RK
ING
\Fig
1- 1
_Site
Ma p
_8x1
1_20
1602
22.
mxd
PROJECT
148430
"/
"/
"/
"/
"/ "/
"/
"/"/
"/
"/
"/
!ñ!ñ !ñ!ñ!ñ
!ñ!ñ!ñ
!ñ
!ñ!ñ !ñ
!ñ!ñ
!ñ!ñ!ñ
!ñ
!ñ
!ñ
!ñ!ñ
!ñ
!ñ
!ñ!ñ!ñ!ñ!ñ
!ñ
!ñ !ñ
!ñ!ñ !ñ
!ñ
!ñ!ñ!ñ!ñ
!ñ!ñ
!ñ!ñ
!ñ
!ñ!ñ!ñ
!ñ!ñ!ñ!ñ
!ñ
!ñ
!ñ!ñ!ñ
!ñ
!ñ!ñ!ñ!ñ!ñ
!ñ
!ñ
!ñ!ñ
!ñ
!ñ!ñ!ñ!ñ
!ñ !ñ
!ñ
!ñ
!ñ!ñ!ñ
!ñ!ñ!ñ
!ñ
!ñ!ñ!ñ
!ñ
!ñ!ñ!ñ!ñ!ñ
!ñ
!ñ!ñ!ñ
!ñ!ñ!ñ
!ñ!ñ!ñ
!ñ!ñ!ñ
!ñ!ñ!ñ!ñ
!ñ!ñ!ñ!ñ
!ñ!ñ!ñ!ñ!ñ!ñ!ñ!ñ
#*
#*
#*
#*
#*
#*
#*
#*
#*
#*
#*
")
")
LITT
LEDR
Y CRE
EK
BIG CHICO CREEK
BUTTE C REE K
FEATH ERRI
VER
19N02E13QS,I,D
20N02E15HS
19N01E09QS
19N01E09RS,I
19N02E07KS,S,I
19N03E05NS
19N03E16QS
19N03E19NS,I
19N03E22AS,I
20N01E02HS
20N01E10CS
20N01E35CS
20N02E06QS
20N02E08HS
20N02E09GS
20N02E09LI,D
20N02E24CS,I,I
20N02E28NS,I
20N03E31MS 20N03E33L
S
21N01E10BI 21N01E12D
S,I
21N01E12KS,I
21N01E13FS,I
21N01E13LI,I,D21N01E14Q
S,I21N01E21CI
21N01E26KI
21N01E27BS,I
21N01E28FS
21N02E07CS,I,D
21N02E18CS,I,D
21N02E20PS,I
21N02E26ES,I,D21N02E30L
S,I
21N02E32ES
21N03E22CS
21N03E29JS,I
21N03E32BS
22N01E09BS
22N01E28JI,I,D
22N01E29RI,D 22N01E35E
S,I,D
22N02E18JS
22N02E30CS
19N02E15N
19N02E17A
19N03E05N
19N03E21C
20N01E13Q 20N02E16P
21N01E25K21N01E27D
21N01E08KS
UV99
LITTLE
CHICO CREEK
MW-4I
MW-6I MW-8a/8b
S,I
MW-9/9bI
MW-10S
MW-13I
21N01W23J
21N01W35KS,I
20N01E18LS,I,D
20N01W04JS
20N01W11NS
21N01W11AS,S,D
21N01W13JD
21N01W13JI,I,D
22N01E32ES
22N01E20K
Chico
Paradise
S ACRA
MEN
TORIV
ER
Docu
ment
Path:
P:\4
8000
\1484
30 - B
utte C
nty Is
otope
Stud
y\GIS\
_MAP
DOCS
\WOR
KING\
Fig4-1
_Sele
ctedW
ells_
11x1
7_20
1602
23.m
xd
3/24/16
Recommended Sampling Locations
Butte County Isotope Study - Field Sampling Plan
Figure4-1
TITLE
SIT E
PROJECT
DAT E
148430
¯ 0 2Miles
Legend
#*Recommended Surface WaterSampling Locations
")Recommended StormwaterSampling Locations
!ñRecommended GroundwaterSampling Locations
!ñ
Known Well Construction S = Shallow (0-200 feet) I = Intermediate (200-600 feet) D = Deep (≥ 600 feet)
"/ Unknown Screen Leng thFocus AreaLower Tuscan OutcropsCounty BoundaryRiver/StreamsHighways
Aerial provided by ESRI & Affiliates (2014)Source:

Field Sampling Plan
TAB-1
DRAFT for review purposes only.
Tables
Field Sampling Plan Tables
TAB-2
DRAFT for review purposes only.
Table 3-1. Analytical Laboratory Methods, Bottle, Sample Volume, Preservative and Holding Time
Analytical Class Analyte Test
Method Minimum Volume
Preservative Filtrati
on? Holding Time
Stable isotope
D CRDS1 40 mL none No 1 year (standard container);
several years in a tightly sealed container
18O CRDS1 40 mL none No 1 year (standard container);
several years in a tightly sealed container
Cations
boron
6010 250 mL HNO3 Yes Six months
calcium
iron
magnesium
manganese
potassium
sodium
Anions
chloride
300.0 200 4˚C No 48 hours
fluoride
nitrate
phosphate
sulfate
General chemistry Alkalinity 310.1 200 4˚C No 14 days
Dissolved Solids 160.1 200 4˚C No 14 days 1 – CRDS – cavity ring-down spectrometry

Field Sampling Plan Section 5
3
DRAFT for review purposes only.
Table 4-1. Recommended Groundwater Sample Locations
Well I. D. Well Type Total Depth (feet bgs1)
Top of Screen
Interval (feet bgs)
Bottom of Screen Interval
(feet bgs) Date Drilled
Well Casing Diameter (inches)
19N02E07K002M Observation 600 560 570 9/5/2006 2.5
19N02E07K003M Observation 368 330 340 9/5/2006 2.5
19N02E07K004M Observation 192 140 150 9/5/2006 2.5
19N02E13Q001M Observation 221 130 210 11/5/2001 2.5
19N02E13Q002M Observation 495 470 480 8/1/2005 2.5
19N02E13Q003M Observation 706 670 680 8/1/2005 2.5
20N01E18L001M Observation 940 767 894
20N01E18L002M Observation 583 510 560
20N01E18L003M Observation 173 100 110
20N01E02H003M Observation 201 70 180 9/13/2001 2
20N02E09G001M Observation 202 130 179.6 11/15/2001 2
20N02E15H001M Observation 190 170 180 5/11/1995 4
20N02E15H002M Observation 75 55 65 5/16/1995 4
20N02E24C001M Observation 155 124 134 10/1/1999 2
20N02E24C002M Observation 390 336 377 10/1/1999 2
20N02E24C003M Observation 520 484 505 10/1/1999 2
20N03E31M001M Observation 201 130 179.6 11/27/2001 2
21N01W11A001M Observation 1311 810 1280 10/15/2010 2.5
21N01W11A002M Observation 200 125 185 10/15/2010 2.5
21N01W11A003M Observation 104 30 50 10/15/2010 2.5
21N01W13J001M Observation 830 780 820 10/25/2011 2.5
21N01W13J002M Observation 610 570 591 10/25/2011 2.5
21N01W13J003M Observation 400 355 385 10/25/2011 2.5
21N01E13L002M Observation 771 735 760 10/8/2010 2.5
21N01E13L003M Observation 574 540 560 10/8/2010 2.5
21N01E13L004M Observation 353 240 340 10/8/2010 2.5
21N02E18C001M Observation 914 770 880 6/14/2010 2.5
21N02E18C002M Observation 701 360 620 6/14/2010 2.5
21N02E18C003M Observation 240 130 200 6/14/2010 2.5
21N02E26E003M Observation 660 610 620 8/20/2007 2.5
21N02E26E004M Observation 518 400 484 8/20/2007 2.5
21N02E26E005M Observation 315 265 290 8/20/2007 2.5
21N02E26E006M Observation 179 105 150 8/20/2007 2.5
22N01E28J001M Observation 660 460 559
22N01E28J003M Observation 320 200 279

Field Sampling Plan Tables
4
DRAFT for review purposes only.
Table 4-1. Recommended Groundwater Sample Locations
Well I. D. Well Type Total Depth (feet bgs1)
Top of Screen
Interval (feet bgs)
Bottom of Screen Interval
(feet bgs) Date Drilled
Well Casing Diameter (inches)
22N01E28J005M Observation 948 740 800
22N02E30C002M Observation 203 130.8 190.5 11/21/2001 2
MW-4 Monitoring 275 245 275 11/21/1988
MW-6 Monitoring 124 94 124 5/10/1993 4
MW-8a Monitoring 190 170 190 8/3/2001 4
MW-8b Monitoring 222 202 222 8/1/2001 4
MW-9 Monitoring 225 205 225 8/8/2001 4
MW-9b Monitoring 253 220 253 4/17/2008 4
MW-10 Monitoring 114 94 114 8/9/2001 4
MW-13 Monitoring 242 212 242 4/21/2008 4


![[Field Generico Imagens-filefield-Description] 93](https://static.fdocuments.us/doc/165x107/563db958550346aa9a9c6f48/field-generico-imagens-filefield-description-93.jpg)

