Field Guide for Spectral Measurements of Australian … BENTHIC HABITATS..... 5 INTRODUCTION..... 5...
21
A Field Guide for Spectral Measurements of Australian Shallow benthic habitats
Transcript of Field Guide for Spectral Measurements of Australian … BENTHIC HABITATS..... 5 INTRODUCTION..... 5...

A Field Guide for Spectral Measurements of Australian Shallow benthic habitats

Acknowledgements This guide has been produced by Janet Anstee of the Aquatic Remote Sensing Group, CSIRO Land and Water (CLW) for the National Land and Water Resources Audit (NLWRA).
Text and Layout Janet Anstee, Elizabeth Botha, Rebecca Edwards
Photography
Field Assistance Paul Daniel
Dr Elizabeth Botha Dr Young Je Park
Janet Anstee Christopher Gallen (DPI)
Published by
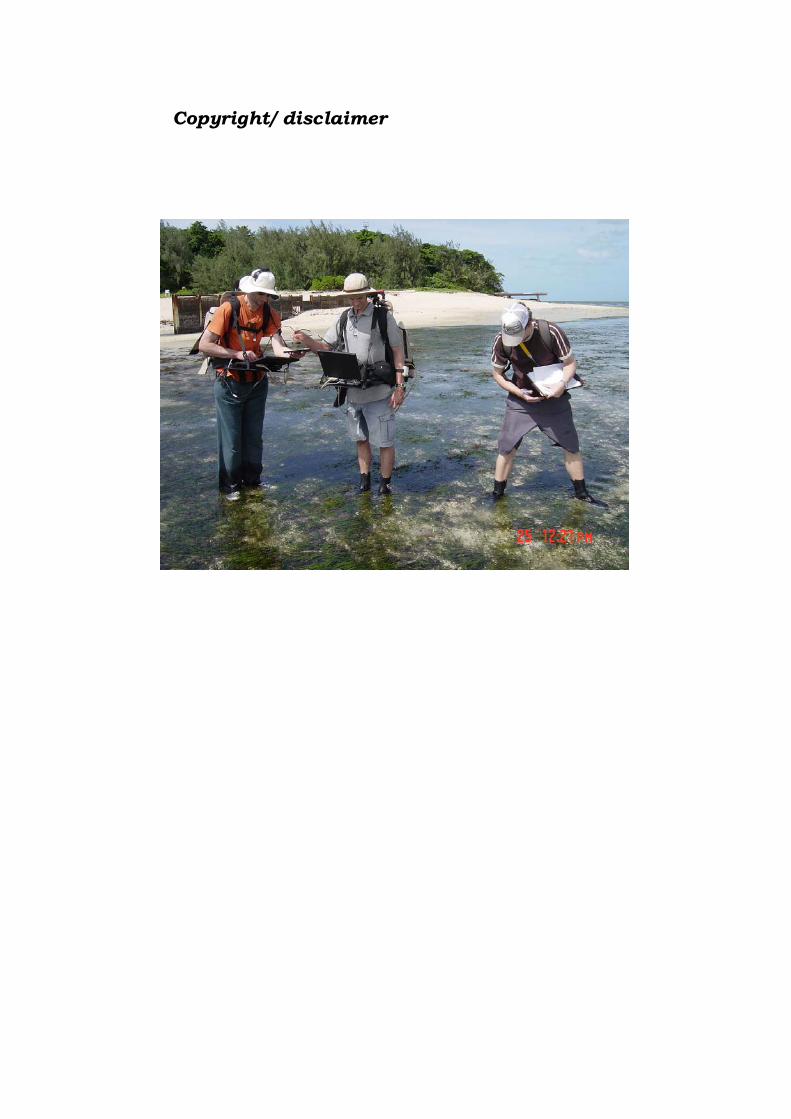
Copyright/ disclaimer
Contents
ACKNOWLEDGEMENTS ......................................................................................... 2 COPYRIGHT/ DISCLAIMER ..................................................................................... 3
FIELD GUIDE FOR SPECTRAL MEASUREMENTS OF AUSTRALIAN SHALLOW BENTHIC HABITATS..................................................................... 5
INTRODUCTION..................................................................................................... 5 Importance of seagrasses and macroalagae................................................... 5 Brief background on spectral measurement & their application in remote sensing and mapping....................................................................................... 6 Spectral Reflectance Data Collection ............................................................. 9
FIELD PLANNING ................................................................................................ 10 Step 1: Make a Timetable.............................................................................. 10 Step 2: Tide Heights...................................................................................... 11 Step 3: Permits.............................................................................................. 11 Step 4: Safety: ............................................................................................... 11
FIELDWORK PREPARATION................................................................................. 12 Equipment list ........................................................................................... 12 Site planning ............................................................................................. 12
METADATA COLLECTION & PROFORMAS ........................................................... 14 Metadata sheets ............................................................................................ 14 Description of each field + keywords to use:................................................ 16
FIELD DATA PROCESSING.................................................................................... 20 SPECTRAL MEASUREMENT ASD COOKBOOK (QUICK ‘N’ EASY GUIDE)........ 20 UPLOADING/DOWNLOADING TO THE SPECTRAL LIBRARY PORTAL ..................... 20 REFERENCES....................................................................................................... 21 FURTHER READING ............................................................................................. 21

Field Guide for Spectral Measurements of Australian Shallow benthic habitats
Introduction This guide has been designed to assist with the collection of reflectance spectra of seagrasses and macroalgae that grows in Australian coastal waters. The purpose of collecting these spectra is to fill in any thematic gaps that exist in the Australian shallow waters spectral library. To facilitate the spectral data collection, the NLWRA has purchased two ASD FieldSpec spectroradiometers (administered by Geoscience Australia). This document was developed to be used in conjunction with the ASD spectroradiometers and the assumption is that the operators have attended a training session in the handling of these spectroradiameters. Importance of seagrasses and macroalagae Seagrasses differ from algae in that they have seeds and fruits whilst algae reproduce with spores. Seagrasses also have separate roots, leaves and underground stems called rhizomes which form extensive networks below the surface whilst algae rarely have roots below the surface (http://www.reef.crc.org.au/discover/plantsanimals/seagrass/index). Whilst seagrass has a growth-form similar to land plants, algae have a large variety of growth forms ranging form single celled plankton algae to large seaweeds that can reach lengths of several metres Seagrasses are important in coastal marine areas where they provide a habitat for many, much smaller marine animals, some of which, like prawns and fish, are commercially important. They also stabilise sediment, helping to keep water clear. Algae are the primary producers that form the basis of most marine food chains. Seagrass and macroalgae often interact to form a complex habitat for many aquatic animals (Laegdsaard, 2001). Insert references here for seagrass and macroalagae identification. Due to their critical importance in coastal environments, monitoring the health and extent of seagrass and macroalgae in marine systems has to be undertaken at a habitat scale. In contrast to field data,
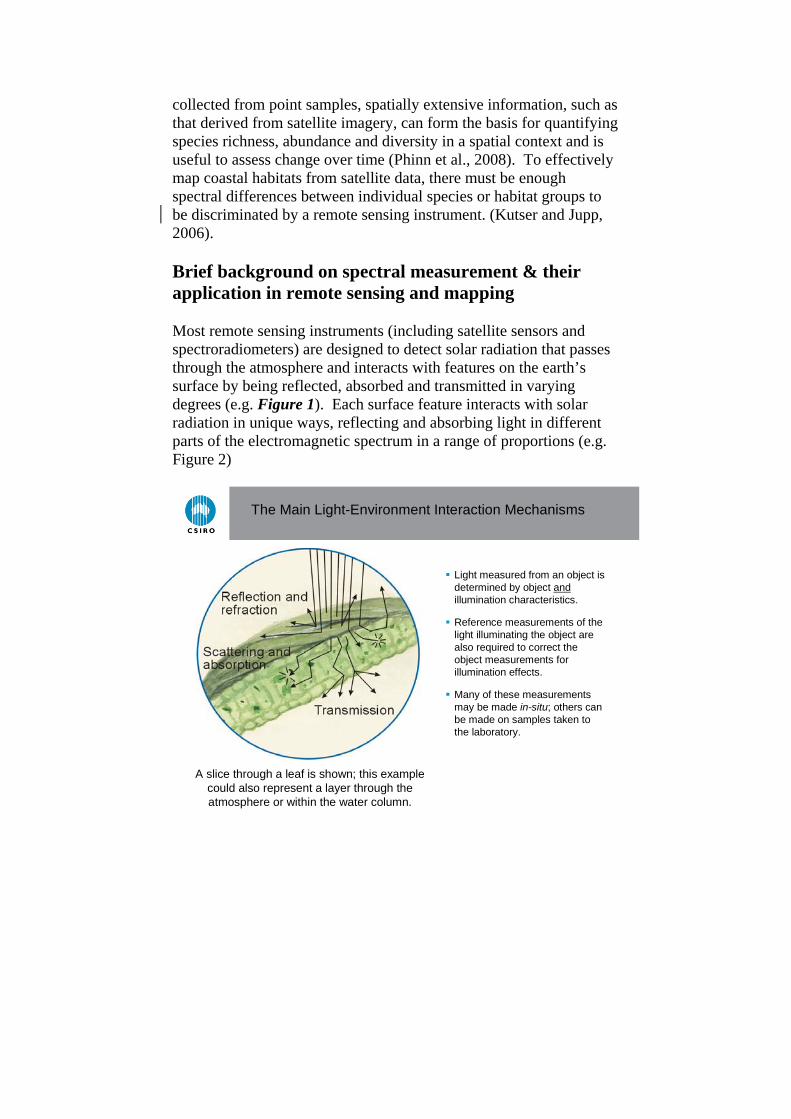
collected from point samples, spatially extensive information, such as that derived from satellite imagery, can form the basis for quantifying species richness, abundance and diversity in a spatial context and is useful to assess change over time (Phinn et al., 2008). To effectively map coastal habitats from satellite data, there must be enough spectral differences between individual species or habitat groups to be discriminated by a remote sensing instrument. (Kutser and Jupp, 2006). Brief background on spectral measurement & their application in remote sensing and mapping Most remote sensing instruments (including satellite sensors and spectroradiometers) are designed to detect solar radiation that passes through the atmosphere and interacts with features on the earth’s surface by being reflected, absorbed and transmitted in varying degrees (e.g. Figure 1). Each surface feature interacts with solar radiation in unique ways, reflecting and absorbing light in different parts of the electromagnetic spectrum in a range of proportions (e.g. Figure 2)
The Main Light-Environment Interaction Mechanisms
Light measured from an object is determined by object andillumination characteristics.
Reference measurements of the light illuminating the object are also required to correct the object measurements for illumination effects.
Many of these measurements may be made in-situ; others can be made on samples taken to the laboratory.
A slice through a leaf is shown; this example could also represent a layer through the atmosphere or within the water column.

Figure 1 Interaction of light with a leaf, showing reflectance, transmittance and absorption pathway
Wavelength
400 500 600 700 800 900
Ref
lect
ance
0.0
0.1
0.2
0.3
ZosteraPosidoniaRuppia Mud (dark substrate)Sand (Light substrate) Sargassum (brown substrate)
Figure 2 Example of unique spectral signatures, in the 400 to 900nm portion of the electromagnetic spectrum, of a number of substrates collected at Wallis Lake, NSW Solar radiation can be measured in three basic ways:
Irradiance: intensity of incoming solar radiation received by the target
Radiance: radiant intensity that is emitted by the target Reflectance: the ratio between radiance and irradiance
Provided that basic measurements are consistent and the relationship between radiance and irradiance taken into account, the most important area of concern for us will be the consistent definition and derivation of reflectance factors (Jupp, 1997). It is thus vitally important to use a standardized protocol for the collection of spectral data to ensure that spectra are spatially and temporally similar. The accuracy of multispectral image analysis and classification is reliant on the spatial resolution of the image being analysed. For example a sensor with a narrow field of view, positioned close to a target, such as seagrass, may measure only the reflectance derived from the seagrass. A lower resolution sensor that is focused on the same target but positioned at a higher altitude, such as a satellite, may have its field of view occupied by a mixture of seagrass, macro algae and other substrates (Figure 3). These mixed pixels present a problem for image classification because the signal that is measured is not representative of a single cover type. In order to accurately classify

the substrate, these mixed spectral signatures can be compared to a set of pure reference spectra, often referred to as ‘end members’, which are measured in the field or in the lab. The assumption is that the spectral variation in an image is caused by mixtures of a limited number of surface materials. Each substance contributes to the spectral signature of the pixel proportionate to the fraction of the pixel that is covered by that substance (Lillesand and Kiefer, 2000).
Wavelength
400 500 600 700 800 900R
efle
ctan
ce
0.0
0.1
0.2
0.3
Wavelength
400 500 600 700 800 900
Ref
lect
ance
0.0
0.1
0.2
0.3
Wavelength
400 500 600 700 800 900
Ref
lect
ance
0.0
0.1
0.2
0.3
Wavelength
400 500 600 700 800 900
Ref
lect
ance
0.0
0.1
0.2
0.3
Wavelength
400 500 600 700 800 900R
efle
ctan
ce
0.0
0.1
0.2
0.3
Wavelength
400 500 600 700 800 900
Ref
lect
ance
0.0
0.1
0.2
0.3
Wavelength
400 500 600 700 800 900
Ref
lect
ance
0.0
0.1
0.2
0.3
Wavelength
400 500 600 700 800 900
Ref
lect
ance
0.0
0.1
0.2
0.3

Figure 3 Representation of how a combination of cover-types in a single pixel-area affects the shape of the spectral signal that is measured by the remote sensing instrument for that area. Spectral Reflectance Data Collection The need for the collection of a comprehensive seagrass and macroalgae spectral library was identified by Dekker et al (2006). In order to replicate the accuracy of sample measurements across locations, a standardized protocol for the collection of spectral library data is important. This protocol is based on:
first measuring radiance from a Spectralon® panel at a set height
then measuring radiance from the target at a set height and viewing angle in relation to the sun (e.g. Figure 4).
Each Spectralon panel and target measurement is derived from an average of multiple samples, and spectral reflectance (target radiance/panel radiance) is derived by the spectrometer’s software and saved along with the location of the sample. All field based reflectance measurements should be adjusted by a scaling factor that represents the ratio between a pristine Spectralon panel and the field panels (Phinn et al, 2008)
Figure 4 Example of measuring panel radiance (from a Teflon reference panel) with an ASD field spectrometer prior to reflectance sampling of Ecklonia over black neoprene (image source: Dekker et al, 2003)
.

Field Planning The main objective of this study is to assess the capability and accuracy of mapping inter-tidal seagrasses using remote airborne and satellite image data sets. Data and information gained from the field sampling program, together with collected simulated, airborne and satellite data, will satisfy the following individual objectives:
Determine the separability of seagrass species from each other and from benthic micro/macro biofilms over a homogenous inter-tidal substrate surface.
Determine minimum cover and cover change detectable in commonly occurring seagrass species.
Determine the effect that sediment colour, algal cover and epiphyte load have on this separability factor and on minimal change detection.
Determine the effect of increasing water depth on change detection and seagrass species identification. Mapping of coastal features from image data sets is complicated by the following factors:
water clarity: increased water clarity increase the ability to map substrate features but decrease the ability to map water quality features
water depth: increases water depth decreased the ability to map substrate features but increase the ability to map water quality features
water roughness: increases water roughness reduces the ability to map substrate features
cloud cover: unable to correct for cloud shade: reduce the quality but can correct for smoke: difficult to correct for depending on the thickness
collection of end members collection of validation data Step 1: Make a Timetable Create a timetable of times of departure and arrival back, and what the objective of the day is and what is to be achieved on the day. Give a copy of this to all participants involved in advance so they can make their arrangements to get to the site on time. List on this timetable what the participants need to bring.

Step 2: Tide Heights To help plan your monitoring, be sure to check the tides at the following website: http://www.bom.gov.au/oceanography/tides/ Step 3: Permits On-ground monitoring in some locations may require permits (e.g., Marine Parks). For a permit to be issued, there is often a fee required. You will need to check with local authorities (Parks and Wildlife or DPI) before conducting any monitoring program in marine waters. Marine Plants are protected in Queensland, Australia. Collection of marine plants for educational, research or monitoring purposes is permitted in accordance with code MP05 of the Fisheries Act and Integrated Planning Act. (DOWNLOAD: MP05_research_VE1.pdf) Step 4: Safety: Please read the following safety section before you begin any fieldwork.
Have a Contact Person to raise the alert if you and the team are not back at a specified or reasonable time.
Assess the risks before monitoring - check weather, tides, time of day, etc.
Use your instincts - if you do not feel safe then abandon sampling.
Do not put yourself or others at risk. Wear appropriate clothing and footwear. Be sun-smart. Be aware of dangerous marine animals. Have a first aid kit on site or nearby Take a mobile phone or marine radio

Fieldwork Preparation Equipment list
ASD FieldSpec spectroradiometer LapTop Blank CDs for back-ups Memory sticks Laptop batteries, mouses & cables Sky characterization Spectralon panel Camera & protective box Sampling equipment Eckman grab Black neoprene panel Zippered bags or clean containers to transport samples if spectral measurements will be done in the lab. GPS GPS system & software Field guides and metadata sheets A Field Guide for Spectral Measurements of Australian
Shallow benthic habitats (this document) ASD cookbook Seagrass/macro algae identification guide Enough field sheets to record metadata for samples at each
station Site planning Study sites are selected to cover a range of seagrass species, substrate colours and seagrass cover levels representative of the coastline. The study sites should be chosen based on discussions with seagrass scientists and resource managers with substantial experience in the study area and to match existing SeagrassWatch (http://www.seagrasswatch.org/monitoring.html) sites where possible.
Sites at each location should be deliberately selected in order to cover the maximum range in species type, density, epiphyte coverage, sediment type and percentage of benthic macroalage present.
At each chosen location set parameters should be collected Field spec measurements will be recorded at a consistent
height to maintain a 45 viewing angle and a ground area of

approximately 1m2. Field ID panel to be used at each location to record sample ID’s.

Metadata collection & Proformas Metadata sheets

Fieldwork: Operator(s): Date Time (local) GPS & data Time (UTC) Location Site Name
Time zone
Site no Site name Lat (dec. deg.) S Long E
Substrate: Substrate Types Substrate
Specification
Epiphytic growth Substrate density of cover
Conditions Water type Wind direction Solar zen./azi. angles
Horizontal Vis.
Water condition Water colour Secchi Depth (m) Bottom Depth
(m)
Cloud cover% Wind speed
Spectrometer Spectrometer ID Spectrum type Panel type F factor Background type
Radiometry Radiometry time Filename Photo ID
Pictures Photos Comments Substrates Panel (Pif) Notes
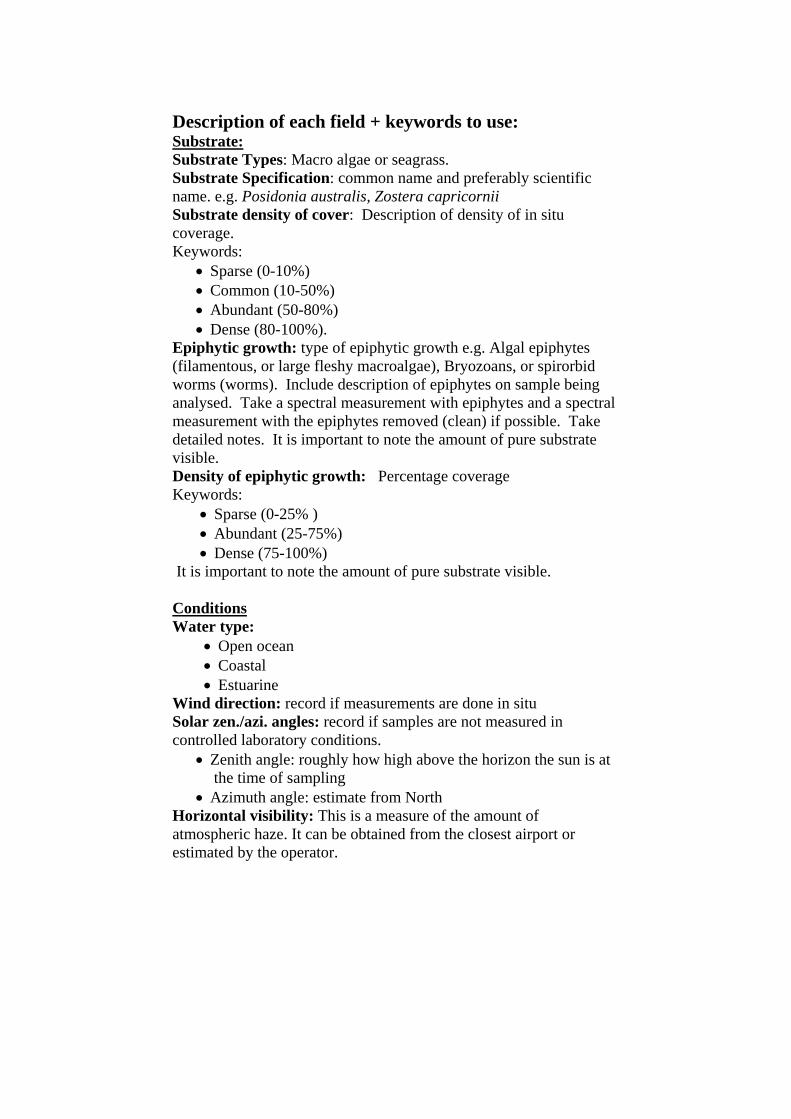
Description of each field + keywords to use: Substrate: Substrate Types: Macro algae or seagrass. Substrate Specification: common name and preferably scientific name. e.g. Posidonia australis, Zostera capricornii Substrate density of cover: Description of density of in situ coverage. Keywords:
Sparse (0-10%) Common (10-50%) Abundant (50-80%) Dense (80-100%).
Epiphytic growth: type of epiphytic growth e.g. Algal epiphytes (filamentous, or large fleshy macroalgae), Bryozoans, or spirorbid worms (worms). Include description of epiphytes on sample being analysed. Take a spectral measurement with epiphytes and a spectral measurement with the epiphytes removed (clean) if possible. Take detailed notes. It is important to note the amount of pure substrate visible. Density of epiphytic growth: Percentage coverage Keywords:
Sparse (0-25% ) Abundant (25-75%) Dense (75-100%)
It is important to note the amount of pure substrate visible. Conditions Water type:
Open ocean Coastal Estuarine
Wind direction: record if measurements are done in situ Solar zen./azi. angles: record if samples are not measured in controlled laboratory conditions.
Zenith angle: roughly how high above the horizon the sun is at the time of sampling
Azimuth angle: estimate from North Horizontal visibility: This is a measure of the amount of atmospheric haze. It can be obtained from the closest airport or estimated by the operator.

Water condition: record if measurements are done in situ. Keywords:
Calm (no wind and minimal waves)
Water color: Important for in situ measurements Keywords:
Blue Green Turbid
Secci Depth: record if in situ measurements are done Bottom depth: record if in situ measurements are done Cloud cover%: Record if measurements are done in situ or on the boat. Keywords: Also indicate where the clouds are in relation to the sun (on the horizon or close to the sun) as this will affect the degree to which the cloud-cover influences the solar irradiance. Wind speed: record if measurements are done in situ. Spectrometer Spectrometer ID: example: ASD 6166/3 Spectrum type:
Reflectance (radiance/irradiance) Irradiance radiance
Panel type: Type of reference panel used to measure sky radiance (Spectralon, Teflon etc.) F factor: scaling factor that represents the ratio between a pristine lab reference panel and the field panels Background type: What the sample was placed on for spectral sampling (e.g. black neoprene or white plastic etc.) Radiometry A description of the substrates measured at this station, the time when the spectrum was recorded (if done in situ or on the boat) the file names of each spectrum that was measured and a reference to any photographs that were taken of the substrates while spectral measurement was done. It is important to record as much detail as possible. Pictures

Additional pictures and notes regarding the station (e.g. photographs of water colour/condition, sky condition, additional photographs of substrates sampled etc.) Notes: Any additional comments (e.g. sudden changes in sky condition whilst sampling etc.)
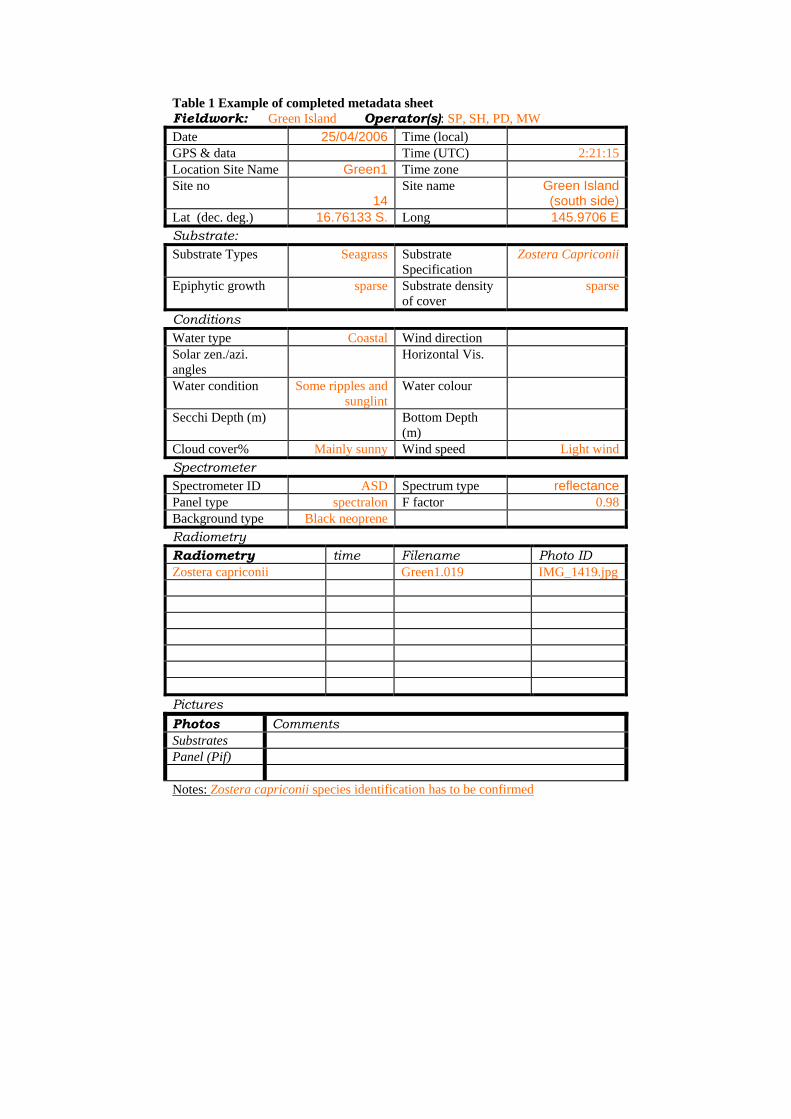
Table 1 Example of completed metadata sheet Fieldwork: Green Island Operator(s): SP, SH, PD, MW Date 25/04/2006 Time (local) GPS & data Time (UTC) 2:21:15 Location Site Name Green1 Time zone Site no
14Site name Green Island
(south side) Lat (dec. deg.) 16.76133 S. Long 145.9706 E Substrate: Substrate Types Seagrass Substrate
Specification Zostera Capriconii
Epiphytic growth sparse Substrate density of cover
sparse
Conditions Water type Coastal Wind direction Solar zen./azi. angles
Horizontal Vis.
Water condition Some ripples and sunglint
Water colour
Secchi Depth (m) Bottom Depth (m)
Cloud cover% Mainly sunny Wind speed Light wind
Spectrometer Spectrometer ID ASD Spectrum type reflectance Panel type spectralon F factor 0.98 Background type Black neoprene Radiometry Radiometry time Filename Photo ID Zostera capriconii Green1.019 IMG_1419.jpg
Pictures
Photos Comments Substrates Panel (Pif) Notes: Zostera capriconii species identification has to be confirmed

Field data processing ASD spectral data Metadata QA
Spectral Measurement ASD Cookbook (quick ‘n’ easy guide)
Uploading/downloading to the Spectral Library portal

References Dekker, A.G., Byrne, G.T., Brando, V.E. and Anstee, J.M. (2003) Hyperspectral Mapping of Intertidal Rock Platform Vegetation as a Tool for Adaptive Management. CSIRO Land and Water Technical Report 9/03, March 2003 Dekker, A.G., Brando, V.E., Anstee, J.M., Fyfe, S., Malthus, T. and Karpouzli, E. (2006) Remote sensing of seagrass ecosystems: use of spaceborne and airborne sensors. In: Larkum, A.W.D., Orth, R.J. and Duarte, C.M (eds.) Seagrasses: Biology, Ecology and Conservation. Springer, Dortrecht. Kutser, T. amd Jupp. D.L.B. (2006) On the possibility of mapping living corals to the species level based on their optical signatures. Estuarine, Coastal and Shelf science, 69: 607-614. Jupp, (1997) Issues in reflectance measurement. CSIRO Earth Observation Centre Discussion document Laegdsaard, P. (2001) A field guide for the identification of the seagrass and macroalgae in Wallis Lake. Centre for Natural Resources, Parramatta, NSW. 56pp. Lillesand, T.M and Kiefer, R.W. (2000) Remote sensing and image interpretation. John Wiley and Sons, Inc, New York. 724pp Phinn, S.R., Roelfsema, C.M., Brando, V.B., Dekker, A.G. and Anstee, J. (2008) Mapping Seagrass Species, Cover and Biomass in Shallow Waters: An Assessment of Satellite Multi-spectral and Airborne Hyper-spectral Imaging Systems in Moreton Bay (Australia). Remote Sensing of Environment. 112(8):3413-3425.
Further reading Refer: seagrass watch Refer: reefcrc.org.au