Field Deployment to Quantify the Value of Real-time ...
43
USDOT Region V Regional University Transportation Center Final Report IL IN WI MN MI OH NEXTRANS Project No. 058PY03 Field Deployment to Quantify the Value of Real-time Information by Integrating Driver Routing Decisions and Route Assignment Strategies By Dongyoon Song Ph.D. student, School of Civil Engineering Purdue University [email protected] Xiaozheng He Research Associate, Nextrans Center Purdue University [email protected] Srinivas Peeta Professor of Civil Engineering Purdue University [email protected]
Transcript of Field Deployment to Quantify the Value of Real-time ...
USDOT Region V Regional University Transportation Center Final Report
IL IN
WI
MN
MI
OH
NEXTRANS Project No. 058PY03
Field Deployment to Quantify the Value of Real-time Information by Integrating Driver Routing Decisions and Route Assignment Strategies
By
Dongyoon Song Ph.D. student, School of Civil Engineering
Purdue University [email protected]
Xiaozheng He Research Associate, Nextrans Center
Purdue University [email protected]
Srinivas Peeta Professor of Civil Engineering
Purdue University [email protected]

DISCLAIMER
Funding for this research was provided by the NEXTRANS Center, Purdue University under Grant No. DTRT07-G-005 of the U.S. Department of Transportation, Research and Innovative Technology Administration (RITA), University Transportation Centers Program. The contents of this report reflect the views of the authors, who are responsible for the facts and the accuracy of the information presented herein. This document is disseminated under the sponsorship of the Department of Transportation, University Transportation Centers Program, in the interest of information exchange. The U.S. Government assumes no liability for the contents or use thereof.
USDOT Region V Regional University Transportation Center Final Report
TECHNICAL SUMMARY
IL IN
WI
MN
MI
OH
NEXTRANS Project No. 058PY03 Final Report, May 15, 2014
Title Field Deployment to Quantify the Value of Real-time Information by Integrating Driver Routing Decisions and Route Assignment Strategies
Introduction Advanced Traveler Information Systems (ATIS) have been proposed as a mechanism to generate and distribute real-time travel information to drivers for the purpose of improving travel experience represented by experienced travel time and enhancing the performance of the vehicular traffic networks. From the system operator’s perspective, it is desired that a driver would fully comply with such information. Traditionally, the prediction of system performance under real-time information provision has been studied using dynamic traffic assignment (DTA) models in which individuals are assigned to time-dependent routes from their origins or en-route locations to their destinations so as to satisfy some system-wide objective and/or individual user level constraints. However, these models primarily focus on prescribing the traffic flow propagation robustly, while the role of driver behavior in the evolution of network dynamics has largely been subsumed by making potentially restrictive a priori assumptions, which include one or more of the following: (i) travel time is the only basis for route choice decision-making, (ii) users are behaviorally homogeneous, and/or (iii) pre-specified behavior classes are available whose fractions are known in the ambient traffic stream. In this context, a comprehensive modeling framework is proposed to understand individual drivers’ behavioral responses in route choice under real-time travel information provision based on driving simulator experiment data. An interactive driving simulator experiment is developed to collect various data related to driving and decision-making with real-time travel information. The associated surveys are also precisely designed to measure drivers’ perception of the information and evaluation of the travel experience.
Findings In this study, an integrated route choice model is proposed with the consideration of perceptional and psychological effects of real-time travel information. In the proposed model, the psychological effects are defined based on the distinct characteristics associated with information-related stresses and explicitly captured by the corresponding indicators (responses to survey questions regarding individuals’ perception of information) for the latent variables. The perceived benefits of the real-time information is affected by the psychological effects defined as latent variables in addition to the explanatory factors
NEXTRANS Project No 058PY03 Technical Summary - Page 1

including individual attributes, route characteristics, and route attribute. To understand the effects of real-time information in decision-making process from the psychological point of view, drivers’ real-time behavioral data under various travel contexts with different information characteristics are required.
In this context, advanced driving simulator-based experiments are designed to collect participants’ behavior data in the context of decision-making under real-time travel information provision. While drivers’ revealed behavior (route choice) data is obtained by the driving trajectory data of the simulator experiment, qualitative data for the real-time perception of information and the evaluation of the travel experience are collected through the multiple surveys associated with the driving simulator experiments. Specifically, a static survey is used to capture the participants’ individual demographic and socio-economic attributes and experience with real-time information, and attitude toward real-time travel information. And several intermediate surveys collect real-time perceptional and psychological states data associated with the information provision under the given travel context.
Recommendations This research illustrates the effectiveness of using the data acquired from the interactive driving simulator experiments in studies involving driver’s behavior responses under real-time travel information provision. Using an interactive driving simulator has some practical merits compared to substantially more expensive field experiments on public road networks. First, it is flexible to build a variety of scenarios in terms of network topology (highway geometry and road surface characteristics), information setting (amount, sources, and content), and travel context (demand level, accidents, and weather conditions). In addition, it is safer than the real physical traffic based experiments. Furthermore, based on the incorporated surveys, the qualitative and psychological implications of the information can be easily collected and analyzed.
Contacts For more information:
Srinivas Peeta Principal Investigator Professor of Civil Engineering & Director NEXTRANS Center, Purdue University Ph: (765) 496 9726 Fax: (765) 807 3123 [email protected]
NEXTRANS Center Purdue University - Discovery Park 3000 Kent Avenue West Lafayette, IN 47906 [email protected] (765) 496-9729 (765) 807-3123 Fax www.purdue.edu/dp/nextrans
NEXTRANS Project No 058PY03 Technical Summary - Page 2

i
ACKNOWLEDGMENTS
The authors acknowledge the assistance and feedback from the members of the
study advisory committee.

ii
TABLE OF CONTENTS
Page
LIST OF TABLES ............................................................................................................. iv
LIST OF FIGURES ............................................................................................................ v
CHAPTER 1. INTRODUCTION ....................................................................................... 1
1.1 Background and motivation .................................................................................1
1.2 Study objectives ...................................................................................................2
1.3 Organization of the research ................................................................................3
CHAPTER 2. INTERACTIVE DRIVING SIMULATOR EXPERIMENT DESIGN ....... 4
2.1 Main issues in simulation-based studies ..............................................................4
2.2 Advanced driving simulator experiment .............................................................6
2.2.1 Network building ......................................................................................... 8
2.2.2 Information provision ................................................................................. 9
2.2.3 Traffic demand .......................................................................................... 10
2.3 Survey design .....................................................................................................10
2.4 Latent variable model ........................................................................................11
CHAPTER 3. INTERACTIVE DRIVING SIMULATOR EXPERIMENT PROCESS .. 14
3.1 Online static survey ...........................................................................................14
3.1.1 Individual attributes .................................................................................. 16
3.1.2 Situational questions ................................................................................. 17
3.1.3 Driving simulator experiment website ...................................................... 20

iii
3.2 Introduction and practice session .......................................................................20
3.3 Pre-experiment survey .......................................................................................22
3.4 Experiment session and mid-run surveys ..........................................................23
3.5 Post-run surveys .................................................................................................26
3.6 Compensation ....................................................................................................27
CHAPTER 4. CONCLUSION ............................................................................................ 30
4.1 Summary ............................................................................................................30
4.2 Future research directions ..................................................................................31
REFERENCES ................................................................................................................. 32
iv
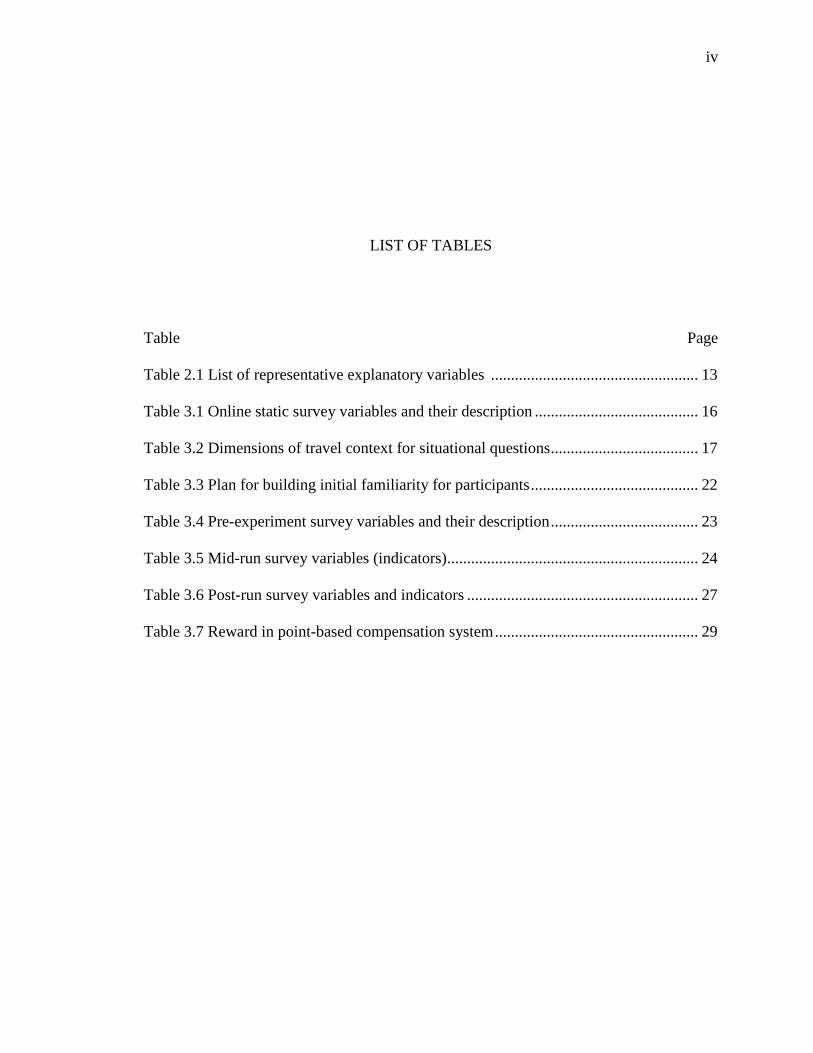
LIST OF TABLES
Table Page
Table 2.1 List of representative explanatory variables .................................................... 13
Table 3.1 Online static survey variables and their description ......................................... 16
Table 3.2 Dimensions of travel context for situational questions ..................................... 17
Table 3.3 Plan for building initial familiarity for participants .......................................... 22
Table 3.4 Pre-experiment survey variables and their description ..................................... 23
Table 3.5 Mid-run survey variables (indicators)............................................................... 24
Table 3.6 Post-run survey variables and indicators .......................................................... 27
Table 3.7 Reward in point-based compensation system ................................................... 29

v
LIST OF FIGURES
Figure Page
Figure 2.1 Indianapolis road network for driving simulator experiment ............................ 7
Figure 2.2 Example of experiment network ....................................................................... 8
Figure 2.3 Example of driving environment in driving simulator ...................................... 8
Figure 2.4 Examples of real-time travel information from different sources .................... 9
Figure 2.5 Proposed integrated choice model ................................................................... 12
Figure 3.1 Steps in driving simulator experiment ............................................................. 15
Figure 3.2 Example of situational questions in online static survey (Situation 1) ........... 18
Figure 3.3 Example of situational questions in online static survey (Situation 4) ........... 19
Figure 3.4 Website for scheduling driving simulator experiment .................................... 21
Figure 3.5 Example of pre-experiment survey ................................................................. 23
Figure 3.6 Example of the mid-run survey ....................................................................... 25
Figure 3.7 Example of the post-run survey ....................................................................... 28

1
CHAPTER 1. INTRODUCTION
1.1 Background and motivation
Advanced Traveler Information Systems (ATIS) have been proposed as a
mechanism to generate and distribute real-time travel information to drivers for the
purpose of improving travel experience represented by experienced travel time and
enhancing the performance of the vehicular traffic networks. From the system operator
perspective, it is desirable that a driver would fully comply with such information.
However, it is also likely that he/she would use it to partly modify the pre-determined
route choice or ignore the information based on inherent behavioral tendencies, past
experience, situational factors (such as time-of-day, weather conditions, and trip
purpose), and the ambient traffic conditions encountered (Peeta and Yu, 2006). Hence,
the complexities associated with driver behavior may impact the reliable prediction of
traffic network states unfolding over time as well as the potential benefits derived from
information provision.
Traditionally, the prediction of system performance under real-time information
provision has been studied using dynamic traffic assignment (DTA) models (Ben-Akiva
et. al. 1998; Mahmassani et. al. 1998) in which individuals are assigned to time-
dependent routes from their origins or en-route locations to their destinations to satisfy a
certain system-wide objective and/or individual user level constraints. However, these
models primarily focus on modeling the traffic flow propagation robustly, while the role
of driver behavior on the evolution of network dynamics has largely been subsumed by
making potentially restrictive a priori assumptions on behavior (Peeta and Yu, 2006).
Such assumptions include one or more of the following: (i) travel time is the only basis
2
for route choice decision-making, (ii) users are behaviorally homogeneous, and/or (iii)
pre-specified behavior classes are available whose fractions are known in the ambient
traffic stream. Further, they do not consider learning that takes place over longer
timescales.
As the system performance is evaluated based on such restrictive assumptions on
drivers’ behavior, the role of real-time information remains unclear for a transportation
network with ATIS. There exists a key gap in terms of adequately understanding the
value of real-time information in real-world contexts. It motivates us to conduct an
integrated driving simulator experiment in which the role of human behavior is analyzed
through careful experiment design to understand the potential benefits of real-time
information.
1.2 Study objectives
The primary objective of this project is to provide a comprehensive modeling
framework to understand individual drivers’ behavioral responses in route choice under
real-time travel information provision based on driving simulator experiment data. With
the consideration of qualitative and psychological aspects of information perception, the
proposed behavioral model can alleviate the aforementioned behavioral assumptions. An
interactive driving simulator experiment is constructed to collect various data related to
driving and decision-making with real-time travel information. The associated surveys
are also precisely designed to measure drivers’ perception of the information and
evaluation of the travel experience. The specific study objectives in this project include:
(i) Review of the current literature regarding the simulation-based models for
driver’s decision-making behaviors under the real-time travel information
provision;
(ii) Development of a decision-making model with considertation of
percpetional and psychological effects of real-time travel information;
3
(iii) Integration of an interactive driving simulator experiment where the
virtual environment of the system allows participants to not only drive
realistically but also make route choice decisions realistically.
(iv) Design of the dynamic surveys correponding to the experiment which
collect the emotional or perceptional states of partcipants depending upon
the information provision.
1.3 Organization of the research
The remainder of the report is organized as follows. Chapter 2 describes the
interactive driving simulator experiment design. Chapter 3 presents the step-by-step
process of the planned driving simulator experiment with the detailed discussion of
corresponding surveys. Chapter 4 summarizes this study and provides potential venues
for future research.
.
4
CHAPTER 2. INTERACTIVE DRIVING SIMULATOR EXPERIMENT DESIGN
2.1 Main issues in simulation-based studies
Several simulation-based studies have been conducted over the past two decades
to analyze the evolution of the traffic network under real-time information provision to
drivers. Some of them assume specific driver behavior models and seek to understand the
effect of real-time information on the unfolding network states. Others combine an
underlying traffic simulator with laboratory-based interactive experiments where the
participants are provided real-time routing information on the traffic conditions related to
their origin-destination (O-D) trip. Thereby, their real-time decisions are simulated along
with that of the ambient traffic for the test network (Adler et. al., 1993; Pel, 2011; Kwan
and Casas, 2006; Adler and McNally, 1994).
However, the various simulation studies are typically limited by one or more of
the following: (i) the need to pre-specify behavior models, (ii) the small number of
participants in interactive studies, and (iii) the type of network topology considered (such
as parallel route corridors). More importantly, and of fundamental relevance to the
proposed work, there is a presumption of the type of information available, how and
when it can be delivered to the individual drivers, and how it is processed by the drivers.
In simulation models, all of these are seamless and the focus is purely on the estimating
the potential benefits of real-time information provision.
Unfortunately, there is an underlying disconnect with the real-world, beyond the
key issues related to restrictive behavioral assumptions. First, drivers can process only
limited information while driving. Hence, it is important to characterize the effects of
real-time information based on providing only information that can be realistically
5
processed by individuals in real-time (as opposed to unstated assumptions in simulation
models of the ability to process any information provided). Second, due to safety
concerns and the inability of individuals to multitask safely while driving, how the
information is provided to them (voice, visual, or text) becomes a key issue. Again, this is
presumed as seamless in simulation models. Third, there are technological issues related
to when information is provided to drivers. This would imply the continuous tracking of
each driver or mechanisms for two-way communication with an automated server.
Namely, how would the information system operator ensure the timeliness of the
information provided to a driver relative to his/her current location in the network? In
simulation models, there is an implicit assumption that a driver can be accessed anywhere
or possibly at discrete points, in the network to provide such information. Hence, even if
we were to discount issues related to the adequacy of representing driver behavior, the
three issues mentioned heretofore would lead to gaps between the benefits predicted by a
simulation model and those of well-planned driving simulator experiments.
To provide a better understanding of the potential value of real-time information
to drivers, in this study, we propose specifically designed experiments that additionally
seek to explicitly capture the behavioral aspects of drivers. That is, we seek to analyze the
effect of the actual information provided to a driver on that driver’s response after each
instance of such information provision. We will then use the collected data to develop
more reliable models of driver response behavior by identifying the various factors that
affect decision-making under information provision. We further expect to identify
additional performance measures beyond the traditionally used benchmark of travel time
savings to better understand the potential benefits of a real-time information system to
both the user and the operator. An enhanced level of reliability in the understanding of
the potential costs and benefits of real-time traffic information systems beyond the
insights provided by idealized simulation studies is critical given the expectation of the
widespread deployment of these technologies in the near future and the concurrent
evolution of the associated information services market (which assumes a significant role
for the private sector as well as public-private partnerships).

6
The advent of modern real-time traffic information dissemination technologies
and potential future levels of market penetration make it technologically viable to send
personalized information in both pre-trip and en-route contexts (to smart phones through
websites like traffic.com, GPS Navigation system through traffic receivers), as well as
generic information en-route (through variable message signs (VMS)) and pre-trip
(through traffic information websites, apps and radio FM). Further, technologically, it is
possible to track the compliance, non-compliance or partial compliance related to the
information provided using devices such as GPS (Lawson et. al., 2008), supplemented
further manually by drivers’ daily trip diaries (Yasuo and Hato, 2004; Shinji and Hato,
2006).
Nevertheless, significant methodological challenges exist beyond privacy
concerns in enabling related studies. First, to understand an individual driver’s response,
there is the need to obtain data on his/her inherent behavioral tendencies (for example,
the level of willingness to take risks) as well as attitude towards information provided.
Second, the ability to understand whether information provision at any point in time
caused the driver to shift from his/her current route requires the knowledge of the current
route at each information provision time instance as well as the commonly-used routes by
that driver. Third, the decision of the driver is captured immediately after each instance of
information provision, as memory retention of the cause of the response may diminish
with time, in addition to the response itself, especially if information is provided several
times.
2.2 Advanced driving simulator experiments
The experiments in this study will make use of an advanced driving simulator to
collect participants’ route choice data. Using an advanced driving simulator has several
practical merits compared to field data from conducting real driving experiment on public
road network despite partly losing realism in the behavioral date collected. First of all, it
is flexible to create various scenarios in driving simulator experiment, which is essential
to controlled experiments. The flexibility is not only for information characteristics such

7
as amount, sources, and content in the experiment, but also for travel context including
traffic demand (ambient traffic situations) and trip purpose. In addition, a driving
simulator experiment requires the minimum risk to participate in the experiment as it
does not involve any physical vehicles, pedestrians or traffic. As safety is a critical issue
in such human-involved experiment, a simulator-based experiment can be an attractive
alternative to the field study.
Figure 2.1 Indianapolis road network for driving simulator experiment

8
2.2.1 Network building
The interactive driving simulator experiment in this study is conducted on a
realistic road network as of the participants’ daily commute based on a Google map
overlay. Specifically, the Indianapolis road network is used to construct a virtual network
environment for travel. Multiple O-D pairs with distinct characteristics such as average
driving distance, availability of freeway option, and number of alternatives, are built for
the use of different scenarios. Figure 2.1 shows the network topology used in the driving
simulator experiment. For a realistic representation, various 3D objects (buildings, and
trees) are inserted according to the area characteristics, in addition to the road signs along
the roads and traffic signals at intersections. Figure 2.2 illustrates a bird’s view of the 3D
driving environment. The driving environment from driver’s perspective is presented in
Figure 2.3.
Figure 2.2 Example of experiment network
Figure 2.3 Example of driving environment in driving simulator

9
2.2.2 Information provision
The simulator has the ability to provide Variable Message Sign (VMS) messages
to participants at distinct points while en-route. Through triggers, different text messages
can be displayed for different information scenarios. In addition, with the integration of a
personal device (iPod Touch in this study) and relevant software packages with the
driving simulator, we can create a situation with multiple information sources. Each
information source (VMS or personal device) provides different travel information in
terms of level of details, customization, or temporal effectiveness. For example, as
illustrated in Figure 2.4, the personalized information that is tailored for a particular
driver’s need may be more convincing because of the content fitted to the need than the
generic information distributed to anonymous drivers (non-personalized information).
The presence of multiple sources of information is important since it allows establishing
different information scenarios with respect to the number of information sources and
potential issues with inconsistency between the messages from different sources.
a. b.
Figure 2.4 Examples of real-time travel information from different sources a. Example of generic real-time travel information (VMS); b. Example of personalized real-time
travel information (Google map)

10
2.2.3 Traffic demand
As the levels of traffic congestion are not supposed to be the same in a major
freeway and a minor local road, the simulator interfaces with microscopic traffic
simulation software, AIMSUN, so as to create dynamic traffic conditions in accordance
with the type or hierarchy of road which reflects the asymmetric traffic demand in reality
(That and Casas, 2011; Punzo and Ciuffo, 2011). The driving simulator helps to create
various scenarios in controlled conditions that cannot be attempted in the field for safety
reasons.
2.3 Survey design
In order to collect data of participants’ stated preference and evaluation of travel
experience, driving simulator experiment is integrated with several surveys for different
purposes. The surveys planned in the experiment are two types: (i) A one-time static
survey that captures socio-economic characteristics and inherent preferences of the driver,
and (ii) dynamic surveys that capture the real-time psychological states or evaluations of
the travel experience during and after each simulation run in the driving simulator
experiment.
The survey in this study has been designed by considering standard practices in
the literature (NCHRP, 2008 and TSM, 2012). There are multiple challenges associated
with designing the survey for the proposed study which are discussed hereafter in the
paper. First, the questions related to the knowledge of real-time traffic information, past
experiences with en-route or pre-trip real-time traffic information, and experiences with
information on personalized devices need to be separated. Further, the experience with
generic real-time traffic information and personalized information can be different.
Second, people with high familiarity with a network may treat real-time travel
information less significantly in many instances. In a simulator, such experience needs to
be replicated and understood through targeted survey questions. Third, information
complexity of a suggested alternative route and the capability for mentally processing the
complex information while driving may play a critical role in the context of the benefits

11
derived from real-time traffic information. This needs to be captured through the
variables/indicators identified in survey questions that feed into the proposed model.
Fourth, various indicators related to information accuracy, adequateness, and
unfavorableness may impact driver perception of real-time traffic information. These
variables and indicators need to be captured, while ensuring that the survey meets some
space constraints.
2.4 Latent variable model
Based on the revealed behavioral data from driving session and the stated data
from the associated surveys, in this study, we propose a latent variable model to address
the unobservable latent variables and its relationships. In the measurement relationships
of latent variable model, each latent variable (ellipses in Figure 2.5) are defined by
multiple indicators (rectangles in Figure 2.5) which can be regarded as the responses of
survey with psychological representation implied.
I P δ= Λ +
where I is a vector (q×1) of exogenous indicators, P is a vector (a×1) of latent exogenous
variables, Λ is a matrix (q×a) of coefficients for P to I, and δ (q×1) is measurement error
terms for I, that are independently distributed.
On the other hand, structural relationships of our model include not only the
relationship among latent variables but also the relationships with observable explanatory
variables representing situational factors and driver, route and information characteristics.
These structural relationships can be mathematically represents as:
P P X ζ= Β +Γ +
where, B is a matrix (b×b) containing direct effect coefficients between P’s, Γ is a matrix
(a×b) of regression coefficients for X, and ζ is a structural error term (b×1).

12
(modified based on Ben-Akiva et al. 1999)
Favorableness (I4)
Psychological Indicators
Driver Characteristics
(XD)
Situational Factors
(XS)
Route Characteristics
(XR)
Information Characteristics
(XI)
Psychological Impacts
Psychological Impacts
Psychological Effects (P)
Psychological Indicators
Psychological Indicators
Psychological Indicators (I)
Utility (U)
Observed Choice (Y)
Observable explanatory variables
Unobservable latent variables
Sufficiency (I3)
Unfavorable-ness Stress (P3)
Observable indicators
β
α
Λ
Γ
Information Gap Stress (P2)
Information-Processing Stress (P1)
Correctness (I2)
Complexity (I1)
structural relationships in the latent variable model
measurement relationships
structural relationships in the discrete choice model
Figure 2.5 Proposed integrated choice model
A list of explanatory variables that may impact the choice model and will be
captured in the survey is given in Table 2.1. The explanatory variables have been divided
in four categories: driver attributes, situational factors, route characteristics, and
information characteristics. Further, psychometric data such as responses to attitudinal
and perceptual survey questions, can be used as indicators of the latent psychological
factors (Ben-Akiva et. al., 1997). In the proposed model the psychological factors are
explicitly captured by including indicators of psychological factors (such as responses to
survey questions regarding individuals’ attitudes, perceptions, etc.) for the latent
variables that are directly fed in the utility function as illustrated in Figure 2.5. The dotted
lines show the relationship between indicators and latent variables.

13
Table 2.1 List of representative explanatory variables
Category Variable Acquisition Driver Attributes
- Demographic attributes (age, gender, etc.) - Socio-economic attributes (Household income, etc.) - Driving experience -Familiarity with real-time travel information - Propensity of using real-time travel information system - Driver familiarity with network*
Online static survey * Controlled in experiment by individuals
Route Characteristics
- Estimated travel time to destination - Type of the route (freeway) - Route preference - Route recommendation
Controlled in experiment by selection of O-D
Situational Factors
- Trip purpose - Ambient traffic demand - Expected travel time left at the location of information provision
Controlled in experiment by different scenarios
Information Characteristics
- Amount of information - Source of information - Content of information
Controlled in experiment by different scenarios

14
CHAPTER 3. INTERACTIVE DRIVING SIMULATOR EXPERIMENT PROCESS
The proposed study seeks to determine the value of real-time information for
drivers through specifically designed experiments in a driving simulator that circumvent
the limitations of behavioral assumptions as well as the methodological challenges. The
detailed investigative approach is shown in the conceptual plan in Figure 3.1. The
flowchart shows a step-by-step approach for the planned study. The first step of the
experiment process is to create a diverse pool of volunteer participants for the
experiment. The participants will be chosen so as to represent the general driving
population. The purpose of the experiment will be explained to the participant when
he/she is first contacted for the experiment, as well before starting the practice session on
the driving simulator. The participants will be specifically requested to imitate their
normal response behavior in the real world rather than some expectation of an idealized
behavior. This can be an issue for the experiment as it is possible that participants may
artificially tend to be more compliant than is representative of real response behavior.
Once the survey procedure is understood by the participants, they will be required to
complete a one-time survey. In this survey, the participants will provide information on
their socio-economic characteristics and attitude towards information.
3.1 Online static survey
The first step to participate in the interactive driving simulator experiment is to
answer an online static survey where the participants’ individual characteristics,
experience with real-time travel information and preferences in travel context are
collected. Table 3.1 summarized representative explanatory variables to be captured
through the static survey.

15
Recruit ing1. Have the part icipant fill out online stat ic survey. 2. Have the part icipant make a reservat ion to part icipate the driving session.3. Setup scenario and cont rol factors (based on online stat ic survey)
I nt roduct ion4. Brief the experimental procedure (slide handouts, int roductory video)5. Check the assigned scenario and cont rol factor set t ing.
Pract ice Session 6. Explain and demonst rate driving simulator operat ion.7. Show the part icipant the driving network and routes .8. Have the part icipant pract ice driving on network.9. Have the part icipant fill out pre-experiment survey.
Experiment Session10. Part icipant take m runs of simulat ion t rips with different pre-defined scenarios.
(The value of m depends on the average t ravel t ime of the assigned O-D pair.)11. Point deduct ion system is running in driving session to keep the part icipant drives
realist ically. 12. Each run is proceeded as:
12A. Start from the origin and take any preferred route to dest inat ion. 12B*. As approaching to the decision-making point , pre-defined informat ion is
provided to the part icipant according to the informat ion scenario assigned for the specific run.
12C. The part icipant makes a route choice decision at the decision-making point .12D*.After decision-making point , the experiment will be paused short ly and the
part icipant fills out mid-run survey to capture the part icipant ’s percept ion of the informat ion.
12E. Repeat 12B to 12D according to the provision of informat ion unt il reaching the dest inat ion.
12F. When reaching the dest inat ion, the part icipant fills out after-run survey to capture the part icipant ’s evaluat ion of the t ravel experience.
12G. Driving log data including t ravel t ime experienced will be stored in the server for the use of t racking and compensat ion calculat ion.
[* : i f real-time travel information is provided through at least one source]
Compensat ion and Complete Session13. Based on the total points remaining after all the assigned runs are over, calculate the
amount of compensat ion.(Point will be normalized to address different number of runs across part icipants.)
14. Complete the experiment .
Figure 3.1 Steps in driving simulator experiment

16
3.1.1 Individual attributes
Demographic and socio-economic attributes including gender, age, education
level, household income level, and so on, are known to influence driving behavior and
information compliance, and route choice decisions (Khattak et al., 1993; Ullman et al.,
1994). The variables related to driving experience with real-time travel information are
presented separately based on the source and property of the information, i.e., generic
information from VMS and personalized information from personal device such as a
smart phone, for the purpose of factorizing participants’ familiarity with the information
and trust in the information. As the perception of the information also depends on
participants’ familiarity with the information and the level of trust in the information, the
variables can serve to understand the participants’ perception.
Table 3.1 Online static survey variables and their description
Variable Description Demographic, socio-economic characteristics
Gender, age, education level Household size Number of children Household income Number of household vehicles Years of holding driver’s license Annual driving mileage Familiarity with Indianapolis road network
(experiment network) and familiar area(s) Experience with real-time travel information
Experience of using generic real-time information Familiarity of using generic real-time information Trust in generic real-time information Reasons for not using generic real-time information Experience of using personalized real-time information Familiarity of using personalized real-time information Trust in personalized real-time information Reasons for not using personalized real-time information
Situational questions
Stated willingness to pay (sacrifice) for avoiding risk from uncertainty under diverse situations
Stated willingness to pay for avoiding effort to switch route under diverse situations
Screening question
Potential health issue with simulation sickness
17
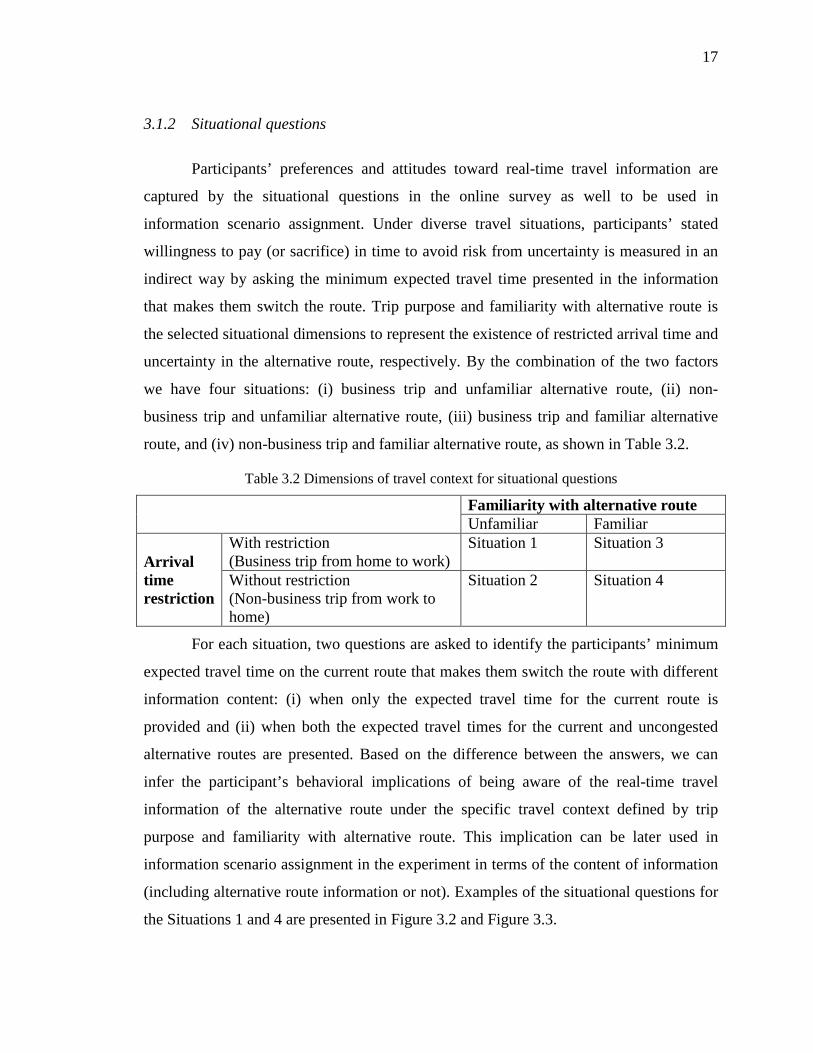
3.1.2 Situational questions
Participants’ preferences and attitudes toward real-time travel information are
captured by the situational questions in the online survey as well to be used in
information scenario assignment. Under diverse travel situations, participants’ stated
willingness to pay (or sacrifice) in time to avoid risk from uncertainty is measured in an
indirect way by asking the minimum expected travel time presented in the information
that makes them switch the route. Trip purpose and familiarity with alternative route is
the selected situational dimensions to represent the existence of restricted arrival time and
uncertainty in the alternative route, respectively. By the combination of the two factors
we have four situations: (i) business trip and unfamiliar alternative route, (ii) non-
business trip and unfamiliar alternative route, (iii) business trip and familiar alternative
route, and (iv) non-business trip and familiar alternative route, as shown in Table 3.2.
Table 3.2 Dimensions of travel context for situational questions
Familiarity with alternative route Unfamiliar Familiar
Arrival time restriction
With restriction (Business trip from home to work)
Situation 1 Situation 3
Without restriction (Non-business trip from work to home)
Situation 2 Situation 4
For each situation, two questions are asked to identify the participants’ minimum
expected travel time on the current route that makes them switch the route with different
information content: (i) when only the expected travel time for the current route is
provided and (ii) when both the expected travel times for the current and uncongested
alternative routes are presented. Based on the difference between the answers, we can
infer the participant’s behavioral implications of being aware of the real-time travel
information of the alternative route under the specific travel context defined by trip
purpose and familiarity with alternative route. This implication can be later used in
information scenario assignment in the experiment in terms of the content of information
(including alternative route information or not). Examples of the situational questions for
the Situations 1 and 4 are presented in Figure 3.2 and Figure 3.3.

18
Figure 3.2 Example of situational questions in online static survey (Situation 1)

19
Figure 3.3 Example of situational questions in online static survey (Situation 4)

20
3.1.3 Driving simulator experiment website
A secure website has been developed to facilitate the study participants better
understand and participate in the experiment. The website provides participants a brief
description about the objectives of the driving simulator experiment. A video on the front
page shows the experiment environment. Detailed experiment steps are presented on the
website, with a hyperlink to the online static survey to allow study participants to
complete it before they come to the experiment site.
A participant screening process is performed through the online static survey. As
the driving simulator experiment involves many 3D objects (such as buildings and trees),
which may cause sickness or dizziness (known as simulator sickness) during the
experiment for some participants. For the purposes of avoiding such participants in the
early stage of the experiment, we have an optional question about any known medical
issues related to simulator sickness. Thereby, sufficient acknowledge can be presented
before conducting driving simulator sessions and the possibility that participants feel
simulator sickness may be reduced.
At the end of the online static survey, a direct link to the experiment scheduling
website provided to select the most convenient time to come and complete driving
simulator sessions, as shown in Figure 3.4.
3.2 Introduction and practice session
Upon their visit, an introductory session will provide the participants a short
briefing about the tasks and the operation of the driving simulator. At the same time, the
maps with highlighted alternative routes in the study network will be explained to
participants before practice session. Then, the participants will be allowed to sit on the
cockpit of the simulator and try to operate it to be familiar with the driving on a simulator
as well as the route.

21
Figure 3.4 Website for scheduling driving simulator experiment
Initial levels of familiarity with the network and the traffic conditions are
constructed in these stages by multiple ways. Table 3.3 summarizes the methodology to
help participants get familiar with the network and the traffic conditions. As the
familiarity is one of the critical factors in route switching behavior, different levels of
initial network familiarity, especially with the alternative route, is implemented to reflect
different threshold values in route switching behavior in the experiment. The familiarity
with traffic conditions, on the other hand, is also significant in evaluating expected travel
time provided in the real-time information as it provides a reference to be compared with

22
the information. In the experiment, the average travel times of each route in major
sections (from one decision-making point to next decision making-point) are going to be
learned only for the participants who are assigned as familiar drivers representing their
knowledge about the usual traffic conditions.
Table 3.3 Plan for building initial familiarity for participants
Familiarity Step For familiar drivers For unfamiliar drivers
Network
Introduction
Demo video of the preferred route (notification of connection road)
Demo video of the preferred route (notification of connection road)
Practice session On a non-preferred route On an irrelevant route
Experiment GPS with all routes highlighted
GPS with all routes highlighted
Traffic conditions Introduction Travel time map provided No travel time map
provided
3.3 Pre-experiment survey
Once the participants become familiar with handling the driving simulator and the
network in different levels, they will be required to complete a pre-experiment survey.
This iPad-based pre-experiment survey captures the participant’s initial perception of
familiarity with each route and likelihood to choose each route for the trip. Figure 3.6 and
Table 3.3 illustrate the variables to be captured by the survey when two route options –
freeway option and arterial option – are available in the experiment scenario. The
collected data will be used in decision-making model as the variables to represent route
characteristics in terms of its familiarity and preference to the participant. As the
experiment proceeds, the participants’ familiarity and preference will evolve over runs in
the experiment and the changes will be captured by another set of these questions after
each trip (run).

23
Figure 3.5 Example of pre-experiment survey
Table 3.4 Pre-experiment survey variables and their description
Variable Description Initial familiarity with routes
Familiarity with freeway option Familiarity with arterial option
Initial likelihood to choose of routes
Likelihood to choose of freeway option Likelihood to choose of arterial option
3.4 Experiment session and mid-run surveys
After the pre-experiment survey, the participants take the first run in simulator
driving session with the specific scenarios that have been assigned to the participants
based on their responses to the static survey. The experiments will be repeated multiple
times (or runs) with different scenarios in terms of travel context and information settings,
as allowed by limited time. The traffic conditions will be modified in real time based on
the dynamic results of a microscopic traffic simulation. Throughout the multiple runs,
traffic demand level (high or normal) and trip purpose (business or non-business) are

24
controlled for a single participant in the experiment to isolate the effects of the different
settings of information. In this context, information settings in terms of amount, source,
and content of information vary across the randomly-ordered runs, so that possible biases
from the specific order of runs with different information settings can be eliminated in
aggregate level.
To create travel contexts with and without arrival time restriction (represented by
business trip and non-business trip, respectively), a point deduction system is
implemented that shows the deducting points on the screen with different speed (faster
for business trip and slower for non-business trip) to generate differently perceived time
values. The point matters to the participants as it will be used to calculate the final
monetary compensation.
Right after a participant makes a decision based on the information provided, the
experiment will be paused, and the participant conducts a mid-run survey about the
perception of the information. This instant survey using 7-point Likert scale allows the
collected data to avoid any possible biases or distortions because of the reminder of the
travel experience after the decision-making associated with the provided information.
The responses to mid-run survey will be used as indicators for latent variables
representing the psychological effects of the real-time information to build a latent
variable model that affect decision-making process, as shown in Figure 3.6. Table 3.5
lists the indicator variables for the mid-run surveys that can be collected as many times as
the information-assisted decisions have made in a trip.
Table 3.5 Mid-run survey variables (indicators)
Latent variable Indicator Complexity (ease of comprehension) of information
Easiness from amount of information Easiness from content of information Easiness from multiple source of information
Consistency of information Consistency with expectations Consistency with content of information from
multiple sources Sufficiency of information Sufficiency from content of information Favorableness of information
Favorableness from content of information

25
Figure 3.6 Example of the mid-run survey
The indicators related to the complexity (ease of comprehension) of information
explain latent information-processing stress as it is caused by excessive cognitive burden
from the perception of the information. The indicators representing the consistency and
sufficiency of information are present to identify information gap stress that is defined by
the cognitive gaps between the level of information that a driver desires to know and the
level of information that the driver actually received and comprehended. Consistent

26
information in relation to the prior experience and information from multiple sources
enhances the awareness of the traffic situations and reduces the information gap as well
as the sufficient information does. The indicators for favorableness of information are
used to specify a latent variable, unfavorableness stress, reflecting the emotional
spectrum in terms of reassurance and anxiety. As the unfavorableness stress is caused by
the unfavorable traffic situations projected in the information under the given individual
attributes and travel context such as sensitivity to delay or trip purpose, it is also possible
to have positive effects based on the favorably anticipated travel experience with the
provided information.
3.5 Post-run surveys
After each run in experiment, participant will be asked to complete the post-run
survey that captures participants’ level of satisfaction from travel experience as well as
their attitude and preference changes in route choice for next experiment run. The
answers regarding satisfaction level are also interpreted as indicators for latent variables
for psychological benefits (i.e., satisfaction). Table 3.6 lists the variables to be captured in
the post-run surveys. The Likert scale-based questions are asked as the indicators for
satisfaction with travel experience and psychological effects (cognitive burden, cognitive
decisiveness, and emotional burden) of the information. Note that the latent satisfaction
inferred by the indicators from post-run survey is not included in the integrated decision-
making model presented in Chapter 2. Rather, the indicators will be used to illustrate the
comprehensive psychological process of real-time travel information provision that
includes satisfaction from psychological effects of the information as well as travel
experience (experienced travel time).
In addition to the questions about satisfaction, another set of questions about the
updated perception of familiarity with each route and likelihood to choose each route for
the trip for the use of prerequisite information for the next run.

27
Table 3.6 Post-run survey variables and indicators
Latent variable Indicator Satisfaction Satisfaction from travel time
Satisfaction from route choice decisions Satisfaction from accuracy of information Satisfaction from cognitive burden Satisfaction from cognitive decisiveness Satisfaction from emotional burden
Familiarity with routes
Familiarity with freeway option Familiarity with arterial option
Likelihood to choose of routes
Likelihood to choose of freeway option Likelihood to choose of arterial option
3.6 Compensation
One of the major disadvantages of behavioral data collected under simulator
environment is that the acquired data may not fully represent the real world since: (i) the
simulator-based experiment does not involve any considerable real risks to the participant,
and (ii) real travel context can never be fully implemented in the experiment. The risk-
free environment may result in reckless driving behavior (excessive speeding, ignorance
of signals, aggressiveness, etc.). Creating travel context, especially trip purpose that is
related to the value of time, and making the participant feel and think that way context is
another issue in simulator-based experiments. Even though a participant drives a
simulator in a very realistic manner, if any of his or her behavioral decision is not made
under the pressure that the business trip would have compared to non-business trip, the
collected data is not sufficient from the behavioral point of view.
In order to address these problems, a compensation system is introduced in this
experiment. In a point-based mechanism, we will deduct some points per unrealistic
driving behavior including excessive speeding, collision, signal ignorance, and so on, to
prevent unrealistic driving behaviors. Also, by setting different targeted arrival times for
different trip purposes and deducting the point at different speeds (faster in business trip
representing the higher pressure to be on time), travel context can be enforced to the
participants. And the points will be computed based on the following scheme:

28
Figure 3.7 Example of the post-run survey

29
• Initial points of 65 for all participants.
• Uncompleted simulation runs will lead to deduction of points: 15 points will
be deducted for each uncompleted simulation run. For example, if a
participant withdraws from the experiments after completing three of five
assigned driving simulator runs, then 30 points will be deducted from the
participant’s total points.
• Late arrival of the experimental trip beyond a scale of time (3 minutes) will
lead to deduction of points: 5 points will be deducted if we are simulating a
business trip; 3 points will be deducted if we are simulating a non-business
trip. Unnecessary speeding, traffic violations may lead to deduction at random
(to represent the reality no details will be provided except for points that will
be deduced): 5 points will be deducted for each violation.
• Incidents or accidents with other vehicles in the driving simulator will lead to
point deductions: 10 points will be deducted for each incident.
The participants will be specifically told that there is no point deduction for following or
not following the information provided in the driving simulator. They are free to make
choices between different routes based on their preferences and attitudes. After a
participant completes (or withdraws from) the driving simulator experiments, his/her
compensation will be calculated based on the table shown below:
Table 3.7 Reward in point-based compensation system
Final Points Reward
Below 20 $10 gift card
20 to 29 $20 gift card
30 to 39 $30 gift card
40 to 49 $40 gift card
50 to 59 $50 gift card and chance to win an iPad Mini (lottery)
60 to 65 $60 gift card and chance to win an iPad Mini (lottery)

30
CHAPTER 4. CONCLUSION
4.1 Summary
In this study, we construct an interactive driving simulator experiment to acquire
the real-time data of driver behavior as well as their perceptional and psychological states.
In order to overcome the common limitations of driving simulator experiments, the
proposed interactive driving simulator experiment is: (1) using a realistic network of
Indianapolis, Indiana, so that the participants configure the attraction of the routes based
on not only the information but also the route attributes (e.g., freeway, toll, or safety); (2)
considering dynamic background traffic demands which are enabled by integration by
driving simulator software and online traffic assignment in microscopic traffic simulation
package; (3) providing diverse information scenarios with multiple sources to understand
participants’ perceptional and psychological states depending on different information
characteristics (e.g., amount, source, or content) and; (4) conducting intermediate surveys,
so that we can obtain during-the-trip perceptional and psychological data which are not
biased because of travel experience (e.g., travel time experienced).
In this study, we discussed the need for explicitly capturing psychological factors in
an integrated choice model framework. The planned experiments in the driving simulator
have been explained in a step-by-step mechanism. Identification of explanatory variables
and indicators for latent variables and challenges associated with capturing each of these
variables and indicators are discussed. The expected results from survey completion and
the developed models are a better understanding of the psychological benefits to users
from real-time traffic information beyond just the travel time savings.

31
4.2 Future research directions
Using an interactive driving simulator allows to collect a variety of behavioral
data regarding driver’s decision-making under different travel situations and various
information scenarios. Based on the data collected, the proposed model addresses the
decision-making behavior of individual driver assuming homogeneity of driver in terms
of the attitude toward real-time travel information. In further research, the approach
should be extended to consider heterogeneity of drivers in decision-making process from
the behavioral perspective.

32
REFERENCES
Adler, Jeffrey L., Wilfred W. Recker, Michael G. McNally (1993). A conflict model and
interactive simulator (FASTCARS) for predicting enroute driver behavior in response to
real-time traffic condition information. Transportation, 20 (2), 83 – 106.
Asakura, Yasuo and Eiji Hato (2004). Tracking survey for individual travel behaviour
using mobile communication instruments. Transportation Research Part C, 12, 273–291.
Ben-Akiva, M. Bierlaire, H.N.M. Koutsopoulos and R. Mishalani (1998). DynaMIT: A
Simulation based System for Traffic Prediction and Guidance Generation. Proceeding of
the 3rd Triennial Symposium on Transportation Systems, San Juan, Puerto Rico.
Ben-Akiva, M., J. Walker, A. T. Bernardino, D. A. Gopinath, T. Morikawa and A.
Polydoropoulou (1997), Integration of Choice and Latent Variable Models. Paper
presented at the 1997 IATBR, University of Texas at Austin.
Dudek, C.L. (2006) Dynamic Message Sign Message Design and Display Manual.
Product 0-4023-P3. Texas Department of Transportation, Austin, TX.
(URL:http://tti.tamu.edu/documents/0-4023-P3.pdf)
Itsubo, Shinji and Eiji Hato (2006). A study of the effectiveness of a household travel
survey using GPS-equipped cell phones and a WEB diary through a comparative study
with a paper based travel survey In CD Proceedings Transportation Research Board 85th
Annual Meeting.

33
Jeffrey L. Adler and Michael G. McNally (1994). In-laboratory experiments to
investigate driver behavior under advanced traveler information systems. Transportation
Research Part C: Emerging Technologies, 2 (3), 149-164.
Khattak, A. J., Schofer, J. L., and Koppelman, F. S. (1993), Commuters’ Enroute
Diversion and Return Decisions: Analysis and Implications for Advanced Traveler
Information Systems, Transportation Research Part A, 27 (2), 101-111.
Kwan, Mei-Po and Irene Casas (2006). GABRIEL: Gis Activity-Based tRavel sImuLator.
Activity Scheduling in the Presence of Real-Time Information GeoInformatica, 10 (4),
469-493
Lawson, Catherine T., Cynthia Chen, Hongmian Gong, Sowmya Karthikeyan, 2008. GPS
Pilot Project Phase Three: Mixed Mode Data Collection And Identification Of Special
Population Segment (URL :www.nymtc.org/project/surveys/GPS/061508GPS_PILOT_PIII.pdf)
Mahmassani, H.S., Y.-C. Chiu, G.L. Chang, S Peeta and A Ziliaskopoulous (1998). Off-
line Laboratory Test Results for the Dynasmart-X Real-Time Dynamic Traffic
Assignment System. Technical Report ST067-85-TASK-G, Center for Transportation
Research, The University of Texas at Austin.
NCHRP (2008) Report 571: Standardized Procedures for Personal Travel Surveys.
Peeta, S, and J-W Yu (2006). Behavior-based consistency-seeking models as deployment
alternatives to dynamic traffic assignment models. Transportation Research Part C, 14,
114–138.
Pel, Adam J. (2011) A review on travel behaviour modelling in dynamic traffic
simulation models for evacuations. Transportation, 39, 97–123.
Punzo, V. and B. Ciuffo (2011) Integration of Driving and Traffic Simulation: Issues and
First Solutions. IEEE Transactions on Intelligent Transportation Systems, 12(2), 354-
363.TSM (2012) Travel Survey Manual (URL: http://www.travelsurveymanual.org/)

34
That, T. N. and J. Casas. (2011) An integrated framework combining a traffic simulator
and a driving simulator. Procedia Social and Behavioral Sciences, 20, 648-655.
Ullman, G. L., Dudek, C. L., and Balke, K. N. (1994), Effect of Freeway Corridor
Attributes on Motorist Diversion Responses to Travel Time Information, Transportation
Research Record 1464, TRB, National Research Council, Washington, D.C., 19-27.