FIELD-DEMONSTRATED EVIDENCE OF CHANGING RAINFALL INTENSITIES IN ONTARIO FOR SHORT DURATION STORMS
19
B. Vasiljevic, E. McBean, and R. Rudra University of Guelph Guelph, Ontario, Canada
description
B. Vasiljevic, E. McBean, and R. Rudra University of Guelph Guelph, Ontario, Canada. FIELD-DEMONSTRATED EVIDENCE OF CHANGING RAINFALL INTENSITIES IN ONTARIO FOR SHORT DURATION STORMS. - PowerPoint PPT Presentation
Transcript of FIELD-DEMONSTRATED EVIDENCE OF CHANGING RAINFALL INTENSITIES IN ONTARIO FOR SHORT DURATION STORMS
B. Vasiljevic, E. McBean, and R. RudraUniversity of GuelphGuelph, Ontario, Canada

Designs for sewers, culverts, and stormwater management ponds rely upon the intensity-duration-frequency (IDF) curves
Stormwater facilities intended to last for decades
Implications also for water supplies

Wells become submergedImplication of rainfall intensity is clear
and profound


Duration
mm
I(mm/hr) I(mm/hr) I(mm/hr)
2 YR
1970-1984
2 YR
1985-2003
5 YR
1970-1984
5 121.4 136.5 135.3
10 80.4 99.5 94.0
15 66.1 81.5 72.9
30 43.8 55.7 51.5
60 25.3 34.6 33.0
120 15.8 19.8 20.8
360 6.8 7.6 8.9
720 3.8 4.3 4.9

IDF Curves Waterloo 5 Year Recurrence Interval
0
20
40
60
80
100
120
140
160
0 30 60 90 120Duration (min)
I (mm/hr)
Existing Waterloo Curve
PDS (70 - 84)
PDS (85 - 03)

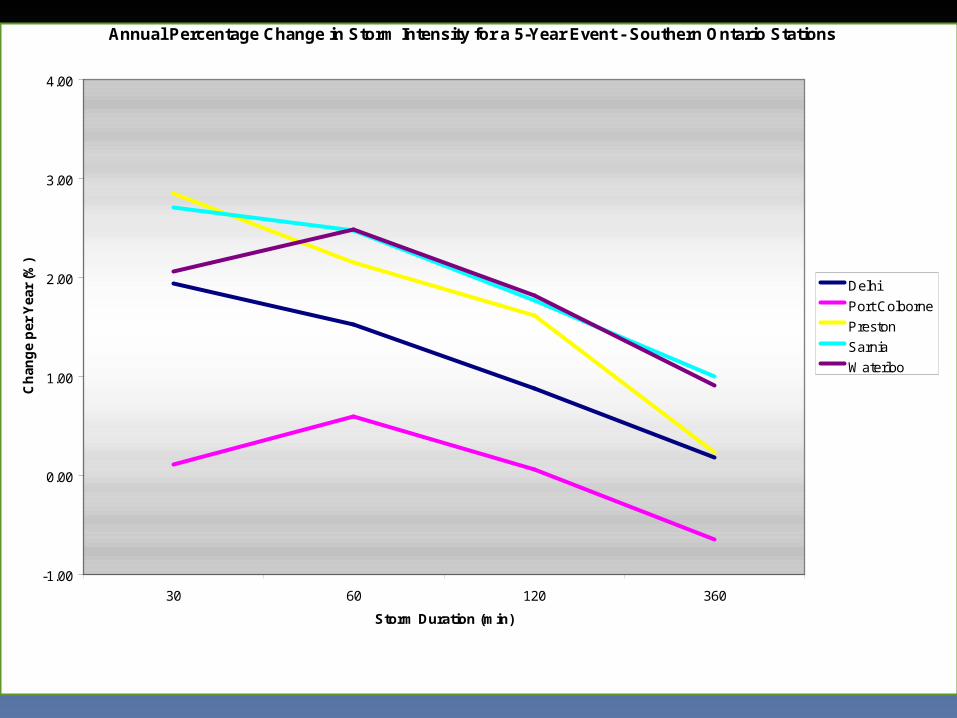
Annual Percentage Change in Storm Intensity for a 5-Year Event - Southern Ontario Stations
-1.00
0.00
1.00
2.00
3.00
4.00
30 60 120 360
Storm Duration (min)
Ch
ang
e p
er Y
ear
(%)
Delhi
Port Colborne
Preston
Sarnia
Waterloo

Annual Percentage Change in Storm Intensity for a 5-Year Event - Northern Ontario Stations
-1.00
0.00
1.00
2.00
3.00
4.00
5.00
30 60 120 360
Storm Duration (min)
Ch
ang
e p
er Y
ear
(%)
Chalk River
Sudbury
Timmins

Annual Percentage Change in Storm Intensity for a 5-Year Event - Central Ontario Stations
-1.00
0.00
1.00
2.00
3.00
30 60 120 360
Storm Duration (min)
Ch
ang
e p
er Y
ear
(%)
Bowmanville
Burketon
Kingston
Orillia
Oshawa

IDF curves Waterloo 5 year recurrence interval
0
20
40
60
80
100
120
140
160
0 30 60 90 120Duration (min)
I (mm/hr)
Existing Waterloo Curve
PDS (70 - 84)
PDS (85 - 03)
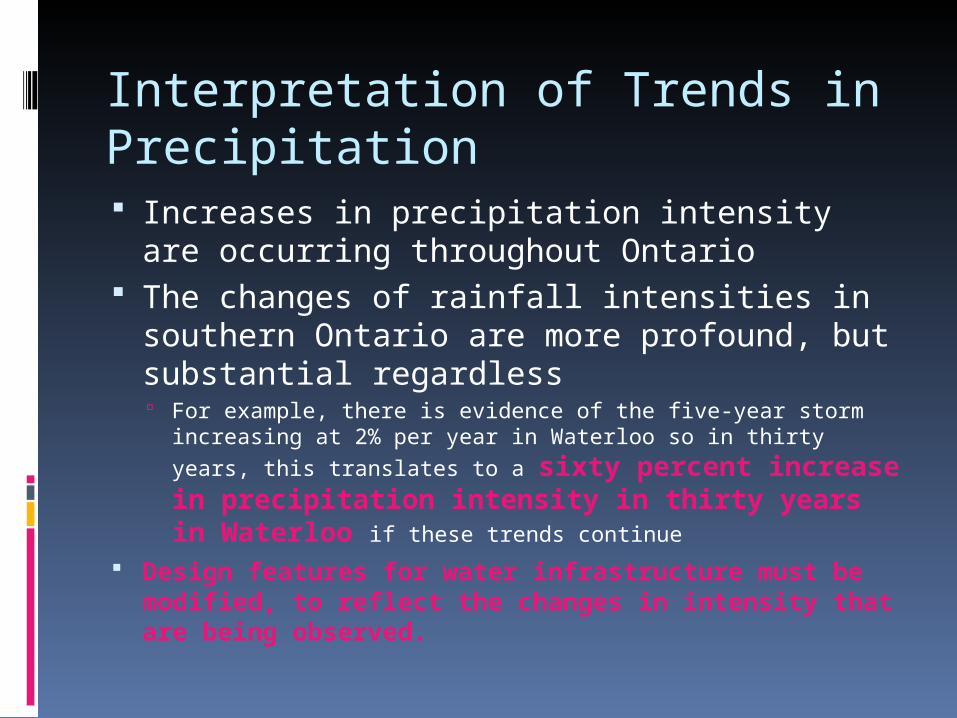
Interpretation of Trends in Precipitation Increases in precipitation intensity are
occurring throughout Ontario The changes of rainfall intensities in
southern Ontario are more profound, but substantial regardless For example, there is evidence of the five-year storm
increasing at 2% per year in Waterloo so in thirty years, this
translates to a sixty percent increase in precipitation intensity in thirty years in Waterloo if these trends continue
Design features for water infrastructure must be modified, to reflect the changes in intensity that are being observed.

Street From ToPipe Size ( mm)
2 3
(South)
MH1 MH2 300 300
MH2 CBMH3 300 300
CBMH3 MH4 375 375
MH4 CBMH5 600 675
CBMH5 #1 750 750
#1 WETLAND 750 825
(North)
FUT MH11 300 300
MH11 CBMH12 375 375
CBMH12 DCBMH13 450 525
DCBMH13 MH8 600 675
MH8 #2 600 600
#2 FOREBAY 600 675

Conclusions
There is evidence that rainfall intensities are changing, since the five year storm of four decades ago is now the two year recurrence interval storm, and hence translates to implications for design of urban infrastructure.
Implications to water supply systems are highly relevant

Questions?