Field Data Collection, Drones, and Monitoring Operations€¦ · Drone type-Albris,...
27
Field Data Collection, Drones, and Monitoring Operations GIS FOR A SUSTAINABLE WORLD 2018 Exploration Team
Transcript of Field Data Collection, Drones, and Monitoring Operations€¦ · Drone type-Albris,...

Field Data Collection, Drones, and Monitoring Operations
GIS FOR A SUSTAINABLE WORLD 2018
Exploration Team

Presentation TitleThank You to Our
Sponsors

Context
• Goals
- Check the inventory of trees for the Jardin Botanique
- Learn how to integrate desktop, web, and mobile GIS applications
- Go outside and enjoy the beautiful day!
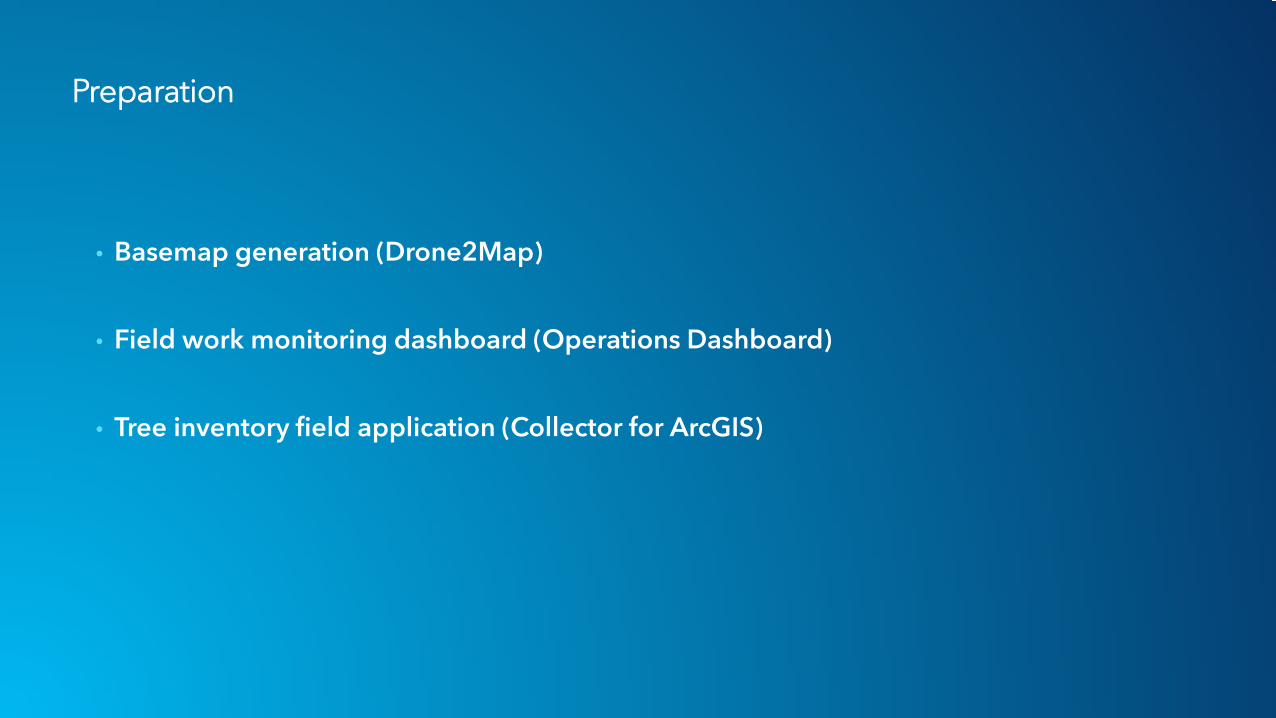
Preparation
• Basemap generation (Drone2Map)
• Field work monitoring dashboard (Operations Dashboard)
• Tree inventory field application (Collector for ArcGIS)

Drone2Map for ArcGIS

Drone Imagery Processing
• Desktop application
• Turn Drone imagery into ArcGIS

Drone Imagery processing
• Create 2D and 3D products
Orthomosaics Digital Surface ModelsDSM & DTM
Smart Inspection &
3D PDF
Point Clouds &
3D Meshes
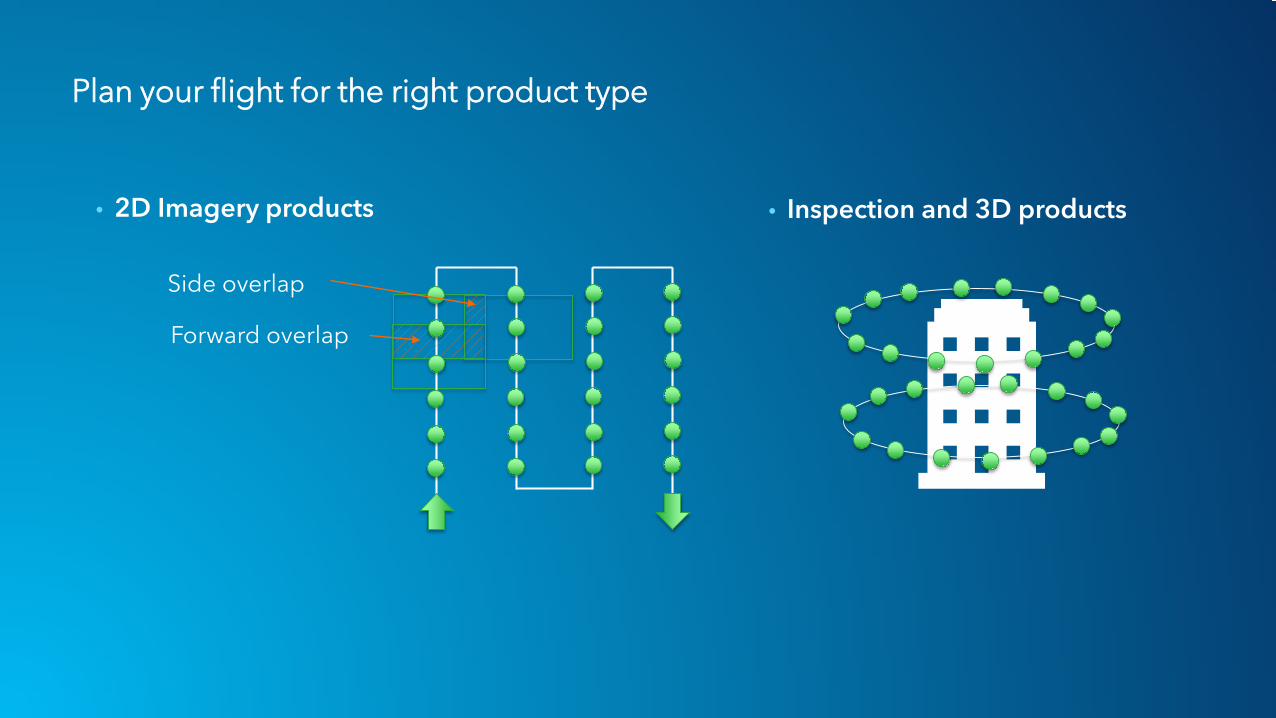
Plan your flight for the right product type
• 2D Imagery products
Side overlap
Forward overlap
• Inspection and 3D products

Processing
• Geolocated images
• Keypoints and matches
• GCP (Optional)
• Clip area (Optional)
LatLongAlti

GIS ready products
• Open in ArcGIS Pro
• Share

Share Drone Imagery

Jardin Botanique
Orthomosaic


Flight specifications
• Jardin Botanique area
• 62 000 m2
• Drone type- Albris, SenseFly
- Quadcopter
• Pilot- Joshua Lyons, Human Right’s Watch
• Altitude- 55m
• Flight date- 14th April 2018

Create a project

Preview the images and the flight path

Processing options

Output result
• Processing time : 1 hour• 16-core machine – 128GB RAM
• High resolution orthomosaic• 2.8cm resolution

Operations Dashboard

Operations Dashboard for ArcGIS | Overview
• Included within ArcGIS Online organization
• Works with new Dashboard item type- Author and view in web browser
• Offers many ready-to-use data visualizations
• Enables display of key performance indicators (KPIs)
• Interactive dashboard user experience- Actions and selectors
• Re-engineered and redesigned new app

Dashboards
• Can be broadly categorized into 2 general types1. Interactive → End user interacts with the dashboard to obtain more info
- Can apply actions and selectors for an interactive UE
- E.g., Click one element, affects changes in other element(s)
2. Unattended display → Designed to provide updates, no interactivity with end user- Typically consume data sources that update, elements would reflect updates
- E.g., Real-time data, IoT

Getting Started with Operations Dashboard
• Several ways to open the app1. App Launcher
2. Map Viewer- Share > Create app > Operations Dashboard
3. Content page- Create > App > Operations Dashboard
4. Dashboard item page
1
2
3
4A

Collector for ArcGIS

Field Data CollectionCollector for ArcGIS
• Prepare your data- Documentation
• Webmap Settings & Capabilities- Sample
- Layer Template
- Documentation
• Track where Collectors go in the field- Documentation
• Extra GPS information
esriurl.com/sw2018field