Fidelity Far East Class of the Fidelity Capital Structure ... · PDF filefast food restaurants...
24
Semi-Annual Management Report of Fund Performance May 31, 2017 Fidelity Far East Class of the Fidelity Capital Structure Corp.
Transcript of Fidelity Far East Class of the Fidelity Capital Structure ... · PDF filefast food restaurants...

Semi-Annual Management Report of Fund PerformanceMay 31, 2017
Fidelity Far East Class of the Fidelity Capital Structure Corp.

Caution Regarding Forward-looking Statements
Certain portions of this report, including, but not limited to, “Results of Operations” and “Recent Developments”, may contain forward-looking statements about the Fund, including its strategy, risks, expected performance and condition. Forward-looking statements include statements that are predictive in nature, that depend upon or refer to future events or conditions, or that include words such as “expects”, “anticipates”, “intends”, “plans”, “believes”, “estimates” and similar forward-looking expressions or negative versions thereof.
In addition, any statement that may be made concerning future performance, strategies or prospects, and possible future Fund action, is also a forward-looking statement. Forward-looking statements are based on current expectations and projections about future events and are inher-ently subject to, among other things, risks, uncertainties and assumptions about the Fund and economic factors. Accordingly, assumptions concerning future economic and other factors may prove to be incorrect at a future date.
Forward-looking statements are not guarantees of future performance, and actual events and results could differ materially from those expressed or implied in any forward-looking statements made by the Fund. Any number of important factors could contribute to these digres-sions, including, but not limited to, general economic, political and market factors in North America and internationally, interest and foreign exchange rates, global equity and capital markets, business competition, technological change, changes in government regulations, unexpected judicial or regulatory proceedings, and catastrophic events.
It should be stressed that the above-mentioned list of important factors is not exhaustive. You are encouraged to consider these and other factors carefully before making any investment decisions and you are urged to avoid placing undue reliance on forward-looking statements. Further, you should be aware of the fact that the Fund has no specific intention of updating any forward-looking statements whether as a result of new information, future events or otherwise, prior to the release of the next Management Report of Fund Performance.

1
Semi-Annual Management Report of Fund Performance as at May 31, 2017Fidelity Far East Class of the Fidelity Capital Structure Corp.This semi-annual management report of fund performance contains financial highlights but does not contain the complete semi-annual financial statements for the investment fund. You can get a copy of the semi-annual financial statements at your request, and at no cost, by calling 1-800-263-4077, by writing to us at Fidelity Investments, 483 Bay St. Suite 300, Toronto ON M5G 2N7 or by visiting our website at www.fidelity.ca or SEDAR at www.sedar.com.
Securityholders may also contact us using one of these methods to request a copy of the investment fund’s proxy voting policies and proce-dures, proxy voting disclosure record or quarterly portfolio disclosure relating to the investment fund.
Management Discussion of Fund PerformanceResults of Operations
Fidelity Far East Class (Fund) invests substantially all of its assets in units of Fidelity Far East Fund (Underlying Fund).
Fidelity Far East Class, Series B, returned 20.8%, after fees and expenses, for the six-month period ended May 31, 2017. The net returns of other series of this Fund are similar to those of Series B, except for differences attributable to expense structures. Global equities, broadly repre-sented by the MSCI World Index, returned 13.4% (in Canadian dollar terms).
Market overview:
Global equities registered positive returns during the review period, owing to the continued low-interest-rate environment around the world. European markets were the best performers, with strong economic data boosting investor sentiment. Markets were also supported by the Dutch election results, where voters rejected a populist candidate. U.S. markets registered strong performance, driven by positive economic data and optimism regarding the proposed policies of the new U.S. administration. Asian markets also registered strong performance; optimism about global economic growth and improved corporate earnings forecasts in the region boosted sentiment. Canadian markets lagged global mar-kets; investors’ concerns about depressed oil prices, rising household debt and risks of a sharp correction in the housing market weighed on Canadian equities.
Factors affecting performance:
The Fund’s benchmark, the MSCI AC (All Country) Far East ex Japan Index, returned 18.8% for the six-month period under review. The Fund’s outperformance of its benchmark was primarily attributable to the Underlying Fund’s holding in the information technology and health care sectors.
In the information technology sector, South Korean mobile phone camera module manufacturer LG Innotek, China-based social network & mobile gaming firm Tencent Holdings and South memory and OLED supplier Samsung Electronics made top contributions.At the end of the review period, the Fund did not have any exposure to LG Innotek. In the health care sector, Chinese pharmaceutical companies Jiangsu Hengrui Medicine and CSPC Pharmaceutical Group made top contributions.
In contrast, the Underlying Fund’s exposure to the consumer discretionary sector detracted from relative performance, with Philippines-based fast food restaurants chain Jollibee Food, Chinese clothing manufacturer Shenzhou International Group and Hong Kong-based power tools manufacturer Techtronic Industries making the top detractions from returns. At the end of the review period, the Fund did not have any expo-sure to Jollibee Food.
Portfolio changes:
During the review period, the portfolio managers increased exposure to the financials and health care sectors. In the financials sector, exposure was added to China Life Insurance Company, which is expected to benefit from growing demand for insurance products in China. Exposure was also added to CTBC Financial Holding, which is expected to benefit from expansion of its international business. In the health care sector, a position was added in Chinese pharmaceutical company CSPC Pharmaceutical Group, because of its strong pipeline of innovate drugs and subsequent growth prospects.
In contrast, the Fund’s exposure was reduced in the consumer discretionary sector. In the sector, exposure was reduced to Hong Kong-based power tools manufacturer Techtronic Industries; potential trade regulations by the new U.S. administration may weigh on the company’s perfor-mance. The portfolio managers also reduced holdings in the utilities sector, by selling position in South Korean electric utility company Korea Electric Power Corporation, after more attractive investment opportunities were found elsewhere.
Recent Developments
Portfolio managers Eileen Dibb and Bruce MacDonald remain positive on the long-term prospects for Asian markets and continue to find attrac-tive investment opportunities in the region. With increased stabilization in the Chinese economy, investors are now focused on the potential for global growth. The portfolio managers believe that China’s greater emphasis on reforms, such as cutting supply in targeted industries, reducing emissions and SOE reforms, is positive for growth and should provide support for continued optimism in China. However, their preference is to
2
Fidelity Far East Class of the Fidelity Capital Structure Corp.
Management Discussion of Fund Performance – continued
have exposure to consumption rather than production in China and across the wider region. They are positive on countries such as Indonesia, the Philippines and India, as these are expected to benefit from improved economic activity driven by long-term structural reforms. They have also increased exposure to Taiwan, as a recovery in emerging economies and continued strong demand from China are going to support Taiwan’s export growth at attractive levels. The portfolio managers believe that with China’s credit impulse now behind us, the key risk faced by some economies in the region is how Chinese policy makers handle the aftermath. To date China’s policy makers have been pulling numerous levers to control credit growth and leverage, and are undertaking a managed and calibrated monetary tightening. This will moderate growth in China and across the region. The portfolio managers are focused on three drivers of growth: consumption, supportive domestic policies and demographics. The managers see the most alpha opportunities in disruptive, niche and structural growth businesses that are exposed to the three growth driv-ers for the region.
At the end of the review period, the Fund had its largest absolute exposure to the information technology sector, followed by the financials sec-tor. The Fund diverged the most from the benchmark sector weightings by having more exposure to the information technology sector and less exposure to the energy sector. In terms of country exposures, the Fund had its largest absolute exposure to Hong Kong and its lowest absolute exposure to Malaysia.
Independent Review Committee
Effective February 28, 2017, Helen M. Meyer retired from the Independent Review Committee and was replaced by James E. Cook as Chair. Also effective on that date, Frances Horodelski of Toronto, Ontario, became a member of the Independent Review Committee.
3
Related Party Transactions
Manager and Portfolio Adviser
The Fund is managed by Fidelity Investments Canada ULC (Fidelity). Fidelity is part of a broader group of companies collectively known as Fidelity Investments.
Fidelity provides or arranges for the provision of all general management and administrative services required by the Fund in its day–to–day operations, bookkeeping, record–keeping and other administrative services for the Fund.
Fidelity is the portfolio adviser to the Fund and it provides investment advisory services to the Fund. Fidelity provides investment advice with respect to the Fund’s investment portfolio and arranges for the acquisition and disposition of portfolio investments, including all necessary brokerage arrangements.
The Fund pays Fidelity a monthly management and advisory fee for their services, based on the net asset value of each Series, calculated daily and payable monthly. The Fund paid Fidelity management and advisory fees of $312,000 for the period ended May 31, 2017.
Administration Fee
Fidelity charges the Fund a fixed administration fee in place of certain variable expenses. Fidelity, in turn, pays all of the operating expenses of the Fund, other than certain specified fund costs (e.g. the fees and expenses of the Independent Review Committee, taxes, brokerage commis-sions and interest charges). The Fund pays an annual rate, which is calculated on a tiered basis, based on the net asset value of each Series, calculated daily and payable monthly. The Fund paid Fidelity administration fees of $53,000 for the period ended May 31, 2017.

4
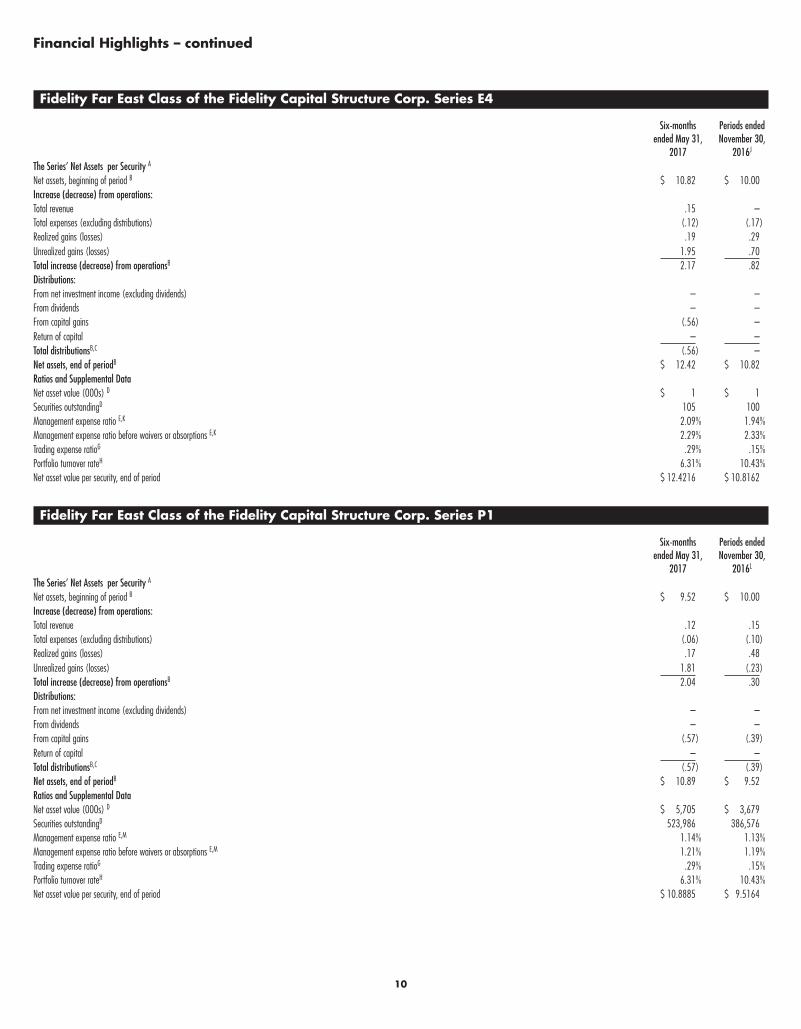
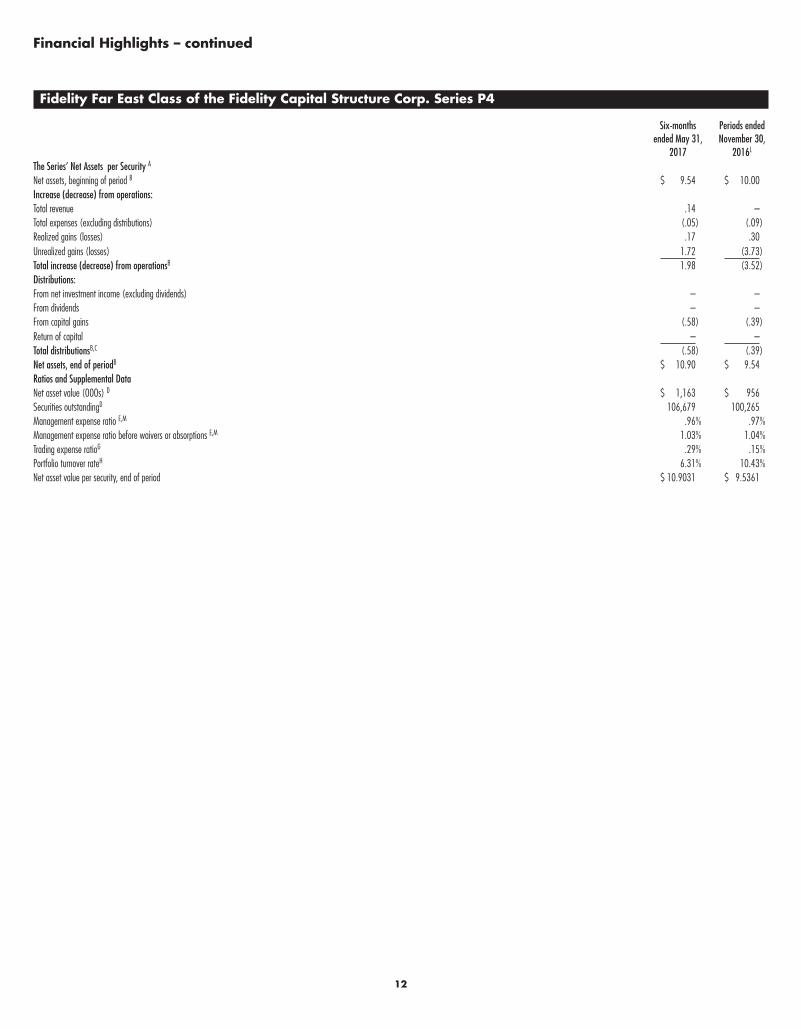
Financial Highlights
The following tables show selected key financial information about the Fund and are intended to help you understand the Fund’s financial performance for the period end of the years shown. This information is derived from the Fund’s audited annual and/or unaudited semi-annual financial statements. Please see the front page for information about how you can obtain the Fund’s annual or semi-annual financial statements.
Fidelity Far East Class of the Fidelity Capital Structure Corp. Series A
Six-months ended May 31, Periods ended November 30,
2017 2016 2015 2014 2013 2012The Series’ Net Assets per Security A Net assets, beginning of period B $ 33.48 $ 34.87 $ 30.98 $ 28.60 $ 24.38 $ 22.05Increase (decrease) from operations: Total revenue .57 .80 .08 .07 .59 .11Total expenses (excluding distributions) (.44) (.86) (.89) (.78) (.71) (.61)Realized gains (losses) .61 2.06 4.05 3.98 .80 1.49Unrealized gains (losses) 5.42 (2.78) .91 (1.46) 3.44 1.30Total increase (decrease) from operationsB 6.16 (.78) 4.15 1.81 4.13 2.29Distributions: From net investment income (excluding dividends) – – – – – –From dividends – – – – – –From capital gains (1.51) (.87) – – – –Return of capital – – – – – –Total distributionsB,C (1.51) (.87) – – – –Net assets, end of periodB $ 38.60 $ 33.48 $ 34.87 $ 30.98 $ 28.60 $ 24.38Ratios and Supplemental Data Net asset value (000s) D $ 3,174 $ 3,540 $ 5,077 $ 5,728 $ 10,085 $ 10,836Securities outstandingD 83,065 105,739 145,606 184,883 352,627 444,554Management expense ratio E,F 2.58% 2.58% 2.60% 2.69% 2.71% 2.66%Management expense ratio before waivers or absorptions E,F 2.64% 2.65% 2.67% 2.70% 2.71% 2.66%Trading expense ratioG .29% .15% .08% .38% .99% .40%Portfolio turnover rateH 6.31% 10.43% 19.53% 13.34% 9.90% 8.10%Net asset value per security, end of period $ 38.6006 $ 33.4777 $ 34.8671 $ 30.9840 $ 28.6007 $ 24.3758
Fidelity Far East Class of the Fidelity Capital Structure Corp. Series B
Six-months ended May 31, Periods ended November 30,
2017 2016 2015 2014 2013 2012The Series’ Net Assets per Security A Net assets, beginning of period B $ 34.27 $ 35.70 $ 31.66 $ 29.16 $ 24.79 $ 23.38Increase (decrease) from operations: Total revenue .52 .84 .07 .06 .56 .07Total expenses (excluding distributions) (.42) (.80) (.84) (.72) (.66) (.57)Realized gains (losses) .62 2.14 3.91 3.53 .83 1.52Unrealized gains (losses) 6.01 (3.12) 1.09 (.44) 3.54 1.32Total increase (decrease) from operationsB 6.73 (.93) 4.23 2.43 4.28 2.34Distributions: From net investment income (excluding dividends) – – – – – –From dividends – – – – – –From capital gains (1.62) (.97) – – – –Return of capital – – – – – –Total distributionsB,C (1.62) (.97) – – – –Net assets, end of periodB $ 39.47 $ 34.27 $ 35.70 $ 31.66 $ 29.16 $ 24.79Ratios and Supplemental Data Net asset value (000s) D $ 21,121 $ 19,727 $ 26,984 $ 26,704 $ 26,537 $ 23,914Securities outstandingD 535,170 575,637 755,210 843,534 911,952 964,725Management expense ratio E,F 2.36% 2.36% 2.38% 2.46% 2.47% 2.45%Management expense ratio before waivers or absorptions E,F 2.41% 2.41% 2.42% 2.47% 2.47% 2.45%Trading expense ratioG .29% .15% .08% .38% .99% .40%Portfolio turnover rateH 6.31% 10.43% 19.53% 13.34% 9.90% 8.10%Net asset value per security, end of period $ 39.4707 $ 34.2702 $ 35.7014 $ 31.6573 $ 29.1577 $ 24.7880
5
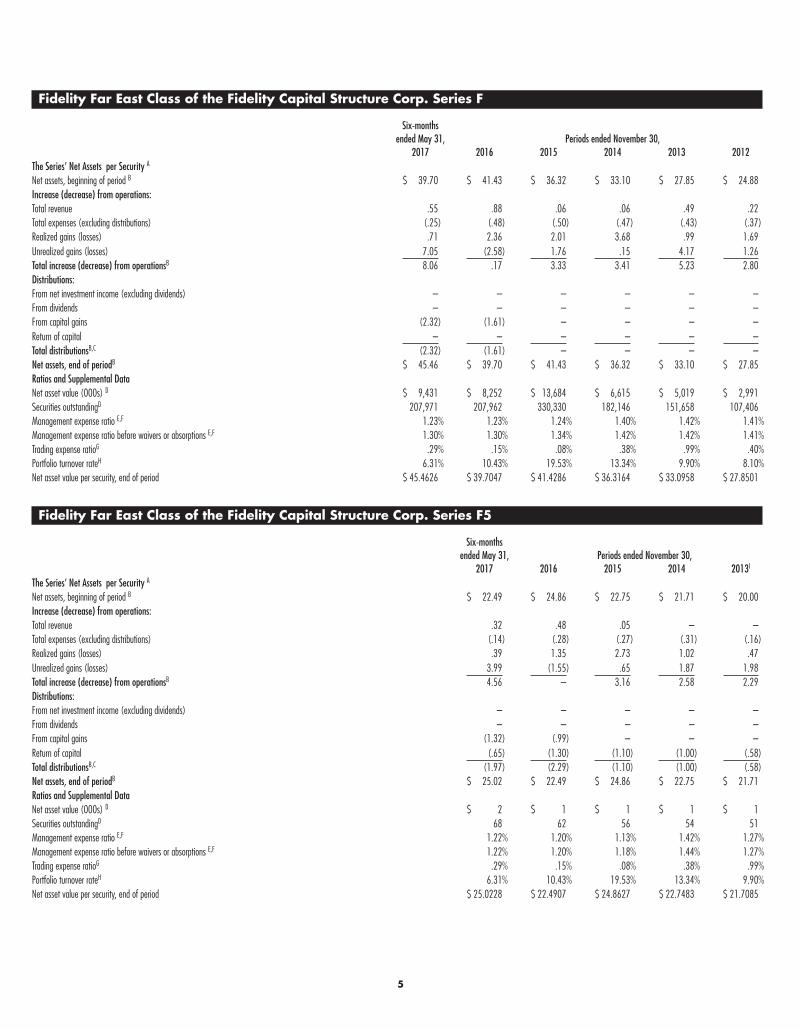
Fidelity Far East Class of the Fidelity Capital Structure Corp. Series F
Six-months ended May 31, Periods ended November 30,
2017 2016 2015 2014 2013 2012The Series’ Net Assets per Security A Net assets, beginning of period B $ 39.70 $ 41.43 $ 36.32 $ 33.10 $ 27.85 $ 24.88Increase (decrease) from operations: Total revenue .55 .88 .06 .06 .49 .22Total expenses (excluding distributions) (.25) (.48) (.50) (.47) (.43) (.37)Realized gains (losses) .71 2.36 2.01 3.68 .99 1.69Unrealized gains (losses) 7.05 (2.58) 1.76 .15 4.17 1.26Total increase (decrease) from operationsB 8.06 .17 3.33 3.41 5.23 2.80Distributions: From net investment income (excluding dividends) – – – – – –From dividends – – – – – –From capital gains (2.32) (1.61) – – – –Return of capital – – – – – –Total distributionsB,C (2.32) (1.61) – – – –Net assets, end of periodB $ 45.46 $ 39.70 $ 41.43 $ 36.32 $ 33.10 $ 27.85Ratios and Supplemental Data Net asset value (000s) D $ 9,431 $ 8,252 $ 13,684 $ 6,615 $ 5,019 $ 2,991Securities outstandingD 207,971 207,962 330,330 182,146 151,658 107,406Management expense ratio E,F 1.23% 1.23% 1.24% 1.40% 1.42% 1.41%Management expense ratio before waivers or absorptions E,F 1.30% 1.30% 1.34% 1.42% 1.42% 1.41%Trading expense ratioG .29% .15% .08% .38% .99% .40%Portfolio turnover rateH 6.31% 10.43% 19.53% 13.34% 9.90% 8.10%Net asset value per security, end of period $ 45.4626 $ 39.7047 $ 41.4286 $ 36.3164 $ 33.0958 $ 27.8501
Fidelity Far East Class of the Fidelity Capital Structure Corp. Series F5
Six-months ended May 31, Periods ended November 30,
2017 2016 2015 2014 2013I
The Series’ Net Assets per Security A Net assets, beginning of period B $ 22.49 $ 24.86 $ 22.75 $ 21.71 $ 20.00Increase (decrease) from operations: Total revenue .32 .48 .05 – –Total expenses (excluding distributions) (.14) (.28) (.27) (.31) (.16)Realized gains (losses) .39 1.35 2.73 1.02 .47Unrealized gains (losses) 3.99 (1.55) .65 1.87 1.98Total increase (decrease) from operationsB 4.56 – 3.16 2.58 2.29Distributions: From net investment income (excluding dividends) – – – – –From dividends – – – – –From capital gains (1.32) (.99) – – –Return of capital (.65) (1.30) (1.10) (1.00) (.58)Total distributionsB,C (1.97) (2.29) (1.10) (1.00) (.58)Net assets, end of periodB $ 25.02 $ 22.49 $ 24.86 $ 22.75 $ 21.71Ratios and Supplemental Data Net asset value (000s) D $ 2 $ 1 $ 1 $ 1 $ 1Securities outstandingD 68 62 56 54 51Management expense ratio E,F 1.22% 1.20% 1.13% 1.42% 1.27%Management expense ratio before waivers or absorptions E,F 1.22% 1.20% 1.18% 1.44% 1.27%Trading expense ratioG .29% .15% .08% .38% .99%Portfolio turnover rateH 6.31% 10.43% 19.53% 13.34% 9.90%Net asset value per security, end of period $ 25.0228 $ 22.4907 $ 24.8627 $ 22.7483 $ 21.7085

6
Financial Highlights – continued
Fidelity Far East Class of the Fidelity Capital Structure Corp. Series F8
Six-months ended May 31, Periods ended November 30,
2017 2016 2015 2014 2013I
The Series’ Net Assets per Security A Net assets, beginning of period B $ 20.53 $ 23.10 $ 21.68 $ 21.33 $ 20.00Increase (decrease) from operations: Total revenue .29 .23 .01 .06 –Total expenses (excluding distributions) (.12) (.24) (.29) (.31) (.16)Realized gains (losses) .36 .98 .39 2.44 .47Unrealized gains (losses) 3.63 (2.30) (3.64) (.19) 1.98Total increase (decrease) from operationsB 4.16 (1.34) (3.54) 2.00 2.29Distributions: From net investment income (excluding dividends) – – – – –From dividends – – – – –From capital gains (1.20) (.89) – – –Return of capital (.80) (1.60) (1.60) (1.60) (.93)Total distributionsB,C (2.00) (2.49) (1.60) (1.60) (.93)Net assets, end of periodB $ 22.61 $ 20.53 $ 23.10 $ 21.68 $ 21.33Ratios and Supplemental Data Net asset value (000s) D $ 28 $ 23 $ 14 $ 1 $ 1Securities outstandingD 1,244 1,127 613 57 52Management expense ratio E,F 1.16% 1.17% 1.24% 1.45% 1.27%Management expense ratio before waivers or absorptions E,F 1.22% 1.23% 1.33% 1.45% 1.27%Trading expense ratioG .29% .15% .08% .38% .99%Portfolio turnover rateH 6.31% 10.43% 19.53% 13.34% 9.90%Net asset value per security, end of period $ 22.6138 $ 20.5329 $ 23.1015 $ 21.6790 $ 21.3288
Fidelity Far East Class of the Fidelity Capital Structure Corp. Series T5
Six-months ended May 31, Periods ended November 30,
2017 2016 2015 2014 2013I
The Series’ Net Assets per Security A Net assets, beginning of period B $ 21.70 $ 23.92 $ 22.24 $ 21.52 $ 20.00Increase (decrease) from operations: Total revenue .46 .47 .05 – –Total expenses (excluding distributions) (.28) (.58) (.64) (.59) (.33)Realized gains (losses) .43 1.31 .36 1.14 .47Unrealized gains (losses) 2.76 (1.54) 2.99 2.70 1.96Total increase (decrease) from operationsB 3.37 (.33) 2.76 3.25 2.10Distributions: From net investment income (excluding dividends) – – – – –From dividends – – – – –From capital gains (.97) (.59) – – –Return of capital (.63) (1.25) (1.08) (1.00) (.58)Total distributionsB,C (1.60) (1.84) (1.08) (1.00) (.58)Net assets, end of periodB $ 24.33 $ 21.70 $ 23.92 $ 22.24 $ 21.52Ratios and Supplemental Data Net asset value (000s) D $ 9 $ 32 $ 27 $ 25 $ 1Securities outstandingD 390 1,468 1,124 1,122 51Management expense ratio E,F 2.61% 2.61% 2.63% 2.78% 2.68%Management expense ratio before waivers or absorptions E,F 2.67% 2.67% 2.72% 2.80% 2.68%Trading expense ratioG .29% .15% .08% .38% .99%Portfolio turnover rateH 6.31% 10.43% 19.53% 13.34% 9.90%Net asset value per security, end of period $ 24.3341 $ 21.7036 $ 23.9185 $ 22.2378 $ 21.5187
7
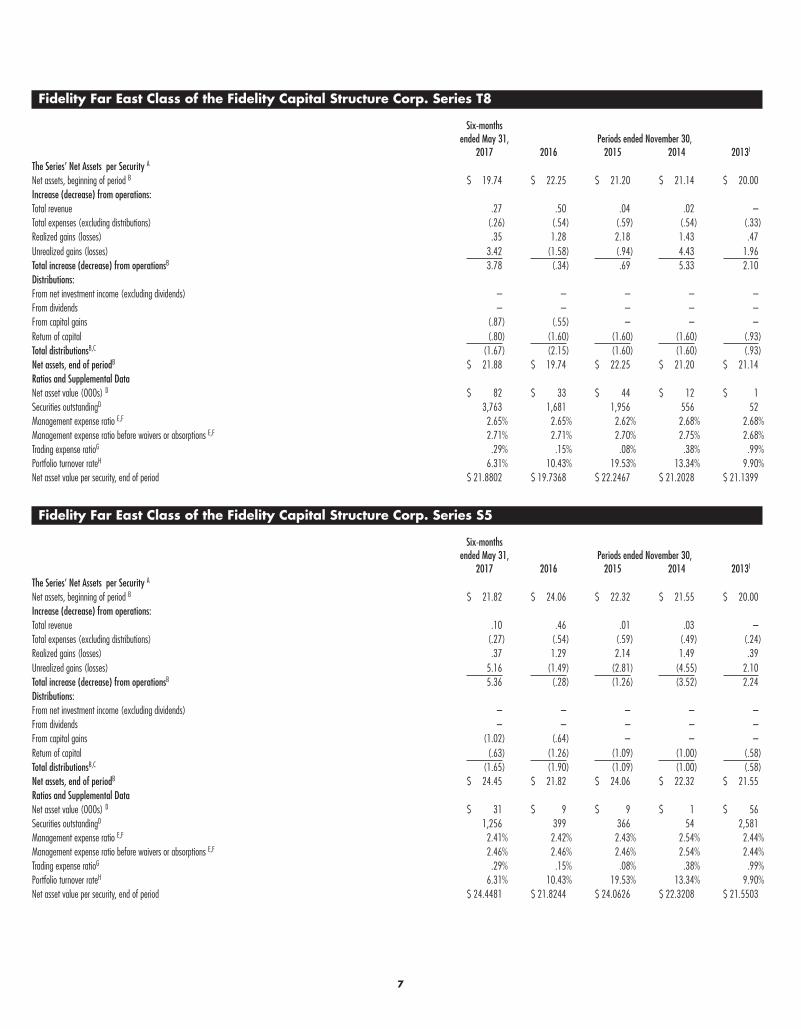
Fidelity Far East Class of the Fidelity Capital Structure Corp. Series T8
Six-months ended May 31, Periods ended November 30,
2017 2016 2015 2014 2013I
The Series’ Net Assets per Security A Net assets, beginning of period B $ 19.74 $ 22.25 $ 21.20 $ 21.14 $ 20.00Increase (decrease) from operations: Total revenue .27 .50 .04 .02 –Total expenses (excluding distributions) (.26) (.54) (.59) (.54) (.33)Realized gains (losses) .35 1.28 2.18 1.43 .47Unrealized gains (losses) 3.42 (1.58) (.94) 4.43 1.96Total increase (decrease) from operationsB 3.78 (.34) .69 5.33 2.10Distributions: From net investment income (excluding dividends) – – – – –From dividends – – – – –From capital gains (.87) (.55) – – –Return of capital (.80) (1.60) (1.60) (1.60) (.93)Total distributionsB,C (1.67) (2.15) (1.60) (1.60) (.93)Net assets, end of periodB $ 21.88 $ 19.74 $ 22.25 $ 21.20 $ 21.14Ratios and Supplemental Data Net asset value (000s) D $ 82 $ 33 $ 44 $ 12 $ 1Securities outstandingD 3,763 1,681 1,956 556 52Management expense ratio E,F 2.65% 2.65% 2.62% 2.68% 2.68%Management expense ratio before waivers or absorptions E,F 2.71% 2.71% 2.70% 2.75% 2.68%Trading expense ratioG .29% .15% .08% .38% .99%Portfolio turnover rateH 6.31% 10.43% 19.53% 13.34% 9.90%Net asset value per security, end of period $ 21.8802 $ 19.7368 $ 22.2467 $ 21.2028 $ 21.1399
Fidelity Far East Class of the Fidelity Capital Structure Corp. Series S5
Six-months ended May 31, Periods ended November 30,
2017 2016 2015 2014 2013I
The Series’ Net Assets per Security A Net assets, beginning of period B $ 21.82 $ 24.06 $ 22.32 $ 21.55 $ 20.00Increase (decrease) from operations: Total revenue .10 .46 .01 .03 –Total expenses (excluding distributions) (.27) (.54) (.59) (.49) (.24)Realized gains (losses) .37 1.29 2.14 1.49 .39Unrealized gains (losses) 5.16 (1.49) (2.81) (4.55) 2.10Total increase (decrease) from operationsB 5.36 (.28) (1.26) (3.52) 2.24Distributions: From net investment income (excluding dividends) – – – – –From dividends – – – – –From capital gains (1.02) (.64) – – –Return of capital (.63) (1.26) (1.09) (1.00) (.58)Total distributionsB,C (1.65) (1.90) (1.09) (1.00) (.58)Net assets, end of periodB $ 24.45 $ 21.82 $ 24.06 $ 22.32 $ 21.55Ratios and Supplemental Data Net asset value (000s) D $ 31 $ 9 $ 9 $ 1 $ 56Securities outstandingD 1,256 399 366 54 2,581Management expense ratio E,F 2.41% 2.42% 2.43% 2.54% 2.44%Management expense ratio before waivers or absorptions E,F 2.46% 2.46% 2.46% 2.54% 2.44%Trading expense ratioG .29% .15% .08% .38% .99%Portfolio turnover rateH 6.31% 10.43% 19.53% 13.34% 9.90%Net asset value per security, end of period $ 24.4481 $ 21.8244 $ 24.0626 $ 22.3208 $ 21.5503
8
Financial Highlights – continued
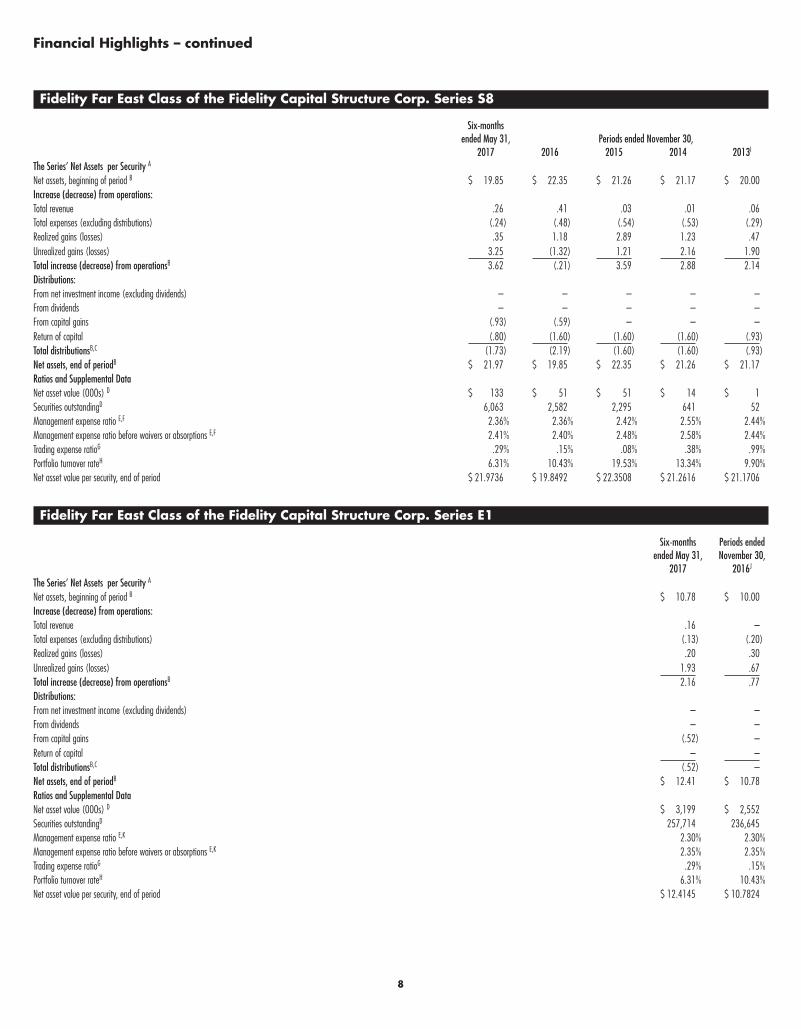
Fidelity Far East Class of the Fidelity Capital Structure Corp. Series S8
Six-months ended May 31, Periods ended November 30,
2017 2016 2015 2014 2013I
The Series’ Net Assets per Security A Net assets, beginning of period B $ 19.85 $ 22.35 $ 21.26 $ 21.17 $ 20.00Increase (decrease) from operations: Total revenue .26 .41 .03 .01 .06Total expenses (excluding distributions) (.24) (.48) (.54) (.53) (.29)Realized gains (losses) .35 1.18 2.89 1.23 .47Unrealized gains (losses) 3.25 (1.32) 1.21 2.16 1.90Total increase (decrease) from operationsB 3.62 (.21) 3.59 2.88 2.14Distributions: From net investment income (excluding dividends) – – – – –From dividends – – – – –From capital gains (.93) (.59) – – –Return of capital (.80) (1.60) (1.60) (1.60) (.93)Total distributionsB,C (1.73) (2.19) (1.60) (1.60) (.93)Net assets, end of periodB $ 21.97 $ 19.85 $ 22.35 $ 21.26 $ 21.17Ratios and Supplemental Data Net asset value (000s) D $ 133 $ 51 $ 51 $ 14 $ 1Securities outstandingD 6,063 2,582 2,295 641 52Management expense ratio E,F 2.36% 2.36% 2.42% 2.55% 2.44%Management expense ratio before waivers or absorptions E,F 2.41% 2.40% 2.48% 2.58% 2.44%Trading expense ratioG .29% .15% .08% .38% .99%Portfolio turnover rateH 6.31% 10.43% 19.53% 13.34% 9.90%Net asset value per security, end of period $ 21.9736 $ 19.8492 $ 22.3508 $ 21.2616 $ 21.1706
Fidelity Far East Class of the Fidelity Capital Structure Corp. Series E1
Six-months ended May 31,
Periods ended November 30,
2017 2016J
The Series’ Net Assets per Security A Net assets, beginning of period B $ 10.78 $ 10.00Increase (decrease) from operations: Total revenue .16 –Total expenses (excluding distributions) (.13) (.20)Realized gains (losses) .20 .30Unrealized gains (losses) 1.93 .67Total increase (decrease) from operationsB 2.16 .77Distributions: From net investment income (excluding dividends) – –From dividends – –From capital gains (.52) –Return of capital – –Total distributionsB,C (.52) –Net assets, end of periodB $ 12.41 $ 10.78Ratios and Supplemental Data Net asset value (000s) D $ 3,199 $ 2,552Securities outstandingD 257,714 236,645Management expense ratio E,K 2.30% 2.30%Management expense ratio before waivers or absorptions E,K 2.35% 2.35%Trading expense ratioG .29% .15%Portfolio turnover rateH 6.31% 10.43%Net asset value per security, end of period $ 12.4145 $ 10.7824

9
Fidelity Far East Class of the Fidelity Capital Structure Corp. Series E2
Six-months ended May 31,
Periods ended November 30,
2017 2016J
The Series’ Net Assets per Security A Net assets, beginning of period B $ 10.80 $ 10.00Increase (decrease) from operations: Total revenue .08 –Total expenses (excluding distributions) (.12) (.19)Realized gains (losses) .18 .29Unrealized gains (losses) 2.45 .85Total increase (decrease) from operationsB 2.59 .95Distributions: From net investment income (excluding dividends) – –From dividends – –From capital gains (.53) –Return of capital – –Total distributionsB,C (.53) –Net assets, end of periodB $ 12.43 $ 10.80Ratios and Supplemental Data Net asset value (000s) D $ 1,585 $ 453Securities outstandingD 127,543 41,902Management expense ratio E,K 2.14% 2.15%Management expense ratio before waivers or absorptions E,K 2.19% 2.19%Trading expense ratioG .29% .15%Portfolio turnover rateH 6.31% 10.43%Net asset value per security, end of period $ 12.4259 $ 10.7993
Fidelity Far East Class of the Fidelity Capital Structure Corp. Series E3
Six-months ended May 31,
Periods ended November 30,
2017 2016J
The Series’ Net Assets per Security A Net assets, beginning of period B $ 10.80 $ 10.00Increase (decrease) from operations: Total revenue .15 –Total expenses (excluding distributions) (.12) (.19)Realized gains (losses) .19 .30Unrealized gains (losses) 1.97 .83Total increase (decrease) from operationsB 2.19 .94Distributions: From net investment income (excluding dividends) – –From dividends – –From capital gains (.53) –Return of capital – –Total distributionsB,C (.53) –Net assets, end of periodB $ 12.42 $ 10.80Ratios and Supplemental Data Net asset value (000s) D $ 11 $ 8Securities outstandingD 883 777Management expense ratio E,K 2.19% 2.18%Management expense ratio before waivers or absorptions E,K 2.23% 2.24%Trading expense ratioG .29% .15%Portfolio turnover rateH 6.31% 10.43%Net asset value per security, end of period $ 12.4249 $ 10.7982
10
Financial Highlights – continued
Fidelity Far East Class of the Fidelity Capital Structure Corp. Series E4
Six-months ended May 31,
Periods ended November 30,
2017 2016J
The Series’ Net Assets per Security A Net assets, beginning of period B $ 10.82 $ 10.00Increase (decrease) from operations: Total revenue .15 –Total expenses (excluding distributions) (.12) (.17)Realized gains (losses) .19 .29Unrealized gains (losses) 1.95 .70Total increase (decrease) from operationsB 2.17 .82Distributions: From net investment income (excluding dividends) – –From dividends – –From capital gains (.56) –Return of capital – –Total distributionsB,C (.56) –Net assets, end of periodB $ 12.42 $ 10.82Ratios and Supplemental Data Net asset value (000s) D $ 1 $ 1Securities outstandingD 105 100Management expense ratio E,K 2.09% 1.94%Management expense ratio before waivers or absorptions E,K 2.29% 2.33%Trading expense ratioG .29% .15%Portfolio turnover rateH 6.31% 10.43%Net asset value per security, end of period $ 12.4216 $ 10.8162
Fidelity Far East Class of the Fidelity Capital Structure Corp. Series P1
Six-months ended May 31,
Periods ended November 30,
2017 2016L
The Series’ Net Assets per Security A Net assets, beginning of period B $ 9.52 $ 10.00Increase (decrease) from operations: Total revenue .12 .15Total expenses (excluding distributions) (.06) (.10)Realized gains (losses) .17 .48Unrealized gains (losses) 1.81 (.23)Total increase (decrease) from operationsB 2.04 .30Distributions: From net investment income (excluding dividends) – –From dividends – –From capital gains (.57) (.39)Return of capital – –Total distributionsB,C (.57) (.39)Net assets, end of periodB $ 10.89 $ 9.52Ratios and Supplemental Data Net asset value (000s) D $ 5,705 $ 3,679Securities outstandingD 523,986 386,576Management expense ratio E,M 1.14% 1.13%Management expense ratio before waivers or absorptions E,M 1.21% 1.19%Trading expense ratioG .29% .15%Portfolio turnover rateH 6.31% 10.43%Net asset value per security, end of period $ 10.8885 $ 9.5164

11
Fidelity Far East Class of the Fidelity Capital Structure Corp. Series P2
Six-months ended May 31,
Periods ended November 30,
2017 2016L
The Series’ Net Assets per Security A Net assets, beginning of period B $ 9.52 $ 10.00Increase (decrease) from operations: Total revenue .11 .07Total expenses (excluding distributions) (.05) (.10)Realized gains (losses) .17 .41Unrealized gains (losses) 1.94 .13Total increase (decrease) from operationsB 2.17 .50Distributions: From net investment income (excluding dividends) – –From dividends – –From capital gains (.57) (.39)Return of capital – –Total distributionsB,C (.57) (.39)Net assets, end of periodB $ 10.89 $ 9.52Ratios and Supplemental Data Net asset value (000s) D $ 2,209 $ 1,206Securities outstandingD 202,853 126,633Management expense ratio E,M 1.07% 1.06%Management expense ratio before waivers or absorptions E,M 1.13% 1.12%Trading expense ratioG .29% .15%Portfolio turnover rateH 6.31% 10.43%Net asset value per security, end of period $ 10.8908 $ 9.5204
Fidelity Far East Class of the Fidelity Capital Structure Corp. Series P3
Six-months ended May 31,
Periods ended November 30,
2017 2016L
The Series’ Net Assets per Security A Net assets, beginning of period B $ 9.53 $ 10.00Increase (decrease) from operations: Total revenue .04 –Total expenses (excluding distributions) (.04) (.09)Realized gains (losses) .21 .31Unrealized gains (losses) (2.64) 1.00Total increase (decrease) from operationsB (2.43) 1.22Distributions: From net investment income (excluding dividends) – –From dividends – –From capital gains (.58) (.39)Return of capital – –Total distributionsB,C (.58) (.39)Net assets, end of periodB $ 10.91 $ 9.53Ratios and Supplemental Data Net asset value (000s) D $ 1 $ 77Securities outstandingD 111 8,053Management expense ratio E,M .96% 1.02%Management expense ratio before waivers or absorptions E,M 1.08% 1.08%Trading expense ratioG .29% .15%Portfolio turnover rateH 6.31% 10.43%Net asset value per security, end of period $ 10.9083 $ 9.5262
12
Financial Highlights – continued
Fidelity Far East Class of the Fidelity Capital Structure Corp. Series P4
Six-months ended May 31,
Periods ended November 30,
2017 2016L
The Series’ Net Assets per Security A Net assets, beginning of period B $ 9.54 $ 10.00Increase (decrease) from operations: Total revenue .14 –Total expenses (excluding distributions) (.05) (.09)Realized gains (losses) .17 .30Unrealized gains (losses) 1.72 (3.73)Total increase (decrease) from operationsB 1.98 (3.52)Distributions: From net investment income (excluding dividends) – –From dividends – –From capital gains (.58) (.39)Return of capital – –Total distributionsB,C (.58) (.39)Net assets, end of periodB $ 10.90 $ 9.54Ratios and Supplemental Data Net asset value (000s) D $ 1,163 $ 956Securities outstandingD 106,679 100,265Management expense ratio E,M .96% .97%Management expense ratio before waivers or absorptions E,M 1.03% 1.04%Trading expense ratioG .29% .15%Portfolio turnover rateH 6.31% 10.43%Net asset value per security, end of period $ 10.9031 $ 9.5361
13
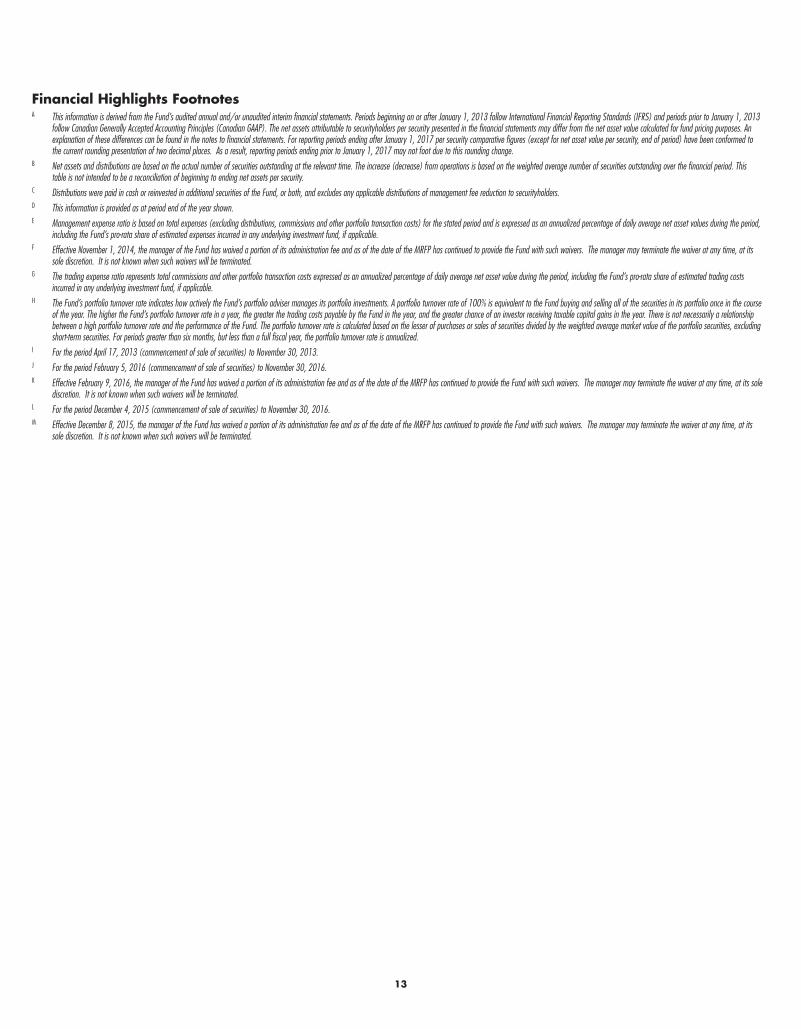
Financial Highlights FootnotesA This information is derived from the Fund’s audited annual and/or unaudited interim financial statements. Periods beginning on or after January 1, 2013 follow International Financial Reporting Standards (IFRS) and periods prior to January 1, 2013
follow Canadian Generally Accepted Accounting Principles (Canadian GAAP). The net assets attributable to securityholders per security presented in the financial statements may differ from the net asset value calculated for fund pricing purposes. An explanation of these differences can be found in the notes to financial statements. For reporting periods ending after January 1, 2017 per security comparative figures (except for net asset value per security, end of period) have been conformed to the current rounding presentation of two decimal places. As a result, reporting periods ending prior to January 1, 2017 may not foot due to this rounding change.
B Net assets and distributions are based on the actual number of securities outstanding at the relevant time. The increase (decrease) from operations is based on the weighted average number of securities outstanding over the financial period. This table is not intended to be a reconciliation of beginning to ending net assets per security.
C Distributions were paid in cash or reinvested in additional securities of the Fund, or both, and excludes any applicable distributions of management fee reduction to securityholders.D This information is provided as at period end of the year shown.E Management expense ratio is based on total expenses (excluding distributions, commissions and other portfolio transaction costs) for the stated period and is expressed as an annualized percentage of daily average net asset values during the period,
including the Fund’s pro-rata share of estimated expenses incurred in any underlying investment fund, if applicable.F Effective November 1, 2014, the manager of the Fund has waived a portion of its administration fee and as of the date of the MRFP has continued to provide the Fund with such waivers. The manager may terminate the waiver at any time, at its
sole discretion. It is not known when such waivers will be terminated.G The trading expense ratio represents total commissions and other portfolio transaction costs expressed as an annualized percentage of daily average net asset value during the period, including the Fund’s pro-rata share of estimated trading costs
incurred in any underlying investment fund, if applicable.H The Fund’s portfolio turnover rate indicates how actively the Fund’s portfolio adviser manages its portfolio investments. A portfolio turnover rate of 100% is equivalent to the Fund buying and selling all of the securities in its portfolio once in the course
of the year. The higher the Fund’s portfolio turnover rate in a year, the greater the trading costs payable by the Fund in the year, and the greater chance of an investor receiving taxable capital gains in the year. There is not necessarily a relationship between a high portfolio turnover rate and the performance of the Fund. The portfolio turnover rate is calculated based on the lesser of purchases or sales of securities divided by the weighted average market value of the portfolio securities, excluding short-term securities. For periods greater than six months, but less than a full fiscal year, the portfolio turnover rate is annualized.
I For the period April 17, 2013 (commencement of sale of securities) to November 30, 2013.J For the period February 5, 2016 (commencement of sale of securities) to November 30, 2016.K Effective February 9, 2016, the manager of the Fund has waived a portion of its administration fee and as of the date of the MRFP has continued to provide the Fund with such waivers. The manager may terminate the waiver at any time, at its sole
discretion. It is not known when such waivers will be terminated.L For the period December 4, 2015 (commencement of sale of securities) to November 30, 2016.M Effective December 8, 2015, the manager of the Fund has waived a portion of its administration fee and as of the date of the MRFP has continued to provide the Fund with such waivers. The manager may terminate the waiver at any time, at its
sole discretion. It is not known when such waivers will be terminated.

14
Management and Advisory Fees
Fidelity serves as manager of the Fund. The Fund pays Fidelity a monthly management fee for its services, based on the net asset value of each Series, calculated daily and payable monthly. Fidelity uses these management fees to pay for sales and trailing commissions to registered dealers on the distribution of the Fund securities, as well as for general investment management expenses. Dealer compensation represents cash commissions paid by Fidelity to registered dealers during the period and includes upfront deferred sales charge and trailing commissions. This amount may, in certain circumstances, exceed 100% of the fees earned by Fidelity during the period. For new Funds or Series the amounts presented may not be indicative of longer term operating periods.
Management Fees
Dealer Compensation
Investment management, administration
and other
Series A 2.000% 33.81% 66.19%Series B 1.850% 54.05% 45.95%Series F 0.850% — 100.00%Series F5 0.850% — 100.00%Series F8 0.850% — 100.00%Series T5 2.000% 27.51% 72.49%Series T8 2.000% 280.20% -180.20%Series S5 1.850% 54.05% 45.95%Series S8 1.850% 54.05% 45.95%Series E1 1.825% 54.79% 45.21%Series E2 1.800% 55.56% 44.44%Series E3 1.775% 56.34% 43.66%Series E4 1.725% 57.97% 42.03%Series P1 0.825% — 100.00%Series P2 0.800% — 100.00%Series P3 0.775% — 100.00%Series P4 0.725% — 100.00%
15
Fidelity Far East Class of the Fidelity Capital Structure Corp.
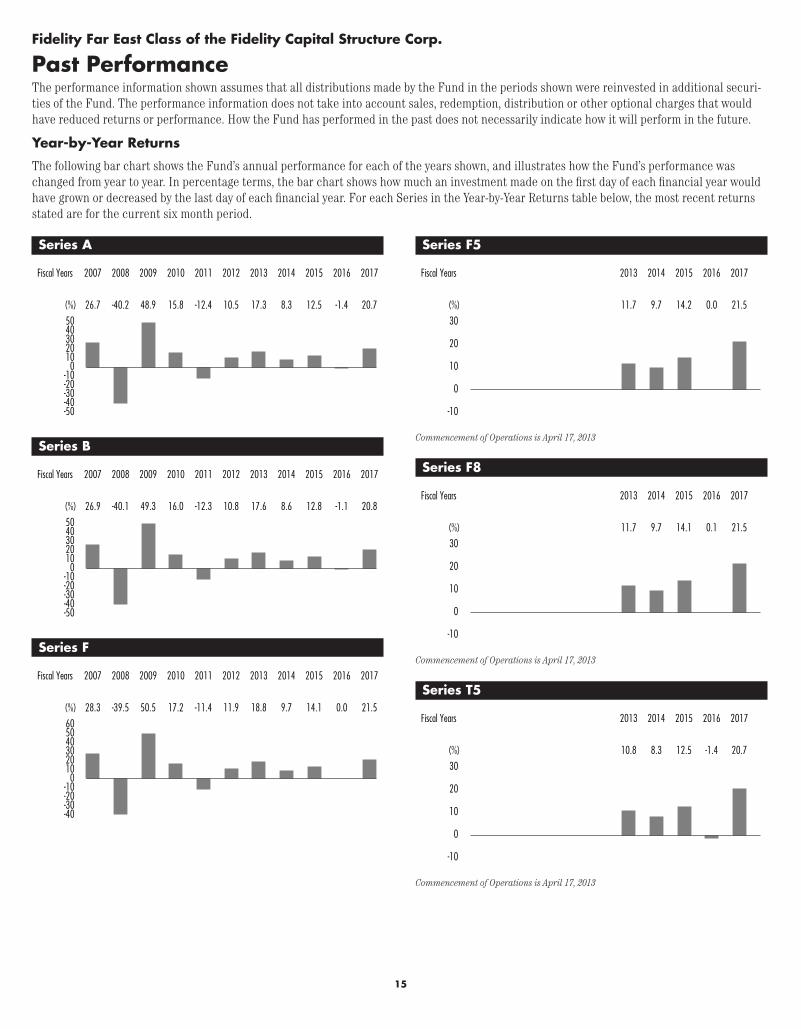
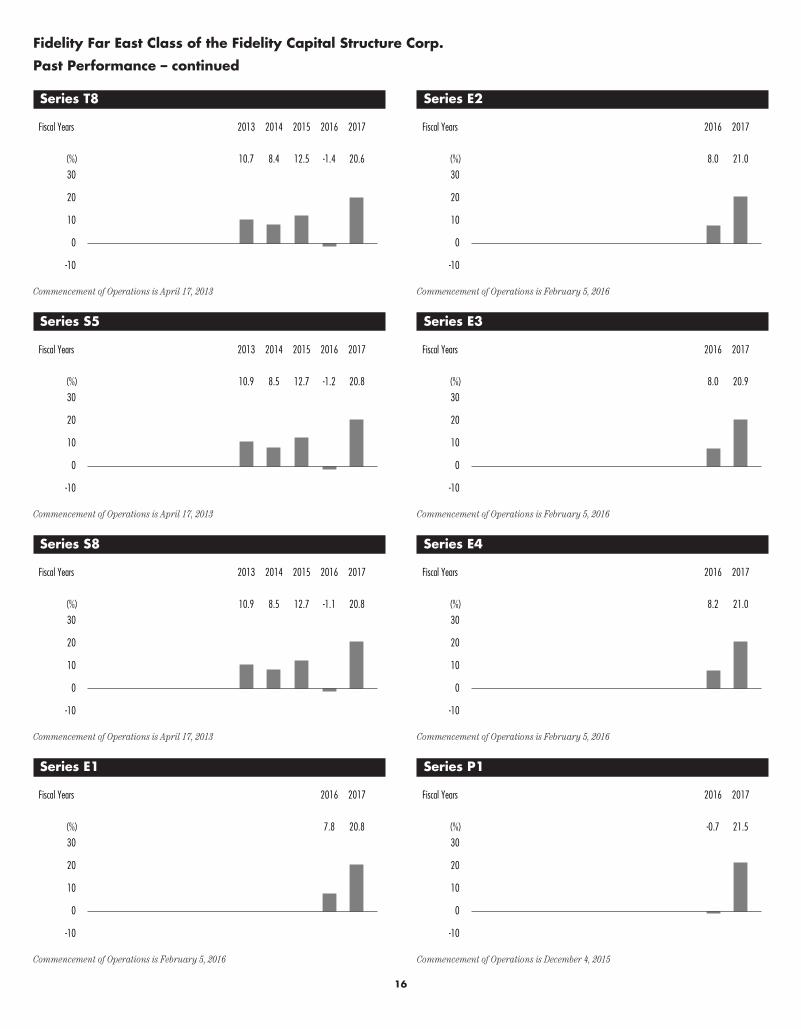
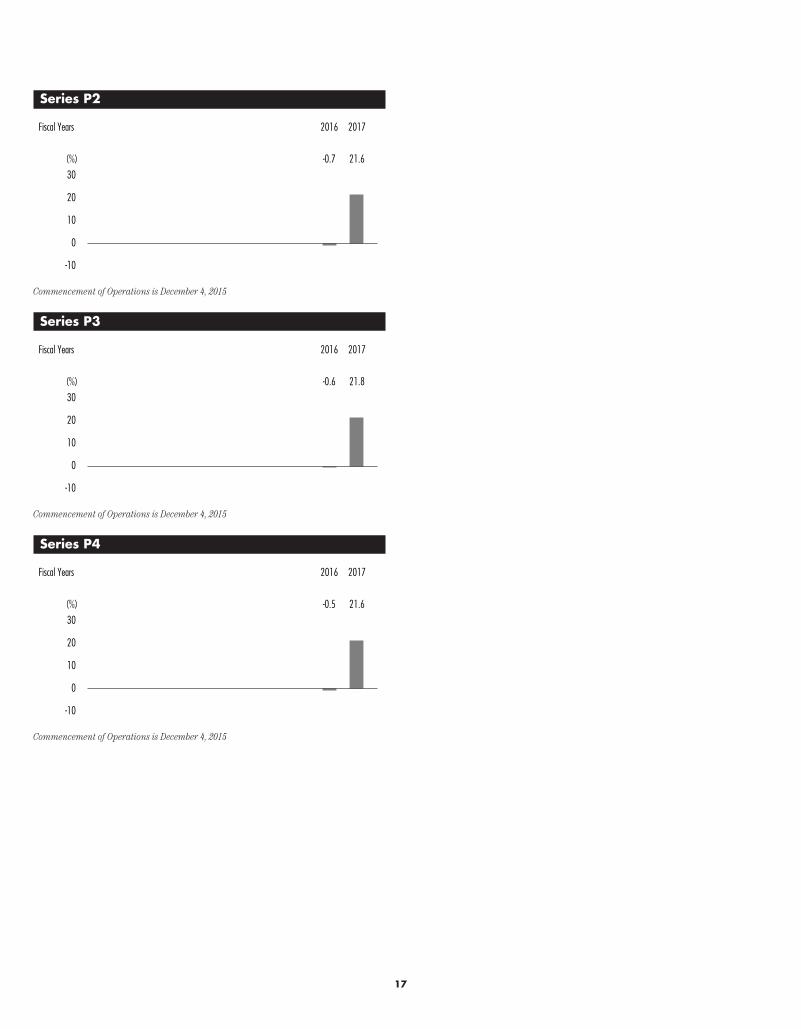
Past PerformanceThe performance information shown assumes that all distributions made by the Fund in the periods shown were reinvested in additional securi-ties of the Fund. The performance information does not take into account sales, redemption, distribution or other optional charges that would have reduced returns or performance. How the Fund has performed in the past does not necessarily indicate how it will perform in the future.
Year-by-Year Returns
The following bar chart shows the Fund’s annual performance for each of the years shown, and illustrates how the Fund’s performance was changed from year to year. In percentage terms, the bar chart shows how much an investment made on the first day of each financial year would have grown or decreased by the last day of each financial year. For each Series in the Year-by-Year Returns table below, the most recent returns stated are for the current six month period.
Series A
50403020100
-10-20-30-40-50
2017
20.7
2016
-1.4
2015
12.5
2014
8.3
2013
17.3
2012
10.5
2011
-12.4
2010
15.8
2009
48.9
2008
-40.2
2007
26.7
Fiscal Years
(%)
Series B
50403020100
-10-20-30-40-50
2017
20.8
2016
-1.1
2015
12.8
2014
8.6
2013
17.6
2012
10.8
2011
-12.3
2010
16.0
2009
49.3
2008
-40.1
2007
26.9
Fiscal Years
(%)
Series F
6050403020100
-10-20-30-40
2017
21.5
2016
0.0
2015
14.1
2014
9.7
2013
18.8
2012
11.9
2011
-11.4
2010
17.2
2009
50.5
2008
-39.5
2007
28.3
Fiscal Years
(%)
Series F5
30
20
10
0
-10
2017
21.5
2016
0.0
2015
14.2
2014
9.7
2013
11.7
Fiscal Years
(%)
Commencement of Operations is April 17, 2013
Series F8
30
20
10
0
-10
2017
21.5
2016
0.1
2015
14.1
2014
9.7
2013
11.7
Fiscal Years
(%)
Commencement of Operations is April 17, 2013
Series T5
30
20
10
0
-10
2017
20.7
2016
-1.4
2015
12.5
2014
8.3
2013
10.8
Fiscal Years
(%)
Commencement of Operations is April 17, 2013
16
Fidelity Far East Class of the Fidelity Capital Structure Corp.
Past Performance – continued
Series T8
30
20
10
0
-10
2017
20.6
2016
-1.4
2015
12.5
2014
8.4
2013
10.7
Fiscal Years
(%)
Commencement of Operations is April 17, 2013
Series S5
30
20
10
0
-10
2017
20.8
2016
-1.2
2015
12.7
2014
8.5
2013
10.9
Fiscal Years
(%)
Commencement of Operations is April 17, 2013
Series S8
30
20
10
0
-10
2017
20.8
2016
-1.1
2015
12.7
2014
8.5
2013
10.9
Fiscal Years
(%)
Commencement of Operations is April 17, 2013
Series E1
30
20
10
0
-10
2017
20.8
2016
7.8
Fiscal Years
(%)
Commencement of Operations is February 5, 2016
Series E2
30
20
10
0
-10
2017
21.0
2016
8.0
Fiscal Years
(%)
Commencement of Operations is February 5, 2016
Series E3
30
20
10
0
-10
2017
20.9
2016
8.0
Fiscal Years
(%)
Commencement of Operations is February 5, 2016
Series E4
30
20
10
0
-10
2017
21.0
2016
8.2
Fiscal Years
(%)
Commencement of Operations is February 5, 2016
Series P1
30
20
10
0
-10
2017
21.5
2016
-0.7
Fiscal Years
(%)
Commencement of Operations is December 4, 2015
17
Series P2
30
20
10
0
-10
2017
21.6
2016
-0.7
Fiscal Years
(%)
Commencement of Operations is December 4, 2015
Series P3
30
20
10
0
-10
2017
21.8
2016
-0.6
Fiscal Years
(%)
Commencement of Operations is December 4, 2015
Series P4
30
20
10
0
-10
2017
21.6
2016
-0.5
Fiscal Years
(%)
Commencement of Operations is December 4, 2015
18
Fidelity Far East Class of the Fidelity Capital Structure Corp.
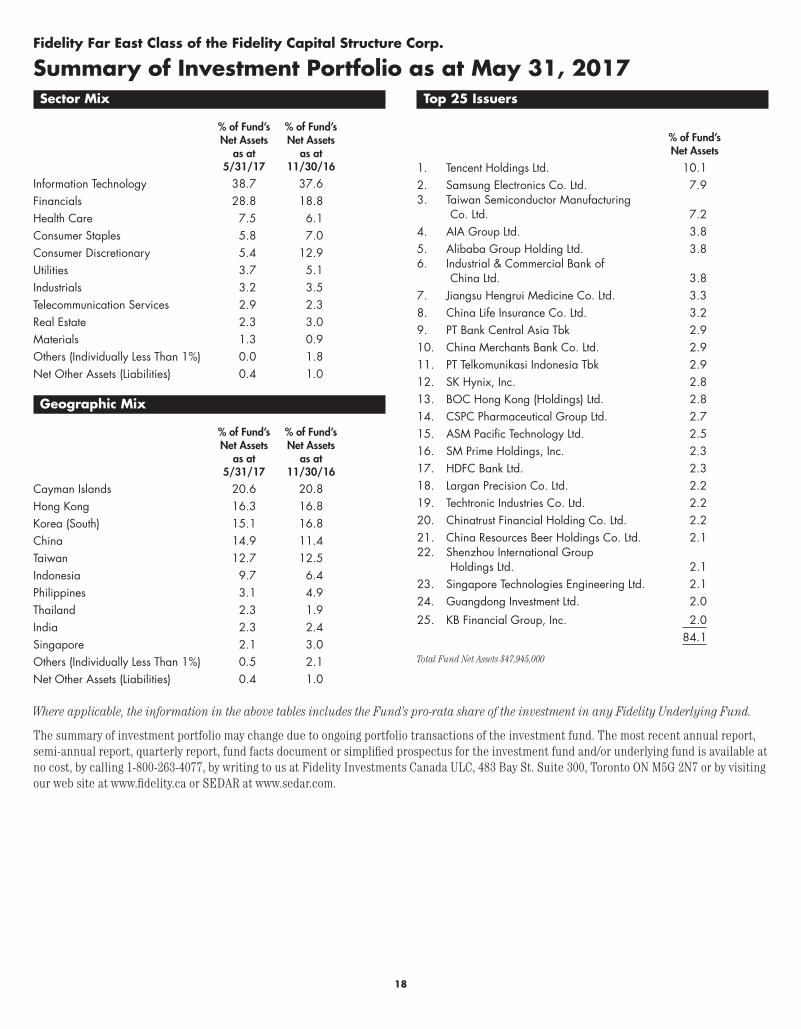
Summary of Investment Portfolio as at May 31, 2017Sector Mix
% of Fund’s Net Assets
as at 5/31/17
% of Fund’s Net Assets
as at 11/30/16
Information Technology 38.7 37.6Financials 28.8 18.8Health Care 7.5 6.1Consumer Staples 5.8 7.0Consumer Discretionary 5.4 12.9Utilities 3.7 5.1Industrials 3.2 3.5Telecommunication Services 2.9 2.3Real Estate 2.3 3.0Materials 1.3 0.9Others (Individually Less Than 1%) 0.0 1.8Net Other Assets (Liabilities) 0.4 1.0
Geographic Mix
% of Fund’s Net Assets
as at 5/31/17
% of Fund’s Net Assets
as at 11/30/16
Cayman Islands 20.6 20.8Hong Kong 16.3 16.8Korea (South) 15.1 16.8China 14.9 11.4Taiwan 12.7 12.5Indonesia 9.7 6.4Philippines 3.1 4.9Thailand 2.3 1.9India 2.3 2.4Singapore 2.1 3.0Others (Individually Less Than 1%) 0.5 2.1Net Other Assets (Liabilities) 0.4 1.0
Top 25 Issuers
% of Fund’s Net Assets
1. Tencent Holdings Ltd. 10.12. Samsung Electronics Co. Ltd. 7.93. Taiwan Semiconductor Manufacturing
Co. Ltd. 7.24. AIA Group Ltd. 3.85. Alibaba Group Holding Ltd. 3.86. Industrial & Commercial Bank of
China Ltd. 3.87. Jiangsu Hengrui Medicine Co. Ltd. 3.38. China Life Insurance Co. Ltd. 3.29. PT Bank Central Asia Tbk 2.910. China Merchants Bank Co. Ltd. 2.911. PT Telkomunikasi Indonesia Tbk 2.912. SK Hynix, Inc. 2.813. BOC Hong Kong (Holdings) Ltd. 2.814. CSPC Pharmaceutical Group Ltd. 2.715. ASM Pacific Technology Ltd. 2.516. SM Prime Holdings, Inc. 2.317. HDFC Bank Ltd. 2.318. Largan Precision Co. Ltd. 2.219. Techtronic Industries Co. Ltd. 2.220. Chinatrust Financial Holding Co. Ltd. 2.221. China Resources Beer Holdings Co. Ltd. 2.122. Shenzhou International Group
Holdings Ltd. 2.123. Singapore Technologies Engineering Ltd. 2.124. Guangdong Investment Ltd. 2.0
25. KB Financial Group, Inc. 2.084.1
Total Fund Net Assets $47,945,000
Where applicable, the information in the above tables includes the Fund’s pro-rata share of the investment in any Fidelity Underlying Fund.
The summary of investment portfolio may change due to ongoing portfolio transactions of the investment fund. The most recent annual report, semi-annual report, quarterly report, fund facts document or simplified prospectus for the investment fund and/or underlying fund is available at no cost, by calling 1-800-263-4077, by writing to us at Fidelity Investments Canada ULC, 483 Bay St. Suite 300, Toronto ON M5G 2N7 or by visiting our web site at www.fidelity.ca or SEDAR at www.sedar.com.


Fidelity’s mutual funds are sold by registered Investment Professionals. Each Fund has a simplified prospectus, which contains important information on the Fund, including its investment objective, purchase options, and applicable charges. Please obtain a copy of the prospectus, read it carefully, and consult your Investment Professional before investing. As with any investment, there are risks to investing in mutual funds. There is no assurance that any Fund will achieve its investment objective, and its net asset value, yield, and investment return will fluc-tuate from time to time with market conditions. Investors may experience a gain or loss when they sell their securities in any Fidelity Fund. Fidelity Global Funds may be more volatile than other Fidelity Funds as they concentrate investments in one sector and in fewer issuers; no single Fund is intended to be a complete diversified investment program. Past performance is no assurance or indicator of future returns. There is no assurance that either Fidelity Canadian Money Market Fund or Fidelity U.S. Money Market Fund will be able to maintain its net asset value at a constant amount. The breakdown of Fund investments is presented to illustrate the way in which a Fund may invest, and may not be representative of a Fund’s current or future investments. A Fund’s investments may change at any time.
1.831562.111 FICL-FE-CS-MRFPS-0717
Fidelity Capital Structure Corp.407 2nd Street S.W., Suite 820Calgary, Alberta T2P 2Y3
Manager and RegistrarFidelity Investments Canada ULC483 Bay Street, Suite 300Toronto, Ontario M5G 2N7
CustodianState Street Trust Company of CanadaToronto, Ontario
Visit us online atwww.fidelity.caor call Fidelity Client Servicesat 1-800-263-4077
62.107395E
®Fidelity Investments is a registered trademark of Fidelity Investments Canada ULC.