Fidelity Emerging Markets Class of the Fidelity Capital ... · Fidelity Emerging Markets Class of...
16
Semi-Annual Management Report of Fund Performance May 31, 2019 Fidelity Emerging Markets Class of the Fidelity Capital Structure Corp.
Transcript of Fidelity Emerging Markets Class of the Fidelity Capital ... · Fidelity Emerging Markets Class of...

Semi-Annual Management Report of Fund PerformanceMay 31, 2019
Fidelity Emerging Markets Class of the Fidelity Capital Structure Corp.

Caution Regarding Forward-looking Statements
Certain portions of this report, including, but not limited to, “Results of Operations” and “Recent Developments”, may contain forward-looking statements about the Fund, including its strategy, risks, expected performance and condition. Forward-looking statements include statements that are predictive in nature, that depend upon or refer to future events or conditions, or that include words such as “expects”, “anticipates”, “intends”, “plans”, “believes”, “estimates” and similar forward-looking expressions or negative versions thereof.
In addition, any statement that may be made concerning future performance, strategies or prospects, and possible future Fund action, is also a forward-looking statement. Forward-looking statements are based on current expectations and projections about future events and are inherently subject to, among other things, risks, uncertainties and assumptions about the Fund and economic factors. Accordingly, assumptions concerning future economic and other factors may prove to be incorrect at a future date.
Forward-looking statements are not guarantees of future performance, and actual events and results could differ materially from those expressed or implied in any forward-looking state-ments made by the Fund. Any number of important factors could contribute to these digressions, including, but not limited to, general economic, political and market factors in North America and internationally, interest and foreign exchange rates, global equity and capital markets, business competition, technological change, changes in government regulations, unexpected judicial or regulatory proceedings, and catastrophic events.
It should be stressed that the above-mentioned list of important factors is not exhaustive. You are encouraged to consider these and other factors carefully before making any investment decisions and you are urged to avoid placing undue reliance on forward-looking statements. Further, you should be aware of the fact that the Fund has no specific intention of updating any forward-looking statements whether as a result of new information, future events or otherwise, prior to the release of the next Management Report of Fund Performance.
1
Semi-Annual Management Report of Fund Performance as at May 31, 2019Fidelity Emerging Markets Class of the Fidelity Capital Structure Corp.This semi-annual management report of fund performance contains financial highlights but does not contain the complete semi-annual financial statements for the investment fund. You can get a copy of the semi-annual financial statements at your request, and at no cost, by calling 1-800-263-4077, by writing to us at Fidelity Investments, 483 Bay St. Suite 300, Toronto ON M5G 2N7 or by visiting our website at www.fidelity.ca or SEDAR at www.sedar.com.
Securityholders may also contact us using one of these methods to request a copy of the investment fund’s proxy voting policies and procedures, proxy voting disclosure record or quarterly portfolio disclosure relating to the investment fund.
Management Discussion of Fund PerformanceResults of OperationsFidelity Emerging Markets Class (Fund) invests substantially all of its assets in units of Fidelity Emerging Markets Fund (Underlying Fund).
Fidelity Emerging Markets Class, Series B, returned 10.6%, after fees and expenses, for the six-month period ended May 31, 2019. The net returns of the other series of this Fund are similar to those of Series B, except for differences attributable to expense structures. During the review period, global equities, as represented by the MSCI World Index, returned 3.1% (in Canadian dollar terms).
Market overview:
Emerging market equities delivered strong performance over the period. Progress in U.S.-China trade talks, and encouraging manufacturing sector data in China, lifted sentiment toward riskier assets. Central banks in Turkey, Russia, Indonesia and Colombia left their benchmark rates unchanged, driving investor interest in overseas assets. However, concerns about Chinese growth and renewed trade tensions weighed on markets toward the end of the review period. Chinese stocks rose after MSCI announced its decision to substantially raise exposure to mainland shares in its indexes. In Latin America, Brazilian stocks gained as the new government announced reform measures.
Factors affecting performance:
The Fund’s benchmark, the MSCI Emerging Markets Index, returned 3.2% during the review period. The Fund outperformed its benchmark, primarily due to exposure to certain stocks in the consumer discretionary sector, where investments in U.S.-based online marketplace company Mercadolibre, China-based educational services firm New Oriental and France-based luxury goods conglomerate LVMH contributed to relative returns. At the end of the review period, the Underlying Fund had no exposure to New Oriental.
In contrast, investments in certain stocks in the materials sector, such as Chile-based chemicals firm Sociedad Química y Minera, Brazil-based paper and paper products firm Suzano and Belgium-based mining company Umicore, detracted from relative returns.
Portfolio changes:
During the review period, the Underlying Fund’s exposures to the industrials and energy sectors were increased. In the industrials sector, the portfolio manager initiated positions in India-based conglomerate Larsen & Toubro and Taiwan-based manufacturer of pneumatic equipment AirTAC International. In the energy sector, exposure was increased to Russia-based integrated oil and gas firm Lukoil. The portfolio manager believes that these companies are trading at attractive valuations and have better future growth potential than their peers.
In contrast, exposures to the consumer discretionary and materials sectors were decreased. In the consumer discretionary sector, the portfolio manager exited positions in India-based automobiles firm Maruti Suzuki and China-based educational services firm New Oriental. In the materials sector, a position in Taiwan-based chemicals firm Formosa Plastics Corp. was exited The portfolio manager found better investment opportunities elsewhere.
Recent DevelopmentsEffective April 1, 2019, Sam Polyak has been added as a co-portfolio manager of the Underlying Fund.
Portfolio manager Sammy Simnegar continues to focus on companies with potential for growth, good management teams and dominant market share, and that operate in industries with high barriers to entry. He believes that emerging markets should continue to benefit from longer-term tailwinds, especially the rise of the emerging markets middle class. However, selectivity remains important, in his view. In general, emerging markets that have experienced the most difficulty in 2018 are ones with current account deficits, making them more vulnerable to U.S. dollar strength. Growth is slowing around the world, and the U.S. seems to be in the best shape among the major economies, in his view. However, even there, with the U.S. Federal Reserve in tightening mode, the portfolio manager is cautious about the longer-term outlook. He currently favours countries, such as India, that are embarking on significant structural reforms. He is also positive on Brazil, believing that the political and economic environment is getting better. The portfolio manager has less exposure than the benchmark to China, due to a lower-than-benchmark allocation to large state-owned enterprises (SOEs). He believes that the U.S.-China trade wars may not be resolved, which would be a significant negative for China in particular and for emerging markets in general, because companies would continue to defer investments, business confidence would erodes, and currencies might weaken.
At the end of the review period, the Underlying Fund had its largest absolute exposure to the financials sector, followed by the information technology sector. The Underlying Fund diverged the most from the benchmark sector weightings by having more exposure to the information technology sector and less exposure to the communication services sector.
Independent Review CommitteeEffective February 8, 2019, Kerry D. Adams retired from the Independent Review Committee. Also effective on that date, Douglas Nowers of Toronto, Ontario became a member of the Independent Review Committee.

2
Fidelity Emerging Markets Class of the Fidelity Capital Structure Corp.
Management Discussion of Fund Performance – continued
Related Party TransactionsManager and Portfolio Adviser
The Fund is managed by Fidelity Investments Canada ULC (Fidelity). Fidelity is part of a broader collection of companies collectively known as Fidelity Investments.
Fidelity provides or arranges for the provision of all general management and administrative services required by the Fund in its day–to–day operations, bookkeeping, record–keeping and other administrative services for the Fund.
Fidelity is the portfolio adviser to the Fund and it provides investment advisory services to the Fund. Fidelity provides investment advice with respect to the Fund’s investment portfolio and arranges for the acquisition and disposition of portfolio investments, including all necessary brokerage arrangements.
The Fund pays Fidelity a monthly management and advisory fee for their services, based on the net asset value of each Series, calculated daily and payable monthly. The Fund paid Fidelity management and advisory fees of $76,000 for the period ended May 31, 2019.
Administration Fee
Fidelity charges the Fund a fixed administration fee in place of certain variable expenses. Fidelity, in turn, pays all of the operating expenses of the Fund, other than certain specified fund costs (e.g. the fees and expenses of the Independent Review Committee, taxes, brokerage commissions and interest charges). The Fund pays an annual rate, which is calculated on a tiered basis, based on the net asset value of each Series, calculated daily and payable monthly. The Fund paid Fidelity administration fees of $11,000 for the period ended May 31, 2019.
3
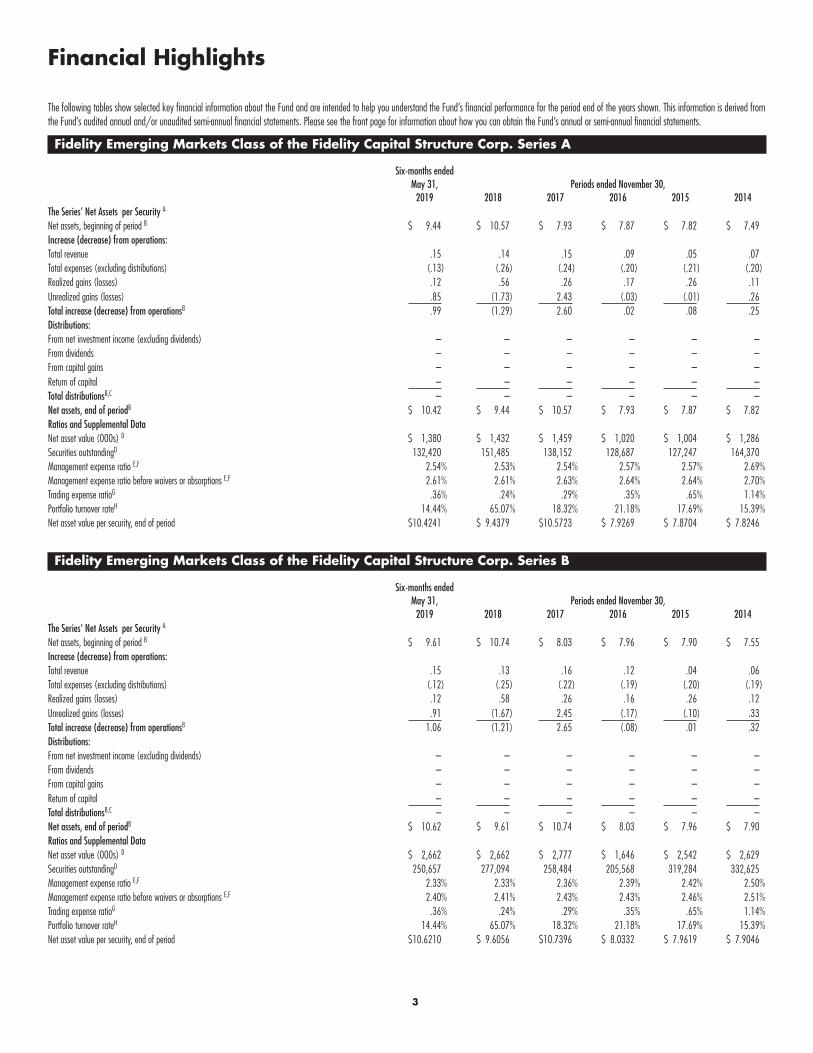
Financial Highlights
The following tables show selected key financial information about the Fund and are intended to help you understand the Fund’s financial performance for the period end of the years shown. This information is derived from the Fund’s audited annual and/or unaudited semi-annual financial statements. Please see the front page for information about how you can obtain the Fund’s annual or semi-annual financial statements.
Fidelity Emerging Markets Class of the Fidelity Capital Structure Corp. Series A
Six-months ended May 31, Periods ended November 30,
2019 2018 2017 2016 2015 2014The Series’ Net Assets per Security A Net assets, beginning of period B $ 9.44 $ 10.57 $ 7.93 $ 7.87 $ 7.82 $ 7.49Increase (decrease) from operations: Total revenue .15 .14 .15 .09 .05 .07Total expenses (excluding distributions) (.13) (.26) (.24) (.20) (.21) (.20)Realized gains (losses) .12 .56 .26 .17 .26 .11Unrealized gains (losses) .85 (1.73) 2.43 (.03) (.01) .26Total increase (decrease) from operationsB .99 (1.29) 2.60 .02 .08 .25Distributions: From net investment income (excluding dividends) – – – – – –From dividends – – – – – –From capital gains – – – – – –Return of capital – – – – – –Total distributionsB,C – – – – – –Net assets, end of periodB $ 10.42 $ 9.44 $ 10.57 $ 7.93 $ 7.87 $ 7.82Ratios and Supplemental Data Net asset value (000s) D $ 1,380 $ 1,432 $ 1,459 $ 1,020 $ 1,004 $ 1,286Securities outstandingD 132,420 151,485 138,152 128,687 127,247 164,370Management expense ratio E,F 2.54% 2.53% 2.54% 2.57% 2.57% 2.69%Management expense ratio before waivers or absorptions E,F 2.61% 2.61% 2.63% 2.64% 2.64% 2.70%Trading expense ratioG .36% .24% .29% .35% .65% 1.14%Portfolio turnover rateH 14.44% 65.07% 18.32% 21.18% 17.69% 15.39%Net asset value per security, end of period $ 10.4241 $ 9.4379 $ 10.5723 $ 7.9269 $ 7.8704 $ 7.8246
Fidelity Emerging Markets Class of the Fidelity Capital Structure Corp. Series B
Six-months ended May 31, Periods ended November 30,
2019 2018 2017 2016 2015 2014The Series’ Net Assets per Security A Net assets, beginning of period B $ 9.61 $ 10.74 $ 8.03 $ 7.96 $ 7.90 $ 7.55Increase (decrease) from operations: Total revenue .15 .13 .16 .12 .04 .06Total expenses (excluding distributions) (.12) (.25) (.22) (.19) (.20) (.19)Realized gains (losses) .12 .58 .26 .16 .26 .12Unrealized gains (losses) .91 (1.67) 2.45 (.17) (.10) .33Total increase (decrease) from operationsB 1.06 (1.21) 2.65 (.08) .01 .32Distributions: From net investment income (excluding dividends) – – – – – –From dividends – – – – – –From capital gains – – – – – –Return of capital – – – – – –Total distributionsB,C – – – – – –Net assets, end of periodB $ 10.62 $ 9.61 $ 10.74 $ 8.03 $ 7.96 $ 7.90Ratios and Supplemental Data Net asset value (000s) D $ 2,662 $ 2,662 $ 2,777 $ 1,646 $ 2,542 $ 2,629Securities outstandingD 250,657 277,094 258,484 205,568 319,284 332,625Management expense ratio E,F 2.33% 2.33% 2.36% 2.39% 2.42% 2.50%Management expense ratio before waivers or absorptions E,F 2.40% 2.41% 2.43% 2.43% 2.46% 2.51%Trading expense ratioG .36% .24% .29% .35% .65% 1.14%Portfolio turnover rateH 14.44% 65.07% 18.32% 21.18% 17.69% 15.39%Net asset value per security, end of period $ 10.6210 $ 9.6056 $ 10.7396 $ 8.0332 $ 7.9619 $ 7.9046
4
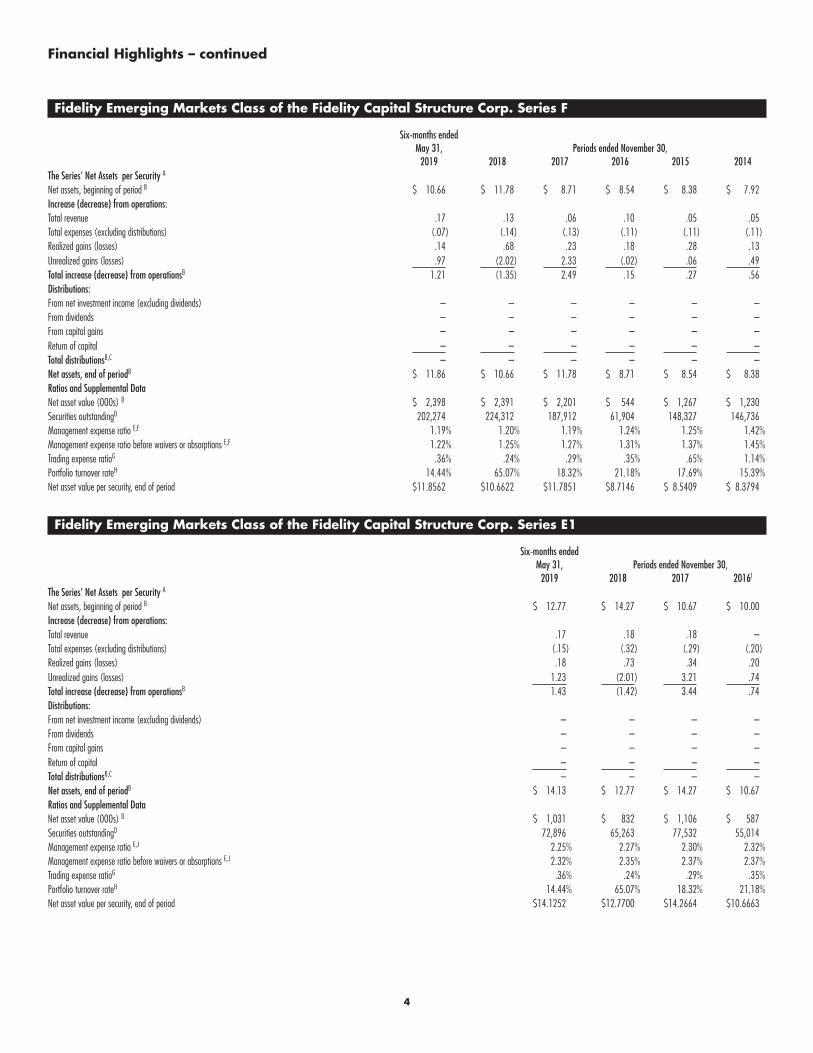
Financial Highlights – continued
Fidelity Emerging Markets Class of the Fidelity Capital Structure Corp. Series F
Six-months ended May 31, Periods ended November 30,
2019 2018 2017 2016 2015 2014The Series’ Net Assets per Security A Net assets, beginning of period B $ 10.66 $ 11.78 $ 8.71 $ 8.54 $ 8.38 $ 7.92Increase (decrease) from operations: Total revenue .17 .13 .06 .10 .05 .05Total expenses (excluding distributions) (.07) (.14) (.13) (.11) (.11) (.11)Realized gains (losses) .14 .68 .23 .18 .28 .13Unrealized gains (losses) .97 (2.02) 2.33 (.02) .06 .49Total increase (decrease) from operationsB 1.21 (1.35) 2.49 .15 .27 .56Distributions: From net investment income (excluding dividends) – – – – – –From dividends – – – – – –From capital gains – – – – – –Return of capital – – – – – –Total distributionsB,C – – – – – –Net assets, end of periodB $ 11.86 $ 10.66 $ 11.78 $ 8.71 $ 8.54 $ 8.38Ratios and Supplemental Data Net asset value (000s) D $ 2,398 $ 2,391 $ 2,201 $ 544 $ 1,267 $ 1,230Securities outstandingD 202,274 224,312 187,912 61,904 148,327 146,736Management expense ratio E,F 1.19% 1.20% 1.19% 1.24% 1.25% 1.42%Management expense ratio before waivers or absorptions E,F 1.22% 1.25% 1.27% 1.31% 1.37% 1.45%Trading expense ratioG .36% .24% .29% .35% .65% 1.14%Portfolio turnover rateH 14.44% 65.07% 18.32% 21.18% 17.69% 15.39%Net asset value per security, end of period $ 11.8562 $ 10.6622 $ 11.7851 $ 8.7146 $ 8.5409 $ 8.3794
Fidelity Emerging Markets Class of the Fidelity Capital Structure Corp. Series E1
Six-months ended May 31, Periods ended November 30,
2019 2018 2017 2016I
The Series’ Net Assets per Security A Net assets, beginning of period B $ 12.77 $ 14.27 $ 10.67 $ 10.00Increase (decrease) from operations: Total revenue .17 .18 .18 –Total expenses (excluding distributions) (.15) (.32) (.29) (.20)Realized gains (losses) .18 .73 .34 .20Unrealized gains (losses) 1.23 (2.01) 3.21 .74Total increase (decrease) from operationsB 1.43 (1.42) 3.44 .74Distributions: From net investment income (excluding dividends) – – – –From dividends – – – –From capital gains – – – –Return of capital – – – –Total distributionsB,C – – – –Net assets, end of periodB $ 14.13 $ 12.77 $ 14.27 $ 10.67Ratios and Supplemental Data Net asset value (000s) D $ 1,031 $ 832 $ 1,106 $ 587Securities outstandingD 72,896 65,263 77,532 55,014Management expense ratio E,J 2.25% 2.27% 2.30% 2.32%Management expense ratio before waivers or absorptions E,J 2.32% 2.35% 2.37% 2.37%Trading expense ratioG .36% .24% .29% .35%Portfolio turnover rateH 14.44% 65.07% 18.32% 21.18%Net asset value per security, end of period $ 14.1252 $ 12.7700 $ 14.2664 $ 10.6663
5
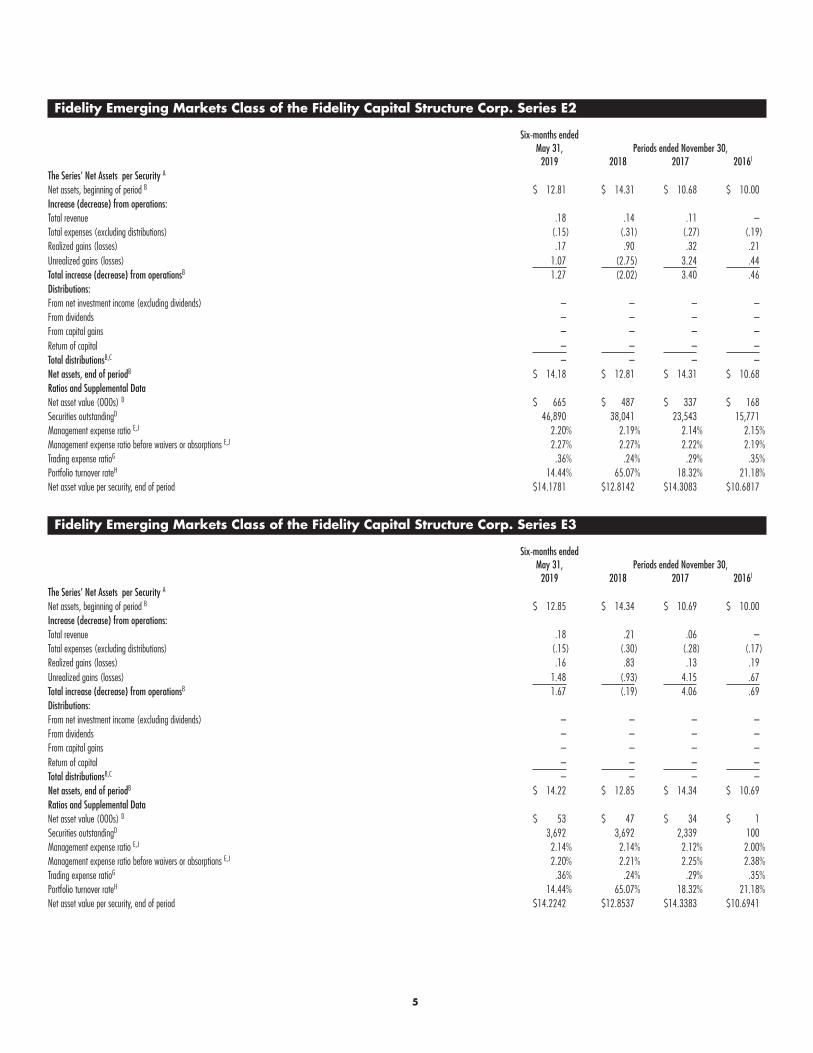
Fidelity Emerging Markets Class of the Fidelity Capital Structure Corp. Series E2
Six-months ended May 31, Periods ended November 30,
2019 2018 2017 2016I
The Series’ Net Assets per Security A Net assets, beginning of period B $ 12.81 $ 14.31 $ 10.68 $ 10.00Increase (decrease) from operations: Total revenue .18 .14 .11 –Total expenses (excluding distributions) (.15) (.31) (.27) (.19)Realized gains (losses) .17 .90 .32 .21Unrealized gains (losses) 1.07 (2.75) 3.24 .44Total increase (decrease) from operationsB 1.27 (2.02) 3.40 .46Distributions: From net investment income (excluding dividends) – – – –From dividends – – – –From capital gains – – – –Return of capital – – – –Total distributionsB,C – – – –Net assets, end of periodB $ 14.18 $ 12.81 $ 14.31 $ 10.68Ratios and Supplemental Data Net asset value (000s) D $ 665 $ 487 $ 337 $ 168Securities outstandingD 46,890 38,041 23,543 15,771Management expense ratio E,J 2.20% 2.19% 2.14% 2.15%Management expense ratio before waivers or absorptions E,J 2.27% 2.27% 2.22% 2.19%Trading expense ratioG .36% .24% .29% .35%Portfolio turnover rateH 14.44% 65.07% 18.32% 21.18%Net asset value per security, end of period $ 14.1781 $ 12.8142 $ 14.3083 $ 10.6817
Fidelity Emerging Markets Class of the Fidelity Capital Structure Corp. Series E3
Six-months ended May 31, Periods ended November 30,
2019 2018 2017 2016I
The Series’ Net Assets per Security A Net assets, beginning of period B $ 12.85 $ 14.34 $ 10.69 $ 10.00Increase (decrease) from operations: Total revenue .18 .21 .06 –Total expenses (excluding distributions) (.15) (.30) (.28) (.17)Realized gains (losses) .16 .83 .13 .19Unrealized gains (losses) 1.48 (.93) 4.15 .67Total increase (decrease) from operationsB 1.67 (.19) 4.06 .69Distributions: From net investment income (excluding dividends) – – – –From dividends – – – –From capital gains – – – –Return of capital – – – –Total distributionsB,C – – – –Net assets, end of periodB $ 14.22 $ 12.85 $ 14.34 $ 10.69Ratios and Supplemental Data Net asset value (000s) D $ 53 $ 47 $ 34 $ 1Securities outstandingD 3,692 3,692 2,339 100Management expense ratio E,J 2.14% 2.14% 2.12% 2.00%Management expense ratio before waivers or absorptions E,J 2.20% 2.21% 2.25% 2.38%Trading expense ratioG .36% .24% .29% .35%Portfolio turnover rateH 14.44% 65.07% 18.32% 21.18%Net asset value per security, end of period $ 14.2242 $ 12.8537 $ 14.3383 $ 10.6941
6
Financial Highlights – continued
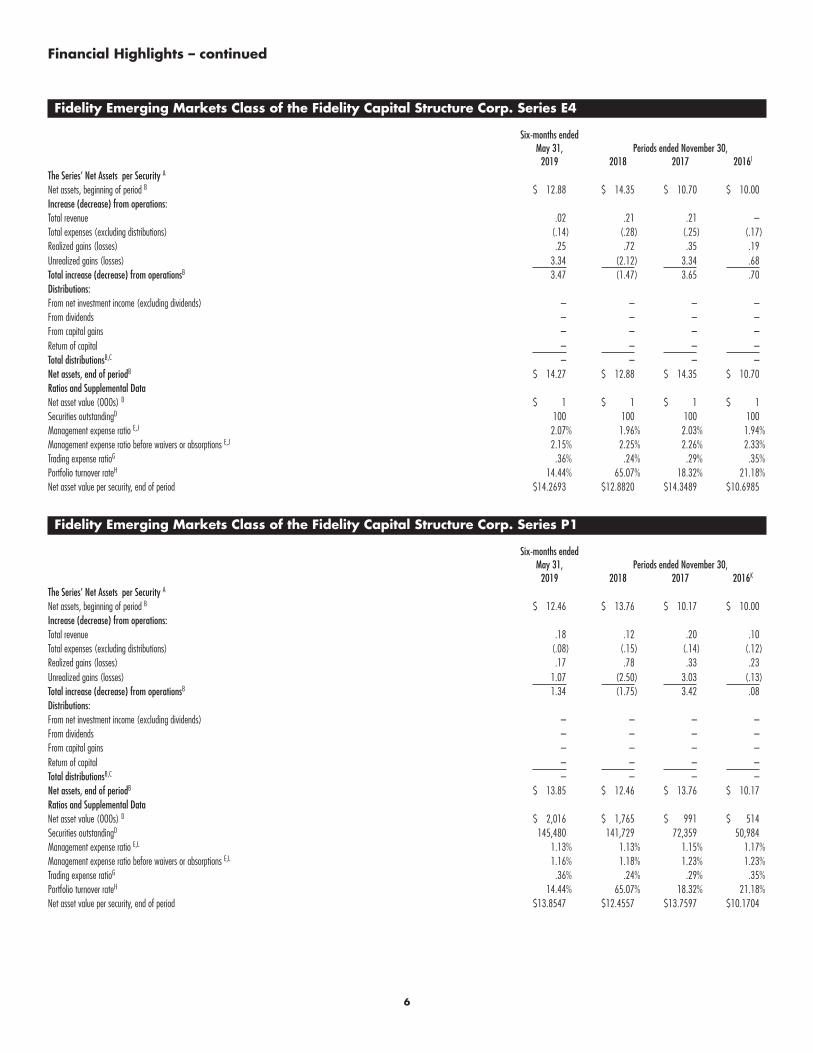
Fidelity Emerging Markets Class of the Fidelity Capital Structure Corp. Series E4
Six-months ended May 31, Periods ended November 30,
2019 2018 2017 2016I
The Series’ Net Assets per Security A Net assets, beginning of period B $ 12.88 $ 14.35 $ 10.70 $ 10.00Increase (decrease) from operations: Total revenue .02 .21 .21 –Total expenses (excluding distributions) (.14) (.28) (.25) (.17)Realized gains (losses) .25 .72 .35 .19Unrealized gains (losses) 3.34 (2.12) 3.34 .68Total increase (decrease) from operationsB 3.47 (1.47) 3.65 .70Distributions: From net investment income (excluding dividends) – – – –From dividends – – – –From capital gains – – – –Return of capital – – – –Total distributionsB,C – – – –Net assets, end of periodB $ 14.27 $ 12.88 $ 14.35 $ 10.70Ratios and Supplemental Data Net asset value (000s) D $ 1 $ 1 $ 1 $ 1Securities outstandingD 100 100 100 100Management expense ratio E,J 2.07% 1.96% 2.03% 1.94%Management expense ratio before waivers or absorptions E,J 2.15% 2.25% 2.26% 2.33%Trading expense ratioG .36% .24% .29% .35%Portfolio turnover rateH 14.44% 65.07% 18.32% 21.18%Net asset value per security, end of period $ 14.2693 $ 12.8820 $ 14.3489 $ 10.6985
Fidelity Emerging Markets Class of the Fidelity Capital Structure Corp. Series P1
Six-months ended May 31, Periods ended November 30,
2019 2018 2017 2016K
The Series’ Net Assets per Security A Net assets, beginning of period B $ 12.46 $ 13.76 $ 10.17 $ 10.00Increase (decrease) from operations: Total revenue .18 .12 .20 .10Total expenses (excluding distributions) (.08) (.15) (.14) (.12)Realized gains (losses) .17 .78 .33 .23Unrealized gains (losses) 1.07 (2.50) 3.03 (.13)Total increase (decrease) from operationsB 1.34 (1.75) 3.42 .08Distributions: From net investment income (excluding dividends) – – – –From dividends – – – –From capital gains – – – –Return of capital – – – –Total distributionsB,C – – – –Net assets, end of periodB $ 13.85 $ 12.46 $ 13.76 $ 10.17Ratios and Supplemental Data Net asset value (000s) D $ 2,016 $ 1,765 $ 991 $ 514Securities outstandingD 145,480 141,729 72,359 50,984Management expense ratio E,L 1.13% 1.13% 1.15% 1.17%Management expense ratio before waivers or absorptions E,L 1.16% 1.18% 1.23% 1.23%Trading expense ratioG .36% .24% .29% .35%Portfolio turnover rateH 14.44% 65.07% 18.32% 21.18%Net asset value per security, end of period $ 13.8547 $ 12.4557 $ 13.7597 $ 10.1704
7
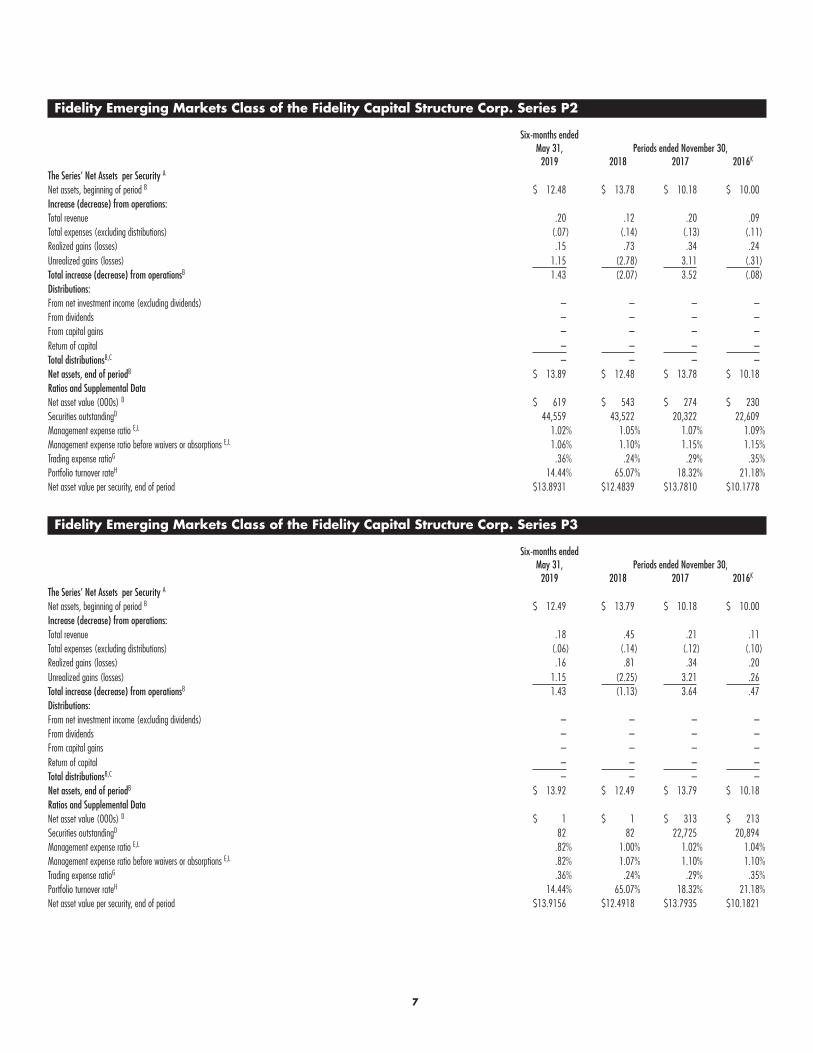
Fidelity Emerging Markets Class of the Fidelity Capital Structure Corp. Series P2
Six-months ended May 31, Periods ended November 30,
2019 2018 2017 2016K
The Series’ Net Assets per Security A Net assets, beginning of period B $ 12.48 $ 13.78 $ 10.18 $ 10.00Increase (decrease) from operations: Total revenue .20 .12 .20 .09Total expenses (excluding distributions) (.07) (.14) (.13) (.11)Realized gains (losses) .15 .73 .34 .24Unrealized gains (losses) 1.15 (2.78) 3.11 (.31)Total increase (decrease) from operationsB 1.43 (2.07) 3.52 (.08)Distributions: From net investment income (excluding dividends) – – – –From dividends – – – –From capital gains – – – –Return of capital – – – –Total distributionsB,C – – – –Net assets, end of periodB $ 13.89 $ 12.48 $ 13.78 $ 10.18Ratios and Supplemental Data Net asset value (000s) D $ 619 $ 543 $ 274 $ 230Securities outstandingD 44,559 43,522 20,322 22,609Management expense ratio E,L 1.02% 1.05% 1.07% 1.09%Management expense ratio before waivers or absorptions E,L 1.06% 1.10% 1.15% 1.15%Trading expense ratioG .36% .24% .29% .35%Portfolio turnover rateH 14.44% 65.07% 18.32% 21.18%Net asset value per security, end of period $ 13.8931 $ 12.4839 $ 13.7810 $ 10.1778
Fidelity Emerging Markets Class of the Fidelity Capital Structure Corp. Series P3
Six-months ended May 31, Periods ended November 30,
2019 2018 2017 2016K
The Series’ Net Assets per Security A Net assets, beginning of period B $ 12.49 $ 13.79 $ 10.18 $ 10.00Increase (decrease) from operations: Total revenue .18 .45 .21 .11Total expenses (excluding distributions) (.06) (.14) (.12) (.10)Realized gains (losses) .16 .81 .34 .20Unrealized gains (losses) 1.15 (2.25) 3.21 .26Total increase (decrease) from operationsB 1.43 (1.13) 3.64 .47Distributions: From net investment income (excluding dividends) – – – –From dividends – – – –From capital gains – – – –Return of capital – – – –Total distributionsB,C – – – –Net assets, end of periodB $ 13.92 $ 12.49 $ 13.79 $ 10.18Ratios and Supplemental Data Net asset value (000s) D $ 1 $ 1 $ 313 $ 213Securities outstandingD 82 82 22,725 20,894Management expense ratio E,L .82% 1.00% 1.02% 1.04%Management expense ratio before waivers or absorptions E,L .82% 1.07% 1.10% 1.10%Trading expense ratioG .36% .24% .29% .35%Portfolio turnover rateH 14.44% 65.07% 18.32% 21.18%Net asset value per security, end of period $ 13.9156 $ 12.4918 $ 13.7935 $ 10.1821
8
Financial Highlights – continued
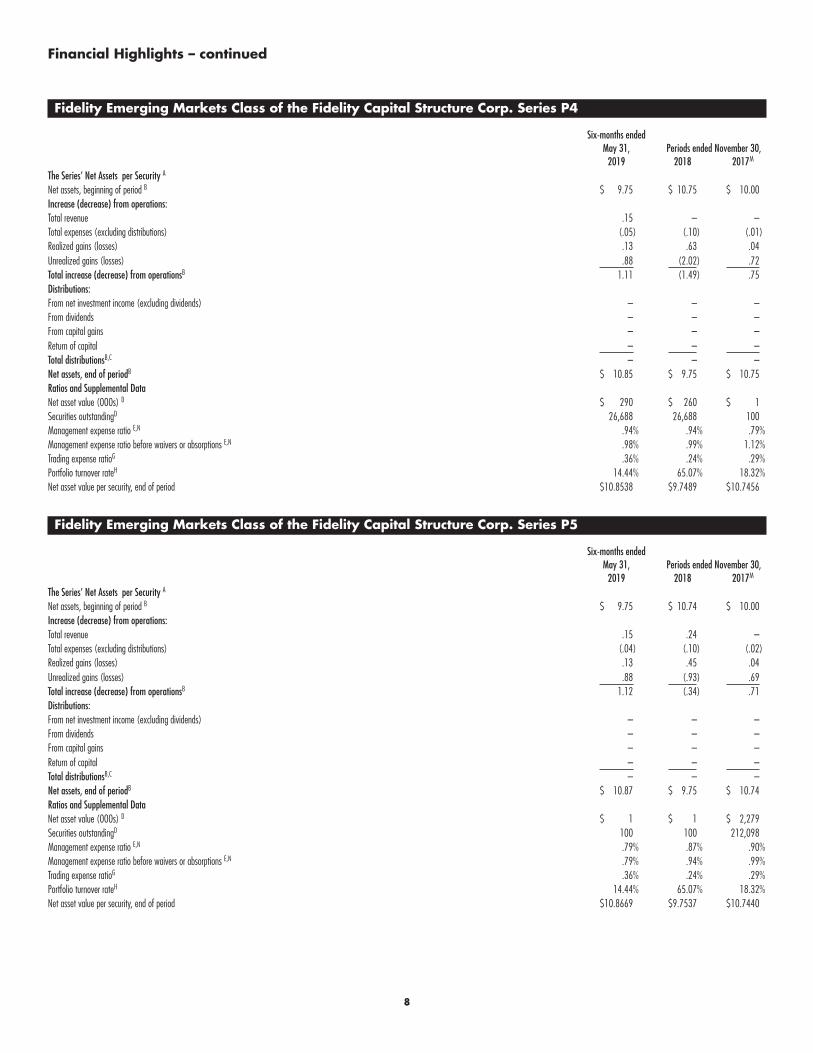
Fidelity Emerging Markets Class of the Fidelity Capital Structure Corp. Series P4
Six-months ended May 31, Periods ended November 30,
2019 2018 2017M
The Series’ Net Assets per Security A Net assets, beginning of period B $ 9.75 $ 10.75 $ 10.00Increase (decrease) from operations: Total revenue .15 – –Total expenses (excluding distributions) (.05) (.10) (.01)Realized gains (losses) .13 .63 .04Unrealized gains (losses) .88 (2.02) .72Total increase (decrease) from operationsB 1.11 (1.49) .75Distributions: From net investment income (excluding dividends) – – –From dividends – – –From capital gains – – –Return of capital – – –Total distributionsB,C – – –Net assets, end of periodB $ 10.85 $ 9.75 $ 10.75Ratios and Supplemental Data Net asset value (000s) D $ 290 $ 260 $ 1Securities outstandingD 26,688 26,688 100Management expense ratio E,N .94% .94% .79%Management expense ratio before waivers or absorptions E,N .98% .99% 1.12%Trading expense ratioG .36% .24% .29%Portfolio turnover rateH 14.44% 65.07% 18.32%Net asset value per security, end of period $ 10.8538 $ 9.7489 $ 10.7456
Fidelity Emerging Markets Class of the Fidelity Capital Structure Corp. Series P5
Six-months ended May 31, Periods ended November 30,
2019 2018 2017M
The Series’ Net Assets per Security A Net assets, beginning of period B $ 9.75 $ 10.74 $ 10.00Increase (decrease) from operations: Total revenue .15 .24 –Total expenses (excluding distributions) (.04) (.10) (.02)Realized gains (losses) .13 .45 .04Unrealized gains (losses) .88 (.93) .69Total increase (decrease) from operationsB 1.12 (.34) .71Distributions: From net investment income (excluding dividends) – – –From dividends – – –From capital gains – – –Return of capital – – –Total distributionsB,C – – –Net assets, end of periodB $ 10.87 $ 9.75 $ 10.74Ratios and Supplemental Data Net asset value (000s) D $ 1 $ 1 $ 2,279Securities outstandingD 100 100 212,098Management expense ratio E,N .79% .87% .90%Management expense ratio before waivers or absorptions E,N .79% .94% .99%Trading expense ratioG .36% .24% .29%Portfolio turnover rateH 14.44% 65.07% 18.32%Net asset value per security, end of period $ 10.8669 $ 9.7537 $ 10.7440
9
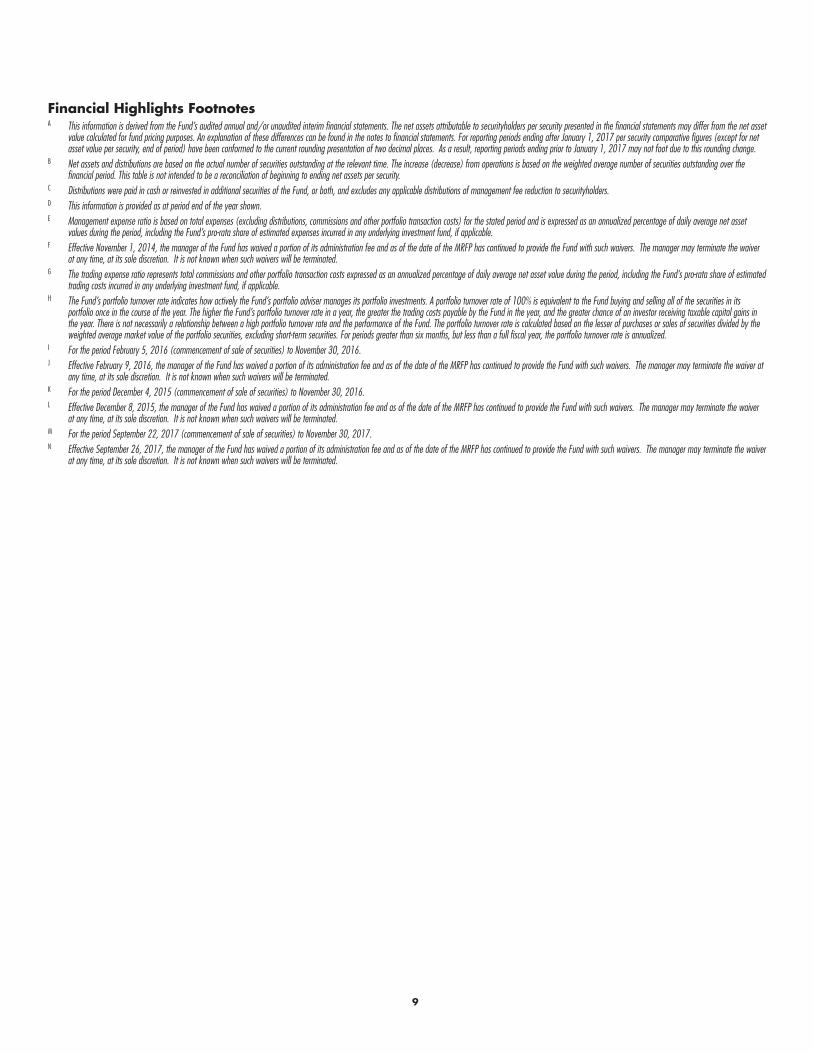
Financial Highlights FootnotesA This information is derived from the Fund’s audited annual and/or unaudited interim financial statements. The net assets attributable to securityholders per security presented in the financial statements may differ from the net asset
value calculated for fund pricing purposes. An explanation of these differences can be found in the notes to financial statements. For reporting periods ending after January 1, 2017 per security comparative figures (except for net asset value per security, end of period) have been conformed to the current rounding presentation of two decimal places. As a result, reporting periods ending prior to January 1, 2017 may not foot due to this rounding change.
B Net assets and distributions are based on the actual number of securities outstanding at the relevant time. The increase (decrease) from operations is based on the weighted average number of securities outstanding over the financial period. This table is not intended to be a reconciliation of beginning to ending net assets per security.
C Distributions were paid in cash or reinvested in additional securities of the Fund, or both, and excludes any applicable distributions of management fee reduction to securityholders.D This information is provided as at period end of the year shown.E Management expense ratio is based on total expenses (excluding distributions, commissions and other portfolio transaction costs) for the stated period and is expressed as an annualized percentage of daily average net asset
values during the period, including the Fund’s pro-rata share of estimated expenses incurred in any underlying investment fund, if applicable.F Effective November 1, 2014, the manager of the Fund has waived a portion of its administration fee and as of the date of the MRFP has continued to provide the Fund with such waivers. The manager may terminate the waiver
at any time, at its sole discretion. It is not known when such waivers will be terminated.G The trading expense ratio represents total commissions and other portfolio transaction costs expressed as an annualized percentage of daily average net asset value during the period, including the Fund’s pro-rata share of estimated
trading costs incurred in any underlying investment fund, if applicable.H The Fund’s portfolio turnover rate indicates how actively the Fund’s portfolio adviser manages its portfolio investments. A portfolio turnover rate of 100% is equivalent to the Fund buying and selling all of the securities in its
portfolio once in the course of the year. The higher the Fund’s portfolio turnover rate in a year, the greater the trading costs payable by the Fund in the year, and the greater chance of an investor receiving taxable capital gains in the year. There is not necessarily a relationship between a high portfolio turnover rate and the performance of the Fund. The portfolio turnover rate is calculated based on the lesser of purchases or sales of securities divided by the weighted average market value of the portfolio securities, excluding short-term securities. For periods greater than six months, but less than a full fiscal year, the portfolio turnover rate is annualized.
I For the period February 5, 2016 (commencement of sale of securities) to November 30, 2016.J Effective February 9, 2016, the manager of the Fund has waived a portion of its administration fee and as of the date of the MRFP has continued to provide the Fund with such waivers. The manager may terminate the waiver at
any time, at its sole discretion. It is not known when such waivers will be terminated.K For the period December 4, 2015 (commencement of sale of securities) to November 30, 2016.L Effective December 8, 2015, the manager of the Fund has waived a portion of its administration fee and as of the date of the MRFP has continued to provide the Fund with such waivers. The manager may terminate the waiver
at any time, at its sole discretion. It is not known when such waivers will be terminated.M For the period September 22, 2017 (commencement of sale of securities) to November 30, 2017.N Effective September 26, 2017, the manager of the Fund has waived a portion of its administration fee and as of the date of the MRFP has continued to provide the Fund with such waivers. The manager may terminate the waiver
at any time, at its sole discretion. It is not known when such waivers will be terminated.
10
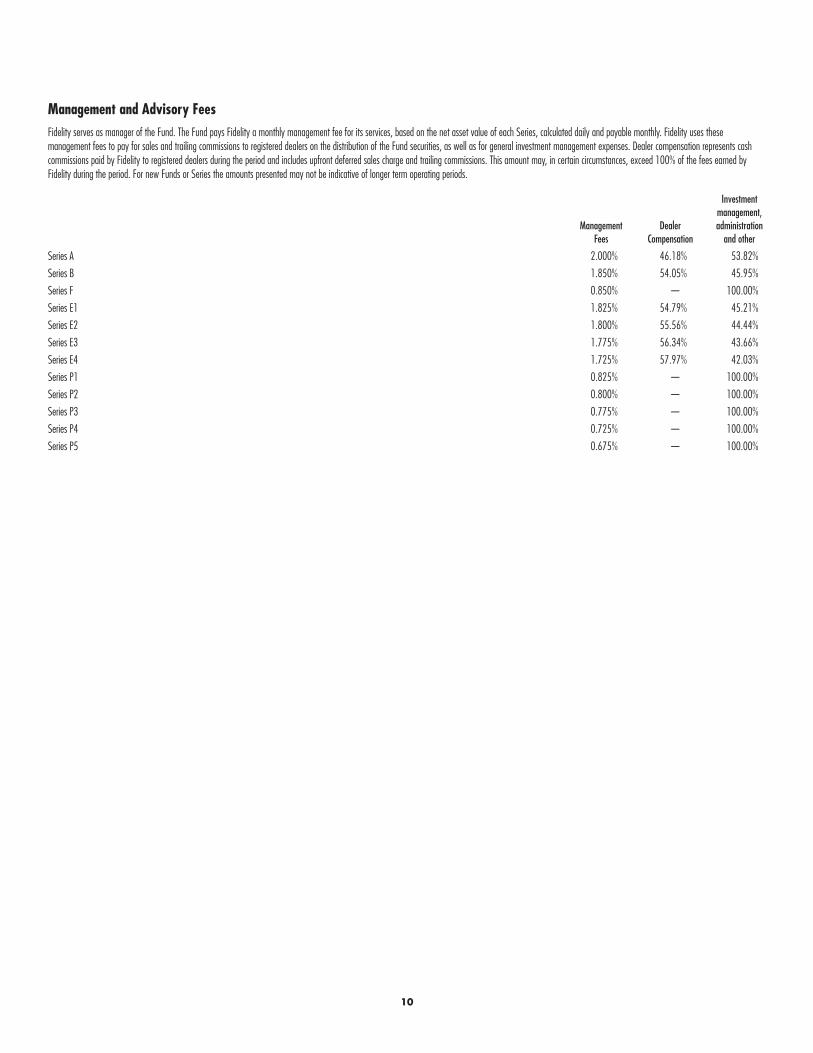
Management and Advisory FeesFidelity serves as manager of the Fund. The Fund pays Fidelity a monthly management fee for its services, based on the net asset value of each Series, calculated daily and payable monthly. Fidelity uses these management fees to pay for sales and trailing commissions to registered dealers on the distribution of the Fund securities, as well as for general investment management expenses. Dealer compensation represents cash commissions paid by Fidelity to registered dealers during the period and includes upfront deferred sales charge and trailing commissions. This amount may, in certain circumstances, exceed 100% of the fees earned by Fidelity during the period. For new Funds or Series the amounts presented may not be indicative of longer term operating periods.
Management Fees
Dealer Compensation
Investment management, administration
and other
Series A 2.000% 46.18% 53.82%
Series B 1.850% 54.05% 45.95%
Series F 0.850% — 100.00%
Series E1 1.825% 54.79% 45.21%
Series E2 1.800% 55.56% 44.44%
Series E3 1.775% 56.34% 43.66%
Series E4 1.725% 57.97% 42.03%
Series P1 0.825% — 100.00%
Series P2 0.800% — 100.00%
Series P3 0.775% — 100.00%
Series P4 0.725% — 100.00%
Series P5 0.675% — 100.00%
11
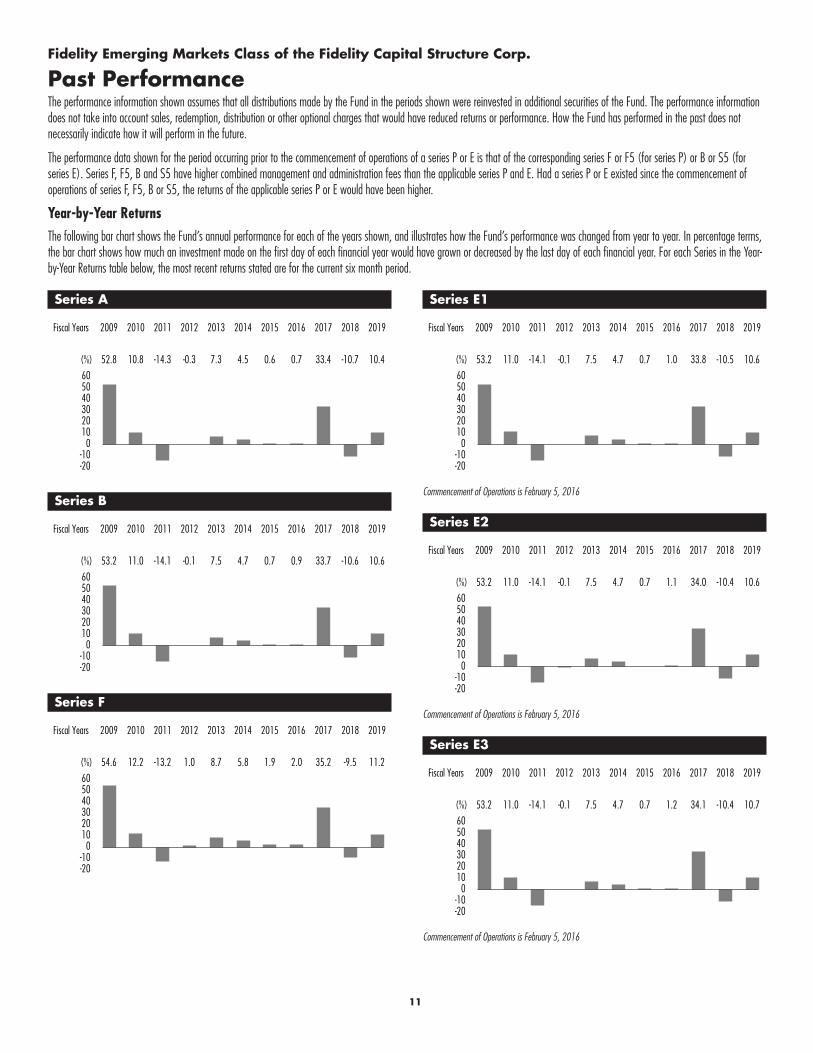
Fidelity Emerging Markets Class of the Fidelity Capital Structure Corp.
Past PerformanceThe performance information shown assumes that all distributions made by the Fund in the periods shown were reinvested in additional securities of the Fund. The performance information does not take into account sales, redemption, distribution or other optional charges that would have reduced returns or performance. How the Fund has performed in the past does not necessarily indicate how it will perform in the future.
The performance data shown for the period occurring prior to the commencement of operations of a series P or E is that of the corresponding series F or F5 (for series P) or B or S5 (for series E). Series F, F5, B and S5 have higher combined management and administration fees than the applicable series P and E. Had a series P or E existed since the commencement of operations of series F, F5, B or S5, the returns of the applicable series P or E would have been higher.
Year-by-Year ReturnsThe following bar chart shows the Fund’s annual performance for each of the years shown, and illustrates how the Fund’s performance was changed from year to year. In percentage terms, the bar chart shows how much an investment made on the first day of each financial year would have grown or decreased by the last day of each financial year. For each Series in the Year-by-Year Returns table below, the most recent returns stated are for the current six month period.
Series A
605040302010
0-10-20
2019
10.4
2018
-10.7
2017
33.4
2016
0.7
2015
0.6
2014
4.5
2013
7.3
2012
-0.3
2011
-14.3
2010
10.8
2009
52.8
Fiscal Years
(%)
Series B
605040302010
0-10-20
2019
10.6
2018
-10.6
2017
33.7
2016
0.9
2015
0.7
2014
4.7
2013
7.5
2012
-0.1
2011
-14.1
2010
11.0
2009
53.2
Fiscal Years
(%)
Series F
605040302010
0-10-20
2019
11.2
2018
-9.5
2017
35.2
2016
2.0
2015
1.9
2014
5.8
2013
8.7
2012
1.0
2011
-13.2
2010
12.2
2009
54.6
Fiscal Years
(%)
Series E1
605040302010
0-10-20
2019
10.6
2018
-10.5
2017
33.8
2016
1.0
2015
0.7
2014
4.7
2013
7.5
2012
-0.1
2011
-14.1
2010
11.0
2009
53.2
Fiscal Years
(%)
Commencement of Operations is February 5, 2016
Series E2
605040302010
0-10-20
2019
10.6
2018
-10.4
2017
34.0
2016
1.1
2015
0.7
2014
4.7
2013
7.5
2012
-0.1
2011
-14.1
2010
11.0
2009
53.2
Fiscal Years
(%)
Commencement of Operations is February 5, 2016
Series E3
605040302010
0-10-20
2019
10.7
2018
-10.4
2017
34.1
2016
1.2
2015
0.7
2014
4.7
2013
7.5
2012
-0.1
2011
-14.1
2010
11.0
2009
53.2
Fiscal Years
(%)
Commencement of Operations is February 5, 2016
12
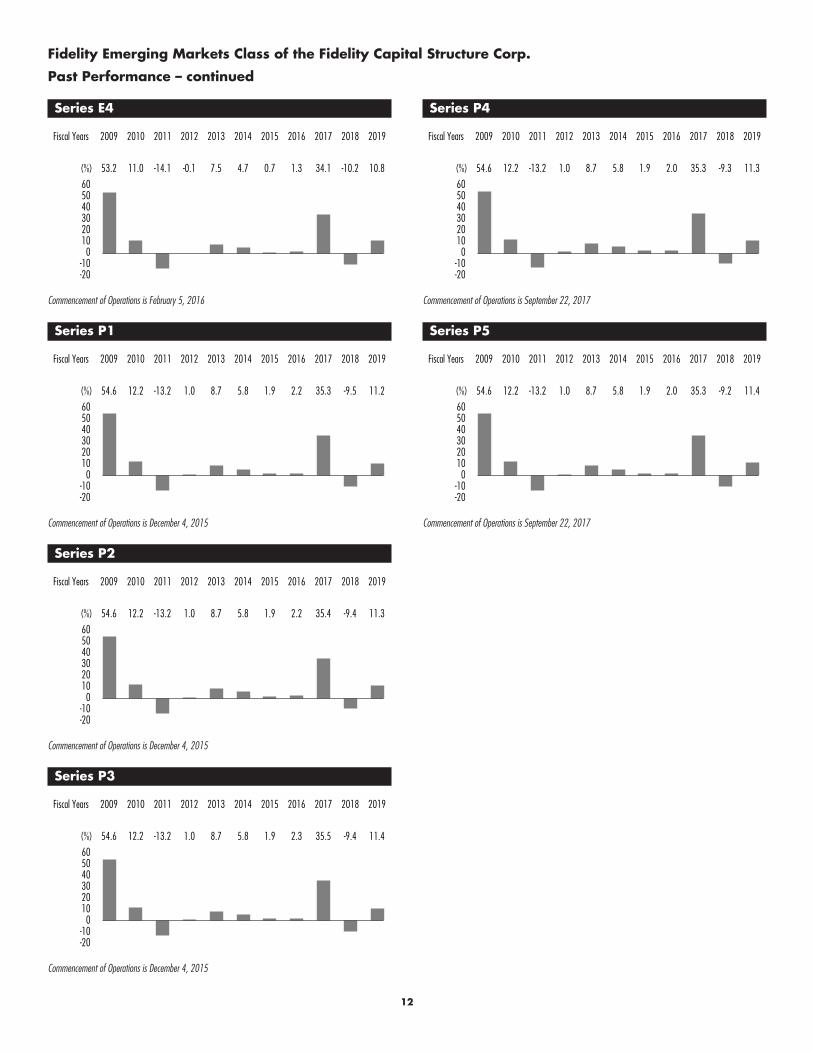
Fidelity Emerging Markets Class of the Fidelity Capital Structure Corp.
Past Performance – continued
Series E4
605040302010
0-10-20
2019
10.8
2018
-10.2
2017
34.1
2016
1.3
2015
0.7
2014
4.7
2013
7.5
2012
-0.1
2011
-14.1
2010
11.0
2009
53.2
Fiscal Years
(%)
Commencement of Operations is February 5, 2016
Series P1
605040302010
0-10-20
2019
11.2
2018
-9.5
2017
35.3
2016
2.2
2015
1.9
2014
5.8
2013
8.7
2012
1.0
2011
-13.2
2010
12.2
2009
54.6
Fiscal Years
(%)
Commencement of Operations is December 4, 2015
Series P2
605040302010
0-10-20
2019
11.3
2018
-9.4
2017
35.4
2016
2.2
2015
1.9
2014
5.8
2013
8.7
2012
1.0
2011
-13.2
2010
12.2
2009
54.6
Fiscal Years
(%)
Commencement of Operations is December 4, 2015
Series P3
605040302010
0-10-20
2019
11.4
2018
-9.4
2017
35.5
2016
2.3
2015
1.9
2014
5.8
2013
8.7
2012
1.0
2011
-13.2
2010
12.2
2009
54.6
Fiscal Years
(%)
Commencement of Operations is December 4, 2015
Series P4
605040302010
0-10-20
2019
11.3
2018
-9.3
2017
35.3
2016
2.0
2015
1.9
2014
5.8
2013
8.7
2012
1.0
2011
-13.2
2010
12.2
2009
54.6
Fiscal Years
(%)
Commencement of Operations is September 22, 2017
Series P5
605040302010
0-10-20
2019
11.4
2018
-9.2
2017
35.3
2016
2.0
2015
1.9
2014
5.8
2013
8.7
2012
1.0
2011
-13.2
2010
12.2
2009
54.6
Fiscal Years
(%)
Commencement of Operations is September 22, 2017
13
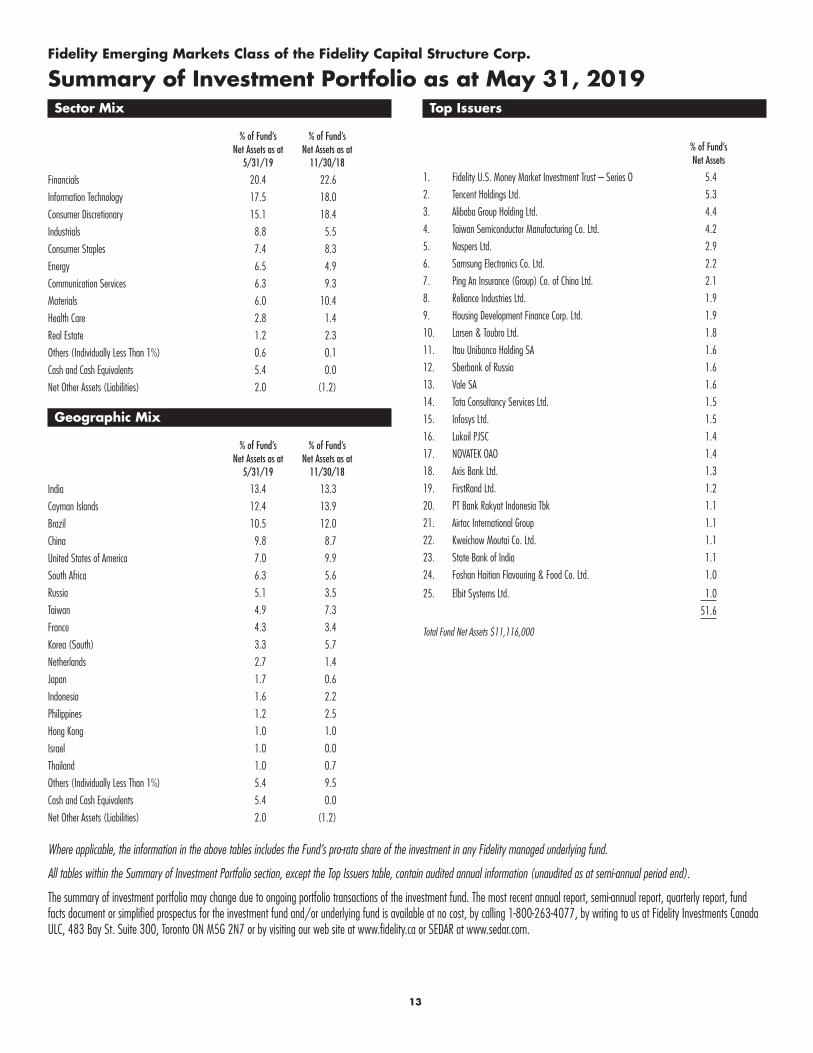
Fidelity Emerging Markets Class of the Fidelity Capital Structure Corp.
Summary of Investment Portfolio as at May 31, 2019Sector Mix
% of Fund’s Net Assets as at
5/31/19
% of Fund’s Net Assets as at
11/30/18
Financials 20.4 22.6
Information Technology 17.5 18.0
Consumer Discretionary 15.1 18.4
Industrials 8.8 5.5
Consumer Staples 7.4 8.3
Energy 6.5 4.9
Communication Services 6.3 9.3
Materials 6.0 10.4
Health Care 2.8 1.4
Real Estate 1.2 2.3
Others (Individually Less Than 1%) 0.6 0.1
Cash and Cash Equivalents 5.4 0.0
Net Other Assets (Liabilities) 2.0 (1.2)
Geographic Mix
% of Fund’s Net Assets as at
5/31/19
% of Fund’s Net Assets as at
11/30/18
India 13.4 13.3
Cayman Islands 12.4 13.9
Brazil 10.5 12.0
China 9.8 8.7
United States of America 7.0 9.9
South Africa 6.3 5.6
Russia 5.1 3.5
Taiwan 4.9 7.3
France 4.3 3.4
Korea (South) 3.3 5.7
Netherlands 2.7 1.4
Japan 1.7 0.6
Indonesia 1.6 2.2
Philippines 1.2 2.5
Hong Kong 1.0 1.0
Israel 1.0 0.0
Thailand 1.0 0.7
Others (Individually Less Than 1%) 5.4 9.5
Cash and Cash Equivalents 5.4 0.0
Net Other Assets (Liabilities) 2.0 (1.2)
Top Issuers
% of Fund’s Net Assets
1. Fidelity U.S. Money Market Investment Trust – Series O 5.4
2. Tencent Holdings Ltd. 5.3
3. Alibaba Group Holding Ltd. 4.4
4. Taiwan Semiconductor Manufacturing Co. Ltd. 4.2
5. Naspers Ltd. 2.9
6. Samsung Electronics Co. Ltd. 2.2
7. Ping An Insurance (Group) Co. of China Ltd. 2.1
8. Reliance Industries Ltd. 1.9
9. Housing Development Finance Corp. Ltd. 1.9
10. Larsen & Toubro Ltd. 1.8
11. Itau Unibanco Holding SA 1.6
12. Sberbank of Russia 1.6
13. Vale SA 1.6
14. Tata Consultancy Services Ltd. 1.5
15. Infosys Ltd. 1.5
16. Lukoil PJSC 1.4
17. NOVATEK OAO 1.4
18. Axis Bank Ltd. 1.3
19. FirstRand Ltd. 1.2
20. PT Bank Rakyat Indonesia Tbk 1.1
21. Airtac International Group 1.1
22. Kweichow Moutai Co. Ltd. 1.1
23. State Bank of India 1.1
24. Foshan Haitian Flavouring & Food Co. Ltd. 1.0
25. Elbit Systems Ltd. 1.0
51.6
Total Fund Net Assets $11,116,000
Where applicable, the information in the above tables includes the Fund’s pro-rata share of the investment in any Fidelity managed underlying fund.
All tables within the Summary of Investment Portfolio section, except the Top Issuers table, contain audited annual information (unaudited as at semi-annual period end).
The summary of investment portfolio may change due to ongoing portfolio transactions of the investment fund. The most recent annual report, semi-annual report, quarterly report, fund facts document or simplified prospectus for the investment fund and/or underlying fund is available at no cost, by calling 1-800-263-4077, by writing to us at Fidelity Investments Canada ULC, 483 Bay St. Suite 300, Toronto ON M5G 2N7 or by visiting our web site at www.fidelity.ca or SEDAR at www.sedar.com.
Fidelity’s mutual funds are sold by registered Investment Professionals. Each Fund has a simplified prospectus, which contains important information on the Fund, including its investment objective, purchase options, and applicable charges. Please obtain a copy of the prospectus, read it carefully, and consult your Investment Professional before investing. As with any investment, there are risks to investing in mutual funds. There is no assurance that any Fund will achieve its investment objective, and its net asset value, yield, and investment return will fluctuate from time to time with market conditions. Investors may experience a gain or loss when they sell their securities in any Fidelity Fund. Fidelity Global Funds may be more volatile than other Fidelity Funds as they concentrate investments in one sector and in fewer issuers; no single Fund is intended to be a complete diversified investment program. Past performance is no assurance or indicator of future returns. There is no assurance that either Fidelity Canadian Money Market Fund, Fidelity Canadian Money Market Investment Trust, Fidelity U.S. Money Market Fund or Fidelity U.S. Money Market Investment Trust will be able to maintain its net asset value at a constant amount. The breakdown of Fund investments is presented to illustrate the way in which a Fund may invest, and may not be representative of a Fund’s current or future investments. A Fund’s investments may change at any time.
1.886183.110 FICL-EMP-CS-MRFPS-0719
Fidelity Capital Structure Corp.407 2nd Street S.W., Suite 820Calgary, Alberta T2P 2Y3
Manager and RegistrarFidelity Investments Canada ULC483 Bay Street, Suite 300Toronto, Ontario M5G 2N7
CustodianState Street Trust Company of CanadaToronto, Ontario
Visit us online atwww.fidelity.caor call Fidelity Client Servicesat 1-800-263-4077
62.108549E
®Fidelity Investments is a registered trademark of Fidelity Investments Canada ULC.