Ficus carica mediated synthesis of simulated solar light ...
24
Ficus Carica Mediated Synthesis of Simulated Solar Light Driven Nano-sized Zinc Stannate Photocatalyst for the Degradation of Methylene Blue Asia Naqeeb University of Azad Jammu and Kashmir Sirajul Haq ( [email protected] ) University of Azad Jammu and Kashmir https://orcid.org/0000-0002-9424-2531 Rimsha Ehsan University of Azad Jammu and Kashmir Muhammad Imran Shahzad National Center for Physics (NCP) Nadia Shahzad National University of Science and Technology (NUST) Wajid Rehman Hazara University Mansehra Muhammad Waseem COMSATS University Islamabad (CUI) Pervaiz Ahmad University of Azad Jammu and Kashmir Umedjon Khalilov University of Antwerp and Academy of Sciences of the Republic of Uzbekistan Research Article Keywords: Environment, Methylene blue, Zinc stannate, Photocatalysis, Degradation Posted Date: April 20th, 2021 DOI: https://doi.org/10.21203/rs.3.rs-435724/v1 License: This work is licensed under a Creative Commons Attribution 4.0 International License. Read Full License
Transcript of Ficus carica mediated synthesis of simulated solar light ...
Ficus Carica Mediated Synthesis of Simulated SolarLight Driven Nano-sized Zinc StannatePhotocatalyst for the Degradation of Methylene BlueAsia Naqeeb
University of Azad Jammu and KashmirSirajul Haq ( [email protected] )
University of Azad Jammu and Kashmir https://orcid.org/0000-0002-9424-2531Rimsha Ehsan
University of Azad Jammu and KashmirMuhammad Imran Shahzad
National Center for Physics (NCP)Nadia Shahzad
National University of Science and Technology (NUST)Wajid Rehman
Hazara University MansehraMuhammad Waseem
COMSATS University Islamabad (CUI)Pervaiz Ahmad
University of Azad Jammu and KashmirUmedjon Khalilov
University of Antwerp and Academy of Sciences of the Republic of Uzbekistan
Research Article
Keywords: Environment, Methylene blue, Zinc stannate, Photocatalysis, Degradation
Posted Date: April 20th, 2021
DOI: https://doi.org/10.21203/rs.3.rs-435724/v1
License: This work is licensed under a Creative Commons Attribution 4.0 International License. Read Full License

Ficus carica mediated synthesis of simulated solar light driven nano-sized zinc
stannate photocatalyst for the degradation of methylene blue
Asia Naqeeb1, Sirajul Haq1*, Rimsha Ehsan1, Muhammad Imran Shahzad2, Nadia
Shahzad3, Wajid Rehman4, Muhammad Waseem5, Pervaiz Ahmad6, Umedjon Khalilov7,8
1Department of Chemistry, University of Azad Jammu and Kashmir, Muzaffarabad, 13100
Pakistan.
2Nanosciences and Technology Department (NS & TD), National Center for Physics (NCP),
44000 Islamabad, Pakistan.
3US-Pakistan Centre for Advanced Studies in Energy, National University of Science and
Technology (NUST), 44000 Islamabad, Pakistan.
4Department of Chemistry, Hazara University Mansehra, 21300 Pakistan.
5Department of Chemistry, COMSATS University Islamabad (CUI), Islamabad Pakistan.
6Department of Physics, University of Azad Jammu and Kashmir, 13100, Muzaffarabad,
Pakistan.
7PLASMANT research group, NANOLab Center of Excellence, University of Antwerp,
Universiteitsplein 1, 2610 Antwerp, Belgium
8Institute of Ion-Plasma and Laser Technologies, Academy of Sciences of the Republic of
Uzbekistan, 33 Durmon Yuli Street, Tashkent 100125, Uzbekistan
*Email: [email protected]
*Phone #: +92333-9698704
Abstract:
The synthesis of zinc stannate nanocomposite (Zn2SnO4 NC) was carried out using an
environment friendly process that included the use of Ficus carica (F. carica) leaves extract as a
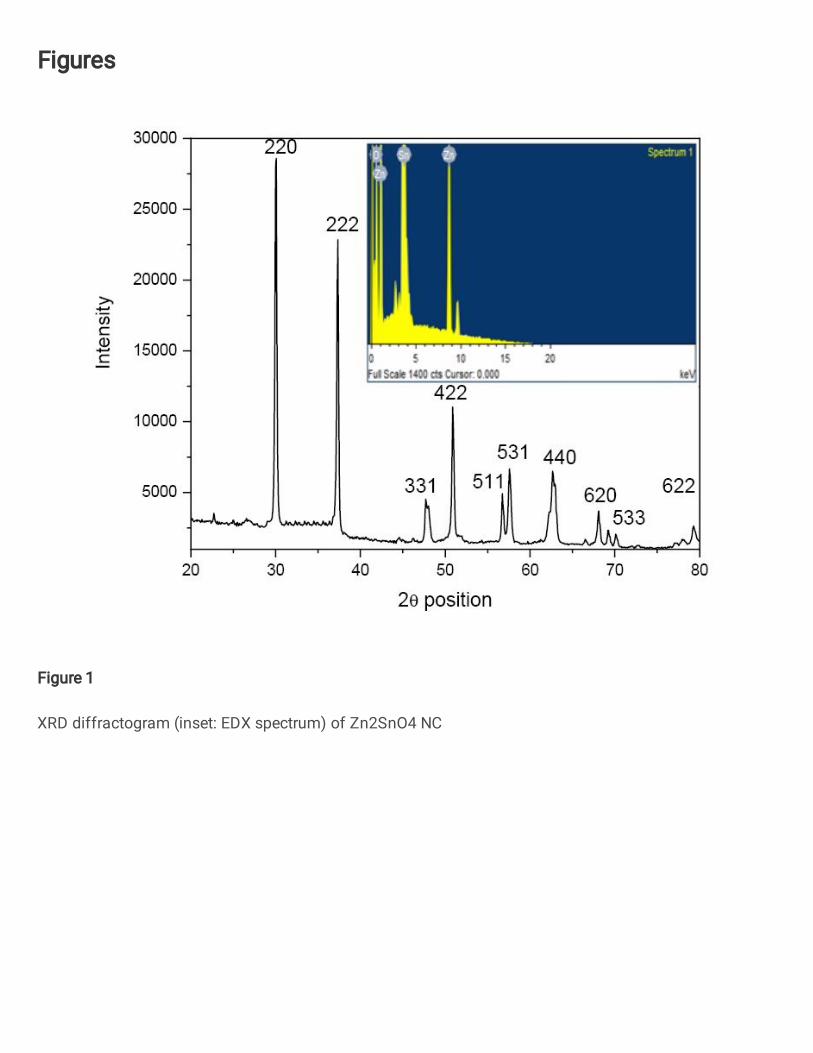
capping and reducing agent. X-ray diffraction (XRD) analysis was used to analyze the structural
and crystallographic parameters, and the crystallite was discovered to have cubic geometry. The
elemental composition of the studied Zn2SnO4 NC was investigated using energy dispersive X-
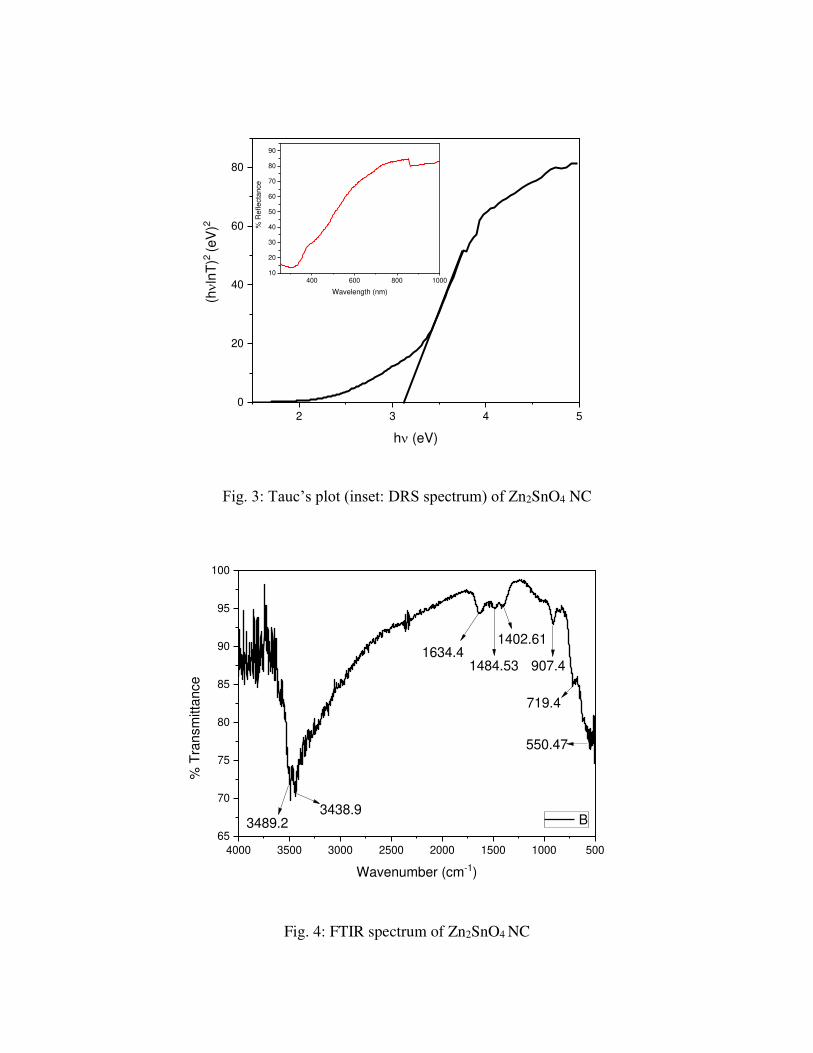
ray (EDX), which revealed that it was extremely pure. The band gap (3.12 eV) was calculated
through Tauc plot using diffuse reflectance (DRS) data where the functional groups were
explored through Fourier transform infrared (FTIR) spectroscopy. Prior to the photocatalytic
reaction, some preliminary experiments were performed, which proposed that pH 9 is suitable
for the mineralization of methylene blue (MB) (10 ppm) in the presence of 20 mg of Zn2SnO4
NC and simulated solar light. The 96 % of MB was degraded in 80 min with the degradation rate
of 0.038 min-1.
Keywords: Environment; Methylene blue; Zinc stannate; Photocatalysis; Degradation.
1. Introduction
The environmental pollution are mainly attributed to the diversifying urbanization and
industrialization. Water and soil pollution is caused by the industrial effluents that have been
discharged into environment, having negative impacts on all living organism [1]. The high
concentration of chemicals, dyes and heavy metals are released into water bodies from dyeing
industries polluting the ground and surface water and make it unfit for drinking [2]. Water
adulteration via dye discharge from several industries (food processing, paints, cosmetics, textile
dyeing, paper making) has captivated major attention because of risk to ecosystem and public
health [3]. The making of synthetic dyes is above 7 lac tons/year and greater than 15% of this
synthetic colorant is expelled into water per annum and are proved to be mutagenic, xenobiotic
and carcinogenic to living organisms [4]. Dyes effluents from the industries like cosmetic, food,
dye synthesis, pulp mill, electroplating, textile, paper, and printing are caused water pollution.
The xenobiotic properties and complicated aromatic structure of dyes form them arduous to
mineralize. A few of the organic dyes and their related products have mutagenic and
carcinogenic effects on humans. There is an urgent need to treat the dyes before their release into
the water bodies [5]. Methylene blue (MB), a cationic dye and has many applications including
silk, wood, and dying cotton. However MB is not believed to be extremely noxious but it can
produce some detrimental results such as quadriplegia, jaundice, cyanosis, shock, diarrhea,
increased heart rate, vomiting, and tissue deathin human being. Consecutively, MB containing
wastewater should be managed properly before letting out into the water bodies [6].
Various biological, chemical, and physical techniques are used for the elimination of unwanted
hazardous compounds from contaminated water comprising membrane separation, advanced

oxidation, coagulation and adsorption, precipitation, reverse osmosis, and membrane processes
[7]. The methods reported to eliminate the dyes from aqueous solution were of physical and
chemical nature but these methods are highly expensive and less efficient for the dye
degradation. The stability of these dyes is maintained by using chemicals which are toxic in
nature and thus add to the toxicity of the environment[8]. Among these, photocatalysis is one of
the most important processes. Photocatalysis is widely used for many applications in treatment of
wastewater and manifested a fair approach for the abolition of inorganic and organic pollutants
including organic dyes, oil leakage, and pesticides that cannot be degraded in natural forms.
Nano photocatalysis is a versatile oxidation process, utilized in the eradication of very minute
amount of pollutant from air and water streams. It is more efficacious than conventional methods
due to the large surface area- to- volume ratio, uniform and controlled particle size, structure,
composition. Among nanophotocatalysts, nanocomposites are preferred because they are
efficient, economic and easy to synthesize [9]. The binary composites oxides render the electron-
hole recombination process thus increasing the photocatalytic activity. Zinc stannate is a tertiary
oxide semiconductor having band gap (∼3.6 eV) and termed as zinc tin oxide (ZTO)[10]. The
Zn2SnO4 depict wide-band semiconductor oxides with the conductivity of n-type, (transparent
within the visible light region), they are optimistic for applications in the fields of gas sensors,
lithium-ion batteries, solar cells, transparent conductors, lead-free ferroelectrics and photo
catalysis[11]. Depending on the molar ratio of the primary components (Sn, Zn and O), this
material exists in two states: ZnSnO3 of the perovskite-type structure and Zn2SnO4 of the spinel-
type structure[12]. Different approaches are used for the preparation of zinc stannate
nanocomposite including thermal evaporation calcinations, sol-gel synthesis, mechanical
grinding, hydrothermal, and ion-exchange methods. However, these methods not user friendly
due to the wide use of toxic chemical reagents and expensive instruments(Baruah sand Dutta
2011). The green method is one of the most effective, safe and low cost process and is a possible
alternate of the conventional methods[14].
The present study was conducted to mineralize MB from aqueous solution on illumination of
simulated solar light irradiation using Zn2SnO4 NC as photocatalyst. The Zn2SnO4 NC was
synthesized via ecofriendly and economic process using F. carica leaves extract which belongs
to the family Moraceae [15]. The physicochemical properties was analyzed through FTIR, DRS,
EDX, XRD, and SEM techniques. The photocatalytic degradation of MB was examined under
the effects of initial concentration, pH and catalyst dose. The stability of the Zn2SnO4 NC as
photocatalyst was also evaluated for several stage degradation process.
2. Materials and Methods
2.1. Materials
Analytical-grade chemicals were used in this research work. The zinc chloride dihydrate,
tin chloride dihydrate, sodium hydroxide, and methylene blue were given by Sigma Aldrich and
were used without further purification. All of the requisite solutions were made with deionized
water. The botany department classified the F. carica leaves that were collected from the
chemistry department's lawn.
2.2. Preparation of Extract
The F. carica leaves were picked, washed in deionized water to remove dust, and then dried in
the shade. To make the extract, 50 g of dried leaves were placed in an airtight jar with 1000 mL
boiled and deionized water and left for 24 hours. The crude extract was then purified and
centrifuged for 10 minutes at 4000 rpm, with the upper layer being saved for future experiments.
2.3. Synthesis of Zn2SnO4 NC
For the fabrication of Zn2SnO4 NC, the calculated amount (1.05 g) of ZnCl2.2H2O was
solvated in 50 mL deionized water and 20 mL of the prepared plant extract was introduced. The
pH of the reaction mixture was fixed at 10 by dropwise addition 0.1 molar solution of NaOH and
was then stirred (250 rpm) and heated (50 °C) for 30 min. The white gel formed was aged at
room temperature for 6 h. At the same time, the SnCl2.2H2O (0.95 g) was solvated in 50 mL
deionized water and 20 mL of the plant extract was introduced and stirred (250 rpm) and heated
(50 °C) for 30 min and white gel formed that was aged for 6 h. Afterward, both the gel were
mixed with constant stirring (300 °C) and heating (50 °C) for 5 h at room temperature and was
then aged for 24 h. The final product was repeatedly washed with deionized water and was oven
dried at 150 °C and stored in air tight polyethylene bottle.
2.4. Characterization

The different physicochemical techniques were utilized for the inspection of the
structural and surface properties of the synthesized Zn2SnO4 NC. The XRD model Panalytical X-
Pert Pro was utilized to analyze the crystalline nature of powder. The XRD quantification was
made of 20° to 80° in 2θ range and Debye-Scherrer equation was employed for determining the
average crystallite size. Morphology was studied by using SEM model JEOL 5910 (Japan). The
band gap was determined from data obtained by running DRS (lambda 950) in the 400-1000 nm
range using Tauc's plot. The material's elemental analysis was performed on an EDX model
INCA200 (UK) operating in the 1-20 keV scale. The FTIR spectrum was recorded using a
Nicolet 6700(USA) spectrometer in the range of 4000–400 cm-1 [16].
2.5. Photocatalytic activity
During the photocatalytic removal of MB, the photocatalytic behavior of the as-
synthesized Zn2SnO4 NC was examined. To begin, a 10 ppm MB solution was made in
deionized water, and 50 mL of that solution was poured into a reaction vessel, along with 20 mg
of Zn2SnO4 NC. The reaction mixture was mixed in the dark for 30 min to obtain the adsorption-
desorption equilibrium. The solution was then subjected to artificial solar radiation. To extract
the catalyst, the 3 mL sample was centrifuged at 4000 rpm for 4 min after a fixed time interval
(in min). On a spectrophotometric analysis of the centrifuged sample using a double beam
spectrophotometer, the absorbance limit was recorded as a function of time (Thermo Spectronic
UV 500).
3. Results and discussion
3.1. Physicochemical study
The diffractogram shown in Fig. 1 possess characteristics Bragg’s reflections at 2θ positions with
hkl values 30.05(220), 37.32(222), 47.63(331), 50.90 (422), 56.75(511), 57.65(531), 62.70(440),
68.12(620), 70.10(533) and 79.35(622). These bands correspond to those listed in JCPDS card
00-024-1470, which confirm the synthesis of Zn2SnO4 NC having Fd3m space group and cubic
geometry. The length of three coordinates (a,b and c) of the cubic Zn2SnO4 NC are equal to
8.5674 Ǻ whereas the angles alpha, beta and gamma are of 90°. The intense and sharp diffraction
bands confirm the formation of well crystalline nanostructures and all peaks were assigned to the
desired elements, suggesting the synthesized samples are highly pure. The crystallite size for

Zn2SnO4 NC was quantified by Debye-Scherrer’s equation is 42.47 nm along with 0.32 %
imperfection was also found in the crystal.
(Position for Fig.1)
The EDX spectrum of Zn2SnO4 NC shown as inset in Fig. 1, exhibits the bands assigned to Sn,
Zn and O, which confirm the synthesis of highly pure Zn2SnO4 NC. The peaks in the range of
3.4 to 3.9 keV are attributed to Sn along with a sharp signal at 0.4 keV is credited to O in the
sample. The three bands at 1, 8.7 and 9.6 keV are due to the Zn and the weight percentages
derived from the EDX data for Zn, Sn, and O are 42.95, 36.33 and 20.71 % respectively. The
SEM micrographs (low and high magnification)given in Fig.2, shows randomly arranged intra-
particles cavities. The small particles areclosely connected with each other forming larger
various shaped structures specially the cauliflower like at the right lower corner of the image (b).
On close observation, small individual particles with almost uniform shape are present on the
surface of the complex structures. The histogram located on the left corner of image (a) shows
two sharp peaks at 50 and 104 suggesting that theparticles size is ranging from 50 to 104 nm
with the average of 79 nm.
(Position for Fig. 2)
The electronic state of the Zn2SnO4 NC was calculated using the transmittance spectrum, which
indicates that all of the samples are translucent over a broad wavelength range. The band gap
energies were determined using the Tauc relation (eq.1), where B is constant, hv is the light
intensity, is the absorption coefficient, and the exponent n is depending on the type of transition:
direct, forbidden direct, indirect, or forbidden indirect, and can have values of 1/2, 2, 3/2, or 3
respectively [17].
𝛼ℎ𝑣 = 𝐵(ℎ𝑣 − 𝐸𝑔)𝑛 (eq.1)
The α and transmittance are correlated as given in eq. 2, where L is the thickness of the
sample for direct allowed transition (n=1/2), by combining eq. 1 and eq. 2, we have;
𝑇 = exp(−𝛼𝐿) 𝑂𝑅𝛼 = − 𝑙𝑛𝑇 𝐿⁄ (eq.2)
(ℎ𝑣𝑙𝑛𝑇)2 = 𝐵2𝐿2(ℎ𝑣 − 𝐸𝑔) (eq.3)

(Position for Fig. 3)
The band gap energies were calculated for Zn2SnO4 NC from Tauc plots by joining sharp rising
portion with horizontal axis of the (hvlnT)2 against hv is 3.12 eV [18,19]. The band gap energy
for Zn2SnO4 NC is divergent from that of SnO2 NPs and ZnO NPs suggesting that the production
of new species and all the deduced band gap energies are in accordance with the reported data
[20–25]. In the FTIR spectrum of Zn2SnO4 NC (Fig.4), the peaks at 3489.2, 3438.9 and 1634.4
cm-1 are because of the deformation, stretching and bending vibrations of adsorbed water
molecules[26]. The stretching vibration of O-Sn-O in the lattice system and potential bonding of
Zn in ZnO are attributed to the small broad peaks at 1484.53 and 1402.61 cm-1, respectively [22].
The stretching vibrations of ZnO and SnO2 pairs, which can be due to the Sn-O-Zn bonding in
Zn2SnO4, are responsible for the peaks at 719.4 and 550.47 cm-1 [27].
(Position for Fig.4)
3.2.Photocatalytic study
The photocatalytic potency of Zn2SnO4 NC was analyzed to degrade MB with the catalyst
concentration of 20mg on irradiating simulated solar light. The visual photodegradation of MB
was observed due to the fading of color with the increase in irradiation time. The eq. 4 was used
to determine the percentage degradation (Fig. 5), that inferred 96% of the dye was mineralized in
80 min of contact with the catalyst under simulated solar light. The self-photolysis was also
performed on irradiation of simulated solar light without introducing catalyst and it was observed
that there was a minor reduction of the original concentration of the MB solution which assures
the stability of the MB dye. This infers that the Zn2SnO4NC is highly effective and the dye
would not be degraded without it. The Langmuir-Hinshelwood kinetic model (eq. 5) was applied
for the kinetic modeling of the kinetic data whereC is the concentration at time (t),Ce is the initial
concentration whereas k is the rate constant. A straight line is obtained by plotting ln(C/Co)
versus time (t) shows that the photocatalytic degradation reaction obeys pseudo first order
kinetics and the k value was found to be 0.038 min-1.
% 𝐷𝑒𝑔𝑟𝑎𝑑𝑎𝑡𝑖𝑜𝑛 = Ct−Co𝐶𝑜 × 100 (eq.4)
ln (𝐶 𝐶𝑜) = −𝑘𝑡⁄ (eq.5)

(Position for Fig. 5)
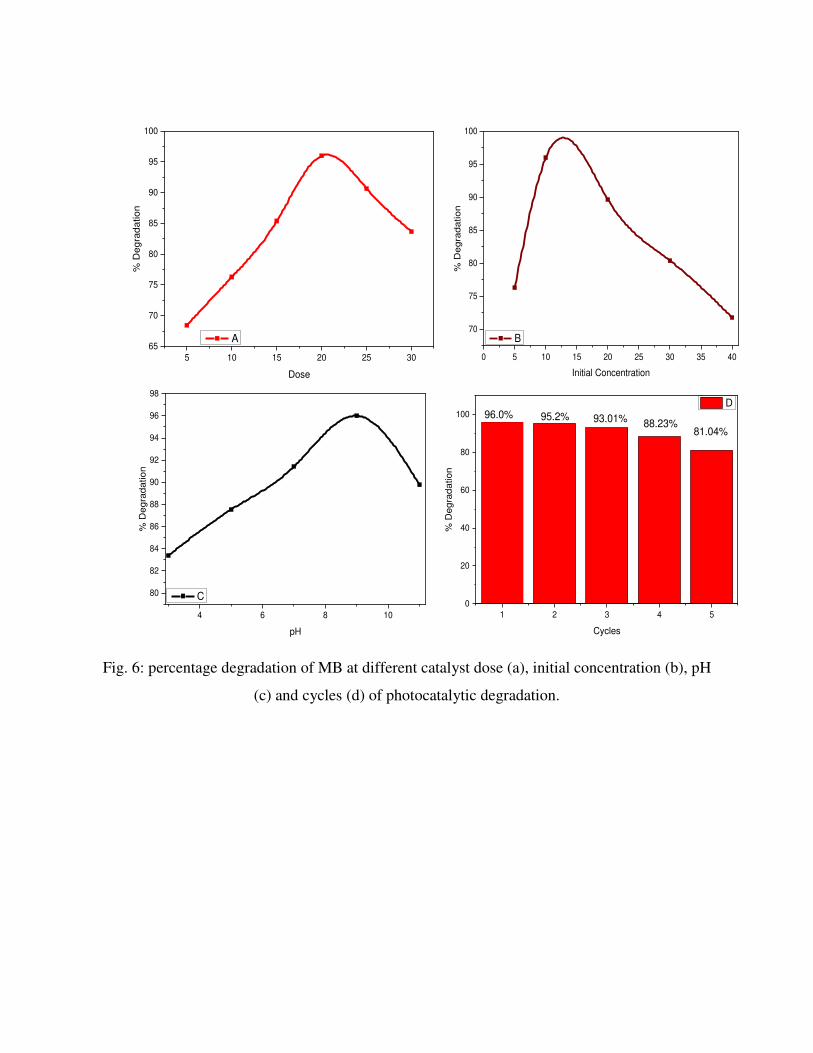
Dosage study
The 10 ppm MB was exposed different quantities of the Zn2SnO4 NC (5, 10, 15, 20, 25 and 30
mg) to check the affect of catalyst dosage on the catalytic mineralization process. From the
experiment Fig. 6(A), it was inferred that the degradation of MB increases with increasing the
dose of catalyst up to 20 mg while further elevation in the dose reduced the degradation process.
This decrease in the degradation is attributed to the phenomenon of deactivation of catalyst.
When large amount of catalyst is introduced to the solution collision ensues between the
activated and the ground state catalyst that leads to the deactivation of the activated molecules
and consequently degradation decreases [28].
3.2.1. Initial concentration study
In the present work, 5, 10, 20, 30 and 40 ppm MB solutions were unveiled to the Zn2SnO4 NC to
scrutinize the effect of dye concentration on the photocatalytic mineralization. The results shows
Fig. 6(B)that the degradation increases with increasing initial concentration of MB up to 10 ppm
whereas gradual decrease was observed with increasing initial concentration. On increasing dye
concentration the MB molecules begin to absorb light and so the catalyst cannot absorb sufficient
light and thus the dye removal efficiency of the catalyst reduced. This also because of the
adsorption of large number of MB molecules on the surface of Zn2SnO4 NC at higher
concentration results into the blocking of the active sits and thus reduce the degradation[28].
3.2.2. pH study
The pH of the solution is the key parameter that significantly affects surface properties of
catalyst. The pH study on photocatalytic degradation of MB was evaluated in pH range of 3 to 11
using 10 ppm dye solution and exposed 20 mg of Zn2SnO4 NC as shown in Fig. 6(C). The
upshots inferred that the percentage degradation of MB was maximum at pH 9 as compared to
other studied pH. MB being a cationic dye shows maximum degradation in the alkaline medium
and maximum degradation is exhibited at pH 9 and the activity decreased with further increased.
The enhanced activity at pH is attributed to formation of hydroxyl ions that are accountable for

the production of hydroxyl radicals. The low degradation at pH 11 is might be due to the
dissociation of Zn2SnO4 NC, thus optimum pH for the degradation of MB is 9[29].
3.2.3. Reusability study
The stability of the Zn2SnO4 NPs in term of its reusability was analyzed against the five-fold
degradation of the MB. The experiment was performed by the addition of fresh MB solution by
degrading the previous one under same conditions for five times. The Fig. 6(d) shows that there
is a negligible reduction in the efficiency of the Zn2SnO4catalystafter three cycles and decrease
on the efficiency of the catalyst that is ascribed to the surface coverage of the catalyst.
Overlooking to the photocatalytic efficiency, the Zn2SnO4NCis the most appropriate catalyst to
be used for degradation of organic pollutants under simulated solar light and it can be effectively
used for various stage reactions.
(Position for Fig. 6)
3.2.4. Photocatalytic mechanism
Photocatalysis is a kind of reaction that proceeds on the expense of energy that is equal or higher
than the band gap of the catalyst. The electrons move from the valance band to the conduction
band on irradiating of semiconductor with a light source. After effect equal number of holes are
engendered in valence band. All types of microbial, organic, and inorganic contaminants owing
to their redox potential are degrading via photo-generated holes and electrons. They react with
adsorbed electron acceptors and electron donors by migrating to the surface to produce hydroxyl
radicals, hydrogen peroxides, superoxide radical anions. The hydroxyl radical reacts with
aqueous solution resultantly producing innocuous compounds. Under same reaction conditions,
the organic pollutants are thoroughly oxidized to halide ions, H2O and CO2 on negligible
production of displeasing by-products [9]. In the present study, the reaction mixture was
irradiated with the simulated solar light and the electrons of both the oxides get excited to
conduction and the holes are generated in the valance band. The electrons and the holes are
adequately separated as the holes get assembled in the VB of ZnO while they were generated in
the VB of SnO2 similarly, electrons get shifted to the CB of SnO2 from the CB of ZnO. Later the
●OH and O2-● are produced by the reaction of holes (h+) and electrons (e-) with the water and

absorbed oxygen respectively. The O2-● free radical serve as an additional source of producing
●OH radicals which then lead to the degradation of the MB to non-toxic material [16].
4. Conclusion
The manipulation of plant materials for the fabrication of nanomaterials is the most effective,
economical and nontoxic route. The investigated physicochemical properties confirm the highly
crystalline nature of Zn2SnO4 NC with band gap of 3.13 eV was found most efficient catalyst for
the photodegradation of MB. The operational parameters like pH, initial concentration of MB
and catalyst dose govern the photocatalytic mineralization of MB. The photocatalytic reaction
was found to follow first order kinetic and 96 % MB was deteriorated in 80 min with the rate of
degradation 0.038 min-1 at pH 9 and catalyst dose of 20 mg. This study reveals that the Zn2SnO4
NC is an efficient, economical and stable photocatalyst for the remediation of organic pollutants.
References
[1] A. Salama, A. Mohamed, N.M. Aboamera, T.A. Osman, A. Khattab, Photocatalytic
degradation of organic dyes using composite nanofibers under UV irradiation, Applied
Nanoscience (Switzerland). 8 (2018) 155–161. doi:10.1007/s13204-018-0660-9.
[2] D.N. S, Impact of Dyeing Industry Effluent on Groundwater Quality by Water Quality
Index and Correlation Analysis Journal of Pollution Effects & Control, 2 (2014) 2–5.
doi:10.4172/2375-4397.1000126.
[3] P. Zhu, Z. Ren, R. Wang, M. Duan, L. Xie, J. Xu, Preparation and visible photocatalytic
dye degradation of, 14 (2020) 33–42.
[4] H. Anwer, A. Mahmood, J. Lee, K. Kim, J. Park, A.C.K. Yip, Photocatalysts for
degradation of dyes in industrial effluents : Opportunities and challenges, 12 (2019) 955–
972.
[5] T. Liu, Y. Li, Q. Du, J. Sun, Y. Jiao, G. Yang, Z. Wang, Y. Xia, W. Zhang, K. Wang, H.
Zhu, D. Wu, Adsorption of methylene blue from aqueous solution by graphene, Colloids
and Surfaces B: Biointerfaces. 90 (2012) 197–203. doi:10.1016/j.colsurfb.2011.10.019.
[6] Y. Li, Q. Du, T. Liu, X. Peng, J. Wang, J. Sun, Y. Wang, S. Wu, Z. Wang, Y. Xia, L. Xia,
Comparative study of methylene blue dye adsorption onto activated carbon, graphene
oxide, and carbon nanotubes, Chemical Engineering Research and Design. 91 (2013) 361–
368. doi:10.1016/j.cherd.2012.07.007.
[7] M. Fakhrzad, A.H. Navidpour, M. Tahari, S. Abbasi, Synthesis of Zn2SnO4 nanoparticles
used for photocatalytic purposes, Materials Research Express. 6 (2019).
doi:10.1088/2053-1591/ab2eb5.
[8] I. Khan, K. Saeed, I. Khan, Nanoparticles : Properties , applications and toxicities,
Arabian Journal of Chemistry. 12 (2019) 908–931. doi:10.1016/j.arabjc.2017.05.011.
[9] V.C. Padmanaban, M.S. Giri Nandagopal, G. Madhangi Priyadharshini, N. Maheswari, G.
Janani Sree, N. Selvaraju, Advanced approach for degradation of recalcitrant by
nanophotocatalysis using nanocomposites and their future perspectives, International
Journal of Environmental Science and Technology. 13 (2016) 1591–1606.
doi:10.1007/s13762-016-1000-9.
[10] S. Danwittayakul, M. Jaisai, T. Koottatep, J. Dutta, Enhancement of photocatalytic
degradation of methyl orange by supported zinc oxide nanorods/zinc stannate (ZnO/ZTO)
on porous substrates, Industrial and Engineering Chemistry Research. 52 (2013) 13629–
13636. doi:10.1021/ie4019726.
[11] S. Sagadevan, J. Singh, K. Pal, Z. Zaman, Hydrothermal synthesis of zinc stannate
nanoparticles spectroscopic investigation, Journal of Materials Science: Materials in
Electronics. 0 (2017) 0. doi:10.1007/s10854-017-6916-4.
[12] S.S. Nalimova, A.I. Maksimov, L.B. Matyushkin, V.A. Moshnikov, Current State of
Studies on Synthesis and Application of Zinc Stannate ( Review ), 45 (2019) 251–260.
doi:10.1134/S1087659619040096.
[13] S. Baruah, J. Dutta, Zinc Stannate Nanostructures : Hydrothermal Synthesis Zinc stannate
nanostructures : hydrothermal synthesis, (2011). doi:10.1088/1468-6996/12/1/013004.
[14] V.N. Kalpana, V.D. Rajeswari, A Review on Green Synthesis , Biomedical Applications ,
and Toxicity Studies of ZnO NPs, 2018 (2018).
[15] C.M. Chetty, Antioxidant Properties of Ficus Species – A Review, 2 (2010) 2174–2182.
[16] S. Shoukat, W. Rehman, S. Haq, M. Waseem, A. Shah, Synthesis and characterization of
zinc stannate nanostructures for the adsorption of chromium (VI) ions and photo-
degradation of rhodamine 6G, Materials Research Express. 6 (2019) 1–12.
doi:10.1088/2053-1591/ab473c.
[17] M. Dehbashi, M. Aliahmad, Experimental study of structural and optical band gap of
nickel doped tin oxide nanoparticles, International Journal of Physical Sciences. 7 (2012)
5415–5420. doi:10.5897/IJPS11.1606.
[18] F. Gu, S.F. Wang, C.F. Song, M.K. Lü, Y.X. Qi, G.J. Zhou, D. Xu, D.R. Yuan, Synthesis
and luminescence properties of SnO2 nanoparticles, Chemical Physics Letters. 372 (2003)
451–454. doi:10.1016/S0009-2614(03)00440-8.
[19] V. Vinoth, T. Sivasankar, A.M. Asiri, J.J. Wu, K. Kaviyarasan, S. Anandan,
Photocatalytic and photoelectrocatalytic performance of sonochemically synthesized
Cu2O@TiO2 heterojunction nanocomposites, Ultrasonics Sonochemistry. 51 (2018) 223–
229. doi:10.1016/j.ultsonch.2018.10.022.
[20] B. Venugopal, B. Nandan, A. Ayyachamy, V. Balaji, S. Amirthapandian, B.K. Panigrahi,
T. Paramasivam, Influence of manganese ions in the band gap of tin oxide nanoparticles:
structure, microstructure and optical studies, RSC Advances. 4 (2014) 6141.
doi:10.1039/c3ra46378h.
[21] B. Baruwati, D.K. Kumar, S. V. Manorama, Hydrothermal synthesis of highly crystalline
ZnO nanoparticles: A competitive sensor for LPG and EtOH, Sensors and Actuators, B:
Chemical. 119 (2006) 676–682. doi:10.1016/j.snb.2006.01.028.
[22] M. Zhang, T. An, X. Hu, C. Wang, G. Sheng, J. Fu, Preparation and photocatalytic
properties of a nanometer ZnO-SnO 2 coupled oxide, Applied Catalysis A: General. 260
(2004) 215–222. doi:10.1016/j.apcata.2003.10.025.
[23] M.B. Ali, F. Barka-Bouaifel, H. Elhouichet, B. Sieber, A. Added, L. Boussekey, M. Ferid,
R. Boukherroub, Hydrothermal synthesis , phase structure , optical and photocatalytic

properties of Zn2SnO4 nanoparticles, Journal of Colloid And Interface Science. 457
(2015) 360–369. doi:10.1016/j.jcis.2015.07.015.
[24] S. Haq, W. Rehman, M. Waseem, R. Javed, Mahfooz-ur-Rehman, M. Shahid, Effect of
heating on the structural and optical properties of TiO2 nanoparticles: antibacterial
activity, Applied Nanoscience. 8 (2018) 11–18. doi:10.1007/s13204-018-0647-6.
[25] A.N. Naje, A.S. Norry, A.M. Suhail, Preparation and Characterization of SnO 2
Nanoparticles, Int. J. Innov. Res. Sci. Eng. Technol. 2 (2013) 7068–7072.
doi:10.1088/0957-4484/13/5/304.
[26] S. Haq, S. Shoukat, W. Rehman, M. Waseem, A. Shah, Green fabrication and
physicochemical investigations of zinc-cobalt oxide nanocomposite for wastewater
treatment, Journal of Molecular Liquids. 318 (2020) 114260.
doi:10.1016/j.molliq.2020.114260.
[27] M.M. Rashad, A.A. Ismail, I. Osama, I.A. Ibrahim, A.H.T. Kandil, Photocatalytic
decomposition of dyes using ZnO doped SnO2 nanoparticles prepared by solvothermal
method, Arabian Journal of Chemistry. 7 (2014) 71–77. doi:10.1016/j.arabjc.2013.08.016.
[28] S. Alkaykh, A. Mbarek, E.E. Ali-Shattle, Photocatalytic degradation of methylene blue
dye in aqueous solution by MnTiO3 nanoparticles under sunlight irradiation, Heliyon. 6
(2020) e03663. doi:10.1016/j.heliyon.2020.e03663.
[29] T. Nguyen, T. Thu, N.N. Thi, V.T. Quang, K. Nguyen, Synthesis , characterisation , and
effect of pH on degradation of dyes of copper-doped TiO2, Journal of Experimental
Nanoscience. 11 (2016) 226–238. doi:10.1080/17458080.2015.1053541.

List of Figures
20 30 40 50 60 70 80
5000
10000
15000
20000
25000
30000
622
533620
440531
511
422
331
222
Inte
nsity
2q position
220
Fig. 1: XRD diffractogram (inset: EDX spectrum) of Zn2SnO4 NC
Fig. 2: Low (a) (inset: histogram) and High (b) magnification SEM micrographs of Zn2SnO4 NC
2 3 4 5
0
20
40
60
80
400 600 800 100010
20
30
40
50
60
70
80
90
% R
eflecta
nce
Wavelength (nm)
(hnl
nT
)2 (e
V)2
hn (eV)
Fig. 3: Tauc’s plot (inset: DRS spectrum) of Zn2SnO4 NC
4000 3500 3000 2500 2000 1500 1000 500
65
70
75
80
85
90
95
100
550.47
1402.61
Wavenumber (cm-1)
B
1634.4907.4
3438.9
1484.53
3489.2
719.4
% T
ran
sm
itta
nce
Fig. 4: FTIR spectrum of Zn2SnO4 NC

Fig. 5: Degradation profile (C/Co) (a), percentage degradation (b), kinetic plot (c) and schematic
degradation mechanism of MB in the presence of Zn2SnO4 NC
0 10 20 30 40 50 60 70 80 90
-3.5
-3.0
-2.5
-2.0
-1.5
-1.0
-0.5
0.0
ln C
/Co
Time (min)
0 20 40 60 80
0
20
40
60
80
100
% D
eg
rad
atio
n
Time (min)
without Zn2SO4
with Zn2SO4
0 20 40 60 80
0.0
0.2
0.4
0.6
0.8
1.0
C/C
o
Time (min)
without Zn2SO4
with Zn2SO4
(c)
(b)(a)
1 2 3 4 5
0
20
40
60
80
100
% D
eg
rad
atio
n
Cycles
D96.0% 95.2% 93.01% 88.23%
81.04%
0 5 10 15 20 25 30 35 40
70
75
80
85
90
95
100
% D
egra
dation
Initial Concentration
B
4 6 8 10
80
82
84
86
88
90
92
94
96
98
% D
egra
dation
pH
C
5 10 15 20 25 30
65
70
75
80
85
90
95
100%
De
gra
datio
n
Dose
A
Fig. 6: percentage degradation of MB at different catalyst dose (a), initial concentration (b), pH
(c) and cycles (d) of photocatalytic degradation.
Figures
Figure 1
XRD diffractogram (inset: EDX spectrum) of Zn2SnO4 NC

Figure 2
Low (a) (inset: histogram) and High (b) magni�cation SEM micrographs of Zn2SnO4 NC

Figure 3
Tauc’s plot (inset: DRS spectrum) of Zn2SnO4 NC
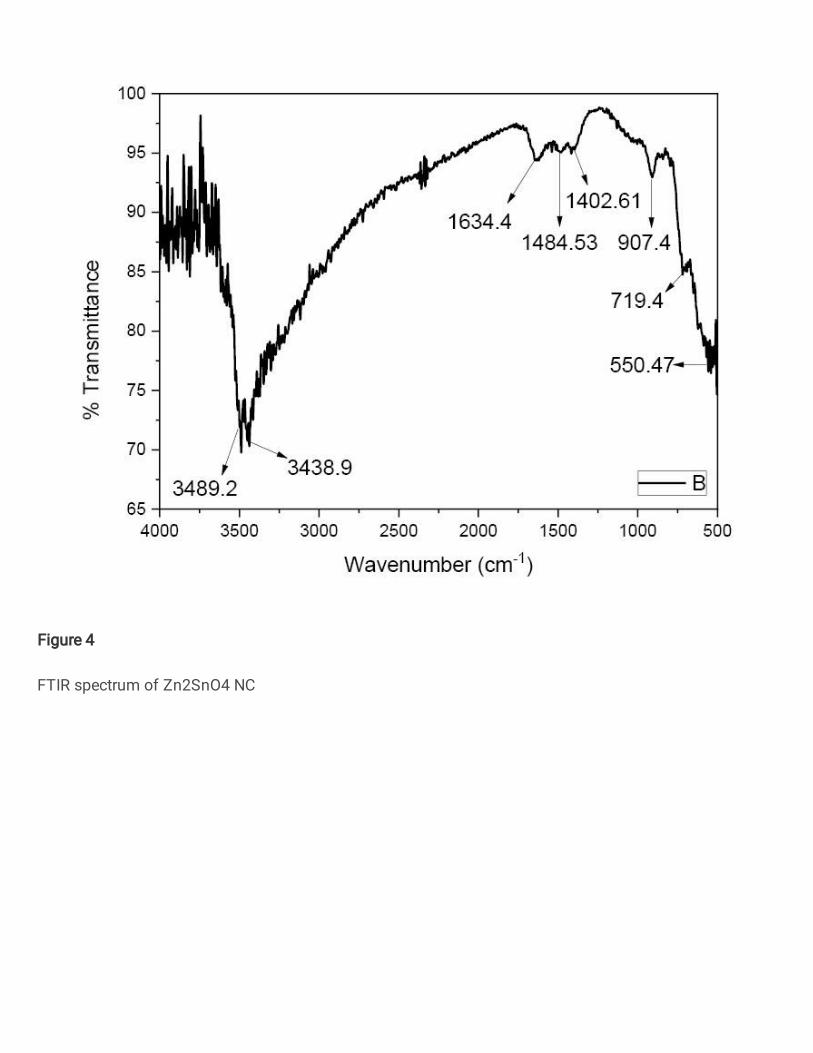
Figure 4
FTIR spectrum of Zn2SnO4 NC
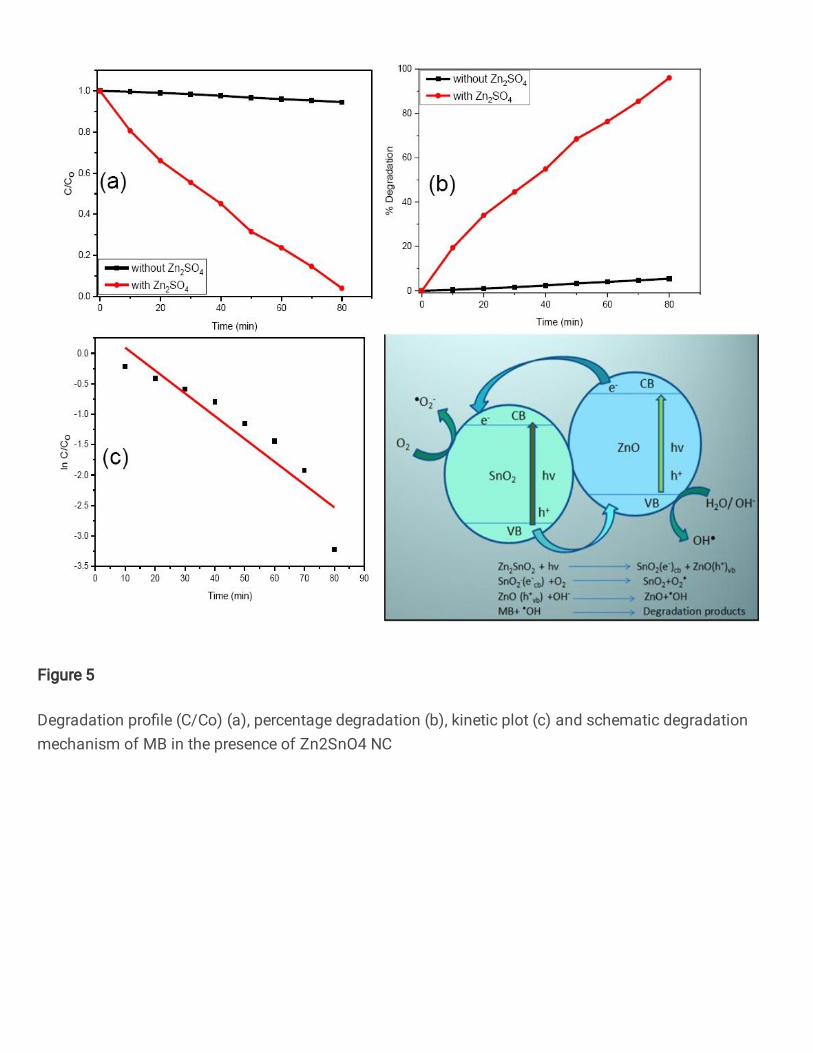
Figure 5
Degradation pro�le (C/Co) (a), percentage degradation (b), kinetic plot (c) and schematic degradationmechanism of MB in the presence of Zn2SnO4 NC

Figure 6
percentage degradation of MB at different catalyst dose (a), initial concentration (b), pH (c) and cycles (d)of photocatalytic degradation.