FIBRIA DAY Day _ vfinal 4.pdf · Stability through continual management improvement and innovation...
57
FIBRIA DAY December 5, 2017
Transcript of FIBRIA DAY Day _ vfinal 4.pdf · Stability through continual management improvement and innovation...

FIBRIA DAYDecember 5, 2017

Disclaimer
The information contained in this presentation may include statements which constitute forward-looking
statements, within the meaning of Section 27A of the U.S. Securities Act of 1933, as amended, and Section 21E
of the U.S. Securities Exchange Act of 1934, as amended.
Such forward-looking statements involve a certain degree of risk and uncertainty with respect to business,
financial, trend, strategy and other forecasts, and are based on assumptions, data or methods that, although
considered reasonable by the company at the time, may turn out to be incorrect or imprecise, or may not be
possible to achieve.
The company gives no assurance that expectations disclosed in this presentation will be fulfilled.
Prospective investors are cautioned that any such forward-looking statements are not guarantees of future
performance and involve risks and uncertainties, and that actual results may differ materially from those in the
forward-looking statements, due to a variety of factors, including, but not limited to, the risks of international
business and other risks referred to in the company’s filings with the CVM and SEC.
The company does not undertake, and specifically disclaims any obligation to update any forward-looking
statements, which speak only for the date on which they are made.
2

AGENDA
PULP AND
PAPER
MARKET
Henri Philippe Van KeerChief Commercial Officer
3FINANCIAL
STRATEGY &
2018 OUTLOOK
Guilherme Cavalcanti Chief Financial Officer
2COMPETITIVE
STRATEGY
Marcelo Castelli Chief Executive Officer
1

1Marcelo CastelliCompetitive Strategy

1 Long-term key aspirations
5
Forestry Strategy
Operational Excellence
Modernization
Innovation
Pursuing a minimum of 10% of
pulp volume priced at a premium.
PROFITABILITY GROWTH
Pursue consolidation as a
priority, aiming to build a healthier
industry.
Expansion and partnerships
conducted in a disciplined way.
Maintain active forest formation,
so as to be ready to seize
opportunities.
DIVERSIFICATION
Diversify cash flow through
focused investments in non-pulp
businesses, leveraging key Fibria
assets and skills
Achieve a sizable free cash flow
from new businesses, in
comparison with pulp business
Operational
Excellence
Financial
Discipline
Sound
GovernanceSustainability Transparency
High-
Performance
Culture
Healthy
Organizational
Climate

1 Long-term key aspirations
6
Operational Excellence
Modernization
Innovation
Pursuing a minimum of 10% of
pulp volume priced at a premium.
.
PROFITABILITY GROWTH DIVERSIFICATION
Pursue consolidation as a
priority, aiming to build a healthier
industry.
Expansion and partnerships
conducted in a disciplined way.
Maintain active forest formation,
so as to be ready to seize
opportunities.
Diversify cash flow through
focused investments in non-pulp
businesses, leveraging key Fibria
assets and skills
Achieve a sizable free cash flow
from new businesses, in
comparison with pulp business
Operational
Excellence
Financial
Discipline
Sound
GovernanceSustainability Transparency
High-
Performance
Culture
Healthy
Organizational
Climate

1
▐ Start-up brought forward: about 2 months ahead of schedule
Horizonte 2 Project
The world’s largest single line pulp mill
7
Energy Surplus
130 MWh
Expansion Capex
US$2,193 million
(US$1,124/t)
Inside the fence(1) Capex
US$947/t
Cash production cost
US$116/t(2)
(@R$/US$3.38)
(1) Industrial capex (2) Energy price assumption: R$132/MWh
Total annual capacity:1,950,000 t

1 Horizonte 2 Project - A winning strategy
Total capex below budget and a new inside-the-fence capex benchmark
7,7066,705
1,462
58
(478)(453) (184)
56 59 275 306
5,883
7,345
Initial budget(May 2015)
Capacityincrease
Contingencies Savings Indirect costs Change ofscope
Updated(in real terms)
Paymentnegotiation
Inflation FX September2017 Budget
Capex
FIBRIA VS PEERS UNIT FIBRIAAVG - PREVIOUS
PROJ.(2)
Industrial Capex US$/t 947 1,496
Industrial Capex US$ mn 1,846 2,917(3)
Inside the fence(1) capex below US$1,000/t
1,846
2,917
Fibria Peers Average
Industrial Capex (US$ mn)
@1.95 mn t
@1.95 mn t
@1.4 MM t (4)
2,094
@peer’s capex, Fibria would be
able to increase capacity by
1,131,000 tons
US$2.8 bn US$2.2 bnR$/US$=2.80 R$/US$=3.33
8(1) Industrial capex (2) According to RISI, considering the average of the BHKP projects started since 2009 in Latam – the average excludes H2 figures.
(3) Multiplied by 1.95 MM tons to make it comparable to Fibria figures. (4) Average capacity of peers’ projects (Suzano Maranhão, CMPC Guaíba II, Eldorado and Montes Del Plata).
To be disbursed

1 Horizonte 2 Project - A winning strategy
So far, much better learning curve than expected
9
Actual Daily Production (t) Expected Daily Production (t)
Nov. 30Aug. 23
Digester
feeding
Actual 409 th. tons
Expected 286 th. tons
(status: November 30, 2017)
+43%
2,235
4,466
5,2165,725 5,699 5,535
5,981 6,0805,567
5,949 5,891
1,866
Planned
stoppage

1 Horizonte 2 Project - A winning strategy
Raising production output as the new mill outperform
H2 production forecast - kton
10
▐ Cash cost (energy, fuels, chemicals)
▐ Pulp quality (Extra prime production index)
Key learning curve indicators:
Learning Curve
estimated at
Inspection
downtime in 2Q18
9 MONTHS
10
377
1,755 1,850
100
7550
2017 2018 2019 2020 2021 2022
10 DAYS
~52 kt1,830 1,900
477
1,950 1,9501,950

1
77 76 84 70
5481 80
130
6045 44
6576 78 82 85
131
157 164
200
Jan-17 Feb-17 Mar-17 Apr-17 May-17 Jun-17 Jul-17 Aug-17 Sep-17 Oct-17 Nov-17 Structuralsurplus
Fibria ex-H2 H2
Fibria’s energy surplus
Embedding market intelligence to become a substantial energy provider...
11
H2 start-upEnergy surplus (MWh)
1Q17 Maintenance
downtimes
Energy management
Energy strategy
Routine
Management
GOVERNANCE
Projects Market
Intelligence
▐ As a co-generation process, the long term strategy is to
have from 50% to 70% contracted for energy sales.
▐ In the short-term, Fibria is mostly exposed to the spot
market. However, keep in mind that in 2018…
Ramp-up H2
Production reduction at Aracruz (-200 kt)
TG overhauls
Energy surplus by mill
-10%
10%
30%
50%
70%
90%
110%
Aracruz Jacareí Veracel Três Lagoas 1 Três Lagoas 2
Generation Consumption Surplus
-30 MWh

1 Long-term key aspirations
12
Operational
Excellence
Financial
Discipline
Sound
GovernanceSustainability Transparency
High-
Performance
Culture
Healthy
Organizational
Climate
GROWTH DIVERSIFICATION
Pursue consolidation as a priority,
aiming to build a healthier industry.
Expansion and partnerships
conducted in a disciplined way.
Maintain active forest formation, so
as to be ready to seize
opportunities.
Diversify cash flow through
focused investments in non-pulp
businesses, leveraging key Fibria
assets and skills
Achieve a sizable free cash flow
from new businesses, in
comparison with pulp business
Forestry Strategy
Operational Excellence
Modernization
Innovation
Pursuing a minimum of 10% of
pulp volume priced at a premium.
PROFITABILITY

1Operational Excellence – Annual Production ex-H2
Back on track, as expected
13
92.9%(¹)
5,299 5,259 5,274 5,185 5,021
1,2041,330 1,325
2012 2013 2014 2015 2016 1Q17 2Q17 3Q17
Operating
Stability
Ex-H2
(‘000 t)
92.4% 92.2%92.7%
92.3%
92.1%91.8%
93.8%93.4%
5,257
Quarter
Annualized
▐ 1Q16 and 1Q17 with extended downtimes
▐ Value over volume strategy going forward
But remember that for 4Q17...
(-) 85 kt Aracruz
(-) Veracel Maintenance Downtime

1
980 940
981905 910
994 1,024
106
112 118
129 135
138
100
117
130
138
149 153
157
96 100
93 93
102 105
0
20
40
60
80
100
120
140
160
180
600
700
800
900
1.000
1.100
1.200
1.300
1.400
1.500
2011 2012 2013 2014 2015 2016 2017
R$/ha/year
Operational Excellence – Silviculture OperationsStability through continual management improvement and innovation
14
Silviculture investment per hectare in line with the strategy of controlling costs below inflation
Base
INCAF(2)
IPCA(2)
FIBRIA
(1) Refers to all direct costs of forest formation (reform), considering the standard cost of new seedlings being planted.
(2) INCAF: Forestry Activity Costs National Index (INCAF – Poyry) | IPCA: Brazilian official inflation index
(1)
▐ Mechanization
▐ Planting optimization
▐ Productivity
▐ Precision silviculture
Outstanding performance based on:

1Third-party wood reduction
Non-recurring pressure decreasing towards the structural level
15(1) Includes Veracel | (2) FX @ BRL/USD3.30.
Total NPV (2):R$ 3.5 billion (US$ 1.1 billion)
788Th
ird
-par
ty w
oo
d ¹
(%
)
225180 185 175 169 181
225
283 267 265 265231
202 202160 160
160153
0
50
100
150
200
250
300
0%
5%
10%
15%
20%
25%
30%
35%
40%
45%
50%
2009 2010 2011 2012 2013 2014 2015 2016 2017 2018 2019 2020 2021 2022 2023 2024 2025 2026
Average distance from forest to mill
Third-party woodA
verage d
istance fro
mfo
rest to m
ill ¹ (km)
68%34% 63% 73% 67% 75% 72%% Planting 84%
In 2016 climate change materialized in the most severe rain shortage in Aracruz forestry base in the last 40 years, but in 2017…
▐ Rain volumes in Aracruz region improved, more close to historical average
▐ Higher productivity was obtained in Jacareí and Três Lagoas forestry bases
▐ Forest productivity long term goal (MAICel) achieved 11.75 adt/ha/year for the new eucalyptus clones effectively planted in 2017

1
16
1 Modernization ProjectsBoosting structural cost competitiveness
51%
100%
2018 2019
2018 Modernization Projects Capex Execution (%)
44
90
2415
3648
110102
133
2010 2011 2012 2013 2014 2015 2016 2017E 2018E
Historical Modernization Capex (R$ million)
24 projects starting in 2018
(8 industrial | 16 forest)
NPV of projects
started in 2018 above
R$ 456 million
▐ Focus on innovation
▐ Average physical execution: ~4 months
▐ Average payback: 4.2 years
▐ VPL/I= 2.2
▐ Upside for return metrics
R$
133 mn
R$
129 mn

1 LONG-TERM KEY ASPIRATIONS
17
GROWTH
Pursue consolidation as a priority,
aiming to build a healthier industry.
Expansion and partnerships
conducted in a disciplined way.
Maintain active forest formation, so
as to be ready to seize
opportunities.
Operational
Excellence
Financial
Discipline
Sound
GovernanceSustainability Transparency
High-
Performance
Culture
Healthy
Organizational
Climate
Operational Excellence
Modernization
Innovation
Pursuing a minimum of 10% of
pulp volume priced at a premium.
.
PROFITABILITY DIVERSIFICATION
Diversify cash flow through
focused investments in non-pulp
businesses, leveraging key Fibria
assets and skills
Achieve a sizable free cash flow
from new businesses, in
comparison with pulp business

1 Development status of different biostrategy technological paths with low capex and high
returns
18
Technology
Identification
Identification of
Technology Partners
Definition and Agreements
with Technology Partners
Pilot
Investment
Agreements with
Application Partners
Commercial
Investment
PYROLISIS
LIGNIN
MFC
BIOCOMPOSITES
NANOCELLULOSE
CNC
DISSOLVING PULP +
SUGARS
Roadmap defined in 2012 Updated and implemented with discipline (2017)
Definition in the
coming months
Under analysis
Many partners
Several
partners
collaborating
Several
partners
collaborating
Several
partners
collaborating
Several
partners
collaborating
Several
partners
collaborating
Several
partners
collaborating
Several
partners
collaborating
Several
partners
collaborating
1
▐ Technological innovations
– Fibria engaged in disruptive technologies
Fibria Insight – Connect with our technologial initiatives
19
research and
development unit of
Fibria, specialized
in lignina
Modern Technology Center with facilities in Jacarei (SP) and Aracruz (ES).
Fibria´s participation in the Canadian
company, the largest global producer of
crystalline nanocellulose (CNC).
Fibria´s participation in the American
company, global producer of bio oil.
FIBRIA
INNOVATIONS
Production and application of
microfibrillated cellulose (MFC). 18%
To look for new ideas, innovative solutions and new technologies!
Connecting, selecting and supporting entrepreneurs and
startups that have solutions!
WIRELESS PACKAGEAPPLICATIONS IN
MICROFIBRILLATED
CELLULOSE

Guilherme CavalcantiFINANCIAL STRATEGY
20

Financial StrategyFocus on capital discipline during Horizonte 2 project
Net debt / Ebitda (USD)Initiatives for Leveraging Management
US$854 mn initiatives mapped
US$220 mn implemented
during the expansion cycle.
Working capital release
▐ Range of 2.0x to 2.5x net debt/EBITDA
▐ Maximum 3.5x net debt/EBITDA during
expansion cycles
Leverage guidelines
▐ Covenants only triggered if Fibria loses
the Investment Grade from 2 of the 3
rating agencies
Highlights
1.86 2.10
2.64
3.303.79 3.75
3.28
4.5
7.06.0
4.5
1Q16 2Q16 3Q16 4Q16 1Q17 2Q17 3Q17 4Q17 1Q18 2Q18 3Q18 4Q18 2019
Actual (in US$)
Covenant level
3.5x
2.0x – 2.5x
Indebtness limits(1)
Waiver
H2 Start-up
21(1) As stated in the Liquidity and Indebtedness Policy and Shareholders’ Agreement 21
Investment Grade rating even during leverage pressured
by H2 capex
BBB- BBB-

22
Financial StrategyNow focusing on liability management ...
22
▐ Amortization concentrated in 2019
▐ Higher volatility in 2018 combined with the current market
opportunity for funding in US$
▐ Balance and extend the debt repayment schedule
▐ Ensure low average cost of debt
▐ Exclude financial covenants
▐ Initiate reduction of gross debt using US$ 200 million cash
Market Scenario Goals
2222
138
581
957
827
665 628 642721
11439
703
2017 2018 2019 2020 2021 2022 2023 2024 2025 2026 2027
BNDES Bond PPE Finnvera NCE ARC Finame Others BNBAmortization schedule (as-is)US$ mn (@Sep. 2017)
EPP
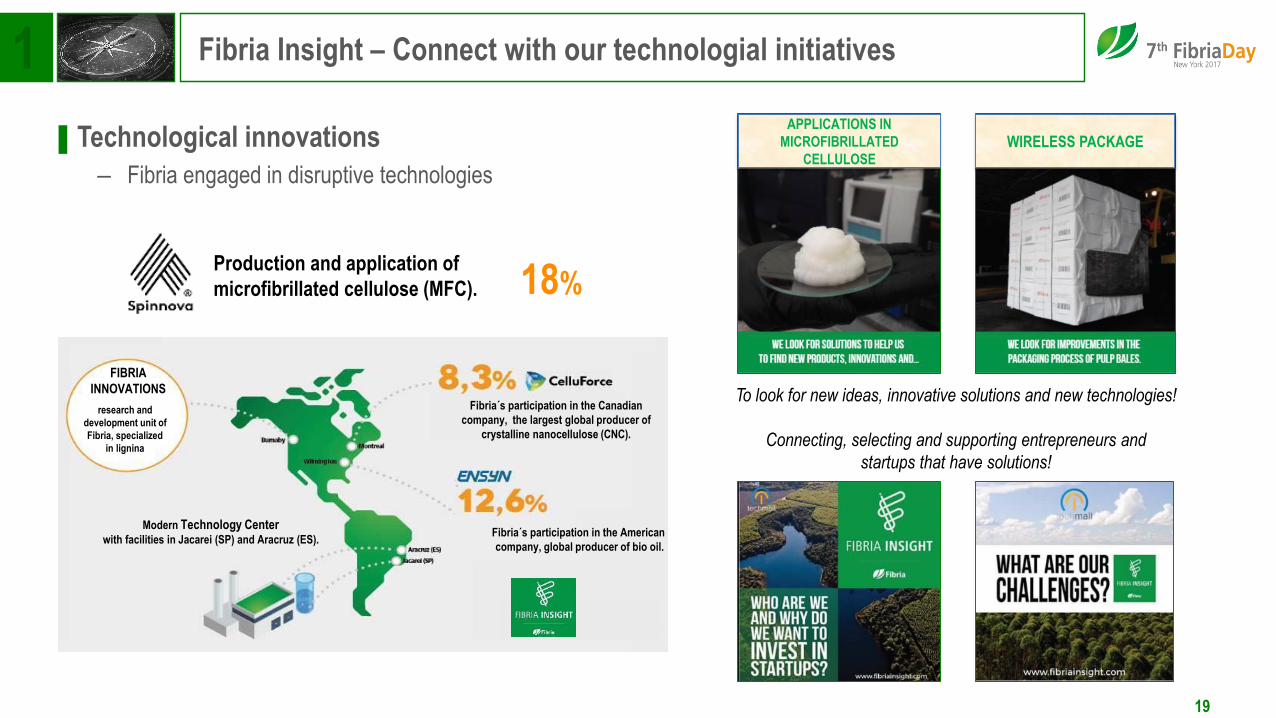
US$ 1.5 bn export pre-payment to be paid in advance, with:
US$ 0.6 bn new bond due 2025 (coupon rate 4.00% p.a.)
+US$ 0.7 bn new Export Pre-Payment
+US$ 0.2 bn cash use
54
66
As-is To be
Average
maturity
(in months)
Average cost in
US$ (% p.a.)
Amortization schedule (to be: EPP + Bond)US$ mn (@Sept. 2017)
88
225
502
715 740 728642
721 714
39
703
2017 2018 2019 2020 2021 2022 2023 2024 2025 2026 2027
BNDES Bond PPE Finnvera NCE Outros CRA Finame Agência de Fomento (FCO, Finep e FDCO) BNB
Financial Strategy…to further improve indebtedeness profile
Cost of debt in US$ and Debt Maturity¹
Others FCO, FINEP and FDCO
3.5 3.5
EPP ARC
1) Considering the portion of debt in reais fully adjusted
by the market swap curves 23

Financial StrategyReducing net currency exposure in the cash flow
(1) November 30, 2017.24
ZCC
+R$ 187 MM
Net cash balance since 2013:
Zero Cost Collars:
▐ No leverage
▐ No margin call
▐ No threshold
▐ CETIP registered
ZCC
+R$ 187 mn
NDF (simulated)
-R$ 6 mn
Notional Strike Put Strike Call FWD
4Q2017 US$ 145 mn 3.32 6.43 3.98
1Q2018 US$ 502 mn 3.22 4.52 3.60
2Q2018 US$ 544 mn 3.15 4.48 3.59
3Q2018 US$ 480 mn 3.14 4.30 3.50
4Q2018 US$ 455 mn 3.17 4.40 3.55
Total US$ 2,126 mn 3.18 4.57 3.59

Why we see upside for return metrics (ROIC and ROE)H2 project will boost free cash flow generation
FCF/t(2) sensibility to net pulp price and FXFCF/t from net pulp price (US$/t)(1)
(1) FX @ 3.38 and assuming working capital = 0. (2) Size of the bubble = FCL/t in US$
546
336
226
116
94
75
1520
Last 3 yrsFibria's pulp
price
Cash cost Freightdelivery to
Europe andSG&A
EBITDA Sustainingcapex
Interest Income taxafter taxshield
PerpetuityFCF
170
226
287
369
443
400
450
500
550
600
650
700
750
1,50 2,50 3,50 4,50 5,50
FCF (US$/t)
FX (R$/US$)
25
Pu
lp p
rice
(U
S$/
t)
25
6.6 yrs
5.1 yrs
3.9 yrs
3.0 yrs
2.5 yrs
Payback
(Capex @US$1,124/t)

Why we see upside for return metrics (ROIC and ROE)Deleveraging process and reducing financial expenses/t
The most rapid deleveraging process after expansion project execution when compared to LatAm peers.
Dividends and interest on equity paid during expansion projects:
Fibria R$ 2,840 mn
Suzano R$ 222 mn
Klabin R$ 741 mn
3.2
5.2
2.3
6.3
4.4
8.1
3.8
1Q12 2Q12 3Q12 4Q12 1Q13 2Q13 3Q13 4Q13 1Q14 2Q14 3Q14 4Q14 1Q15 2Q15 3Q15 4Q15 1Q16 2Q16 3Q16 4Q16 1Q17 2Q17 3Q17 2017
Fibria Suzano Klabin Eldorado
Horizonte 2
Maranhão
Puma
218165
52
60
42
36
3
20
121
101
38
15
473
397
Fibria 3Q17 LTM Fibria w/ H2 Structuralpro-forma
Interest
Capex
Income taxSG&A
H2 benefit
WC benefit
Klabin=($39/t)
H2= ($20/t)
Assuming WC
release = 0
Freight
Cash
Production
Cost
26

(1) Partially integrated production.
(2) Sources: Hawkins Wright, Poyry and Fibria Analysis. Pulp price estimates according to RISI (Oct/17)
Why we see upside for the return metrics (ROIC and ROE)No major new capacity announced after OKI and H2 projects
27
Cap
acity
Add
ition
s (‘0
00 to
n)(2
)
Pul
p pr
ices
-C
IF E
urop
e (U
S$/
ton)
(2)
813
905
1.010
0
0,5
1
1,5
2
2,5
-
200
400
600
800
1.000
1.200
2000 2001 2002 2003 2004 2005 2006 2007 2008 2009 2010 2011 2012 2013 2014 2015 2016 2017 2018 2019 2020
BHKP BHKP adjusted by CPI
7,400 kt 5,250 kt
Metsa
Horizonte 2
APP South
Sumatra(1)
Klabin
Guaíba II
Oji Nantong
Montes del
Plata
Eldorado
Maranhão
Chenming
Zhanjiang
APP Guangxi
Rizhao
Três Lagoas
Kerinci
PL3
Fray BentosSanta Fé
Mucuri
Nueva
AldeaVeracel
APP
Hainan
Valdivia
JacareiAracruz
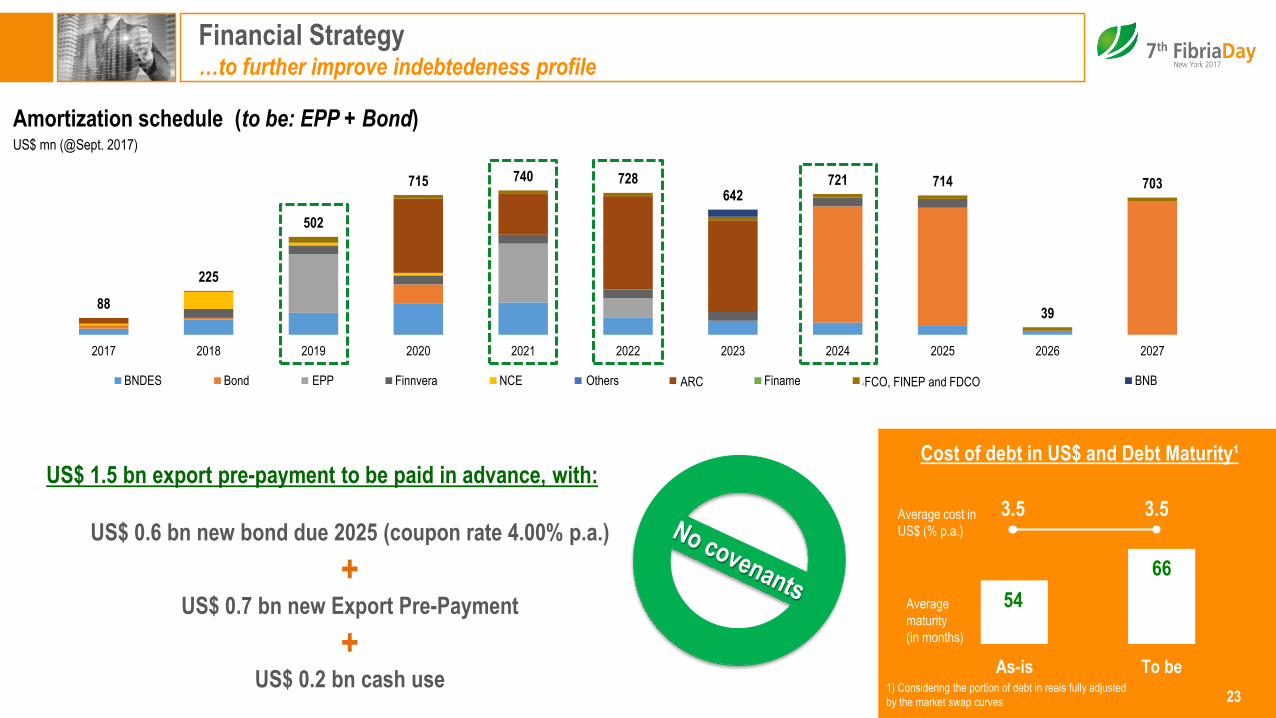
Why we see upside for return metrics (ROIC and ROE)Positive quarterly FCF in the last 5 years, even during appreciated FX
28
FCF (USD million)
EBITDA Margin
Average FX
125
29
77
194
84113
53
329
4
111
51
103130
112
317
225
158118 124 135
80
174
2Q12 3Q12 4Q12 1Q13 2Q13 3Q13 4Q13 1Q14 2Q14 3Q14 4Q14 1Q15 2Q15 3Q15 4Q15 1Q16 2Q16 3Q16 4Q16 1Q17 2Q17 3Q17
(1) Excluding H2 Project, dividends, pulp logistics and land purchase effects.
1.96 2.03 2.06 2.00 2.07 2.29 2.27 2.37 2.23 2.27 2.55 2.87 3.07 3.45 3.84 3.90 3.51 3.25 3.26 3.15 3.22 3.16
37% 37% 41% 39% 39% 41% 42% 41% 35% 35% 45% 50% 50% 56% 54% 52% 43% 43% 36% 37% 45% 49%
Average Net Price
594 597 591 605 630 612 592 577 562 554 552 559 581 600 589 536 503 487 481 499 557 604
Nominal Capacity (‘000 t)
5,300 7,250
28

ROE = Adjusted EBIT(1)/ Equity before IAS 41(2) and ROIC = Adjusted EBIT(3)/ Invested Capital before IAS 41(2)
Average FX
(R$/US$)
Average Net
Pulp Price
(US$)
1.95 2.16 2.35 3.33
581 610 561 586
3.20
535
3.49
496
3.38(4)
546(5)
(1) Adjusted EBITDA – CAPEX – Net Interest – Taxes (2) International accounting standards for biological assets.
(3) Adjusted EBITDA – CAPEX – Taxes (4) FX for H2 cash cost and sustaining capex
(5) Fibria’s actual net realized pulp price – average last 3 years @3Q17 (6) Considers the cost structure presented on slide 27 and 3Q17 balance sheet (invested capital and equity)
ROE and ROIC (R$)
29
3.4%5.7% 6.2%
25.1%
9.8%7.5%
15.1%
30.8%
4.7%6.1% 5.6%
15.6%
6.9% 6.3%
10.6%12.8%
2012 2013 2014 2015 2016 3Q17 LTM Annualized 3Q17 Fibria after H2Structural
(pro-forma)
ROE ROIC
(6)
3.16
604

ROIC and ROE Fibria’s case going forward…
30
▐ Horizonte 2: capacity increase, cash cost lower than expected, efficient ramp-up with high energy surplus
▐ Deleveraging and interest expense/ton reduction
▐ Pulp price: up to 2021 without any significant capacity – we have not seen such positive scenario since
late 1990s and early 2000s
▐ Wood cost: despite pressures, wood cost reduction moves towards structural level
▐ FX upside risk more than downside risk
▐ Sustainability: listed in the Dow Jones Sustainability EM Index and B3 Corporate Sustainability Index (ISE)

PRESERVING CAPITAL DISCIPLINE
&
FREE CASH FLOW
INDUSTRY
CONSOLIDATION
PULP
- Growth with discipline
- Best portfolio
of projects
DIVIDENDS BIO-Business&&
Capital AllocationWith a robust free cash flow no trade-off is needed…
31

Guilherme Cavalcanti
2018 OUTLOOK

2,175
2,855
3,430
88
460132
131
444
2017 GuidanceUpdate
∆ Inflation / FX H2 Sustaining Modernization &Non-recurring
2018 Guidance(ex-pulp logistics and
H2 expansion)
Pulp logistics H2 Expansion 2018 Guidance
CAPEX 2018 – R$ million
3333
(1) Converted at 3Q17 LTM FX – BRL/USD 3.21 | (2) Converted at 2018 average FX - BRL/USD 3.30, according to Focus Report (Brazilian Central Bank – November 24, 2017)
(3) Subject to Board approval | (4) IPCA estimate @4.5% and FX @3.15 | (5) Capacity 7,250 kt. | (6) Forestry base adjustment, environmental, other projects (PIFF, Pentatrem, TG’s overhauls, etc.).
(3)
USD119/t(5)
USD
678 mn(1)
USD
865 mn(2)
USD
1,039 mn(2)
USD128/t
7011,006
4Q17 2018
H2 capex (cash basis - R$ million)
(6)

STRUCTURAL CAPEX – BRL MILLION
3434(1) Converted at 2018 average FX - BRL/USD 3.30 - According to Focus Report (Brazilian Central Bank – November 24, 2017) | (2) Subject to Board approval
(2)
2,855
2,285
2018Guidance
(sust+moderniz)
Non-recurringwood purchase
Modernization Non-recurringprojects / SSMA
Turbogeneratoroverhaul
Others Structuralcapex
(includes TLS 2)
USD
865 M(1)
USD
692 M(1)
USD119/t USD96/t

CASH COST UPDATE (USD/T) @2021BRL/USD 3.12
35
218
165(27)
(19) (10)
3
LTM 3Q17 Horizonte 2 Project Wood cost reduction Modernization Payroll tax Structuralcash-cost(1)
FX Cash cost (US$/t)
3.00 171
3.10 166
3.12 165
3.30 157
3.50 150
12%
90%100%
2017 2018 2019
24%
49%
71% 75%
100%
2019 2020 2021 2022 2023
(1) Considering inflation (IPCA) up to 2018.

HENRI PHILIPPE VAN KEER
PULP AND PAPER MARKET

What has been the 2017 Supply & Demand scenario?
Also, compared to our forecast…
37
FIBRIA EXPECTED SCENARIO FOR 2017 AT THE END 2016
1,350
720
-500
-60
-40
-80
-300
-100
300
1,000
500
BHKP demand growth**
Net Supply Availability
Unexpected Closures and Downtime
Navigator Cacia
Resolute Calhoun
Taiwan P&P
APRIL Rizhao
APRIL Kerinci
Fibria TLS II
APP OKI
Klabin
1,027*
-230
-960
-85
-40
-60
-400
-300
-115
25
35
470
700
500
390BHKP demand growth**
Net Supply Availability
Unexpected Closures and Downtime
Fibria Aracruz
Resolute Calhoun
Taiwan P&P
APRIL Jiangmen
APRIL Rizhao
APRIL Kerinci
Altri Celbi
Ence Pontevedra & Navia
Fibria TLS II
APP OKI
Klabin
SCENARIO YTD 2017
** Fibria’s estimates | *Source: PPPC Global 100 YTD Jan-Sept 2017
▐ BHKP CAPACITY CHANGES
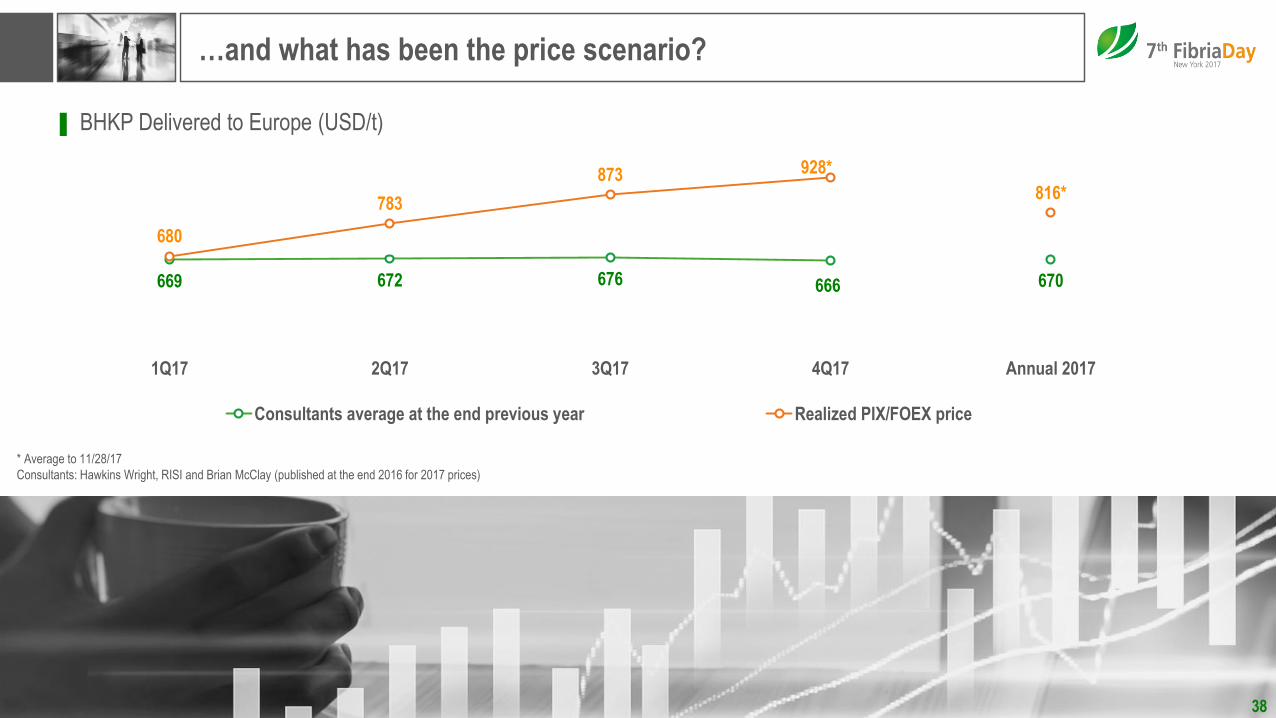
…and what has been the price scenario?
* Average until 11/14/17
Consultants: Hawkins Wright, RISI and Brian McClay (published in the end 2016 for 2017 prices)
▐ BHKP Delivered to Europe (USD/t)
669 672 676 666 670
680
783
873 928*
816*
1Q17 2Q17 3Q17 4Q17 Annual 2017
Consultants average at the end previous year Realized PIX/FOEX price
* Average to 11/28/17
Consultants: Hawkins Wright, RISI and Brian McClay (published at the end 2016 for 2017 prices)
38

39
What can explain such an unexpected price scenario?
For sure, one explanation was the
Market caught by surprise by
But that was not the only
explanation!
It was also supported by the
combination of 2 other factors...
significant supply disruptions

Source: PPPC Global 100
2016 2017, YTD Jan-Sep
4.9%
-4.2% -2.3%
16.0%
Global NA Europe China
4.3%
0.2%
-0.6%
11.7%
Global NA Europe China
2013 2014 2015
5.3%
5.5%0.4%
19.0%
Global NA Europe China
3.3%
5.0% 2.5%
5.1%
Global NA Europe China
3.3%
-3.5%
4.3%6.3%
Global NA Europe China
-300
0
300
600
900
1.200
1.500
-300
0
300
600
900
1.200
1.500
A firm global demand but more importantly... driven by all the regions
40
▐ BHKP SHIPMENTS (KT AND % CHANGE, Y-O-Y)
1st

Low Pulp & Paper inventories at the hands of the Chinese Paper & Board
producers
41
2nd
65
70
75
80
85
90
95
100
105
Jan-14 Jun-14 Nov-14 Apr-15 Sep-15 Feb-16 Jul-16 Dec-16
20
40
60
80
100
120
140
160
Jan-14 Jun-14 Nov-14 Apr-15 Sep-15 Feb-16 Jul-16 Dec-16
80
90
100
110
120
130
140
150
160
Jan-14 Jun-14 Nov-14 Apr-15 Sep-15 Feb-16 Jul-16 Dec-16
40
60
80
100
120
140
160
180
200
May-15 Jul-15 Sep-15 Nov-15 Jan-16 Mar-16 May-16 Jul-16 Sep-16 Nov-16
Fibria Index for Paper & Board inventories @ Paper & Board producers Fibria Index for Chemical Pulp inventories @ Paper & Board producers
Fibria Index for Pulp inventory @ Changshu Fibria Index for Pulp inventory @ Qingdao
Source: Fibria according to company’s estimates

42
So, what can be expected for 2018?
Fibria continues to forecast
strong global demand driven by
all the regions

3.5
-0.9
2.2
7.9
3.5
-0.2
1.7
7.8
3.6
1.3
2.6
7.3
3.4
2.0
2.9
6.9
3.2
1.81.5
6.7
3.6
2.1 2.2
6.8
3.7
1.92.3
6.5
World Euro Area USA China
2012 2013 2014 2015 2016 2017F 2018F
Positive worldwide macroeconomics
Source: International Monetary Fund, World Economic Outlook Database, October 2017 43
▐ REAL GDP % ANNUAL GROWTH

44
So, what can be expected for 2018?
Fibria continues to forecast
strong global demand driven by
all the regions
The Eurozone economy is
definitely doing better

Eurozone indicators
Sources: Bloomberg/Markit and Eurostat
40
42
44
46
48
50
52
54
56
58
60
2013 2014 2015 2016 2017
PMI Manufacturing PMI Services
EUROZONE PMIs EUROZONE UNEMPLOYMENT RATE (%)
0
2
4
6
8
10
12
14
2003 2004 2005 2006 2007 2008 2009 2010 2011 2012 2013 2014 2015 2016 2017
45
46
So, what can be expected for 2018?
Fibria continues to forecast
strong global demand driven by
all the regions
The Eurozone economy is
definitely doing better
But the real engine will
continue to be China

The 19th CPC National Congress
▐ Identified unbalanced and inadequate development as China’s principal challenge in the next stage of
development.
▐ Pledged to build a “moderately prosperous” society in China by 2020, a prosperous China by 2035, therefore:
– Re-affirmed its commitment to doubling China 2010 GDP and per capita income by 2020 and getting rid of poverty.
• China should maintain its growth @ 6.5% until 2020.
▐ In our opinion, there is no doubt that Chinese growth is far from losing steam. It is actually getting to a next level, with
very aggressive targets. The list of Xi Jinping’s “thoughts” made it very clear:
– To improve the people’s livelihood.
– To promote ecological civilization and implement the strictest environmental protection.
– To strengthen party discipline, with zero tolerance for corruption.
From a practical point of view, our last trip to
China has been the opportunity to confirm
our customers’ positive outlook and
confidence about the on-going growth of
their country.47
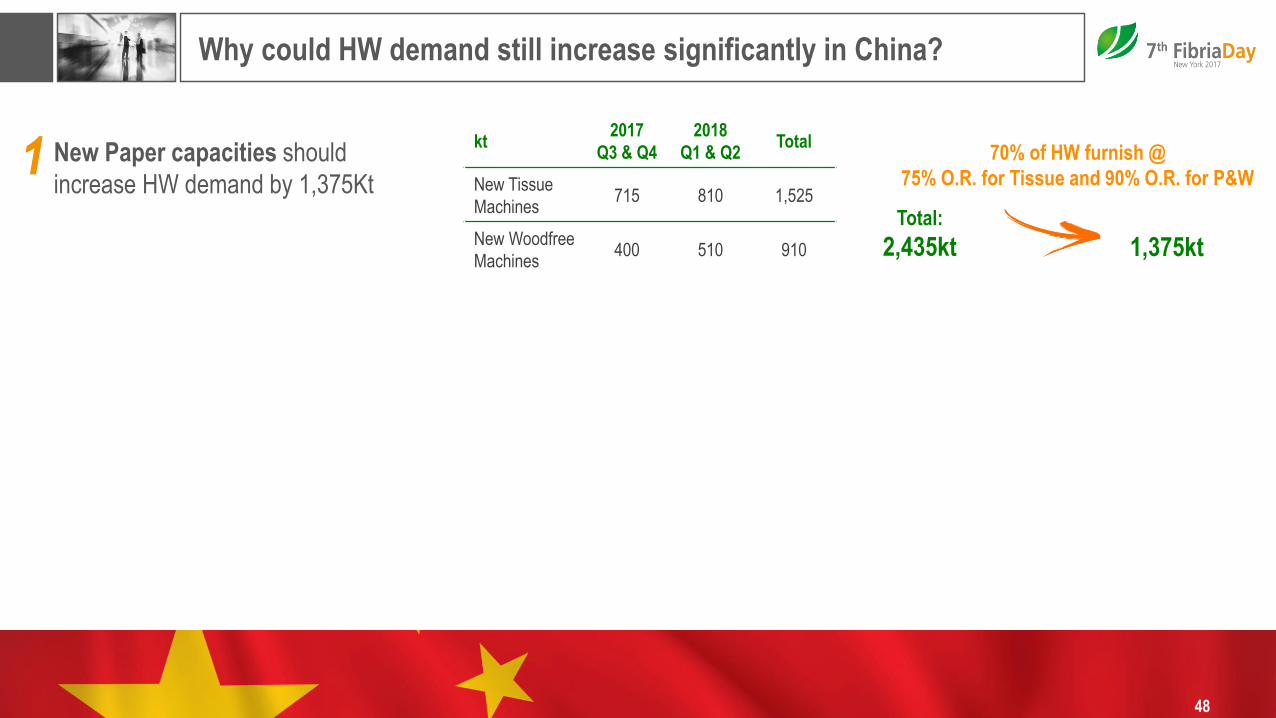
Why could HW demand still increase significantly in China?
New Paper capacities should
increase HW demand by 1,375Kt
kt2017
Q3 & Q4
2018
Q1 & Q2Total
New Tissue
Machines715 810 1,525
New Woodfree
Machines400 510 910
Total:
2,435kt 1,375kt
1 70% of HW furnish @
75% O.R. for Tissue and 90% O.R. for P&W
48

New Paper capacities “Worldwide”
Sources: Fibria and Independent Consultants
2016 2017F 2018F
Woodfree -360 150 715
China 155 890 510
Rest of the World -510 -740 205
Tissue 1,535 2,380 3,525
China 1,000 1,170 1,945
Rest of the World 535 1,210 1,580
Cartonboard & Specialty 2,630 110 765
China 1,550 0 100
Rest of the World 1,080 110 665
49

Why could HW demand still increase significantly in China ?
Closures of inefficient Pulp & Paper mills might increase HW demand by 540Kt
New Paper capacities should
increase HW demand by 1,375Kt
kt2017
Q3 & Q4
2018
Q1 & Q2Total
New Tissue
Machines715 810 1,525
New Woodfree
Machines400 510 910
1
2
Total:
2,435kt 1,375kt
70% of HW furnish @
75% O.R. for Tissue and 90% O.R. for P&W
50

Closures of inefficient Pulp & Paper mills
5151
Closed capacities in million tons: Pulp, Paper & Board
2010 – 2015:
38 million tons of capacity (Pulp, Paper & Board) was permanently closed down, as low efficiency assets are not compliant with
environmental regulations:
Pulp 3.7 million/t Substituted by imported pulp
Paper & Board 34.7 million/tThese closures have clearly benefited the “big” Paper & Board producers,
therefore, imported pulp

Closures of inefficient Pulp & Paper mills
▐ According to China´s 13th Five-Year Plan (2016-2020):– China paper industry will close an additional 8 million tons during this period
– Non-wood Pulp will be maintained @ 6 million tons/y
– Therefore closures will be mainly concentrated in small and medium size Paper & Board mills
Assuming that:
Coated Ivory Board and Coated Fine Papers are already 2 paper segments consolidated in the hands of big players with efficient assets:
– Respectively 81% and 85% in the hands of the Top 4
60% of the closures occur in “Packaging”:
– 4.8 million tons of closures @ an O.R. of 90%, which gives 4.3 million tons of production moving to “big producers” and benefiting RF & Unbleached Long Fiber; in other words, Long Fiber due to RF scarcity ≈ 900kt of closures per year
– Our premises: 80% benefits SW demand: 720 Kt/y
20% benefits HW demand: 180 Kt/y
40% of the closures happen in “UWF & Tissue”:
– 3.2 million tons of closures @ an O.R. of 80%, which gives 2.6 million tons of production moving to “big producers” and benefiting Pulp imports 70% of which are HW: 1.8 million tons of additional HW demand: 360 Kt/y
52

Why could HW demand still increase significantly in China ?
Waste paper ban imports reduction in 2018 should be around 5 million tons of Mixed Waste Paper. Let’s consider that:
▐ 60% MIGHT be sourced from domestic market and improved quality through sorting coming from overseas suppliers
▐ 40% MIGHT switch to virgin pulp: 2 million tons / 1.4 = 1.4 million tons
– 80% benefits SW demand: 1.1 million tons
– 20% benefits HW demand: 300Kt
Total HW demand increase in 2018 could
be around 2,215 kt... Just in China!
Closures of inefficient Pulp & Paper mills might increase HW demand by 540Kt
New Paper capacities should
increase HW demand by 1,375Kt
kt2017
Q3 & Q4
2018
Q1 & Q2Total
New Tissue
Machines715 810 1,525
New Woodfree
Machines400 510 910
1
2
3
Total:
2,435kt 1,375kt
70% of HW furnish @
75% O.R. for Tissue and 90% O.R. for P&W
53

So, what could be next year’s scenario in terms of supply and demand?
54
FIBRIA EXPECTED SCENARIO FOR 2018 AT THE END 2017
2,950
2,930
-500
-50
-500
-200
30
25
85
135
100
100
1,360
1,300
960 85 (Aracruz)
BHKP demand growth
Net Supply Availability
Unexpected Closures and Downtime
Navigator Cacia
APRIL
Fibria Aracruz
Suzano Maranhão
Altri Celbi
Ence Pontevedra & Navia
UPM Kymi
Svetlogorsky P&B
Metsä Äänekoski
Fibria TLS II
APP OKI
Unexpected Downtimes 2017

It should be a rather well balanced scenario then, in terms of...
Supply and demand, combining with...1
and also…3
a firm Global demand pushed by all the regions…2
55

Low inventories at the Chinese Paper & Board producers
56
20
40
60
80
100
120
140
160
Jan-14 May-14 Sep-14 Jan-15 May-15 Sep-15 Jan-16 May-16 Sep-16 Jan-17 May-17 Sep-17
65
70
75
80
85
90
95
100
105
Jan-14 May-14 Sep-14 Jan-15 May-15 Sep-15 Jan-16 May-16 Sep-16 Jan-17 May-17 Sep-17
80
90
100
110
120
130
140
150
160
Jan-14 May-14 Sep-14 Jan-15 May-15 Sep-15 Jan-16 May-16 Sep-16 Jan-17 May-17 Sep-17
40
60
80
100
120
140
160
180
200
May-15 Sep-15 Jan-16 May-16 Sep-16 Jan-17 May-17 Sep-17
Fibria Index for Paper & Board inventories @ Paper & Board producers Fibria Index for Chemical Pulp inventories @ Paper & Board producers
Fibria Index for Pulp inventory @ Changshu Fibria Index for Pulp inventory @ Qingdao
Source: Fibria according to company’s estimates

FIBRIA DAYDecember 5, 2017
Thank You.