fft f hr Prdd b Pp Fttn n th Drp z Dtrbtn n Trblnt Fl f ... · soa mie i 1" 1 Fr (2: Dprn r th ll...
22
An-Najah Univ. J. Res., Vol. 13 (1999) 9-30 Effect of Shear Produced by Pipe Fittings on the Drop Size Distributions in Turbulent Flow of Kerosene/Water Mixtures 4;. 4-A44 ..011 &hi cLut.s.W1 .sal JiaL Z 11-a d9.): 14-9 CJ-4 C;71 ..; 4 Amer EL-Hamouz 5 s a tl AIL Dept. of Chemical Engineering, An-Najah National Univ., Nablus, Palestine Received: (7/6/1998), Accepted: (11/4/1999) Abstract Drop size distribution data for kerosene-water dispersion were obtained in 1."1.1/ pipe at a range of velocities in turbulent flow for a straight horizontal pipe. U shaped pipe and an offset pipe fitting oriented horizontally and vertically (upward and downward) to the main flow. A Lightnin in line static mixer was used as a premixer and the drop size distribution was measured by a Malvern 2600 analyzer. By changing the number of internal elements from 4 to 18 the mixer produced a primary dispersion with the mean drop sizes in the range of 50-700 um for the flow rates of 20 to Uminute. The Sauter mean diameter, d ri ,, was found to decrease as the number of elements was increased until an equilibrium drop size was reached. This equilibrium drop size varied with the fluid velocity through the mixer. For a dispersion of —0.5% kerosene in water, the correlation of drop site with energy dissipation rate, e, was found to give a reasonable agreement with Kolmogoroffs theory mm ith au exponent in the range of -0.47 to -0.56 for a horizontal pipe and -0.60 to -0.72 for U-shaped and offset pipe fittings. The Sauter mean diameter was also correlated against \Veber number with an exponent in the range of -0.71 to -0.83 for all the linings used Keywords: Sauter mean diameter, dispersion, mixing, on-line measurement. oil-water, fittings. ••■:1— 2.s.16 _ L ,1 3 . 3 )2':a5'431 " :}" , i •=1= > ,L2,1 }Lai - ) :,■; )6i 3 .Malvem 2600 \' • -c • y 1, r _51 j3: A /_; 3 A; •
Transcript of fft f hr Prdd b Pp Fttn n th Drp z Dtrbtn n Trblnt Fl f ... · soa mie i 1" 1 Fr (2: Dprn r th ll...
An-Najah Univ. J. Res., Vol. 13 (1999) 9-30
Effect of Shear Produced by Pipe Fittings on theDrop Size Distributions in Turbulent Flow of
Kerosene/Water Mixtures4;. 4-A44..011 &hi cLut.s.W1 .sal JiaL
Z 11-a d9.):14-9 CJ-4 C;71..;4
Amer EL-Hamouz
5s a tl AIL
Dept. of Chemical Engineering, An-Najah National Univ., Nablus, Palestine
Received: (7/6/1998), Accepted: (11/4/1999)
Abstract
Drop size distribution data for kerosene-water dispersion were obtained in 1."1.1/ pipe at arange of velocities in turbulent flow for a straight horizontal pipe. U shaped pipe and an offset pipefitting oriented horizontally and vertically (upward and downward) to the main flow. A Lightnin inline static mixer was used as a premixer and the drop size distribution was measured by a Malvern2600 analyzer. By changing the number of internal elements from 4 to 18 the mixer produced aprimary dispersion with the mean drop sizes in the range of 50-700 um for the flow rates of 20 toUminute. The Sauter mean diameter, d ri ,, was found to decrease as the number of elements wasincreased until an equilibrium drop size was reached. This equilibrium drop size varied with the fluidvelocity through the mixer. For a dispersion of —0.5% kerosene in water, the correlation of drop sitewith energy dissipation rate, e, was found to give a reasonable agreement with Kolmogoroffs theorymm ith au exponent in the range of -0.47 to -0.56 for a horizontal pipe and -0.60 to -0.72 for U-shapedand offset pipe fittings. The Sauter mean diameter was also correlated against \Veber number with anexponent in the range of -0.71 to -0.83 for all the linings used
Keywords: Sauter mean diameter, dispersion, mixing, on-line measurement. oil-water,fittings.
••■:1—
2.s.16 _L,1 3 . 3
)2':a5'431 " :}" , i •=1=
> ,L2,1 }Lai- ) :,■; )6i 3 .Malvem 2600
\' • -c • y 1, r _51 j3: A
/_; 3 A; •

10 "Effect of Shear Produced by Pipe Fittings on the ..
_53;,L•J
cjI5N1 :4
3L.)+, 45i ( • , c) ;
41:),.. • ,V T— j f.Y. - „Lv.: c 4:LA ,,Let
)]=111 ;4..111 L ra.44, it Weber
Introduction
The detailed design of the removal of water droplets from oil or fromany kind of liquid-liquid separation requires knowledge of dispersionproperties such as the droplet size distribution, dispersed phaseconcentration and the physical properties of the system. However, the valueof these parameters in a section of a pipe does not necessarily represent thedispersion properties in the whole system. Fluids passing through pipes andfittings will experience various forms of turbulence which will have a greatinfluence on these properties. Hence it is essential to determine the effect ofthese fittings in order to gain a better understanding of the dispersionconditions at a specific position in a pipe or plant.
The major aims of this work were:1. To produce data on the effect of the shear through fittings on the
dispersion properties in a heterogenous mixture with preconditioningmixer.to produce data on drop size distributions for use in the design of oil-water separators.
3. to produce a correlation of the dependence of d32 on the energydissipation rate and Weber number for a kerosene/water system .
Drop Breakup in Turbulent Pipe flow
When two liquid phases are mixed, droplets are formed by 'break-up' ofthe dispersed phase in the shear field, while simultaneously, in other parts ofthe flow, droplets are coalescing.
An-Najah Univ. J. Pee.. Vol. 13 (1999) 9-30

Amer EL-Hamouz 11
Kolmogoroffs theory (1949) on isotropic turbulence was pioneering inexplaining this drop break-up. The theory was found to yield the followingexpression, Hinze l . for maximum stable particle size of the dispersed phase.
0.6
kmaxP
0.6 0.4 (I)
where the constant k must be determined from experimental data. Thedetermination of the maximum drop diameter from the drop size distributionis somewhat ambiguous, if not difficult, as the largest drop size in adistribution is hardly reproducible. It is common practise to use a cut offsize in the cumulative drop size distribution as a measure of the maximumsize. Thus, Hinze l defined d 95 , the diameter below which 95°./o of thecumulative drop volume was confined as the maximum drop size andreported a value of k=0.725 in a Couette flow field.
The assumption made is that the smaller eddies produced by thedissipative process are statistically independent, in size, from the primaryeddies and that they are isotropic. A lot of experimental work, (Mlynek andResnick, Shinnar 3 and Sprow4 ), has been done and a satisfactory agreementhas been achieved between the experimental data and equation (1) withdiscrepancy only in the value of the constant k for agitated vessels.
Collins and Knudsen' have published data on drop size distribution ofan oil-water dispersion in well defined turbulent pipe flow. They developeda stochastic mathematical model in which d„,„, is a basic input parameterwhich could predict both the shape of the observed distributions and thekinetics of the droplet breakup process for the distribution produced by theirexperimental turbulent flow field.
Sleicher6 and Paul and Sleicher 7 have reported experimental data forthe maximum stable drop size for two immiscible liquids of differentphysical properties such as viscosity in the range of 0.5 to 32cp , densityfrom 700 to 1585 kg/m3 and interfacial tension from 8 to 45 dyne/cm.flowing in a pipe. The dispersed phase volume fraction was very small (lessthan 1%) so that the coalescence process was negligible. Hughmark s used
An-Najah Univ. J. Res.. Vol. 13 (1999) 9-30

12 "Effect of Shear Produced by Pipe Fittings on the
the data from Sleicher 6 and Paul and Sleicher' and produce a correlation tocalculate the maximum drop size for two pipe sizes (0.5 and 1.5" I.D).
Karabelas c carried out experimental work with water dispersed inhydrocarbon at various flow rates to measure the drop size distribution inwell-mixed dilute liquid-liquid dispersion (of a maximum of 0.26% watervolume concentration) across the vertical profile of horizontal pipeline usingphotographic and droplet encapsulation techniques to measure themaximum stable drop size. where N we is the Weber number, which is theratio of the viscous force in surface tension force defined by
PI'' DIPV a (2)
In systems where mass transfer is important it is useful to have aknowledge of the interfacial area, a, given by
a , 60
Therefore the Sauter mean diameter, d32„ has been used to replace inequation (1), which reconciled the discrepancies among the findings ofvarious investigators. Equation 1 can then be written as
cp6
c13 —kit 06 a4 (10
This equation is valid for low dispersed phase hold up. A number ofworkers, Mersmann Grossmann''', have proposed equations of a similarform based on experimental results,.
Hanzevack and Demefriou ll studied the effect of flow velocity andpipeline configuration of 1% water-kerosene dispersion in turbulent flowusing laser image processing. Suidving ti-le concentration profile in ahorizontal 8.2cm I.D. pipe, they dai men that the transitt how =n I'd inadequately dispersed flow occurred at -i.bo -Lit 2 3 inis
d 32 (3)
An-Najah Univ 3. Res Vol 13 (1999) 9-30

CI
Amer EL-Hamouz 13
Middleman' correlated the Sauter mean diameter as a function ofWeber number and Reynolds number in the following equation
7- 0. 132_ ___Dh v 2 1 We 1 Re (5)
A/icitsumura el a/13 reported a variation of the exponent of Webernumber in equation 6 to be between -0.57 to -0.67 and that the value of k 7 isdependent on the viscosity of the emulsion.
Experimental ProcedureA schematic diagram of the flow loop used in the experimental work is
shown in (Figure 1). The two liquid phases were stored in polypropylenetanks of 2m3 volume (a small storage tank of 20 litre capacity was alsolinked to the rig for use at low concentration of oil phase) from which thefluids were pumped, in the required ratios, at rates of up to 8e/h. to therig's tessection. The two streams were joined at the inlet of a "Light in" in-line static mixer. The purpose of this device was to precondition the feeddispersion. The flow rate of the continuous phase was 20-84 I/min.(corresponding to 0.65-2.76 trils superficial velocity through 1" I.D pipefitting giving Reynolds numbers for water continuous dispersions up to7'10") and regulated by a control valve. The kerosene/water volumetricratio was maintained at 1:200 through the entire set of experiments. Themixture was then fed into a fibre bed coalescer where it was separated intotwo constituent phases which were then recycled to the feed tanks.
The continuous flow rate, temperature and pressure across the fittingswere logged by a computer. Quantitative information on the flow rate andthe pressure drop across the fittings was required to calculate the energydissipated through the fitting.
The drop size distributions were measured using a laser diffractiontechnique,Stewart et al 14 . The analysis of tile daia collected is based onFaunhofer diffraction theory Nalvern i j Experiments have been carriedout to obtain drop size distribution proli!es ior different pi-es Lcornetries.
Univ. Res ',/c/ 13 (1999) 9-30

›i Quell 16101 (tam
este tht pima
14
"Effect of Shear Produced by Pipe Fittings on the
Reseiploes111atmg
1-7sre krrcsele'ark 'al IC S COr entrat ,On
Figure (1): Experimental rig in the Pilot Plant.
Fittings Used
The geometries studies can be divided into four cases:
Case one: static mixer placed directly before the test cell. In this casethe number of elements in the static mixer was varied from 0 to 18.
Case two: horizontal pipe of length 18d (d=1") fitted after the staticmixer.
Case three: two separate "U" shape pipe fittings of 42d and 18d totallength oriented horizontally and vertically (upward and downward) to themain flow, positioned after the static mixer.
Case four: an offset pipe fitting of 18d total length and including twonormal radius elbows.
This was positioned after the static mixer .
In cases two to four the static mixer was fitted with 18 elements .
The geometry of each of these cases is illustrated in Figure 2 .
An-Najah Limy, J. Res , Vol 13 (1999) 9-30

....tic mixer
13sota mixer ri
18"18d
Figure (2): Dispersion rig with all the fittings used.
DisKrsed phase
(kerosene)
to coalesrerPTX1
0
case one
Nlaivern1
Amer EL-Hamouz 15
Results and Discussion
The drop size distribution in a pipe or fitting may be related to the shearof the system. Previous workers, Collins and Knudsen', have basedcorrelations of drop size on Kolmogoroffs theory which relates themaximum stable drop size, d n., to the energy dissipation rate, e. In thiswork the Sauter mean diameter, d32, was correlated with energy dissipationrate, e, for all of the cases described above .
For different oil-water systems the density and interfacial tension willchange. According to Kolmogoroffs theory, drop size distribution will alsobe a function of these properties. Therefore, results from this work have alsobeen correlated with Weber number, Nw e, defined by equation 2 which isdependent on the physical properties of the system. The correlation isparticularly useful for systems where chemical additives were presentresulting in a sianificant decrease in interfacial tension. The effect of suchadditives on the characteristics of kerosene-water dispersions is reportedelsewhere, (Stewart et al 14).
An-Najah Univ. J. Res., Vol. 13 (1999) 9-30

16 "Effect of Shear Produced by Pipe Fittings on the
The shear is also a function of Reynolds number
Re pvD
(6)
In this work, only one oil-water system and a constant pipe diameter(1") was used, therefore velocity is the only variable in the above equation.
If a fluid of volumetric flow rate Q passes through a fitting of length Land diameter D then the residence time t is given by
= ;TD 2 I L
where V is the velocity of the fluid passing through the mixer of diameter D.The rate of energy dissipation per unit mass contained in the mixer is
4 OAP I/AErcD 2 Lp c 1-Pc (8)
and the energy dissipated per unit mass of the passing fluid through themixer is
L = TE = 1) , (9)
Effect of Number of Elements in the Static Mixer on the Equilibriumvalue of d 32 .
The static mixer used was flexible in the fact it was possible to changethe number of elements and alter their orientation depending on thedispersion required and the state of the fluid stream (laminar or turbulent).The Reynolds number was calculated for all experimental conditions and itwas varied from 16500 to 70,000 and it was found that the flow was in theturbulent regime. Therefore the mixer elements were arranged asrecommended by the manufacture for this flow regime as shown in Figure 3.
40 V
(7)
An-Najah Univ. J. Res.. Vol. 13 (1999) 9-30

.77
Figure (3): In-line mixing elements
Amer EL-Hamouz 17
A set of experiments was carried out to obtain a profile of the change ofdroplet size distribution with the number of static mixer elements (staticmixer length) for case one described above. The number of elements wasvaried from 4 to 18. For the same number of elements, the higher thevelocity the more the shear produced and the lower the d32. As the fluidmixture passes through a field of constant turbulence intensity, the dispersedphase elements disintegrate into finer droplets. This process of break-up andcoalescence of the dispersed phase continues as long as the turbulence ismaintained. The time scale of the equilibrium rate of the dispersion andcoalescence processes is still uncertain. The equilibrium rate has a specialrelevance in operations in which the residence time is short and is of crucialimportance in static mixers. The position of this equilibrium is controlled bythe turbulence intensity and hence the value of e for a liquid-liquid system.Figure (4) shows the equilibrium Sauter mean diameter, d32, as a function ofthe flow velocity through the mixer. For a constant velocity, the residencetime increases as the number of elements increases. This results indecreasing di, up to a point where a dynamic equilibrium is achieved. Atthis point the rate of coalescence is equal to the rate of dispersion resultingin a constant average drop size at each velocity. 400um at 0.75 m/s and70mm at 2.5 nVs. The presence of mixer elements greater than the numberrequired to achieve equilibrium, serves merely to maintain that equilibrium
The rate at which drops are dispersed, the residence time required toachieve equilibrium, as well as the equilibrium value of d32 were found to bestrongly dependant on the rate of energy dissipation per unit of mixervolume. Higher fluid velocities induce large values of E (as a result ofhigher pressure drop across the static mixer) which in turn result in faster
An-Najah Univ. J. Res., Vol. 13 (1999) 9-30

18 "Effect of Shear Produced by Pipe Fittings on the
disintegration, finer equilibrium dispersions and shorter residence timerequirements to obtain equilibrium dispersions.
The effect of energy dissipation rate on Sauter mean diameter fordifferent static mixer elements is shown in Figure (5). The logarithmicdependence of d32 as predicted by Kolmogoroffs theory (equation 5) isdemonstrated in this figure.
number of elements
Figure (4): Kinetics of drop dispersion
Comparison of Present Work with Published Data
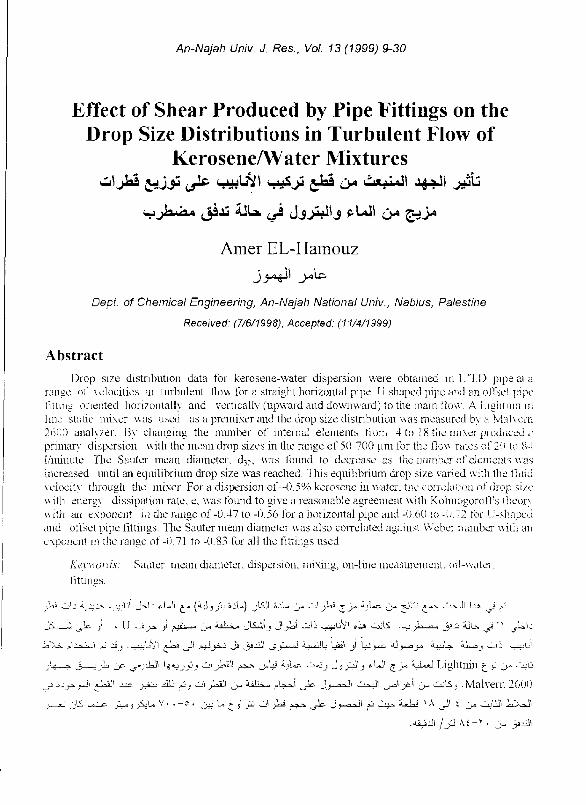
Kolmogoroffs theory predicts an exponent of -0.4 to the energydissipation rate and -0.6 for N„, whereas the present experimental data hasan exponent in the range of -0.47 to -0.56 for energy dissipation rate and -0.71 to -0.83 for Weber number. This discrepancy is most likely due to thedeparture from the homogenous, isotropic turbulence structure assumed inthe theoretical development and is similar to that found from theexperimental work of AL-Taweel and Walker 16 . Their data producedexponents of -0.6 and -0.75 for energy dissipation rate and Weber numberrespectively. The data obtained in this work was for 0.5% dispersed phaseconcentration whereas the work presented by AL-Taweel and Walker'" wasfor 1% phase concentration. Figure (6) shows that the equilibrium value ofd32 is effected by the phase ratio. The higher the phase ratio the larger thevalue of d32.
An-Najah Univ. J. Res., Vol. 13 (1999) 9-30
14- this work 1L-Taw eel and Wal ke.I
Amer EL-Hamouz 19
1 0
20
30
4
number of elementsFigure (5): Comparison of the equilibrium value of d32 with publisheddata_
10 00
r.;H
1) 100
7-%10
==nr242111 '■• al ITZ 71; 1 i ■■•■■••mmialIIMINIIINIMMIMMIN••NN_....=largrarnig==.11..
IMIW-3.1010.0110.1■11MINIIMEManIMIIIMI=MMIIIMENOMINIMMaiIMMIEL.:•... MIMEIIi....■PIIIM=MIIIIIII MINIM111111•1111
11.11MYlartra lalarlitS.S..1111C,AMPIIMMIUMMOMMIMMENI
"...74%trAitillitg illiValllilMEMMInill
'%bNii*allPihilliffi.....1..............m....,.= ... ''=■"....;:!...%)..."■:4...-47.1:122.2•amancalan msrazzratz....vmsrage.NIMMIKHEIMIIM..... le.nialiMINSantIMM011MENIM MMIIMOM:11. I =WO
1111101.1111111....11111111IMOSUlaillINIMMOMIIIIIIIIMMOMIENNUMMIMMIIIIMII+ 4 6 :rricnt. - 6 clenmns '1-- g ei:dneins 1110 tden,,ra:
7,11' elements _ 16 dernent, •• 18 elemeNs.................. ..■...............
10 100 1000
10000
Energy dissipation rate (11(g. ․ )
Figure 6: Effect of Energy dissipation rate on sauter mean diameter
Chen and Libby l reported that using the Sulzer static mixer for an oil-water system, the following correlation could be used to predict the Sautermean diameter, d32
6132 =1 14N —Cs-7 5D
( •0.18fid
(10)
An-Najah Univ. J. Res., Vol. 13 (1999) 9-30

20 "Effect of Shear Produced by Pipe Fittings on the
When equation 10 is used to predict the d32 as a function of Weber numberfor the kerosene-water system, good agreement between our results and thisprediction as shown in Figure (7). The discrepancy may be due to the valueof the constant (k=1.14) in the correlation. From the present data theexponent on the Weber number was in the range -0.71 to -0.83 which islower than that predicted by the widely used theory of drop break up,Kolmogoroffs theory, in the inertial sub-range. Recently Baldyga andBourne 18-19 and Bourne2° explained that this exponent could be smaller than-0.6 down to a value of -0.93 due to the fact that the theory ignoresintermittency and employs a time averaged energy dissipation rate.However this and other turbulence characteristics are more accuratelyrepresented by a distribution which Baldyga and Bourne 18 predicted usingmultifractals.
1000
a.
100
0
;4.
10
il=10.1=1.1■■■■=1=IMINIMIMMINIMIN.MINI=1111 MI=MMINIMMIIOM
■IIMMIIMINIMINils.-.1i.i......101===MEN Olii.liM=MMig
....1171MIMINO.la..\44:101111171.4Z1....
=MME• NM=M=MNIMME11.
IMENIMME
01111111G '■1 4121.110SZU IMINIIIII■I■I11111111111111M11-51ia■MNIMINIMIll
11SRM1 11111
■■=1MMMIll
-----■■■■■■••
111111Nt.,112416..M11111-:•.......-.."..1,14.74.54ft.
,..--a.,..-+=■■•■■•••
....FWAiLIMiShMI
-.....7marms
-,:;.......:■romusMIMI
lamaimiummminom■M=MONIMI
MI=M111111•11M • 11 — , .
-4 elements 6 elements 5 eiemen s
■ 10 elements 12 elements .• 16 elementsI ix chen and Libby 1978 18 elements
■-■i.m■i •• ,
100
1000
Weber number
Figure (7): Sauter mean diameter as a function of 1 '
Although mixing elements such as bends and pi pe ee config_rationsare often counted on to provide sufficient tw -buient miy7ing tg. -7:, insurerepresentative sampling, they have not been studied thoruughiy. The onlywork reported in the open literature in which the efTe.,:c of rntinus on di opsize distributions for liquid-liquid dispersion has been studied is ti atofHanzevack and Demetriou ll . They measured
An-Najah Univ. J. Res., Vol. 13 (1999) 9 - 30

•-6 elementselements
10 elements-12 elements
x-16 eiemnts
Amer EL-Hamouz 2 1
line configuration on the maximum drop size (d 99 ) and concentration profilefor a 1% water-kerosene dispersion. No comparison could be made betweenthe results and those of Hanzevack and Demetriou' l for several reasons;firstly their continuous phase was kerosene, whereas water was thecontinuous phase in this work. Secondly, the pipe diameter in their work isS.2 cm whereas in ours it was 2.5cm. Thirdly, they did not use a premixersuch as a static mixer and finally, a different drop size distributionmeasurement technique was used (laser image processing).
The energy expended in the process of phase dispersion, E, is correlatedwith interfacial area generated in Figure (8). It can be seen that the sameinterfacial area can be produced using different combinations of velocityand mixer elements, or expressed in more fundamental terms, by usingdifferent combinations of turbulence intensity and residence time.
71)0
600 -
500 -
400 -
300 -
200 -
100 -
0 -0 5 10 15 20 25
30
Energy dissipation, (J kg)
Figure (8): Interfacial area generated by the static mixer.
Therefore, it is of interest to know the effect of increasing the number ofelements at a particular velocity on the efficiency of conversion ofmechanical to surface energy. The efficiency of utilisation can be obtainedby comparing the free energy of the newly generated surface to themechanical energy that is expended to generate it. Thus where d 320 is theSauter mean diameter at the entrance of the static mixer which has beenmeasured experimentally. The higher efficiency of dispersion, underconditions of high velocity and small number of elements, can be attributed
An-Nejah Univ J. Res., Vol 13 (1999) 9-30

60o-
= p ^ E d 32 d3201 00 %
22 "Effect of Shear Produced by Pipe Fittings on the
to the rapid rate of droplet break-up when the average drop size is muchlarger than the equilibrium size. Conversely after the equilibrium conditionshave been established, the rate of interfacial area production and theefficiency of energy utilisation both tend to zero. At any point in the mixer,the driving force for droplet break-up is the difference between the localaverage drop size and the local equilibrium drop size. As the dispersionflows through the mixer, this driving force decreases to a point wherefurther reduction in drop size requires disproportionately larger incrementsin residence time. The efficiency calculated using Equation (11) is shown inFigure (9) for different numbers of mixer elements and velocities.
0. 1 20L•-velocity= 1 0 m"s 211 rn'
41-velocity= 2 rm's II- vein:71'N= 2 5n1
0.100 -
a
0 . 080 -
■ I I7 8 9 10 11 12 13 14 15 16
number of elements
Figure (9): Efficiency utilization of static mixer at different flowvelocities.
Effect of Horizontal Pipe on Sauter Mean Diameter, d32.
The drop size distribution profile for a static mixer fitted after 18d(d=1") horizontal pipe and before the test cell have been compared withdrop size distribution profile of 18d horizontal pipe fitted after the staticmixer. A plot of Sauter mean diameter against the fluid velocity for this case
0.060
An-Najah Univ. J. Res.. Vol. 13 (1999) 9-30

1 ‘.81
1 1.3 1.5
Amer EL-Hamouz 23
shows that at the same value of velocity, d32 is higher when the 18d pipe isfitted between the static mixer and the test cell. The results plotted inFigure(10), show a significant degree of coalescence takes place even athigh fluid velocities when the residence time is extremely short. Forexample when the fluid velocity is changed from 0.8 to 2.25m/s, theresidence time decreases from 0.6 to 0.25s. In both cases the Sauter meandiameter was found to increase between the exit of the static mixer and theend of the 18d horizontal pipe. At fluid velocity of 0.8m/s there was a 42%increase observed compared to a 25% increase at 2.25m/s. These changesare proportional to the change in the residence time.
600
500 -
400 -
300 -
200 -
100 -
-, 18" pipe after the static mixer • 18" pipe before the static mixer
0 - 1 I
0 0.3 0.5 0.8 23 2 5
velocity, (m/s)
Figure (10): Effect of horizontal pipe on Sauter mean diameter.
Effect of 'U' Shaped Pipe on Sauter Mean Diameter, d32.
Two 'U' shaped pipe fittings with four standard radius bends of totallength of 18d and 43d were fitted after the static mixer. The 18d 'U' pipefitting was chosen to get a 'U' pipe fitting with a total length equal to the 1 8 dhorizontal pipe without any elbows. The 43d 'U' pipe fitting was chosen toget a 'U' pipe fitting with a distance of 18d between the inlet and outlet. Thegeometry of the 'U' pipe fittings used, together with all dimensions, is shownin Figure (2). In all cases, the 'U' pipe fittings were fitted after the staticmixer and were oriented horizontally and vertically (upward and downward)to the main flow.
An-Najah Univ. J. Res. Vol. 13 (1999) 9-30

24 "Effect of Shear Produced by Pipe Fittings on the
Figure (11) shows the change in d32 as a function of velocity for an 18dhorizontal pipe fitted after the static mixer and 18d pipe fitting orientedhorizontally to the main flow after the static mixer so that gravity will playno role in the breakup or coalescence of droplets. It can be clearly seen thatat the same value of flow rate, the Sauter mean diameter, d32, is smaller atthe exit of the 'U' pipe fitting than at the exit of the horizontal pipe as aresult of the increased shear produced by the four standard elbows in the 'U'pipe fitting.
05 1.5 2 2.5
F4-18clhor. pipe -•-18d hor. "U“ pipe]
0
600
500
400 -
300 -
200 -
100 -
velocity (in's)
Figure (11): Effect of geometry on Sauter mean diameter.
Drop size distributions were measured for the 43d 'U' pipe fitting andresults were compared with that of thel8d 'U' pipe fitting. The onlydifference in the two fittings is the total length of the pipe, both have fourstandard elbows and were oriented horizontally to the main flow. At thesame flow rate, the Sauter mean diameter, d32, of the drop size distributionproduced by the large 'U' pipe fitting is larger than that produced by thesmall 'U' pipe fitting. This is due to the higher rate of coalescence of dropsin the large 'U' which is more than twice the length of the small 'U' pipefitting. This is well demonstrated in Figure (12). The exponent of thecorrelation relating the Sauter mean diameter and the energy dissipation wasin the range of -0.6 to -0.72. The error bars in this figure show the 95%confidence limits, which indicate although the effect of the increased lengthis small it is significant.
An-Najah Univ. J. Res.. Vol. 13 (1999) 9-30

I—Mrge fitting -&-small fitting)
Amer EL-Hamouz 25
Figure (12): Comparison of Sauter mean diameter for small and large'U' fittings.
Effect of an Offset Pipe on Sauter Mean Diameter, d32.
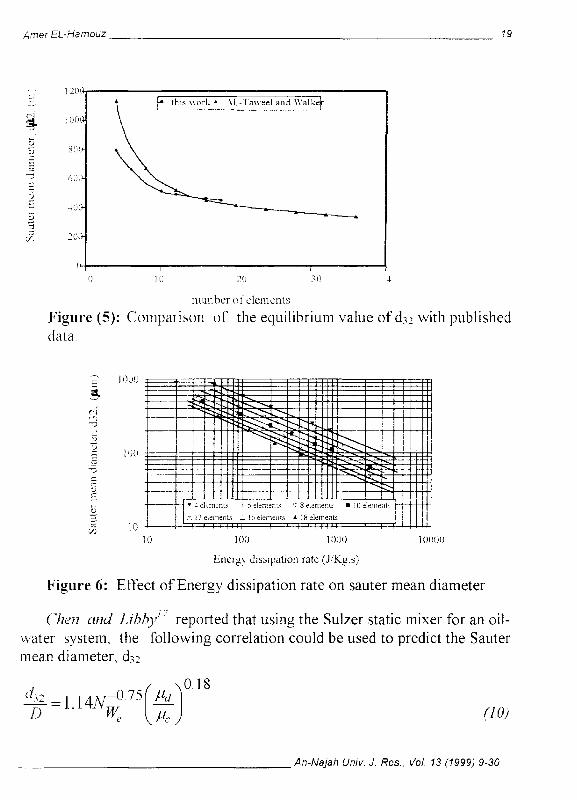
The offset pipe fitting had two standard elbows and was 13d in lengthwhich is equal to the length of one of the arms of the 43d 'U' pipe fitting.The offset pipe was oriented horizontally and vertically (upward anddownward) to the main flow after the static mixer as shown in Figure (2).When drop size distribution profiles of the offset pipe and the 'U' pipefitting, oriented vertically upward to the main flow, against fluid velocitywere compared, (Figure 13), a marked difference in the value of d32 wasnoticed, the error bars again indicate the 95% confidence limits. At the samevelocity, the Sauter mean diameter for the 'U -4 pipe fitting is larger than thatof the offset pipe. This indicates that the rate of drop coalescence due to theextra 30d of pipe length was greater than the rate of drop breakup from thetwo extra elbows in the 'U' pipe fitting. When the fittings were verticallyoriented, the pressure drop across the offset pipe fitting was greater than thatfor the 'U' pipe fitting at the same flow rate. This is due to the fact that thenet pressure drop across the first and second arm of the 'U' pipe fitting isnegligible especially when it is vertically oriented (due to the flow in thedirection of gravity in one arm and opposite to the gravity in the other armof the 'U' fitting).
The equivalent length of a fitting is the length of straight pipe which
An-Najah Univ. J. Res , Vol. 13 (1999) 9-30
300 -c
E 200 -
100 -
0
0 0.5 1 1.5 2
velocity, (m/s)
26 "Effect of Shear Produced by Pipe Fittings on the
Figure (13): Effect of two and four bends oriented upward to the mainflow on the Sauter mean diameter.
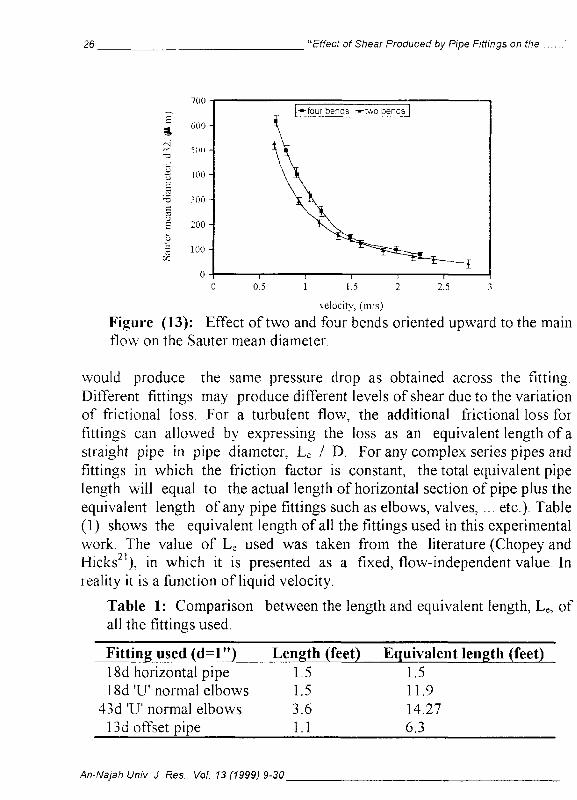
would produce the same pressure drop as obtained across the fitting.Different fittings may produce different levels of shear due to the variationof frictional loss. For a turbulent flow, the additional frictional loss forfittings can allowed by expressing the loss as an equivalent length of astraight pipe in pipe diameter, Le / D. For any complex series pipes andfittings in which the friction factor is constant, the total equivalent pipelength will equal to the actual length of horizontal section of pipe plus theequivalent length of any pipe fittings such as elbows, valves, ... etc.). Table(1) shows the equivalent length of all the fittings used in this experimentalwork. The value of L e used was taken from the literature (Chopey andHicks 21 ), in which it is presented as a fixed, flow-independent value. Inreality it is a function of liquid velocity.
Table 1: Comparison between the length and equivalent length, L e, ofall the fittings used.
Fitting used (d=1")18d horizontal pipe18d 'U' normal elbows
43d 'U' normal elbows13d offset pipe
Length (feet)1.51.53.61.1
Equivalent length (feet)1.511.914.276,3
An-Najah Univ. J. Res.. Vol. 13 (1999) 9-30
Amer EL-Harnouz 27
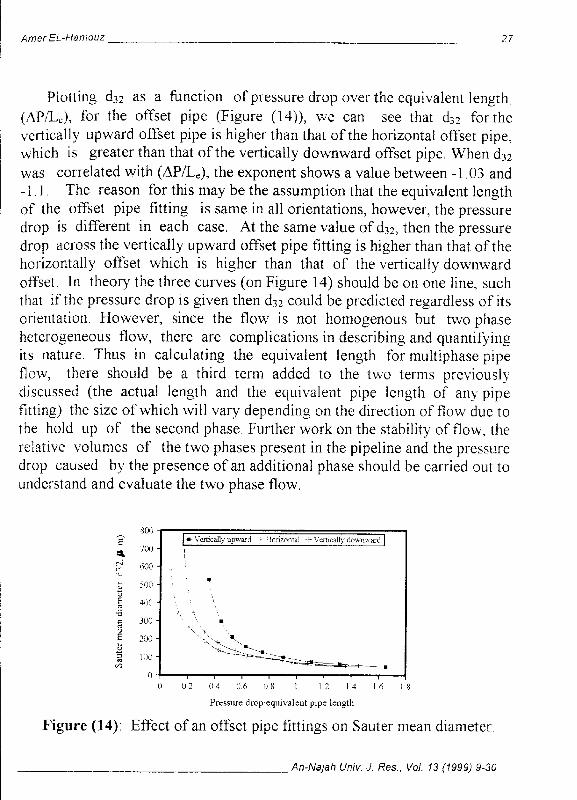
Plotting d 32 as a function of pressure drop over the equivalent length,(AP/Le), for the offset pipe (Figure (14)), we can see that d 32 for thevertically upward offset pipe is higher than that of the horizontal offset pipe,which is greater than that of the vertically downward offset pipe. When d32was correlated with (AP/Le), the exponent shows a value between -1.03 and-1.1. The reason for this may be the assumption that the equivalent lengthof the offset pipe fitting is same in all orientations, however, the pressuredrop is different in each case. At the same value of d32, then the pressuredrop across the vertically upward offset pipe fitting is higher than that of thehorizontally offset which is higher than that of the vertically downwardoffset. In theory the three curves (on Figure 14) should be on one line, suchthat if the pressure drop is given then d32 could be predicted regardless of itsorientation. However, since the flow is not homogenous but two phaseheterogeneous flow, there are complications in describing and quantifyingits nature. Thus in calculating the equivalent length for multiphase pipeflow, there should be a third term added to the two terms previouslydiscussed (the actual length and the equivalent pipe length of any pipefitting) the size of which will vary depending on the direction of flow due tothe hold up of the second phase. Further work on the stability of flow, therelative volumes of the two phases present in the pipeline and the pressuredrop caused by the presence of an additional phase should be carried out tounderstand and evaluate the two phase flow.
Pressure drop equivalent pipe length
Figure (14): Effect of an offset pipe fittings on Sauter mean diameter.
An-Najah Univ. J. Res., Vol. 13 (1999) 9-30

2t "Effect of Shear Produced by Pipe Fittings on the
Conclusions
Drop size distribution measurements were carried out on-line using amodified Malvern 2600 laser diffraction instrument aligned through aspecially constructed glass-walled test cell. This instrument was found toprovide reproducible and accurate data for dispersed phase concentrations0.5%. From the analysis of the drop size distribution data obtained, anumber of conclusions can be drawn:1 Correlation of the mean drop size with the energy dissipation rate, E,
were produced and gave an exponent of -0.47 to -0.56 for a horizontalpipe configuration and -0.6 to -0.72 for the 'It pipe fittings. The energydissipation rate, E, strongly affects the equilibrium value of d i - 2; and therate at which it is achieved.
2. The Weber number (the ratio of inertia to surface tension forces) wasalso correlated with Sauter mean diameter and shows an exponent in therange of -0.71 to -0.83 for both horizontal pipe configurations and 'Upipe fittings of the lengths tested.
3. Correlations of the mean drop size with the pressure drop overequivalent length, (A13/1_,), for all the fittings oriented horizontally andvertically (upward and downward) to the main flow were produced andfound to give an exponent in the range of -1_.l to - 103.d 3 , is approximately 25% larger at 18d downstream of the static mixerthan that at the exit of the mixer. This indicates that a significant degreeof coalescence occurs even in a relatively short length of horizontalpipe. This result has important implications for the design proceduresused for mixing plant and for the process requiring the separation ofliquid-liquid dispersions as it suggests that the order of pipes andfittings in a flow network can have a profound effect on the nature ofthe dispersion at the exit stream.
References1. Hinze J.O., Fundamentals of the Hydrodynamic Mechanism of Splitting in
Dispersion Processes, AlChE 11(3), (1955) 289.2. Mlynek Y.: Resnick W., Drop Sizes in Agitated Liquid-Liquid Systems.
.41C hE J, 18(1), (1972), 122.3. Shinnar R., On the Behaviour of Liquid Dispersions, .1. Fluid Mech. 10,
An-Najah Univ. J. Res., Vol. 13 (1999) 9-30

Amer EL-r'amouz 29
(1961) 259.4. Sprow F. B., Distribution of Drop Sizes Produced in Turbulent Liquid-Liquid
Dispersion, Chem, Eng, Sci., 22, (1967). 435.Collins S. B.: Knudsen J. G., Drop-Size Distributions Produced by TurbulentPipe Flow of Immiscible Liquids, AIChE J., 16(6), (1970) 1072.
6. Sleicher C. A., Maximum Stable Drop Size in Turbulent Flow, ,41ChEJ, 8 (4),(1962) 471.
7. Paul H. I.; Sleicher C. A., The Maximum Stable Drop Size in Turbulent Flew:Effect of Pipe Diameter, Chem. Eng. 20 (1965) 57.
S Hughmark G. A., Drop Breakup in Turbulent Pipe Flow. AlChE J., 17(4),(1971), 1000.
9. Karabelas A. J., Droplet Size Spectra Generated in Turbulent Pipe Flow ofDilute Liquid-Liquid Dispersions, AlChE j., 24(2), (1978), 171.
10. Mersmann A: Grossmann H.. Dispergieren in Flussigen Zweiphasen system,Chem. Ing. Tech., 52, (1980), 621.
11 Hanzevack EL; Demctriou C.D., Effect of Velocity and PipelineConfiguration on Dispersion in Turbulent Hydrocarbon-Water Flow UsingLaser Image Processing,. Icr J. 'vltlaphase Flow, 15(6), (1989), 985.
12 Middleman S., Drop Size Distributions Produced by Turbulent Pipe Flow ofImmiscible, Fluids Through a Static Mixer, Ind. Eng. Chem. Process. Des.Del.•, 13, (1974), 78.
13 Matsumura K. Morishima Y.; Masuda, K; Ilcenago, H., Some PerformanceData of the Hi-Mixer, an In-Line Mixer., Chem. Ing. Tech, 53, (1981), 52.
14. Stewart A.C: EL-Hamouz A.M.; Davies G.A., Effect of Chemical Additiveson the Interfacial Properties of Oil-Water Mixture, J.Disp. Sci. Tech.. 17(6),(1996). 675 .
15. Malvern Instruments. 2600 Series user Manual, (1992).16.AL-Taweei A.M.; Walker L.D., Liquid Dispersion in Static In-Line Mixers,
The Canadian Journal of Chemical Engineering, 61, (1983), 527,17. Chen S.J.; Libby D.R.., Gas, Liquid and Liquid-Liquid Dispersions in a
Kenics Mixer, 71st Annual AIChE Meeting, (1978).18. Baldvga J.; Bourne J. R., Drop Breakup and Intermittent Turbulence, Journal
of Chemical Engineering ofJapan, 26(6), (1993), 738.19. Baldyga J.: Bourne J. R., Drop Breakup in the Viscous Subrange: A Source of
Possible Confusion, Chem Eng. Sci., 49(7), (1994), 1077.20. Bourne J.R., Personal Communication (1994).21. Chopey N.P.: Hicks T. G., "Handbook of Chemical Engineering Calculations",
First Edition, McGraw Hill Book Company, New York (1984).
An-Najah Univ. J. Res., Vol. 13 (1999) 9-30

30 "Effect of Shear Produced by Pipe Fittings on the
Appendix A: Nomenclaturea Interfacial area, in - ni -3
D pipe diameter, mPh hydraulic pipe diameter, md T11,IX maximum drop diameter, tmd32 Sauter mean drop diameter, umd320 Sauter mean drop diameter upstream from the mixer, umE energy dissipation per unit mass of fluid, Jf friction factor in a pipe, dimensionless
proportionality constant, i=1,2,3L mixer length, mL, pipe equivalent length, m
Reynolds number, dimensionlessWeber number, dimensionless
DP pressure drop, kp a
Q volumetric flow rate, m 3 s -1
✓ velocity, m
Greek letterse energy dissipation rate per unit mass of fluid, J s '
s interfacial tension, mNf dispersed phase volumetric fractionr, density of continuous phase, kg m - 't residence time, sm c viscosity of continuous phase. N s m -2
m,d viscosity of dispersed phase, N s in --
density of the fluid, kg/in -'h efficiency of conversion of mechanical to surface energy. dimensionles
Subscriptsnormal radius elbow
c know le dgm ent
The author would like to thank Marine Technology Directorate Ltd. and theindustrial sponsors of the managed program on the design and Instrumentation ofPrimary Separation Systems (DIPSS) for funding this project. All the experimentalwork was carried out at UMIST. A special thanks is also due to Dr A. Stewart forher encouragement.
An-Najah Univ. J. Res., Vol. 13 (1999) 9-30