FFA LAND JUDGING SCORECARD INSTRUCTIONS · FFA LAND JUDGING SCORECARD INSTRUCTIONS By the staff of...
30
8/24/2012 1 FFA LAND JUDGING SCORECARD INSTRUCTIONS By the staff of the Department of Soil Science University of Minnesota-St. Paul - 2005 With Assistance from Lauren Klement (GFW FFA) Introduction A. Physical and chemical properties of soil affect plant growth and, therefore, crop production. They affect the amount of water and nutrients available to the plant, the aeration, temperature, and drainage of the root zone. Fortunately, many important soil physical properties can be estimated with reasonable accuracy through observation. These soil-judging instructions go with the scorecard to be used in the field. The instructor needs to give the student advance preparation before judging in the field. To judge the soil, its physical features must be investigated. Part 1. SURFACE SOIL Part 2. SUBSOIL Part 3. Parent Material A. Soil Horizons (Layers Of Soil) Observe the soil profile in the judging pit or in the judging Tray. Determine the depth of the dark colored surface soil (called the A horizon). This is the depth of the horizon with greatest organic matter accumulation and generally the darkest colored horizon. Plowing may have mixed the surface (topsoil) soil of the A horizon (if it is a shallow horizon) with the soil from the horizon below the A Horizon which is known as subsoil. If there is erosion potential on these mixed shallow horizons, severe erosion may actually remove the A horizon. Under these shallow conditions, record the depth of the tillage layer. This is called Ap. A Horizon with a plow layer. Next determine the depth of the bottom boundary of the subsoil horizons. In a forest soil, there will be a leached gray horizon or a horizon that is lighter in color then the A horizon and lighter then the B-horizon. It is not a deep horizon. This lighter colored horizon is called the E Horizon. The E Horizon is found not in all soil profiles so you will not always see this horizon. The E horizon is to be included in the subsoil for depth measurement purposes. Tillage may have mixed the soil layers. The subsoil, which is called the B-horizon, will be present below the A or the E horizon. It is lower in organic matter so it will be a lighter color then the surface soil in the A horizon. There can be an accumulation of iron and aluminum compounds or clay in the B Horizon. The soil structure and color of this soil is distinctly different from the soil structure and color in the A horizon and the horizon below it. The underlying material is called the C Horizon. Weathering has occurred to some extent but is has not been subjected to biological (plant/animal) activity. The C Horizon may be like or it may be different than the parent material which is what the surface and subsoil were formed from. Underlying material may include bedrock and would be called an R Horizon. Cementation may be present.
-
Upload
trinhthien -
Category
Documents
-
view
216 -
download
0
Transcript of FFA LAND JUDGING SCORECARD INSTRUCTIONS · FFA LAND JUDGING SCORECARD INSTRUCTIONS By the staff of...

8/24/2012 1
FFA LAND JUDGING SCORECARD INSTRUCTIONS
By the staff of the Department of Soil Science
University of Minnesota-St. Paul - 2005
With Assistance from Lauren Klement (GFW FFA)
Introduction
A. Physical and chemical properties of soil affect plant growth and, therefore, crop production.
They affect the amount of water and nutrients available to the plant, the aeration, temperature, and
drainage of the root zone. Fortunately, many important soil physical properties can be estimated
with reasonable accuracy through observation.
These soil-judging instructions go with the scorecard to be used in the field. The instructor needs to
give the student advance preparation before judging in the field.
To judge the soil, its physical features must be investigated.
Part 1. SURFACE SOIL
Part 2. SUBSOIL
Part 3. Parent Material
A. Soil Horizons (Layers Of Soil)
Observe the soil profile in the judging pit or in the judging Tray. Determine the depth of the dark
colored surface soil (called the A horizon). This is the depth of the horizon with greatest organic
matter accumulation and generally the darkest colored horizon. Plowing may have mixed the
surface (topsoil) soil of the A horizon (if it is a shallow horizon) with the soil from the horizon
below the A Horizon which is known as subsoil. If there is erosion potential on these mixed
shallow horizons, severe erosion may actually remove the A horizon.
Under these shallow conditions, record the depth of the tillage layer. This is called Ap. A Horizon
with a plow layer.
Next determine the depth of the bottom boundary of the subsoil horizons. In a forest soil, there will
be a leached gray horizon or a horizon that is lighter in color then the A horizon and lighter then the
B-horizon. It is not a deep horizon. This lighter colored horizon is called the E Horizon. The E
Horizon is found not in all soil profiles so you will not always see this horizon. The E horizon is to
be included in the subsoil for depth measurement purposes. Tillage may have mixed the soil layers.
The subsoil, which is called the B-horizon, will be present below the A or the E horizon. It is lower
in organic matter so it will be a lighter color then the surface soil in the A horizon. There can be an
accumulation of iron and aluminum compounds or clay in the B Horizon. The soil structure and
color of this soil is distinctly different from the soil structure and color in the A horizon and the
horizon below it.
The underlying material is called the C Horizon. Weathering has occurred to some extent but is
has not been subjected to biological (plant/animal) activity. The C Horizon may be like or it may be
different than the parent material which is what the surface and subsoil were formed from.
Underlying material may include bedrock and would be called an R Horizon. Cementation may
be present.

8/24/2012 2
Use a tape measure to indicate depths in the pit or soil tray and horizon boundaries may be marked in some training contests. Record the depth of each layer.
Bedrock, very gravelly sand, dense glacial till with platy structure, and fragipan layers are
considered unfavorable to root growth. The depth of each of these layers should be entered (Depth
to the top of the pan layer) Part 6-C. A fluctuating or temporary water table is not a layer
unfavorable to root growth. However, a water table permanently maintained at some depth forms a
layer unfavorable to root growth. This is why a permanent water table will be noted on the placard.
B. SOIL COLOR
The surface soil color should be judged when the soil is moist, as the color is usually darker when
the soil is wet and lighter in color when it is dry. Determine the color from soil crushed and well
mixed in your hand. Color descriptions are as follows:
Dark: Black, very dark brown or very dark gray.
Medium: Dark Gray, very dark grayish brown or dark grayish brown or dark brown.
Light: Gray, light gray, or grayish brown or dark yellowish brown.
SUBSOIL COLOR AND INTERNAL DRAINAGE
Scorecard
Notation
Subsoil Color Internal
Drainage
Bright
Uniformly brown, dark brown, yellowish brown, dark
yellowish brown or reddish brown throughout the subsoil.
(See R,YR, and Y pages in Munsell Color Manual)
Well Drained
Mottled
Mottled upper subsoil, the lower subsoil will be gray or
mottled. (Gley pages in Munsell Color Chart show gray for
Poorly Drained)
Somewhat
Poorly Drained
Dull
Dull gray or olive color subsoil, some mottles may be present
(See Gley page in Munsell Color Chart)
Poor or Very
Poorly Drained
Surface or subsurface drainage is often required for the last two classes if crop and land values
permit. Very fine textured soils require close tile spacing that may not be economical.
Check Internal Drainage in Part 5-F.
C. SOIL TEXTURE
(Soil Texture is closely related to Available Water Capacity in Part 6) The individual soil particles vary greatly in size. Soil particles are classified as clay, silt, sand and
gravel on the basis of increasing size. Gravel is greater than 2mm in diameter.
Soil Texture refers to the relative proportions of the various size groups of individual soil particles
(clay, silt, and sand). A loam soil contains appreciable amounts of two or more particle sizes.
Specifically, loam contains 7-27 % clay, 28-50% silt and less then 52% sand. The textural triangle
shows the composition of soil and the percentages of sand, silt and clay.
It is very important to accurately describe the soil texture because if affects so many other items on
the scorecard such as drainage, landform, and evaluation for community development.

8/24/2012 3
Descriptions:
Very Fine: Clay, silty clay, and sandy clay
Fine: Sandy clay loam, silty clay loam, and clay loam
Medium: Silt, silt loam, loam,
Moderately Coarse:sandy loam
Coarse: Sands and loamy sand
To identify a soil’s textural group, moisten a small amount of soil to the consistency of putty. Make
a small ball of soil and squeeze it between your thumb and forefinger, pressing the thumb forward
to form the sample into a ribbon.
Very fine textured soils form a long, pliable ribbon. These soils feel smooth and sticky when wet
due to their high clay content.
Fine textured soils form a much shorter ribbon which breaks rather easily under it’s own weight.
These soils are less sticky but usually smooth when moist.
Medium textured soils may and may not form a ribbon depending on clay content. If the soils feel
smooth with a slight gritty feeling, it is a loam. If it is very smooth, like flour, and has no grittiness,
it is a silt loam.
Moderately coarse soils may and may not form a ribbon depending on clay content. If the soils
feel smooth with a very gritty feeling it is a sandy loam.
Coarse textured soils feel gritty and lack smoothness. Loamy sands hold together but fall apart
easily, and feel very gritty. Coarse textured soils feel very gritty and lack smoothness or slickness.
Sands are only held together when wet, yet fall apart when bounced in the hand.
D. Gravel
The amount of gravel (rock fragments > 2mm) in a soil will greatly influence the soil properties.
This is especially important for water holding capacity. Estimate the amount of gravel in the soil by
comparing a volume of soil to the volume of gravel it contains. A 2 mm sieve may be necessary to
accurately determine this when soils approach 50% gravel.
None to few less than 15% by volume gravel
Gravelly 15 - 34% by volume gravel
Very gravelly 35 – 59% by volume gravel
Extremely gravelly greater than 50% by volume gravel

8/24/2012 4
Part 4. TOPOGRAPHY
Stakes at the site will specify the area in which the associated features are judged.
A. Steepness of Slope
The percent (feet of drop per 100 feet of horizontal distance) and length of slope affect the amount
and speed which water runs off the land, which in turn, affects the amount of soil carried off by the
water.
The amount of soil loss from a given area increases faster than the percent of slope:
if the slope percentage is doubled, the soil loss is increased about 2 ½ times
long slopes are subject to more erosion than short slopes; thus, if the slope length is doubled,
the soil loss is increased about 1½ times.
The slope groups commonly used in Minnesota follow:
Slope Type Description Percent slope
A Nearly level 0-2%
B Gently sloping 3-6%
C Moderately sloping 7-12%
D Strongly sloping 13-18%
E Steep 18+%
Slope Length is given on the placard.

8/24/2012 5
B. Landscape Position:
The soil profile is located in one of the following landforms depending on its place in the landscape.
Uplands occupy the higher parts of the landscape in relation to old flood plains and may be either level, rolling (uneven), or sloping (long, regular slopes).
Terrace is formed by soil deposited adjacent to a stream valley. It represents the remnant of an
old flood plain that is no longer subjected to flooding. Footslopes and adjacent to steep hills and
contain materials deposited from upslope by water or gravity.
Bottomland is flat, and may be subjected to flooding and is in the bottom of a stream valley.
Depressional areas, with no outlet, may be located on any part of the landscape.
Part 5. LAND USE CAPABILITY CLASSES
This refers to the degree and kind of hazard for land use. The definitions of the 8 Land Use
Capability Classes are:
1. Class I land is very good land, nearly level, and does not wash or blow readily. The soil is
deep and easy to work. It holds water well and is at least fairly well supplied with plant
nutrients. It can be used safely in almost any way you choose. Of course, it should be man-
aged to maintain plant nutrients and good physical conditions. Slopes are Type A (0-2%).
2. Class II land is good land from every standpoint, but certain physical conditions make it
inferior to Class I. The slope may be just enough to create an erosion hazard. Some Class II
land is naturally wet and can drain slowly. Some lack the water capacity of a Class I and is
slightly droughty. These deficiencies either limit the use of the land or require special
attention year after year. Since Class II land has some moderate, natural use limitation,
special treatment is needed, such as easily applied conservation practices like contouring,
cover crops, simple water management, crop rotations, and fertilizers. Slopes do not exceed
Type A and B slopes (0-6%).
3. Class III land is moderately good land for cultivation and more limited in use than Class II
because of natural features. It can be used regularly for crops, but intensive treatment of
some kind is needed. Some Class III land is moderately sloping and must have intensive use
of erosion control practices if cropped in a regular crop rotation. Another variation of Class
III land is that it may be poorly drained and require drainage. Slopes do not exceed Type C
(12%)
4. Class IV land is good enough for occasional cultivation under careful management, but not
for regular production of cultivated crops. A large part of it is too steep for regular
cultivation primarily because of the danger of erosion. A large part of it may be flat, sandy
lands, which are droughty. Five out of six years its best use if for pasture or hay. Slopes do
not exceed Type D (18%).
5. Class V land is nearly level and not subject to erosion. Because of wetness, flooding,
climate, or some permanent obstruction like stones and boulders, it is not suited for
cultivation. The soil is deep, however, and is suited for grazing or forestry. Slopes are Type
A (0-2%)

8/24/2012 6
6. Class VI land is unsuited to cultivation, and somewhat limited for grazing or forestry by
shallow soil, steep slopes, or excessive streambank cutting that cannot be corrected to
permit use for crops. Slopes do not exceed 30%.
7. Class VII land is unsuited for cultivation and has severe limitations for grazing or forestry.
It requires extreme care to prevent erosion. In rough areas its use for either grazing or
woodland requires special care. Slopes do not exceed 60%.
8. Class VIII land is suited only for wildlife or recreation purposes. Usually it is extremely
dry, rough, steep, stony, sandy, wet or severely eroded.
Part 6. INTERPRETATION OF SOIL FEATURES
A. Type of Material that limits rooting depth. –
Determine the type of soil material that is unfavorable for plant roots.
None – No limiting material
Bedrock – Hard or Soft
Hard Pan – Soil is cemented – this is called a Fragipan, or the glacial till is compacted
and this is a densipan (a Bt horizon is not a hard pan).
Very gravelly sand or high water table. Where sandy soil textures are
very gravelly roots will not enter. Soils with a permanent high water table
that do not have tile drainage will also limit roots.
B. Parent Material.
Determine the material the soil formed from. More than one can be checked where soils
have two or more parent materials.
Bedrock Hard or Soft – soil forms from the bedrock.
Alluvium/Outwash/Lacustrine Soil forms from water deposited materials.
Till/Loess/Aeolian Sand Materials derived from glacial action or wind.
Organic Materials Peat or muck from decayed plant remains.
C. Depth of Soil Favorable for Root and Water Penetration.
Determine the depth of the material from Part 5-A. If no unfavorable material is evident in
the pit face or soil tray assume the last horizon goes to 60 inches.
Very Deep greater than 60 inches
Deep 40-59 inches
Moderately Deep 20-39 inches
Shallow less than 20 inches
D. Air and Water Movement
Both texture and structure play a role in this determination. Use the subsoil for this
determination.
Very Rapid Open – single grain – Coarse Texture
Rapid Porous – granular or small subangular block, - Medium or Moderately
Coarse Texture Moderate Slightly compact – blockly or prismatic structure – Fine Texture
Slow Compact – blocky to massive – Very Fine Texture

8/24/2012 7
E. Water Holding Capacity and Internal Drainage
1. Total Available Water Capacity
Available water Capacity is closely related to soil texture.
To determine the available water capacity of the surface layer, refer to the table, which
follows.
a. Find the inches of water per inch of soil for the soil texture of the surface horizon
and multiply by the depth of the surface horizon.
b. Find the available water capacity for each horizon to a depth of 60 inches (or the root
zone if rooting is restricted to less than 60 inches).
c. Add these up to get total water capacity in 60 inches (or the root zone if rooting is
restricted).
Example: The available water capacity of a medium textured subsoil with an upper
boundary at 9 inches-depth and the lower boundary is at 20-inch depth. (Part 1) is
calculated as follows:
Subsoil (B-horizon)
a) Available water capacity per inch of each
layer
0.20 inches of H20 per inch of soil
(from table)
b) Thickness of layer in inches (20 less 9) 11 inches
c) Available water capacity in layer (a x b) 0.20 x 11 = 2.2 inches
Total each layer to 60 inches (5 feet) to arrive at the total available water capacity or to the
depth favorable for rooting (Part C). If a soil texture has gravel, the % volume of gravel
(Part 1-D must be subtracted from the total volume of soil.
AVAILABLE WATER CAPACITY TABLE TO USE FOR CALCULATING AWC
Texture Average inches of water per inch of
soil
Very Fine- clay, silty clay,
sandy clay
0.15
Fine – sandy clay loam, clay
loam, silty clay loam
0.20
Medium – loam, silt loam, or
silt
0.20
Moderately Coarse- sandy
loam
0.15
Coarse- loamy sand and sand 0.05
The preceding values are approximate. For example, the available water capacity of
moderately fine textured soils may range from at least 0.14 to 0.22 inches of water per inch
of soil.
Drought results when plants exhaust the water supply in the soil. Soils with low available
water capacity and crops with shallow root systems are much more susceptible to drought.
The following table relates total available water capacity and the possibility of drought on a
soil.

8/24/2012 8
3. Total Available Water Capacity
Available Water
Capacity in 5 feet of
soil (or layer to
limiting root growth)
Amount in inches
Available Water
Capacity
Class
Drought Susceptibility
Less than 3 inches Very Low Very High
3-6 inches Low High
6.1-9 inches Moderate Medium
Over 9.1 inches High Low
4. Internal Drainage
Scorecard Notation Subsoil Color Internal Drainage
Bright
Uniformly brown, dark
brown, yellowish
brown, dark yellowish
brown or reddish
brown throughout the
subsoil.
(See R,YR, and Y
pages in Munsell Color
Manual)
Well Drained
Bright
Same as well drained
except the lower
subsoil may be
mottled.
Moderately Well
Drained
Mottled
Mottled upper subsoil,
the lower subsoil will
be gray or mottled.
(Gley pages in Munsell
Color Chart show gray
for Poorly Drained)
Somewhat Poorly
Drained
Dull
Dull gray or olive
color subsoil, some
mottles may be present
(See Gley page in
Munsell Color Chart)
Poor or Very Poorly
Drained
Part. 7 TYPE OF EROSION AND NEED FOR EROSION CONTROL
A. Amount of Erosion or Evidence of Deposition
Compare the present depth of surface soil or surface and subsurface with the original depth given on
the placard. Rate the soil as to present degree of erosion. If the present depth of the soil is greater
by two inches then what is on the placard, then deposition has occurred.

8/24/2012 9
B. Kind of Erosion None No erosion was evident in part A. (none to slight)
If erosion was evident determine the kind of erosion most likely responsible.
Active Gully or streambank Where active gulleys or streambank are eroding the soil
Wind erosion Where soil areas are open to wind and soil texture are very fine or
coarse
Sheet or Rill Erosion Areas with slopes greater than 2% and Non-Permanent vegetation
Part 8-Need for Erosion Control
Determine if water or wind erosion would be the most pressing erosion problem. For Land
Capability Class VII or VIII Wildlife Recreation is checked.
A. Water Erosion
The extent of water erosion is determined by following factors:
a) Erosion control practices
b) Rainfall factor (this depends on energy and intensity of the rainfall or how hard and
fast the rain hits the ground (raindrop splash).
c) Erodibility of the soil (how readily the soil erodes)
d) Crop management system
e) Slope length and slope percent
Soil types vary in their resistance to loss by water erosion or erodibility. The intensity and duration
of rainfall determines the rainfall factor. The steeper and longer the slope, the greater the amount of
erosion.
Erosion control practices and crop management are adjusted to keep soil loss within allowable
limits (T= Soil loss tolerance, which is the amount of soil lost that does not affect the productivity
of the soil, acceptable T levels are less than 3 or 5 tons/acre/year lost to erosion). It takes from
approximately 500 to 1000 years for one inch of soil to develop. Without Best Management
Practices (BMPs) soil structure can be broken down and runoff can carry particles off of the land
into surface waters, making the soil less productive with each storm event. Intensity, stormwater
runoff and Best Management Practices (BMPs) are outside the bounds of this scorecard, so a
simplified system is applied.
When the percent of slope is greater than 2%, and slope length approaches 100 feet, water erosion
may be a hazard and erosion control practices are needed. If the topography is irregular (short,
steep, slopes,), BMPs to control erosion include sod cover (pasture, hay field), and conservation
tillage which leaves more crop residue on the surface.
When regular slopes are present examples of BMPs are: contour farming (crop rows follow the
contour of the land); strip cropping (certain width of alfalfa or sod crop is planted between a
certain width of row crop, this slows the water down and allows for more infiltration of water into
the soil. Sediment carried by runoff water can be filtered out of the water by vegetation); the
creation of terraces (breaking up the slope by creating long ridges and channels across the field to
intercept and reduce the flow of surface runoff).

8/24/2012 10
Conservation tillage is a general recommendation as a conservation practice. Conservation tillage
decreases planting cost. This is done with a reduction in field passes with equipment. Conservation
tillage also leaves more residue on the surface which reduces damage to soil structure by raindrop
splash. Conservation tillage can decrease soil loss by 50% or more over conventional tillage
(moldboard with spring tillage).
Grass waterways and gully control structures (water retention basins) are installed where
infiltration rate is slow and runoff occurs, which can cause erosion and gully formation. Grass
waterways are designed to handle specific flows and should be checked often for damage. Repairs
are easy and cost less if they are taken care of right away. If a grass waterway becomes damaged
and rill erosion (little channels) occurs and this leads to gully erosion (deep V shaped gullies) which
is expensive to repair. When gully erosion in Part 7B has been checked, Grass waterways should
also be checked.
Permanent pastures are used with Land Use Capability Class V and VI. Wildlife or recreation is
checked whenever the land use merits that use. (Class VII, VIII)
B. Wind Erosion
On coarse soils, peat (organic) soils, and fine soils, wind erosion and damage to plants by wind are
erosion hazards. On peat and coarse soils both mulch tillage (residue management), and planting
cover crops (small grain) in the fall, and field windbreaks or windstrips are generally needed. On
fine soils cover crops are generally sufficient but field windbreaks may be desired.
The time of year to be concerned with wind erosion when the surface is exposed and the wind
carries the soil particles. As the seedlings grow, their height will reduce the wind velocity. This
happens during late fall, winter and into spring.
The most erodible soil particles are about 1/100 of an inch in diameter for sand and a little larger for
aggregates of finer textured soils which are less dense. As a guide, when 2/3 of the dry weight of a
soil is made up of soil particles and aggregates larger than 1/25 of an inch in diameter, the soil is
resistant to wind erosion. Sands and often very fine textured soils are more erodible than the
medium textured soils. Sands are singe grained and lack enough silt and clay to bind the particles
together, which makes sand more susceptible to wind erosion. Fine textured soils may need
protection during winter and early spring on fall plowed land. Peat soils are very susceptible to
wind erosion.
The most successful control measure is to keep the soil covered with crops or crop residue. Field
windbreaks/windstrips provide protection where wind erosion is a major problem. These
shelterbelts of trees planted along field boundaries will provide some protection, but by themselves
are adequate only on relatively small fields.

8/24/2012 11
Part 9 Drainage Required
Surface Drainage and/or Tile Drainage
Plants need air as well as moisture in the root zone. Excess water in the soil fills the air pore space
that the plants need for proper aeration. For maximum productivity of most crops, surface and/or
internal drainage are recommended. The Wetland Conservation Act became law in 1991 and must
be adhered to. Draining an existing wetland in an agricultural field can also force a landowner out
of the federal farm programs. Check with your local conservation district before tiling.
Drainage is generally needed when internal drainage of the soil is poor or somewhat poorly drained
on fine textured soil. There are two types of drainage: surface drainage and sub-surface drainage.
Sub-surface tile drainage is required for soils with poor internal drainage, moderately fine textured
or coarser, and a high water table. Sub-surface tile drainage lowers the water table.
Crop yields are increased by (“Elementary Soil and Water Engineering”):
Removing gravitational or free water that is not directly available to plants, allowing a larger, deeper root system;
Increasing the volume of soil from which roots can obtain nutrients;
Increasing the movement and quantity of air in the soil;
Providing conditions that permit the soil to warm up faster in the spring, allowing tillage and planting schedules that allow full growth cycle to obtain the best yields and it
provides;
Increasing the bacterial activity in the soil, which improves soil structure and makes plant nutrients more readily available;
Reduces soil erosion since a well-drained soil has more capacity to hold rainfall,
resulting in less runoff. The open tile intakes of the system can be a direct line for
sediment to surface waters, an environmental hazard. Blind intakes and slotted offset
risers are recommended to reduce sedimentation to surface waters.
Surface drainage is the removal of excess water using constructed open ditches, field drains, land
grading and related structures. Surface drainage is needed for flat or undulating topography to
remove excess ponded water that is detrimental to plant growth after a certain period of time.
Surface drainage does not lower the water table.
8/24/2012 12
Part. 10-FERTILIZER and LIME RECOMMENDATIONS
Gauge the rate of fertilizer application on the following:
1. Soil Test
2. Crop to be grown (1-6 possible crops)
3. Yield goal
4. Previous crops (affects nitrogen available in the soil)
5. Subsoil phosphorus and potassium levels
The placard at the pit contains this information.
The yield goal of corn is affected by several climatic conditions including
Air temperature,
Solar radiation, and
Length of growing season and
Precipitation.
Generally lower yield goals are set where drought probability is high or where the growing season
is short and air temperatures are low.
The computerized fertilizer recommendations now used in Minnesota and Wisconsin use many
factors in making fertilizer recommendations. Subsoil fertility affects the phosphorus and
potassium recommendations while “lime” subsoil in Western Minnesota decrease the lime
requirements. Acidic soils need lime to bring the pH up to where plant growth is optimum.
Alkaline soils do not need lime since alkaline soils have a higher pH than acidic soils.
(Note: Lime contains calcium and magnesium (cations) which raises pH; (cations have positive
charges) and remember that a pH of 7 is neutral, a pH less than 7 is acidic (anions have negative
charges) while a pH greater than 7 is alkaline). Of an interesting note that will not be included in
the competition: If a soil has a high pH (alkaline) that is 7.5-9, the phosphorus bonds with the
calcium and phosphorus becomes unavailable to the plant. This has a detrimental effect on plant
growth.
The level of soil organic matter was not included in the contest, even though it affects the release of
nitrogen (N) and the rate of nitrogen fertilizer applied. Nitrogen recommendations given for corn
are for medium-low organic matter levels. Nitrogen recommendations for soils with high organic
matter levels are 10 to 30 pounds/acre less than for soils with medium-low organic matter levels.
a) Fertilizer Rates for Nitrogen (N), Phosphorus (P), and Potassium (K) Are Given for the
Following Crops:
1) Grass Legume Mixtures
2) Alfalfa (established stands)
3) Corn
4) Grass Pastures, non-leguminous hay, Sorghum Sudan and managed woodlots
5) Small Grain, wheat, barley, rye, oats
6) Soybeans
2. To determine Phosphorus (P) and Potassium (K) Recommendations:
Consider the soil test and present crop. For corn and alfalfa, also consider the subsoil P and K
levels given on the placard. For corn, record only Broadcast Recommendations.

8/24/2012 13
Nitrogen recommendations for corn depend on yield goal and previous crop given on the placard.
The placard is used to indicate whether to use row or broadcast recommendations for small grain, P
& K.
3. To determine lime recommendations:
For Lime, consider the lime area (see map on page 17), the SMP buffer index when pH is 5.9 or less
and crop to be grown (see placard). When pH is 6.0 or higher, disregard the SMP buffer index and
use the soil water pH.
4. To determine nitrogen recommendations:
1. Refer to Placard for the crop to be grown and its yield level. Note the previous
crop grown.
2. For grass pastures and non-leguminous hay, the type of pasture, or non-leguminous hay
will be written at the base of the placard and adequacy of rainfall will be written on the
placard for nitrogen (N) recommendations.
1. Grass Legume Mixtures
Phosphorus (P)
Phosphorus (P) Relative Subsoil Phosphorus Level**
Soil Test (lbs/acre) Low Medium High
Amount of P2O5 to be applied (lbs/acre)
0-10 100 90 60
11-20 90 70 40
21-30 70 50 0
Over 30 30 15 0
*For each ton of manure applied, subtract 2 lbs. of phosphate (P2O5) from the above
recommendation
**See Placard
Potassium (K)
*Potassium fertilizer recommendations for grass Legume Mixture
Potassium (K) Relative Subsoil Potassium Level**
Soil Test (lbs/acre) Low Medium High
Amount of K2O to be applied (lbs/acre)
0-75 300 230 200
76-151 180 165 120
151-225 120 100 60
226-300 60 35 0
Over 300 0 0 0
*For each ton of manure applied, subtract 5 lbs. of potash (K2O) from the above recommendations.
**See Placard

8/24/2012 14
Nitrogen – 60 lbs/Early Spring
2. Alfalfa: Established Stands
Phosphorus (P)
Annual phosphorus fertilizer recommendations for established stands of alfalfa
Phosphate (P)
Soil Test (lbs/acre)
5-Tons/Acre Yield
Amount of Phosphate
(P2O5) to be applied annually
0-10 100
11-20 80
21-30 55
Over 30 0
Potassium (K)
Potassium (K)
Soil Test (lbs/acre)
5-Tons/Acre Yield
Amount of Potash (K2O)
Lbs/acre to be applied annually
0-75 240
76-150 165
151-225 90
226-300 0
3. Corn
Phosphorus (P) Broadcast recommendations for Corn:
Yield Potential greater than 100 bu/acre
Phosphorus (P) Relative Subsoil Phosphorus Level
Soil Test (lbs/acre) Low Medium High
Amount of P2O5 to be applied (lbs/acre)
0-10 100 85 70
11-20 80 60 50
21-40 60 35 30
For each ton of manure applied, subtract 5 lbs. of Phosphorous (P2O5) from the above
recommendations
Potassium (K) Broadcast recommendations for Corn:
Potassium (K) Relative Subsoil Potassium Level**
Soil Test (lbs/acre) Low Medium High
Amount of K2O to be applied (lbs/acre)
0-100 140 110 80
101-175 80 60 50
176-250 40 40 40
Over 250 0 0 0
8/24/2012 15
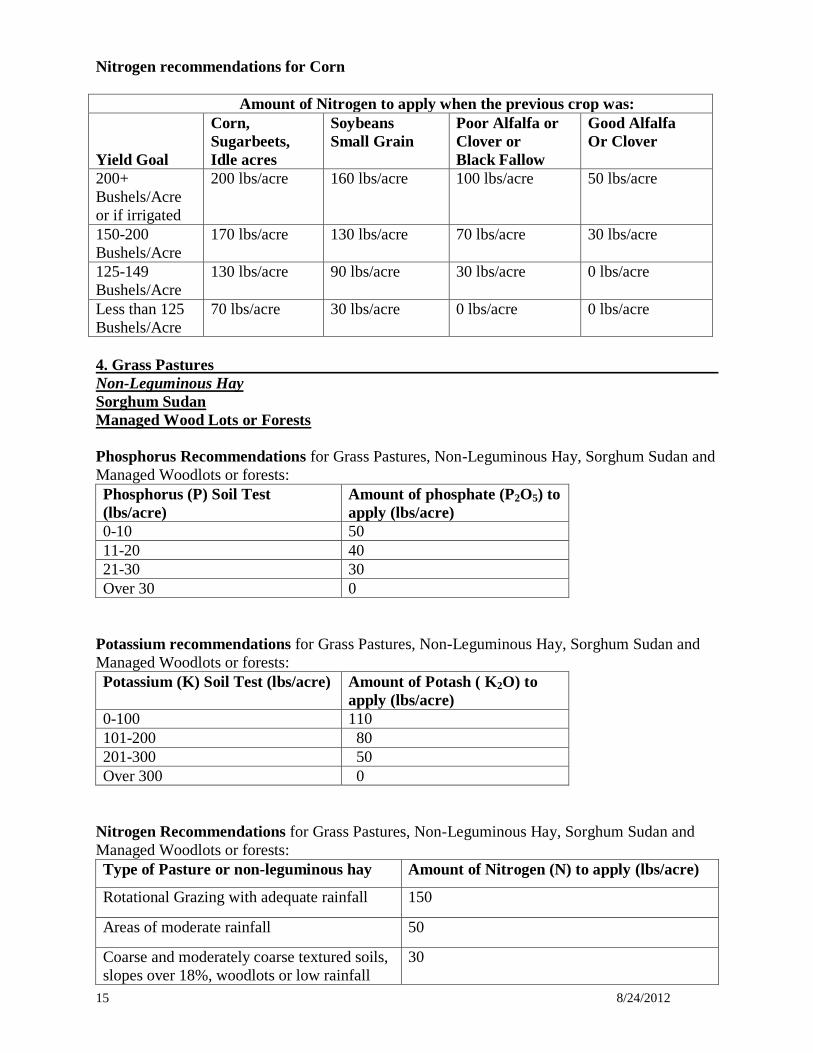
Nitrogen recommendations for Corn
Amount of Nitrogen to apply when the previous crop was:
Yield Goal
Corn,
Sugarbeets,
Idle acres
Soybeans
Small Grain
Poor Alfalfa or
Clover or
Black Fallow
Good Alfalfa
Or Clover
200+
Bushels/Acre
or if irrigated
200 lbs/acre 160 lbs/acre 100 lbs/acre 50 lbs/acre
150-200
Bushels/Acre
170 lbs/acre 130 lbs/acre 70 lbs/acre 30 lbs/acre
125-149
Bushels/Acre
130 lbs/acre 90 lbs/acre 30 lbs/acre 0 lbs/acre
Less than 125
Bushels/Acre
70 lbs/acre 30 lbs/acre 0 lbs/acre 0 lbs/acre
4. Grass Pastures
Non-Leguminous Hay
Sorghum Sudan
Managed Wood Lots or Forests
Phosphorus Recommendations for Grass Pastures, Non-Leguminous Hay, Sorghum Sudan and
Managed Woodlots or forests:
Phosphorus (P) Soil Test
(lbs/acre)
Amount of phosphate (P2O5) to
apply (lbs/acre)
0-10 50
11-20 40
21-30 30
Over 30 0
Potassium recommendations for Grass Pastures, Non-Leguminous Hay, Sorghum Sudan and
Managed Woodlots or forests:
Potassium (K) Soil Test (lbs/acre) Amount of Potash ( K2O) to
apply (lbs/acre)
0-100 110
101-200 80
201-300 50
Over 300 0
Nitrogen Recommendations for Grass Pastures, Non-Leguminous Hay, Sorghum Sudan and
Managed Woodlots or forests:
Type of Pasture or non-leguminous hay Amount of Nitrogen (N) to apply (lbs/acre)
Rotational Grazing with adequate rainfall 150
Areas of moderate rainfall 50
Coarse and moderately coarse textured soils,
slopes over 18%, woodlots or low rainfall
30

8/24/2012 16
5. Small Grain (Barley, Oats, Rye and Wheat_______________________________________
Phosphorus (P) Recommendations for Small Grain:
Phosphorus (P) Soil Test
(lbs/acre)
Amount of phosphate (P2O5)
to apply (lbs/acre)
0-10 50
11-20 35
21-30 20
Over 30 0
Potassium (K) Recommendations for Small Grain:
Potassium (K) Soil Test (lbs/acre) Amount of Potash ( K2O) to
apply (lbs/acre)
0-100 95
101-200 70
201-300 40
Over 300 0
Recommended rates are total amount to apply- broadcast +drill
Nitrogen (N) Recommendations for Small Grain
Nitrogen recommendations based On Previous Cropping History
Amount of Nitrogen (N) to Apply (lbs/acre)
Previous Crops Fine Textured Soils Coarse Textured Soils
Corn
Sugarbeets
Idle Acres
60 80
Small Grain
Soybeans
Potatoes
40 60
Alfalfa, Black Fallow
Sweetclover Fallow
20 40
6. Soybeans
Phosphorus (P) Recommendations for Soybeans:
Phosphorus (P) Soil Test (lbs/acre) Amount of Phosphate (P2O5) to Apply (lbs/acre)
0-20 60
21-30 0
Over 30 0
Potassium Recommendations for Soybeans:
Potassium (K) Soil Test (lbs/acre) Amount of Potash (K2O) to Apply (lbs/acre)
0-100 80
101-175 60
175-250 30
pH and Lime Recommendations

8/24/2012 17
What liming does?
Lime improves crops principally by promoting desirable biological activity. Such benefits are
realized through higher yields and better quality.
Bacteria in legume root nodules supply nitrogen to these crops in plentiful quantities if soil acidity
is reduced sufficiently. Other types of bacteria step up their activity in rotting residues and soil
organic matter if adequate lime is present.
In addition to stimulating biological activity, dolomitic lime (generally available in Minnesota)
supplies calcium and magnesium. Addition of the latter is important advantage in soil areas, which
tend to be low in magnesium. Liming acidic soils will also make soil phosphorus more available to
plants as long as the pH is below 7.2 (it binds with calcium and becomes unavailable to the plant).
The SMP Buffer Test
Since January 1, 1968, an SMP buffer test has been used to determine lime needs in Minnesota.
The SMP buffer test for lime determines total soil acidity and more accurately predicts lime needs.
With one the soil-water pH, the total acidity could only be estimated. Two soils with exactly the
same soil-water pH might vary quite widely in the amount of lime needed to raise the pH to 6.5,
depending on the amount of organic matter and clay contents of each soil. The soil with the higher
organic matter and/or clay content would require more lime to the higher reserve acidity.
The pH of the SMP buffer solution itself is 7.5. When the SMP is added to a soil, the original pH of
the SMP buffer will go down. Since it is known how much acid is required to lower the SMP buffer
to any given pH level, total soil acidity can be determined. For example, a soil with a soil-water pH
of 5.4 might bring the SMP buffer pH index from 7.5 to 6.3. According to the following table, it
would take 5.5 tons of lime to raise the soil-water pH from 5.4 to 6.5.
The buffer index is different from the soil pH. The buffer index is used only to determine lime
needs and is in no other way connected with soil water pH.
Lime Recommendations
See next page for Lime Recommendation Table

8/24/2012 18
Lime Recommendations
Where SMP buffer Applies
(Soil-water pH values below 6.0) Lime Required (tons/acre)
Mineral Soils To raise soil-water pH to 6.5 To raise soil-water pH to 6.9
for Alfalfa only
SMP Buffer Index Area 1 Area 2 Area 1
6.8 3.0 2.0 5.0
6.7 3.5 2.0 5.0
6.6 4.0 2.0 6.0
6.5 4.5 2.0 6.5
6.4 5.0 2.5 7.0
6.3 5.5 2.5 7.5
6.2 6.0 3.0 8.0
6.1 6.5 3.0 8.5
6.0 7.0 3.5 9.0
5.9 7.5 3.5 9.5
5.8 8.0 4.0 10.0
5.7 8.5 4.0 10.5
5.6 9.0 4.5 11.0
Where SMP buffer does not apply
(Soil-water pH values above 6.0) Lime Required (tons/acre)
Mineral Soils To raise soil-water pH to
6.5
To raise soil-water pH to 6.9
for Alfalfa only
Soil-water pH Area 1 Area 2 Area 1
6.5 0 0 2.0
6.4 2.0 0 3.0
6.3 2.0 0 5.0
6.2 3.0 0 5.0
6.1 3.0 0 6.0
6.0 4.0 2.0 6.0
Map of Areas:
SMP buffer is not used above pH 5.9
If the soil-water pH (soil pH) is 6.0 or higher, the SMP buffer is not run. The relative error of the
SMP buffer is too high in this soil pH range.

8/24/2012 19
Recommendations (see table previous page)
1. Lime recommendations for corn and soybeans
If alfalfa is not in the cropping system, pH levels of 6.0 or above are adequate
without liming. If the soil pH is below 6.0, apply lime rates needed to reach a
soil pH of 6.5. High nitrogen rates used for corn on non-calcareous soils
lower pH.
2. Lime recommendations for Alfalfa
When alfalfa is in the rotation, the soil-water pH is raised to 6.9 in map area
I. However, in map area II, it is not necessary to raise the pH above 6.1 due
to the presence of lime in the subsoil.
3. “Limy” subsoils in western Minnesota (Area II) call for less lime.
**Notice
Fertilizer tables are from Extension Bulletin BU06240, 2001, Fertilizer Rec. for Agronomic Crops
in Minnesota. This report provides additional information on soil fertility and soil testing and is
recommended for resource information. Since space in the Land Judging Instruction is limited,
many important aspects of fertilizer use such as micronutrients, or limitations o the amounts of N
and K which can safely be applied in the row, had to be eliminated. The Land Judging Instruction
tables are not meant to make actual fertilizer recommendations, but to give pointers as to how such
recommendations are made.
Part 11. LAND USE LIMITATIONS: SOIL EVALUATION FOR COMMUNITY
DEVELOPMENT
For more than 40 years, the procedure used to determine the proper use of soils in agriculture has
been to evaluate soil resources and then develop a farm plan using the soils information. The
evaluation of soils for non-agricultural uses is just as important. This section serves as an
educational aid for the uses of soils for community development. All sites are determined for
Community Development.
This section is based on technical information from the Soil Conservation Service, now called
Natural Resources Conservation Service Guide for Interpreting Engineering Uses of Soils. It was
necessary to introduce a few simplifications and omit one or two of the less important factors. For
each use being evaluated, (1) mark the most likely description of each feature of the land area, (2)
consider the relative importance of each feature you have circled, and (3) check the degree of
limitation (slight, moderate, or severe) to indicate the appropriateness of a particular land use.
In the “Limitation” column, the terms slight, moderate, and severe, refer to the limitations of the
area for the use being considered. The terms also apply individually to each feature as it is
described on the same line to the right. For example, a slope of 0-6% has slight limitations for
dwellings; a slope of 6.1-12%, dwellings has moderate limitations; slope >12%, dwellings has
severe limitations. This reasoning applies to each feature. The limitation on use is determined by
the greatest limitation noted for any feature. If all the features for the area are slight, the limitation
of the area is “slight” for that use. If one or more of the features for the area are described as
“severe”, the limitations of the area are severe for that use. If one or more of the features for the
area are described as “moderate”, with none described as severe, the limitations are moderate for
that use.

8/24/2012 20
**There is one exception, for septic tank absorption fields, lagoons and holding basins:
When both % slope and depth to bedrock are moderate, the limitation is severe. Since the farm
lagoon surface will be level and the absorption field nearly level, bedrock is encountered at the
upslope portion of any sizable lagoon or absorption field, which severely limits these uses.
Limitations:
(Level of Limitation for each use)
Slight: The area is physically well suited to the use being considered. None of the physical
features described is a significant limitation. Existing limitations are easily reduced
or corrected. The area is relatively free of hazards.
Moderate: There are one or two important limitations that cause this area to be only fairly
suitable for the use being considered. The limitations are considered moderate. It is
economical to correct the limitations or reduce their influence.
Severe: The area is poorly suited for the use being considered. The limitations (there may be
only one) are severe and may be costly to overcome.
Explanation of a new term: Permeability
Permeability is the rate that water moves through a soil. The accepted measure used in soil surveys
is saturated permeability, which is the rate of flow of water through a saturated soil under specified
conditions. Permeability rates are the same as hydraulic conductivity. Permeability is determined
for each soil in Part 6-D, for the subsoil.
Permeability Class Inches per hour
(movement of water through the soil)
Slow Very Slow Less than 0.06 inches per hour
Slow 0.06-0.2 inches per hour
Moderate Moderately Slow 0.2-0.6 inches per hour
Moderate 0.6-2.0 inches per hour
Rapid Moderately Rapid 2.0-6.0 inches per hour
Rapid 6.0-20.0 inches per hour
Very Rapid Very Rapid More than 20 inches per hour
A. Use for Dwellings Soil properties affect house construction in several ways. Major emphasis in this section is on soil
properties that affect foundations. The properties affecting the soil’s bearing strength when wet and
the shrink-swell potential (Clays have the ability to shrink and swell depending on moisture
content) determine the size of the foundation required.
The properties affecting the cost of excavation and construction include:
Drainage
Slope
Depth to bedrock
Soil properties, which have affects beyond those relating exclusively to foundations and are also
considered, follow:
Percent slope
Susceptibility to flooding
Seasonal high water table
Depth to bedrock
Surface texture
This discussion applies to undisturbed soils, which single family dwellings, or other structures with
similar foundation requirements can be built.

8/24/2012 21
Features for Dwellings:
Percent Slope Steeper slopes generally increases construction costs of the house, road, and
water systems. Some soils given limitations of moderate or severe may still be good sites
with an aesthetic value, but may require more preparation and/or maintenance.
Limitations of Percent Slope for dwellings:
Slight: 0-6% slope
Moderate: 6.1-12 %
Severe: > 12%
Surface Soil Texture: Medium surface soil texture have slight limitations for dwellings.
They are most desirable for lawns because they hold moderate to high amounts of available
water, require less frequent watering and suffer less damage from foot traffic when wet.
Coarse, fine, and very fine-textured soils have moderate limitations. Coarse-textured soils
hold little water and are droughty unless watered frequently. Fine or very fine-textured soils
have poor workability and are more easily damaged by traffic when wet.
Limitations of Surface Soil Texture for dwellings:
Slight: Medium and moderately coarse surface soil texture
Moderate: Coarse and fine-textured soils
Severe: None in this category
Flooding: State regulations prohibit building on flood plains. Look at landform (see Part 4-
B)
Limitations of Flooding for dwellings:
Slight: None in this category
Moderate: None in this category
Severe: any flooding
Internal Drainage Class: Wet basements and decreased soil bearing strength are associated
with saturation of the soil due to high water table. Internal drainage class is used to
determine whether a seasonal high water table exists.
Limitations of Internal Drainage Class for dwellings:
Slight: Well drained to moderately well drained
Moderate: For this competition: None (in actual practice, moderately well drained
soils would be here, but it is not reasonable to expect students to distinguish
moderately well-drained)
Severe: Somewhat poorly drained, poorly drained
Depth to Bedrock: Bedrock at less than 60 inches is a limitation because it interferes with
construction and placement of utility lines.
Limitations of Depth to Bedrock for dwellings:
Slight: Greater than 60 inches depth
Moderate: 40-60 inches depth
Severe: Less than 40

8/24/2012 22
Subsoil or underlying materials and shrink-swell potential: Coarse and medium-textured
subsoil or underlying material have low shrink-swell potential and reduce the size and cost
of foundations required. These textures have slight limitations. Fine-textured soils have
moderate shrink-swell potential and require more extensive foundations; therefore, they
have moderate limitations. Very fine-textured soils have high shrink-swell potential hence
severe limitations.
Limitations of Subsoil, shrink-swell potential for dwellings:
Slight (Low shrink-swell potential): Coarse and medium texture
Moderate: Fine-textured
Severe (High shrink-swell potential): Very fine textured
B. Use for Septic Tank Absorption Fields
A septic tank absorption field is a soil absorption system for sewage disposal. It is a subsurface tile
system laid so that effluent from the septic tank is distributed with reasonable uniformity into the
natural soil. The soil is treated on its ability to absorb effluent. Soil areas considered in this section
are those where tile lines will distribute effluent from sewage septic tanks. Local experience and
record of performance for existing filter beds provide important guides where such information is
available.
Features for Septic Tank Adsorption Fields:
Percent Slope: Soils with a 6% or less slope offer the best site for sewage disposal systems
from the standpoint of construction and successful operation of an absorption field.
Mechanical problems of layout and construction increase with slope steepness. Lateral
seepage of downslope surface flow is a problem on sloping soils, especially where bands of
material with slower permeability occur in the top 4 feet of the soil. With slopes over 12%,
effluent frequently flows to the surface at low points so such soils have severe limitations for
use as disposal fields. Large rocks, boulders and rock outcrops increase construction costs.
The tile grade is difficult to maintain if the obstacle cannot be removed. Trench lines can be
installed and that grade can be maintained around these obstacles on nearly level soils.
Limitations for Percent Slope for Septic Tank Adsorption Fields:
Slight: 0-6% slope
Moderate: 6-12% slope
Severe: Greater than 12%
Flooding: Soils subject to flooding have severe limitations, even if permeability is
satisfactory and the ground water level is below 4 feet. Floodwater interferes with the
functioning of the filter field and carries away unfiltered sewage (Health hazard). Areas
subject to flooding should not be considered for onsite sewage disposal systems unless they
are protected from flooding.
Limitations of Flooding for Septic Tank Adsorption Fields:
Slight: None
Moderate: None
Severe: Any flooding

8/24/2012 23
Internal Drainage: A seasonal water table should be at least 4 feet below the bottom of the
trench (6 feet below the soil surface) at all times for soils rated as having slight limitations.
Soils with a water table less than 2 feet below the bottom of the trench (4 feet below the soil
surface) for extended periods have severe limitations. Soil drainage class is used to estimate
the depth of a seasonal water table. Well-drained and moderately well-drained soils have
slight limitations. Somewhat poorly drained soils and poorly drained have severe
limitations. Tile drainage may be used to lower the water table in some soils if state law
permits it. Soils are rated on their natural undrained conditions.
Limitations of Internal Drainage for Septic Tank Adsorption Fields:
Slight: Well drained, moderately well drained
Moderate: None
Severe: Somewhat poorly and poorly drained
Permeability Class: Soil permeability is a very important feature in a soil absorption field.
Soils with very rapid and rapid permeability are rated as having slight limitations. However,
soils that have sand or sand and gravel within 4 feet of the surface will not provide proper
filtration and may allow pollution of subsurface aquifers where we obtain our drinking
water. Soils with moderate permeability have moderate limitations. In actual practice, soils
have slight limitations; however, for contest purposes, we consider all soils with moderate
permeability to have moderate limitations. Soils with slow to very slow permeability have
severe limitations for use as septic tank absorption fields. Permeability class is rated for the
most restrictive layer below the plow layer. (See Part 6-D)
The Soil permeability is determined from Part 6-D.
Permeability Class Inches per hour
(movement of water through the soil)
Slow Very Slow Less than 0.06 inches per hour
Slow 0.06-0.2 inches per hour
Moderate Moderately Slow 0.2-0.6 inches per hour
Moderate 0.6-2.0 inches per hour
Rapid Moderately Rapid 2.0-6.0 inches per hour
Rapid 6.0-20.0 inches per hour
Very Rapid Very Rapid More than 20 inches per hour
Limitations of Permeability for Septic Tank Adsorption Fields:
Slight: very rapid, rapid
Moderate: Moderate
Severe: Slow, to very slow
Depth to Bedrock: Impervious layers (compactions, resistant, water tight, where water or
roots cannot pass through), including rock formations, must be 6 feet or more below the soil
surface for slight limitation. Six feet of soil is also required over crevices or fractured rock
for slight limitations because unless an adequate soil cover is present, unfiltered sewage may
travel long distances through an aquifer where people draw their drinking water from, as in
cracked limestone. When the depth to bedrock is over 48 inches but not more than 72
inches, limitations are moderate. When the depth to bedrock is less than 48 inches,
limitations are severe.

8/24/2012 24
Limitations of Depth to Bedrock for Septic Tank Adsorption Fields:
Slight: Bedrock depth is more than 60 inches.
Moderate: Bedrock depth is 40-60 inches.
Severe: Bedrock depth is less than 40 inches.
C. Use for Farm Lagoons and Holding Basins
A manure lagoon is a shallow pond used to hold livestock sewage for the time required for bacterial
decomposition. Manure lagoon construction requires consideration of the soil for two functions:
As a vessel or container for the impound area and;
Soil material for the enclosing embankment.
The lagoon must be capable of holding water with minimum seepage.
Soil requirements for basin floors of farm lagoons are:
1. Slow rate of seepage
2. Even surface
3. Little or now organic matter
Official specifications for lagoons state that the depth of liquid should not be less than 2 feet and
generally not more than 5 feet. Also, that the floor should be level or nearly level and that the
materials for the basin floor should be so nearly impervious as to preclude excessive loss of liquid through seepage. The relatively impervious material should be at least 4 feet thick. This is
especially important where the local water supply comes from shallow wells that may become
contaminated. Contamination occurs when the pollutant enters the groundwater through seepage or
through fractured limestone.
Important soil characteristics include: Percent slope
Drainage Class
Flooding
Permeability Class
Depth to Bedrock
Type of Bedrock
Features:
Percent Slope: Percent slope is important because the liquid body of the lagoon must be
between 2 and 5 feet deep. Slope must be level enough and soil material thick enough over
bedrock to make it possible to smooth the bottom of the lagoon in order to have a uniform
lagoon depth. Greater slope is allowable if the soil material is more than 6 feet deep, but
generally smoothing is impractical where slopes exceed 6%. Zero to 2% slopes have slight
limitations, 2-6% slopes have moderate limitations and slopes greater than 6 % have severe
limitations.
Limitations for lagoons and holding basins:
Slight: 0-2 % slope
Moderate: 2-6% slope
Severe: Greater than 6 %

8/24/2012 25
Flooding: Flooding is a severe limitation because floodwaters may overtop the
embankment, interfere with the functioning of the lagoon and carry polluting sewage away
before sufficient decomposition, through biological activity, has occurred.
Limitations for Flooding lagoons and holding basins:
Slight: None
Moderate: None
Severe: Any Flooding
Internal Drainage Class: The depth to water table is critical for evaluating sites for lagoons
that have basin floors composed of material with moderate to very rapid permeability.
However, depth to water table is disregarded if the lagoon floor consists of at least 2 feet of
material with moderately slow to very slow permeability. Again, drainage class is used to
judge depth to water table. Well and moderately well drained soils have slight limitations
because the water table is always at a depth greater than 60 or more inches. Somewhat
poorly drained soils are considered to have moderate limitations with a water table between
40-60 inches depth at some time during the year. Poorly drained soils have severe
limitations with a water table less than 40 inches from the surface some time during the year.
Limitations for Internal Drainage Class lagoons and holding basins:
Slight: Well drained, moderately well drained
Moderate: Somewhat poorly drained
Severe: Poorly drained
Permeability Class: The greater the permeability (in its natural state) the greater the
limitation on use as a lagoon. Soils with slow permeability have slight limitations;
moderately permeable soils have moderate limitations, and soils with rapid to very rapid
permeability such as gravelly, sandy and organic soils have severe limitations. Permeability
class is rated for the most restrictive layer below the plow layer (subsoil).
Limitations for Permeability lagoons and holding basins:
Slight: Slow
Moderate: Moderate
Severe: Rapid to very rapid
Depth to Bedrock: A depth of at least 60 inches of relatively impervious soil material is
required for the area to be classified as having slight limitations. This is especially
important where the local water supply comes from shallow wells that may become
contaminated. Where depth to bedrock is less than 40 inches, limitations are severe.
Moderate limitations are between 40-60 inches depth to bedrock.
Limitations for Depth to Bedrock lagoons and holding basins:
Slight: Depth to bedrock is greater than 60 inches
Moderate: Depth to bedrock is between 40-60 inches
Severe: Depth to bedrock is less than 40 inches

8/24/2012 26
Soils Contest
1. The soils contest can consist of judging 4 land areas using the “FFA Land Judging
Scorecard” and instructions. The information in the “FFA Land Judging Scorecard
Instructions” will be the subject matter guide. Questions on interpretation should be
directed to Dr. Cooper - Soil, Water, and Climate Department, U of MN, St. Paul
2. Teams will normally be composed of four members with the top three scores counting..
3. The correct answers for each soil site used may be available after completion of the contest
and will be posted on the FFA Web Site. The winners will be announced at the Awards
Ceremony.
4. 1st Place team or alternate may represent Minnesota at the National Soil Contest in
Oklahoma.
5. Materials available for FFA Land Judging are posted on the FFA
Website(http://afee.coafes.umn.edu/ffacon/):
a. Minnesota FFA Land Judging Score Card (2005)
b. FFA Land Judging Instructions – (2005)
c. Land Judging Placard – (2005)

8/24/2012 27
GRADING THE SCORECARD
Several general rules apply to grading the scorecard. A master scorecard is used to indicate acceptable answers. Never
record a minus score for any part.
Parts 1, 2, & 3 A. The point assignment is two points for correctly recording each depth with a range of 1” above
and 1” below being correct. Where boundaries are indistinct or variable, the official judge will
allow for appropriate variation in the answers.
B. – Allow four points for correctly identifying the correct color in parts 1 & 2.
C. - Allow 5 pts for identifying the correct texture in parts 1, 2 & 3.
D. - Allow 2 pts for identifying the correct gravel and rock.
Part 4 Allow 3 pts each for identifying the correct steepness and correct landscape position. If the wrong
box is checked or if a correct answer is not marked, the score for that part is zero. Judges may allow
an alternative choice or award partial credit if the choice is considered difficult or borderline.
Part 5 Allow six points if the correct class number is circled. If more than one number is circled, the score
is zero. If the circle is one class from the correct answer, allow three points credit. No credit
allowed between classes IV and V and between V and VI. Three points is allowed between class
IV and VI.
Part 6 A. thru D. Allow 2 pts each for identifying the correct answer. If the wrong box is checked or if a
correct answer is not marked, the score for that part is zero.
E. – Allow 1 pt. For each correct answer in 1-a.b.c; and 2-a.b.c. Allow 4 pts. for 3 and 6 pts for 4. If
the wrong box is checked or if a correct answer is not marked, the score for that part is zero
Part 7 Allow two points each for parts A. Amount of erosion and B. Kind of erosion. If the wrong box is
checked or if a correct answer is not marked, the score for that part is zero.
Part 8 Allow 3 pts each for A. Water Erosion and 3 pts for B. Wind Erosion. Only one answer is allowed
in each section. If the wrong box is checked , if two boxes are checked, or if a correct answer is not
marked, the score for that part is zero.
Part 9 Allow 5 pts. for identifying the correct Drainage Required. If the wrong box is checked or if a
correct answer is not marked, the score for that part is zero.
Part 10 Allow two pts each for identifying the correct fertilizer and lime recommendations. If the wrong
box is checked or if a correct answer is not marked, the score for that part is zero.
Part 11 Land Use Limitations
Each USE will be scored and totaled individually as follows:
Limitations - Allow three points for correct answers.
Land Features - Allow one point for every correct answer in each column.
If the wrong box is checked or if a correct answer is not marked, the score for that part is zero.

8/24/2012 28
Part 1: Subsurface Soil - Part 3 Parent Material - Continued
A. Thickness in Inches B. Texture
1 2 3 4 5 6 7 8 9 10 11 12 13 14 15 16 17 18 Coarse
Moderately Coarse
2 Medium
19 20 21 22 23 24 25 26 27 28 29 30 31 32 33 34 35 36> Fine
Very Fine
Allow 1 inch either way on thickness C. Gravel
B. Color None to Few
Dark Gravelly
Medium Very Gravelly
Light Extremely Gravelly
C. Texture Part 4 A Steepness of Slope
Coarse A. Steepness of Slope
Moderately Coarse Nearly level - 2% or less
Medium Gently sloping - 3 - 6 %
Fine Moderatley sloping - 7-12%
Very Fine Strongly sloping - 13 to 18 %
D. Gravel and Rock Steep - Greater than 18 %
None to Few B. Topography
Gravelly Upland
Very Gravelly Terrace - Footslope
Extremely Gravelly Bottomland - Flood Plains
Part 2: Subsurface Soil Depressional Area - No Outlet
A. Thckness in Inches Part 5 - Land Capability Classification
1 2 3 4 5 6 7 8 9 10 11 12 13 14 15 16 17 18 Class I
Class III
Class III
19 20 21 22 23 24 25 26 27 28 29 30 31 32 33 34 35 36> Class IV
Class V
Allow 1 inch either way on thickness Class VI
B. Color Class VII
Bright Class VIII
Mottled Part 6 Interpretation of Soil Features
Dull A. Type of Material that Limits Depth
C. Texture None- No limiting materials
Coarse Bedrock - Soft or hard
Moderately Coarse Harpan - Cemented
Medium Very gravelly sand or high water table
Fine B. Parent Material
Very Fine Bedrock - Soft or hard
D. Gravel and Rock Alluvium/Outwash/Lacustrine
None to Few Till/Loess/Aeolian Sand
Gravelly Organic materials - Peat or muck
Very Gravelly C. Depth Favorable
Extremely Gravelly Very Deep - 60 inches or more
Part 3: Subsurface Soil Deep - 40 through 59 inches
A. Thickness in Inches Moderately Deep - 20 through 39 inches
1 2 3 4 5 6 7 8 9 10 11 12 13 14 15 16 17 18 Shallow - less than 20 inches
D. Air and Water Movement (Subsoil Permeability)
Very Rapid
19 20 21 22 23 24 25 26 27 28 29 30 31 32 33 34 35 36> Rapid
Moderate
Allow 1 inch either way on thickness Slow
Minnesota FFA Soils ScorecardName ________________________ School ______________________________ Number _______ 5/12
4
53
2
3
6
5
2
2
2
2
5
2
4
Score 6 points for
correct answer - 3
points for 1 class off
except for class 5.
Allow 3 points
between Class IV and
VI.
Land suitable
for for
Cultivated
Crops
Land suitable
for Permanent
Vegetation
2
2
2

8/24/2012 29
E. Total Available Water capacity Part 7 Accelerated Erosion
1. Available water in horizon per inch of soil A. Amount of Erosion
0.05 No erosion evident (less than 2 inches)
0.15 Deposition (2 inches or greater)
0.20 Erosion present (2 inches or greater)
0.05 B. Kind of Erosion
0.15 None
0.20 Active gully 0.05 Wind erosion
0.15 Sheet or rill
0.20 Part 8 - Need for Erosion Control
2. Available Water Capacity per Horizon A. Water Erosion
a. Surface Horizon None to slight
8.1> Crop cover, sod cover, and conservation tillage
Contour, strip crop and conservation tillage
b. Subsoil Grass waterways and gully control
8.1> Woodland or permanent pasture
Wildlife or recreation
c. Underlying Material B. Wind Erosion
8.1> None to slight
Mulch tillage, cover crop
3. Total available water capacity in five feet of soil
Very low - Less than 3 inches None required
Low - 3.1 to 6.0 inches Surface and/or tile
Moderate - 6.1 to 9.0 inches
High - over 9.0 inches
4. Internal Drainage
Well Drained
Moderately well drained
Somewhat poorly drained
Poorly or very poorly drained
Part 11 - Land use Limitation (Points are for each section)
3 Pts Each 1 Point Each
4.1-5.00-1.0 1.1-2.0 2.1-3.0 3.1-4.0 6.1-7.0
4.1-5.0 5.1-6.0
Septic tank
absorption
fields
0-1.0 1.1-2.0 2.1-3.0 3.1-4.0
Slight
6.1-7.05.1-6.0 7.1-8.0
Calculation Area
8
8
0 to 6.0
40 to 60
po o rly
drained
less than
40
M o derate
R apid to
very rapid
5.1-6.0
mo re than
60
40 to 60
less than
40
mo re than
60
very rapid
to rapid
M o derate
s lo w to
very slo w
Slo w
M o derate
Severe
so mewhat
po o rly to
po o rly
drained
N o ne
A ny f lo o ding
0 to 6.0
6.1 to
12.0
M o re
than
12.0
M o re
than
12.0
A ny f lo o ding
A ny
F lo o ding
N o ne
well to
mo d well
drained
so mewhat
po o rly to
po o rly
drained
well to
mo d well
drained
so mewhat
po o rly
drained
Farm
lagoons and
holding
basins
Slight 0 - 2 .0
M o derate2.1 -
6 .0
Severe
M o re
than
6.0
9
4
4
1
1
co arse,
mo d.co arse,
medium
Underlying
Material
(Shrink Swell
Potential)
Internal
Drainage
Class
Permeability
Class
Depth to
Bedrock
(inches)
well
drained,
mo d. well
drained
mo re than
60
Use Limitation
Dwellings
(lawns),
foundations,
basements
Slight
M o derate
Severe
0-1.0 1.1-2.0 2.1-3.0 3.1-4.0 4.1-5.0
7.1-8.0
1
6.1-7.0 7.1-8.0
1
1
1
a. Surface
Horizon
b. Subsoil
C. Underlying
Material
40 to 60
less than
40
f ine texture
very f ine
texture
Potassium pounds per acre
Lime tons per acres
2
Nitrogen pounds per acre
Phosphorous pounds per acre
Part 10 - Fertilizer and Lime Recommendations
2
2
2
2
2
3
3
5
Part 9 Drainage Required
6.1 to
12.0
% SlopeSurface Soil
TextureFlooding
medium,
mo derate,
co arse
co arse,
f ine,
very f ine
N o ne

8/24/2012 30
FFA LAND JUDGING PLACARD – MINNESOTA
Pit Number _ _ _ _ _ _ _ _ _ _ _ _ _ _ _ _ _ _ _ _ _ _ _ _ _ _ _ _ _ _ _ _ _ _ _ _ _ _
Lime Area _ _ _ _ _ _ _ _ _ _ _ _ _ _ _ _ Flooding _ _ _ _ _ _ _ _ _ _ _ _ _ _ _ _ _
pH _ _ _ _ _ _ SMP Buffer Index _ _ _ _ _ _ _ Assumed Field Size _ _ _ _ _ _ Acres
P Test_ _ _ _ _ _ _ _ _ _ _ _ _ _ _ lb./acres available phosphorus
Subsoil Phosphorus Level _ _ _ _ _ _ _ _ _ _ _ _ _ _ _ _ _ _ _ _
K Test _ _ _ _ _ _ _ _ _ _ _ _ _ _lb./acres exchangeable potassium
Subsoil Potassium Level _ _ _ _ _ _ _ _ Manure Applied _ _ _ _ _ _ _ _ _ Tons/Acre
Corn Yield Goal _ _ _ _ _ _ _ _ _ _ _ _ _ _ _ _ _ _ _ _ _ bu./acres
Crop to be planted _ _ _ _ _ _ _ _ _ _ _ _ _ _ _ _ _ _ _ _ _ _ _ _ _
Past Crop _ _ _ _ _ _ _ _ _ _ _ _ _ _ _ _ _ _ _ _ _ _ _ _ _ _ _ _ _ _
Original Surface Soil Depth _ _ _ _ _ _ _ _ _ _ _ _ _ _ _ _ inches
Slope Length _ _ _ _ _ _ _ _ _ _ _ _ _ _ _ _ _ _ _ _ _ _ _ _ _ feet
Depth to permanent water table _ _ _ _ _ _ _ _ _ _ _ _ _ _ _ _ _