ff 65 PROCEDURE FOR OBTAINING FLUID I AMPLIFIER ...
73
o0 GPO PRICE $ ______ 0v CESTI PRICE(S) $______ UsA-Hard copy~ (HC)- ( U0 Microfiche (MF) e' ff 653 July 65 . PROCEDURE FOR OBTAINING FLUID I AMPLIFIER RELIABILITY DATA ..{O f;l'4-S9 , AUTHORS: J. N. SHINN F. A. UNDERWOOD oG. J. HAHN 0 2 NOVEMBER 1965 Prepared For mg9 W11013 A1111 THE ASTRIONICS LABORATORY MARSHALL SPACE FLIGHT CENTER NATIONAL AERONAUTICS AND SPACE ADMINISTRATION HUNTSVILLE, ALABAMA CONTRACT NAS 8-5408 SELECTRIC eGENERAL E , W C SCHENECTADY, NEW YORK
Transcript of ff 65 PROCEDURE FOR OBTAINING FLUID I AMPLIFIER ...

o0 GPO PRICE $ ______
0v CESTI PRICE(S) $______
UsA-Hard copy~ (HC)- ( U0 Microfiche (MF) e
ff 653 July 65
PROCEDURE FOR OBTAINING FLUID I AMPLIFIER RELIABILITY DATA
O fl4-S9
AUTHORS J N SHINN
F A UNDERWOOD
oG J HAHN
0 2 NOVEMBER 1965
Prepared For
mg9 W11013 A1111
THE ASTRIONICS LABORATORY MARSHALL SPACE FLIGHT CENTER
NATIONAL AERONAUTICS AND SPACE ADMINISTRATION HUNTSVILLE ALABAMA
CONTRACT NAS 8-5408
SELECTRIC eGENERAL E
W
C
SCHENECTADY NEW YORK
PROCEDURE FOR OBTAINING FLUID AMPLIFIER RELIABILITY DATA
AUTHORS J N SHINN
F A UNDERWOOD
G J HAHN
NOVEMBER 1965
Prepared For
THE ASTRIONICS LABORATORY MARSHALL SPACE FLIGHT CENTER
NATIONAL AERONAUTICS AND SPACE ADMINISTRATION HUNTSVILLE ALABAMA
CONTRACT NAS 8-5408
GENERAL ELECTRIC
SCHENECTADY NEW YORK
FOREWORD
The fluid amplifier reliability procedure work described in this report was carried out as Phase IV and as Task 3 Phase V of a National Aeronautics and Space Administration fluid amplifier program Research and Development - Fluid Amplifiers and Logic (Contract NAS 8-5408) The work was sponsored by the Astrionics Laboratory at the George C Marshall Space Flight Center Huntsville Alabama This project originated under the technical direction of Mr R E Currie and subsequently was under the technical direction of Mr J A Peoples
The work was conducted at the Mechanical Technology Laboratory General Electric Research and Development Center in Schenectady New York Mr R C Bowlin was the project engineer and Dr J N Shinn provided technical direction In addition to the authors other major contribushytors to the program were Messrs A R Adler R K Rose and H W Avery
ABSTRACT
This report summarizes the work performed to develop initial procedures by which data may be gathered and on which an assessment of fluid amplifier reliability may be made A specific test directed toward evaluating the reliability of fluid amplifiers and a generalized failure report form have been developed Recommendations have been submitted for procedural improvements and expanded scope to better understand the physics of fluid amplifier failures
ii
TABLE OF CONTENTS
Section Page
I INTRODUCTION 1
22 SYNOPSIS
21 Program Plan 2
22 Summary of Results 3 23 Conclusions 4
24 Recommendations 5
3 METHOD OF APPROACH 6
31 Program Philosophy 6
3 2 Factors Affecting Reliability - Definition 6
33 Establishing the Test Procedure 8
4 DISCUSSION 10
41 Test Approach 10
42 Nature of the Test Data 18
4 3 Inspection Results 24
APPENDIX -A-t-TEST DATA 26
APPENDIX B - FAILURE REPORTS 41
APPENDIX C - DIGITALELEMENT SELECTION 52
iii
Section 1
INTRODUCTION
Apparent advantages with respect to the failure mechanisms inherent in competing devices are by themselves insufficient proof of fluid amplifier reliability A procedure must be developed by which data may be gathered in an orderly fashion and on which an accurate assessment of fluid amplifier reliability may be made independent of competitive devices The primary emphasis of this program was directed toward establishing such a procedure
Up to now a fundamental consideration in the choice of fluid amplifiers for applications (such as logic devices and control systems) has been the intuitive conclusion that fluid amplifiers will offer substantially increased reliability over other devices that might be called upon to perform similar functions This intuitive judgement is based on an understanding of how conshyventional hydraulic pneumatic or electronic devices fail and on the easily descernible immunity of fluid logic to those mechanisms of failure
It was apparent that the absence of moving parts precludes the conventional aspects of friction induced by sliding or rollingparts It was also evident that the functional integrity of fluid amplifiers is not dependent on the choice of a particular mnaterial but that material selection could be adapted to the needs of environmental constraints For example the effect of radiation which is apparent in silicon semiconductors could be minimized through material selection processes since the fluid amplifier characteristic is a function of its geometry and since the material need only be inert relative to the transport flu id
Section 2
SYNOPSIS
21 PROGRAM PLAN
To develop procedures for gathering information with which an assessment
of fluid amplifier reliability may be made one must recognize that in general
reliability data can be obtained from two sources
1 Specific reliability tests to obtain failure data under known and
controlled conditions
2 Failure reports gathered from various programs aimed at research
or device development that is programs not specifically aimed at
reliability work
2 1 1 RELIABILITY TEST PROCEDURE
This program concentrated on failures in digital devices because 1) a digital failure could clearly be defined and 2) definition of failure in anashylog devices (e g degradation of gain or response) becomes difficult unless catastrophic The test device selected was a series stack of digital elements referred to as a serial shift register with the output connected back to the inshyput so that it stored information on application of clock pulses (for element selection details see Appendix C) The register capacity was five bits each clock pulse advanced the stored number or digit order by one bit so that after five clock pulses the register again contained the initially set five-bit word Six such registers were continuously clocked at a 120 cycle per second pulse rate Thus the digital fluid amplifier elements switched as the preset number circulated through the shift register at the rate of approximately 2 07 x 106
times per day
The following plan was followed to study failure rates
Phase I - Operation at design conditions
Phase II - Operation at stressed conditions
Phase III - Retest at design conditions
In Phase II the stresses were changes in operating parameters most likely to be encountered with fluid amplifier circuits in a practical application The parameters their design values and the stress values are shown in Table 1
The procedures were refined as the test work proceeded and the failure data investigated to determine its statistical significance (procedural changes of any significance occurred subsequent to Phase II)
Table 1
CHANGES IN OPERATING PARAMETERS
Operating Parameter Design Value Stress Value
Supply gas pressure Flip-flop shy 15 psig 25 percent decrease Gate - 20 psig
Supply gas temperature 700 F 1600 F Environment contamination Room air ambient 10 ml
Arizona road dust
The Phase III testing was carried out to learn if any permanent damage had occurred because of testing at stressed conditions Finally the test devices which produced the greatest failure rates as a result of the stress tests were torn down to learn if the physics of the failures could be determined
2 12 FAILURE REPORTS
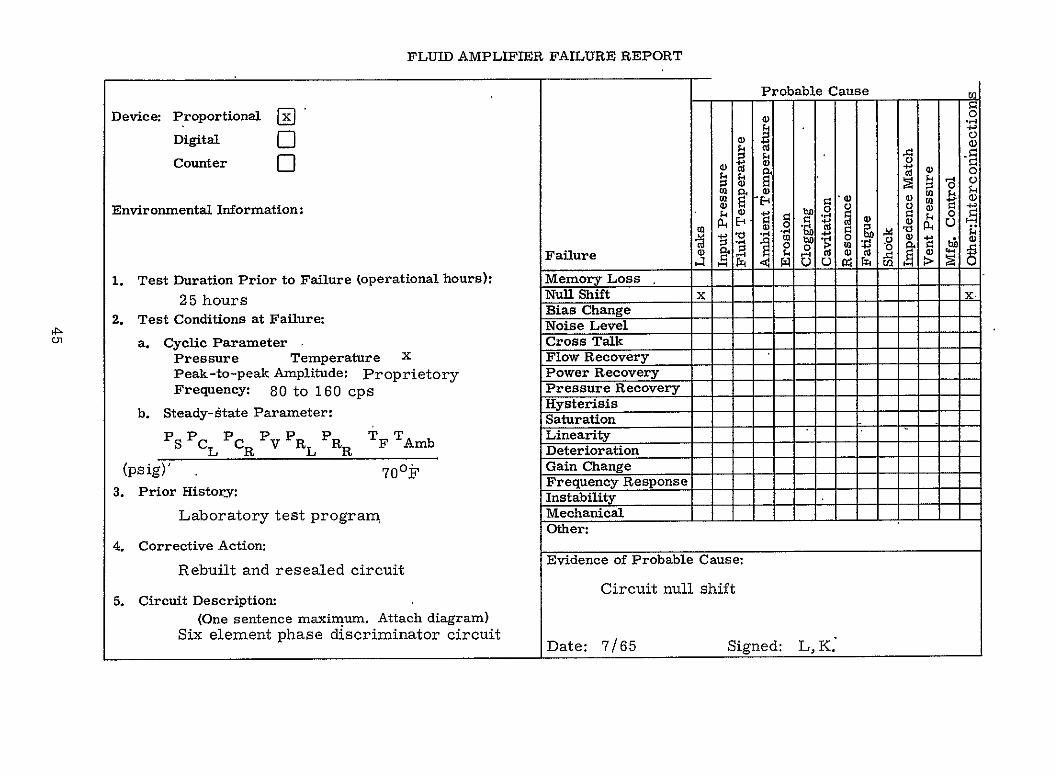
Failures of fluid amplifier elements in programs at the General Electric Research and Development Center were documented on a standard report form (see Appendix B) developed during this reliability program The intent of this failure recording was not to establish procedure but rather to develop reshyporting techniques amenable to collecting data from a large variety of sources In order to encourage reporting the form is a brief one page document which could be quickly completed Although the failure reporting form was developed and modified once during this program in an attempt to cover all reported failures it is not yet considered all-inclusive It is expected that additional refinement and updating will be necessary when this reporting procedure is implemented
2 2 SUMMARY OF RESULTS
A fluid amplifier standard report form has been developed by which information pertinent to fluid amplifier reliability may be collected Failures reported on fluid amplifier standard report forms from development programs at the Research and Development Center appear primarily due to manufacturing techniques which at the present state-of-the-art are not necessarily optimum At this time there is little or no history with which failure trends may be esshytablished (See Appendix B)
A basic test procedure has been established by which accurate reliability information may be gathered for digital fluid amplifiers Observations based on preliminary data are as follows
3
1 Failures appear to be nonrandom in that certain patterns were more predominant than others while in general failure rates varied with time
2 Data from some (but not all) shift registers suggest a higher failure rate under increased temperature Further there is no clear cut evidence that pressure or contamination lead to any changes in mean time to failure or that residual effects from previous stress conditions exist
3 A substantial variability existed in the number of failures between shift registers In general however a total of 51 failures occurred in 486 shift register test days at standard room temperature conditions while 57 failures occurred in 294 shift register test days at stressed environmental conditions (As noted before 2 07 x 106 switch cycles occur in one shift register test day
23 CONCLUSIONS
It has been concluded that the test procedure developed when properly monitored is one successful approach by which accurate reliability informshyation may be gathered By requiring each shift register to hold the same digit order the likelihood of failure is the same for each register and the effect of geometry or stress level may be evaluated independently of a variable probability of failure A measure of the element memory reliability may be evaluated separately from its ability to switch when it is required that each shift register hold a digit order which does not require switching between digits Finally the significance of switching sequence may be evaluated by changing the digit order on all registers to all possible combinations of digit orders (some digit orders have higher probabilities of failure)
Perhaps the most notable conclusion derived from the preliminary data in this program is that shift register failures (the inability to hold an input number) occur in clearly nonrandom or preferential patterns Although it is not known specifically which variables (environmental or geometric) affect this phenomenon several statements may be made First failures occurred clustered in time irrespective of prior test duration This tends to contradict the assumption that infant mortality or burn-in periods will eliminate such clustering Second shift registers of the same design reacted differently to changes in environmental conditions
It may be concluded therefore that environmental trends or patterns applicable to all the digital amplifiers were not established It does indicate however that one or both of the following may apply Either the changes in stress level were insufficient in magnitude and therefore inconclusive or the likelihood exists that manufacturing processes and tolerances are extremely
4
critical and strongly influence the amplifiers susceptibility and trend relative to environmental changes The latter is probably more accurate The conshysiderable variation in failure rate demonstrated between shift registers at the same level of stress and in the same environment is probably related to the manufacturing process
Statistically the data gathered is preliminary limited in quantity and therefore doubtful as to its credibility as being truly representative of the fluid amplifier population It represents the first point on a history curve What is important however is the creation and demonstration of a test procedure or approach which will permit future programs to expand on this beginning
24 RECOMMENDATIONS
In order to achieve a better understanding of the physics of fluid amplishyfier failure and expand upon the knowledge already obtained the following recommendations are made
1 Work should be performed to understand which amplifier characteristics are critical and most significantly affect failure rate Of interest is the sensitivity of switching level (control pressure) and element gain (discharge pressure) to geometric changes of the interaction region and flow level
2 To understand the physical significance of the apparent nonshyrandom failure patterns work should be performed to detershymine the sequence of events whiich occur when a failure takes place First instrumentation should be increased in scope to ascertain if serial shift register failures occur consistently because of a particular element in that stack Then transient instrumentation may be applied to the suspect element and a like element which does not malfunction to compare the sequence of events that occur during the switching process
3 Test equipment should be modified to include a system of time marking signals so that the selection of digit orders can be expanded to include all possible combinations -and evaluate each probability of failure
4 A set of Acceptance Test limits should be developed to define acceptable operation of an analog element which might be shipped as a production unit Testing as outlined above should then be performed to determine the analog element characteristic sensitivities to geometry changes (possibly due to erosion) or variable source pressures (possibly due to leaks)
5
Section 3
METHOD OF APPROACH
3 1 PROGRAM PHILOSOPHY
Conventional reliability assessments direct themselves toward the estabshylishment of a Reliability Figute of Merit such as failure rate or mean time between failure based on the statistical evaluation of a meaningful sample This sample tested under controlled environments provides such measureshyments with some measure of statistical confidence Further these test proshygrams generally require a product maturity that allows the treatment of failure events as a random occurrence or in rare instances as being associated with some other (but equally well-defined) distributional assumption
Because of the early development status of fluid amplifiers this preshyliminary investigation of fluid amplifier failure rates attempts to do more than establish an initial point on the reliability growth curve and informs on the devices reliability potential This program directs itself toward 1) establishshying meaningful reliability testing procedures where the ultimate goal is inshycreased understanding of the physics of failure of fluid amplifiers 2) providing preliminary information useful in assessing inherent reliability and 3) proshyviding guidance in determining areas of weakness and therefore areas of emshyphasis during continuing program development
32 FACTORS AFFECTING RELIABILITY - DEFINITIONS
In order to evaluate the failure mechanisms that might be appropriate for investigation at this time it was decided to classify all potential failure types into five major categories Only those appropriate during early developshyment were considered during the program The five failure mechanisms are identified as
1 Mean Basic
2 Mean Contaminant
3 Variants
4 Freaks
5 Abnormal Environments
321 MEANBASIC
This category is defined as the one where the mean strength or mean life is limited by the properties of the basic constituent materials of the part
6
The problems in this category are not related to variability from specimen to specimen nor are they subject to external contaminants The important featur of this category is that it is dependent on the physical properties of the basic material or the basic design and that it is likely to be a limiting factor in all components and not just in a small percentile of the population An example of a Mean Basic failure in fluid amplifiers might be the fatigue failure of a thin section due to inadequate stress margins Control of mean basic failure mechanisms therefore must be undertaken during the initial development of the product and cannot be improved by process or quality control
322 MEAN CONTAMINANT
The category described as mean contaminant while relating to mean strength or mean life concerns itself with the influence of a foreign or conshytaminating material In the case of fluid amplifiers contaminants exist to a greater or lesser degree in all fluids but unlike the mean basic category the opportunity exists for varying the amount of contaminant without a change in basic materials The erosion of iharp edges by contaminants in the transshyport fluid would be a typical example of this category
323 VARIANTS
This category relates to the limitation of strength or life due to the effect of statistical variability within the population It is often the result of a poorly controlled manufacturing process and many examples of the life limiting efshyfects of variability can be cited for example a fluid amplifier failure of this type might be due to dimensional variability and bond strength These types of failures should not be considered during an early developmental program
324 FREAKS
The category of freaks includes those failures which are not representashytive of the test lot Very often these freaks are sorted out during infant mortality checks such as run-in or burn-in In the case of fluid amplifiers such freaks would include gross leakage at interconnections or failure to drill a control port
325 ABNORMAL ENVIRONMENTS
In this category failure occurs due to abnormal usage conditions This type of failure mechanism is usually not exposed by in-house testing but by a pos m6rtem analysis An6xample of thistyp6 of failure could befroi operation in a pressure range in excess of those specified for a particular fluid amplifier design
7
In the initial analysis appropriate for investigation during this phase of
the program consideration of failures resulting from the so-called freak have
been eliminated Primary emphasis has been placed on the Mean Basic
Mean Contaminant and Abnormal Environment categories with little considershy
ation being given to those failure mechanisms that are primarily a question
cf production or process control
33 ESTABLISHING THE TEST PROCEDURE
The establishment of a test procedure required the selection of meaningshy
ful failure parameters that could be observed and easily monitored during a
detailed test program This was accomplished by reviewing with selected
laboratory personnel engineers and technicians the results from prior indishy
vidual element tests For example
1 Previous modes of failures
2 The mechanism potentially responsible for such failure and
3 Other failure modes and mechanisms that could be postulated
This review disclosed a variety of possible failure modes that might be
relevant in this investigation such as catastrophic failure memory loss
noise cross-talk improper gain and instability
The failure mechanisms for the above modes could include chemical
attack creep aging overpressure (or underpressure) surface erosion thermal distortion channel corrosion stress corrosion fatigue film buildup
oneand fluid contamination A review of these modes and mechanisms allows
to classify the dominant mechanism into three groups
1 Ambient effects
2 Transport fluid effects
3 Geometric effects
In devising a program that would meaningfully evaluate these effects on
fluid amplifier failure it was deemed necessary to make this test not only sensitive to the main effects of these mechanisms but also to their sequence of occurrence This could best be achieved by designing a statistical test using pressure temperature and contamination as the three factors influencshying the six stacks of elements each stack consisting of fifteen digital fluid amplifiers previously referred to as shift registers
7For discussion of statistical testing see National Bureau of Standards Handbook No 91 Experimental Statistics August 1963
8
B
T 2 PiC2 - TPC I
deg- I
-- 1TIP2CI
T1 P1 C1 IP 2 C1
Figure 1 Statistical Test Profile
Figure 1 illustrates the statistical test profile that was followed All six shift registers are initially tested under T I P 1 C 1 conditions Upon completion of the test for a specified number of hours the registers are divided into three groups of two each and are tested under the following conditions
Two shift registers at T2 PI C 1 followed by T 2 P2 C1
Two registers tested at T11 P 2 C1 followed by T11 P2 1 C 2
Two registers to be tested at TI P 1 C2 followed by T 2 PI1 C 2
Upon completion of this test path all six registers were again tested at T2 P 2 C2 Additional stress levels for these factors can be obtained by proshygressively testing within Blocks B and C etc in a manner similar to that followed in Block A until all registers have been tested at T3 P3 C3 and so on This latter graduated test (Blocks B and C) however was beyond the scope of this program
9
Section 4
DISCUSSION
41 TEST APPROACH
The serial shift register was selected as the most convenient test device
because
1 It is a digital device and failures are easily defined and identified
2 By recirculating information initially set into a register the
failures become self-recording i e failure of any one
fluid element at any time will change the stored information
3 Instrumentation is relatively simple Because of failure
self-recording the instrumentation is not subjected to long test times it is used only during periodic monitoring
The registers were a five-stage device (Figure 2amp3) which provided
five-bit serial word storage capacity Bit storage was provided by a fluid
amplifier flip-flop and digital amplifiers were used to gate information from a
given flip-flop to the succeeding flip-flop Thus application of a clock pulse
to the register advanced the stored information by one bit Since the register
connected back to the input (similar to a ring counter) the applicashyoutput was tion of five clock pulses brought the initially stored information back to the
Each digital element used in the six-shift registers was selecshysame position ted via the procedure discussed in Appendix C The clock pulses were genershy
ated by a motor-driven slotted disc at a rate of 120 pulses per second A view of the assembled test rig is shown in Figure 4
A particular serial binary number preset in the register was observed
by means of a pressure transducer attached at one of the feedback lines
(register output to input) An oscilloscope was used to observe the transducer
signal a positive-pressure pulse arbitrarily was assigned the value 1 and
correspondingly negative-pressure pulses became 0 as shown in Figure 5
The front or leading edge of the five-bit number was identified in the pulse
train appearing on the oscilloscope by proper selection of the initially set
numbers For example if the-number 11010 is preset into the register the
two most significant digits are identified by the adjacent s (Figure 5 ) could occur such that one set of adjacentIt is conceivable that several failures
s could appear in other than the preset arrangement It was concluded
that the likelihood of such occurrences would be very small Future work
with the setup will include a marker pulse to avoid this assumption
10
Figure 2 View of Shift Register
Feedback
T T Flip-flop - ------------
One Stage
Gate Gate
Figure 3 5-Bit Shift Register
12
Figure 4 Test Apparatus
- - igu- 5 Read o Ca In -it
Figure 5 Readout Signal Characteristic
The test setup also included a line pressure recorder and an indicator to detect any power failures that may have occurred between monitoring periods Without this instrumentation loss of line pressure or electrical power will cause the registers to drop information Hence such losses could be mis shytaken for register failures
The testing was carried out in three phases The Phase I test was carried out with all six registers operated at design conditions This test duration was relatively long (approximately 1872 hours) to obtain large amounts of data to more accurately establish failure rates at unstressed conditions and to learn if preferential failure modes occur (e g characteristics of a
particular number or register) During this test the supply pressures to the registers were at the design values (1 5 and 2 0 psig to the flip-flops and the
gates respectively) the temperature of the ambient and supply gas was at room temperature and the registers were operated in a relatively clean enshyvironment The setup was operated 24 hours per day and monitored once per day
In the Phase II testing the selection of stress levels was dictated by the register design and the fabrication materials It was concluded that the most likely change in supply pressure would be a pressure drop (e g caused by line or fitting leaks or supply pump deterioration) By test it was established that the registers would operate as low as 50 percent of the design value for supply pressure The value of 25 percent supply pressure drop was selected as the stress level for pressure change This pressure change was used for the flip-flop the gates and the input clock pulses
The temperature stress selected was an increase in supply air tempershyature from room temperature to 1600 F This limitation occurred because of the photo-etched plastic fabricating material used for the fluid amplifier elements (program limitation did not permit use of higher temperature materials)
The contamination stress was applied by placing the register in a small bell-jar with a measured quantity (10 ml) of Arizona road dust (Mil-Spec) to simulate a typical dusty field environment The dust was stirred daily with small air jets to produce a cloud of contamination adjacent to the register Vents from the fluid amplifier elements communicated with the dust environment and thus the dust was injested by the elements at locations where aspiration from the environment occurred Figure 6 shows a register after operating in the dust environment Contamination was not added directly to the supply air
The Phase II testing sequence involved operating a pair of registers for about 400 hours under successive stress conditions as shown in Table 2
During the course of the testing in Phases I and II it became evident that the failures apparently were nonrandom In particular the failure rate of a given register seemed to be a function of the particular digital number
15
IV 7
Figure 6 Shift Register After Operation in a Dusty Environment
PHASE II TEST PROCEDURE
Registers Registers Registers I and 2 3 and 6 4and 5
Test 1 P T C
Test 2 C P T
Test 3 T C P
C = contamination P = supply pressure change T = supply temperature change
initially set into it As pointed out earlier no marker was used to identify the leading edge of the five digits The leading edge was identified by clustershying units towards it For example a 10100 initially set in later would appear on the oscilloscope as a train of pulses with two s separated by a 0 The scope then was synchronized so that the number would appear as a 10100 The lack of a marker signal limited the choice of binary numbers to be set in For example 10100 could not be distinguished from 01010 00101 or 01001 The numbers used for presetting the registers during the Phase I and Phase II testing were as follows
10100 11010 11110 10000
The numbers 11111 11100 11000 and 00000 were not used
The Phase III testing was carried out at design conditions to determine if any permanent damage had occurred as a result of the stressed tests Conshyforming to the procedure at the start of the design condition testing the registers were monitored at one hour intervals when the test started During this test phase all possible number combinations without a time marker were used (10100 11010 11110 10000 11111 00000 11100 and 11000) since the failures seemed to be nonrandom i e a function of the preset number In addition during this test each register was set to the same numshyber for about one day for each of the eight numbers and then repeated comshypletely Thus Phase III involved a total of about 16 days of testing Whenshyever a failure was noted the shift register was set back to the value for that day
The data obtained in this manner provided the necessary information to determine if the nonrandom failures were caused by differences in shift regisshyters or if the registers behaved differently with different preset numbers or both Use of a marker to positively identify the numbers leading edge would provide the greatest number of presettings (32) thus the most information on
17
nonrandom failure tendencies Future tests should include the use of such a marker Following the three phases of testing two registers were carefully disassembled to determine if any evidence of a deficiency could be observed which could cause malfunctioning The findings are presented at the end of this report
42 NATURE OF THE TEST DATA
The experimental results have been summarized in Appendix A Tables A-i through A-6 show the detailed failure patterns and the number of elapsed days between the setting of the number in the register and the determination that it has been lost for Phases I II and-I1 Also indicated is where a failure did not occur previous to the setting being changed
The results have been summarized according to the set-in value shift register environmental conditions and test phase in Table A-7 Finally error movements (failure from a particular set-up value to a particular readshyout value) are summarized in Table A-8 Taken as a whole
1 The data suggests a higher failure rate under increased temperature on some shift registers but not on others with no clearcut evidence that pressure or contamination levels experienced lead to any change in mean-timeshyto-failure In evidence note that the aggregate failure report at each of the test conditions was (see Table 3)
Table 3
FAILURE SUMMARY
Number of Shift Register Number of Mean Number of
Condition Test Days Failures Days to Failure
Standard- Phase I 486 51 95 Pressure Stress 108 17 64 Contamination 81 9 90 Temperature Stress 105 31 34
Whereas by shift register the failure distribution was
Shift Register Number 1 2 3 4 5 6 Failures - Phase I 0 8 2 2 10 21 Failures - Phase II 8 16 8 0 33 0 Failures - Phase III - 2 0 0 0 51 0
The results are not comparable between -test Phase III and test Phases I and II due to the difference in number of test days and inspection times For exshyample if inspections in Phase III would have been on a daily rather than an hourly basis 8 rather than 51 failures would have been recorded The results are however comparable between shift registers
18
The above tables make clear the very large differences in performance
between the shift registers Note also that the relative performance of the
shift registers was not consistent over the two phases Near the end of Phase I a low failure rate was switched inShift Register No 4 which to that point had
location in the test apparatus with Shift Register No 6 which up to that point
had a high failure rate Subsequently no failures occurred on Shift Register
No 6 in eight further days of Phase I testing and throughout Phases If and III
Shift Register No 4 also had no failures during Phases II and III and only one
failure during eight days at its new position in Phase I Comparison of the
results of initial testing at standard conditions (Phase I) and final testing at 6 performedstandard conditions (Phase III) indicated that Shift Register No
Shift Regisshyappreciably better in the subsequent testing than it did in Phase I
ter No 5 seemed to do somewhat worse and the remainder did approximately
the same
The reaction to change in test condition also varied among the shift No 4 and No 6 performed withoutregisters As indicated Shift Registers
failure at each of the three changed environments In contrast however 5 failed almost equally readily at each condition This shiftShift Register No
register showed about the same failure rate during an initial 14-day period of
normal testing (no variation in test condition) during Phase II as it did under
environmental change Consequently the high failure rate on this shift regisshy
ter during Phase II cannot necessarily be attributed to the change in testing condition
On Shift Register No 1 all eight Phase II failures took place during change in temperature with no failures under pressure and contamination
change On Shift Register No 3 six of the eight failures in Phase II took conshyplace under temperature change and the remaining two took place under
3 under pressuretamination There were no failures on Shift Register No nine and seven failures respectivelychange Finally on Shift Register No 2
took place under changed temperature and pressure with no failures under contamination
2 There is no conclusive evidence to suggest a residual effect of a
previous stress condition
Shift Register No 1 ran 114 consecutive days before its first failure occurred
(See TableA-l Appendix A)
19
The two shift registers with a predominant number of failures during
accelerated temperature testing were Registers No 1 and No 3 No informshy
ation can be gathered concerning residual effects by examining the results on
Shift Register No 1 during Phase II since the increased temperature testing
on this shift register was conducted last (after the pressure and contamination
change) However two failures did take place in Phase III
Shift Register No 3 does provide an evaluation of residual effects since
the increased temperature testing on this shift register was conducted as the first environmental change It was found that immediately subsequent to inshy
creased temperature testing there were no failures in 15 days of testing at
changed temperature and only four failures in the 16 days following days with
contamination Furthermore there were no failures on this shift register in Phase III Thus the data on Shift Register No 3 suggests that the failure pattern observed during increased temperature testing does not hold over in subsequept tests after the temperature has been returned to normal
3 Various nonrandom patterns asserted themselves The specific
patterns noted were
a Seventy-seven of the Phase I and Phase II failures were simple in that only one of the five binary numbers was involved in the failure The remaining 31 failures involved two or more binary numbers The exact nature of these failures (i e the specific
binary bits involved) can be gathered from Tables A-1 through A-6 (and are also discussed further below
b During Phase I failure rates for a particular shift register were found to vary greatly from one set-up value to the next For example for Shift Register No 5 there were two failures in 20 days of operation for a set-up value of 10000 one failure in 45 days of operation for a set-up value of 10100 and seven failures in nine days of operation for a set-up value of 11110 The
corresponding results for the other five shift registers are shown in Tables A-1 through A-4 and Table A-6 This pattern was not evident in Phase II
Phase III was designed so as to permit clear-cut evaluation of the differences in failure rate for different set-in values The results on Shift Register No 5 in this phase confirmed the
previous findings that the failure rate depended upon the set-in value of the shift register as demonstrated by Table 4
20
Table 4
SHIFT REGISTER 5 PHASE III FAILURE DETAIL
First Day Number of Numberof
Second Day Numberof Number of
Set- in Value Failures -Readings Failures Readings
00000 0 7 0 8
11111 0 9 0 8
11110 0 0 0 0
11100 2 6 3 9
11000 9 9 8 8 10000 9 9 8 8 11010 0 8 0 8
10100 6 7 6 6
It is particularly noteworthy that the differences in results between set-in values repeated very well between the two days at which each set-in value was tested This repeatabilityhowever does not carry over when the results on Shift Register No 5 on the additional tests are compared with those previously noted for Phase I For example
The set-in value 10100 yielded 12 failures in two days of additional testing but only one failure in 45 days of testing during Phase I (this value was not used for set-in on Shift Register No 5 during Phase II)
The Set-in value 10000 yielded 17 failures in two days of additional tests but only two failures in 20 days of testing during Phase I (this set-in value also yielded a substantial number of failures in Phase II)
Certain failure patterns are much more prominent than others For example 15 of the 26 simple failures during Phase I were of the type 11110 to 11100 The specific changes in binary values which were involved in each of the 43 failures of Phase I and the 65 failures of Phase II are summarized in Table A-8 The probabilities of each simplefailure given a set-up ina partishycular location are also indicated on this table For example given the set-up 1110 the following simple failures are possible
Change to 11010 (two chances out of five) Change to 11100 (two chances out of five) Change to 1111 (one dhance out of five)
21
Thus the most likely pattern of the 16 failures of Phase I assuming random failure would be as follows
Change to 11010 - six or seven failures Change to 11100 - six or seven failures Change to 11111 - three or four failures
It is seen from Table A-8 that the actual results showed zero failures 15 failures and one failure respectively in the above three categories Thus one would suspect that the failure patterns are nonrandom This can be confirmed by comparing the actual results with the expected results using a statistical chi-square contingency test
Moreover the failure-patterns observed in Phase II difshyfered markedly from those in Phase I as illustrated by the following tabulation of simple failures based on a set-up value of 11010
Phase I Phase II
Change to 10100 0 Failures 15 Failures Change to 11000 4 Failures 0 Failures Change to 11110 0 Failures 2 Failures
d Failure susceptibility for a particular shift register using a specified set-up value also tended to vary over the period of the test For example the failure sequence during Phase I on Shift Register No 6 with regard to the set-up value 11110 was
Failure after one day using set-up value 11110
Failure after three days using set-up value 11110
Failure after one day using set-up value 11110
Failure after one day using set-up value 11110
Twenty-two days using other set-up valuesshy
-Davies 0 L Statistical Methods in Research and Production Chapter 9 Hafner Publishing Company 1957 or Dixon W J and Massey F R Introduction to Statistical Analysis Chapter 13 McGraw-Hill Book Company 1951
-Results at other set-up values are not pertinent to this analysis since it has been previously shown that different failure rates are obtained for different set-up values
22
Failure after one day using set-up value 11110
Failure after zero days
One day using other set-up values
No failure for 17 days using set-up value 11110
Eight days using other set-up values
Failure after six days using set-up value 11110
Failure after four days
No failure after eight days using set-up value 11110
It is evident that failures occurred more frequently for this particular set-up shift register combination near the beginning of the testing phase than near the end Other combinations can be studied by examining Tables A- 1 through A- 6
4 Confidence intervals on mean-time-to-failure were not calculated although this could easily have been done by standard techniques It was felt that such a calculation would be misleading because of
a The differences between shift registers thus the confidence figure would vary from one shift register to the next The same difference also cloud the evaluation of the significance of decreased mean-time-between-failures under stressed conditions
b The nonrandom nature of the data which leads to variations in reliability according to input value and time
c The possibility-that some failures during Phases I and II could have occurred long before the actual read-out time (readings were taken on a daily basis and not on week ends) thus leading to over-optimistic estimates
It must be emphasized that while examining the above results one must keep in mind that they are based on a preliminary study involving six shift registers only Additional information need be obtained to confirm some of the initial trends that have been noted to date
tResults at other set-up values are not pertinent to this analysis since it has been previously shown that different failure rates are obtained for different set-up values
23
43 INSPECTION RESULTS
After completion of the Phases I II and III testing two registers were disssembled to learn if causes for failure could be detected Shift Register No 5 was selected for disassembly since at the completion of the Phase III testing (standard conditions) it had very high failure rates (at least one hour) In addition a register with low failure rates (Shift Register No 2) was disshyassembled to provide a basis for comparison
The appearance of the individual register elements was excellent The
only visual differences between their condition at initial assembly and at this teardown were three types of internal contamination
1 Small amounts of Arizona road dust plated out on vent channels near their termination to the ambient
2 Light coating of oil in the channels oil condensation occurred elsewhere in the test set-up indicating oil vapor in the air supply
3 A thin black varnish-like deposit in the interaction region of the elements The deposits appeared most concentrated at high velocity points
Closer inspection and comparison of the elements from the operating and the failing registers revealed that the epoxy bonding used to seal covers on the element cutouts may have failed The evidence of failure was that the oil film in the various element channels extended on to some surfaces (cover and element cutout) that were supposed to be bonded before disassembly The only explanation for the oil film appearing on the supposedly bonded surfaces is that separation of the bonded joint occurred and allowed leakage to occur Since the failure rates increased when the temperature was increased it was concluded that the bonding failures occurred because of overstressing from differential expansion of the fabricating materials Inspection of the covers and element cutouts of the properly operating register revealed no oil film on the bonded surfaces this information provided further verification that bondshyed joint failure occurred in Shift Register No 5
Further testing which is beyond the scope of the present program could be carried out to determine more conclusively the physics of the failures For example the failing register and a properly operating one could be intershychanged on thetest set-up to verify that the failures were internal to the regisshyters and not in the test equipment In addition each element from each regisshyter could be retested to determine if any significant changes of element pershyformance had occurred Specifically the element acceptance tests could be rerun and the curves could be compared to the elements in the new condition This test would reveal if any degradation of the element occurred because of
24
erosion or other causes Future work should include careful consideration of the plans for teardown and inspection since corrective action for failures will be meaningful only if the exact causes for failutes can be determined
25
Appendix A
TESTDATA
Table A-1
SHIFT REGISTER NO 1 RESULTS
PHASE I (NO STRESS)
Apprdximate Digit Order Number of days Set Value At Set Value
11010 1 11110 3 10100 1 10000 3 11110 3 10100 22 11010 21 10000 24
PHASE II (PRESSURE STRESS)
14010 12 10100 10
PHASE II (CONTAMINATION)
10100 14
PHASE II (TEMPERATURE STRESS)
11010 0-1 11010 0-2 11010 0-1 11010 0-3 11010 2-4 11010 0-4 11010 0-i 11010 0-1 11010 1 1
Failed to No Failure
Digit Reset Digit Reset
x x x x x x x x
x x
x
10100 10100 10100 10100 10100 10100 10100 10100
26
Table A-I Cont
PTIASE III (NO STRESS)
Digit Order Set Value
00000 11111 11110 11100 11000 10000 11010 10100 00000 11111 11110 11100 11100 11000 10000 10000 11010 10100
Approximate Niumber of Hours At Set Value
9 9 9 9 9 9 9 9 9 9 9 6 2 9 3 5 9 9
Failed to No Failure
Digit Reset Digit Reset
x x x x x x x x x x x
11000 x x
00000 x x x
27
Table A-2
SHIFT REGISTER NO 2 RESULTS
PHASE I ( NO STRESS)
Approximate Digit Order Number of Days
Set Value At Set Value
11110 1 11100 0 10100 2 11110 0 11010 4 11010 1 10000 13 11010 9 11110 1 11110 3 11110 7
11110 10 10100 21 10100 4
PHASE II(PRESSURESTRESS)
10100 0-7 10100 0-2 10100 0-1 10100 0-3 10100 0-1 10100 0-1 10100 1-2 10100 5
PHASE I (CONTAMINATION)
10100 15
PHASE II(TEMPERATURESTRESS)
11010 0-1 10000 0-2 11110 0-1
28
Failed to No Failure
Digit Reset Digit Reset
11100 x x
11100 11000
x 11000
x 11100 11100 11100
x 11111
x
11010 11010 11010 11010 11010 11010 11010
x
x
10100 11000 11000
Table A-2 Cont
PHASE II (TEMPERATURE STRESS) (continued)
Approximate
Digit Order Number of Days Set Value At Set Value
11110 0-3 11110 0-2 11010 0-2 11010 3-4 11010 0-1 10000 0-1
PHASE III (NO STRESS)
Approximate Digit Order Number of Hours
At Set ValueSet Value
00000 9 11111 9 11110 9 11100 9 11000 0 10000 9 11010 9 10100 9 00000 9 11111 9 11110 9 11100 9 11000 9 10000 9 11010 9 10100 9
Failed
to No Failure Digit Reset Digit Reset
11000 11000 10100 10100 10100 11000
Failed to No Failure
Digit Reset Digit Reset
x x x x x x x x x x x x x x x x
29
Table A -3
SHIFT REGISTER NO 3 RESULTS
PHASE I (NO STRESS)
Digit Order Set Value
10000 11100 11110 10000 11010 11010 11010
Approximate Number of Days At Set Value
3 2
26 20 19
2 4
PHASE II (TEMPERATURE STRESS)
11010 0-1 11010 0 10100 11010
11110 10000 6-8 10100 1-4 11010 0-1 10100 0-1 10100 2 10000
11000
10000 1
PHASE II (PRESSURE STRESS)
10000 15
PHASE II (CONTAMINATION)
10000 8 11010 0-2 11010 0-3 11010 3
Unable to Set Digit Order
30
Failed tb I N6 Failure
Digit Reset Digit Reset
x x x x
11111 11111
x
10100 10000
00000 10000 10000 10000
x
x
x
x 10100 10100
Table A-3 Cont
PHASE III ( NO STRESS)
Approximate Digit Order Number of Hours
Set Value At Set Value
10000 9 11111 9 11110 9 11100 9 11000 9 10000 9 11010 9 10100 9 00000 9 11111 9 11110 9 11100 9 11000 9 10000 9 11010 9 10100 9
Failed to No Failure
Digit Reset Digit Reset
x x x x x x x x x x x x x x x x
31
Table A-4
SHIFT REGISTER NO 4 RESULTS
PHASE I (NO STRESS)
Digit Order Set Value
11100 11010 10100 11010 11110 10100
Shift Register Moved to Position Six
10100 3 10100 5 11010 14
PHASE II (CONTAMINATION)
11010 8
PHASE II (TEMPERATURE STRESS)
10100 14
PHASE II(PRESSURE STRESS)
Failed to No Failure
Digit Reset Digit Reset
00000 x x x x x
11000 x x
x
x
x
Failed to No Failure
Digit Reset Digit Reset
x x x x x x
Approximate Number of Days
At Set Value
1 3 5
22 20 18
10000
PHASE III (NO STRESS)
Digit Order Set Value
00000 11111 11110 11100 11000 10000
16
Approximate Number of Hours
At Set Value
9 9 9 9 9 9
-Shift Register in Position Six
32
Table A-4 Cont
PHASE III (NO STRESS) (continued)
Approximate Failed Digit Order Number of Hours to No Failure
Set Value At Set Value Digit Reset Digit Reset
11010 9 x 10100 9 x 00000 9 x 11111 9 x 11110 9 x 11100 9 x 11000 9 x 10000 9 x 11010 9 x 10100 9 x
33
Table A-5
SHIFT REGISTER NO 5 RESULTS
PHASE I ( NO STRESS)
Approximate Digit Order Number of Days Set Value At Set Value
11100 1 10100 2 11010 1 10100 5 10000 11 10000 2 11110 1 10000 7 i0100 21 11110 i 11110 3 11110 1 11110 1 11110 1 11110 1 10100 10 10100 7 10000 0-1 10000 0-1 10000 0-1 10000 0-3 10000 0-1 10000 0-2 10000 0-2 10000 0-3
PHASE II(CONTAMINATION)
11110 1-2 11110 0-1 11110 0-1 11110 0-3 11110 0-1 11110 0-1 11110 0-1
34
Failed to No Failure
Digit Reset Digit Reset
x x x x
11100 11000 11100
x x
00000 11100 11100 11100 11111 11100 11010
x 11100 11110 11110 00000 00000 11110 00000 11110
11000 11100 11100 11111 10000 00000 00000
Table A-5 cont
PHASE II (TEMPERATURE STRESS)
Approximate Digit Order Number of Days Set Value At Set Value
-iii0 could not hold set value 10000 0-1 10000 1-2 10000 0-1 10000 1-4 10000 0-1 10000 0-1 10000 0-2 10000 0-3
PHASE II (PRESSURE STRESS)
10000 0 10000 0-1 10000 2-3 10000 0-3 10000 0-2 10000 0-2 10000 0-3 10000 0-1 10000 0-1 10000 0-1
PHASE III (NO STRESS)
Approximate Digit Order Number of Hours
Set Value At Set Value
00000 9 11111 9
11110 9 11100 5 11000 11
1211000 10000 1 10000
10000 114 10000 1 10000 1 11010 9
Failed to No Failure
Digit Reset Digit Reset
00000 00000 00000 00000 00000 00000 00000 00000
00000 00000 00000 00000 00000 00000 00000 00000 00000 00000
Failed to No Failure
Digit Reset Digit Reset
x x x
11110 11100 11110 11000 11100
1000 11100 00000
x
35
x
Table A-5 Cont
PHASE III (NO STRESS) (continued)
Approximate Failed Digit Order Number of Hours to No Failure
Set Value At Set Value Digit Reset Digit Reset
1510100 11010 00000 9 x 11111 9 11110 9 x 11100 2 11110 11100 5 11110 11100 1 11000 11000 1 11100
11000 1ii01i000 111 6 1110011000 117 11110
11000 1 1111010000 1 1-100010000 1 fI O00 10000 11010 91 1111~i0
10000 111i00
11010 9 x 10100 4 11010
10100 1 11100 10100 Rn ai010
-i Repeated six times at once per hour (hourly readings) 2 _ Repeated three times at once per hour (hourly readings)3 Repeated for times at once per hour (hourly readings)4 - Repeated nhre times at once per hour (hourly readings)5 Repeated four times at once per hour (hourly readings)
- Repeated four times at once per hour (hourly readings) 5 Repeated fiv times at once per hour (hourly readings)
8 - Repeated fiue times at once per hour (hourly readings)
Repeated four times at once per hour (hourly readings)
36
Table A-6
SHIFT REGISTER NO 6 RESULTS
PHASE I (NO STRESS)
Approximate Digit Order Number of Days
Set Value At Set Value
10100 1 10000 1 1110 1 11110 3 11110 1 11110 1 11010 1 10100 6 11010 4 11010 1 10100 10 11110 1 11110 0 10000 1 11110 17 10000 1 10000 3 10000 1 10000 1 10000 1 10000 1 11110 6 11110 4
Shift Register Moved to Position 4
11110 8
PHASE Ifl(TEMPERATURE STRESS)
10100 23
PHASE II(PRESSURE STRESS)
10100 18
37
Failed to No Failure
Digit Reset Digit Reset
11000 11000 11100 10000 11100 11000 11000 10000 11000 ii000
x 11100 11100 11000
x 11100 11100 11110 11111 11111 11100 11100 30000
x
x
x
Table A-6 Cont
PHASE II (CONTAMINATION)
Approximate Failed
Digit Order Number of Days to No Failure
Set Value At Set Value Digit Reset Digit Reset
10100 16
Shift Register in Position Four
PHASE III (NO STRESS)
Approximate Failed Digit Order Number of Hours to No Failure
Set Value At Set Value Digit Reset Digit Reset
00000 9 x 11111 9 x
11110 9 x
11100 9 x 11000 9 x 10000 9 x 11010 9 x 10100 9 x 00000 9 x 11111 9 x
11110 9 x 11100 9 x 11000 9 x 10000 9 x 11010 9 x 10100 9 x
38
Table A-7
SUMMARY OF TEST RESULTS
- Set In Value Shift Register Setting 10000 10100 11010 11110 11100 Total Number Phase Condition Sequence D F M D F M b F M D F M D F M D F M
I 27 0 cc23 0cc 22 0 c 6 0c 78 0 IT N 1 iI P 2 10 0 c 12 0 c 22 0
II C 3 14 0 cc 14 0 cc
II T 4 18 8 23 18 8 23
2 I 13 1 130 27 1 270 14 1 140 22 5 44 76 8 95 II N 1 II P 2 22 7 31 22 7 31 II C 3 15 0 cc 15 0 cc H T1 4 3 2 15 8 4 20 6 3 20 17 9 19
3 I 23 0 c 25 2 125 26 0 c 2 0c 76 2 380 II N I iI P 3 15 0 c 15 0 c II C 4 8 0 cc 8 2 40 16 2 80 II T 2 9 1 90 7 2 35 2 3 7 18 6 30
4 I A 23 0 cc 25 0 20 1 1 10 69 1 6902 I B 8 1 80 8 1 80
II N 1 14 0 c 14 0 iI P 4 16 0 c 16 0 H C 2 8 0 c 8 0 Il T 3 14 0 c 14 0
5 I 20 2 100 45 1 450 1 0 9 7 13 1 0c 76 10 76 H N 1 14 8 18 14 8 18 II P 4 17 10 17 17 10 17 II C 2 10 7 14 10 7 14 II T 3 15 8 19 I 15 8 19
6 I A 10 8 13 17 2 85 6 3 20 34 8 43 67 21 32 I B 8 0c 8 0
II N I II P 3 18 0 cc 18 0 II C 4 16 0 c 16 O o HI T 2 23 0 1 23 0 1
Total I 93 11 85143 5 286 93 6 155 125 20 63 4 1 40 458 43 107 Il N 14 8 18 14 0 c 28 8 3 5 II P 48 10 48 48 7 69 12 0 c 108 17 64 II C 8 0 w 47 0 cc 16 2 80 10 7 14 81 9 90 II T 27 11 2 44 2 28 15 19 6 3 0 105 31 34
Schedule of Conditions Key
Temperature Pressure Contamination D - total number of days
N 25 0 C 1 5 -2 0 psi None F - number of failures P 250 C 125-15 psi Noneor added - not stirred M - mean number of days C 25 0 C 15 -2 0 psi Added and stirred M e-wen ue s T 70 0 C 1 5 -2 0 psi None or added - not stirred
Indicates value could not be held in shift register
NOTE Phase IlI results not included Different reading frequency for a shorter period of time does not lend itself to establishing a mean-time-to-failure
FOOTNOTE Condition A Shift Registers 4 and 6 in Position 4 and 6 Respectively Condition B Shift Registers 4 and 6 in Position 6 and 4 Respectively
39
__
Table A-8
SUMMARY OF ERROR MOVEMENTS
_ Set-up Value
10000 10100 11010 11110 11100 11000 Probability of Occurrence P P P P P P
Phase 111I II 1I I1 II III I III III TIIn Read Out Value
00000 0 22 1 15 0 0 0 0 0 1 2 0 11 0 0 1
10000 0 0 0 25 0 2 0 1 1 0 0 0
10100 0 2 0 25 0 15 0 25 0 0 0 0 0
C 11000 4 2 5 25 2 0 0 4 0 0 15 1 4 0 2 25
11010 0 0 0 1 7 10 25 0 0 0 25 0 0
11100 4 1 6 0 0 1 15 0 0 0 15 2 0 25 11 25
11110 1 4 5 0 0 0 0 0 0 25 3 25 6
11111 2 0 0 1 0 0 2 0 0 1 1 0 15 0 0
Indicates complex failures i e more than one bit change All other failures are simple (one bit change)
NOTE 1 The probability of occurrence is calculated assuming that all possible simple failures are
equally likely
2 Phase I and Phase II readings were taken daily whereas Phase III readings were taken hourly
FLUID AMPLIFIER FAILURE REPORT
Device Proportional H Digital
Counter Li Hybrid
LW0)Environmental Information
1 Test Duration Prior to Failure (operational hours)
100 hours 2 Test Conditions at Failure
a Cyclic Parameter
Pressure X Temperature Peak -to-peak Amplitude 4 psi Frequency 90 - 200 cps
b Steady-state Parameter
PSP PV P P TF TAmb SC PC R V L PR
70 (OF)(psig)2103 Prior History
No failures Slight periodic gain changes
No recalibration requested 4 Corrective Action
Recalibrated circuit by adjusting supply pressure
5 Circuit Description (One sentence maximum Attach diagram)
Frequency to analog converter
Probable Cause
C
I a)
C0 0 wl o
Failure
Memory Loss Null Shift Bias Change Noise Level Cross Talk
Flow Recovery Power Recovery Pressure RecoveryHysterisisSaturation
LinearityDeterioration
Gain Change Frequency ResponseInstability
Mechanical Other
Evidence of Probable Cause Circuit inadvertantly calibrated with chipin
nozzle Chip loosened in shipment causing
reduction in supply pressures from 9 3 to 8 0 psig
Date 92865 Signed DL R
digital 3a rectifier amp at
-----
I
FLUID AMPLIFIER FAILURE REPORT
Probable Cause
Device Proportional [] Digital Q4~
C) 0 Counter LI Hybrid 3 0 8
p 0 QEnvironmental Information
d) j 0 0 0-IFailure
x1 Test Duration Prior to Failure (operational hours) Memory Loss Null Shift8 hours Bias Change
Noise Level2 Test Conditions at Failure Cross Talka Cyclic Parameter
Pressure X Temperature --------------Flow Recovery 13 psig Power Recovery --------- -----shyPeak-to-peak Amplitude
Pressure RecoveryFrequency 1 cpm
b Steady-state Parameter Hysterisis
V P PR TF LinearityP P P S C C V RL F Deterioration
Gain Change
70OF Frequency Response(psig)-iU to4- t o -13 Instability3 Prior History Mechanical Other
4 Corrective Action Evidence of Probable Cause
Removed contaminant Small piece of rubber in nozzle
5 Circuit Description (One sentence maximum Attach diagram)
1 SR6C amplifier used as a barometric switch Date 965 Signed D L R
FLUID AMPLIFIER FAILURE REPORT
Device Proportional [) Digital DI Counter Li
Environmental Information
150 hours
1 Test Duration Prior to Failure (operational hours)
2 Test Conditions at Failure
a Cyclic Parameter Pressure X Temperature Peak-to-peak Amplitude 1 5 psi (input) Frequency 150 cps
b Steady-state Parameter
P P PV P P T F TAm bC PC V PR PRR F mbDeterioration
(psig) 70OF 3 Prior History
No problems
4 Corrective Action The solution was the elimination of the
sticky tape used as a sealer 5 Circuit Description
(One sentence maximum Attach diagram)
Helmholtz phase discriminator circuit used in a speed loop
Probable Cause
-
o 0 U 0
( o C
Failure $ C a t 9
Memory Loss Null Shift Bias Change Noise Level
X
Cross Talk Flow Recovery Power Recovery Pressure Recovery Hysterisis Saturation Linearity
x
x
Gain Change x Frequency Responsenstability Mechanical Other
Evidence of Probable Cause The problem was the use of a sticky (adhesive)
surface in the flow channels that picked up dirt
Date 92865 Signed CWW
FLUID AMLIk- L1WhIt UUu rUttt
Probable Cause
Device Proportional n] Q)
Digital [] Counter D]
0
Environmental Information 4 0 0 P 0 o C o e
Wa r4 bfl 4 r0 0 cdo iiFailure
1 Test Duration Prior to Failure (operational hours) Memory Loss Nul Shift100 hours Bias Change x xNoise Level 2L
2 Test Conditions at Failure a Cyclic Parameter -- Cross Talk ------
Pressure Temperature x Flow Recovery - ---- -Power RecoveryProprietoyPeak-to-peak Amplitude Pressure Recovery x xFrequency 2 to 4 KC Hysterisis
b Steady-state Parameter Saturation
PP P PV PTF TAm b LinearityS V L PR F DeteriorationC L CR
70OF Gain Change(psig) Frequency Response 3 Prior History Instability
Mechanical
Other
4 Corrective Action Evidence of Probable Cause
Circuit plates warped after thermal cycling
5 Circuit Descriptior (One sentence maximum Attach diagram)
Date 765 Signed L K Two element superhet circuit
FLUID AMPLIFIER FAILURE REPORT
Device Proportional M 0 Probable Cause
o Digital [ Counter M 0
Environmental Information P o) ao 0)
~z
F ailur e zi ) a r a)
1 Test Duration Prior to Failure (operational hours) Memory Loss
25 hours Null Shift x x
2 Test Conditions at Failure Bias Change Noise Level
a Cyclic Parameter Cross Talk Pressure Temperature X Flow Recovery Peak-to-peak Amplitude Proprietory Power Recovery Frequency 80 to 160 cps Pressure Recovery
b Steady-state Parameter Hysterisis
PPS(psig) C
P CR
PV
PRPR
T TF Amb700F
LinearityDeteriorationGain Change
3 Prior History Frequency ResponseInstability
Laboratory test program Mechanical Other
4 Corrective Action
Rebuilt and resealed circuit Evidence of Probable Cause
Circuit null shift
5 Circuit Description
(One sentence maximum Attach diagram) Six element phase discriminator circuit Date 765 Signed LK
FLUID AMPLIFIER FAILURE REPORT
Probable Cause
Device Proportional W Digital B Counter I 0 0
Hybrid [ S
Environmental Information bull0 0 0 X
Failure C S r 4 CdOCU 5Om _ __ _ _ _ _ 4 P4U U _
1 Test Duration Prior to Failure (operational hours) 16 hours
Memory Loss Null Shift
2 s t on Bias Change 2 Test Conditions at Failure Noise Level
a Cyclic Parameter Pressure Temperature x
Cross Talk Flow Recovery
Peak-to-peak Amplitude Proprietory Power Recovery Frequency 2 - 4 KC Pressure Recovery
b Steady-state Parameter Hysterisis Saturation
P PPSPC L
PPC
P PPV PH
PPR
TAm b LinearityDeterioration
(psig) Gain Change
3 Prior History Frequency ResponseInstability
Two cycles Mechanical Other
4 Corrective Action Stopped Oscillating xx x x
Operate at lower temperature Evidence of Probable Cause
5 Circuit Description
(One sentence maximum Attach diagram)
Fluid Oscillation (classified) Date 765 Signed L K
FLUID AMPLIFIER FAILURE REPORT
Probable Cause
Device Proportional (II Digital 0
C W CdCounter
c ) Environmental Information
0 E- 0)
Failure
1 Test Duration Prior to Failure (operational hours) Memory Lops Null Shift16 hours Bias Change
2 Test Conditions at Failure Noise Level
a Cyclic Parameter Cross Talk Pressure Temperature x Flow Recovery Peak-to-peak Amplitude Proprietory Power Recovery Frequency 2 to 4 KC Pressure Recovery
Hysterisisb Steady-state Parameter
Saturation PSP P P P P T F TAm b Linearity
PC PV P DeteriorationSC L R
Gain Change(psig)
Frequency Response3 PiorHistryInstability3 Prior History
MechanicalFour cycles Other
4 Corrective Action Frequency Shift x x x
Evidence of Probable CauseNo gasket used
5 Circuit Description (One sentence maximum Attach diagram)
Fluid oscillator (classified) Date 765 Signed L K
FLUID AMPLIFIER FAILURE REPORT
Device Proportional D] Digital
Counter ]
Environmental Information
1 Test Duration Prior to Failure (operational hours)
6
2 Test Conditions at Failure
a Cyclic Parameter Pressure X Temperature Peak-to-peak Amplitude 2 psi Frequency 100Freqencycs 100cpsHysterisis
b Steady-state Parameter
PSP P P T TAmbLinearityRASC L C V RL
70 0 F (psig H s70degFFrequency 3 Prior History
None
4 Corrective Action
Cleaned by alternately vacuuming and
pressurizing the ports and vents
5 Circuit Description (One sentence maximum Attach diagram)
Five stage shift register assembly SR6C manushy061-inchfactured by Corning Supply nozzle
wide x 0 016-inch
Failure
Memory Loss
Null ShiftBias Change
Bis ChangNoise Level Cross Talk Flow Recovery Power Recovery Pressure Recovery
SatriinSaturation
Deterioration
Gain ChangeResponse
Instability
Mechanical
Other
Probable Cause
4 0
W r) w) Q 4 oW
P4 r4 0 0)2 o o Wo4 0h
Evidence of Probable Cause
White dust built up in visible areas same is
probably in invisible more critical areas Same
dust found in yellow supply hose
Date 10365 Signed DLR
---------------------------------------------
FLUID AMPLIFIER FAILURE REPORT
Device Proportional [a Digital fl
Environmental Information
1 Test Duration Prior to Failure (operational hours)
-10 during circuit debugging
2 Test Conditions at Failure
a Cyclic Parameter Pressure x Temperature Peak-to-peak Amplitude + 25 psi output AP Frequency DC up to 25 cps
b Steady-state Parameter
P P P P P P TATbSCL C R L RR
(psig) 45 5 5 0 -20 -20 both 70degF 3 Prior HistoryIntbly
Operated in laboratory with laboratory line
air filter only after failure test always run with
a filter at hardware 4 Corrective Action
Amplifier disassembled large rust scale particle discovered in interaction region particle removed and covered reattached
5 Circuit Description (One sentence maximum Attach diagram)
Power amplifier for RL-10 servo circuit
Probable Causeshy
$4
o 4
r 0o) 0)
00 b P~ C
0~ a a - U 0)a-Failure
Memory Loss Null Shift x
Noise Level
Cross Talk Flow Recovery Power Recovery Pressure Recovery Hysterisis Saturation Linearity xDeterioration
Gain Change X Frequency Response
Instability Mechanical Other
Evidence of Probable Cause
Amplifier operation erratic hard over
signal often occurred
Date 10665 Signed J N S
0
FLUID AMPLIFIER FAILURE REPORT
Probable Cause
Device Proportional R]
Digital [] P oj 4)aCounter
Hybrid
Environmental Information P 4 V Qo 0
j 00 c
Failure a) R amp
1 Test Duration Prior to Failure (operational hours) Memory Loss
2000 hours NullBias ShiftChange xC
2 Test Conditions at Failure Noise Level
-a Cyclic Parameter Cross Talk-- -- --Pressure Temperature Flow Recovery Peak-to-peak Amplitude Power Recovery
Frequency Pressure Recovery Hysterisis
b Steady-state Parameter
P P P P P P T TAmb Linearity SC V RH R DeteriorationL CR L
300F Gain Change x(psig) 360 280 280 280 310 310
Frequency Response 3 Prior History Instability
See attached (page 51) Mechanical Other
4 Corrective Action Evidence of Probable CauseSee attached (page 51)
Visual inspection Circuit Description5
(One sentence maximum Attach diagram)
Individual elements in Life test fixture - Tested Date 10865 Signed C G R
with 6 0 wet steam and dry steam
Thirteen elements of various materials and geometry were tested under both wet and dry steam conditions Eleven of the thirteen elements failed by criteria derived by considering a specific application in a steam turbine speed governor The application could tolerate a 25 percent gain change and a bias change equivalent to five percent of the element power supply In general the performance improved with life linearity improved and gain increased This improvement was attributed to surface roughening by erosion and mineral deposition of carry over from the boiler feed water and steam mains The corrective action to be taken is artificial roughing of the walls before use plus fabrication elements out of chrome steel Carbon steel elements would have failed in spite of surface roughing because of gross geometry changes due to erosion
The two elements which passed the test had their surfaces inadvertently roughened by a coating of titanium carbide
51
Appendix C
DIGITAL ELEMENT SELECTION
This Appendix summarizes tests conducted prior to the assembly of the fluid amplifier elements into six five-stage shift register circuits Each element (both gates and flip-flops) was visually inspected and tested in a special test fixture designed to obtain the more critical steady-state parameters (switching and output characteristics) One hundred and twenty elements were fabricated and the best 90 were then selected for use in six shift register circuits
All data was obtained using Statham pressure transducers calibrated before each run against water manometers in conjunction with an x-y recorder Typical data obtained for the 600 700 and 800 series elements is shown ini Figures -C-I C-2 and C-3 For each type element the control pressure is shown on the abscissa and the output pressure is shown on the ordinate Refer to the sketch at the upper right hand corner for the element outline and the definition of the various pressures of interest All of the data was taken at a nominal supply pressure of one psig and each of the elements was loaded with the same size orifice as in the actual circuit The test data was processed statistically and 25 percent of the elements were rejected(those exhibiting the greatest deviation from the average) Thus the final circuits were fabricated from elements having closely matched chaiacteristics Tables C-I -2 and C-3 present the input data (as read from graphs such as Figures Cl-I C--2 and C-3)and reduced data for the 600 700 and 800 series elements In the reduced data all of the pressures have been normalized to supply and averaged The deviation of each element from the average as well as the total standard deviation is shown For example referring to Table C-I control Port No I of element 601 required 2 56 in water switching pressure at a supply level of 27 in water (normalized PclPs = 0 09481) For all of the No 1 controls the averaged switch pressure was 0 09092 times the supply with a standard deviation of 8 81 percent or 0 222 in water Element 601 therefore required a normalized switch pressure 0 0039 above average Figures C-4 through C-9 sh6w the data plotted on probability coordinates Since a straight line provided a good fit to the data it was concluded that the distributions were normal Table C-4 summarizes all of the normalized results for allof the elements taken as a group and for the best 75 percent of those elements On the average a 30 percent reduction in standard deviation per element was achieved by the selection process
52
l
I-II
I I gllI-I-I Ishy
---
---lrl-shy
-shy
- I-shy
l-
R_I
--shy--I --shyI-
-
l
I-llll
~ l--i
I-
C+
F IIF
I
I l
I
IIJ
I~~
~I-Il liJ
--
-H
---
+IIshy
--I-
--
--
--
-- --
--
-shy
----
---
--
-5-
_II
---
_
---
-shy
--shy_I
_HT
-1 -
R-S
shy-
--
---
--O
~ttt$I
i_ T
_
IL
IJ-- E
1 I1I -I-It V
1 It T li ft
I_
d-I~
wfr~
i~~
vE
--I
-IT
JI
ii 1-l IT1
V
LE
1
11 if
54
-- -----
------------
--
-------------
--------------------- ---- -- ---------------------------
I I I
I I in I I I I
IV
RFF-
III It
141
I-PH
TT
-T
- I--shy
ti I
i-fr
-----------shy
mi-id
t
F Ica
V
Til
-F Tilshy
1-1 TTI
J_ 11 T
F IF
TR_ I
I Tt
F+ Jplusmn -H1d
4 F TF-
F-I F
If
it
----------------
-----------44H
J_ -I
--I -------------
KC
_L M
i-I
H
Li
55
999
99 shy-
90
00 _ 0
80
S70
r 60 co 0 50--shy
40
-
__
_ _ _
-
0
S30
Cd 0
0
0040-O - - I 1
Average o-
0 0913 0 00605
0080
Figure C-4
0090
P clPs
600 Series (Flip Flops)
0100
56
999
99
90 800
90 c__
00
80shy
-I
0
0
Cd
20 0_
) 10- _1
o
Average = 0 07285 M= 0 00592
001- L 0060 0070 0080 0090
Pc2 p s
Figure C-5600Seies(Flip Flop)
57
999
99 _
900
80 0 0
)
0
70 z_
6010 r 50
40 I
30
20
Zc i 0
Average = 00394 o- = 0 00311
01
001 0030 0035 0040 0 045
PclPs
Figure C-6 700 Series (Left Hand Gates)
58
__
999
99
0
0
90 1
800 0
70
60
40bull 50
30 __
Cd
-i
= 10 O
0
Average = 005080 a-= 000318
01
001 0045 0050 0055
Pc2Ps
Figure C-7 700 Series (Left Hand Gates)
59
999
99 - -
0
90
800
0
700
60
50
40shy
bull 30
0020
__
8 0
UJ
1 -
1
10 0
0
0 1 -- -
Average = 0 04786 a= 0 00592
001 0040 0045
Figure C-8
0050 p clPs
800 Series (Right Hand Gates)
0055
60
999
99 -
90 - I Ia
-
r-shy
70
80 00
_ c__ _
CS
deg 00
30 40
I
00
C) 0
01
Average =
-= 005211 0 00592
001 0045 0050
Figure C-9 800
0055 Pc2P
s
Series (Right Hand Gates)
61
0060
Table C71
VNUT DATA IPRESSURES INNIO CAMI
ELIM SUPPLY CONTROL I to 14 2 OUTPUT 1 OUTPUT 2 gar 17-00000 2560DO 220806 481500 510000 602 2200000 242000 4800W
+ 498000 496000
405 2700000 230000 4scale 507500 4954DO 604 2700000 257000 265000 491000 9090000
TTuom - 1zvg0 400 --j71m1 606 2700000 280000 tMO600 903000 508080
-Vay 27J00066 261060 amp8b0oe 470500 48000 608 2700000 270000 1 9500 512000 536000 M0 _7 60oO 220660 M 0115 5[6600 339055 611 2700000 273000 190000 90700D 17000 _11 217VD0 U [ 00 462U19j10 25Vw190U00zuu
494000138600 4944006L2 2730000 260000 603 27Ob6OO 2MDO0 1800000 51060 490001 614 2700000 275600 j80600 454600 454000 608 2700000 289000 -W957100 467000 481000 616 2700000 2 40W0 Jbi0ld 460000 4asect000
-- zvyuu 101o99 Gggoo WTOTOZI0 618 2700000 238660 106000 478000 46 Old Wit -27IWO 243000 I10000 4 7140 477110 820 2700000 6do a00CIS10ad00 5A34000 62[ -2700000 +i -5102000 SM00214000d RED
+6 2700000 250000 0 9000000 420000
6 24 21 000 2 000 0 300OO0 9 14 C0 O 11000
40 27+00000 25500 00 0 4840 00
625 2700000 23000 1000 40l000 Case00a
624 2100000 220000 230000 480000 460000
127 270660 22401001 l 0 -e5040000 5190600
628 2t0000 400 19300 488000 47O000
630 27 00000 5 2800 8000 48DOO 41000
632 2700000 2470060 t77000 480000 500000
-33 0-l40 0 0 3 0 0 480040 0 40004 i0 1 0 88 9 0 4 634 2100000 2OO~ g u++2200 Otol- o~ os v 4 - W 27000o01 =0000 180007 90im3 613700061 )400007
633 0 27 00002009 010 4 0008 45740 0 007 0I00 410
630 70509 0 250000 IA MB60 73000 47670407 0071 0 70 90R
6409 2780000 2370002 0+600180600 000600450000 044
6013 D09789 00[03 _010l v006410 0180794 0104ig2l4 Ut0l
N037+iSTI403 001
4j1444 906000 6 0099 0003
682 008964 0Di0ott 0700tt6-0[7
OM D076 606331 0187776 _01006if 0 Sig
605 6i00 015 EM4+0 00011 M4474 -000480 010 001 669 0100000 bull00 91 024 8 007 0 V - L I 0_ 4 01763 0 000468 t+
-607 096647 005754 0606667 400101 0190 001of6so O18 0100186
OOQ7600 ~0084i-0t 600 02 24 62t 00R963a 00 3000|1 09-F sriv 0t0
604 009444 60149 01064063 6005o a Is$tE - nt va i go8 620 0090 01 0lfi2 010120 0its 01|031 -00047J 0404 941 016002
4471104U00041 Ol - t 617 - D090 3 -+00078 00760 000366 0 777 00038 1 33St 406039616 OOdW5 60 l fIoolISO 006242 0177304 46 0 a974 190001~
d 0059 0080609 067407 1 01664 1 1 OiVV1139 -t-J0led7 1110M)
624 0044 0006 ill 0006
oi310110 a 01807140 0-
627 0090833 1 0671 a0t 080331 018661 00ll01 ci]7iV 4 0 ot 626 M 818 -0g0144 0061148o1 0z~~~ n0
00 010 020 3 0608 -+ 8 003 6 00 +al[ Dvi 630 60580 o044z o0ost Cl-Aum 014 shy4 o0010t 4+01C0t
0 937 +0 001|_ 620 050111 -011164 i00 806+7 014fal8 110|40
63s 009259 --oi4T a 383-O43l SPo00011l00 0T000021W3 -06333 0u00 11571 u 3177 0iW0 o~ -
tl~l 0te~dvm6m oWH09
-|HTT] 00 14 bullO~ D18i-Y9 006225 sh 14M 6 + f| dal wolml+u La++ k to- -
Table C-2 INPUT CATA IPA-SSURES INH20 GAGE)
ELEM SUPPLY CLHINOL I CONTROL 2-OUTPUT 1 nUTPIT 2
701 2700000 130000 160000 667000 555000
702 2700000 120000 168000 662nOn 555000
703 2700000 108000 125000 625000 538000
704 27D00000 115000 128000 5900 505000
705 2700000 106000 125000 580000 515000
706 2700000 120000 150000 580000 510000
70-7 2700000 10000 140000 605000 529000 708 2700000 109000 120000 638000 519000
709 2700000 - 005000 118000 605800 505000
710 2700000 080000 130000 565000 500000
711 2700000 089000 615000110000 518000 7plusmn2 2700 15000 130000 590000 510000oon
713 2700000 109000 130000 630000 540000
714 2700000 095000 148000 650000 525000
715 2700009 110000 139000 550000 495000 515000130000 615000
717 2700000 115000 140000 600000 716 2700000 100000
490000
718 2700000 105000 135000 675000 535000
719 2700000 099000 138000 635100 515000
720 2700000 098000 130000 578000 480000 520000
722 2700000 119000 139b00 615000 515000
723 2700000 120000 t39000 730000 605000
724 2700000 080000 100000 590000
721 2700000 088000 132000 635000
510000
725 2700000 105000 118000 615000 515000
726 2700000 118000 plusmn50000 580000 515000
727- 2700000 105000 140000 595000 50000 728 2700000 105000 140000 615000 535008
729 2700000 089000 10000 619000 498000
730 2700000 109000 145000 650000 525000
13i- 2700000 10000 139000 615000 510000 732 2700000 100000 140000 575000 520000 733 2700000 087000 120000 550000 595000
734 2700000 115000 145000 625000 535000
7M5 2700000 110000 150000 602000 502000
736 2700000 105008 140000 635000 505000
-737- 2Z00000 115000 160000 610900 52000 2700000 098000 142000 630000- 490000
739 2700000 090000 148000 ClsOo 518000 738
REDUCED DATA
DEOTA DELTAELFPENT - 6ELTI DELTA
NUNBER PCIPS PctlPS PC2PS P02PS P01PS P0PS Po0PS 0O2PS 701 04815 1- o00OI1 -0701289Fo 6-o5T I69~ 024704 oat1 -- 6716Mh
O0i198 001768 0012580702 004444 000583 006222 024519 020556
703 004000 00O039 004630 006395 23j46 0 308 6osect26 000691 704 004259 006398 04741 000284 021S92 -8O089 018704 000572
705 003926 006065 D64636 663 N217 001259 0104100 706 004444 Oo5863 005556 006531 021461 001269 00a880_ 000397
orIH60 22407 -M9594l-t1111r 708 004037 o611 004444 000580 02360 000670 0122 oOOOSs 7~bo7o o-oo0561164 0- -Q10343
-40143 01E704 00072709 003148 -07t3 0o4376 0664 D92407 710 002963 -000896 00485 000210 020926 -00plusmn524 010i89 000797
711 003296 -ooosjNr 004074 66051 02P2176 045623 a19tH 000000 712 004259 0 00398 004215 060210 021852 000 9 0104o 000361 713 004037 0040 AD 023334 900583W -ri2r000176 0051
000457 60344 000W
715 004014 00823 004146 o6ifs L25316 a8 1 00589 716 003704 -006M18 004615 000210 022778 002 0801
714 003519 -000343 b0948 024074 464
0t9074 717 004259 000396 ooqlSs 0006ampG0 82622 018i l846ib51117 718 0036889 OL000t28 0O0500 00802$ 025000 Cohi0 01980 000039 719 03667 -000195 009111 000086 02351 I ooiol
720 003630 000232 0048plusmn 006210 021407 001343 0177 001496 721 003259 -000602 004859 000136 00014 610416i 619 iO0o081
722 004407 610636 00 46 000plusmn23 022770 006026 Oia04 a00020 46 Oi23 037 60428 811457 06332723 004444 000563 0
002963 0L0698 ocszg4 000 1 021892 0008 tso l 0031724 7s 083869 6060W-004 000654 oMFl -jlflu0i1 of4hi0fl
Qonl 0j1481 0I [89 1j4074 iO00181726 004310 o o0t89 0035596 00028 00169 000160 21037 11 0 so 005387727 003889
728 003889 00boo5 00518 00hplusmn60 022776 4OS0OOS 01986 000939
729 003296 0060565 004074 00095t o22926 MO78 O18444 i00003
730 004037 o00176 00370 00oo46 024074 CjOI324 W01444 001069
0(0364 onr-5-63a E-flW010002 --idllar o nToraniir ~ 73M 021206 0j0494 010t0 0000plusmni732 003704 000plusmn5 0018 000160
733 003222 0043 064444 6o6580 626370 1011380 011837 002fl
734 004259 000398 009370 008346 023148 400E38 0961 000939 4000683735 004014 0060 605956 OO 3 62296 -14f4 818993
00028 009n 00160 023519 06166 818704 000Mfl736 003689
738 003630 -00032 006299 000235 023333 8083 01814l -00plusmn1M
739 003333 106600481 086457 622176 585625 191 040590
o6903 522750 110270AVERAGE 0103061
A3 -------r6341l-SiIGHIPTJ1 1u478-
0356 019StGMAIM20 0123 6J144
63shy
C Table C-3 IYNPUT DATA [PRPPSURES 0N20 GAGE] -
ELEN SUPPLY CONTROL I CONTROC 2 OUTPUT I OUTPUT 2 Bamp 2700000 120000 155000 635000 460000 802 2700000 115000 Z30000 675600 455000 803 2700000 120000 140000 655000 439000 804 2700000 60 2700000
120006 128000
125000 145000
678000 670000
442000 440000
806 2700000 407 2700000 808 2700000
102000 122000 30000
120000 150000 140000
685000 670000 630000
500000 418000 420000
09 2700000 104000 162000 605000 435000 010 2700000 uf 2700000 812 27oOoO
120000 100000 135000
142000 130000 145000
618000 685000 635000
430000 460000 445000
813 2700000 614 2700000
138000 130000
150000 122000
590000 615000
410000 390000
815 2700000 130000 140000 620000 400000 816 2700000 Al7 2700000
119000 125000
130000 155000
642000 660000
410000 445000
818 2700000 819 2700000
130000 140000
140000 150000
665000 675000
440000 458000
820 2700000 145000 150000 625000 425000 821 2700000 120000 125000 645000 465000 622 2700000 623 2700000 824 2700000
115000 130000 145000
135000 135000 140000
695000 670000 6456000
455000 410000 425000
825 2700000 826 2700000
120000 140000
150000 145000
660000 620000
405000 435000
827 2700000 120000 130000 595000 375000 828 2700000 09 2700000
125000 130000
150000 135000
645000 -660000
400000 405000
830 2700000 831 2700000 $32 2700000
145000 150000 130000
60000-160000 125000
680000 665000 670000
450000 440000
460000 833 2700000 834 2700000
plusmn38006 120000
40000 145000
609000 660000
450000 490000
-shy 35 2700000 142000 AS5O000 655000 445000 836 2700000 637 2700000
838 2700000
130000 130000 145000
130000 139000 145000
660000 630000 625000
430000 4 5000 459000
639 2700000 84b 2700000
155000 145600
145006 145000
609000 680000
400000 440000
REDUCED DAT
ELEMENT DELTA DELTA DELTAWPM800 PCIPS PCIPS PC2PS P62PS- P2IPS P01PS801 004444 -000322 005741 000509 023519 -000473802 004259 -000507 00481 660417 025000 001068803 0V04444 000322 005185 -000046 0242q9 000268
- m4f4 20lfl7D nr~iZr-u m-- VQ11805 004741 000026 005370 000139 024815 008823806 003778 -066949 004444 ZO0f787 025370 001379807 004519 -000248 005556 000324 024815 008823860 0048plusmn5 006048 005185 -f00046 023333 6O00658
809 003852 -000915 006000 000769 022407 -601584 516 064444 -01 0322- 00 59 o10i028 --shyOa-228R- T a0t-811 003704 -001063 004815 000417 025370 001379812 00060 000233 005370 60d139 023519 -000473813 005111 00044 005556 000324 021852 -002140814 004815 000048 004519 -006713 022778 001214815 004815 000048 005185 -006046 022963 -001029816 0 04407 -000339 004815 -shy00DT417 -02378 3T0824-817 004630 -000137 005741 000509 024444 000453 818 004815 000048 005105 O00046 024630 005638 819 005185 000419 005956 000324 025000 001008826 005370 600604 005556 006324 023148 -000844 821 004444 000322 004630 -000602 023889 -000103 -822 004259 -008507- 00000 000231- 02574T 07T749 823 004815 000048 005000 000231 024815 000823 024 005310 605654 005M85 Z006046 023889 -000103825 004444 -000322 005556 000324 024444 008453826 06516 006419 005370 006139 022963 -001029827 004444 -000322 004815 000417 022037 -001955 828 004630 000137-005556 005 24 023889 0iu0 829 004815 000040 005000 000231 024444 000453836 005670 005654 005926 06664 025183 00119431 005556 000789 005926 000694 024630 008638
832 004815 600048 004630 006602 024815 008823833 005111 000344 005185 000046 022556 -0O436 -834 064444 60d0322- 003370-- 07091-39- 2f4---0101493835 005259 000493 005556 000324 024259 000268836 06481 000048 004615 ZO00417 024444 000433837 004815 000048 005148 000063 02333 -008658 838 005370 000604 005370 000139 023146 000844 839 005741 000974 005370
600139 022556 -001436
0ELI0 P02PS P02PS 017037 000948 0M1682 00063 016299 000170
837- -uonn-shy016296 00007 018519 002430 01481 000667 013538 000533 016111 000022 Os- rio 50 aU103 017037 000940 018481 000393 019185 -000904 014444 -001644 0146h0 001274 g1183J -000904 016481 000303 016296 00020 016963 000814019741 000348 01722 001133 01632 000163 015185 000904 019741 -000348 01000 -001089 016111 000022 013869 002200 014l0 i 001274 019000 00809 016667 000976 016296 000207 017037 000948 016667 000578 0t48 002054 016481 000393 090326 000180 01 370 006119 011000 00011 04815 001274
T4U070T5370 D0061 - 035310 0706139- 07213l tt9- 0162fl 00007 AVERAGE 004767 003231 023992 01809
S1DAiPCTI 9850 7530 4186 s977
n EOMM021011300 010- 67278 0266
64
Table C4
SUMMARY OF NORMALIZED DATA
ALL 75 PERCENT
Average 1 d AverageI (Percent of Average) (Percent of AveragE
600 Series (Flip-flopS)
PclPs 00909 881 00913 663
Pc2Ps 00737 1221 00729 8 13
P1Ps 01817 306 01819 316
Po2Ps 01837 374 01848 387
700 Series (Left Hand Gates)
clPs 00386 1148 00344 789
c2Ps 00503 1035 00508 627
P1Ps 02275 565 02281 552
o2Ps 01928 471 01919 4 17
800 Series (Right Hand Gates)
clPs 00477 985 00479 698
c2P 00523 7 53 00521 564
PoP 02399 419 02403 400
po P 01609 5 98 01599 546o2 s
65
APPENDIX A
Test Data
APPENDIX B
Failure Reports
APPENDIX C
Digital Element Selection

PROCEDURE FOR OBTAINING FLUID AMPLIFIER RELIABILITY DATA
AUTHORS J N SHINN
F A UNDERWOOD
G J HAHN
NOVEMBER 1965
Prepared For
THE ASTRIONICS LABORATORY MARSHALL SPACE FLIGHT CENTER
NATIONAL AERONAUTICS AND SPACE ADMINISTRATION HUNTSVILLE ALABAMA
CONTRACT NAS 8-5408
GENERAL ELECTRIC
SCHENECTADY NEW YORK
FOREWORD
The fluid amplifier reliability procedure work described in this report was carried out as Phase IV and as Task 3 Phase V of a National Aeronautics and Space Administration fluid amplifier program Research and Development - Fluid Amplifiers and Logic (Contract NAS 8-5408) The work was sponsored by the Astrionics Laboratory at the George C Marshall Space Flight Center Huntsville Alabama This project originated under the technical direction of Mr R E Currie and subsequently was under the technical direction of Mr J A Peoples
The work was conducted at the Mechanical Technology Laboratory General Electric Research and Development Center in Schenectady New York Mr R C Bowlin was the project engineer and Dr J N Shinn provided technical direction In addition to the authors other major contribushytors to the program were Messrs A R Adler R K Rose and H W Avery
ABSTRACT
This report summarizes the work performed to develop initial procedures by which data may be gathered and on which an assessment of fluid amplifier reliability may be made A specific test directed toward evaluating the reliability of fluid amplifiers and a generalized failure report form have been developed Recommendations have been submitted for procedural improvements and expanded scope to better understand the physics of fluid amplifier failures
ii
TABLE OF CONTENTS
Section Page
I INTRODUCTION 1
22 SYNOPSIS
21 Program Plan 2
22 Summary of Results 3 23 Conclusions 4
24 Recommendations 5
3 METHOD OF APPROACH 6
31 Program Philosophy 6
3 2 Factors Affecting Reliability - Definition 6
33 Establishing the Test Procedure 8
4 DISCUSSION 10
41 Test Approach 10
42 Nature of the Test Data 18
4 3 Inspection Results 24
APPENDIX -A-t-TEST DATA 26
APPENDIX B - FAILURE REPORTS 41
APPENDIX C - DIGITALELEMENT SELECTION 52
iii
Section 1
INTRODUCTION
Apparent advantages with respect to the failure mechanisms inherent in competing devices are by themselves insufficient proof of fluid amplifier reliability A procedure must be developed by which data may be gathered in an orderly fashion and on which an accurate assessment of fluid amplifier reliability may be made independent of competitive devices The primary emphasis of this program was directed toward establishing such a procedure
Up to now a fundamental consideration in the choice of fluid amplifiers for applications (such as logic devices and control systems) has been the intuitive conclusion that fluid amplifiers will offer substantially increased reliability over other devices that might be called upon to perform similar functions This intuitive judgement is based on an understanding of how conshyventional hydraulic pneumatic or electronic devices fail and on the easily descernible immunity of fluid logic to those mechanisms of failure
It was apparent that the absence of moving parts precludes the conventional aspects of friction induced by sliding or rollingparts It was also evident that the functional integrity of fluid amplifiers is not dependent on the choice of a particular mnaterial but that material selection could be adapted to the needs of environmental constraints For example the effect of radiation which is apparent in silicon semiconductors could be minimized through material selection processes since the fluid amplifier characteristic is a function of its geometry and since the material need only be inert relative to the transport flu id
Section 2
SYNOPSIS
21 PROGRAM PLAN
To develop procedures for gathering information with which an assessment
of fluid amplifier reliability may be made one must recognize that in general
reliability data can be obtained from two sources
1 Specific reliability tests to obtain failure data under known and
controlled conditions
2 Failure reports gathered from various programs aimed at research
or device development that is programs not specifically aimed at
reliability work
2 1 1 RELIABILITY TEST PROCEDURE
This program concentrated on failures in digital devices because 1) a digital failure could clearly be defined and 2) definition of failure in anashylog devices (e g degradation of gain or response) becomes difficult unless catastrophic The test device selected was a series stack of digital elements referred to as a serial shift register with the output connected back to the inshyput so that it stored information on application of clock pulses (for element selection details see Appendix C) The register capacity was five bits each clock pulse advanced the stored number or digit order by one bit so that after five clock pulses the register again contained the initially set five-bit word Six such registers were continuously clocked at a 120 cycle per second pulse rate Thus the digital fluid amplifier elements switched as the preset number circulated through the shift register at the rate of approximately 2 07 x 106
times per day
The following plan was followed to study failure rates
Phase I - Operation at design conditions
Phase II - Operation at stressed conditions
Phase III - Retest at design conditions
In Phase II the stresses were changes in operating parameters most likely to be encountered with fluid amplifier circuits in a practical application The parameters their design values and the stress values are shown in Table 1
The procedures were refined as the test work proceeded and the failure data investigated to determine its statistical significance (procedural changes of any significance occurred subsequent to Phase II)
Table 1
CHANGES IN OPERATING PARAMETERS
Operating Parameter Design Value Stress Value
Supply gas pressure Flip-flop shy 15 psig 25 percent decrease Gate - 20 psig
Supply gas temperature 700 F 1600 F Environment contamination Room air ambient 10 ml
Arizona road dust
The Phase III testing was carried out to learn if any permanent damage had occurred because of testing at stressed conditions Finally the test devices which produced the greatest failure rates as a result of the stress tests were torn down to learn if the physics of the failures could be determined
2 12 FAILURE REPORTS
Failures of fluid amplifier elements in programs at the General Electric Research and Development Center were documented on a standard report form (see Appendix B) developed during this reliability program The intent of this failure recording was not to establish procedure but rather to develop reshyporting techniques amenable to collecting data from a large variety of sources In order to encourage reporting the form is a brief one page document which could be quickly completed Although the failure reporting form was developed and modified once during this program in an attempt to cover all reported failures it is not yet considered all-inclusive It is expected that additional refinement and updating will be necessary when this reporting procedure is implemented
2 2 SUMMARY OF RESULTS
A fluid amplifier standard report form has been developed by which information pertinent to fluid amplifier reliability may be collected Failures reported on fluid amplifier standard report forms from development programs at the Research and Development Center appear primarily due to manufacturing techniques which at the present state-of-the-art are not necessarily optimum At this time there is little or no history with which failure trends may be esshytablished (See Appendix B)
A basic test procedure has been established by which accurate reliability information may be gathered for digital fluid amplifiers Observations based on preliminary data are as follows
3
1 Failures appear to be nonrandom in that certain patterns were more predominant than others while in general failure rates varied with time
2 Data from some (but not all) shift registers suggest a higher failure rate under increased temperature Further there is no clear cut evidence that pressure or contamination lead to any changes in mean time to failure or that residual effects from previous stress conditions exist
3 A substantial variability existed in the number of failures between shift registers In general however a total of 51 failures occurred in 486 shift register test days at standard room temperature conditions while 57 failures occurred in 294 shift register test days at stressed environmental conditions (As noted before 2 07 x 106 switch cycles occur in one shift register test day
23 CONCLUSIONS
It has been concluded that the test procedure developed when properly monitored is one successful approach by which accurate reliability informshyation may be gathered By requiring each shift register to hold the same digit order the likelihood of failure is the same for each register and the effect of geometry or stress level may be evaluated independently of a variable probability of failure A measure of the element memory reliability may be evaluated separately from its ability to switch when it is required that each shift register hold a digit order which does not require switching between digits Finally the significance of switching sequence may be evaluated by changing the digit order on all registers to all possible combinations of digit orders (some digit orders have higher probabilities of failure)
Perhaps the most notable conclusion derived from the preliminary data in this program is that shift register failures (the inability to hold an input number) occur in clearly nonrandom or preferential patterns Although it is not known specifically which variables (environmental or geometric) affect this phenomenon several statements may be made First failures occurred clustered in time irrespective of prior test duration This tends to contradict the assumption that infant mortality or burn-in periods will eliminate such clustering Second shift registers of the same design reacted differently to changes in environmental conditions
It may be concluded therefore that environmental trends or patterns applicable to all the digital amplifiers were not established It does indicate however that one or both of the following may apply Either the changes in stress level were insufficient in magnitude and therefore inconclusive or the likelihood exists that manufacturing processes and tolerances are extremely
4
critical and strongly influence the amplifiers susceptibility and trend relative to environmental changes The latter is probably more accurate The conshysiderable variation in failure rate demonstrated between shift registers at the same level of stress and in the same environment is probably related to the manufacturing process
Statistically the data gathered is preliminary limited in quantity and therefore doubtful as to its credibility as being truly representative of the fluid amplifier population It represents the first point on a history curve What is important however is the creation and demonstration of a test procedure or approach which will permit future programs to expand on this beginning
24 RECOMMENDATIONS
In order to achieve a better understanding of the physics of fluid amplishyfier failure and expand upon the knowledge already obtained the following recommendations are made
1 Work should be performed to understand which amplifier characteristics are critical and most significantly affect failure rate Of interest is the sensitivity of switching level (control pressure) and element gain (discharge pressure) to geometric changes of the interaction region and flow level
2 To understand the physical significance of the apparent nonshyrandom failure patterns work should be performed to detershymine the sequence of events whiich occur when a failure takes place First instrumentation should be increased in scope to ascertain if serial shift register failures occur consistently because of a particular element in that stack Then transient instrumentation may be applied to the suspect element and a like element which does not malfunction to compare the sequence of events that occur during the switching process
3 Test equipment should be modified to include a system of time marking signals so that the selection of digit orders can be expanded to include all possible combinations -and evaluate each probability of failure
4 A set of Acceptance Test limits should be developed to define acceptable operation of an analog element which might be shipped as a production unit Testing as outlined above should then be performed to determine the analog element characteristic sensitivities to geometry changes (possibly due to erosion) or variable source pressures (possibly due to leaks)
5
Section 3
METHOD OF APPROACH
3 1 PROGRAM PHILOSOPHY
Conventional reliability assessments direct themselves toward the estabshylishment of a Reliability Figute of Merit such as failure rate or mean time between failure based on the statistical evaluation of a meaningful sample This sample tested under controlled environments provides such measureshyments with some measure of statistical confidence Further these test proshygrams generally require a product maturity that allows the treatment of failure events as a random occurrence or in rare instances as being associated with some other (but equally well-defined) distributional assumption
Because of the early development status of fluid amplifiers this preshyliminary investigation of fluid amplifier failure rates attempts to do more than establish an initial point on the reliability growth curve and informs on the devices reliability potential This program directs itself toward 1) establishshying meaningful reliability testing procedures where the ultimate goal is inshycreased understanding of the physics of failure of fluid amplifiers 2) providing preliminary information useful in assessing inherent reliability and 3) proshyviding guidance in determining areas of weakness and therefore areas of emshyphasis during continuing program development
32 FACTORS AFFECTING RELIABILITY - DEFINITIONS
In order to evaluate the failure mechanisms that might be appropriate for investigation at this time it was decided to classify all potential failure types into five major categories Only those appropriate during early developshyment were considered during the program The five failure mechanisms are identified as
1 Mean Basic
2 Mean Contaminant
3 Variants
4 Freaks
5 Abnormal Environments
321 MEANBASIC
This category is defined as the one where the mean strength or mean life is limited by the properties of the basic constituent materials of the part
6
The problems in this category are not related to variability from specimen to specimen nor are they subject to external contaminants The important featur of this category is that it is dependent on the physical properties of the basic material or the basic design and that it is likely to be a limiting factor in all components and not just in a small percentile of the population An example of a Mean Basic failure in fluid amplifiers might be the fatigue failure of a thin section due to inadequate stress margins Control of mean basic failure mechanisms therefore must be undertaken during the initial development of the product and cannot be improved by process or quality control
322 MEAN CONTAMINANT
The category described as mean contaminant while relating to mean strength or mean life concerns itself with the influence of a foreign or conshytaminating material In the case of fluid amplifiers contaminants exist to a greater or lesser degree in all fluids but unlike the mean basic category the opportunity exists for varying the amount of contaminant without a change in basic materials The erosion of iharp edges by contaminants in the transshyport fluid would be a typical example of this category
323 VARIANTS
This category relates to the limitation of strength or life due to the effect of statistical variability within the population It is often the result of a poorly controlled manufacturing process and many examples of the life limiting efshyfects of variability can be cited for example a fluid amplifier failure of this type might be due to dimensional variability and bond strength These types of failures should not be considered during an early developmental program
324 FREAKS
The category of freaks includes those failures which are not representashytive of the test lot Very often these freaks are sorted out during infant mortality checks such as run-in or burn-in In the case of fluid amplifiers such freaks would include gross leakage at interconnections or failure to drill a control port
325 ABNORMAL ENVIRONMENTS
In this category failure occurs due to abnormal usage conditions This type of failure mechanism is usually not exposed by in-house testing but by a pos m6rtem analysis An6xample of thistyp6 of failure could befroi operation in a pressure range in excess of those specified for a particular fluid amplifier design
7
In the initial analysis appropriate for investigation during this phase of
the program consideration of failures resulting from the so-called freak have
been eliminated Primary emphasis has been placed on the Mean Basic
Mean Contaminant and Abnormal Environment categories with little considershy
ation being given to those failure mechanisms that are primarily a question
cf production or process control
33 ESTABLISHING THE TEST PROCEDURE
The establishment of a test procedure required the selection of meaningshy
ful failure parameters that could be observed and easily monitored during a
detailed test program This was accomplished by reviewing with selected
laboratory personnel engineers and technicians the results from prior indishy
vidual element tests For example
1 Previous modes of failures
2 The mechanism potentially responsible for such failure and
3 Other failure modes and mechanisms that could be postulated
This review disclosed a variety of possible failure modes that might be
relevant in this investigation such as catastrophic failure memory loss
noise cross-talk improper gain and instability
The failure mechanisms for the above modes could include chemical
attack creep aging overpressure (or underpressure) surface erosion thermal distortion channel corrosion stress corrosion fatigue film buildup
oneand fluid contamination A review of these modes and mechanisms allows
to classify the dominant mechanism into three groups
1 Ambient effects
2 Transport fluid effects
3 Geometric effects
In devising a program that would meaningfully evaluate these effects on
fluid amplifier failure it was deemed necessary to make this test not only sensitive to the main effects of these mechanisms but also to their sequence of occurrence This could best be achieved by designing a statistical test using pressure temperature and contamination as the three factors influencshying the six stacks of elements each stack consisting of fifteen digital fluid amplifiers previously referred to as shift registers
7For discussion of statistical testing see National Bureau of Standards Handbook No 91 Experimental Statistics August 1963
8
B
T 2 PiC2 - TPC I
deg- I
-- 1TIP2CI
T1 P1 C1 IP 2 C1
Figure 1 Statistical Test Profile
Figure 1 illustrates the statistical test profile that was followed All six shift registers are initially tested under T I P 1 C 1 conditions Upon completion of the test for a specified number of hours the registers are divided into three groups of two each and are tested under the following conditions
Two shift registers at T2 PI C 1 followed by T 2 P2 C1
Two registers tested at T11 P 2 C1 followed by T11 P2 1 C 2
Two registers to be tested at TI P 1 C2 followed by T 2 PI1 C 2
Upon completion of this test path all six registers were again tested at T2 P 2 C2 Additional stress levels for these factors can be obtained by proshygressively testing within Blocks B and C etc in a manner similar to that followed in Block A until all registers have been tested at T3 P3 C3 and so on This latter graduated test (Blocks B and C) however was beyond the scope of this program
9
Section 4
DISCUSSION
41 TEST APPROACH
The serial shift register was selected as the most convenient test device
because
1 It is a digital device and failures are easily defined and identified
2 By recirculating information initially set into a register the
failures become self-recording i e failure of any one
fluid element at any time will change the stored information
3 Instrumentation is relatively simple Because of failure
self-recording the instrumentation is not subjected to long test times it is used only during periodic monitoring
The registers were a five-stage device (Figure 2amp3) which provided
five-bit serial word storage capacity Bit storage was provided by a fluid
amplifier flip-flop and digital amplifiers were used to gate information from a
given flip-flop to the succeeding flip-flop Thus application of a clock pulse
to the register advanced the stored information by one bit Since the register
connected back to the input (similar to a ring counter) the applicashyoutput was tion of five clock pulses brought the initially stored information back to the
Each digital element used in the six-shift registers was selecshysame position ted via the procedure discussed in Appendix C The clock pulses were genershy
ated by a motor-driven slotted disc at a rate of 120 pulses per second A view of the assembled test rig is shown in Figure 4
A particular serial binary number preset in the register was observed
by means of a pressure transducer attached at one of the feedback lines
(register output to input) An oscilloscope was used to observe the transducer
signal a positive-pressure pulse arbitrarily was assigned the value 1 and
correspondingly negative-pressure pulses became 0 as shown in Figure 5
The front or leading edge of the five-bit number was identified in the pulse
train appearing on the oscilloscope by proper selection of the initially set
numbers For example if the-number 11010 is preset into the register the
two most significant digits are identified by the adjacent s (Figure 5 ) could occur such that one set of adjacentIt is conceivable that several failures
s could appear in other than the preset arrangement It was concluded
that the likelihood of such occurrences would be very small Future work
with the setup will include a marker pulse to avoid this assumption
10
Figure 2 View of Shift Register
Feedback
T T Flip-flop - ------------
One Stage
Gate Gate
Figure 3 5-Bit Shift Register
12
Figure 4 Test Apparatus
- - igu- 5 Read o Ca In -it
Figure 5 Readout Signal Characteristic
The test setup also included a line pressure recorder and an indicator to detect any power failures that may have occurred between monitoring periods Without this instrumentation loss of line pressure or electrical power will cause the registers to drop information Hence such losses could be mis shytaken for register failures
The testing was carried out in three phases The Phase I test was carried out with all six registers operated at design conditions This test duration was relatively long (approximately 1872 hours) to obtain large amounts of data to more accurately establish failure rates at unstressed conditions and to learn if preferential failure modes occur (e g characteristics of a
particular number or register) During this test the supply pressures to the registers were at the design values (1 5 and 2 0 psig to the flip-flops and the
gates respectively) the temperature of the ambient and supply gas was at room temperature and the registers were operated in a relatively clean enshyvironment The setup was operated 24 hours per day and monitored once per day
In the Phase II testing the selection of stress levels was dictated by the register design and the fabrication materials It was concluded that the most likely change in supply pressure would be a pressure drop (e g caused by line or fitting leaks or supply pump deterioration) By test it was established that the registers would operate as low as 50 percent of the design value for supply pressure The value of 25 percent supply pressure drop was selected as the stress level for pressure change This pressure change was used for the flip-flop the gates and the input clock pulses
The temperature stress selected was an increase in supply air tempershyature from room temperature to 1600 F This limitation occurred because of the photo-etched plastic fabricating material used for the fluid amplifier elements (program limitation did not permit use of higher temperature materials)
The contamination stress was applied by placing the register in a small bell-jar with a measured quantity (10 ml) of Arizona road dust (Mil-Spec) to simulate a typical dusty field environment The dust was stirred daily with small air jets to produce a cloud of contamination adjacent to the register Vents from the fluid amplifier elements communicated with the dust environment and thus the dust was injested by the elements at locations where aspiration from the environment occurred Figure 6 shows a register after operating in the dust environment Contamination was not added directly to the supply air
The Phase II testing sequence involved operating a pair of registers for about 400 hours under successive stress conditions as shown in Table 2
During the course of the testing in Phases I and II it became evident that the failures apparently were nonrandom In particular the failure rate of a given register seemed to be a function of the particular digital number
15
IV 7
Figure 6 Shift Register After Operation in a Dusty Environment
PHASE II TEST PROCEDURE
Registers Registers Registers I and 2 3 and 6 4and 5
Test 1 P T C
Test 2 C P T
Test 3 T C P
C = contamination P = supply pressure change T = supply temperature change
initially set into it As pointed out earlier no marker was used to identify the leading edge of the five digits The leading edge was identified by clustershying units towards it For example a 10100 initially set in later would appear on the oscilloscope as a train of pulses with two s separated by a 0 The scope then was synchronized so that the number would appear as a 10100 The lack of a marker signal limited the choice of binary numbers to be set in For example 10100 could not be distinguished from 01010 00101 or 01001 The numbers used for presetting the registers during the Phase I and Phase II testing were as follows
10100 11010 11110 10000
The numbers 11111 11100 11000 and 00000 were not used
The Phase III testing was carried out at design conditions to determine if any permanent damage had occurred as a result of the stressed tests Conshyforming to the procedure at the start of the design condition testing the registers were monitored at one hour intervals when the test started During this test phase all possible number combinations without a time marker were used (10100 11010 11110 10000 11111 00000 11100 and 11000) since the failures seemed to be nonrandom i e a function of the preset number In addition during this test each register was set to the same numshyber for about one day for each of the eight numbers and then repeated comshypletely Thus Phase III involved a total of about 16 days of testing Whenshyever a failure was noted the shift register was set back to the value for that day
The data obtained in this manner provided the necessary information to determine if the nonrandom failures were caused by differences in shift regisshyters or if the registers behaved differently with different preset numbers or both Use of a marker to positively identify the numbers leading edge would provide the greatest number of presettings (32) thus the most information on
17
nonrandom failure tendencies Future tests should include the use of such a marker Following the three phases of testing two registers were carefully disassembled to determine if any evidence of a deficiency could be observed which could cause malfunctioning The findings are presented at the end of this report
42 NATURE OF THE TEST DATA
The experimental results have been summarized in Appendix A Tables A-i through A-6 show the detailed failure patterns and the number of elapsed days between the setting of the number in the register and the determination that it has been lost for Phases I II and-I1 Also indicated is where a failure did not occur previous to the setting being changed
The results have been summarized according to the set-in value shift register environmental conditions and test phase in Table A-7 Finally error movements (failure from a particular set-up value to a particular readshyout value) are summarized in Table A-8 Taken as a whole
1 The data suggests a higher failure rate under increased temperature on some shift registers but not on others with no clearcut evidence that pressure or contamination levels experienced lead to any change in mean-timeshyto-failure In evidence note that the aggregate failure report at each of the test conditions was (see Table 3)
Table 3
FAILURE SUMMARY
Number of Shift Register Number of Mean Number of
Condition Test Days Failures Days to Failure
Standard- Phase I 486 51 95 Pressure Stress 108 17 64 Contamination 81 9 90 Temperature Stress 105 31 34
Whereas by shift register the failure distribution was
Shift Register Number 1 2 3 4 5 6 Failures - Phase I 0 8 2 2 10 21 Failures - Phase II 8 16 8 0 33 0 Failures - Phase III - 2 0 0 0 51 0
The results are not comparable between -test Phase III and test Phases I and II due to the difference in number of test days and inspection times For exshyample if inspections in Phase III would have been on a daily rather than an hourly basis 8 rather than 51 failures would have been recorded The results are however comparable between shift registers
18
The above tables make clear the very large differences in performance
between the shift registers Note also that the relative performance of the
shift registers was not consistent over the two phases Near the end of Phase I a low failure rate was switched inShift Register No 4 which to that point had
location in the test apparatus with Shift Register No 6 which up to that point
had a high failure rate Subsequently no failures occurred on Shift Register
No 6 in eight further days of Phase I testing and throughout Phases If and III
Shift Register No 4 also had no failures during Phases II and III and only one
failure during eight days at its new position in Phase I Comparison of the
results of initial testing at standard conditions (Phase I) and final testing at 6 performedstandard conditions (Phase III) indicated that Shift Register No
Shift Regisshyappreciably better in the subsequent testing than it did in Phase I
ter No 5 seemed to do somewhat worse and the remainder did approximately
the same
The reaction to change in test condition also varied among the shift No 4 and No 6 performed withoutregisters As indicated Shift Registers
failure at each of the three changed environments In contrast however 5 failed almost equally readily at each condition This shiftShift Register No
register showed about the same failure rate during an initial 14-day period of
normal testing (no variation in test condition) during Phase II as it did under
environmental change Consequently the high failure rate on this shift regisshy
ter during Phase II cannot necessarily be attributed to the change in testing condition
On Shift Register No 1 all eight Phase II failures took place during change in temperature with no failures under pressure and contamination
change On Shift Register No 3 six of the eight failures in Phase II took conshyplace under temperature change and the remaining two took place under
3 under pressuretamination There were no failures on Shift Register No nine and seven failures respectivelychange Finally on Shift Register No 2
took place under changed temperature and pressure with no failures under contamination
2 There is no conclusive evidence to suggest a residual effect of a
previous stress condition
Shift Register No 1 ran 114 consecutive days before its first failure occurred
(See TableA-l Appendix A)
19
The two shift registers with a predominant number of failures during
accelerated temperature testing were Registers No 1 and No 3 No informshy
ation can be gathered concerning residual effects by examining the results on
Shift Register No 1 during Phase II since the increased temperature testing
on this shift register was conducted last (after the pressure and contamination
change) However two failures did take place in Phase III
Shift Register No 3 does provide an evaluation of residual effects since
the increased temperature testing on this shift register was conducted as the first environmental change It was found that immediately subsequent to inshy
creased temperature testing there were no failures in 15 days of testing at
changed temperature and only four failures in the 16 days following days with
contamination Furthermore there were no failures on this shift register in Phase III Thus the data on Shift Register No 3 suggests that the failure pattern observed during increased temperature testing does not hold over in subsequept tests after the temperature has been returned to normal
3 Various nonrandom patterns asserted themselves The specific
patterns noted were
a Seventy-seven of the Phase I and Phase II failures were simple in that only one of the five binary numbers was involved in the failure The remaining 31 failures involved two or more binary numbers The exact nature of these failures (i e the specific
binary bits involved) can be gathered from Tables A-1 through A-6 (and are also discussed further below
b During Phase I failure rates for a particular shift register were found to vary greatly from one set-up value to the next For example for Shift Register No 5 there were two failures in 20 days of operation for a set-up value of 10000 one failure in 45 days of operation for a set-up value of 10100 and seven failures in nine days of operation for a set-up value of 11110 The
corresponding results for the other five shift registers are shown in Tables A-1 through A-4 and Table A-6 This pattern was not evident in Phase II
Phase III was designed so as to permit clear-cut evaluation of the differences in failure rate for different set-in values The results on Shift Register No 5 in this phase confirmed the
previous findings that the failure rate depended upon the set-in value of the shift register as demonstrated by Table 4
20
Table 4
SHIFT REGISTER 5 PHASE III FAILURE DETAIL
First Day Number of Numberof
Second Day Numberof Number of
Set- in Value Failures -Readings Failures Readings
00000 0 7 0 8
11111 0 9 0 8
11110 0 0 0 0
11100 2 6 3 9
11000 9 9 8 8 10000 9 9 8 8 11010 0 8 0 8
10100 6 7 6 6
It is particularly noteworthy that the differences in results between set-in values repeated very well between the two days at which each set-in value was tested This repeatabilityhowever does not carry over when the results on Shift Register No 5 on the additional tests are compared with those previously noted for Phase I For example
The set-in value 10100 yielded 12 failures in two days of additional testing but only one failure in 45 days of testing during Phase I (this value was not used for set-in on Shift Register No 5 during Phase II)
The Set-in value 10000 yielded 17 failures in two days of additional tests but only two failures in 20 days of testing during Phase I (this set-in value also yielded a substantial number of failures in Phase II)
Certain failure patterns are much more prominent than others For example 15 of the 26 simple failures during Phase I were of the type 11110 to 11100 The specific changes in binary values which were involved in each of the 43 failures of Phase I and the 65 failures of Phase II are summarized in Table A-8 The probabilities of each simplefailure given a set-up ina partishycular location are also indicated on this table For example given the set-up 1110 the following simple failures are possible
Change to 11010 (two chances out of five) Change to 11100 (two chances out of five) Change to 1111 (one dhance out of five)
21
Thus the most likely pattern of the 16 failures of Phase I assuming random failure would be as follows
Change to 11010 - six or seven failures Change to 11100 - six or seven failures Change to 11111 - three or four failures
It is seen from Table A-8 that the actual results showed zero failures 15 failures and one failure respectively in the above three categories Thus one would suspect that the failure patterns are nonrandom This can be confirmed by comparing the actual results with the expected results using a statistical chi-square contingency test
Moreover the failure-patterns observed in Phase II difshyfered markedly from those in Phase I as illustrated by the following tabulation of simple failures based on a set-up value of 11010
Phase I Phase II
Change to 10100 0 Failures 15 Failures Change to 11000 4 Failures 0 Failures Change to 11110 0 Failures 2 Failures
d Failure susceptibility for a particular shift register using a specified set-up value also tended to vary over the period of the test For example the failure sequence during Phase I on Shift Register No 6 with regard to the set-up value 11110 was
Failure after one day using set-up value 11110
Failure after three days using set-up value 11110
Failure after one day using set-up value 11110
Failure after one day using set-up value 11110
Twenty-two days using other set-up valuesshy
-Davies 0 L Statistical Methods in Research and Production Chapter 9 Hafner Publishing Company 1957 or Dixon W J and Massey F R Introduction to Statistical Analysis Chapter 13 McGraw-Hill Book Company 1951
-Results at other set-up values are not pertinent to this analysis since it has been previously shown that different failure rates are obtained for different set-up values
22
Failure after one day using set-up value 11110
Failure after zero days
One day using other set-up values
No failure for 17 days using set-up value 11110
Eight days using other set-up values
Failure after six days using set-up value 11110
Failure after four days
No failure after eight days using set-up value 11110
It is evident that failures occurred more frequently for this particular set-up shift register combination near the beginning of the testing phase than near the end Other combinations can be studied by examining Tables A- 1 through A- 6
4 Confidence intervals on mean-time-to-failure were not calculated although this could easily have been done by standard techniques It was felt that such a calculation would be misleading because of
a The differences between shift registers thus the confidence figure would vary from one shift register to the next The same difference also cloud the evaluation of the significance of decreased mean-time-between-failures under stressed conditions
b The nonrandom nature of the data which leads to variations in reliability according to input value and time
c The possibility-that some failures during Phases I and II could have occurred long before the actual read-out time (readings were taken on a daily basis and not on week ends) thus leading to over-optimistic estimates
It must be emphasized that while examining the above results one must keep in mind that they are based on a preliminary study involving six shift registers only Additional information need be obtained to confirm some of the initial trends that have been noted to date
tResults at other set-up values are not pertinent to this analysis since it has been previously shown that different failure rates are obtained for different set-up values
23
43 INSPECTION RESULTS
After completion of the Phases I II and III testing two registers were disssembled to learn if causes for failure could be detected Shift Register No 5 was selected for disassembly since at the completion of the Phase III testing (standard conditions) it had very high failure rates (at least one hour) In addition a register with low failure rates (Shift Register No 2) was disshyassembled to provide a basis for comparison
The appearance of the individual register elements was excellent The
only visual differences between their condition at initial assembly and at this teardown were three types of internal contamination
1 Small amounts of Arizona road dust plated out on vent channels near their termination to the ambient
2 Light coating of oil in the channels oil condensation occurred elsewhere in the test set-up indicating oil vapor in the air supply
3 A thin black varnish-like deposit in the interaction region of the elements The deposits appeared most concentrated at high velocity points
Closer inspection and comparison of the elements from the operating and the failing registers revealed that the epoxy bonding used to seal covers on the element cutouts may have failed The evidence of failure was that the oil film in the various element channels extended on to some surfaces (cover and element cutout) that were supposed to be bonded before disassembly The only explanation for the oil film appearing on the supposedly bonded surfaces is that separation of the bonded joint occurred and allowed leakage to occur Since the failure rates increased when the temperature was increased it was concluded that the bonding failures occurred because of overstressing from differential expansion of the fabricating materials Inspection of the covers and element cutouts of the properly operating register revealed no oil film on the bonded surfaces this information provided further verification that bondshyed joint failure occurred in Shift Register No 5
Further testing which is beyond the scope of the present program could be carried out to determine more conclusively the physics of the failures For example the failing register and a properly operating one could be intershychanged on thetest set-up to verify that the failures were internal to the regisshyters and not in the test equipment In addition each element from each regisshyter could be retested to determine if any significant changes of element pershyformance had occurred Specifically the element acceptance tests could be rerun and the curves could be compared to the elements in the new condition This test would reveal if any degradation of the element occurred because of
24
erosion or other causes Future work should include careful consideration of the plans for teardown and inspection since corrective action for failures will be meaningful only if the exact causes for failutes can be determined
25
Appendix A
TESTDATA
Table A-1
SHIFT REGISTER NO 1 RESULTS
PHASE I (NO STRESS)
Apprdximate Digit Order Number of days Set Value At Set Value
11010 1 11110 3 10100 1 10000 3 11110 3 10100 22 11010 21 10000 24
PHASE II (PRESSURE STRESS)
14010 12 10100 10
PHASE II (CONTAMINATION)
10100 14
PHASE II (TEMPERATURE STRESS)
11010 0-1 11010 0-2 11010 0-1 11010 0-3 11010 2-4 11010 0-4 11010 0-i 11010 0-1 11010 1 1
Failed to No Failure
Digit Reset Digit Reset
x x x x x x x x
x x
x
10100 10100 10100 10100 10100 10100 10100 10100
26
Table A-I Cont
PTIASE III (NO STRESS)
Digit Order Set Value
00000 11111 11110 11100 11000 10000 11010 10100 00000 11111 11110 11100 11100 11000 10000 10000 11010 10100
Approximate Niumber of Hours At Set Value
9 9 9 9 9 9 9 9 9 9 9 6 2 9 3 5 9 9
Failed to No Failure
Digit Reset Digit Reset
x x x x x x x x x x x
11000 x x
00000 x x x
27
Table A-2
SHIFT REGISTER NO 2 RESULTS
PHASE I ( NO STRESS)
Approximate Digit Order Number of Days
Set Value At Set Value
11110 1 11100 0 10100 2 11110 0 11010 4 11010 1 10000 13 11010 9 11110 1 11110 3 11110 7
11110 10 10100 21 10100 4
PHASE II(PRESSURESTRESS)
10100 0-7 10100 0-2 10100 0-1 10100 0-3 10100 0-1 10100 0-1 10100 1-2 10100 5
PHASE I (CONTAMINATION)
10100 15
PHASE II(TEMPERATURESTRESS)
11010 0-1 10000 0-2 11110 0-1
28
Failed to No Failure
Digit Reset Digit Reset
11100 x x
11100 11000
x 11000
x 11100 11100 11100
x 11111
x
11010 11010 11010 11010 11010 11010 11010
x
x
10100 11000 11000
Table A-2 Cont
PHASE II (TEMPERATURE STRESS) (continued)
Approximate
Digit Order Number of Days Set Value At Set Value
11110 0-3 11110 0-2 11010 0-2 11010 3-4 11010 0-1 10000 0-1
PHASE III (NO STRESS)
Approximate Digit Order Number of Hours
At Set ValueSet Value
00000 9 11111 9 11110 9 11100 9 11000 0 10000 9 11010 9 10100 9 00000 9 11111 9 11110 9 11100 9 11000 9 10000 9 11010 9 10100 9
Failed
to No Failure Digit Reset Digit Reset
11000 11000 10100 10100 10100 11000
Failed to No Failure
Digit Reset Digit Reset
x x x x x x x x x x x x x x x x
29
Table A -3
SHIFT REGISTER NO 3 RESULTS
PHASE I (NO STRESS)
Digit Order Set Value
10000 11100 11110 10000 11010 11010 11010
Approximate Number of Days At Set Value
3 2
26 20 19
2 4
PHASE II (TEMPERATURE STRESS)
11010 0-1 11010 0 10100 11010
11110 10000 6-8 10100 1-4 11010 0-1 10100 0-1 10100 2 10000
11000
10000 1
PHASE II (PRESSURE STRESS)
10000 15
PHASE II (CONTAMINATION)
10000 8 11010 0-2 11010 0-3 11010 3
Unable to Set Digit Order
30
Failed tb I N6 Failure
Digit Reset Digit Reset
x x x x
11111 11111
x
10100 10000
00000 10000 10000 10000
x
x
x
x 10100 10100
Table A-3 Cont
PHASE III ( NO STRESS)
Approximate Digit Order Number of Hours
Set Value At Set Value
10000 9 11111 9 11110 9 11100 9 11000 9 10000 9 11010 9 10100 9 00000 9 11111 9 11110 9 11100 9 11000 9 10000 9 11010 9 10100 9
Failed to No Failure
Digit Reset Digit Reset
x x x x x x x x x x x x x x x x
31
Table A-4
SHIFT REGISTER NO 4 RESULTS
PHASE I (NO STRESS)
Digit Order Set Value
11100 11010 10100 11010 11110 10100
Shift Register Moved to Position Six
10100 3 10100 5 11010 14
PHASE II (CONTAMINATION)
11010 8
PHASE II (TEMPERATURE STRESS)
10100 14
PHASE II(PRESSURE STRESS)
Failed to No Failure
Digit Reset Digit Reset
00000 x x x x x
11000 x x
x
x
x
Failed to No Failure
Digit Reset Digit Reset
x x x x x x
Approximate Number of Days
At Set Value
1 3 5
22 20 18
10000
PHASE III (NO STRESS)
Digit Order Set Value
00000 11111 11110 11100 11000 10000
16
Approximate Number of Hours
At Set Value
9 9 9 9 9 9
-Shift Register in Position Six
32
Table A-4 Cont
PHASE III (NO STRESS) (continued)
Approximate Failed Digit Order Number of Hours to No Failure
Set Value At Set Value Digit Reset Digit Reset
11010 9 x 10100 9 x 00000 9 x 11111 9 x 11110 9 x 11100 9 x 11000 9 x 10000 9 x 11010 9 x 10100 9 x
33
Table A-5
SHIFT REGISTER NO 5 RESULTS
PHASE I ( NO STRESS)
Approximate Digit Order Number of Days Set Value At Set Value
11100 1 10100 2 11010 1 10100 5 10000 11 10000 2 11110 1 10000 7 i0100 21 11110 i 11110 3 11110 1 11110 1 11110 1 11110 1 10100 10 10100 7 10000 0-1 10000 0-1 10000 0-1 10000 0-3 10000 0-1 10000 0-2 10000 0-2 10000 0-3
PHASE II(CONTAMINATION)
11110 1-2 11110 0-1 11110 0-1 11110 0-3 11110 0-1 11110 0-1 11110 0-1
34
Failed to No Failure
Digit Reset Digit Reset
x x x x
11100 11000 11100
x x
00000 11100 11100 11100 11111 11100 11010
x 11100 11110 11110 00000 00000 11110 00000 11110
11000 11100 11100 11111 10000 00000 00000
Table A-5 cont
PHASE II (TEMPERATURE STRESS)
Approximate Digit Order Number of Days Set Value At Set Value
-iii0 could not hold set value 10000 0-1 10000 1-2 10000 0-1 10000 1-4 10000 0-1 10000 0-1 10000 0-2 10000 0-3
PHASE II (PRESSURE STRESS)
10000 0 10000 0-1 10000 2-3 10000 0-3 10000 0-2 10000 0-2 10000 0-3 10000 0-1 10000 0-1 10000 0-1
PHASE III (NO STRESS)
Approximate Digit Order Number of Hours
Set Value At Set Value
00000 9 11111 9
11110 9 11100 5 11000 11
1211000 10000 1 10000
10000 114 10000 1 10000 1 11010 9
Failed to No Failure
Digit Reset Digit Reset
00000 00000 00000 00000 00000 00000 00000 00000
00000 00000 00000 00000 00000 00000 00000 00000 00000 00000
Failed to No Failure
Digit Reset Digit Reset
x x x
11110 11100 11110 11000 11100
1000 11100 00000
x
35
x
Table A-5 Cont
PHASE III (NO STRESS) (continued)
Approximate Failed Digit Order Number of Hours to No Failure
Set Value At Set Value Digit Reset Digit Reset
1510100 11010 00000 9 x 11111 9 11110 9 x 11100 2 11110 11100 5 11110 11100 1 11000 11000 1 11100
11000 1ii01i000 111 6 1110011000 117 11110
11000 1 1111010000 1 1-100010000 1 fI O00 10000 11010 91 1111~i0
10000 111i00
11010 9 x 10100 4 11010
10100 1 11100 10100 Rn ai010
-i Repeated six times at once per hour (hourly readings) 2 _ Repeated three times at once per hour (hourly readings)3 Repeated for times at once per hour (hourly readings)4 - Repeated nhre times at once per hour (hourly readings)5 Repeated four times at once per hour (hourly readings)
- Repeated four times at once per hour (hourly readings) 5 Repeated fiv times at once per hour (hourly readings)
8 - Repeated fiue times at once per hour (hourly readings)
Repeated four times at once per hour (hourly readings)
36
Table A-6
SHIFT REGISTER NO 6 RESULTS
PHASE I (NO STRESS)
Approximate Digit Order Number of Days
Set Value At Set Value
10100 1 10000 1 1110 1 11110 3 11110 1 11110 1 11010 1 10100 6 11010 4 11010 1 10100 10 11110 1 11110 0 10000 1 11110 17 10000 1 10000 3 10000 1 10000 1 10000 1 10000 1 11110 6 11110 4
Shift Register Moved to Position 4
11110 8
PHASE Ifl(TEMPERATURE STRESS)
10100 23
PHASE II(PRESSURE STRESS)
10100 18
37
Failed to No Failure
Digit Reset Digit Reset
11000 11000 11100 10000 11100 11000 11000 10000 11000 ii000
x 11100 11100 11000
x 11100 11100 11110 11111 11111 11100 11100 30000
x
x
x
Table A-6 Cont
PHASE II (CONTAMINATION)
Approximate Failed
Digit Order Number of Days to No Failure
Set Value At Set Value Digit Reset Digit Reset
10100 16
Shift Register in Position Four
PHASE III (NO STRESS)
Approximate Failed Digit Order Number of Hours to No Failure
Set Value At Set Value Digit Reset Digit Reset
00000 9 x 11111 9 x
11110 9 x
11100 9 x 11000 9 x 10000 9 x 11010 9 x 10100 9 x 00000 9 x 11111 9 x
11110 9 x 11100 9 x 11000 9 x 10000 9 x 11010 9 x 10100 9 x
38
Table A-7
SUMMARY OF TEST RESULTS
- Set In Value Shift Register Setting 10000 10100 11010 11110 11100 Total Number Phase Condition Sequence D F M D F M b F M D F M D F M D F M
I 27 0 cc23 0cc 22 0 c 6 0c 78 0 IT N 1 iI P 2 10 0 c 12 0 c 22 0
II C 3 14 0 cc 14 0 cc
II T 4 18 8 23 18 8 23
2 I 13 1 130 27 1 270 14 1 140 22 5 44 76 8 95 II N 1 II P 2 22 7 31 22 7 31 II C 3 15 0 cc 15 0 cc H T1 4 3 2 15 8 4 20 6 3 20 17 9 19
3 I 23 0 c 25 2 125 26 0 c 2 0c 76 2 380 II N I iI P 3 15 0 c 15 0 c II C 4 8 0 cc 8 2 40 16 2 80 II T 2 9 1 90 7 2 35 2 3 7 18 6 30
4 I A 23 0 cc 25 0 20 1 1 10 69 1 6902 I B 8 1 80 8 1 80
II N 1 14 0 c 14 0 iI P 4 16 0 c 16 0 H C 2 8 0 c 8 0 Il T 3 14 0 c 14 0
5 I 20 2 100 45 1 450 1 0 9 7 13 1 0c 76 10 76 H N 1 14 8 18 14 8 18 II P 4 17 10 17 17 10 17 II C 2 10 7 14 10 7 14 II T 3 15 8 19 I 15 8 19
6 I A 10 8 13 17 2 85 6 3 20 34 8 43 67 21 32 I B 8 0c 8 0
II N I II P 3 18 0 cc 18 0 II C 4 16 0 c 16 O o HI T 2 23 0 1 23 0 1
Total I 93 11 85143 5 286 93 6 155 125 20 63 4 1 40 458 43 107 Il N 14 8 18 14 0 c 28 8 3 5 II P 48 10 48 48 7 69 12 0 c 108 17 64 II C 8 0 w 47 0 cc 16 2 80 10 7 14 81 9 90 II T 27 11 2 44 2 28 15 19 6 3 0 105 31 34
Schedule of Conditions Key
Temperature Pressure Contamination D - total number of days
N 25 0 C 1 5 -2 0 psi None F - number of failures P 250 C 125-15 psi Noneor added - not stirred M - mean number of days C 25 0 C 15 -2 0 psi Added and stirred M e-wen ue s T 70 0 C 1 5 -2 0 psi None or added - not stirred
Indicates value could not be held in shift register
NOTE Phase IlI results not included Different reading frequency for a shorter period of time does not lend itself to establishing a mean-time-to-failure
FOOTNOTE Condition A Shift Registers 4 and 6 in Position 4 and 6 Respectively Condition B Shift Registers 4 and 6 in Position 6 and 4 Respectively
39
__
Table A-8
SUMMARY OF ERROR MOVEMENTS
_ Set-up Value
10000 10100 11010 11110 11100 11000 Probability of Occurrence P P P P P P
Phase 111I II 1I I1 II III I III III TIIn Read Out Value
00000 0 22 1 15 0 0 0 0 0 1 2 0 11 0 0 1
10000 0 0 0 25 0 2 0 1 1 0 0 0
10100 0 2 0 25 0 15 0 25 0 0 0 0 0
C 11000 4 2 5 25 2 0 0 4 0 0 15 1 4 0 2 25
11010 0 0 0 1 7 10 25 0 0 0 25 0 0
11100 4 1 6 0 0 1 15 0 0 0 15 2 0 25 11 25
11110 1 4 5 0 0 0 0 0 0 25 3 25 6
11111 2 0 0 1 0 0 2 0 0 1 1 0 15 0 0
Indicates complex failures i e more than one bit change All other failures are simple (one bit change)
NOTE 1 The probability of occurrence is calculated assuming that all possible simple failures are
equally likely
2 Phase I and Phase II readings were taken daily whereas Phase III readings were taken hourly
FLUID AMPLIFIER FAILURE REPORT
Device Proportional H Digital
Counter Li Hybrid
LW0)Environmental Information
1 Test Duration Prior to Failure (operational hours)
100 hours 2 Test Conditions at Failure
a Cyclic Parameter
Pressure X Temperature Peak -to-peak Amplitude 4 psi Frequency 90 - 200 cps
b Steady-state Parameter
PSP PV P P TF TAmb SC PC R V L PR
70 (OF)(psig)2103 Prior History
No failures Slight periodic gain changes
No recalibration requested 4 Corrective Action
Recalibrated circuit by adjusting supply pressure
5 Circuit Description (One sentence maximum Attach diagram)
Frequency to analog converter
Probable Cause
C
I a)
C0 0 wl o
Failure
Memory Loss Null Shift Bias Change Noise Level Cross Talk
Flow Recovery Power Recovery Pressure RecoveryHysterisisSaturation
LinearityDeterioration
Gain Change Frequency ResponseInstability
Mechanical Other
Evidence of Probable Cause Circuit inadvertantly calibrated with chipin
nozzle Chip loosened in shipment causing
reduction in supply pressures from 9 3 to 8 0 psig
Date 92865 Signed DL R
digital 3a rectifier amp at
-----
I
FLUID AMPLIFIER FAILURE REPORT
Probable Cause
Device Proportional [] Digital Q4~
C) 0 Counter LI Hybrid 3 0 8
p 0 QEnvironmental Information
d) j 0 0 0-IFailure
x1 Test Duration Prior to Failure (operational hours) Memory Loss Null Shift8 hours Bias Change
Noise Level2 Test Conditions at Failure Cross Talka Cyclic Parameter
Pressure X Temperature --------------Flow Recovery 13 psig Power Recovery --------- -----shyPeak-to-peak Amplitude
Pressure RecoveryFrequency 1 cpm
b Steady-state Parameter Hysterisis
V P PR TF LinearityP P P S C C V RL F Deterioration
Gain Change
70OF Frequency Response(psig)-iU to4- t o -13 Instability3 Prior History Mechanical Other
4 Corrective Action Evidence of Probable Cause
Removed contaminant Small piece of rubber in nozzle
5 Circuit Description (One sentence maximum Attach diagram)
1 SR6C amplifier used as a barometric switch Date 965 Signed D L R
FLUID AMPLIFIER FAILURE REPORT
Device Proportional [) Digital DI Counter Li
Environmental Information
150 hours
1 Test Duration Prior to Failure (operational hours)
2 Test Conditions at Failure
a Cyclic Parameter Pressure X Temperature Peak-to-peak Amplitude 1 5 psi (input) Frequency 150 cps
b Steady-state Parameter
P P PV P P T F TAm bC PC V PR PRR F mbDeterioration
(psig) 70OF 3 Prior History
No problems
4 Corrective Action The solution was the elimination of the
sticky tape used as a sealer 5 Circuit Description
(One sentence maximum Attach diagram)
Helmholtz phase discriminator circuit used in a speed loop
Probable Cause
-
o 0 U 0
( o C
Failure $ C a t 9
Memory Loss Null Shift Bias Change Noise Level
X
Cross Talk Flow Recovery Power Recovery Pressure Recovery Hysterisis Saturation Linearity
x
x
Gain Change x Frequency Responsenstability Mechanical Other
Evidence of Probable Cause The problem was the use of a sticky (adhesive)
surface in the flow channels that picked up dirt
Date 92865 Signed CWW
FLUID AMLIk- L1WhIt UUu rUttt
Probable Cause
Device Proportional n] Q)
Digital [] Counter D]
0
Environmental Information 4 0 0 P 0 o C o e
Wa r4 bfl 4 r0 0 cdo iiFailure
1 Test Duration Prior to Failure (operational hours) Memory Loss Nul Shift100 hours Bias Change x xNoise Level 2L
2 Test Conditions at Failure a Cyclic Parameter -- Cross Talk ------
Pressure Temperature x Flow Recovery - ---- -Power RecoveryProprietoyPeak-to-peak Amplitude Pressure Recovery x xFrequency 2 to 4 KC Hysterisis
b Steady-state Parameter Saturation
PP P PV PTF TAm b LinearityS V L PR F DeteriorationC L CR
70OF Gain Change(psig) Frequency Response 3 Prior History Instability
Mechanical
Other
4 Corrective Action Evidence of Probable Cause
Circuit plates warped after thermal cycling
5 Circuit Descriptior (One sentence maximum Attach diagram)
Date 765 Signed L K Two element superhet circuit
FLUID AMPLIFIER FAILURE REPORT
Device Proportional M 0 Probable Cause
o Digital [ Counter M 0
Environmental Information P o) ao 0)
~z
F ailur e zi ) a r a)
1 Test Duration Prior to Failure (operational hours) Memory Loss
25 hours Null Shift x x
2 Test Conditions at Failure Bias Change Noise Level
a Cyclic Parameter Cross Talk Pressure Temperature X Flow Recovery Peak-to-peak Amplitude Proprietory Power Recovery Frequency 80 to 160 cps Pressure Recovery
b Steady-state Parameter Hysterisis
PPS(psig) C
P CR
PV
PRPR
T TF Amb700F
LinearityDeteriorationGain Change
3 Prior History Frequency ResponseInstability
Laboratory test program Mechanical Other
4 Corrective Action
Rebuilt and resealed circuit Evidence of Probable Cause
Circuit null shift
5 Circuit Description
(One sentence maximum Attach diagram) Six element phase discriminator circuit Date 765 Signed LK
FLUID AMPLIFIER FAILURE REPORT
Probable Cause
Device Proportional W Digital B Counter I 0 0
Hybrid [ S
Environmental Information bull0 0 0 X
Failure C S r 4 CdOCU 5Om _ __ _ _ _ _ 4 P4U U _
1 Test Duration Prior to Failure (operational hours) 16 hours
Memory Loss Null Shift
2 s t on Bias Change 2 Test Conditions at Failure Noise Level
a Cyclic Parameter Pressure Temperature x
Cross Talk Flow Recovery
Peak-to-peak Amplitude Proprietory Power Recovery Frequency 2 - 4 KC Pressure Recovery
b Steady-state Parameter Hysterisis Saturation
P PPSPC L
PPC
P PPV PH
PPR
TAm b LinearityDeterioration
(psig) Gain Change
3 Prior History Frequency ResponseInstability
Two cycles Mechanical Other
4 Corrective Action Stopped Oscillating xx x x
Operate at lower temperature Evidence of Probable Cause
5 Circuit Description
(One sentence maximum Attach diagram)
Fluid Oscillation (classified) Date 765 Signed L K
FLUID AMPLIFIER FAILURE REPORT
Probable Cause
Device Proportional (II Digital 0
C W CdCounter
c ) Environmental Information
0 E- 0)
Failure
1 Test Duration Prior to Failure (operational hours) Memory Lops Null Shift16 hours Bias Change
2 Test Conditions at Failure Noise Level
a Cyclic Parameter Cross Talk Pressure Temperature x Flow Recovery Peak-to-peak Amplitude Proprietory Power Recovery Frequency 2 to 4 KC Pressure Recovery
Hysterisisb Steady-state Parameter
Saturation PSP P P P P T F TAm b Linearity
PC PV P DeteriorationSC L R
Gain Change(psig)
Frequency Response3 PiorHistryInstability3 Prior History
MechanicalFour cycles Other
4 Corrective Action Frequency Shift x x x
Evidence of Probable CauseNo gasket used
5 Circuit Description (One sentence maximum Attach diagram)
Fluid oscillator (classified) Date 765 Signed L K
FLUID AMPLIFIER FAILURE REPORT
Device Proportional D] Digital
Counter ]
Environmental Information
1 Test Duration Prior to Failure (operational hours)
6
2 Test Conditions at Failure
a Cyclic Parameter Pressure X Temperature Peak-to-peak Amplitude 2 psi Frequency 100Freqencycs 100cpsHysterisis
b Steady-state Parameter
PSP P P T TAmbLinearityRASC L C V RL
70 0 F (psig H s70degFFrequency 3 Prior History
None
4 Corrective Action
Cleaned by alternately vacuuming and
pressurizing the ports and vents
5 Circuit Description (One sentence maximum Attach diagram)
Five stage shift register assembly SR6C manushy061-inchfactured by Corning Supply nozzle
wide x 0 016-inch
Failure
Memory Loss
Null ShiftBias Change
Bis ChangNoise Level Cross Talk Flow Recovery Power Recovery Pressure Recovery
SatriinSaturation
Deterioration
Gain ChangeResponse
Instability
Mechanical
Other
Probable Cause
4 0
W r) w) Q 4 oW
P4 r4 0 0)2 o o Wo4 0h
Evidence of Probable Cause
White dust built up in visible areas same is
probably in invisible more critical areas Same
dust found in yellow supply hose
Date 10365 Signed DLR
---------------------------------------------
FLUID AMPLIFIER FAILURE REPORT
Device Proportional [a Digital fl
Environmental Information
1 Test Duration Prior to Failure (operational hours)
-10 during circuit debugging
2 Test Conditions at Failure
a Cyclic Parameter Pressure x Temperature Peak-to-peak Amplitude + 25 psi output AP Frequency DC up to 25 cps
b Steady-state Parameter
P P P P P P TATbSCL C R L RR
(psig) 45 5 5 0 -20 -20 both 70degF 3 Prior HistoryIntbly
Operated in laboratory with laboratory line
air filter only after failure test always run with
a filter at hardware 4 Corrective Action
Amplifier disassembled large rust scale particle discovered in interaction region particle removed and covered reattached
5 Circuit Description (One sentence maximum Attach diagram)
Power amplifier for RL-10 servo circuit
Probable Causeshy
$4
o 4
r 0o) 0)
00 b P~ C
0~ a a - U 0)a-Failure
Memory Loss Null Shift x
Noise Level
Cross Talk Flow Recovery Power Recovery Pressure Recovery Hysterisis Saturation Linearity xDeterioration
Gain Change X Frequency Response
Instability Mechanical Other
Evidence of Probable Cause
Amplifier operation erratic hard over
signal often occurred
Date 10665 Signed J N S
0
FLUID AMPLIFIER FAILURE REPORT
Probable Cause
Device Proportional R]
Digital [] P oj 4)aCounter
Hybrid
Environmental Information P 4 V Qo 0
j 00 c
Failure a) R amp
1 Test Duration Prior to Failure (operational hours) Memory Loss
2000 hours NullBias ShiftChange xC
2 Test Conditions at Failure Noise Level
-a Cyclic Parameter Cross Talk-- -- --Pressure Temperature Flow Recovery Peak-to-peak Amplitude Power Recovery
Frequency Pressure Recovery Hysterisis
b Steady-state Parameter
P P P P P P T TAmb Linearity SC V RH R DeteriorationL CR L
300F Gain Change x(psig) 360 280 280 280 310 310
Frequency Response 3 Prior History Instability
See attached (page 51) Mechanical Other
4 Corrective Action Evidence of Probable CauseSee attached (page 51)
Visual inspection Circuit Description5
(One sentence maximum Attach diagram)
Individual elements in Life test fixture - Tested Date 10865 Signed C G R
with 6 0 wet steam and dry steam
Thirteen elements of various materials and geometry were tested under both wet and dry steam conditions Eleven of the thirteen elements failed by criteria derived by considering a specific application in a steam turbine speed governor The application could tolerate a 25 percent gain change and a bias change equivalent to five percent of the element power supply In general the performance improved with life linearity improved and gain increased This improvement was attributed to surface roughening by erosion and mineral deposition of carry over from the boiler feed water and steam mains The corrective action to be taken is artificial roughing of the walls before use plus fabrication elements out of chrome steel Carbon steel elements would have failed in spite of surface roughing because of gross geometry changes due to erosion
The two elements which passed the test had their surfaces inadvertently roughened by a coating of titanium carbide
51
Appendix C
DIGITAL ELEMENT SELECTION
This Appendix summarizes tests conducted prior to the assembly of the fluid amplifier elements into six five-stage shift register circuits Each element (both gates and flip-flops) was visually inspected and tested in a special test fixture designed to obtain the more critical steady-state parameters (switching and output characteristics) One hundred and twenty elements were fabricated and the best 90 were then selected for use in six shift register circuits
All data was obtained using Statham pressure transducers calibrated before each run against water manometers in conjunction with an x-y recorder Typical data obtained for the 600 700 and 800 series elements is shown ini Figures -C-I C-2 and C-3 For each type element the control pressure is shown on the abscissa and the output pressure is shown on the ordinate Refer to the sketch at the upper right hand corner for the element outline and the definition of the various pressures of interest All of the data was taken at a nominal supply pressure of one psig and each of the elements was loaded with the same size orifice as in the actual circuit The test data was processed statistically and 25 percent of the elements were rejected(those exhibiting the greatest deviation from the average) Thus the final circuits were fabricated from elements having closely matched chaiacteristics Tables C-I -2 and C-3 present the input data (as read from graphs such as Figures Cl-I C--2 and C-3)and reduced data for the 600 700 and 800 series elements In the reduced data all of the pressures have been normalized to supply and averaged The deviation of each element from the average as well as the total standard deviation is shown For example referring to Table C-I control Port No I of element 601 required 2 56 in water switching pressure at a supply level of 27 in water (normalized PclPs = 0 09481) For all of the No 1 controls the averaged switch pressure was 0 09092 times the supply with a standard deviation of 8 81 percent or 0 222 in water Element 601 therefore required a normalized switch pressure 0 0039 above average Figures C-4 through C-9 sh6w the data plotted on probability coordinates Since a straight line provided a good fit to the data it was concluded that the distributions were normal Table C-4 summarizes all of the normalized results for allof the elements taken as a group and for the best 75 percent of those elements On the average a 30 percent reduction in standard deviation per element was achieved by the selection process
52
l
I-II
I I gllI-I-I Ishy
---
---lrl-shy
-shy
- I-shy
l-
R_I
--shy--I --shyI-
-
l
I-llll
~ l--i
I-
C+
F IIF
I
I l
I
IIJ
I~~
~I-Il liJ
--
-H
---
+IIshy
--I-
--
--
--
-- --
--
-shy
----
---
--
-5-
_II
---
_
---
-shy
--shy_I
_HT
-1 -
R-S
shy-
--
---
--O
~ttt$I
i_ T
_
IL
IJ-- E
1 I1I -I-It V
1 It T li ft
I_
d-I~
wfr~
i~~
vE
--I
-IT
JI
ii 1-l IT1
V
LE
1
11 if
54
-- -----
------------
--
-------------
--------------------- ---- -- ---------------------------
I I I
I I in I I I I
IV
RFF-
III It
141
I-PH
TT
-T
- I--shy
ti I
i-fr
-----------shy
mi-id
t
F Ica
V
Til
-F Tilshy
1-1 TTI
J_ 11 T
F IF
TR_ I
I Tt
F+ Jplusmn -H1d
4 F TF-
F-I F
If
it
----------------
-----------44H
J_ -I
--I -------------
KC
_L M
i-I
H
Li
55
999
99 shy-
90
00 _ 0
80
S70
r 60 co 0 50--shy
40
-
__
_ _ _
-
0
S30
Cd 0
0
0040-O - - I 1
Average o-
0 0913 0 00605
0080
Figure C-4
0090
P clPs
600 Series (Flip Flops)
0100
56
999
99
90 800
90 c__
00
80shy
-I
0
0
Cd
20 0_
) 10- _1
o
Average = 0 07285 M= 0 00592
001- L 0060 0070 0080 0090
Pc2 p s
Figure C-5600Seies(Flip Flop)
57
999
99 _
900
80 0 0
)
0
70 z_
6010 r 50
40 I
30
20
Zc i 0
Average = 00394 o- = 0 00311
01
001 0030 0035 0040 0 045
PclPs
Figure C-6 700 Series (Left Hand Gates)
58
__
999
99
0
0
90 1
800 0
70
60
40bull 50
30 __
Cd
-i
= 10 O
0
Average = 005080 a-= 000318
01
001 0045 0050 0055
Pc2Ps
Figure C-7 700 Series (Left Hand Gates)
59
999
99 - -
0
90
800
0
700
60
50
40shy
bull 30
0020
__
8 0
UJ
1 -
1
10 0
0
0 1 -- -
Average = 0 04786 a= 0 00592
001 0040 0045
Figure C-8
0050 p clPs
800 Series (Right Hand Gates)
0055
60
999
99 -
90 - I Ia
-
r-shy
70
80 00
_ c__ _
CS
deg 00
30 40
I
00
C) 0
01
Average =
-= 005211 0 00592
001 0045 0050
Figure C-9 800
0055 Pc2P
s
Series (Right Hand Gates)
61
0060
Table C71
VNUT DATA IPRESSURES INNIO CAMI
ELIM SUPPLY CONTROL I to 14 2 OUTPUT 1 OUTPUT 2 gar 17-00000 2560DO 220806 481500 510000 602 2200000 242000 4800W
+ 498000 496000
405 2700000 230000 4scale 507500 4954DO 604 2700000 257000 265000 491000 9090000
TTuom - 1zvg0 400 --j71m1 606 2700000 280000 tMO600 903000 508080
-Vay 27J00066 261060 amp8b0oe 470500 48000 608 2700000 270000 1 9500 512000 536000 M0 _7 60oO 220660 M 0115 5[6600 339055 611 2700000 273000 190000 90700D 17000 _11 217VD0 U [ 00 462U19j10 25Vw190U00zuu
494000138600 4944006L2 2730000 260000 603 27Ob6OO 2MDO0 1800000 51060 490001 614 2700000 275600 j80600 454600 454000 608 2700000 289000 -W957100 467000 481000 616 2700000 2 40W0 Jbi0ld 460000 4asect000
-- zvyuu 101o99 Gggoo WTOTOZI0 618 2700000 238660 106000 478000 46 Old Wit -27IWO 243000 I10000 4 7140 477110 820 2700000 6do a00CIS10ad00 5A34000 62[ -2700000 +i -5102000 SM00214000d RED
+6 2700000 250000 0 9000000 420000
6 24 21 000 2 000 0 300OO0 9 14 C0 O 11000
40 27+00000 25500 00 0 4840 00
625 2700000 23000 1000 40l000 Case00a
624 2100000 220000 230000 480000 460000
127 270660 22401001 l 0 -e5040000 5190600
628 2t0000 400 19300 488000 47O000
630 27 00000 5 2800 8000 48DOO 41000
632 2700000 2470060 t77000 480000 500000
-33 0-l40 0 0 3 0 0 480040 0 40004 i0 1 0 88 9 0 4 634 2100000 2OO~ g u++2200 Otol- o~ os v 4 - W 27000o01 =0000 180007 90im3 613700061 )400007
633 0 27 00002009 010 4 0008 45740 0 007 0I00 410
630 70509 0 250000 IA MB60 73000 47670407 0071 0 70 90R
6409 2780000 2370002 0+600180600 000600450000 044
6013 D09789 00[03 _010l v006410 0180794 0104ig2l4 Ut0l
N037+iSTI403 001
4j1444 906000 6 0099 0003
682 008964 0Di0ott 0700tt6-0[7
OM D076 606331 0187776 _01006if 0 Sig
605 6i00 015 EM4+0 00011 M4474 -000480 010 001 669 0100000 bull00 91 024 8 007 0 V - L I 0_ 4 01763 0 000468 t+
-607 096647 005754 0606667 400101 0190 001of6so O18 0100186
OOQ7600 ~0084i-0t 600 02 24 62t 00R963a 00 3000|1 09-F sriv 0t0
604 009444 60149 01064063 6005o a Is$tE - nt va i go8 620 0090 01 0lfi2 010120 0its 01|031 -00047J 0404 941 016002
4471104U00041 Ol - t 617 - D090 3 -+00078 00760 000366 0 777 00038 1 33St 406039616 OOdW5 60 l fIoolISO 006242 0177304 46 0 a974 190001~
d 0059 0080609 067407 1 01664 1 1 OiVV1139 -t-J0led7 1110M)
624 0044 0006 ill 0006
oi310110 a 01807140 0-
627 0090833 1 0671 a0t 080331 018661 00ll01 ci]7iV 4 0 ot 626 M 818 -0g0144 0061148o1 0z~~~ n0
00 010 020 3 0608 -+ 8 003 6 00 +al[ Dvi 630 60580 o044z o0ost Cl-Aum 014 shy4 o0010t 4+01C0t
0 937 +0 001|_ 620 050111 -011164 i00 806+7 014fal8 110|40
63s 009259 --oi4T a 383-O43l SPo00011l00 0T000021W3 -06333 0u00 11571 u 3177 0iW0 o~ -
tl~l 0te~dvm6m oWH09
-|HTT] 00 14 bullO~ D18i-Y9 006225 sh 14M 6 + f| dal wolml+u La++ k to- -
Table C-2 INPUT CATA IPA-SSURES INH20 GAGE)
ELEM SUPPLY CLHINOL I CONTROL 2-OUTPUT 1 nUTPIT 2
701 2700000 130000 160000 667000 555000
702 2700000 120000 168000 662nOn 555000
703 2700000 108000 125000 625000 538000
704 27D00000 115000 128000 5900 505000
705 2700000 106000 125000 580000 515000
706 2700000 120000 150000 580000 510000
70-7 2700000 10000 140000 605000 529000 708 2700000 109000 120000 638000 519000
709 2700000 - 005000 118000 605800 505000
710 2700000 080000 130000 565000 500000
711 2700000 089000 615000110000 518000 7plusmn2 2700 15000 130000 590000 510000oon
713 2700000 109000 130000 630000 540000
714 2700000 095000 148000 650000 525000
715 2700009 110000 139000 550000 495000 515000130000 615000
717 2700000 115000 140000 600000 716 2700000 100000
490000
718 2700000 105000 135000 675000 535000
719 2700000 099000 138000 635100 515000
720 2700000 098000 130000 578000 480000 520000
722 2700000 119000 139b00 615000 515000
723 2700000 120000 t39000 730000 605000
724 2700000 080000 100000 590000
721 2700000 088000 132000 635000
510000
725 2700000 105000 118000 615000 515000
726 2700000 118000 plusmn50000 580000 515000
727- 2700000 105000 140000 595000 50000 728 2700000 105000 140000 615000 535008
729 2700000 089000 10000 619000 498000
730 2700000 109000 145000 650000 525000
13i- 2700000 10000 139000 615000 510000 732 2700000 100000 140000 575000 520000 733 2700000 087000 120000 550000 595000
734 2700000 115000 145000 625000 535000
7M5 2700000 110000 150000 602000 502000
736 2700000 105008 140000 635000 505000
-737- 2Z00000 115000 160000 610900 52000 2700000 098000 142000 630000- 490000
739 2700000 090000 148000 ClsOo 518000 738
REDUCED DATA
DEOTA DELTAELFPENT - 6ELTI DELTA
NUNBER PCIPS PctlPS PC2PS P02PS P01PS P0PS Po0PS 0O2PS 701 04815 1- o00OI1 -0701289Fo 6-o5T I69~ 024704 oat1 -- 6716Mh
O0i198 001768 0012580702 004444 000583 006222 024519 020556
703 004000 00O039 004630 006395 23j46 0 308 6osect26 000691 704 004259 006398 04741 000284 021S92 -8O089 018704 000572
705 003926 006065 D64636 663 N217 001259 0104100 706 004444 Oo5863 005556 006531 021461 001269 00a880_ 000397
orIH60 22407 -M9594l-t1111r 708 004037 o611 004444 000580 02360 000670 0122 oOOOSs 7~bo7o o-oo0561164 0- -Q10343
-40143 01E704 00072709 003148 -07t3 0o4376 0664 D92407 710 002963 -000896 00485 000210 020926 -00plusmn524 010i89 000797
711 003296 -ooosjNr 004074 66051 02P2176 045623 a19tH 000000 712 004259 0 00398 004215 060210 021852 000 9 0104o 000361 713 004037 0040 AD 023334 900583W -ri2r000176 0051
000457 60344 000W
715 004014 00823 004146 o6ifs L25316 a8 1 00589 716 003704 -006M18 004615 000210 022778 002 0801
714 003519 -000343 b0948 024074 464
0t9074 717 004259 000396 ooqlSs 0006ampG0 82622 018i l846ib51117 718 0036889 OL000t28 0O0500 00802$ 025000 Cohi0 01980 000039 719 03667 -000195 009111 000086 02351 I ooiol
720 003630 000232 0048plusmn 006210 021407 001343 0177 001496 721 003259 -000602 004859 000136 00014 610416i 619 iO0o081
722 004407 610636 00 46 000plusmn23 022770 006026 Oia04 a00020 46 Oi23 037 60428 811457 06332723 004444 000563 0
002963 0L0698 ocszg4 000 1 021892 0008 tso l 0031724 7s 083869 6060W-004 000654 oMFl -jlflu0i1 of4hi0fl
Qonl 0j1481 0I [89 1j4074 iO00181726 004310 o o0t89 0035596 00028 00169 000160 21037 11 0 so 005387727 003889
728 003889 00boo5 00518 00hplusmn60 022776 4OS0OOS 01986 000939
729 003296 0060565 004074 00095t o22926 MO78 O18444 i00003
730 004037 o00176 00370 00oo46 024074 CjOI324 W01444 001069
0(0364 onr-5-63a E-flW010002 --idllar o nToraniir ~ 73M 021206 0j0494 010t0 0000plusmni732 003704 000plusmn5 0018 000160
733 003222 0043 064444 6o6580 626370 1011380 011837 002fl
734 004259 000398 009370 008346 023148 400E38 0961 000939 4000683735 004014 0060 605956 OO 3 62296 -14f4 818993
00028 009n 00160 023519 06166 818704 000Mfl736 003689
738 003630 -00032 006299 000235 023333 8083 01814l -00plusmn1M
739 003333 106600481 086457 622176 585625 191 040590
o6903 522750 110270AVERAGE 0103061
A3 -------r6341l-SiIGHIPTJ1 1u478-
0356 019StGMAIM20 0123 6J144
63shy
C Table C-3 IYNPUT DATA [PRPPSURES 0N20 GAGE] -
ELEN SUPPLY CONTROL I CONTROC 2 OUTPUT I OUTPUT 2 Bamp 2700000 120000 155000 635000 460000 802 2700000 115000 Z30000 675600 455000 803 2700000 120000 140000 655000 439000 804 2700000 60 2700000
120006 128000
125000 145000
678000 670000
442000 440000
806 2700000 407 2700000 808 2700000
102000 122000 30000
120000 150000 140000
685000 670000 630000
500000 418000 420000
09 2700000 104000 162000 605000 435000 010 2700000 uf 2700000 812 27oOoO
120000 100000 135000
142000 130000 145000
618000 685000 635000
430000 460000 445000
813 2700000 614 2700000
138000 130000
150000 122000
590000 615000
410000 390000
815 2700000 130000 140000 620000 400000 816 2700000 Al7 2700000
119000 125000
130000 155000
642000 660000
410000 445000
818 2700000 819 2700000
130000 140000
140000 150000
665000 675000
440000 458000
820 2700000 145000 150000 625000 425000 821 2700000 120000 125000 645000 465000 622 2700000 623 2700000 824 2700000
115000 130000 145000
135000 135000 140000
695000 670000 6456000
455000 410000 425000
825 2700000 826 2700000
120000 140000
150000 145000
660000 620000
405000 435000
827 2700000 120000 130000 595000 375000 828 2700000 09 2700000
125000 130000
150000 135000
645000 -660000
400000 405000
830 2700000 831 2700000 $32 2700000
145000 150000 130000
60000-160000 125000
680000 665000 670000
450000 440000
460000 833 2700000 834 2700000
plusmn38006 120000
40000 145000
609000 660000
450000 490000
-shy 35 2700000 142000 AS5O000 655000 445000 836 2700000 637 2700000
838 2700000
130000 130000 145000
130000 139000 145000
660000 630000 625000
430000 4 5000 459000
639 2700000 84b 2700000
155000 145600
145006 145000
609000 680000
400000 440000
REDUCED DAT
ELEMENT DELTA DELTA DELTAWPM800 PCIPS PCIPS PC2PS P62PS- P2IPS P01PS801 004444 -000322 005741 000509 023519 -000473802 004259 -000507 00481 660417 025000 001068803 0V04444 000322 005185 -000046 0242q9 000268
- m4f4 20lfl7D nr~iZr-u m-- VQ11805 004741 000026 005370 000139 024815 008823806 003778 -066949 004444 ZO0f787 025370 001379807 004519 -000248 005556 000324 024815 008823860 0048plusmn5 006048 005185 -f00046 023333 6O00658
809 003852 -000915 006000 000769 022407 -601584 516 064444 -01 0322- 00 59 o10i028 --shyOa-228R- T a0t-811 003704 -001063 004815 000417 025370 001379812 00060 000233 005370 60d139 023519 -000473813 005111 00044 005556 000324 021852 -002140814 004815 000048 004519 -006713 022778 001214815 004815 000048 005185 -006046 022963 -001029816 0 04407 -000339 004815 -shy00DT417 -02378 3T0824-817 004630 -000137 005741 000509 024444 000453 818 004815 000048 005105 O00046 024630 005638 819 005185 000419 005956 000324 025000 001008826 005370 600604 005556 006324 023148 -000844 821 004444 000322 004630 -000602 023889 -000103 -822 004259 -008507- 00000 000231- 02574T 07T749 823 004815 000048 005000 000231 024815 000823 024 005310 605654 005M85 Z006046 023889 -000103825 004444 -000322 005556 000324 024444 008453826 06516 006419 005370 006139 022963 -001029827 004444 -000322 004815 000417 022037 -001955 828 004630 000137-005556 005 24 023889 0iu0 829 004815 000040 005000 000231 024444 000453836 005670 005654 005926 06664 025183 00119431 005556 000789 005926 000694 024630 008638
832 004815 600048 004630 006602 024815 008823833 005111 000344 005185 000046 022556 -0O436 -834 064444 60d0322- 003370-- 07091-39- 2f4---0101493835 005259 000493 005556 000324 024259 000268836 06481 000048 004615 ZO00417 024444 000433837 004815 000048 005148 000063 02333 -008658 838 005370 000604 005370 000139 023146 000844 839 005741 000974 005370
600139 022556 -001436
0ELI0 P02PS P02PS 017037 000948 0M1682 00063 016299 000170
837- -uonn-shy016296 00007 018519 002430 01481 000667 013538 000533 016111 000022 Os- rio 50 aU103 017037 000940 018481 000393 019185 -000904 014444 -001644 0146h0 001274 g1183J -000904 016481 000303 016296 00020 016963 000814019741 000348 01722 001133 01632 000163 015185 000904 019741 -000348 01000 -001089 016111 000022 013869 002200 014l0 i 001274 019000 00809 016667 000976 016296 000207 017037 000948 016667 000578 0t48 002054 016481 000393 090326 000180 01 370 006119 011000 00011 04815 001274
T4U070T5370 D0061 - 035310 0706139- 07213l tt9- 0162fl 00007 AVERAGE 004767 003231 023992 01809
S1DAiPCTI 9850 7530 4186 s977
n EOMM021011300 010- 67278 0266
64
Table C4
SUMMARY OF NORMALIZED DATA
ALL 75 PERCENT
Average 1 d AverageI (Percent of Average) (Percent of AveragE
600 Series (Flip-flopS)
PclPs 00909 881 00913 663
Pc2Ps 00737 1221 00729 8 13
P1Ps 01817 306 01819 316
Po2Ps 01837 374 01848 387
700 Series (Left Hand Gates)
clPs 00386 1148 00344 789
c2Ps 00503 1035 00508 627
P1Ps 02275 565 02281 552
o2Ps 01928 471 01919 4 17
800 Series (Right Hand Gates)
clPs 00477 985 00479 698
c2P 00523 7 53 00521 564
PoP 02399 419 02403 400
po P 01609 5 98 01599 546o2 s
65
APPENDIX A
Test Data
APPENDIX B
Failure Reports
APPENDIX C
Digital Element Selection
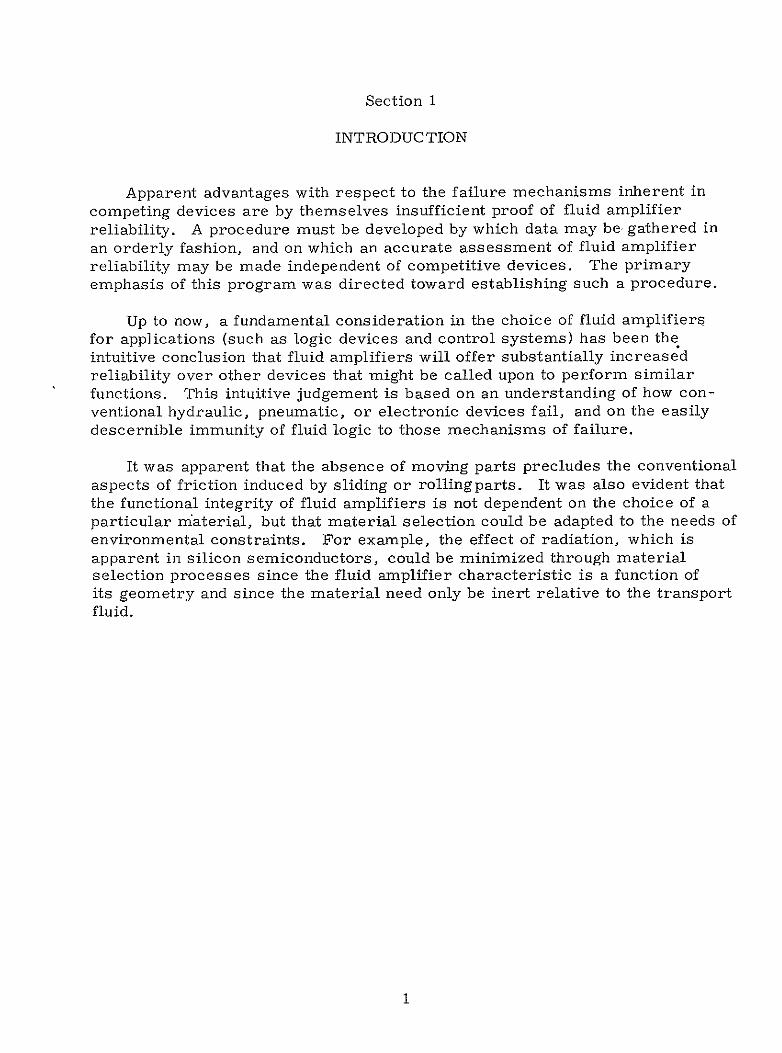