First and second trimester screening for fetal structural ...
Fetal volume measurements in the first trimester of pregnancy with three-dimensional ultrasound
Nicol Smeets
Proefschrift Nicol.indb 1 4-10-2012 14:33:52
Copyright 2012 Nicol SmeetsAll rights serverved. No part of this publication may be reproduced, stored in a retrieval system, or transmitted, in any form or by any means, electronic, mechanical, photocopying, recording or otherwise, without the prior written permission from the copyright owner.
Cover design Chris Bor en Aline PloegCover a picture of Luuk at 11+1 weeks, the son of the author Lay-out Chris BorPrinted Ipskamp drukkers
Financial support for the publication of this thesis has been kindly provided byStichting de Weijerhorst, Conceptus BV, Olympus Nederland BV/Medical Expert Training, Chip Soft BV, Johnson & Johnson Medical BV, Covidien Nederland BV, Abbott BV, Smith-Nephew, BMA BV (Mosos), Medical Dynamics and Hologic Benelux BV, Memidis Pharma bv
A catalogue record is available from the Endhoven University of Technology LibraryISBN 978-90-386-3246-9NUR 954
Proefschrift Nicol.indb 2 4-10-2012 14:33:52
Fetal volume measurements in the first trimester of pregnancy with three-dimensional ultrasound
PROEFSCHRIFT
ter verkrijging van de graad van doctor aan deTechnische Universiteit Eindhoven, op gezag van de
rector magnificus, prof.dr.ir. C.J. van Duijn, voor eencommissie aangewezen door het College voor
Promoties in het openbaar te verdedigenop dinsdag 13 november 2012 om 16.00 uur
door
Nicol Anna Cornelia Smeets
geboren te Heerlen
Proefschrift Nicol.indb 3 4-10-2012 14:33:52

Dit proefschrift is goedgekeurd door de promotoren:
prof.dr. S.G. Oeienprof.dr.ir. P.F.F. Wijn
Copromotor:dr. B.Winkens
Proefschrift Nicol.indb 4 4-10-2012 14:33:53

Carpe diem
Samenstelling van de promotiecommissie:
prof.dr. S.G. Oei, promotorTechnische Universiteit Eindhoven
prof.dr.ir. P.F.F. Wijn, promotorTechnische Universiteit Eindhoven
dr. B. Winkens, co-promotorMaastricht University
dr.ir. M. Mischi, lid TU/eTechnische Universiteit Eindhoven
prof.dr. J.G. Nijhuis, extern lidMaastricht Universitair Medisch Centrum
prof.dr. P.P. van den Berg, extern lidUniversitair Medisch Centrum Groningen
dr. F.J.M.E. Roumen, adviseurAtrium Medisch Centrum Parkstad, Heerlen
prof.dr. S. Weiland, voorzitterTechnische Universiteit Eindhoven
Proefschrift Nicol.indb 5 4-10-2012 14:33:53

Proefschrift Nicol.indb 6 4-10-2012 14:33:53
Contents
Chapter 1 Introduction 9
Chapter 2 Learning curve of volume measurements by three-dimensional ultrasound with a rotational multi-planar technique (VOCAL), an in vitro studyEur J Obstet Gynecol Reprod Biol 2011;159:476-7
19
Chapter 3 Measurement error of volume measurements by three-dimensional ultrasound with a rotational multi-planar technique (VOCAL) accepted for publication in Gynecol Obstet Invest
31
Chapter 4 Preliminary results of a new semi-automated method for fetal volume measurements with three-dimensional ultrasound Prenat Diagn 2012;32:1-7
43
Chapter 5 Inter- and intra-observer variation of first trimester fetal volume measurements with three-dimensional ultrasound J Perinat Med 2011;39:539–543
55
Chapter 6 Fetal volume measurements with three-dimensional ultrasound in the first trimester of pregnancy in relation to pregnancy outcome BMC Pregnancy and Childbirth 2012;12:38
67
Chapter 7 The predictive value of first trimester fetal volume measurements, a prospective cohort study
75
Chapter 8 Conclusion and perspectives 93
Addendum Summary 101
Samenvatting 105
List of abbreviations 111
List of publications 115
Dankwoord 119
About the author 125
Proefschrift Nicol.indb 7 4-10-2012 14:33:53
Early Hum Dev, minor revision

Proefschrift Nicol.indb 8 4-10-2012 14:33:53
Chapter
General introduction and outline of the thesis
1
Proefschrift Nicol.indb 9 4-10-2012 14:33:53

Proefschrift Nicol.indb 10 4-10-2012 14:33:53
Introduction
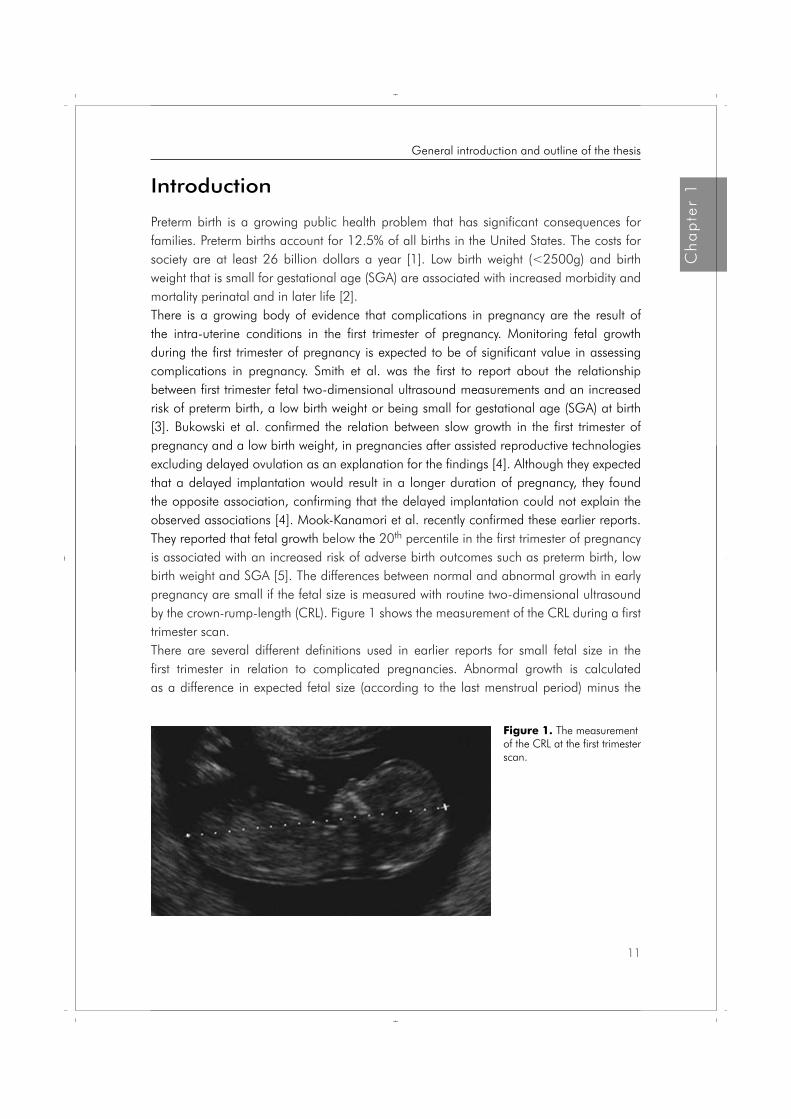
Preterm birth is a growing public health problem that has significant consequences for families. Preterm births account for 12.5% of all births in the United States. The costs for society are at least 26 billion dollars a year [1]. Low birth weight (<2500g) and birth weight that is small for gestational age (SGA) are associated with increased morbidity and mortality perinatal and in later life [2]. There is a growing body of evidence that complications in pregnancy are the result of the intra-uterine conditions in the first trimester of pregnancy. Monitoring fetal growth during the first trimester of pregnancy is expected to be of significant value in assessing complications in pregnancy. Smith et al. was the first to report about the relationship between first trimester fetal two-dimensional ultrasound measurements and an increased risk of preterm birth, a low birth weight or being small for gestational age (SGA) at birth [3]. Bukowski et al. confirmed the relation between slow growth in the first trimester of pregnancy and a low birth weight, in pregnancies after assisted reproductive technologies excluding delayed ovulation as an explanation for the findings [4]. Although they expected that a delayed implantation would result in a longer duration of pregnancy, they found the opposite association, confirming that the delayed implantation could not explain the observed associations [4]. Mook-Kanamori et al. recently confirmed these earlier reports. They reported that fetal growth below the 20th percentile in the first trimester of pregnancy is associated with an increased risk of adverse birth outcomes such as preterm birth, low birth weight and SGA [5]. The differences between normal and abnormal growth in early pregnancy are small if the fetal size is measured with routine two-dimensional ultrasound by the crown-rump-length (CRL). Figure 1 shows the measurement of the CRL during a first trimester scan.There are several different definitions used in earlier reports for small fetal size in the first trimester in relation to complicated pregnancies. Abnormal growth is calculated as a difference in expected fetal size (according to the last menstrual period) minus the
Figure 1. The measurement of the CRL at the first trimester scan.
11
Ch
ap
ter
1
General introduction and outline of the thesis
Proefschrift Nicol.indb 11 4-10-2012 14:33:54
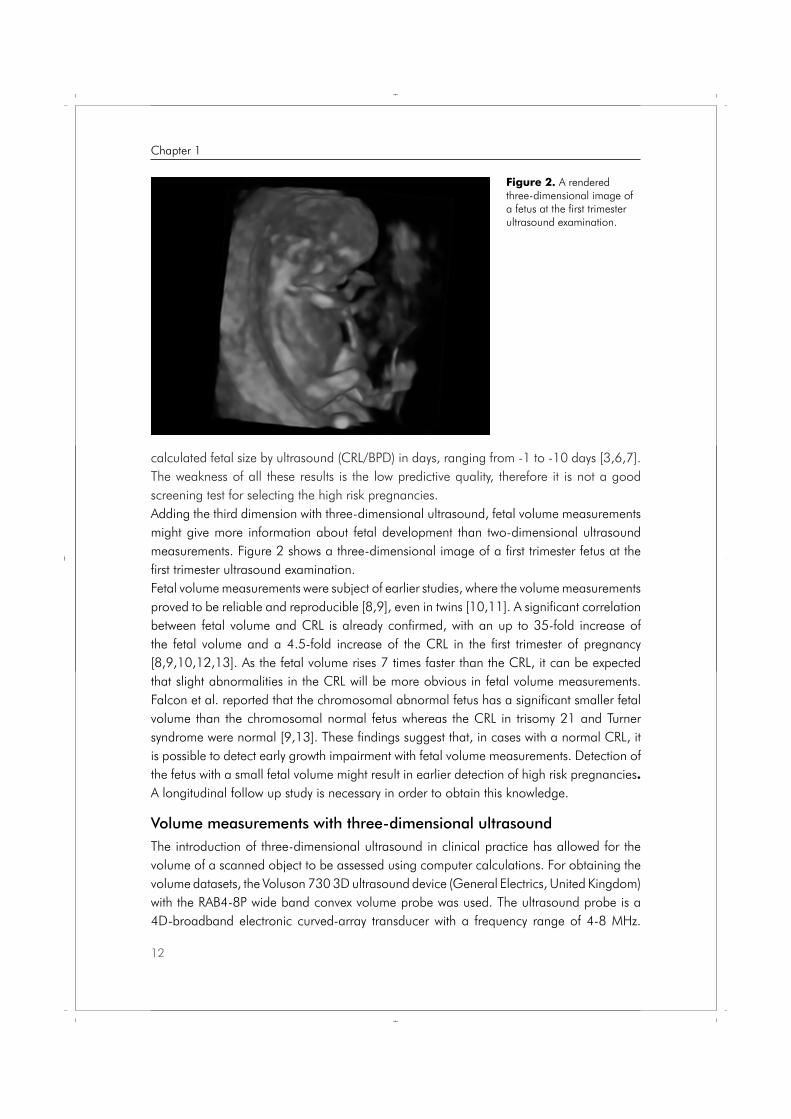
calculated fetal size by ultrasound (CRL/BPD) in days, ranging from -1 to -10 days [3,6,7]. The weakness of all these results is the low predictive quality, therefore it is not a good screening test for selecting the high risk pregnancies.Adding the third dimension with three-dimensional ultrasound, fetal volume measurements might give more information about fetal development than two-dimensional ultrasound measurements. Figure 2 shows a three-dimensional image of a first trimester fetus at the first trimester ultrasound examination. Fetal volume measurements were subject of earlier studies, where the volume measurements proved to be reliable and reproducible [8,9], even in twins [10,11]. A significant correlation between fetal volume and CRL is already confirmed, with an up to 35-fold increase of the fetal volume and a 4.5-fold increase of the CRL in the first trimester of pregnancy [8,9,10,12,13]. As the fetal volume rises 7 times faster than the CRL, it can be expected that slight abnormalities in the CRL will be more obvious in fetal volume measurements. Falcon et al. reported that the chromosomal abnormal fetus has a significant smaller fetal volume than the chromosomal normal fetus whereas the CRL in trisomy 21 and Turner syndrome were normal [9,13]. These findings suggest that, in cases with a normal CRL, it is possible to detect early growth impairment with fetal volume measurements. Detection of the fetus with a small fetal volume might result in earlier detection of high risk pregnancies. A longitudinal follow up study is necessary in order to obtain this knowledge.
Volume measurements with three-dimensional ultrasoundThe introduction of three-dimensional ultrasound in clinical practice has allowed for the volume of a scanned object to be assessed using computer calculations. For obtaining the volume datasets, the Voluson 730 3D ultrasound device (General Electrics, United Kingdom) with the RAB4-8P wide band convex volume probe was used. The ultrasound probe is a 4D-broadband electronic curved-array transducer with a frequency range of 4-8 MHz.
Figure 2. A rendered three-dimensional image of a fetus at the first trimester ultrasound examination.
12
Chapter 1
Proefschrift Nicol.indb 12 4-10-2012 14:33:54
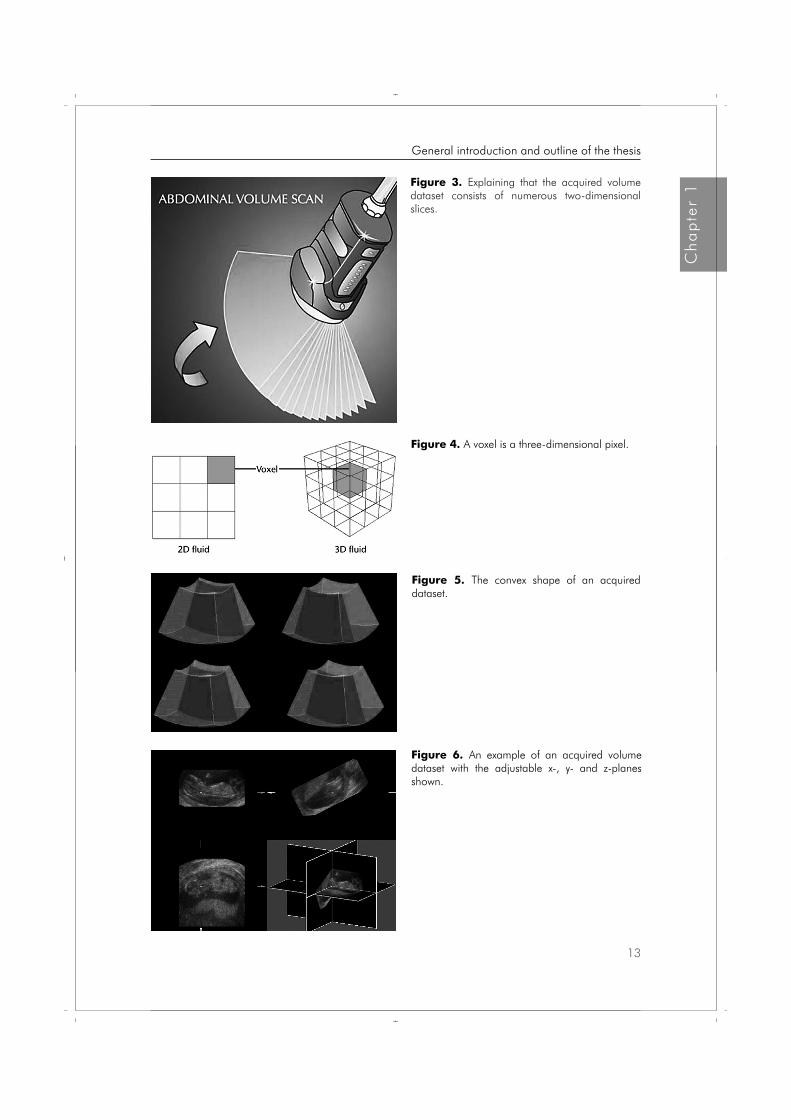
Figure 3. Explaining that the acquired volume dataset consists of numerous two-dimensional slices.
Figure 6. An example of an acquired volume dataset with the adjustable x-, y- and z-planes shown.
Figure 5. The convex shape of an acquired dataset.
Figure 4. A voxel is a three-dimensional pixel.
13
Ch
ap
ter
1
General introduction and outline of the thesis
Proefschrift Nicol.indb 13 4-10-2012 14:33:55

Figure 3 explains that a volume dataset acquired by the transducer consists of numerous two-dimensional slices. Each slice is made up of pixels, all these two-dimensional slices together result in an acquired dataset that is made up of voxels. Voxels are the calculated three-dimensional pixels as a result of adding all the two-dimensional planes together. This is graphically explained by figure 4. The acquired three-dimensional dataset has a convex shape as is shown in figure 5, this has to be taken into account when calculating distances or when determining the position of the voxels of interest.After obtaining the three-dimensional dataset it is possible to go through the dataset in the x-, y- or z-axis or to rotate the dataset around these axes in order to obtain the optimal image of the object of interest for the volume calculations. An example is shown in figure 6.The most commonly used method for volume calculations is the rotational multi-planar technique called VOCAL (Volume Organ Computer-aided AnaLysis). This technique consists of the following steps: the contour of the object of interest is outlined and the object of interest is rotated around its axis to a known number of degrees. The rotation of the object of interest around its axis is shown in figure 7. After this the next contour is outlined. This procedure continues until the object of interest is rotated 180°. The rotational step can be chosen, the options are 6°, 9°, 15° or 30°. This results in respectively in 30, 20, 12 or 6 contours to be drawn around the object of interest. A volume is then fitted around all of the outlined contours. Which rotational step is most suitable depends on whether the object of interest is regular or irregular [14]. Finally, the program calculates the volume of the fitted object. An example of a calculated (fetal) volume is shown in figure 8. The VOCAL software is installed in most commonly used three-dimensional ultrasound devices and is used in the search for new diagnostic tools in obstetrics and gynaecology. Earlier reports described the accuracy and reproducibility of this technique in several settings. Hui-Xiong et al. described three-dimensional measurements of hepatic tumours conducted both in vitro and in vivo with the aid of the VOCAL technique [15]. They compared the results with mathematical two-dimensional calculations and concluded that the VOCAL technique
Figure 7. A graphical explanation of the rotation of the object of interest around its axis.
14
Chapter 1
Proefschrift Nicol.indb 14 4-10-2012 14:33:55
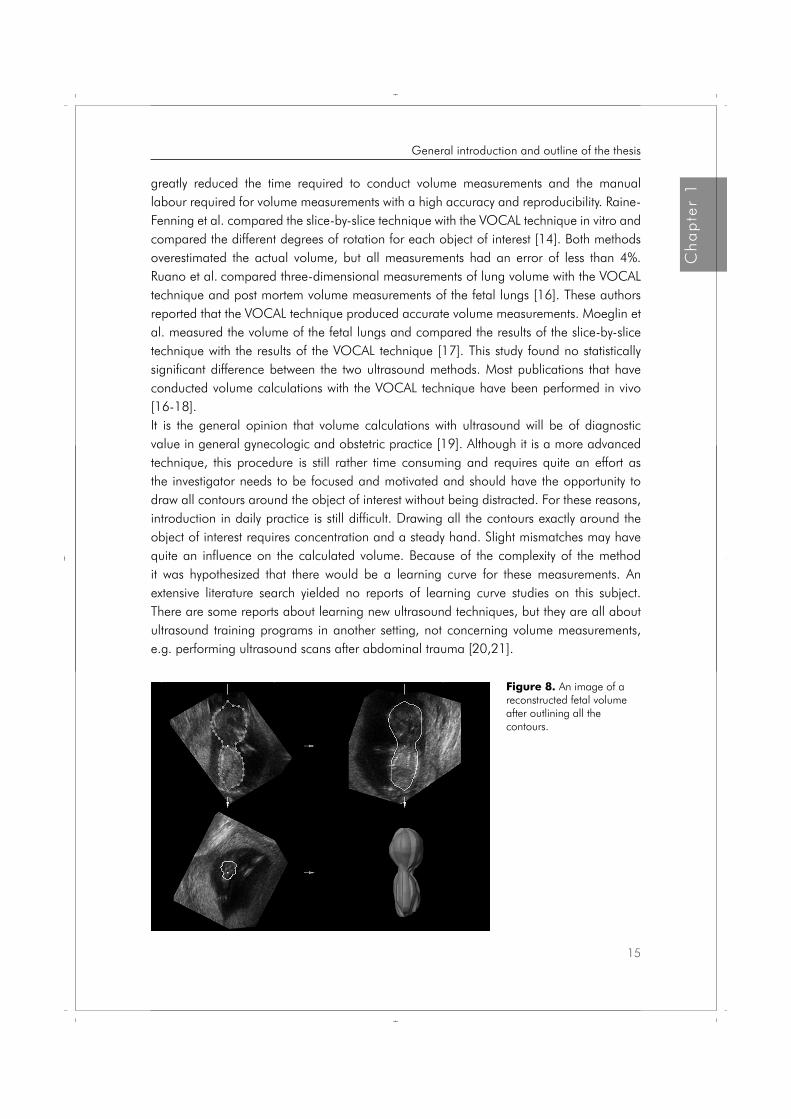
greatly reduced the time required to conduct volume measurements and the manual labour required for volume measurements with a high accuracy and reproducibility. Raine-Fenning et al. compared the slice-by-slice technique with the VOCAL technique in vitro and compared the different degrees of rotation for each object of interest [14]. Both methods overestimated the actual volume, but all measurements had an error of less than 4%. Ruano et al. compared three-dimensional measurements of lung volume with the VOCAL technique and post mortem volume measurements of the fetal lungs [16]. These authors reported that the VOCAL technique produced accurate volume measurements. Moeglin et al. measured the volume of the fetal lungs and compared the results of the slice-by-slice technique with the results of the VOCAL technique [17]. This study found no statistically significant difference between the two ultrasound methods. Most publications that have conducted volume calculations with the VOCAL technique have been performed in vivo [16-18].It is the general opinion that volume calculations with ultrasound will be of diagnostic value in general gynecologic and obstetric practice [19]. Although it is a more advanced technique, this procedure is still rather time consuming and requires quite an effort as the investigator needs to be focused and motivated and should have the opportunity to draw all contours around the object of interest without being distracted. For these reasons, introduction in daily practice is still difficult. Drawing all the contours exactly around the object of interest requires concentration and a steady hand. Slight mismatches may have quite an influence on the calculated volume. Because of the complexity of the method it was hypothesized that there would be a learning curve for these measurements. An extensive literature search yielded no reports of learning curve studies on this subject. There are some reports about learning new ultrasound techniques, but they are all about ultrasound training programs in another setting, not concerning volume measurements, e.g. performing ultrasound scans after abdominal trauma [20,21].
Figure 8. An image of a reconstructed fetal volume after outlining all the contours.
15
Ch
ap
ter
1
General introduction and outline of the thesis
Proefschrift Nicol.indb 15 4-10-2012 14:33:56
Because of the still rather complex and time consuming technique for volume measurements, further enhancement of the available techniques or development of a new technique is advisable.
Outline of the thesis
This thesis aims to answer the following questions:1. Is there a learning curve for volume measurements with three-dimensional ultrasound?2. How large is the measurement error of the three-dimensional ultrasound measurement
of the first trimester fetal volume and does it depend on the volume measured?3. Is it possible to calculate the volume of an object of interest in an ultrasound dataset
with semi-automated computer calculations?4. Are fetal volume measurements with three-dimensional ultrasound measurements
reproducible? 5. Is it possible to select pregnancies with a high risk of preterm birth and/or a low birth
weight by measuring the first trimester fetal volume?
To answer these questions we conducted the following studies, of which the results are presented in the thesis:In chapter 2, we focus on the learning curve of three-dimensional ultrasound volume measurements. This will be analyzed in vitro, using the multi-planar technique VOCAL. The volume related measurement error of in vitro volume measurements by three-dimensional ultrasound with the rotational multi-planar technique will be discussed in Chapter 3. The third in vitro study (Chapter 4) reports of the preliminary results of a newly developed semi-automated method for volume measurements with three-dimensional ultrasound. First, this study was performed in vitro to compare the new method with VOCAL, and then it was tested in vivo on a first trimester fetus.The second part of the thesis reports of the results of the clinical studies concerning fetal volume measurements. In Chapter 5, the inter- and intra-observer variation of first trimester fetal volume measurements with three-dimensional ultrasound are computed to evaluate if fetal volume measurements are a potential useful diagnostic tool in the first trimester of pregnancy. Chapter 6 describes the protocol of the prospective cohort study concerning fetal volume measurements with three-dimensional ultrasound in the first trimester of pregnancy, in relation to pregnancy outcome. Chapter 7 discusses the outcome of this prospective cohort study in which first trimester fetal volume measurements with three-dimensional ultrasound were evaluated as a potential tool for selecting pregnancies with a high risk of preterm birth and/or a low birth weight. In Chapter 8, the results will be summarized and recommendations for clinical application and future research will be presented.
16
Chapter 1
Proefschrift Nicol.indb 16 4-10-2012 14:33:57
References 1. Behrman RE, Stith Butler A, Committee on Understanding Premature Birth and Assuring Healthy
Outcomes. Preterm birth: Causes, consequences, and prevention. Washington, D.C. National Academies Press; 2007.
2. Barker DJB. Adult consequences of fetal growht restriction. Clin Obstet Gynecol 2006;49:270-83.
3. Smith GCS, Smith MFS, McNay MB, Fleming JEE. First-trimester growth and the risk of low birth weight. N Engl J Med 1998;339:1817-22.
4. Bukowski R, Smith GCS, Malone FD, Ball RH, Nyberg DA, Comstock CH, Hankins GDV, Berkowitz RL, Gross SJ, Dugoff L, Craigo SD, Timor-Tritsch IE, Carr SR, Wolfe HM, D’Alton ME. Fetal growth in early pregnancy and risk of delivering low birth weight infant: prospective cohort study. BMJ,doi:10.1136/bmj.39129.637917. AE2007.
5. Mook-Kanamori DO, Steegers EAP, Eilers PH, Raat H, Hofman A, Jaddoe VWV. Risk factors and outcomes associated with first-trimester fetal growth restriction. JAMA 2010;303:527-534.
6. Gardosi J, Francis A. Early pregnancy predictors of preterm birth: the role of a prolonged menstruation-conception interval. BJOG 2000;107:228-37.
7. Mercer BM, Merlino AA, Milluzzi CJ, Moore JJ. Small fetal size before 20 weeks’ gestation: associations with maternal tobacco use, early preterm birth, and low birthweight. Am J Obstet Gynecol 2008;198:673.e1-673.e8.
8. Blaas HGK, Taipale P, Torp H, Eik-Nes SH. Three-dimensional ultrasound volume calculations of human embryos and young fetuses: a study on the volumetry of compound structures and its reproducibility. Ultrasound Obstet Gynecol 2006;27:640-6.
9. Falcon O, Peralta CFA, Cavoretto P, Auer M, Nicolaides KH. Fetal trunk and head volume in chromosomally abnormal fetuses at 11+0 to 13+6 weeks of gestation. Ultrasound Obstet Gynecol 2005;26:517-20.
10. Martins WP, Ferriani RA, Nastri CO, Filho FM. First trimester fetal volume and crown-rump length: Comparison betweens singletons and twins conceived by in vitro fertilization. Ultrasound Med Biol 2008;34:1360-4.
11. Martins WP, Nastri CO, Barra DA, Navarro PAAS, Filho FM, Ferriani RA. Fetal volume and crown-rump length from 7 to 10 weeks of gestational age in singletons and twins. Eur J Obstet Gynecol Reprod Biol 2009;145:32-5.
12. Aviram R, Kamar Shpan D, Markovitch O, Fisherman A, Tepper R. Three-dimensional first trimester fetal volumetry; comparison with crown rump length. Early Hum Dev 2004;80:1-5.
13. Falcon O, Peralta CF, Cavoretto P, Faiola S, Nicolaides KH. Fetal trunk and head volume measured by three-dimensional ultrasound at 11+0 to 13+6 weeks of gestation in chromosomally normal pregnancies. Ultrasound Obstet Gynecol 2005;26:263-6.
14. Raine-Fenning NJ, Clewes JS, Kendall NR, Bunkheila AK, Campbell BK, Johnson IR. The interobserver reliability and validity of volume calculation from three-dimensional ultrasound datasets in the in vitro setting. Ultrasound Obstet Gynecol 2003;21:283-291.
15. Hui-Xiong X, Xiao-Yu Y, Ming-De L, Guang-Jian Liu, Zuo-Feng X. Estimation of liver tumor volume using a three-dimensional ultrasound volumetric system. Ultrasound in Med & Biol 2003;29:839-846.
16. Ruano R, Martinovic J, Dommergues M, Aubry M-C, Dumez Y, Benachi A. Accuracy of fetal lung volume assessed by three-dimensional sonography. Ultrasound Obstet Gynecol 2005;26:725-730.
17. Moeglin D, Talmant C, Duyme M, Lopez AC. Fetal lung volumetry using two- and three-dimensional ultrasound. Ultrasound Obstet Gynecol 2005;25:119-127.
17
Ch
ap
ter
1
General introduction and outline of the thesis
Proefschrift Nicol.indb 17 4-10-2012 14:33:57
18. Raine-Fenning NJ, Campbell B, Collier J, Brincat M, Johnson I. The reproducibility of endometrial volume acquisition and measurement with the VOCAL-imaging program. Ultrasound Obstet Gynecol 2002;19:69-75.
19. Geomini PM, Coppus SF, Kluivers KB, Bremer GL, Kruitwagen RF, Mol BW. Is three-dimensional ultrasonography of additional value in the assessment of adnexal masses? Gynecol Oncol 2007;106:153-9.
20. McCarter FD, Luchette FA, Molloy M, Hurst JM, Davis K, Johannigman JA, Frame SB, Fischer JE. Institutional and individual learning curves for focused abdominal ultrasound for trauma. Ann surg;2000:5:689-700.
21. Smith RS, Kern SJ, Fry WR, Helmer SD. Institutional learning curve of surgeon-performed trauma ultrasound. Arch Surg 1998;133:530-536.
18
Chapter 1
Proefschrift Nicol.indb 18 4-10-2012 14:33:57
Chapter 2Nicol AC Smeets
Bjorn Winkens
S Guid Oei
Learning curve of volume measurements by three-dimensional ultrasound with a rotational multi-planar technique (VOCAL), an in vitro study
Extended version of brief communication as published in Eur J
Obstet Gynecol Reprod Biol 2011;159:476-7
Proefschrift Nicol.indb 19 4-10-2012 14:33:57
Abstract
Objectives Evidence is increasing that volume calculations by three-dimensional ultrasound are of clinical importance in obstetrical and gynecological practice. However, the current available methods for volume calculation might be too complex for introduction in common practice. The goal of the present research project is to describe the learning curve for volume calculations by three-dimensional ultrasound.
Methods A three-dimensional ultrasound device (Kretz Voluson 730) with a rotational multi-planar volume measurement program (VOCAL) was used, together with a three-dimensional ultrasound phantom of 21.5 cm3. All volume measurements were performed by 6 investigators who were blinded for the actual volume and for the results of their volume calculations. The time needed for each measurement was registered. Statistical analysis was performed with the CUSUM method and linear mixed-effects models.
Results The overall mean volume was 24.6 cm3 (range 21.8-30.5 cm3). There was no significant learning effect. The time needed for one measurement first decreased and then stabilized after a few measurements at 72 seconds.
Conclusion There appears to be no learning curve for three-dimensional ultrasound volume measurements with the VOCAL technique.
20
Chapter 2
Proefschrift Nicol.indb 20 4-10-2012 14:33:57
Introduction
Since the introduction of three-dimensional ultrasound in clinical practice, it became possible to measure volumes of a scanned object with computer calculations. It is the general opinion that volume calculations with ultrasound will be of diagnostic value in the general gynecologic and obstetric practice [1]. The current available methods for volume calculation are however rather complex and time-consuming. For this reason introduction in daily practice is still difficult.The most frequently used method to obtain volume measurements from 3D volume datasets is VOCAL™ (Volume Organ Computer Aided analysis) [2]. The technique consists of the following procedures: the contour of the object of interest is outlined, the object of interest is rotated around a fixed axis and the next contour is outlined. This procedure continues until the object of interest is rotated 180°, then a volume is fitted around all outlined contours. Finally the program calculates the volume of the fitted object. This method is currently installed on most of the three-dimensional ultrasound devices and used in the quest for new diagnostic tools in obstetrics and gynecology. Volume calculations with the VOCAL technique are rather complex. Drawing all the contours exactly around the object of interest requires concentration and a steady hand. Slight mismatches may have quite an influence on the calculated volume. Because of the complexity of the method it was hypothesized that there would be a learning curve for these measurements. An extensive literature search yielded no reports of learning curve studies on this subject. There are some reports about learning new ultrasound techniques. But they are all about ultrasound training programs in another setting, not concerning volume measurements. For example performing ultrasound scans after abdominal trauma [3,4].The goal of the present paper is to discuss the learning curve for three-dimensional volume calculations with the VOCAL technique.
Materials and Methods
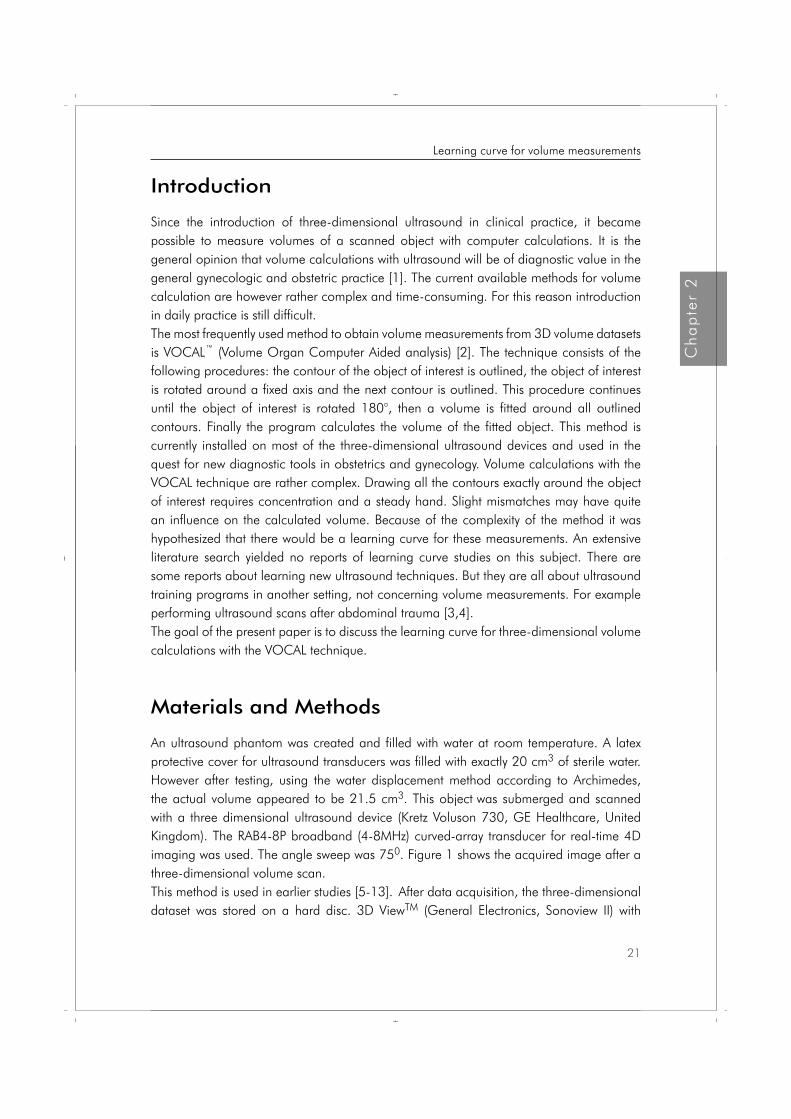
An ultrasound phantom was created and filled with water at room temperature. A latex protective cover for ultrasound transducers was filled with exactly 20 cm3 of sterile water. However after testing, using the water displacement method according to Archimedes, the actual volume appeared to be 21.5 cm3. This object was submerged and scanned with a three dimensional ultrasound device (Kretz Voluson 730, GE Healthcare, United Kingdom). The RAB4-8P broadband (4-8MHz) curved-array transducer for real-time 4D imaging was used. The angle sweep was 750. Figure 1 shows the acquired image after a three-dimensional volume scan. This method is used in earlier studies [5-13]. After data acquisition, the three-dimensional dataset was stored on a hard disc. 3D ViewTM (General Electronics, Sonoview II) with
21
Ch
ap
ter
2
Learning curve for volume measurements
Proefschrift Nicol.indb 21 4-10-2012 14:33:57
the rotational multi-planar technique (VOCAL) was used for volume measurements. An example of a calculated volume is shown in figure 2. When the rotational interval between the outlined contours is changed in larger steps, fewer contours need to be drawn. After testing, there was minimal difference in measurement results, which was confirmed in the report of Raine-Fenning et al [14]. They reported only significant differences in measured volumes when irregular shaped objects are measured. As a regular shaped object was used, it was decided that too many rotational steps would take too much time and would require too much concentration from the investigator in repeated measurements. Therefore, rotational steps of 30° (6 contours) were used in the present study.
Figure 1. Three-dimensional image of the scanned object.
Figure 2. Result of a volume measurement with the VOCAL-technique.
22
Chapter 2
Proefschrift Nicol.indb 22 4-10-2012 14:33:58
All volume measurements were performed by six investigators with broad experience in two-dimensional obstetric ultrasound imaging, but without any experience with three-dimensional ultrasound volume measurements. An expert in three-dimensional volume measurements performed the same measurements. The volume of the object was measured twelve times by each investigator. The measurements were performed on a personal computer. For each volume measurement the necessary time to perform the procedure was registered. The investigators were blinded for the actual volume of the object, for the results of their volume calculations, and for the time needed for one measurement. To analyze the learning curve, the CUSUM method [15] was used, where failure was defined as a measurement error of more than 10% compared to the control measurement (the measurements performed by the expert). The acceptable and unacceptable failure rates were set at 0.05 and 0.15, and the probabilities of type I and II errors were chosen to be 0.10. As a result, the CUSUM decreases with s = 0.1281 after each success and increases with 1-s = 0.8719 after each failure, where the lower boundary limit h0 = -1.19 and upper boundary limit h1 = 1.19. Additionally the measurements and the time needed to perform a measurement were analyzed using linear mixed-effects models. These models were used, since they take into account the correlation between the outcomes from the same subject. The procedure to select the final model was as follows. We started with a model that included a linear (B1=linear effect) and quadratic trend (B2=quadratic effect) as well as a random intercept and random slope. The final model was obtained by a top-down procedure using likelihood ratio tests based on maximum likelihood estimation. The results from this final model were then acquired using restricted maximum likelihood estimation to obtain unbiased estimators [16]. P-values £ 0.05 were considered statistically significant. Statistical analysis was performed using SPSSTM (Chicago Illinois, USA) version 15.0 for windows.
Results
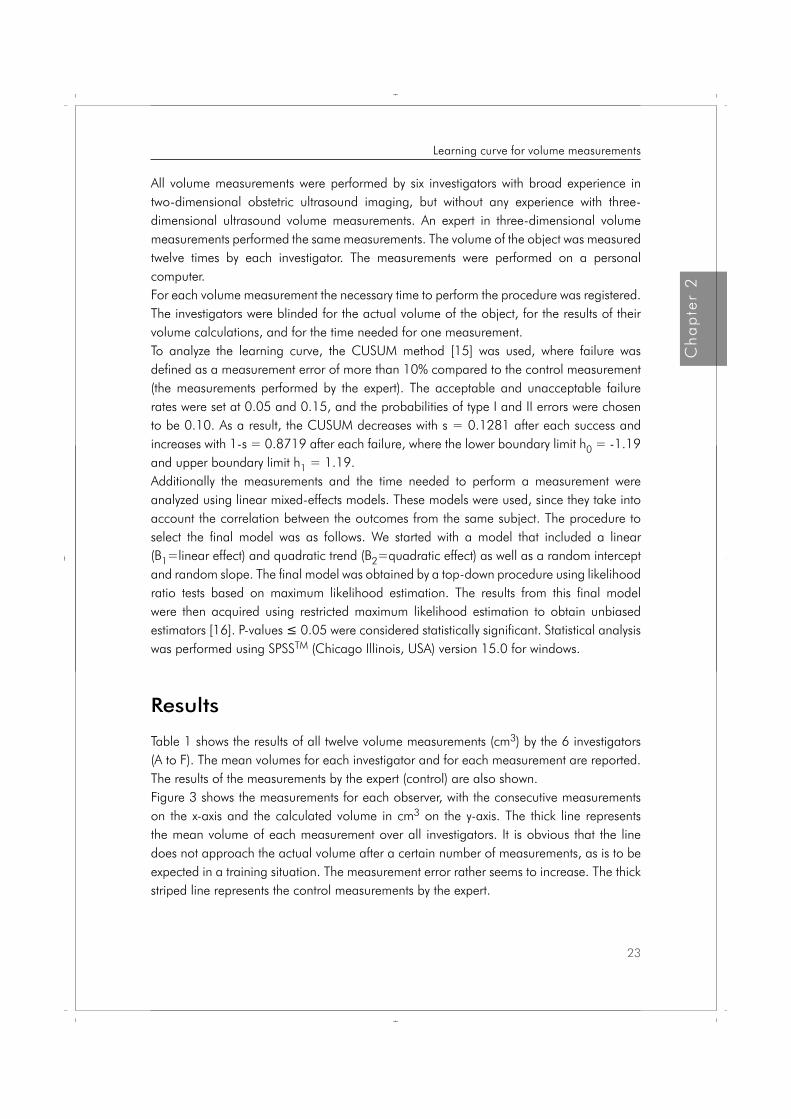
Table 1 shows the results of all twelve volume measurements (cm3) by the 6 investigators (A to F). The mean volumes for each investigator and for each measurement are reported. The results of the measurements by the expert (control) are also shown.Figure 3 shows the measurements for each observer, with the consecutive measurements on the x-axis and the calculated volume in cm3 on the y-axis. The thick line represents the mean volume of each measurement over all investigators. It is obvious that the line does not approach the actual volume after a certain number of measurements, as is to be expected in a training situation. The measurement error rather seems to increase. The thick striped line represents the control measurements by the expert.
23
Ch
ap
ter
2
Learning curve for volume measurements
Proefschrift Nicol.indb 23 4-10-2012 14:33:58
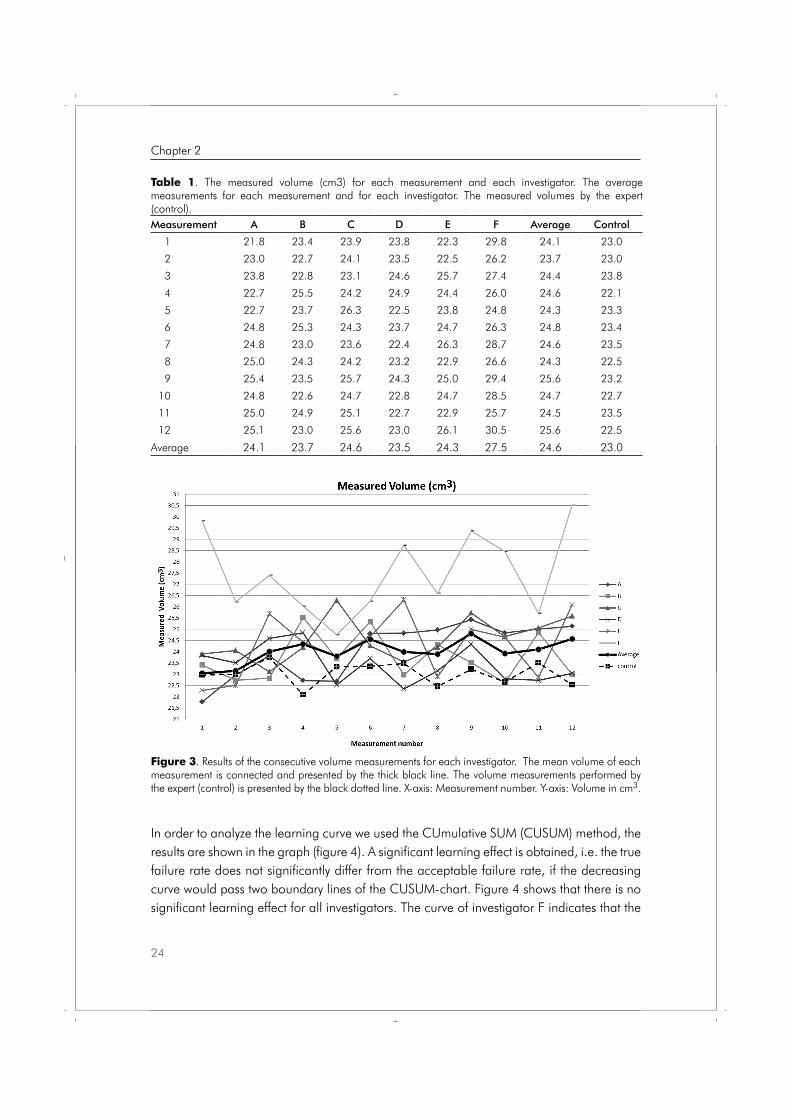
In order to analyze the learning curve we used the CUmulative SUM (CUSUM) method, the results are shown in the graph (figure 4). A significant learning effect is obtained, i.e. the true failure rate does not significantly differ from the acceptable failure rate, if the decreasing curve would pass two boundary lines of the CUSUM-chart. Figure 4 shows that there is no significant learning effect for all investigators. The curve of investigator F indicates that the
Figure 3. Results of the consecutive volume measurements for each investigator. The mean volume of each measurement is connected and presented by the thick black line. The volume measurements performed by the expert (control) is presented by the black dotted line. X-axis: Measurement number. Y-axis: Volume in cm3.
Table 1. The measured volume (cm3) for each measurement and each investigator. The average measurements for each measurement and for each investigator. The measured volumes by the expert (control).Measurement A B C D E F Average Control
1 21.8 23.4 23.9 23.8 22.3 29.8 24.1 23.0
2 23.0 22.7 24.1 23.5 22.5 26.2 23.7 23.0
3 23.8 22.8 23.1 24.6 25.7 27.4 24.4 23.8
4 22.7 25.5 24.2 24.9 24.4 26.0 24.6 22.1
5 22.7 23.7 26.3 22.5 23.8 24.8 24.3 23.3
6 24.8 25.3 24.3 23.7 24.7 26.3 24.8 23.4
7 24.8 23.0 23.6 22.4 26.3 28.7 24.6 23.5
8 25.0 24.3 24.2 23.2 22.9 26.6 24.3 22.5
9 25.4 23.5 25.7 24.3 25.0 29.4 25.6 23.2
10 24.8 22.6 24.7 22.8 24.7 28.5 24.7 22.7
11 25.0 24.9 25.1 22.7 22.9 25.7 24.5 23.5
12 25.1 23.0 25.6 23.0 26.1 30.5 25.6 22.5
Average 24.1 23.7 24.6 23.5 24.3 27.5 24.6 23.0
24
Chapter 2
Proefschrift Nicol.indb 24 4-10-2012 14:33:58
true failure rate for this investigator is significantly larger than the acceptable failure rate, while no statistical interference can be made for the other investigators. The linear mixed effects analysis showed a linear trend, i.e. mean absolute difference with control = 1.28 + 0.08 * measurement number, with a statistical significant slope (2-sided
Figure 4. The CUSUM-graph of the results of the measurement of all investigators.
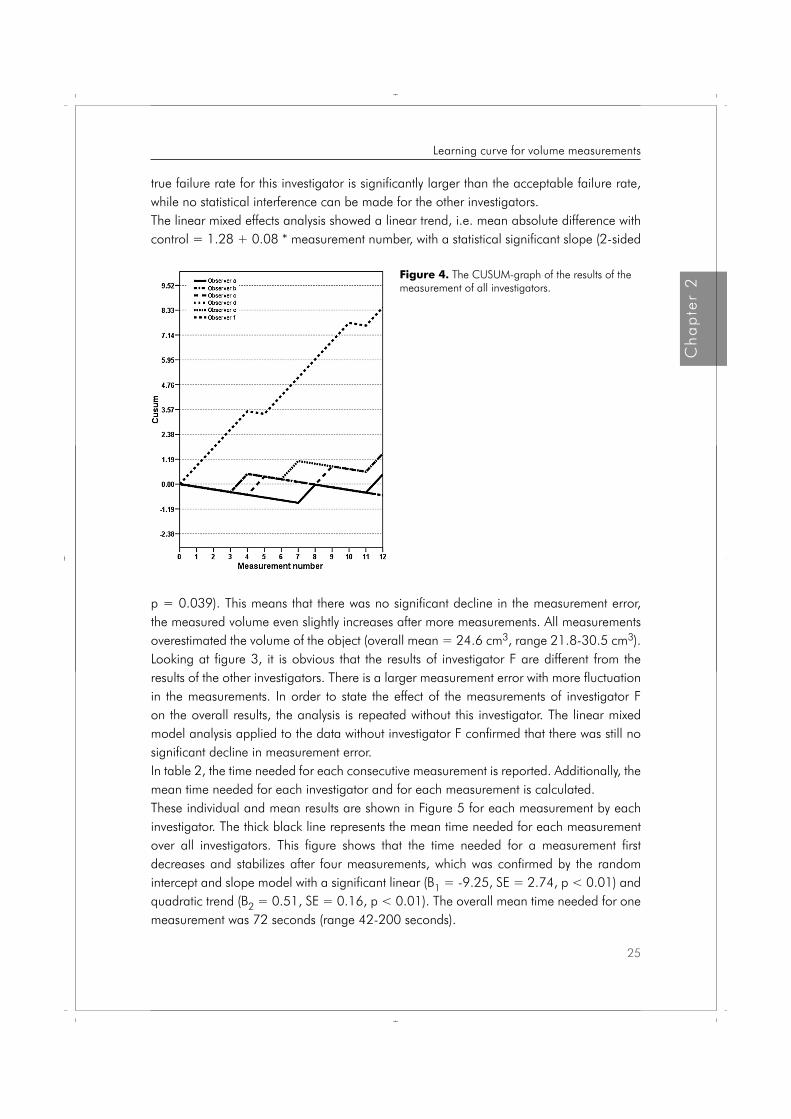
p = 0.039). This means that there was no significant decline in the measurement error, the measured volume even slightly increases after more measurements. All measurements overestimated the volume of the object (overall mean = 24.6 cm3, range 21.8-30.5 cm3). Looking at figure 3, it is obvious that the results of investigator F are different from the results of the other investigators. There is a larger measurement error with more fluctuation in the measurements. In order to state the effect of the measurements of investigator F on the overall results, the analysis is repeated without this investigator. The linear mixed model analysis applied to the data without investigator F confirmed that there was still no significant decline in measurement error. In table 2, the time needed for each consecutive measurement is reported. Additionally, the mean time needed for each investigator and for each measurement is calculated. These individual and mean results are shown in Figure 5 for each measurement by each investigator. The thick black line represents the mean time needed for each measurement over all investigators. This figure shows that the time needed for a measurement first decreases and stabilizes after four measurements, which was confirmed by the random intercept and slope model with a significant linear (B1 = -9.25, SE = 2.74, p < 0.01) and quadratic trend (B2 = 0.51, SE = 0.16, p < 0.01). The overall mean time needed for one measurement was 72 seconds (range 42-200 seconds).
25
Ch
ap
ter
2
Learning curve for volume measurements
Proefschrift Nicol.indb 25 4-10-2012 14:33:58
Discussion
Earlier reports show that the VOCAL technique can be used for volume calculations. Hui-Xiong et al [5] described in vitro and in vivo three-dimensional measurements of hepatic tumors with the aid of the VOCAL technique and compared the results with mathematical two-dimensional calculations, they concluded that the VOCAL technique greatly reduced the consumed time and manual labor for volume measurement with high accuracy and reproducibility. Raine-Fenning et al [14] compared the slice-by-slice technique with the VOCAL technique in vitro and compared the different degrees of rotating the object of interest. Both methods overestimated the actual volume. In irregular objects the VOCAL program proved significantly better than the slice-by-slice technique. In regular objects there were no significant differences, the same applies to the rotational degrees. Ruano et al [17] compared three-dimensional measurements of lung volume with the aid of the VOCAL technique and post mortem volume measurements of the fetal lungs. They reported accurate volume measurements. Moeglin et al [18] measured the volume of the fetal lungs and compared the results of the slice-by-slice technique with the results of the VOCAL technique, there was no statistical significant difference between measurement results of
Figure 5. The results of the time needed for each consecutive volume measurement for each investigator. The mean time needed at each measurement is connected and presented by the thick blue line. X-axis: Measurement number. Y-axis: Time in seconds.
Time (s)
25
50
75
100
125
150
175
200
225
1 2 3 4 5 6 7 8 9 10 11 12Measurement number
Tim
e (s
)
ABCDEFAverage
26
Chapter 2
Proefschrift Nicol.indb 26 4-10-2012 14:33:58
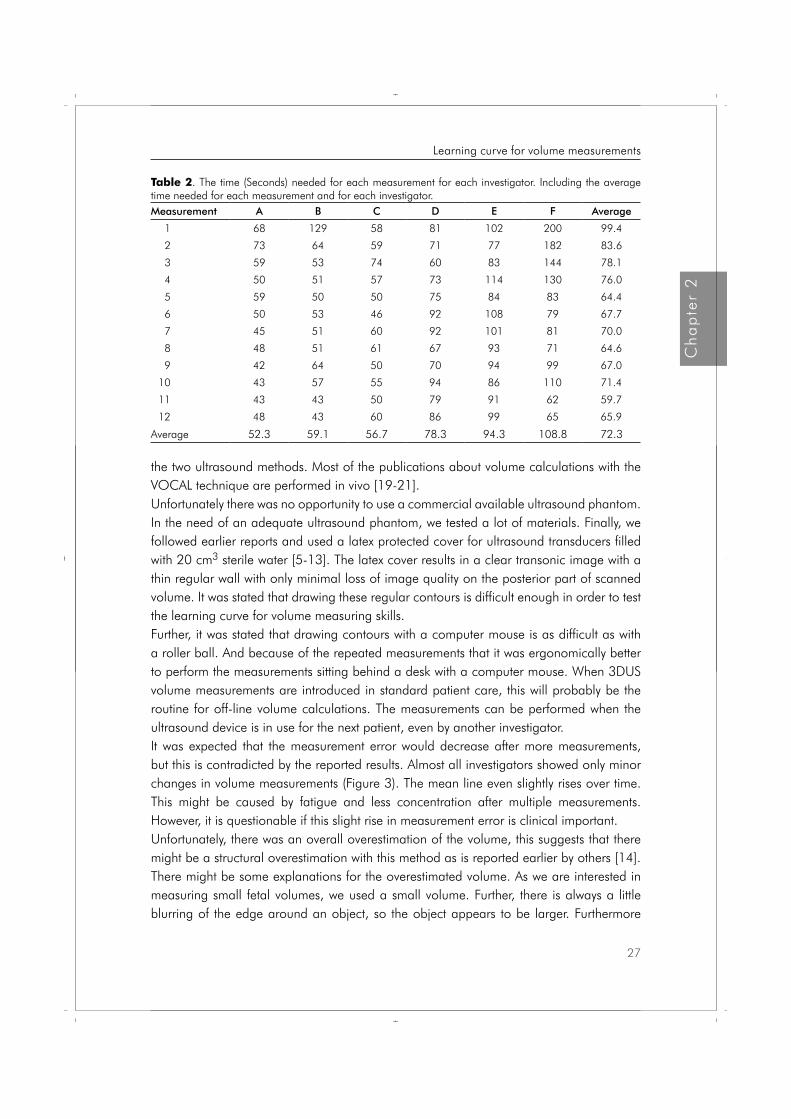
the two ultrasound methods. Most of the publications about volume calculations with the VOCAL technique are performed in vivo [19-21]. Unfortunately there was no opportunity to use a commercial available ultrasound phantom. In the need of an adequate ultrasound phantom, we tested a lot of materials. Finally, we followed earlier reports and used a latex protected cover for ultrasound transducers filled with 20 cm3 sterile water [5-13]. The latex cover results in a clear transonic image with a thin regular wall with only minimal loss of image quality on the posterior part of scanned volume. It was stated that drawing these regular contours is difficult enough in order to test the learning curve for volume measuring skills. Further, it was stated that drawing contours with a computer mouse is as difficult as with a roller ball. And because of the repeated measurements that it was ergonomically better to perform the measurements sitting behind a desk with a computer mouse. When 3DUS volume measurements are introduced in standard patient care, this will probably be the routine for off-line volume calculations. The measurements can be performed when the ultrasound device is in use for the next patient, even by another investigator.It was expected that the measurement error would decrease after more measurements, but this is contradicted by the reported results. Almost all investigators showed only minor changes in volume measurements (Figure 3). The mean line even slightly rises over time. This might be caused by fatigue and less concentration after multiple measurements. However, it is questionable if this slight rise in measurement error is clinical important.Unfortunately, there was an overall overestimation of the volume, this suggests that there might be a structural overestimation with this method as is reported earlier by others [14]. There might be some explanations for the overestimated volume. As we are interested in measuring small fetal volumes, we used a small volume. Further, there is always a little blurring of the edge around an object, so the object appears to be larger. Furthermore
Table 2. The time (Seconds) needed for each measurement for each investigator. Including the average time needed for each measurement and for each investigator.Measurement A B C D E F Average
1 68 129 58 81 102 200 99.4
2 73 64 59 71 77 182 83.6
3 59 53 74 60 83 144 78.1
4 50 51 57 73 114 130 76.0
5 59 50 50 75 84 83 64.4
6 50 53 46 92 108 79 67.7
7 45 51 60 92 101 81 70.0
8 48 51 61 67 93 71 64.6
9 42 64 50 70 94 99 67.0
10 43 57 55 94 86 110 71.4
11 43 43 50 79 91 62 59.7
12 48 43 60 86 99 65 65.9
Average 52.3 59.1 56.7 78.3 94.3 108.8 72.3
27
Ch
ap
ter
2
Learning curve for volume measurements
Proefschrift Nicol.indb 27 4-10-2012 14:33:59
the investigators had no interest in the measuring results. Although they took a lot of effort in these measurements, their results might be less exact comparing to trained and devoted researchers. As all investigators measured the same volume images with the same instructions, we stated that the overestimation does not influence the learning curve for volume measurements. Therefore we conclude that the results of this study show that there is no significant learning curve for the performance of three-dimensional ultrasound volume measurements with the VOCAL technique. The investigators need less time after four measurements, this suggests that there might be a slight learning curve according to the time needed for a measurement (Figure 4). After this study it is concluded that it is not necessary to develop a training program for volume measurements with the VOCAL technique, if the investigators are experienced with common ultrasound and used to working with a computer.
28
Chapter 2
Proefschrift Nicol.indb 28 4-10-2012 14:33:59
References 1. Geomini PM, Coppus SF, Kluivers KB, Bremer GL, Kruitwagen RF, Mol BW. Is three-dimensional
ultrasonography of additional value in the assessment of adnexal masses? Gynecol Oncol 2007;106:153-9.
2. Kusanovic JP, Nien JK, Gonçalves LF, Espinoza J, Lee W, Balasubramaniam M, Soto E, Erez O, Romero R. The use of inversion mode and 3D manual segmentation in volume measurement of fetal fluid-filled structures: Comparison with Virtual Organ Computer-aided AnaLysis (VOCALTM). Ultrasound Obstet Gynecol. 2008;31:177–186.
3. McCarter FD, Luchette FA, Molloy M, Hurst JM, Davis K, Johannigman JA, Frame SB, Fischer JE. Institutional and individual learning curves for focused abdominal ultrasound for trauma. Ann surg;2000:5:689-700.
4. Smith RS, Kern SJ, Fry WR, Helmer SD. Institutional learning curve of surgeon-performed trauma ultrasound. Arch Surg 1998;133:530-536.
5. Hui-Xiong X, Xiao-Yu Y, Ming-De L, Guang-Jian Liu, Zuo-Feng X. Estimation of liver tumor volume using a three-dimensional ultrasound volumetric system. Ultrasound in Med & Biol 2003;29:839-846.
6. Dodds WJ, Groh WJ, Darweesh RMA, Lawson TL, Kishk SMA, Kern MK. Sonographic measurement of gallbladder volume. AJR 1985;145:1009-1011.
7. Riccabona M, Nelson TR, Pretorius DH, Davidson TE. Distance and volume measurement using three-dimensional ultrasonography. J Ultrasound Med 1995;14:881-6.
8. Riccabona M, Nelson TR, Pretorius DH. Three-dimensional ultrasound: accuracy of distance and volume measurements. Ultrasound Obstet Gynecol 1996;7:429-34.
9. Wong J, Gerscovich EO, Cronan MS, Seibert JA. Accuracy and precision of in vitro volumetric measurements by three-dimensional sonography. Invest Radiol 1996;31:26-9.
10. Hosli IM, Tercanli S, Herman A, Kretschmann M, Holzgreve W. In vitro volume measurement by three-dimensional ultrasound: comparison of two different systems. Ultrasound Obstet Gynecol 1998;11:17-22.
11. Hashimoto S, Goto H, Hirooka Y, Itoh A, Ishiguro Y, Kojima S, Hirai T, Hayakawa T, Naitoh Y. An evaluation of three-dimensional ulstrasonography for the measurement of gallbladder volume. AJG 1999;94:3492-3496.
12. Barry CD, Allott CP, John NW, Mellor PM, Arundel PA, Thomson DS, Waterton JC. Three-dimensional freehand ultrasound: Image reconstruction and volume analysis. Ultrasound in Med & Biol 1997;23:1209-1224.
13. Farrell T, Leslie JR, Chien PFW, Agustsson P. The reliability and validity of three dimensional ultrasound volumetric measurements using an in vitro balloon an in vivo uterine model. BJOG 2001;108:573-582.
14. Raine-Fenning NJ, Clewes JS, Kendall NR, Bunkheila AK, Campbell BK, Johnson IR. The interobserver reliability and validity of volume calculation from three-dimensional ultrasound datasets in the in vitro setting. Ultrasound Obstet Gynecol 2003;21:283-291.
15. Bolsin S, Colson M. Methodology matters. The use of the cusum technique in the assessment of trainee competence in new procedures. Int J Qual Health Care 2000;12:433-438.
16. Harville DA. Maximum likelihood approaches to variance component estimation and to related problems. JASA 1977;72: 320-340.
17. Ruano R, Martinovic J, Dommergues M, Aubry M-C, Dumez Y, Benachi A. Accuracy of fetal lung volume assessed by three-dimensional sonography. Ultrasound Obstet Gynecol 2005;26:725-730.
18. Moeglin D, Talmant C, Duyme M, Lopez AC. Fetal lung volumetry using two- and three-dimensional ultrasound. Ultrasound Obstet Gynecol 2005;25:119-127.
29
Ch
ap
ter
2
Learning curve for volume measurements
Proefschrift Nicol.indb 29 4-10-2012 14:33:59

19. Kalache KD, Espinoza J, Chaiworapongsa T, Londono J, Schoen ML, Treadwell MC, Lee W, Romero R. Three-dimensional ultrasound fetal lung volume measurement: a systematic study comparing the multiplanar method with the rotational (VOCAL) technique. Ultrasound Obstet Gynecol 2003;21:111-8.
20. Yaman C, Jesacher K, Polz W. Accuracy of three-dimensional transvaginal ultrasound in uterus volume measurements; comparison with two-dimensional ultrasound. Ultrasound Med Biol 2003;29:1681-4.
21. Raine-Fenning NJ, Campbell B, Collier J, Brincat M, Johnson I. The reproducibility of endometrial volume acquisition and measurement with the VOCAL-imaging program. Ultrasound Obstet Gynecol 2002;19:69-75.
30
Chapter 2
Proefschrift Nicol.indb 30 4-10-2012 14:33:59
Chapter
Nicol AC Smeets
Bjorn Winkens
S Guid Oei
Accepted for publication in Gynecol Obstet Invest
Volume related measurement error by three-dimensional ultrasound with a rotational multi-planar technique
3
Proefschrift Nicol.indb 31 4-10-2012 14:33:59
Abstract
Background: The goal of this study was to calculate the accuracy of three-dimensional volume measurements with the rotational multi-planar technique VOCAL (Volume Organ Computer-aided AnaLysis).
Methods: An ultrasound phantom with thirteen objects (volume: 10.2-40.5 cm3) was created. After data acquisition, the volumes of the objects were measured with the VOCAL technique.
Results: A linear mixed model analysis showed a significant linear (B = -0.008, 95%CI -0.014, -0.002, p = 0.005) and a significant quadratic trend (B = 0.0001, 95%CI 0.000004, 0.0002, p = 0.040). The absolute error increases significantly with the increasing volume of interest with 0.044 cm3 for each cm3 rise of the volume of interest. The actual volume increased from an initial value of 10 cm3 to values of 20 cm3, 30 cm3 and 40 cm3, resulting in a decrease in the mean estimated percentage error from 15.4% to 10.6%, 8.0% and 7.5%.
Conclusion: The results of this study showed that volume measurements with three-dimensional ultrasound and the VOCAL software can be used for volume measurements in vivo. However, it is important to assess the measurement error and to consider these error values when interpreting the results in daily practice.
32
Chapter 3
Proefschrift Nicol.indb 32 4-10-2012 14:33:59
Introduction
The introduction of three-dimensional ultrasound in clinical practice has allowed the volume of a scanned object to be assessed using computer calculations. It is the general opinion that volume calculations with ultrasound are of diagnostic value in general gynaecological and obstetric practices. Several years ago, a new three-dimensional volume measurement technique, the rotational multi-planar technique called VOCAL (Volume Organ Computer-aided AnaLysis), was introduced. The VOCAL software is installed in most commonly used three-dimensional ultrasound devices and is used in the search for new diagnostic tools in obstetrics and gynaecology. Earlier reports described the accuracy and reproducibility of this technique in several settings. Hui-Xiong et al. [1] described three-dimensional measurements of hepatic tumours conducted both in vitro and in vivo with the aid of the VOCAL technique. They compared the results with mathematical two-dimensional calculations and concluded that the VOCAL technique greatly reduced the time required to conduct volume measurements and the manual labour required for volume measurements with a high accuracy and reproducibility. Raine-Fenning et al. [2] compared the slice-by-slice technique with the VOCAL technique in vitro and compared the different degrees of rotation for each object of interest. Both methods overestimated the actual volume, but all measurements had an error of less than 4%. Ruano et al. [3] compared three-dimensional measurements of lung volume with the VOCAL technique and post mortem volume measurements of the fetal lungs. These authors reported that the VOCAL technique produced accurate volume measurements. Moeglin et al. [4] measured the volume of the fetal lungs and compared the results of the slice-by-slice technique with the results of the VOCAL technique. This study found no statistically significant difference between the two ultrasound methods. Most publications that have conducted volume calculations with the VOCAL technique have been performed in vivo [3-5]. The reported in vitro studies all used a limited number of measured objects with different shapes and volumes. An in vitro study to analyse the measurement error in objects with the same shape and consecutive volumes is missing in the current literature [2]. This is, to our knowledge, the first in vitro study to describe the relation between the volume of an object and the measurement error in vitro, with a continuous range of volumes. As we are interested in fetal volume measurements in the first trimester of pregnancy, we used volumes accordingly. The goal of this study was to investigate whether the measurement error of three-dimensional ultrasound volume measurement is related to the volume of the object of interest using the rotational multi-planar technique (VOCAL).
33
Ch
ap
ter
3
Volume related measurement error
Proefschrift Nicol.indb 33 4-10-2012 14:34:00
Materials and Methods
An ultrasound phantom was created and filled with tap-water at room temperature. A latex protective cover for ultrasound transducers was filled with a known amount of sterile water (volumes ranging from 10 to 40 cm3), creating sixteen objects with a known content. The actual volume of these sixteen objects was calculated using the water displacement method of Archimedes (calculated volumes ranged from 10.2 to 40.5 cm3). The sixteen objects
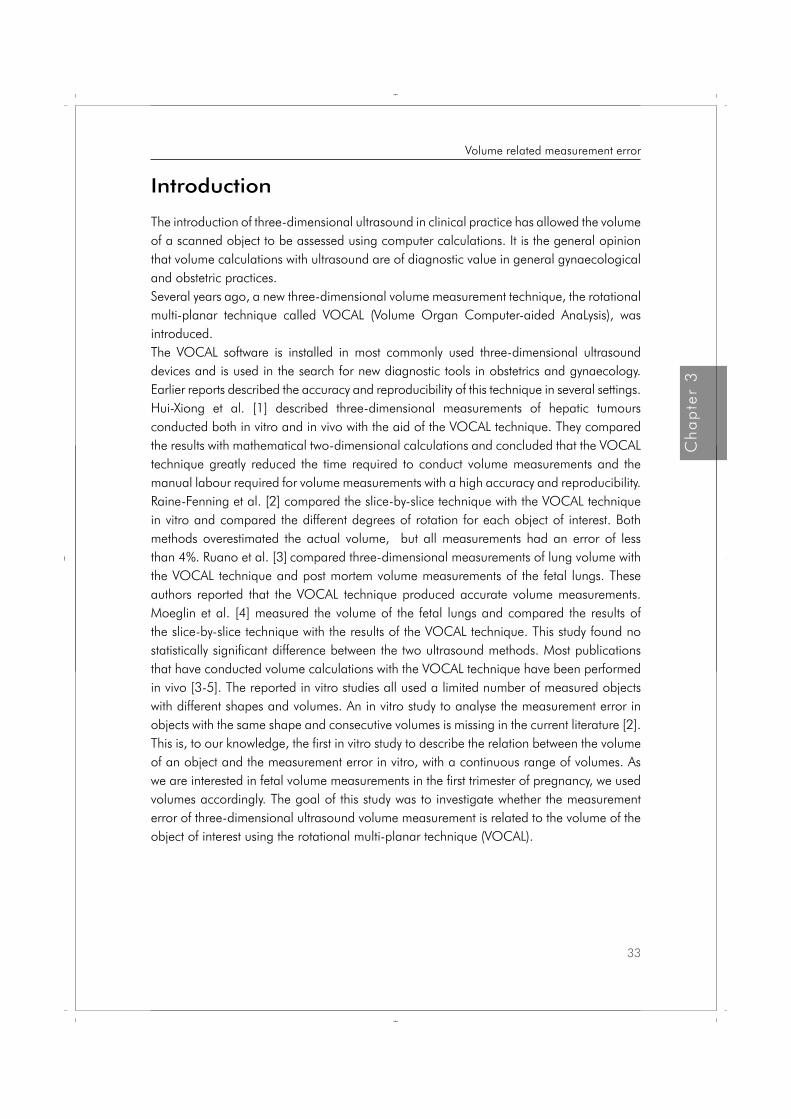
were submerged and scanned with a three-dimensional ultrasound device (Voluson 730, GE Healthcare, Zipf, United Kingdom). The RAB4-8P wide band convex volume probe, a real-time 4D-broadband electronic curved-array transducer with a frequency range of 4-8 MHz, was used. The angle sweep was 75°. Figure 1 shows the acquired image after a three-dimensional volume scan. This method has been used in previous studies [1, 6-12].
Figure 1. Image acquired using a three-dimensional volume ultrasound scan.
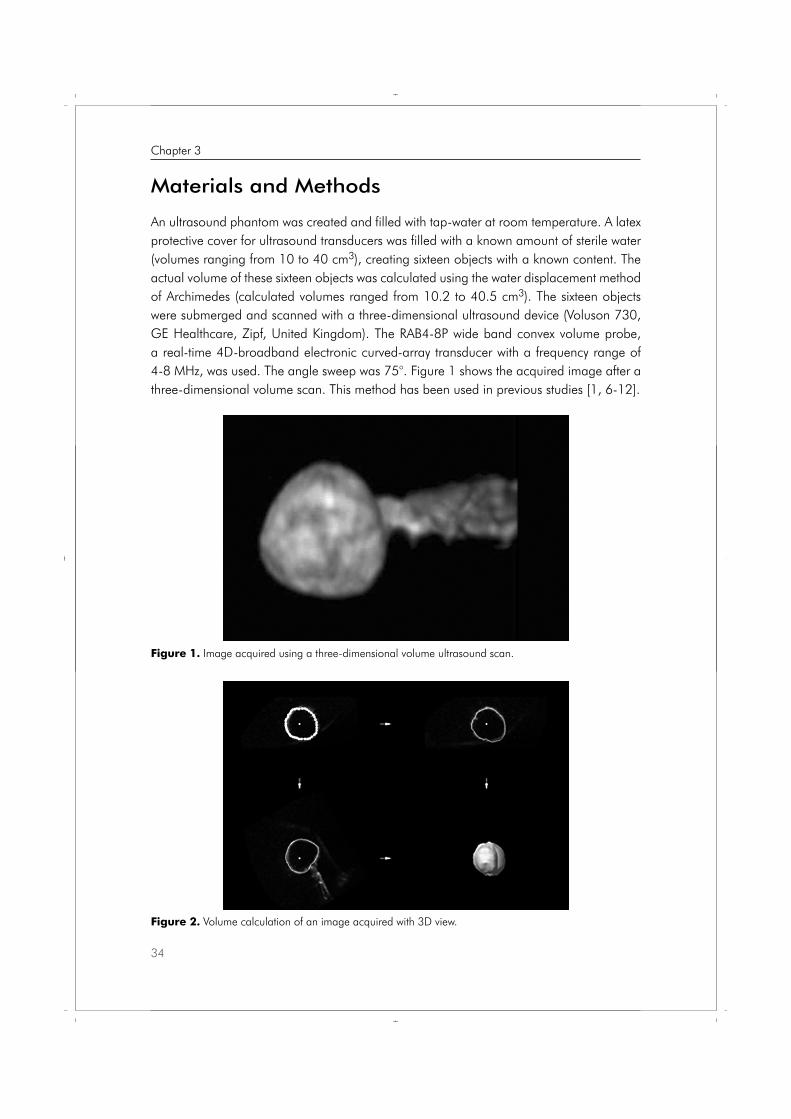
Figure 2. Volume calculation of an image acquired with 3D view.
34
Chapter 3
Proefschrift Nicol.indb 34 4-10-2012 14:34:00
After data acquisition, the three-dimensional dataset was stored on a hard disc. 4D ViewTM software (General Electrics, Sonoview II) was used with the rotational multi-planar technique (VOCAL) for the volume measurements. An example of a measured volume is shown in Figure 2. Volume measurements with this technique consists of the following steps: the contour of the object of interest is outlined and the object of interest is rotated around its axis to a known number of degrees. Then the next contour is outlined. This procedure continues until the object of interest is rotated 180°. A volume is then fitted around all of the outlined contours. Finally, the program calculates the volume of the fitted object. Although an advance compared to earlier techniques, this procedure is still rather time consuming. The investigator needs to be focused and motivated and should have the opportunity to draw all contours around the object of interest without being distracted. With a larger rotational step, fewer contours need to be drawn. After testing, there was a minimal difference in the measurement results, as was expected according to the report by Raine-Fenning et al. [2]. They reported that with irregular objects, the VOCAL program with rotational steps of 6° or 9° was found to be significantly better than the VOCAL program with rotational steps of 15° and 30° and the slice-by-slice technique. In regular objects, there were no significant differences between the rotational steps. Consequently, rotational steps of 30° (6 contours) were used in the present study. All volume measurements were performed by ten investigators who all have at least several years of experience as sonographers at one of the departments of obstetrics and gynecology. So they all have a great deal of experience in gynecologic and obstetric two-dimensional ultrasound imaging and calculations. Several of them also participated in a learning curve study that concluded that there is no learning curve for volume measurements with three-dimensional ultrasound [13]. In our hospitals ten experienced sonographers were available. The volumes of the different objects were calculated in a random order. The measurements were performed on a personal computer, sitting at a desk and using a computer mouse, because this arrangement would typically be used in daily practice. The investigators were not aware of the actual volume of the object or the measurement results. Others [2,3,13] performed multiple measurements ranging from two to five measurements of each object, without a clear explanation for the repetition of the measurements. It is expected that multiple measurements will even out, and thus reduce the measurement error. However, multiple measurements will probably not represent the daily practice. To investigate these expected results, the objects in this study were measured twice by each investigator. First, the average of these two measurements was used in the analysis. Then, the results of only the first volume measurements were analysed and compared to the first analysis.The measurement error was defined as the difference between (the average of) the measured volume and the actual volume of the object. The effect of the actual volume on the absolute value of the measurement error (the absolute error) and on the percentage of absolute measurement error (percentage error), i.e. 100% * absolute error / actual volume,
35
Ch
ap
ter
3
Volume related measurement error
Proefschrift Nicol.indb 35 4-10-2012 14:34:00
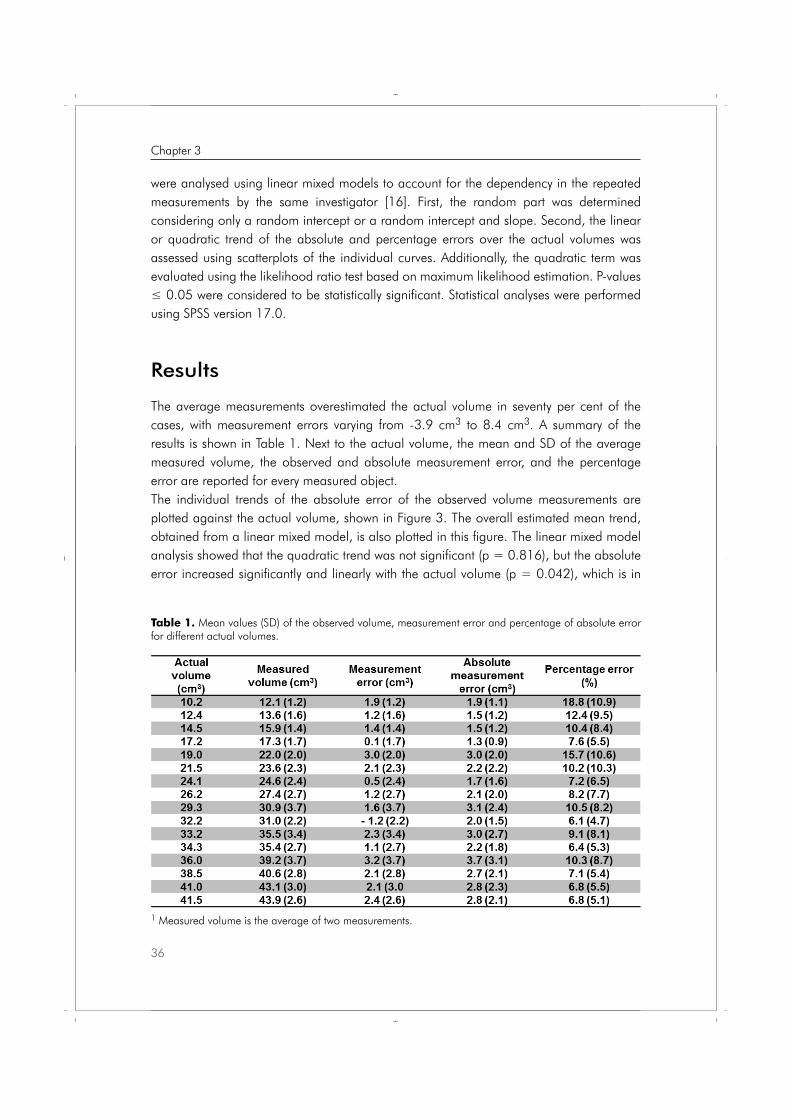
were analysed using linear mixed models to account for the dependency in the repeated measurements by the same investigator [16]. First, the random part was determined considering only a random intercept or a random intercept and slope. Second, the linear or quadratic trend of the absolute and percentage errors over the actual volumes was assessed using scatterplots of the individual curves. Additionally, the quadratic term was evaluated using the likelihood ratio test based on maximum likelihood estimation. P-values ≤ 0.05 were considered to be statistically significant. Statistical analyses were performed using SPSS version 17.0.
Results
The average measurements overestimated the actual volume in seventy per cent of the cases, with measurement errors varying from -3.9 cm3 to 8.4 cm3. A summary of the results is shown in Table 1. Next to the actual volume, the mean and SD of the average measured volume, the observed and absolute measurement error, and the percentage error are reported for every measured object. The individual trends of the absolute error of the observed volume measurements are plotted against the actual volume, shown in Figure 3. The overall estimated mean trend, obtained from a linear mixed model, is also plotted in this figure. The linear mixed model analysis showed that the quadratic trend was not significant (p = 0.816), but the absolute error increased significantly and linearly with the actual volume (p = 0.042), which is in
1 Measured volume is the average of two measurements.
Table 1. Mean values (SD) of the observed volume, measurement error and percentage of absolute error for different actual volumes.
36
Chapter 3
Proefschrift Nicol.indb 36 4-10-2012 14:34:01
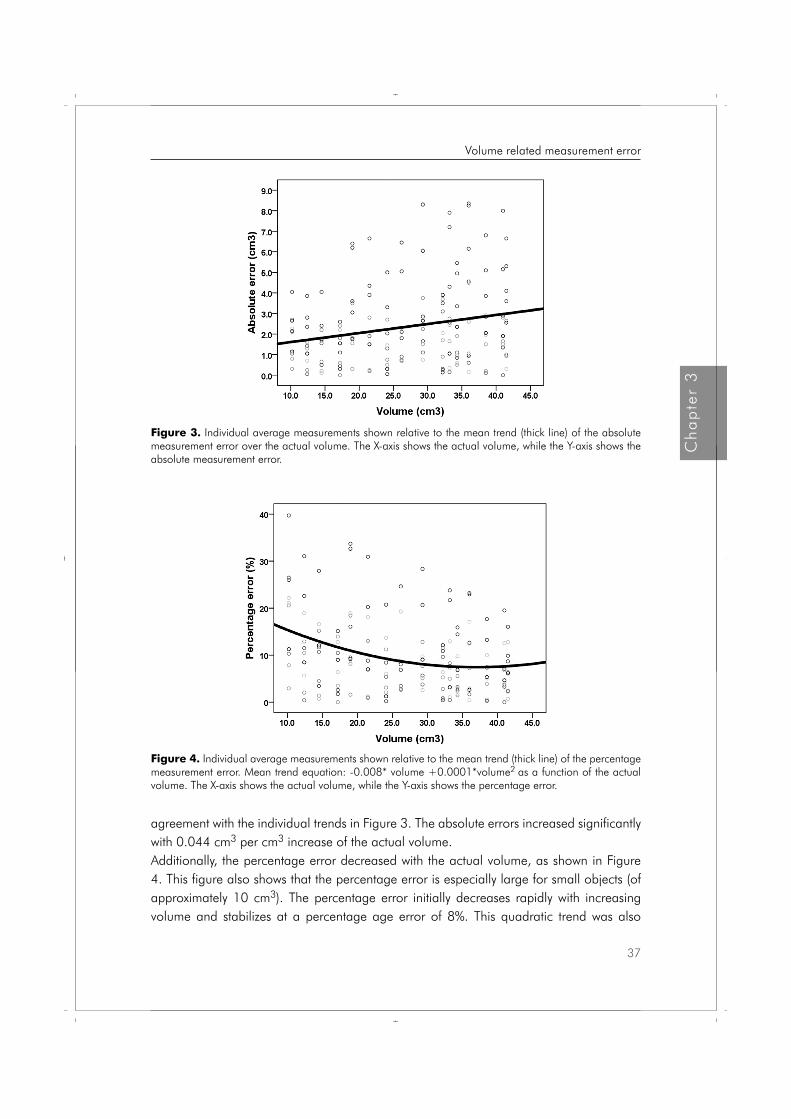
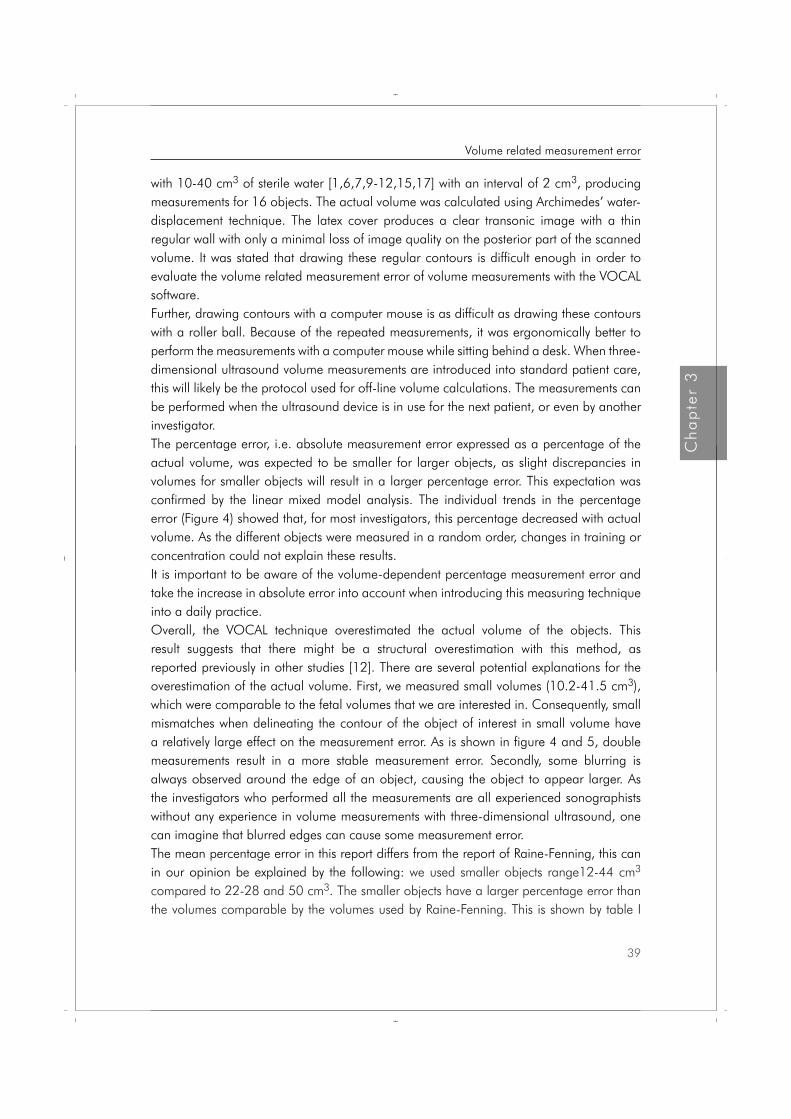
agreement with the individual trends in Figure 3. The absolute errors increased significantly with 0.044 cm3 per cm3 increase of the actual volume. Additionally, the percentage error decreased with the actual volume, as shown in Figure 4. This figure also shows that the percentage error is especially large for small objects (of approximately 10 cm3). The percentage error initially decreases rapidly with increasing volume and stabilizes at a percentage age error of 8%. This quadratic trend was also
Figure 4. Individual average measurements shown relative to the mean trend (thick line) of the percentage measurement error. Mean trend equation: -0.008* volume +0.0001*volume2 as a function of the actual volume. The X-axis shows the actual volume, while the Y-axis shows the percentage error.
Figure 3. Individual average measurements shown relative to the mean trend (thick line) of the absolute measurement error over the actual volume. The X-axis shows the actual volume, while the Y-axis shows the absolute measurement error.
37
Ch
ap
ter
3
Volume related measurement error
Proefschrift Nicol.indb 37 4-10-2012 14:34:03

confirmed with a linear mixed model analysis showing that if the actual volume increases from 10 cm3 to 20 cm3, 30 cm3 or 40 cm3, the mean estimated percentage error decreases from 15.4% to 10.6%, 8.0% and 7.5%, respectively. In the daily practice, it would be more practical to perform the measurements just once. Therefore, the same analysis was performed for the first measurements only. Although it is obvious that these single measurements can have a larger percentage measurement error (see figure 5) compared to the average of two measurements (see figure 4), the results were similar, i.e. a significant decrease in percentage measurement error with a larger volume.
Figure 5. Individual measurements, only the first measurement relative to the mean trend of the percentage error. The X-axis shows the actual volume, while the Y-axis shows the percentage error.
Discussion
This study demonstrates that the percentage error in this volume range is especially large for small objects. As expected, percentage error linearly declines with an increasing volume of interest. The percentage error stabilizes at 8%. The percentage measurement error evens out when calculating the average of two volume measurements. Single volume measurements resulted in a higher percentage measurement error for each object, but showed similar decrease in percentage error with increasing volume. The absolute error increases significantly with the increasing volume of interest with 0.044 cm3 for each cm3 rise of the volume of interest. We used a latex protected cover for ultrasound transducers filled
38
Chapter 3
Proefschrift Nicol.indb 38 4-10-2012 14:34:04
with 10-40 cm3 of sterile water [1,6,7,9-12,15,17] with an interval of 2 cm3, producing measurements for 16 objects. The actual volume was calculated using Archimedes’ water-displacement technique. The latex cover produces a clear transonic image with a thin regular wall with only a minimal loss of image quality on the posterior part of the scanned volume. It was stated that drawing these regular contours is difficult enough in order to evaluate the volume related measurement error of volume measurements with the VOCAL software.Further, drawing contours with a computer mouse is as difficult as drawing these contours with a roller ball. Because of the repeated measurements, it was ergonomically better to perform the measurements with a computer mouse while sitting behind a desk. When three-dimensional ultrasound volume measurements are introduced into standard patient care, this will likely be the protocol used for off-line volume calculations. The measurements can be performed when the ultrasound device is in use for the next patient, or even by another investigator.The percentage error, i.e. absolute measurement error expressed as a percentage of the actual volume, was expected to be smaller for larger objects, as slight discrepancies in volumes for smaller objects will result in a larger percentage error. This expectation was confirmed by the linear mixed model analysis. The individual trends in the percentage error (Figure 4) showed that, for most investigators, this percentage decreased with actual volume. As the different objects were measured in a random order, changes in training or concentration could not explain these results. It is important to be aware of the volume-dependent percentage measurement error and take the increase in absolute error into account when introducing this measuring technique into a daily practice. Overall, the VOCAL technique overestimated the actual volume of the objects. This result suggests that there might be a structural overestimation with this method, as reported previously in other studies [12]. There are several potential explanations for the overestimation of the actual volume. First, we measured small volumes (10.2-41.5 cm3), which were comparable to the fetal volumes that we are interested in. Consequently, small mismatches when delineating the contour of the object of interest in small volume have a relatively large effect on the measurement error. As is shown in figure 4 and 5, double measurements result in a more stable measurement error. Secondly, some blurring is always observed around the edge of an object, causing the object to appear larger. As the investigators who performed all the measurements are all experienced sonographists without any experience in volume measurements with three-dimensional ultrasound, one can imagine that blurred edges can cause some measurement error. The mean percentage error in this report differs from the report of Raine-Fenning, this can in our opinion be explained by the following: we used smaller objects range12-44 cm3 compared to 22-28 and 50 cm3. The smaller objects have a larger percentage error than the volumes comparable by the volumes used by Raine-Fenning. This is shown by table I
39
Ch
ap
ter
3
Volume related measurement error
Proefschrift Nicol.indb 39 4-10-2012 14:34:04
and figure 4. The absolute percentage error of the larger objects reaches the error reported by Raine-Fenning. They reported signed percentage differences, which can also be an explanation for the larger measurement error. It is generally known that averaging over repeated measurements evens out the measurement error. Raine-Fenning performed each measurement five times. As they reported, it took a lot of time to perform their measurements. Our opinion is that five volume measurements for each object of interest is not suited for the daily practice. Therefore, we decided to perform each measurement twice, and compare these results with those from a single measurement. Furthermore, the measurements in our study are performed by independent investigators (not the authors as in the report of Raine-Fenning), in order to mimic the result of daily practice as much as possible. It is well known that the results of new tests are mostly slightly less when performed by non-researchers. In conclusion, the results of this study show that volume measurements conducted with three-dimensional ultrasound and VOCAL software can be used for volume measurements in vivo. However, it is important to take the absolute and percentage measurement error into account, and to use this knowledge to interpret the results in daily practice.
40
Chapter 3
Proefschrift Nicol.indb 40 4-10-2012 14:34:04
References 1. Hui-Xiong X, Xiao-Yu Y, Ming-De L, Guang-Jian Liu, Zuo-Feng X. Estimation of liver tumor volume
using a three-dimensional ultrasound volumetric system. Ultrasound in Med & Biol 2003;29:839-846.
2. Raine-Fenning NJ, Clewes JS, Kendall NR, Bunkheila AK, Campbell BK, Johnson IR. The interobserver reliability and validity of volume calculation from three-dimensional ultrasound datasets in the in vitro setting. Ultrasound Obstet Gynecol 2003;21:283-291.
3. Ruano R, Martinovic J, Dommergues M, Aubry M-C, Dumez Y, Benachi A. Accuracy of fetal lung volume assessed by three-dimensional sonography. Ultrasound Obstet Gynecol 2005;26:725-730.
4. Moeglin D, Talmant C, Duyme M, Lopez AC. Fetal lung volumetry using two- and three-dimensional ultrasound. Ultrasound Obstet Gynecol 2005;25:119-127.
5. Raine-Fenning NJ, Campbell B, Collier J, Brincat M, Johnson I. The reproducibility of endometrial volume acquisition and measurement with the VOCAL-imaging program. Ultrasound Obstet Gynecol 2002;19:69-75.
6. Dodds WJ, Groh WJ, Darweesh RMA, Lawson TL, Kishk SMA, Kern MK. Sonographic measurement of gallbladder volume. AJR 1985;145:1009-1011.
7. Hashimoto S, Goto H, Hirooka Y, Itoh A, Ishiguro Y, Kojima S, Hirai T, Hayakawa T, Naitoh Y. An evaluation of three-dimensional ultrasonography for the measurement of gallbladder volume. Am J Gastroenterology 1999;94:3492-6.
8. Riccabona M, Nelson TR, Pretorius DH, Davidson TE. In vivo three-dimensional sonographic measurement of organ volume: validation in the urinary bladder. J Ultrasound Med 1996;15:627-32.
9. Riccabona M, Nelson TR, Pretorius DH, Davidson TE. Distance and volume measurement using three-dimensional ultrasonography. J Ultrasound Med 1995;14:881-6.
10. Wong J, Gerscovich EO, Cronan MS, Seibert JA. Accuracy and precision of in vitro volumetric measurements by three-dimensional sonography. Invest Radiol 1996;31:26-9.
11. Hosli IM, Tercanli S, Herman A, Kretschmann M, Holzgreve W. In vitro volume measurement by three-dimensional ultrasound: comparison of two different systems. Ultrasound Obstet Gynecol 1998;11:17-22.
12. Barry CD, Allott CP, John NW, Mellor PM, Arundel PA, Thomson DS, Waterton JC. Three-dimensional freehand ultrasound: Image reconstruction and volume analysis. Ultrasound in Med & Biol 1997;23:1209-1224.
13. Smeets NAC, Ven vd J, Oei SG. Inter- and intra-observer variation of fetal volume measurements with three-dimensional ultrasound in the first trimester of pregnancy.
14. Barreto EQ, Milani HJ, Araujo Júnior E, Haratz KK, Rolo LC, Nardozza LM, Moron AF. Reliability and validity of in vitro volume calculations by 3-dimensional ultrasonography using the multiplanar, virtual organ computer-aided analysis (VOCAL), and extended imaging VOCAL methods. J Ultrasound Med. 2010 May;29(5):767-74.
15. Farrell T, Leslie JR, Chien PFW, Agustsson P. The reliability and validity of three dimensional ultrasound volumetric measurements using an in vitro balloon an in vivo uterine model. BJOG 2001;108:573-582.
16. Cnaan A, Laird NM, Slasor P. Using the general linear mixed model to analyse unbalanced repeated measures and longitudinal data. Statist Med 1997;16:2349-2380.
17. Riccabona M, Nelson TR, Pretorius DH. Three-dimensional ultrasound: accuracy of distance and volume measurements. Ultrasound Obstet Gynecol 1996;7:429-34.
41
Ch
ap
ter
3
Volume related measurement error
Proefschrift Nicol.indb 41 4-10-2012 14:34:04

Proefschrift Nicol.indb 42 4-10-2012 14:34:04
Chapter
Nicol A.C. Smeets
Natallia A. Dvinskikh
Bjorn Winkens
S.Guid Oei
Prenat Diagn 2012;32:1-7
A new semi-automated method for fetal volume measurements with three-dimensional ultrasound: Preliminary results
4
Proefschrift Nicol.indb 43 4-10-2012 14:34:05
Abstract
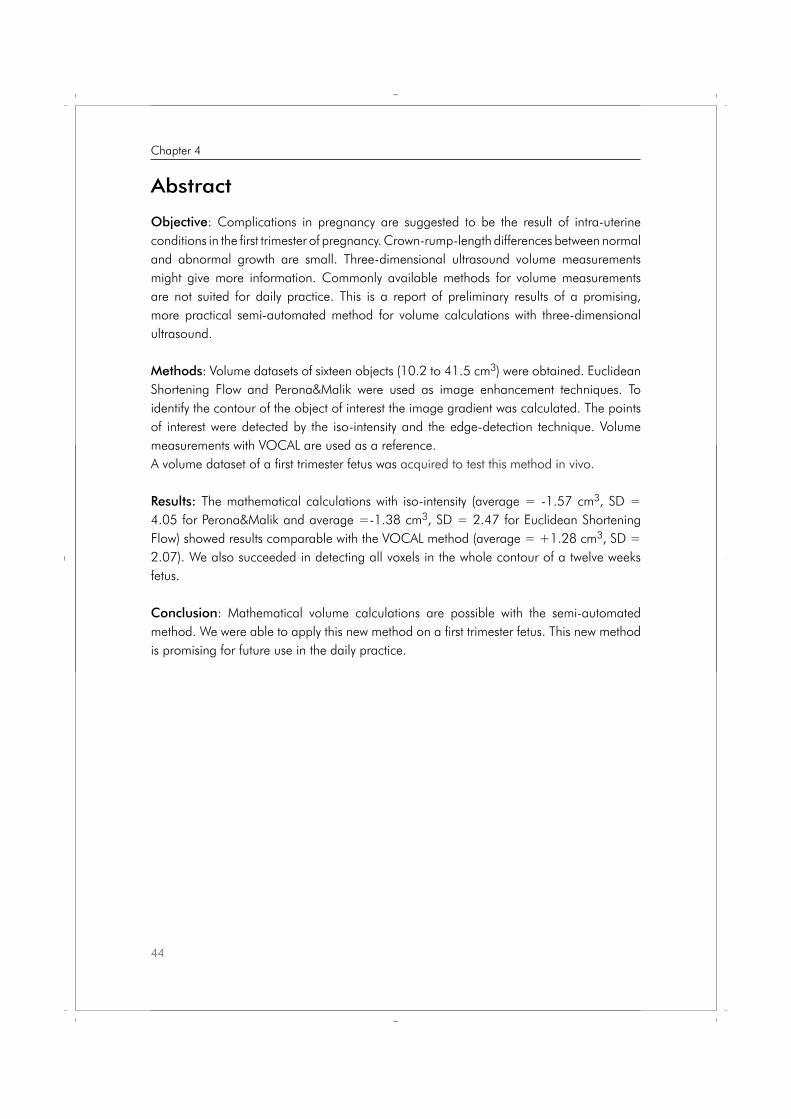
Objective: Complications in pregnancy are suggested to be the result of intra-uterine conditions in the first trimester of pregnancy. Crown-rump-length differences between normal and abnormal growth are small. Three-dimensional ultrasound volume measurements might give more information. Commonly available methods for volume measurements are not suited for daily practice. This is a report of preliminary results of a promising, more practical semi-automated method for volume calculations with three-dimensional ultrasound.
Methods: Volume datasets of sixteen objects (10.2 to 41.5 cm3) were obtained. Euclidean Shortening Flow and Perona&Malik were used as image enhancement techniques. To identify the contour of the object of interest the image gradient was calculated. The points of interest were detected by the iso-intensity and the edge-detection technique. Volume measurements with VOCAL are used as a reference.A volume dataset of a first trimester fetus was acquired to test this method in vivo.
Results: The mathematical calculations with iso-intensity (average = -1.57 cm3, SD = 4.05 for Perona&Malik and average =-1.38 cm3, SD = 2.47 for Euclidean Shortening Flow) showed results comparable with the VOCAL method (average = +1.28 cm3, SD = 2.07). We also succeeded in detecting all voxels in the whole contour of a twelve weeks fetus.
Conclusion: Mathematical volume calculations are possible with the semi-automated method. We were able to apply this new method on a first trimester fetus. This new method is promising for future use in the daily practice.
44
Chapter 4
Proefschrift Nicol.indb 44 4-10-2012 14:34:05
Introduction
There is a growing body of evidence that complications in pregnancy are the result of the intra-uterine conditions in the first trimester of pregnancy. Monitoring fetal growth during the first trimester of pregnancy is expected to be of significant value in assessing complications in pregnancy such as an increased risk of preterm birth, a low birth weight or being small for gestational age (SGA) at birth [1,2,3]. The differences between normal and abnormal growth in early pregnancy are small if the fetal size is measured by the crown-rump-length (CRL) [1,4,5].Three-dimensional ultrasound (3DUS) volume measurements might give more information about fetal development than two-dimensional ultrasound (2DUS) measurements. Fetal volume (FV) measurements were subject of earlier studies, these measurements proved to be reliable and reproducible [6,7,8], even in twins [9,10]. A significant correlation between FV and the CRL is already confirmed, with an up to 35-fold increase of the FV and a 4.5-fold increase of the CRL in the first trimester of pregnancy [6,7,9,11,12]. As the FV rises 7 times faster than the CRL, it can be expected that slight abnormalities in the CRL will be more obvious in FV measurements. Falcon et al. reported that the chromosomal abnormal fetus has a significant smaller FV (10-15%) than the chromosomal normal fetus whereas the CRL in trisomy 21 and Turner syndrome were normal [7,12]. These findings suggest that it is possible to detect early growth impairment with FV measurements, in cases with a normal CRL. Detection of the fetus with a small FV might result in an earlier detection of high risk pregnancies. Despite these promising results, FV measurements with 3DUS are still not used in the daily practice. This is understandable, as the current methods for 3DUS volume measurements are not fit for the daily practice, because the measurements are time consuming and rather difficult to perform.Recently new methods for 3DUS volume measurements became available. Such as XI-VOCAL, Sono-AVC and the measurements in I-space with V-scope. We tried to use XI-VOCAL and Sono-AVC for FV calculations at twelve weeks of gestational age, our efforts were unsuccessful. V-scope is not yet generally available. Only Rousian et al. reported of FV measurements with this new technique [31]. Rousian et al. also compared the different methods for volume measurements, VOCAL, inversion mode, SonoAVC and V-Scope [32]. They concluded that VOCAL and inversion mode are useful for volume measurements of hypo-echoic structures. Sono-AVC appears to underestimate the volume, as is confirmed by Sur et al [33]. So, all these new developed techniques are not suited for FV measurements in the daily practice.The goal of this study was to perform explorative research in order to develop a more practical semi-automated method for volume calculations with 3DUS images. This new method will enable the sonographer to calculate the volume of an object only by pointing out the grey value of the voxels of interest. First the method was developed and tested in vitro. Secondly the method was tested in vivo on the dataset of a first trimester fetus.
45
Ch
ap
ter
4
Semi-automated volume measurements
Proefschrift Nicol.indb 45 4-10-2012 14:34:05
Methods
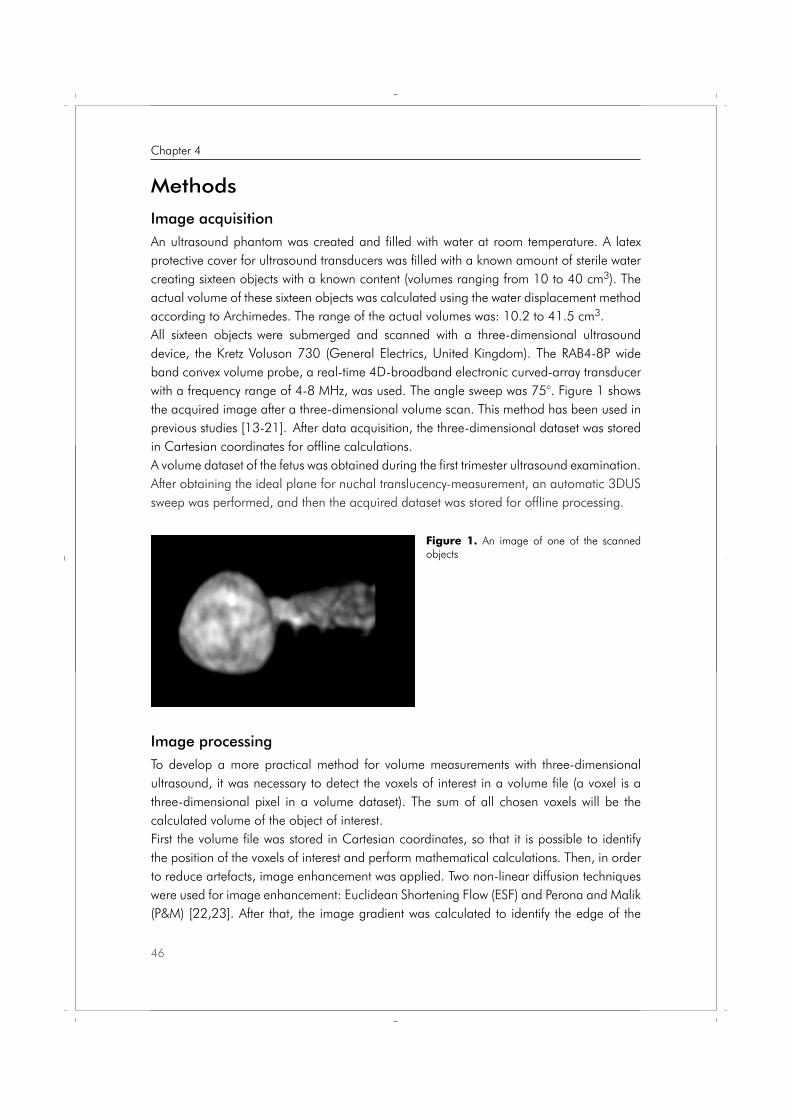
Image acquisitionAn ultrasound phantom was created and filled with water at room temperature. A latex protective cover for ultrasound transducers was filled with a known amount of sterile water creating sixteen objects with a known content (volumes ranging from 10 to 40 cm3). The actual volume of these sixteen objects was calculated using the water displacement method according to Archimedes. The range of the actual volumes was: 10.2 to 41.5 cm3. All sixteen objects were submerged and scanned with a three-dimensional ultrasound device, the Kretz Voluson 730 (General Electrics, United Kingdom). The RAB4-8P wide band convex volume probe, a real-time 4D-broadband electronic curved-array transducer with a frequency range of 4-8 MHz, was used. The angle sweep was 75°. Figure 1 shows the acquired image after a three-dimensional volume scan. This method has been used in previous studies [13-21]. After data acquisition, the three-dimensional dataset was stored in Cartesian coordinates for offline calculations. A volume dataset of the fetus was obtained during the first trimester ultrasound examination. After obtaining the ideal plane for nuchal translucency-measurement, an automatic 3DUS sweep was performed, and then the acquired dataset was stored for offline processing.
Image processingTo develop a more practical method for volume measurements with three-dimensional ultrasound, it was necessary to detect the voxels of interest in a volume file (a voxel is a three-dimensional pixel in a volume dataset). The sum of all chosen voxels will be the calculated volume of the object of interest. First the volume file was stored in Cartesian coordinates, so that it is possible to identify the position of the voxels of interest and perform mathematical calculations. Then, in order to reduce artefacts, image enhancement was applied. Two non-linear diffusion techniques were used for image enhancement: Euclidean Shortening Flow (ESF) and Perona and Malik (P&M) [22,23]. After that, the image gradient was calculated to identify the edge of the
Figure 1. An image of one of the scanned objects
46
Chapter 4
Proefschrift Nicol.indb 46 4-10-2012 14:34:05
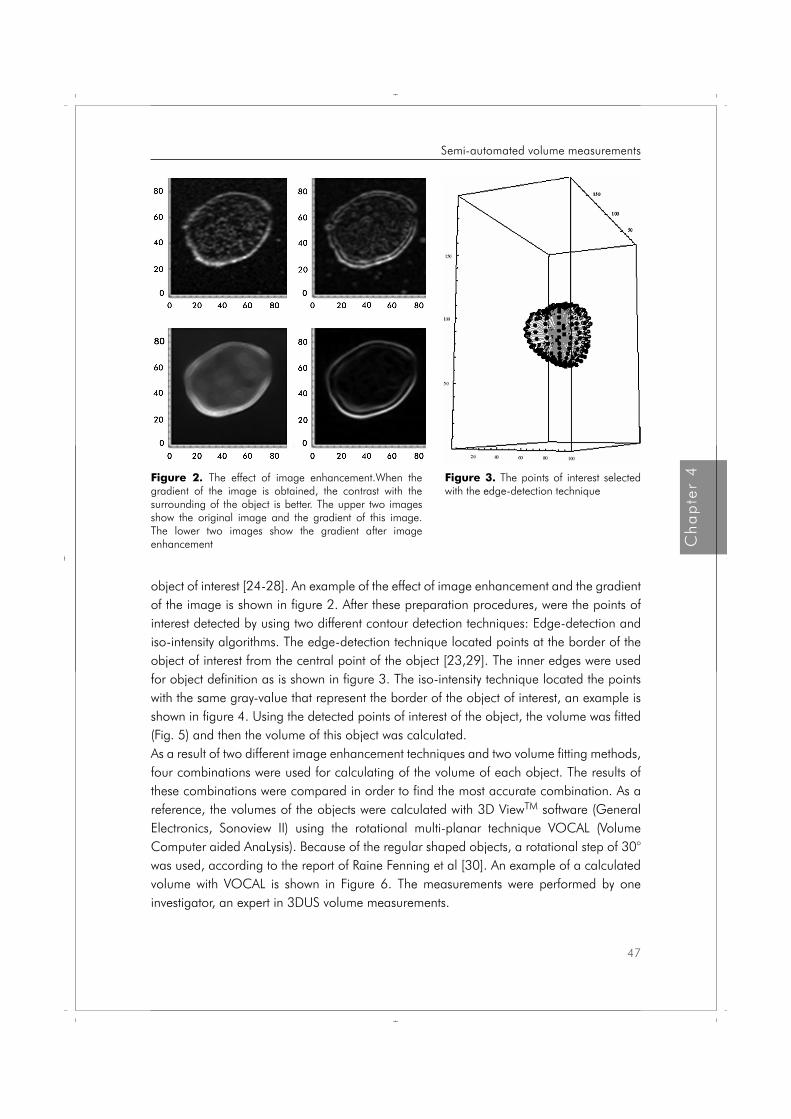
object of interest [24-28]. An example of the effect of image enhancement and the gradient of the image is shown in figure 2. After these preparation procedures, were the points of interest detected by using two different contour detection techniques: Edge-detection and iso-intensity algorithms. The edge-detection technique located points at the border of the object of interest from the central point of the object [23,29]. The inner edges were used for object definition as is shown in figure 3. The iso-intensity technique located the points with the same gray-value that represent the border of the object of interest, an example is shown in figure 4. Using the detected points of interest of the object, the volume was fitted (Fig. 5) and then the volume of this object was calculated. As a result of two different image enhancement techniques and two volume fitting methods, four combinations were used for calculating of the volume of each object. The results of these combinations were compared in order to find the most accurate combination. As a reference, the volumes of the objects were calculated with 3D ViewTM software (General Electronics, Sonoview II) using the rotational multi-planar technique VOCAL (Volume Computer aided AnaLysis). Because of the regular shaped objects, a rotational step of 30° was used, according to the report of Raine Fenning et al [30]. An example of a calculated volume with VOCAL is shown in Figure 6. The measurements were performed by one investigator, an expert in 3DUS volume measurements.
Figure 2. The effect of image enhancement.When the gradient of the image is obtained, the contrast with the surrounding of the object is better. The upper two images show the original image and the gradient of this image. The lower two images show the gradient after image enhancement
Figure 3. The points of interest selected with the edge-detection technique
47
Ch
ap
ter
4
Semi-automated volume measurements
Proefschrift Nicol.indb 47 4-10-2012 14:34:06
Statistical analysisFor the statistical analysis SPSSTM (Chicago Illinois, USA) version 13.0 for Windows was used. Bland and Altman plots were created to calculate the individual agreement of the five measurement methods (4 mathematical and the VOCAL method for volume calculation) with the actual volume.
Results
Three of the sixteen datasets appeared of insufficient quality, it was not possible to mathematical calculate the volume. With VOCAL all objects could be measured.
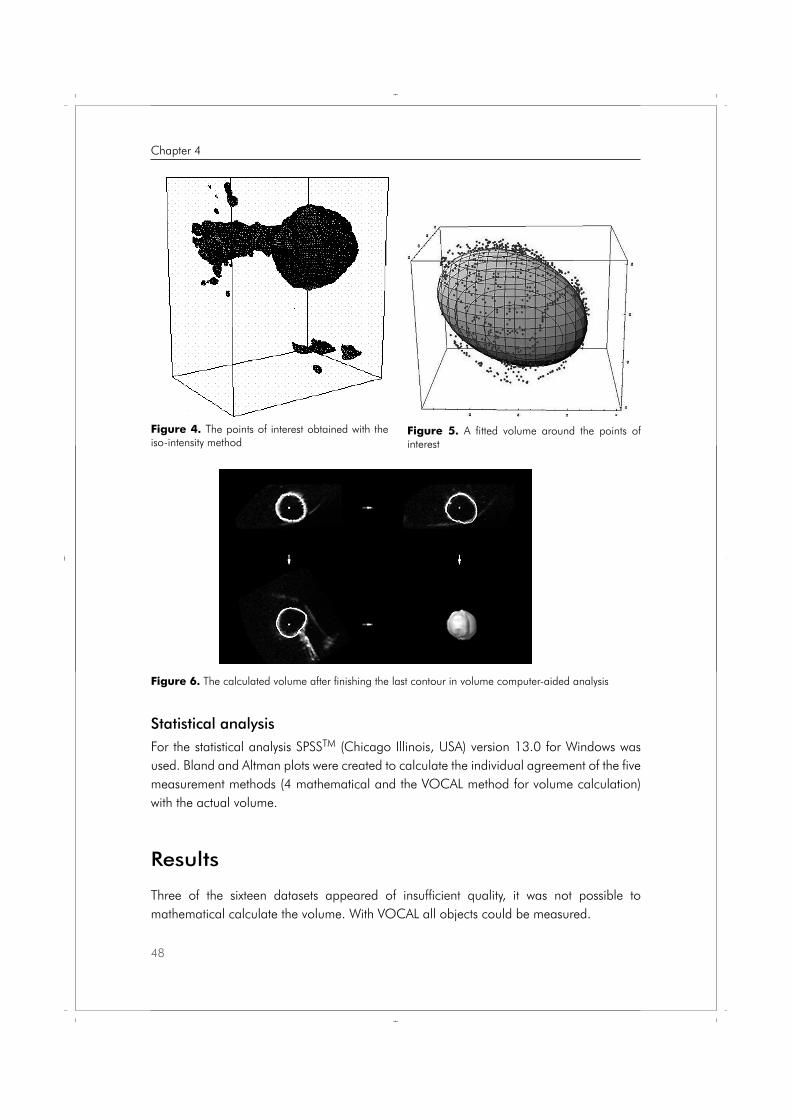
Figure 4. The points of interest obtained with the iso-intensity method
Figure 5. A fitted volume around the points of interest
Figure 6. The calculated volume after finishing the last contour in volume computer-aided analysis
48
Chapter 4
Proefschrift Nicol.indb 48 4-10-2012 14:34:06
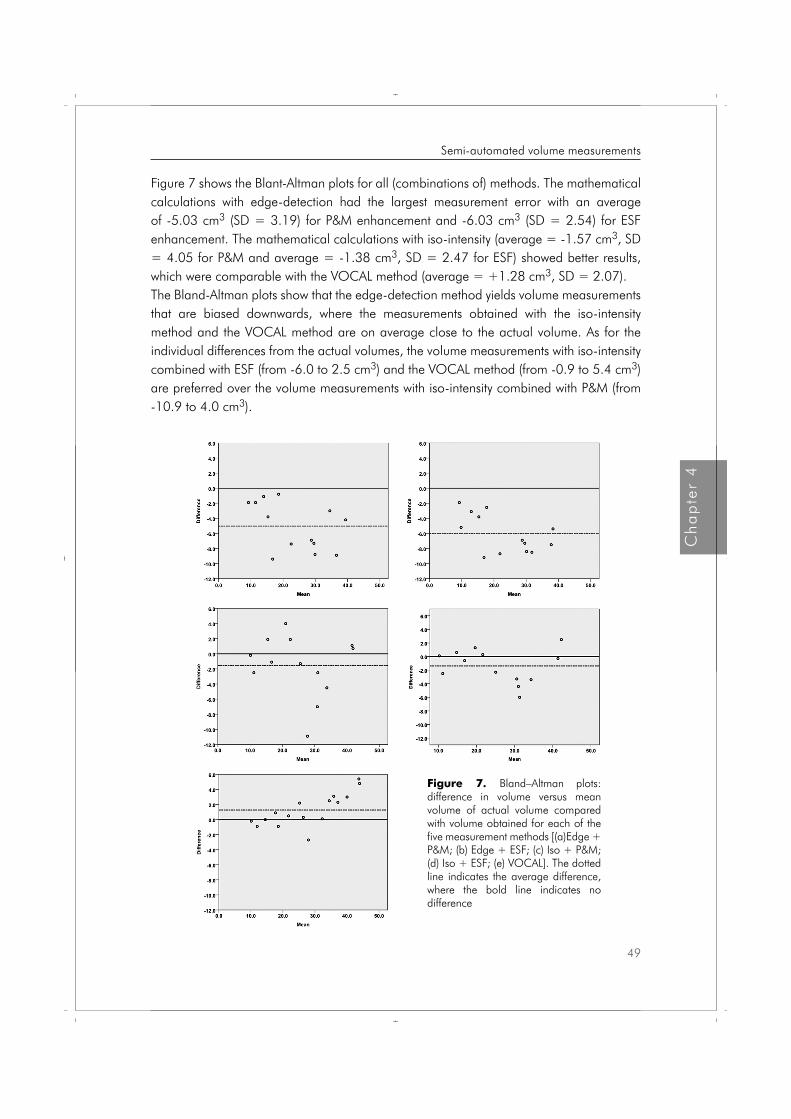
Figure 7 shows the Blant-Altman plots for all (combinations of) methods. The mathematical calculations with edge-detection had the largest measurement error with an average of -5.03 cm3 (SD = 3.19) for P&M enhancement and -6.03 cm3 (SD = 2.54) for ESF enhancement. The mathematical calculations with iso-intensity (average = -1.57 cm3, SD = 4.05 for P&M and average = -1.38 cm3, SD = 2.47 for ESF) showed better results, which were comparable with the VOCAL method (average = +1.28 cm3, SD = 2.07). The Bland-Altman plots show that the edge-detection method yields volume measurements that are biased downwards, where the measurements obtained with the iso-intensity method and the VOCAL method are on average close to the actual volume. As for the individual differences from the actual volumes, the volume measurements with iso-intensity combined with ESF (from -6.0 to 2.5 cm3) and the VOCAL method (from -0.9 to 5.4 cm3) are preferred over the volume measurements with iso-intensity combined with P&M (from -10.9 to 4.0 cm3).
Figure 7. Bland–Altman plots: difference in volume versus mean volume of actual volume compared with volume obtained for each of the five measurement methods [(a)Edge + P&M; (b) Edge + ESF; (c) Iso + P&M; (d) Iso + ESF; (e) VOCAL]. The dotted line indicates the average difference, where the bold line indicates no difference
49
Ch
ap
ter
4
Semi-automated volume measurements
Proefschrift Nicol.indb 49 4-10-2012 14:34:07
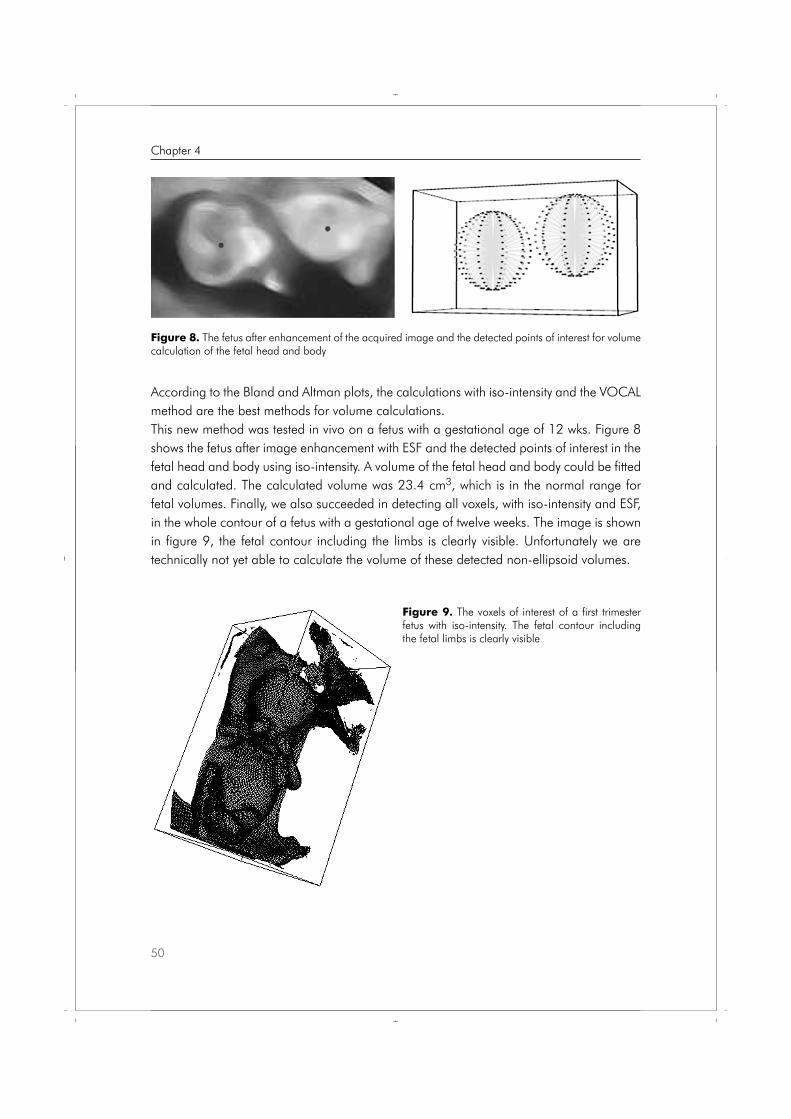
According to the Bland and Altman plots, the calculations with iso-intensity and the VOCAL method are the best methods for volume calculations.This new method was tested in vivo on a fetus with a gestational age of 12 wks. Figure 8 shows the fetus after image enhancement with ESF and the detected points of interest in the fetal head and body using iso-intensity. A volume of the fetal head and body could be fitted and calculated. The calculated volume was 23.4 cm3, which is in the normal range for fetal volumes. Finally, we also succeeded in detecting all voxels, with iso-intensity and ESF, in the whole contour of a fetus with a gestational age of twelve weeks. The image is shown in figure 9, the fetal contour including the limbs is clearly visible. Unfortunately we are technically not yet able to calculate the volume of these detected non-ellipsoid volumes.
Figure 8. The fetus after enhancement of the acquired image and the detected points of interest for volume calculation of the fetal head and body
Figure 9. The voxels of interest of a first trimester fetus with iso-intensity. The fetal contour including the fetal limbs is clearly visible
50
Chapter 4
Proefschrift Nicol.indb 50 4-10-2012 14:34:08

Discussion
The goal of this study was to perform explorative research in order to develop and verify a more practical semi-automated method for volume calculations with 3DUS images. The results of this study show that mathematical volume calculations are possible with the semi-automated method. There is a structural underestimation of the volume with this method, possibly because of the detection of the inner contour of the object. The VOCAL technique has a structural overestimation of the volume, probably caused by blurring of the contours of the object. It was not possible to calculate the volume of three objects with the new method while all volumes were calculated with the VOCAL technique. The logic explanation for this is that a mathematical method only detects raw data, whereas the human brain is able to fill in the logic ‘blanks’ while drawing the contour of the object of interest. This means that this method will need some manual support in some cases of low quality images. Overall resulting in a faster method for volume calculations with less human effort.In the future, new software that recognizes the expected shape of the measured object and automatically fills in the logic blanks in the image could be added to improve the performance of this new method. Unfortunately, the main limitation of the mathematical method is that it is only possible to calculate the volume of an ellipsoid structure. In order to be able to calculate the volume of irregular objects we intent to use the spherical harmonics technique in the future.Furthermore, we were able to apply this new method on a fetus with a gestational age of 12 wks. With iso-intensity for image enhancement and ESF for detecting the points of interest at the contour of the fetal head and body, as shown in figure 9. The calculated fetal volume was 23.4 cm3, which is in the normal range for fetal volumes at twelve weeks of gestation.Finally, we also succeeded in detecting voxels in the whole contour of a fetus, including the limbs, with a gestational age of twelve weeks as is clearly visible in figure 9. To our knowledge, this is the first report of detecting the voxels of a whole fetal contour by computer calculations. Unfortunately we are not yet able to calculate the volume of these detected (non-ellipsoid) volumes. Further development of this method using spherical harmonics might succeed in calculating the volume of irregular objects.
Conclusion
We were able to perform mathematical volume calculations with three-dimensional datasets. This new developed method is, despite its limitations at this moment, promising for future use in the daily practice and earns further development.
51
Ch
ap
ter
4
Semi-automated volume measurements
Proefschrift Nicol.indb 51 4-10-2012 14:34:08
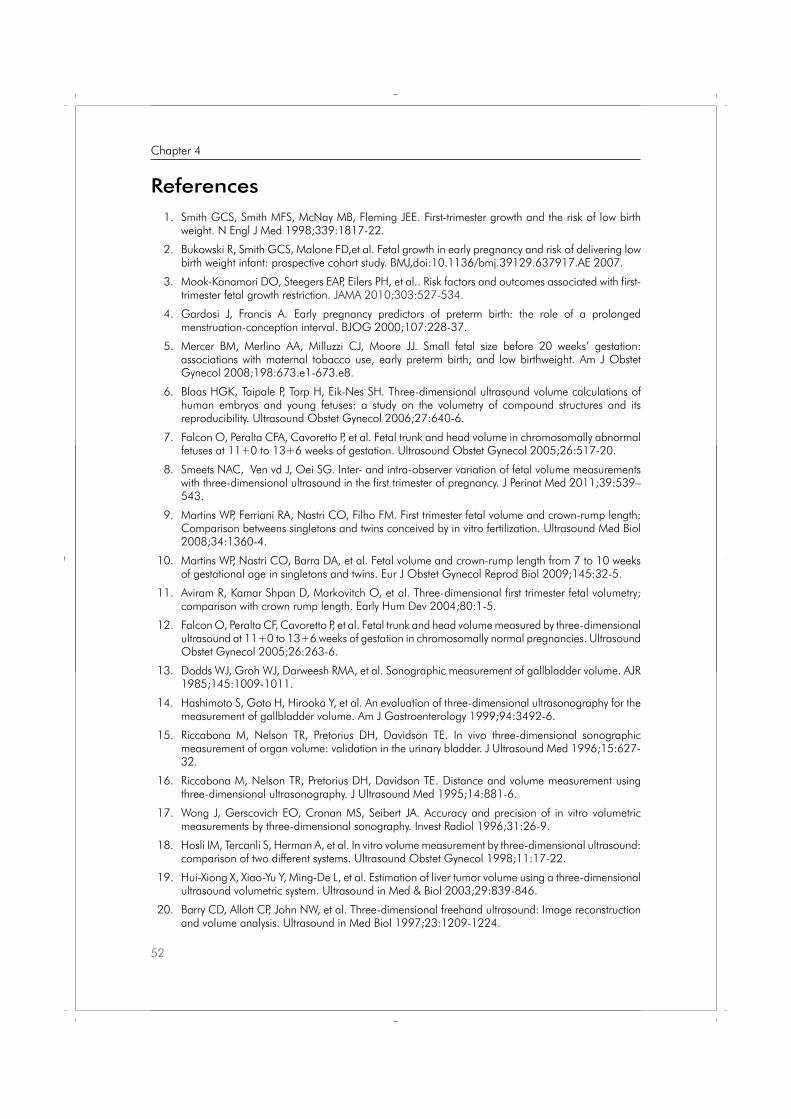
References 1. Smith GCS, Smith MFS, McNay MB, Fleming JEE. First-trimester growth and the risk of low birth
weight. N Engl J Med 1998;339:1817-22.
2. Bukowski R, Smith GCS, Malone FD,et al. Fetal growth in early pregnancy and risk of delivering low birth weight infant: prospective cohort study. BMJ,doi:10.1136/bmj.39129.637917.AE 2007.
3. Mook-Kanamori DO, Steegers EAP, Eilers PH, et al.. Risk factors and outcomes associated with first-trimester fetal growth restriction. JAMA 2010;303:527-534.
4. Gardosi J, Francis A. Early pregnancy predictors of preterm birth: the role of a prolonged menstruation-conception interval. BJOG 2000;107:228-37.
5. Mercer BM, Merlino AA, Milluzzi CJ, Moore JJ. Small fetal size before 20 weeks’ gestation: associations with maternal tobacco use, early preterm birth, and low birthweight. Am J Obstet Gynecol 2008;198:673.e1-673.e8.
6. Blaas HGK, Taipale P, Torp H, Eik-Nes SH. Three-dimensional ultrasound volume calculations of human embryos and young fetuses: a study on the volumetry of compound structures and its reproducibility. Ultrasound Obstet Gynecol 2006;27:640-6.
7. Falcon O, Peralta CFA, Cavoretto P, et al. Fetal trunk and head volume in chromosomally abnormal fetuses at 11+0 to 13+6 weeks of gestation. Ultrasound Obstet Gynecol 2005;26:517-20.
8. Smeets NAC, Ven vd J, Oei SG. Inter- and intra-observer variation of fetal volume measurements with three-dimensional ultrasound in the first trimester of pregnancy. J Perinat Med 2011;39:539–543.
9. Martins WP, Ferriani RA, Nastri CO, Filho FM. First trimester fetal volume and crown-rump length: Comparison betweens singletons and twins conceived by in vitro fertilization. Ultrasound Med Biol 2008;34:1360-4.
10. Martins WP, Nastri CO, Barra DA, et al. Fetal volume and crown-rump length from 7 to 10 weeks of gestational age in singletons and twins. Eur J Obstet Gynecol Reprod Biol 2009;145:32-5.
11. Aviram R, Kamar Shpan D, Markovitch O, et al. Three-dimensional first trimester fetal volumetry; comparison with crown rump length. Early Hum Dev 2004;80:1-5.
12. Falcon O, Peralta CF, Cavoretto P, et al. Fetal trunk and head volume measured by three-dimensional ultrasound at 11+0 to 13+6 weeks of gestation in chromosomally normal pregnancies. Ultrasound Obstet Gynecol 2005;26:263-6.
13. Dodds WJ, Groh WJ, Darweesh RMA, et al. Sonographic measurement of gallbladder volume. AJR 1985;145:1009-1011.
14. Hashimoto S, Goto H, Hirooka Y, et al. An evaluation of three-dimensional ultrasonography for the measurement of gallbladder volume. Am J Gastroenterology 1999;94:3492-6.
15. Riccabona M, Nelson TR, Pretorius DH, Davidson TE. In vivo three-dimensional sonographic measurement of organ volume: validation in the urinary bladder. J Ultrasound Med 1996;15:627-32.
16. Riccabona M, Nelson TR, Pretorius DH, Davidson TE. Distance and volume measurement using three-dimensional ultrasonography. J Ultrasound Med 1995;14:881-6.
17. Wong J, Gerscovich EO, Cronan MS, Seibert JA. Accuracy and precision of in vitro volumetric measurements by three-dimensional sonography. Invest Radiol 1996;31:26-9.
18. Hosli IM, Tercanli S, Herman A, et al. In vitro volume measurement by three-dimensional ultrasound: comparison of two different systems. Ultrasound Obstet Gynecol 1998;11:17-22.
19. Hui-Xiong X, Xiao-Yu Y, Ming-De L, et al. Estimation of liver tumor volume using a three-dimensional ultrasound volumetric system. Ultrasound in Med & Biol 2003;29:839-846.
20. Barry CD, Allott CP, John NW, et al. Three-dimensional freehand ultrasound: Image reconstruction and volume analysis. Ultrasound in Med Biol 1997;23:1209-1224.
52
Chapter 4
Proefschrift Nicol.indb 52 4-10-2012 14:34:08
21. Farrell T, Leslie JR, Chien PFW, Agustsson P. The reliability and validity of three dimensional ultrasound volumetric measurements using an in vitro balloon an in vivo uterine model. BJOG 2001;108:573-582.
22. Alvares L, Lions PL, Morel JM, Image selective smoothing and edge detection by nonlinear diffusion. SIAM Journal of Numerical Analysis 1992;29:845-866.
23. Perona P and Malik J. Scale-space and edge detection using anisotropic diffusion. IEEE Transactions on pattern analysis and machine intelligence 1990;12:629-639.
24. Bankman N, Handbook of medical imaging: processing and analysis. Academic Press: London, 2000.
25. Wolfram Library Archive. http://www.library.wolfram.com/infocenter.
26. Jankowski M, Linear and morphological image processing. Mathematica Journal 2001;8:147-159.
27. Fitzpatrick JM, Sonka M, Handbook of medical maging Vol. 2: Medical image processing and analysis. SPIE Press: Bellingham,2000.
28. Young I, Gerbrands J, van Vliet L, Fundamentals of image processing. Delft University of Technology, 1998.
29. B.M. ter Haar Romeny, Front-End Vision and Multi-Scale Image Analysis, Kluwer Academic Publishers: Dordrecht, 2003.
30. Raine-Fenning NJ, Clewes JS, Kendall NR, et al. The interobserver reliability and validity of volume calculation from three-dimensional ultrasound datasets in the in vitro setting. Ultrasound Obstet Gynecol 2003;21:283–91.
31. Rousian M, Koning AH, van Oppenraaij RH, et al. An innovative virtual reality technique for automated human embryonic volume measurements. Hum Reprod 2010;25:2210-6.
32. Rousian M, Verwoerd-Dikkeboom CM, Koning AH, et al. Early pregnancy volume measurements: Validation of ultrasound techniques and new perspectives. BJOG 2009;116:278-85.
33. Sur S, Marsh A, Campbell B, Raine-Fenning N. Re: Gestational sac volume: comparison between SonoAVC and VOCAL measurements at 11 + 0 to 13 + 6 weeks of gestation.Ultrasound Obstet Gynecol. 2010 Nov;36:648-9; author reply 649-51.
53
Ch
ap
ter
4
Semi-automated volume measurements
Proefschrift Nicol.indb 53 4-10-2012 14:34:08

Proefschrift Nicol.indb 54 4-10-2012 14:34:08

Nicol AC Smeets
Joost van de Ven
S Guid Oei
J Perinat Med 2011;39:539–543
Inter- and intraobserver variation of fetal volume measurements with three-dimensional ultrasound in the first trimester of pregnancy
Chapter 5
Proefschrift Nicol.indb 55 4-10-2012 14:34:08
Abstract
Aims: The aim of this study is to determine the inter- and intraobserver variation of volume calculations of human fetuses at a gestational age of 11+0 – 13+6 weeks by three-dimensional ultrasound (3DUS).
Methods: 3DUS datasets were acquired during nuchal translucency measurements. The fetal volume was measured in 65 cases by two independent investigators. The Virtual Organ Computer aided AnaLysis (VOCAL™) imaging software was used to manually calculate the fetal volume (rotational step 9°). Inter- and intraobserver variation were assessed by Bland-Altman plots and Intraclass Correlation Coefficients (ICC).
Results: Both inter- and intraobserver reproducibility were highly reliable as shown by the Bland-Altman plots and an ICC of respectively 0.934 and 0.994.
Conclusion: Fetal volume calculation by 3DUS with VOCAL and a rotational step of 9° is feasible and has a high inter- and intraobserver reliability in the first trimester of pregnancy.
56
Chapter 5
Proefschrift Nicol.indb 56 4-10-2012 14:34:09
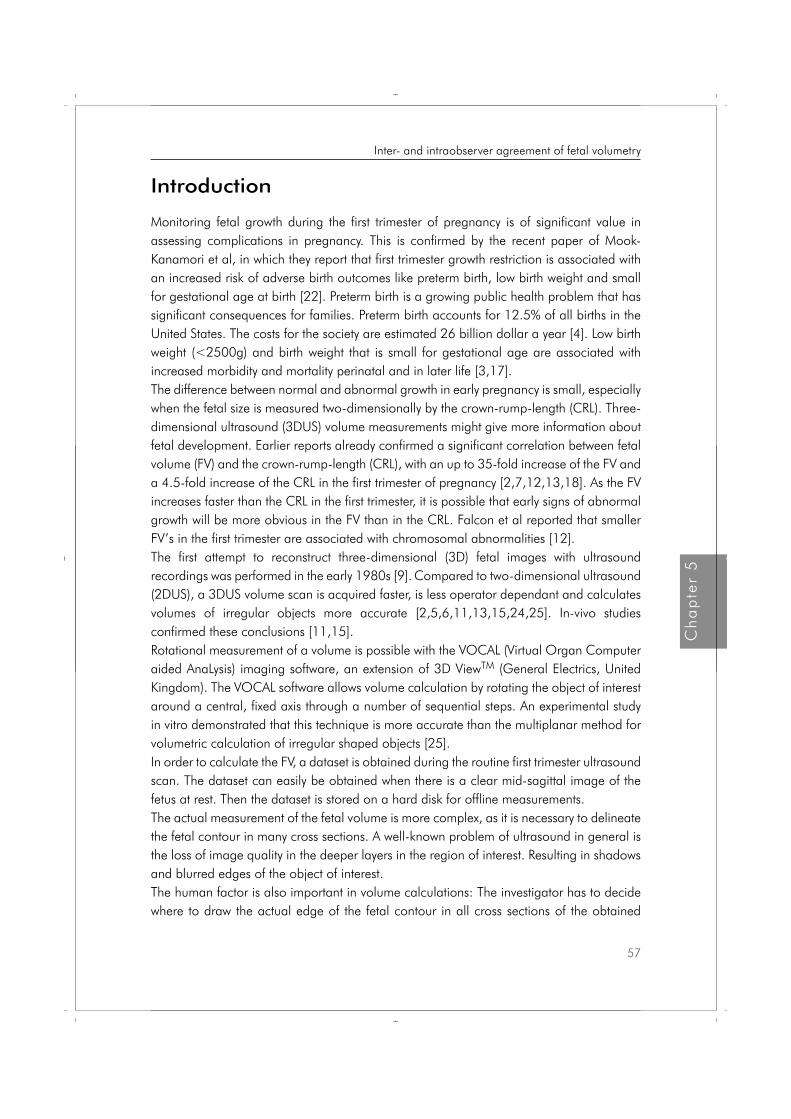
Introduction
Monitoring fetal growth during the first trimester of pregnancy is of significant value in assessing complications in pregnancy. This is confirmed by the recent paper of Mook-Kanamori et al, in which they report that first trimester growth restriction is associated with an increased risk of adverse birth outcomes like preterm birth, low birth weight and small for gestational age at birth [22]. Preterm birth is a growing public health problem that has significant consequences for families. Preterm birth accounts for 12.5% of all births in the United States. The costs for the society are estimated 26 billion dollar a year [4]. Low birth weight (<2500g) and birth weight that is small for gestational age are associated with increased morbidity and mortality perinatal and in later life [3,17]. The difference between normal and abnormal growth in early pregnancy is small, especially when the fetal size is measured two-dimensionally by the crown-rump-length (CRL). Three-dimensional ultrasound (3DUS) volume measurements might give more information about fetal development. Earlier reports already confirmed a significant correlation between fetal volume (FV) and the crown-rump-length (CRL), with an up to 35-fold increase of the FV and a 4.5-fold increase of the CRL in the first trimester of pregnancy [2,7,12,13,18]. As the FV increases faster than the CRL in the first trimester, it is possible that early signs of abnormal growth will be more obvious in the FV than in the CRL. Falcon et al reported that smaller FV’s in the first trimester are associated with chromosomal abnormalities [12].The first attempt to reconstruct three-dimensional (3D) fetal images with ultrasound recordings was performed in the early 1980s [9]. Compared to two-dimensional ultrasound (2DUS), a 3DUS volume scan is acquired faster, is less operator dependant and calculates volumes of irregular objects more accurate [2,5,6,11,13,15,24,25]. In-vivo studies confirmed these conclusions [11,15].
Rotational measurement of a volume is possible with the VOCAL (Virtual Organ Computer aided AnaLysis) imaging software, an extension of 3D ViewTM (General Electrics, United Kingdom). The VOCAL software allows volume calculation by rotating the object of interest around a central, fixed axis through a number of sequential steps. An experimental study in vitro demonstrated that this technique is more accurate than the multiplanar method for volumetric calculation of irregular shaped objects [25]. In order to calculate the FV, a dataset is obtained during the routine first trimester ultrasound scan. The dataset can easily be obtained when there is a clear mid-sagittal image of the fetus at rest. Then the dataset is stored on a hard disk for offline measurements. The actual measurement of the fetal volume is more complex, as it is necessary to delineate the fetal contour in many cross sections. A well-known problem of ultrasound in general is the loss of image quality in the deeper layers in the region of interest. Resulting in shadows and blurred edges of the object of interest. The human factor is also important in volume calculations: The investigator has to decide where to draw the actual edge of the fetal contour in all cross sections of the obtained
57
Ch
ap
ter
5
Inter- and intraobserver agreement of fetal volumetry
Proefschrift Nicol.indb 57 4-10-2012 14:34:09
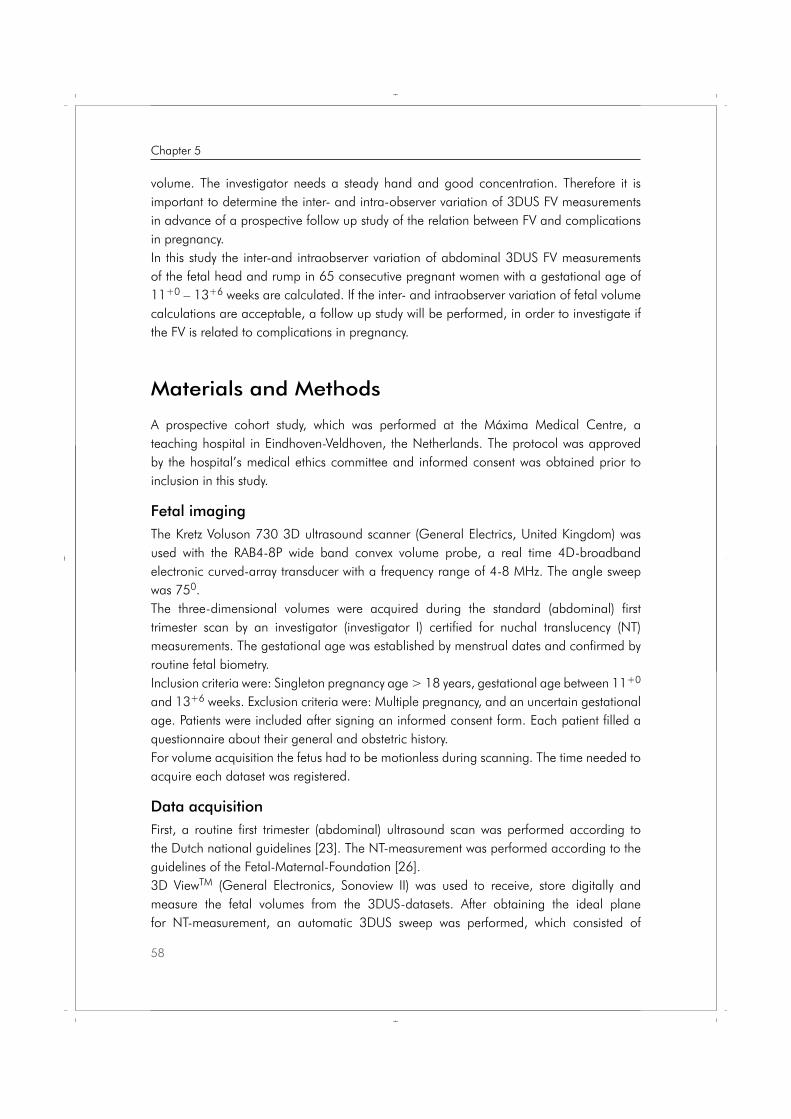
volume. The investigator needs a steady hand and good concentration. Therefore it is important to determine the inter- and intra-observer variation of 3DUS FV measurements in advance of a prospective follow up study of the relation between FV and complications in pregnancy.In this study the inter-and intraobserver variation of abdominal 3DUS FV measurements of the fetal head and rump in 65 consecutive pregnant women with a gestational age of 11+0 – 13+6 weeks are calculated. If the inter- and intraobserver variation of fetal volume calculations are acceptable, a follow up study will be performed, in order to investigate if the FV is related to complications in pregnancy.
Materials and Methods
A prospective cohort study, which was performed at the Máxima Medical Centre, a teaching hospital in Eindhoven-Veldhoven, the Netherlands. The protocol was approved by the hospital’s medical ethics committee and informed consent was obtained prior to inclusion in this study.
Fetal imaging The Kretz Voluson 730 3D ultrasound scanner (General Electrics, United Kingdom) was used with the RAB4-8P wide band convex volume probe, a real time 4D-broadband electronic curved-array transducer with a frequency range of 4-8 MHz. The angle sweep was 750. The three-dimensional volumes were acquired during the standard (abdominal) first trimester scan by an investigator (investigator I) certified for nuchal translucency (NT) measurements. The gestational age was established by menstrual dates and confirmed by routine fetal biometry. Inclusion criteria were: Singleton pregnancy age > 18 years, gestational age between 11+0 and 13+6 weeks. Exclusion criteria were: Multiple pregnancy, and an uncertain gestational age. Patients were included after signing an informed consent form. Each patient filled a questionnaire about their general and obstetric history. For volume acquisition the fetus had to be motionless during scanning. The time needed to acquire each dataset was registered.
Data acquisitionFirst, a routine first trimester (abdominal) ultrasound scan was performed according to the Dutch national guidelines [23]. The NT-measurement was performed according to the guidelines of the Fetal-Maternal-Foundation [26]. 3D ViewTM (General Electronics, Sonoview II) was used to receive, store digitally and measure the fetal volumes from the 3DUS-datasets. After obtaining the ideal plane for NT-measurement, an automatic 3DUS sweep was performed, which consisted of
58
Chapter 5
Proefschrift Nicol.indb 58 4-10-2012 14:34:09
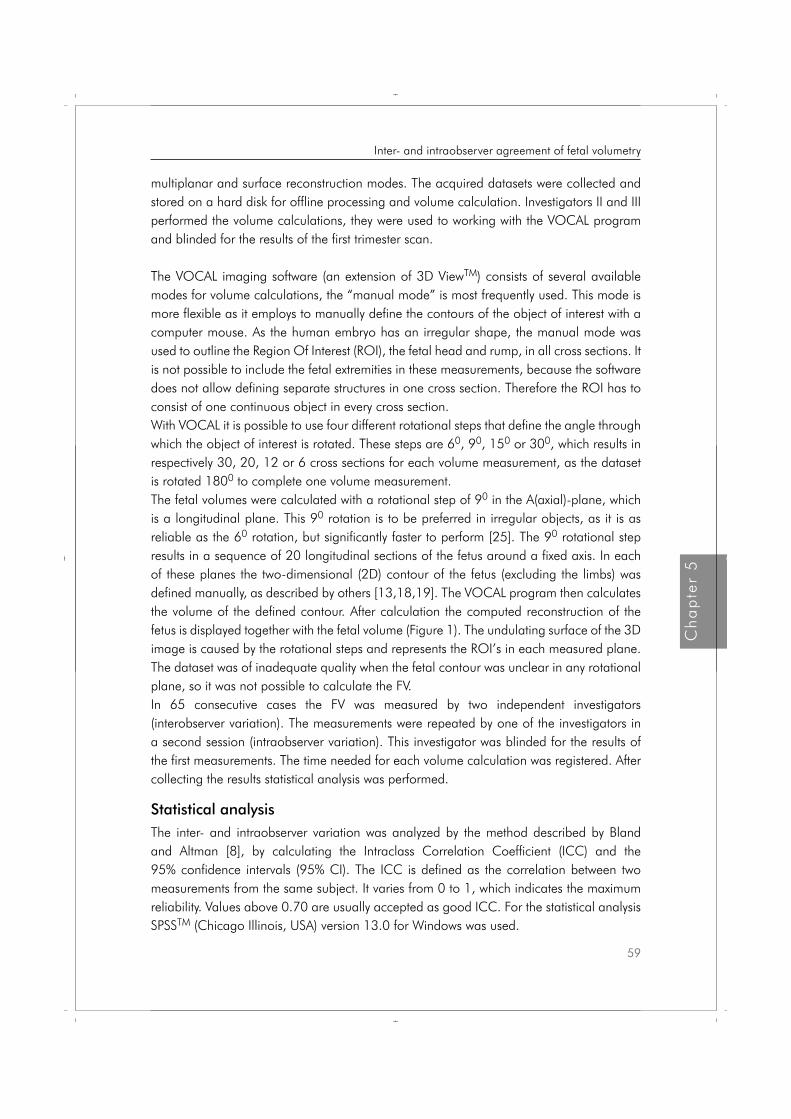
multiplanar and surface reconstruction modes. The acquired datasets were collected and stored on a hard disk for offline processing and volume calculation. Investigators II and III performed the volume calculations, they were used to working with the VOCAL program and blinded for the results of the first trimester scan.
The VOCAL imaging software (an extension of 3D ViewTM) consists of several available modes for volume calculations, the “manual mode” is most frequently used. This mode is more flexible as it employs to manually define the contours of the object of interest with a computer mouse. As the human embryo has an irregular shape, the manual mode was used to outline the Region Of Interest (ROI), the fetal head and rump, in all cross sections. It is not possible to include the fetal extremities in these measurements, because the software does not allow defining separate structures in one cross section. Therefore the ROI has to consist of one continuous object in every cross section. With VOCAL it is possible to use four different rotational steps that define the angle through which the object of interest is rotated. These steps are 60, 90, 150 or 300, which results in respectively 30, 20, 12 or 6 cross sections for each volume measurement, as the dataset is rotated 1800 to complete one volume measurement.The fetal volumes were calculated with a rotational step of 90 in the A(axial)-plane, which is a longitudinal plane. This 90 rotation is to be preferred in irregular objects, as it is as reliable as the 60 rotation, but significantly faster to perform [25]. The 90 rotational step results in a sequence of 20 longitudinal sections of the fetus around a fixed axis. In each of these planes the two-dimensional (2D) contour of the fetus (excluding the limbs) was defined manually, as described by others [13,18,19]. The VOCAL program then calculates the volume of the defined contour. After calculation the computed reconstruction of the fetus is displayed together with the fetal volume (Figure 1). The undulating surface of the 3D image is caused by the rotational steps and represents the ROI’s in each measured plane. The dataset was of inadequate quality when the fetal contour was unclear in any rotational plane, so it was not possible to calculate the FV.In 65 consecutive cases the FV was measured by two independent investigators (interobserver variation). The measurements were repeated by one of the investigators in a second session (intraobserver variation). This investigator was blinded for the results of the first measurements. The time needed for each volume calculation was registered. After collecting the results statistical analysis was performed.
Statistical analysisThe inter- and intraobserver variation was analyzed by the method described by Bland and Altman [8], by calculating the Intraclass Correlation Coefficient (ICC) and the 95% confidence intervals (95% CI). The ICC is defined as the correlation between two measurements from the same subject. It varies from 0 to 1, which indicates the maximum reliability. Values above 0.70 are usually accepted as good ICC. For the statistical analysis SPSSTM (Chicago Illinois, USA) version 13.0 for Windows was used.
59
Ch
ap
ter
5
Inter- and intraobserver agreement of fetal volumetry
Proefschrift Nicol.indb 59 4-10-2012 14:34:09
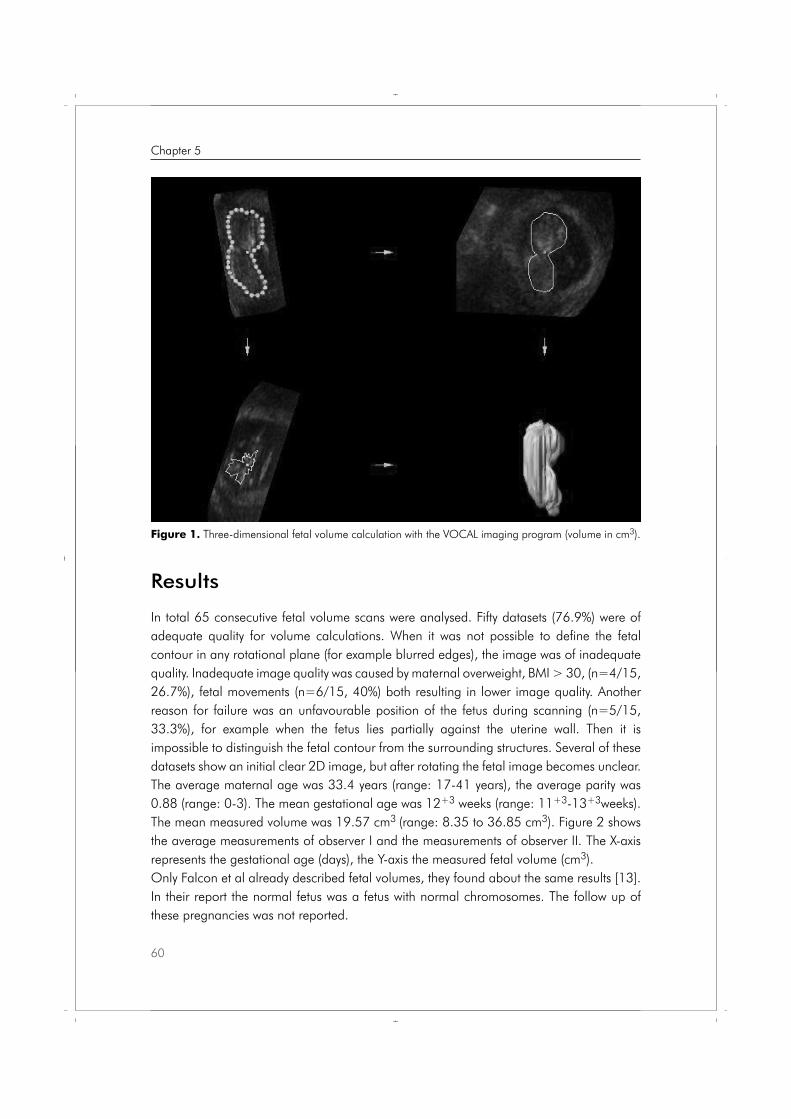
Results
In total 65 consecutive fetal volume scans were analysed. Fifty datasets (76.9%) were of adequate quality for volume calculations. When it was not possible to define the fetal contour in any rotational plane (for example blurred edges), the image was of inadequate quality. Inadequate image quality was caused by maternal overweight, BMI > 30, (n=4/15, 26.7%), fetal movements (n=6/15, 40%) both resulting in lower image quality. Another reason for failure was an unfavourable position of the fetus during scanning (n=5/15, 33.3%), for example when the fetus lies partially against the uterine wall. Then it is impossible to distinguish the fetal contour from the surrounding structures. Several of these datasets show an initial clear 2D image, but after rotating the fetal image becomes unclear.The average maternal age was 33.4 years (range: 17-41 years), the average parity was 0.88 (range: 0-3). The mean gestational age was 12+3 weeks (range: 11+3-13+3weeks). The mean measured volume was 19.57 cm3 (range: 8.35 to 36.85 cm3). Figure 2 shows the average measurements of observer I and the measurements of observer II. The X-axis represents the gestational age (days), the Y-axis the measured fetal volume (cm3). Only Falcon et al already described fetal volumes, they found about the same results [13]. In their report the normal fetus was a fetus with normal chromosomes. The follow up of these pregnancies was not reported.
60
Chapter 5
Figure 1. Three-dimensional fetal volume calculation with the VOCAL imaging program (volume in cm3).
Proefschrift Nicol.indb 60 4-10-2012 14:34:09
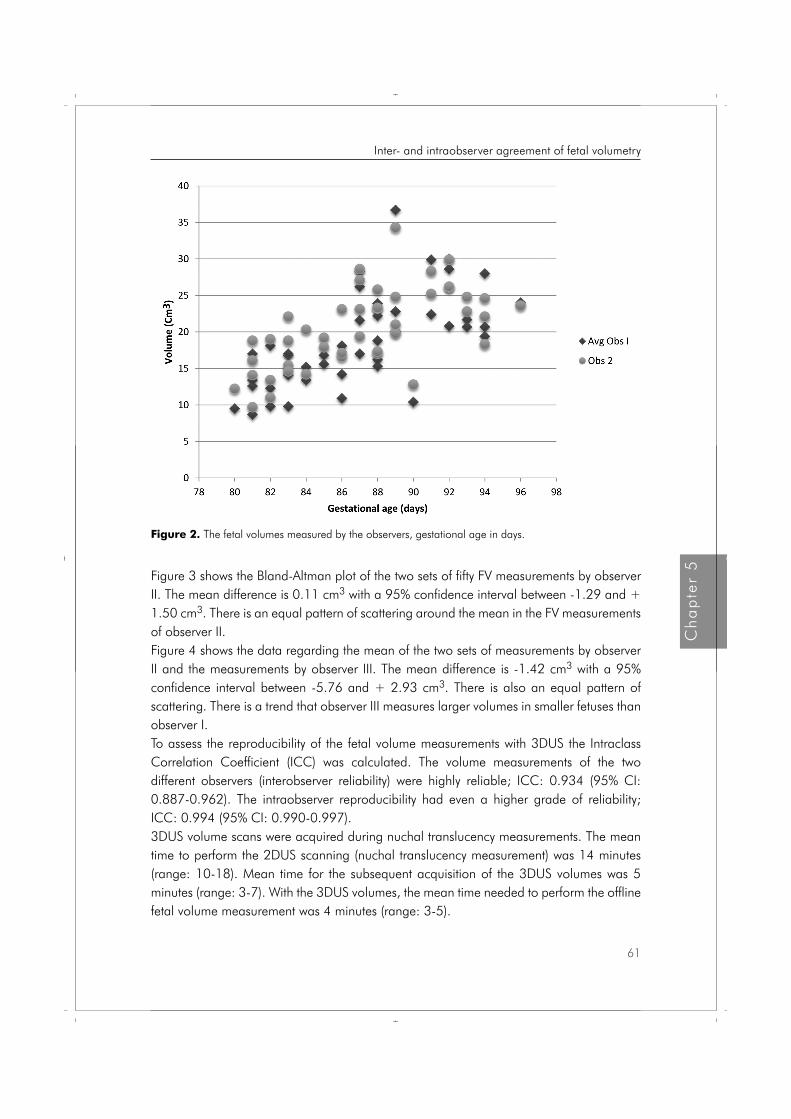
Figure 3 shows the Bland-Altman plot of the two sets of fifty FV measurements by observer II. The mean difference is 0.11 cm3 with a 95% confidence interval between -1.29 and + 1.50 cm3. There is an equal pattern of scattering around the mean in the FV measurements of observer II. Figure 4 shows the data regarding the mean of the two sets of measurements by observer II and the measurements by observer III. The mean difference is -1.42 cm3 with a 95% confidence interval between -5.76 and + 2.93 cm3. There is also an equal pattern of scattering. There is a trend that observer III measures larger volumes in smaller fetuses than observer I. To assess the reproducibility of the fetal volume measurements with 3DUS the Intraclass Correlation Coefficient (ICC) was calculated. The volume measurements of the two different observers (interobserver reliability) were highly reliable; ICC: 0.934 (95% CI: 0.887-0.962). The intraobserver reproducibility had even a higher grade of reliability; ICC: 0.994 (95% CI: 0.990-0.997). 3DUS volume scans were acquired during nuchal translucency measurements. The mean time to perform the 2DUS scanning (nuchal translucency measurement) was 14 minutes (range: 10-18). Mean time for the subsequent acquisition of the 3DUS volumes was 5 minutes (range: 3-7). With the 3DUS volumes, the mean time needed to perform the offline fetal volume measurement was 4 minutes (range: 3-5).
Figure 2. The fetal volumes measured by the observers, gestational age in days.
61
Ch
ap
ter
5
Inter- and intraobserver agreement of fetal volumetry
Proefschrift Nicol.indb 61 4-10-2012 14:34:09
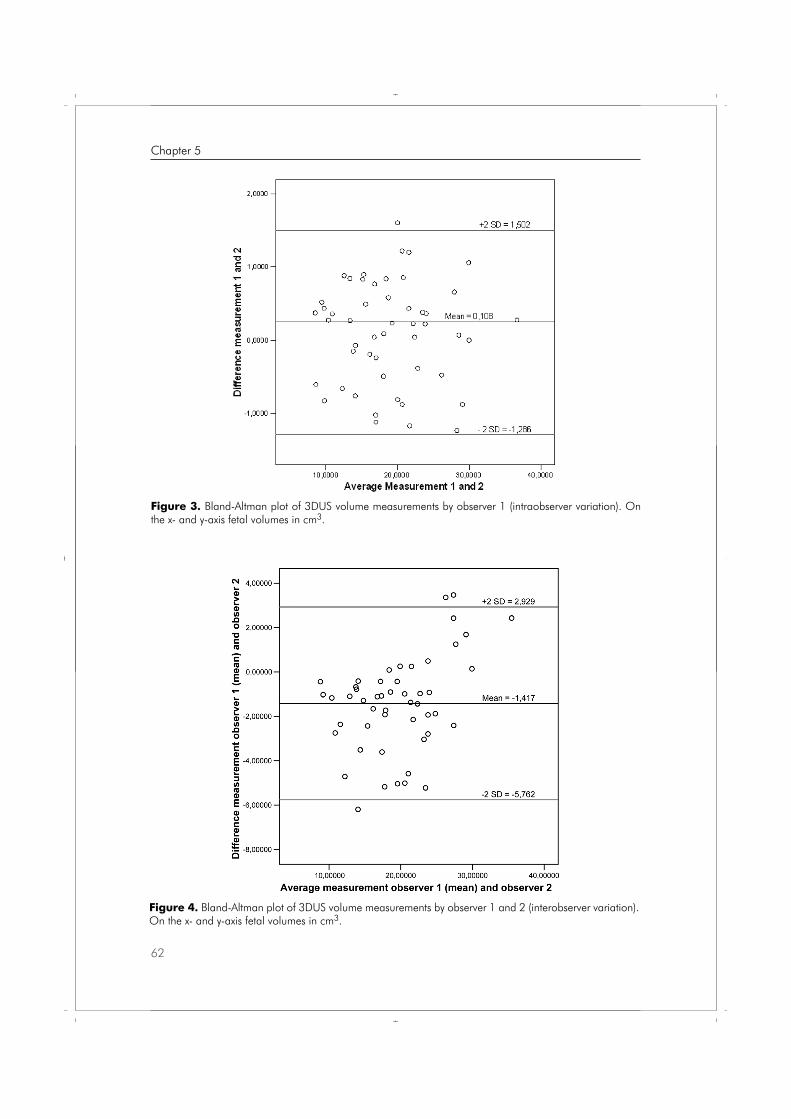
Figure 3. Bland-Altman plot of 3DUS volume measurements by observer 1 (intraobserver variation). On the x- and y-axis fetal volumes in cm3.
Figure 4. Bland-Altman plot of 3DUS volume measurements by observer 1 and 2 (interobserver variation). On the x- and y-axis fetal volumes in cm3.
62
Chapter 5
Proefschrift Nicol.indb 62 4-10-2012 14:34:10
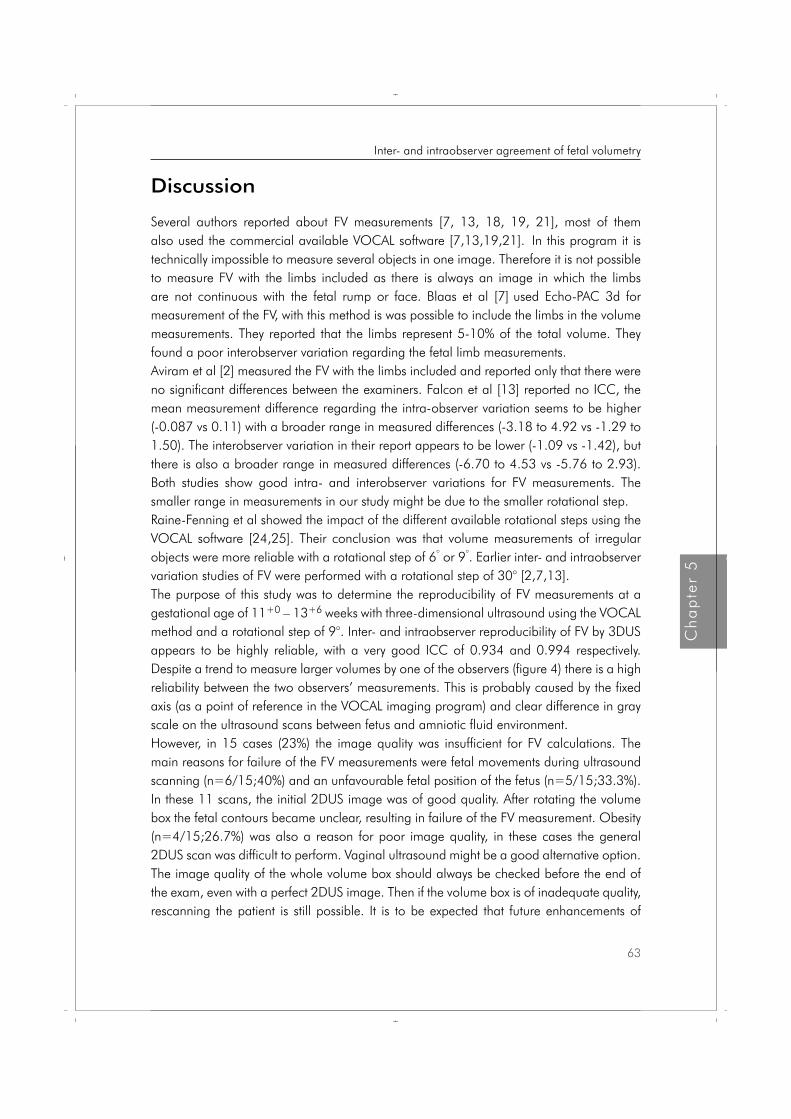
Discussion
Several authors reported about FV measurements [7, 13, 18, 19, 21], most of them also used the commercial available VOCAL software [7,13,19,21]. In this program it is technically impossible to measure several objects in one image. Therefore it is not possible to measure FV with the limbs included as there is always an image in which the limbs are not continuous with the fetal rump or face. Blaas et al [7] used Echo-PAC 3d for measurement of the FV, with this method is was possible to include the limbs in the volume measurements. They reported that the limbs represent 5-10% of the total volume. They found a poor interobserver variation regarding the fetal limb measurements.Aviram et al [2] measured the FV with the limbs included and reported only that there were no significant differences between the examiners. Falcon et al [13] reported no ICC, the mean measurement difference regarding the intra-observer variation seems to be higher (-0.087 vs 0.11) with a broader range in measured differences (-3.18 to 4.92 vs -1.29 to 1.50). The interobserver variation in their report appears to be lower (-1.09 vs -1.42), but there is also a broader range in measured differences (-6.70 to 4.53 vs -5.76 to 2.93). Both studies show good intra- and interobserver variations for FV measurements. The smaller range in measurements in our study might be due to the smaller rotational step. Raine-Fenning et al showed the impact of the different available rotational steps using the VOCAL software [24,25]. Their conclusion was that volume measurements of irregular objects were more reliable with a rotational step of 6° or 9°. Earlier inter- and intraobserver variation studies of FV were performed with a rotational step of 30° [2,7,13].The purpose of this study was to determine the reproducibility of FV measurements at a gestational age of 11+0 – 13+6 weeks with three-dimensional ultrasound using the VOCAL method and a rotational step of 9°. Inter- and intraobserver reproducibility of FV by 3DUS appears to be highly reliable, with a very good ICC of 0.934 and 0.994 respectively. Despite a trend to measure larger volumes by one of the observers (figure 4) there is a high reliability between the two observers’ measurements. This is probably caused by the fixed axis (as a point of reference in the VOCAL imaging program) and clear difference in gray scale on the ultrasound scans between fetus and amniotic fluid environment. However, in 15 cases (23%) the image quality was insufficient for FV calculations. The main reasons for failure of the FV measurements were fetal movements during ultrasound scanning (n=6/15;40%) and an unfavourable fetal position of the fetus (n=5/15;33.3%). In these 11 scans, the initial 2DUS image was of good quality. After rotating the volume box the fetal contours became unclear, resulting in failure of the FV measurement. Obesity (n=4/15;26.7%) was also a reason for poor image quality, in these cases the general 2DUS scan was difficult to perform. Vaginal ultrasound might be a good alternative option. The image quality of the whole volume box should always be checked before the end of the exam, even with a perfect 2DUS image. Then if the volume box is of inadequate quality, rescanning the patient is still possible. It is to be expected that future enhancements of
63
Ch
ap
ter
5
Inter- and intraobserver agreement of fetal volumetry
Proefschrift Nicol.indb 63 4-10-2012 14:34:10

acquisition time will result in further improvement of image quality and less artefacts caused by fetal movement. These points will result in less failure of the FV measurements.Assessment of normal values of 3DUS FV measurements in pregnant women with a gestational age of 11+0 – 13+6 weeks is feasible. The inter- and intraobserver agreement of fetal volumetry by 3DUS is very high. A small rotational step of 9° results in an acceptable range of measured volumes.
64
Chapter 5
Proefschrift Nicol.indb 64 4-10-2012 14:34:10
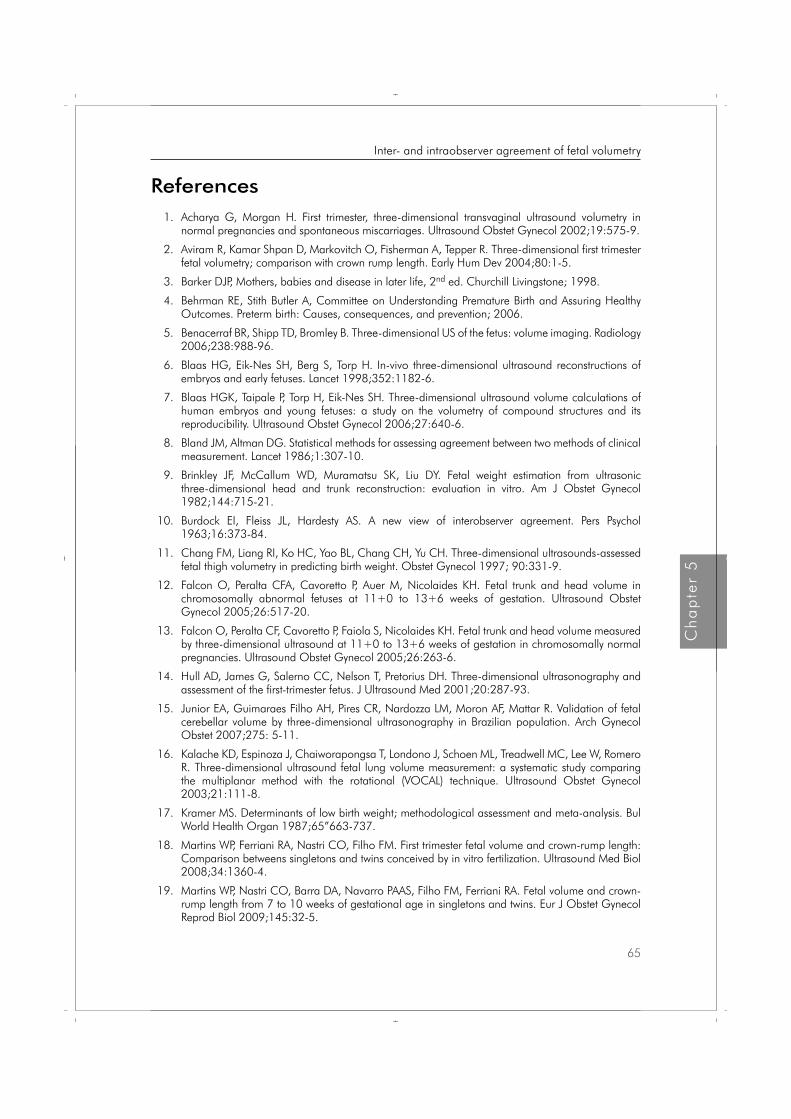
References 1. Acharya G, Morgan H. First trimester, three-dimensional transvaginal ultrasound volumetry in
normal pregnancies and spontaneous miscarriages. Ultrasound Obstet Gynecol 2002;19:575-9.
2. Aviram R, Kamar Shpan D, Markovitch O, Fisherman A, Tepper R. Three-dimensional first trimester fetal volumetry; comparison with crown rump length. Early Hum Dev 2004;80:1-5.
3. Barker DJP, Mothers, babies and disease in later life, 2nd ed. Churchill Livingstone; 1998.
4. Behrman RE, Stith Butler A, Committee on Understanding Premature Birth and Assuring Healthy Outcomes. Preterm birth: Causes, consequences, and prevention; 2006.
5. Benacerraf BR, Shipp TD, Bromley B. Three-dimensional US of the fetus: volume imaging. Radiology 2006;238:988-96.
6. Blaas HG, Eik-Nes SH, Berg S, Torp H. In-vivo three-dimensional ultrasound reconstructions of embryos and early fetuses. Lancet 1998;352:1182-6.
7. Blaas HGK, Taipale P, Torp H, Eik-Nes SH. Three-dimensional ultrasound volume calculations of human embryos and young fetuses: a study on the volumetry of compound structures and its reproducibility. Ultrasound Obstet Gynecol 2006;27:640-6.
8. Bland JM, Altman DG. Statistical methods for assessing agreement between two methods of clinical measurement. Lancet 1986;1:307-10.
9. Brinkley JF, McCallum WD, Muramatsu SK, Liu DY. Fetal weight estimation from ultrasonic three-dimensional head and trunk reconstruction: evaluation in vitro. Am J Obstet Gynecol 1982;144:715-21.
10. Burdock EI, Fleiss JL, Hardesty AS. A new view of interobserver agreement. Pers Psychol 1963;16:373-84.
11. Chang FM, Liang RI, Ko HC, Yao BL, Chang CH, Yu CH. Three-dimensional ultrasounds-assessed fetal thigh volumetry in predicting birth weight. Obstet Gynecol 1997; 90:331-9.
12. Falcon O, Peralta CFA, Cavoretto P, Auer M, Nicolaides KH. Fetal trunk and head volume in chromosomally abnormal fetuses at 11+0 to 13+6 weeks of gestation. Ultrasound Obstet Gynecol 2005;26:517-20.
13. Falcon O, Peralta CF, Cavoretto P, Faiola S, Nicolaides KH. Fetal trunk and head volume measured by three-dimensional ultrasound at 11+0 to 13+6 weeks of gestation in chromosomally normal pregnancies. Ultrasound Obstet Gynecol 2005;26:263-6.
14. Hull AD, James G, Salerno CC, Nelson T, Pretorius DH. Three-dimensional ultrasonography and assessment of the first-trimester fetus. J Ultrasound Med 2001;20:287-93.
15. Junior EA, Guimaraes Filho AH, Pires CR, Nardozza LM, Moron AF, Mattar R. Validation of fetal cerebellar volume by three-dimensional ultrasonography in Brazilian population. Arch Gynecol Obstet 2007;275: 5-11.
16. Kalache KD, Espinoza J, Chaiworapongsa T, Londono J, Schoen ML, Treadwell MC, Lee W, Romero R. Three-dimensional ultrasound fetal lung volume measurement: a systematic study comparing the multiplanar method with the rotational (VOCAL) technique. Ultrasound Obstet Gynecol 2003;21:111-8.
17. Kramer MS. Determinants of low birth weight; methodological assessment and meta-analysis. Bul World Health Organ 1987;65”663-737.
18. Martins WP, Ferriani RA, Nastri CO, Filho FM. First trimester fetal volume and crown-rump length: Comparison betweens singletons and twins conceived by in vitro fertilization. Ultrasound Med Biol 2008;34:1360-4.
19. Martins WP, Nastri CO, Barra DA, Navarro PAAS, Filho FM, Ferriani RA. Fetal volume and crown-rump length from 7 to 10 weeks of gestational age in singletons and twins. Eur J Obstet Gynecol Reprod Biol 2009;145:32-5.
65
Ch
ap
ter
5
Inter- and intraobserver agreement of fetal volumetry
Proefschrift Nicol.indb 65 4-10-2012 14:34:10
20. Michailidis GD, Papageorgiou P, Economides DL. Assessment of fetal anatomy in the first trimester using two- and three-dimensional ultrasound. Br J Radiol 2002;75:215-9.
21. Moeglin D, Talmant C, Duyme M, Lopez AC, CFEF. Fetal lung volumetry using two and three-dimensional ultrasound. Ultrasound Obstet Gynecol 2005;25:119-27.
22. Mook-Kanamori DO, Steegers EAP, Eilers PH, Raat H, Hofman A, Jaddoe VWV. Risk factors and outcomes associated with first-trimester fetal growth restriction. JAMA. 2010;303:527-534.
23. Nederlandse Vereniging voor Obstetrie en Gynaecologie, Modelprotocol Nekplooimeting, 2005, www.nvog.nl.
24. Raine-Fenning N, Cambell B, Collier J, Brincat M, Johnson I. The reproducibility of endometrial volume acquisition and measurement with the VOCAL-imaging program. Ultrasound Obstet Gynecol 2002;19:69-75.
25. Raine-Fenning NJ, Clewes JS, Kendall NR, Bunkheila AK, Campbell BK, Johnson IR. The interobserver reliability and validity of volume calculation from three-dimensional ultrasounds datasets in the in vitro setting. Ultrasound Obstet Gynecol 2003;21:283-91.
26. The Fetal Medicine Foundation, the 11-13 weeks scan. www.fetalmedicine.com.
27. Wegrzyn P, Faro C, Falcon O, Peralta CFA, Nicolaides KH. Placental volume measured by three-dimensional ultrasounds at 11 to 13+6 weeks of gestation: relation to chromosomal defects. Ultrasounds Obstet Gynecol 2005;26:28-32.
66
Chapter 5
Proefschrift Nicol.indb 66 4-10-2012 14:34:10
Chapter
Nicol AC Smeets
Marc Prudon
Bjorn Winkens
S Guid Oei
BMC Pregnancy and Childbirth 2012,12:38
Fetal volume measurements with three dimensional ultrasound in the first trimester of pregnancy, related to pregnancy outcome, a prospective cohort study
6
Proefschrift Nicol.indb 67 4-10-2012 14:34:11
Abstract
Background: First trimester growth restriction is associated with an increased risk of adverse birth outcomes (preterm birth, low birth weight and small for gestational age at birth). The differences between normal and abnormal growth in early pregnancy are small if the fetal size is measured by the crown-rump-length. Three-dimensional ultrasound volume measurements might give more information about fetal development than two-dimensional ultrasound measurements. Detection of the fetus with a small fetal volume might result in earlier detection of high risk pregnancies and a better selection of high risk pregnancies.
Methods: A prospective cohort study, performed at the Máxima Medical Centre, in Eindhoven-Veldhoven, the Netherlands. During the routine first trimester scan with nuchal translucency measurement 500 fetal volumes will be obtained. The gestational age is based on the first day of the last menstrual period in a regular menstrual cycle and by the crown-rump-length. The acquired datasets are collected and stored on a hard disk for offline processing and volume calculation. The investigator who performs the volume measurements is blinded for the results of the first trimester scan. The manual mode will be used to outline the Region Of Interest, the fetal head and rump, in all cross sections. The fetal volumes are calculated with a rotational step of 90. First, the relation between fetal volume and gestational age, for a set of participants with normal pregnancies (training set), will be assessed. This model will then be used to determine expected values of fetal volume for a normal pregnancy, which will be referred to as expected normal values. Secondly, for a new set of participants with normal pregnancies and a set of participants with complicated pregnancies (together defined as validation set), the observed fetal volumes (FVobserved) are compared with their expected normal values (FVexpected) and expressed as a percentage of the expected normal value. The mean difference in percentage error between the set of normal versus complicated pregnancies will then be compared using the independent-samples t-test. Finally, logistic regression analysis will be applied to the validation set of participants to analyze the possibility of predicting the pregnancy outcome after fetal volume calculation in the first trimester, using this percentage error.
Discussion: After this study it is clear whether FV measurement in the first trimester can detect high risk pregnancies. If it is possible to detect these pregnancies, more intensive follow up in these pregnancies might result in fewer complicated pregnancies and fewer fetal morbidities.
68
Chapter 6
Proefschrift Nicol.indb 68 4-10-2012 14:34:11
Background
Preterm birth is a growing public health problem that has significant consequences for families. Preterm birth accounts for 12.5% of all births in the United States. The costs for society are at least $26 billion dollar a year [1]. Low birth weight (<2500g) and birth weight that is small for gestational age (SGA) are associated with increased morbidity and mortality perinatal and in later life [2]. There is a growing body of evidence that complications in pregnancy are the result of the intra-uterine conditions in the first trimester of pregnancy. Monitoring fetal growth during the first trimester of pregnancy is expected to be of significant value in assessing complications in pregnancy. Smith et al. was the first to report about the relationship between first trimester fetal two-dimensional ultrasound (2DUS) measurements in relation to an increased risk of preterm birth, a low birth weight or being small for gestational age (SGA) at birth [3]. Bukowski et al. confirmed the relation between slow growth in the first trimester of pregnancy and a low birth weight [4]. These pregnancies were a result of assisted reproductive technologies excluding delayed ovulation as an explanation for the findings. They also report that a delayed implantation would result in a longer duration of pregnancy. However they found the opposite association, confirming that the delayed implantation could not explain the observed associations [4]. Mook-Kanamori et al. recently confirmed these earlier reports. They reported that fetal growth below the 20th percentile in the first trimester of pregnancy is associated with an increased risk of adverse birth outcomes such as preterm birth, low birth weight and SGA [5]. The differences between normal and abnormal growth in early pregnancy are small if the fetal size is measured by the crown-rump-length (CRL). There are several different definitions used in earlier reports for small fetal size in the first trimester in relation to complicated pregnancies. Abnormal growth is calculated as a difference in expected fetal size (according to the last menstrual period) minus the calculated fetal size by ultrasound (CRL/BPD) in days, ranging from -1 to -8-10 days [3,6,7]. The weakness of all these results is the low positive predictive value, therefore it is not a good screening test in order to select the high risk pregnancies.Three-dimensional ultrasound (3DUS) volume measurements might give more information about fetal development than 2DUS measurements. Fetal volume (FV) measurements were subject of earlier studies, where the volume measurements proved to be reliable and reproducible [8,9], even in twins [10,11]. A significant correlation between FV and the crown-rump-length (CRL) is already confirmed, with an up to 35-fold increase of the FV and a 4.5-fold increase of the CRL in the first trimester of pregnancy [8,9,10,12,13]. As the FV rises 7 times faster than the CRL, it can be expected that slight abnormalities in the CRL will be more obvious in FV measurements. Falcon et al. reported that the chromosomal abnormal fetus has a significant smaller FV than the chromosomal normal fetus whereas the CRL in trisomy 21 and Turner syndrome were normal [9,13]. These findings suggest
69
Ch
ap
ter
6
The predictive value of fetal volume measurements, study protocol
Proefschrift Nicol.indb 69 4-10-2012 14:34:11
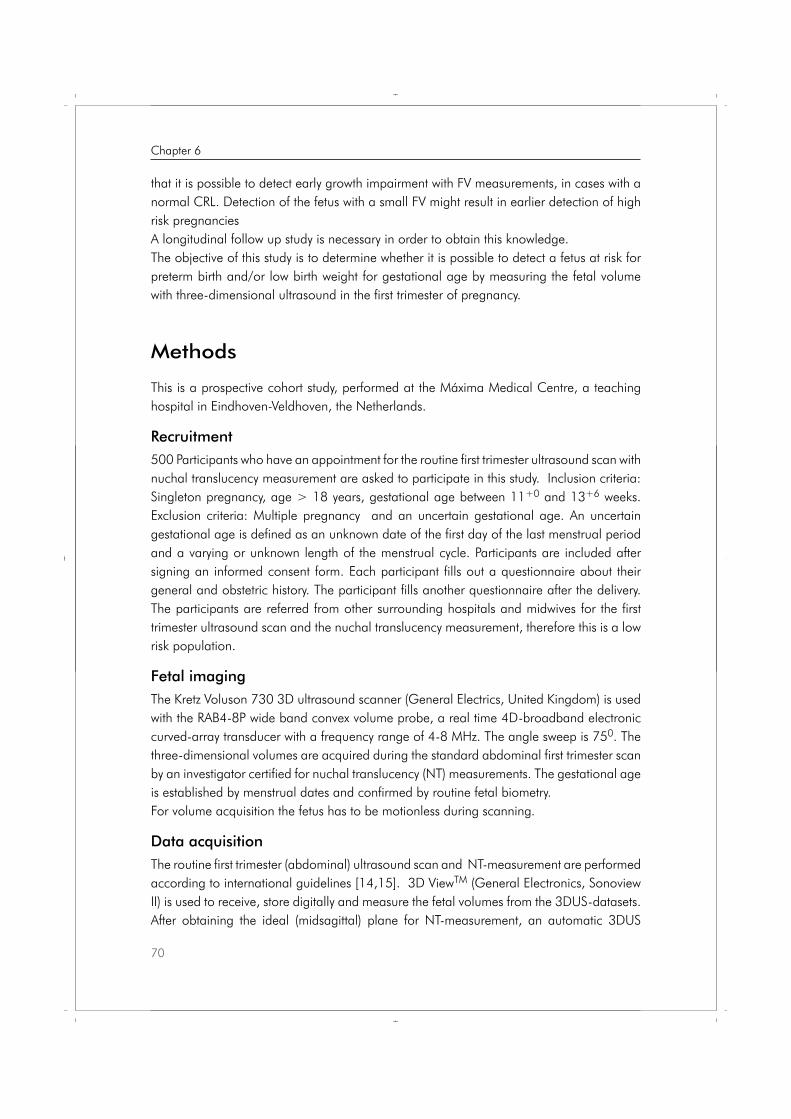
that it is possible to detect early growth impairment with FV measurements, in cases with a normal CRL. Detection of the fetus with a small FV might result in earlier detection of high risk pregnancies A longitudinal follow up study is necessary in order to obtain this knowledge.The objective of this study is to determine whether it is possible to detect a fetus at risk for preterm birth and/or low birth weight for gestational age by measuring the fetal volume with three-dimensional ultrasound in the first trimester of pregnancy.
Methods
This is a prospective cohort study, performed at the Máxima Medical Centre, a teaching hospital in Eindhoven-Veldhoven, the Netherlands.
Recruitment500 Participants who have an appointment for the routine first trimester ultrasound scan with nuchal translucency measurement are asked to participate in this study. Inclusion criteria: Singleton pregnancy, age > 18 years, gestational age between 11+0 and 13+6 weeks. Exclusion criteria: Multiple pregnancy and an uncertain gestational age. An uncertain gestational age is defined as an unknown date of the first day of the last menstrual period and a varying or unknown length of the menstrual cycle. Participants are included after signing an informed consent form. Each participant fills out a questionnaire about their general and obstetric history. The participant fills another questionnaire after the delivery. The participants are referred from other surrounding hospitals and midwives for the first trimester ultrasound scan and the nuchal translucency measurement, therefore this is a low risk population.
Fetal imaging The Kretz Voluson 730 3D ultrasound scanner (General Electrics, United Kingdom) is used with the RAB4-8P wide band convex volume probe, a real time 4D-broadband electronic curved-array transducer with a frequency range of 4-8 MHz. The angle sweep is 750. The three-dimensional volumes are acquired during the standard abdominal first trimester scan by an investigator certified for nuchal translucency (NT) measurements. The gestational age is established by menstrual dates and confirmed by routine fetal biometry. For volume acquisition the fetus has to be motionless during scanning.
Data acquisitionThe routine first trimester (abdominal) ultrasound scan and NT-measurement are performed according to international guidelines [14,15]. 3D ViewTM (General Electronics, Sonoview II) is used to receive, store digitally and measure the fetal volumes from the 3DUS-datasets. After obtaining the ideal (midsagittal) plane for NT-measurement, an automatic 3DUS
70
Chapter 6
Proefschrift Nicol.indb 70 4-10-2012 14:34:11
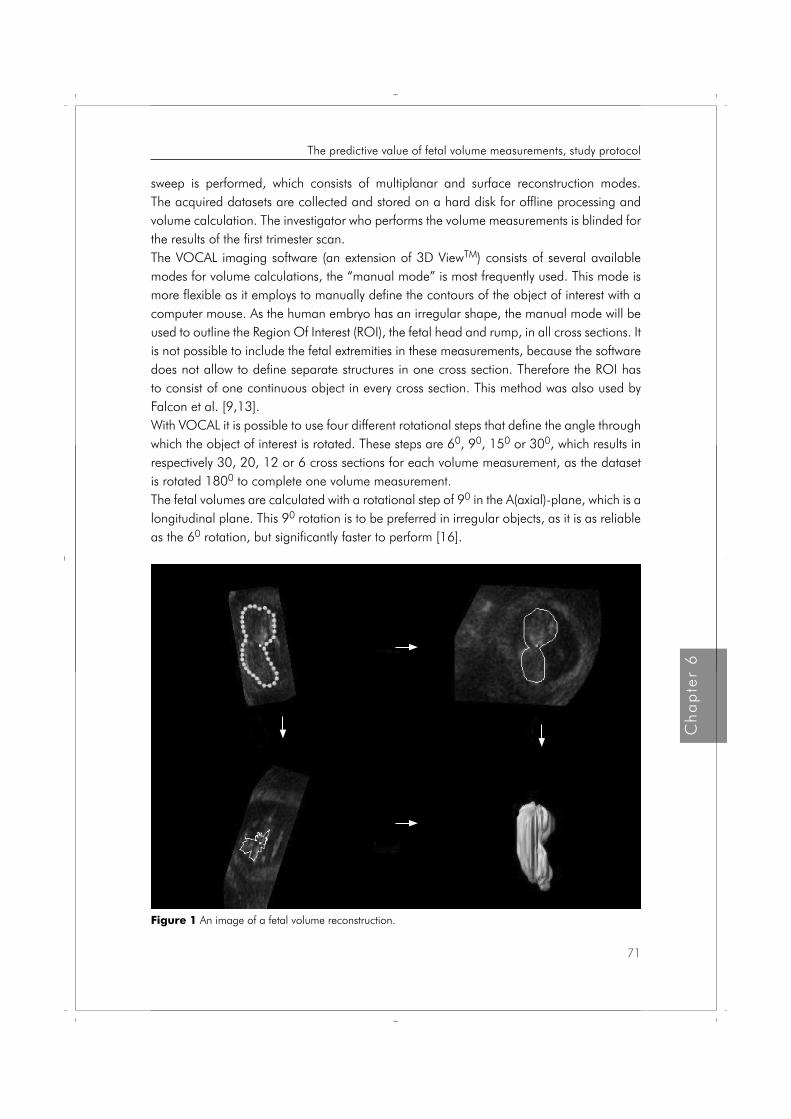
sweep is performed, which consists of multiplanar and surface reconstruction modes. The acquired datasets are collected and stored on a hard disk for offline processing and volume calculation. The investigator who performs the volume measurements is blinded for the results of the first trimester scan.The VOCAL imaging software (an extension of 3D ViewTM) consists of several available modes for volume calculations, the “manual mode” is most frequently used. This mode is more flexible as it employs to manually define the contours of the object of interest with a computer mouse. As the human embryo has an irregular shape, the manual mode will be used to outline the Region Of Interest (ROI), the fetal head and rump, in all cross sections. It is not possible to include the fetal extremities in these measurements, because the software does not allow to define separate structures in one cross section. Therefore the ROI has to consist of one continuous object in every cross section. This method was also used by Falcon et al. [9,13].With VOCAL it is possible to use four different rotational steps that define the angle through which the object of interest is rotated. These steps are 60, 90, 150 or 300, which results in respectively 30, 20, 12 or 6 cross sections for each volume measurement, as the dataset is rotated 1800 to complete one volume measurement.The fetal volumes are calculated with a rotational step of 90 in the A(axial)-plane, which is a longitudinal plane. This 90 rotation is to be preferred in irregular objects, as it is as reliable as the 60 rotation, but significantly faster to perform [16].
Figure 1 An image of a fetal volume reconstruction.
71
Ch
ap
ter
6
The predictive value of fetal volume measurements, study protocol
Proefschrift Nicol.indb 71 4-10-2012 14:34:12
The 90 rotational step results in a sequence of 20 longitudinal sections of the fetus around a fixed axis. In each of these planes the two-dimensional (2D) contour of the fetus (excluding the limbs) is defined manually, as described by others [10,11,13]. The VOCAL program then calculates the volume of the defined contour. After calculation the computed reconstruction of the fetus is displayed together with the fetal volume (Figure I). There can be an undulating surface of the 3D image, which is caused by the rotational steps and represents the ROI’s in each measured plane. We have previously reported that the inter- and intraobserver agreement of fetal volume measurements by 3DUS is very high [17].
Statistical analysisFirst, for a set of participants with normal pregnancies (training set), the relation between fetal volume and gestational age (GA) will be assessed using multiple linear regression. The influence of fetal gender and parity will be observed, if needed different training sets will be generated. This model will then be used to determine expected values of fetal volume for a normal pregnancy, which will be referred to as expected normal values. Secondly, for a new set of participants with normal pregnancies and a set of participants with complicated pregnancies (together defined as validation set), the observed fetal volumes (FVobserved) are compared with their expected normal values (FVexpected) and expressed as a percentage of the expected normal value, i.e. percentage error = 100% * (FVobserved – FVexpected)/FVexpected. The mean difference in percentage error between the set of normal versus complicated pregnancies will then be compared using the independent-samples t-test. Finally, logistic regression analysis will be applied to the validation set of participants to analyze the possibility of predicting the pregnancy outcome after fetal volume calculation in the first trimester, using this percentage error. For the statistical analysis SPSSTM (Chicago Illinois, USA) version 18.0 for Windows will be used. A two-sided p-value ≤ 0.05 is considered statistically significant. As we use a smaller rotational step, there might be a difference with the results of Falcon et al. [9].
Sample sizeAt the routine first trimester scan with nuchal translucency measurement, 500 fetal volumes will be measured. 50% of these volumes (n=250) will be used as the training set and the other 50% as the validation set. Since it was expected that at least 10% of all pregnancies will be complicated by pre-term delivery or a low birth weight for gestational age, the validation set consists of 50 complicated pregnancies and 200 normal pregnancies. Based on the independent-samples t-test to compare the mean percentage error between complicated and normal pregnancies, these sample sizes are sufficient to detect a medium standardized effect size (Cohen’s d = 0.5) with sufficient power (80%) using a significance level of 5% and accounting for 10-20% lost to follow up. The protocol is approved by the hospital’s medical ethics committee and informed consent will be obtained prior to inclusion in this study.
72
Chapter 6
Proefschrift Nicol.indb 72 4-10-2012 14:34:12
Discussion
After this study it is clear whether FV measurement in the first trimester can detect high risk pregnancies. If it is possible to detect these pregnancies, more intensive follow up in these pregnancies might result in less complicated pregnancies and less fetal morbidity. We expect to perform measurements in a normal population. Based on the definition of SGA, it is to be expected that 50 fetuses will be SGA (10%), and 62 deliveries will be preterm (12,5%).
Summary
This study is designed to provide information on whether FV volume measurements with three-dimensional ultrasound in the first trimester of pregnancy can be helpful in selecting high risk pregnancies.
73
Ch
ap
ter
6
The predictive value of fetal volume measurements, study protocol
Proefschrift Nicol.indb 73 4-10-2012 14:34:12
References 1. Behrman RE, Stith Butler A, Committee on Understanding Premature Birth and Assuring Healthy
Outcomes. Preterm birth: Causes, consequences, and prevention. Washington, D.C. National Academies Press; 2007.
2. Adult consequences of fetal growht restriction. Barker DJB. Clin Obstet Gynecol 2006;49:270-83.
3. First-trimester growth and the risk of low birth weight. Smith GCS, Smith MFS, McNay MB, Fleming JEE. N Engl J Med 1998;339:1817-22.
4. Fetal growth in early pregnancy and risk of delivering low birth weight infant: prospective cohort study. Bukowski R, Smith GCS, Malone FD, Ball RH, Nyberg DA, Comstock CH, Hankins GDV, Berkowitz RL, Gross SJ, Dugoff L, Craigo SD, Timor-Tritsch IE, Carr SR, Wolfe HM, D’Alton ME. BMJ, doi:10.1136/bmj.39129.637917. AE 2007.
5. Mook-Kanamori DO, Steegers EAP, Eilers PH, Raat H, Hofman A, Jaddoe VWV. Risk factors and outcomes associated with first-trimester fetal growth restriction. JAMA 2010;303:527-534.
6. Early pregnancy predictors of preterm birth: the role of a prolonged menstruation-conception interval. Gardosi J, Francis A. BJOG 2000;107:228-37
7. Small fetal size before 20 weeks’ gestation: associations with maternal tobacco use, early preterm birth, and low birthweight. Mercer BM, Merlino AA, Milluzzi CJ, Moore JJ. Am J Obstet Gynecol 2008;198:673.e1-673.e8.
8. Blaas HGK, Taipale P, Torp H, Eik-Nes SH. Three-dimensional ultrasound volume calculations of human embryos and young fetuses: a study on the volumetry of compound structures and its reproducibility. Ultrasound Obstet Gynecol 2006;27:640-6.
9. Falcon O, Peralta CFA, Cavoretto P, Auer M, Nicolaides KH. Fetal trunk and head volume in chromosomally abnormal fetuses at 11+0 to 13+6 weeks of gestation. Ultrasound Obstet Gynecol 2005;26:517-20.
10. Martins WP, Ferriani RA, Nastri CO, Filho FM. First trimester fetal volume and crown-rump length: Comparison betweens singletons and twins conceived by in vitro fertilization. Ultrasound Med Biol 2008;34:1360-4.
11. Martins WP, Nastri CO, Barra DA, Navarro PAAS, Filho FM, Ferriani RA. Fetal volume and crown-rump length from 7 to 10 weeks of gestational age in singletons and twins. Eur J Obstet Gynecol Reprod Biol 2009;145:32-5.
12. Aviram R, Kamar Shpan D, Markovitch O, Fisherman A, Tepper R. Three-dimensional first trimester fetal volumetry; comparison with crown rump length. Early Hum Dev 2004;80:1-5.
13. Falcon O, Peralta CF, Cavoretto P, Faiola S, Nicolaides KH. Fetal trunk and head volume measured by three-dimensional ultrasound at 11+0 to 13+6 weeks of gestation in chromosomally normal pregnancies. Ultrasound Obstet Gynecol 2005;26:263-6.
14. Nicolaides KH. The 11-13+6 weeks scan. London, The Fetal Medicine Foundation; 2004.
15. American College of Obstetricians and Gynecologists. ACOG Practice Bulletin No. 101: Ultrasonography in pregnancy. Obstet Gynecol 2009;113:451-61.
16. Raine-Fenning NJ, Clewes JS, Kendall NR, Bunkheila AK, Campbell BK, Johnson IR. The interobserver reliability and validity of volume calculation from three-dimensional ultrasounds datasets in the in vitro setting. Ultrasound Obstet Gynecol 2003;21:283-91.
17. Smeets NAC, Ven van de J, Oei SG. Inter- and intraobserver variation of fetal volume measurements with three-dimensional ultrasound in the first trimester of pregnancy. J Perinat Med 2011;39:539-43.
74
Chapter 6
Proefschrift Nicol.indb 74 4-10-2012 14:34:12

Nicol AC Smeets
Bjorn Winkens
Marc Prudon
Joost van de Ven
Vera PJ Gondrie
Frank van Deursen
S Guid Oei
The predictive value of first trimester fetal volume measurements, a prospective cohort study
7Chapter
Proefschrift Nicol.indb 75 4-10-2012 14:34:13
Early Hum Dev, minor revision
Abstract
Objectives To determine if fetal volume(FV) measurements with three-dimensional ultrasound in the first trimester of pregnancy can detect the fetus is at risk for preterm birth and/or low birth weight.
Methods In this prospective cohort study, 538 participants were included during the routine first trimester ultrasound examination. Volume measurements were performed with VOCAL using a rotational step of 9°. Firstly, the relation between FV and gestational age for a set of participants with normal pregnancies(training set), was assessed using multiple linear regression analysis, which was then used to determine the expected normal values. Secondly, for a new set of participants with normal pregnancies and a set of participants with complicated pregnancies(preterm birth and/or low birth weight), i.e. the validation set, the observed fetal volumes(FVobserved) were compared with their expected normal values(FVexpected) and expressed as a percentage of the expected normal value. The difference in mean percentage was then assessed with independent-samples t-test. Finally, logistic regression analysis was applied to the validation set to analyse the ability to predict the pregnancy outcome with FV calculation.
Results Linear regression analysis of FV as a predictor of preterm birth and/or low birth weight or low birth weight alone did not result in significant (p=0.630 and 0.290, respectively) or clinical relevant results(standardized effect sizes of 0.061 and 0.179, respectively). As a consequence, the predicting quality was also very low (AUC=0.508 and 0.545 respectively).
Conclusions Fetal volume measurements in the first trimester of pregnancy are not suitable for the prediction of high risk pregnancies.
76
Chapter 7
Proefschrift Nicol.indb 76 4-10-2012 14:34:13
Introduction
There is a growing body of evidence that complications in pregnancy, such as preterm birth, low birth weight and birth weight that is small for gestational age (SGA), are the result of the intra-uterine conditions in the first trimester of pregnancy. Preterm birth is a growing public health problem that has significant consequences for families. Preterm birth accounts for 12.5% of all births in the United States. The costs for society are at least 26 billion dollar a year [1]. Low birth weight (<2500g) and birth weight that is SGA are associated with increased morbidity and mortality in the perinatal period and in later life [2]. Monitoring fetal growth during the first trimester of pregnancy is expected to be of significant value in assessing complications in pregnancy. Smith et al. was the first to report about the relationship between first trimester fetal two-dimensional ultrasound (2DUS) measurements and an increased risk of preterm birth, a low birth weight or being SGA at birth [3]. Bukowski et al. confirmed the relation between slow growth in the first trimester of pregnancy and a low birth weight [4]. Mook-Kanamori et al. recently confirmed these earlier reports by reporting that first trimester growth restriction (below 20th percentile) is associated with an increased risk of adverse birth outcomes such as preterm birth, low birth weight and SGA [5]. Odeh et al. found a smaller crown-rump-length (CRL) in pregnancies complicated by pregnancy induced hypertension or SGA [6].The differences between normal and abnormal growth in early pregnancy are small if the fetal size is measured by the CRL. There are several different definitions used in earlier reports for small fetal size in the first trimester in relation to complicated pregnancies. Abnormal growth is defined as the expected fetal size (according to the last menstruation period) minus the calculated fetal size by ultrasound (CRL/BPD) in days, ranging from -10 to -1 days [3,7,8]. The weakness of all these results is the low positive predictive value, therefore it is not a good screening test for selecting the high risk pregnancies.Three-dimensional ultrasound (3DUS) volume measurements might give more information about fetal growth than 2DUS measurements by adding the third dimension in the analysis. Fetal volume (FV) measurements were the subject of earlier studies, showing that these volume measurements were reliable and reproducible [9,10], even in twins [11,12]. A significant correlation between FV and the CRL was already confirmed, with an up to 35-fold increase of the FV and a 4.5-fold increase of the CRL in the first trimester of pregnancy [9-11,13,14]. As the FV rises 7 times faster than the CRL, it can be expected that slight abnormalities in the CRL will be more obvious in FV measurements. Falcon et al. reported that the chromosomal abnormal fetus has a significant smaller FV (10-15%) than the chromosomal normal fetus whereas the CRL in trisomy 21 and Turner syndrome were normal [10,14]. These findings suggest that it might be possible to detect early growth impairment with FV measurements, in cases with a normal CRL. This has recently been confirmed by Fajardo et al., in their study FV measurements performed significantly better than CRL in predicting inter-twin growth disturbances [15]. Antsaklis et al. reported in their
77
Ch
ap
ter
7
The predictive value of first trimester fetal volume
Proefschrift Nicol.indb 77 4-10-2012 14:34:13
pilot study that the FV correlates best with birth weight, compared to CRL and gestational sac volume [16]. Despite the fact that they did not take the gestational age at birth into account, their results are promising. Detection of the fetus with a small FV might result in earlier detection of high risk pregnancies, with the possibility to customize healthcare in these cases. A longitudinal follow up study is necessary in order to obtain this knowledge.The objective of this prospective cohort study is to determine if it is possible to detect whether the fetus is at risk for preterm birth and/or low birth weight for gestational age by measuring the fetal volume with three-dimensional ultrasound in the first trimester of pregnancy.
Materials and Methods
This is a longitudinal prospective cohort study, performed at a teaching hospital in the Netherlands. Participants were included during the routine first trimester ultrasound examination for three years. Fetal volume measurements and data collection were completed afterwards.
RecruitmentAll 538 consecutive participants with an appointment for the routine first trimester ultrasound scan with nuchal translucency (NT) measurement were asked to participate in this study. The inclusion criteria were: a singleton pregnancy, maternal age > 18 years, gestational age between 11+0 and 13+6 weeks. Exclusion criteria were: a multiple pregnancy and an uncertain gestational age. An uncertain gestational age is defined as an unknown date of the first day of the last menstrual period or no knowledge of the length of the menstrual cycle. Participants were included after signing an informed consent form. Each participant filled out two questionnaires, one about their general and obstetric history and another one after the delivery about the pregnancy, delivery and neonatal outcome. The participants were referred from other surrounding hospitals and midwives for the first trimester ultrasound scan and the nuchal translucency measurement, which indicates that this is a low risk population.
Fetal imaging The Kretz Voluson 730 3D ultrasound scanner (General Electrics, United Kingdom) was used in combination with the RAB4-8P wide band convex volume probe, a real time 4D-broadband electronic curved-array transducer with a frequency range of 4-8 MHz. The angle sweep was 750. The three-dimensional volumes were acquired during the standard abdominal first trimester scan by an investigator certified for NT measurements. The gestational age was established by menstrual dates and confirmed by routine fetal biometry. For volume acquisition the fetus had to be motionless during scanning.
78
Chapter 7
Proefschrift Nicol.indb 78 4-10-2012 14:34:13
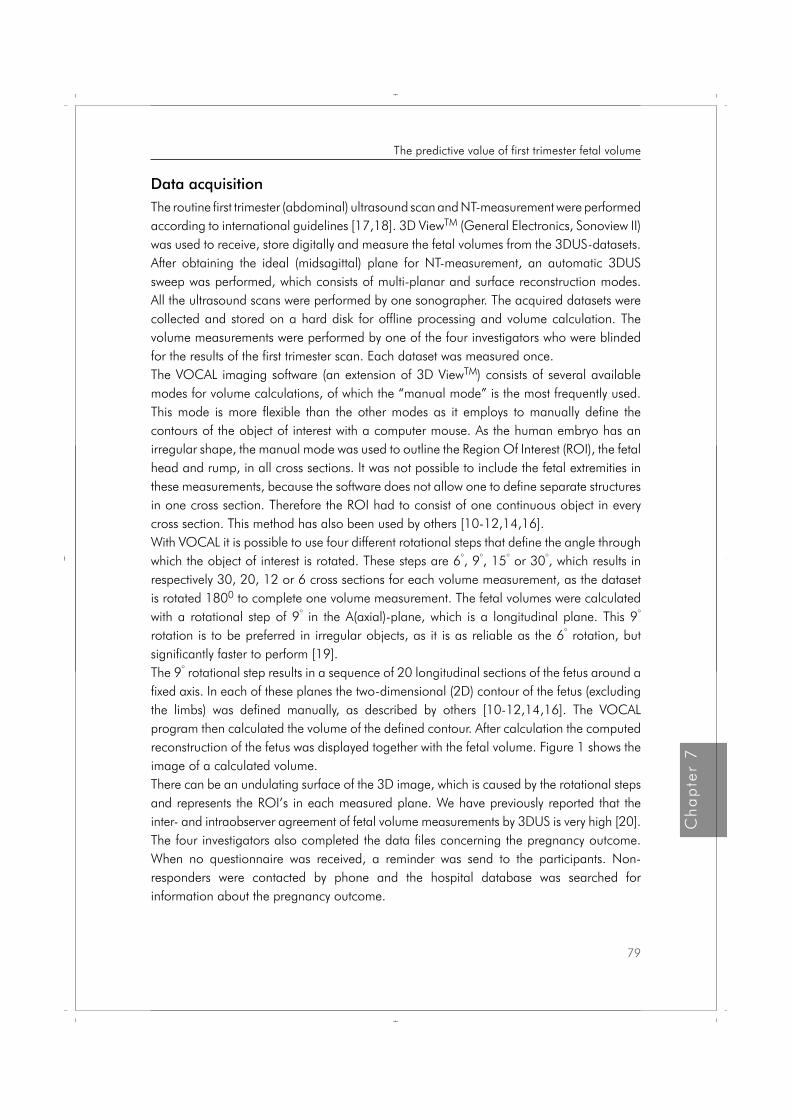
Data acquisitionThe routine first trimester (abdominal) ultrasound scan and NT-measurement were performed according to international guidelines [17,18]. 3D ViewTM (General Electronics, Sonoview II) was used to receive, store digitally and measure the fetal volumes from the 3DUS-datasets. After obtaining the ideal (midsagittal) plane for NT-measurement, an automatic 3DUS sweep was performed, which consists of multi-planar and surface reconstruction modes. All the ultrasound scans were performed by one sonographer. The acquired datasets were collected and stored on a hard disk for offline processing and volume calculation. The volume measurements were performed by one of the four investigators who were blinded for the results of the first trimester scan. Each dataset was measured once.The VOCAL imaging software (an extension of 3D ViewTM) consists of several available modes for volume calculations, of which the “manual mode” is the most frequently used. This mode is more flexible than the other modes as it employs to manually define the contours of the object of interest with a computer mouse. As the human embryo has an irregular shape, the manual mode was used to outline the Region Of Interest (ROI), the fetal head and rump, in all cross sections. It was not possible to include the fetal extremities in these measurements, because the software does not allow one to define separate structures in one cross section. Therefore the ROI had to consist of one continuous object in every cross section. This method has also been used by others [10-12,14,16].With VOCAL it is possible to use four different rotational steps that define the angle through which the object of interest is rotated. These steps are 6°, 9°, 15° or 30°, which results in respectively 30, 20, 12 or 6 cross sections for each volume measurement, as the dataset is rotated 1800 to complete one volume measurement. The fetal volumes were calculated with a rotational step of 9° in the A(axial)-plane, which is a longitudinal plane. This 9° rotation is to be preferred in irregular objects, as it is as reliable as the 6° rotation, but significantly faster to perform [19]. The 9° rotational step results in a sequence of 20 longitudinal sections of the fetus around a fixed axis. In each of these planes the two-dimensional (2D) contour of the fetus (excluding the limbs) was defined manually, as described by others [10-12,14,16]. The VOCAL program then calculated the volume of the defined contour. After calculation the computed reconstruction of the fetus was displayed together with the fetal volume. Figure 1 shows the image of a calculated volume.There can be an undulating surface of the 3D image, which is caused by the rotational steps and represents the ROI’s in each measured plane. We have previously reported that the inter- and intraobserver agreement of fetal volume measurements by 3DUS is very high [20].The four investigators also completed the data files concerning the pregnancy outcome. When no questionnaire was received, a reminder was send to the participants. Non-responders were contacted by phone and the hospital database was searched for information about the pregnancy outcome.
79
Ch
ap
ter
7
The predictive value of first trimester fetal volume
Proefschrift Nicol.indb 79 4-10-2012 14:34:13
Statistical analysisPrimary analysis: pregnancies complicated by preterm birth and a low birth weight were extracted from the cohort. The remaining cohort was defined as ‘normal’. First, for a random sample of these ‘normal’ pregnancies (defined as the training set), the relation between FV and gestational age (GA) at time of the ultrasound scan was assessed using multiple linear regression analysis, accounting for fetal gender and parity. This model was then used to determine expected values of fetal volume for a normal pregnancy, which are referred to as expected normal values. Secondly, for a new set of participants with normal pregnancies and a set of participants with complicated pregnancies (together defined as the validation set), the observed fetal volumes (FVobserved) were compared with their expected normal values (FVexpected) and expressed as a percentage of the expected normal value, i.e. percentage error = 100% * (FVobserved – FVexpected)/FVexpected. The mean difference in percentage error between the set of normal versus complicated pregnancies was then compared using the independent-samples t-test. Finally, logistic regression analysis was applied to the validation set in order to analyse the possibility of predicting the pregnancy outcome after fetal volume calculation in the first trimester, using this percentage error. The prediction quality is presented by the area under the ROC curve (AUC). Complicated
Figure 1. An image of a fetal volume reconstruction.
80
Chapter 7
Proefschrift Nicol.indb 80 4-10-2012 14:34:13
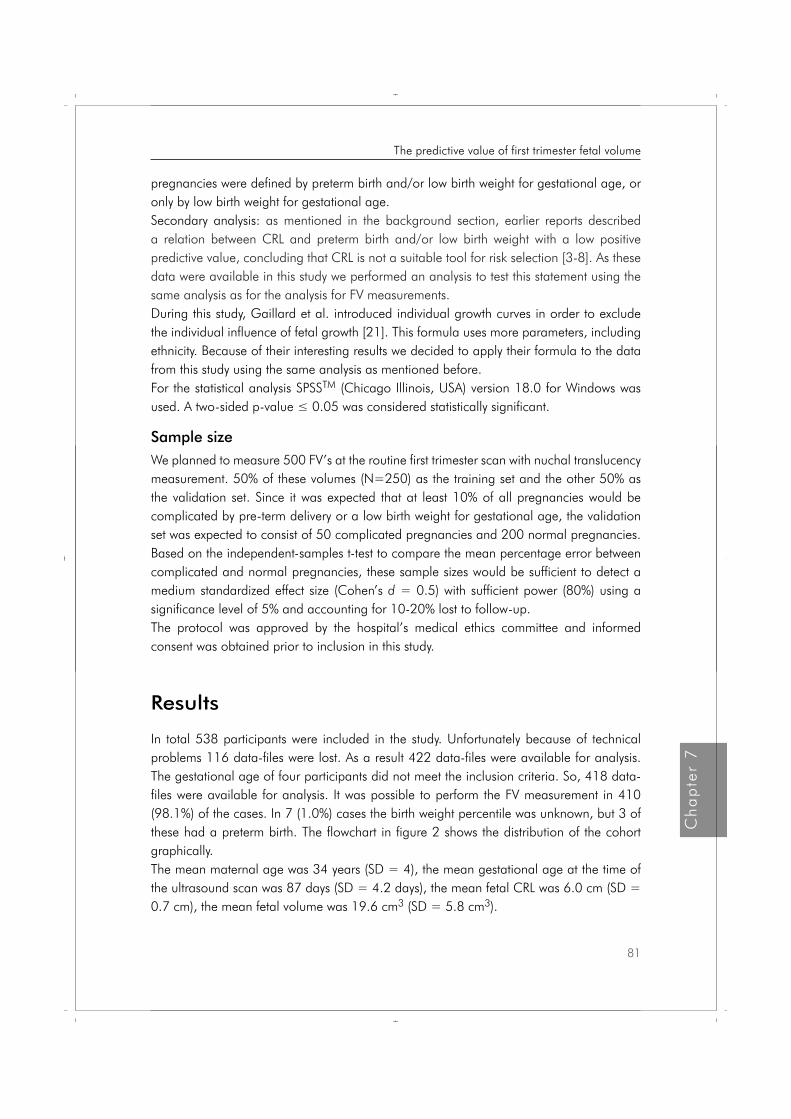
pregnancies were defined by preterm birth and/or low birth weight for gestational age, or only by low birth weight for gestational age.Secondary analysis: as mentioned in the background section, earlier reports described a relation between CRL and preterm birth and/or low birth weight with a low positive predictive value, concluding that CRL is not a suitable tool for risk selection [3-8]. As these data were available in this study we performed an analysis to test this statement using the same analysis as for the analysis for FV measurements.During this study, Gaillard et al. introduced individual growth curves in order to exclude the individual influence of fetal growth [21]. This formula uses more parameters, including ethnicity. Because of their interesting results we decided to apply their formula to the data from this study using the same analysis as mentioned before. For the statistical analysis SPSSTM (Chicago Illinois, USA) version 18.0 for Windows was used. A two-sided p-value ≤ 0.05 was considered statistically significant.
Sample sizeWe planned to measure 500 FV’s at the routine first trimester scan with nuchal translucency measurement. 50% of these volumes (N=250) as the training set and the other 50% as the validation set. Since it was expected that at least 10% of all pregnancies would be complicated by pre-term delivery or a low birth weight for gestational age, the validation set was expected to consist of 50 complicated pregnancies and 200 normal pregnancies. Based on the independent-samples t-test to compare the mean percentage error between complicated and normal pregnancies, these sample sizes would be sufficient to detect a medium standardized effect size (Cohen’s d = 0.5) with sufficient power (80%) using a significance level of 5% and accounting for 10-20% lost to follow-up. The protocol was approved by the hospital’s medical ethics committee and informed consent was obtained prior to inclusion in this study.
Results
In total 538 participants were included in the study. Unfortunately because of technical problems 116 data-files were lost. As a result 422 data-files were available for analysis. The gestational age of four participants did not meet the inclusion criteria. So, 418 data-files were available for analysis. It was possible to perform the FV measurement in 410 (98.1%) of the cases. In 7 (1.0%) cases the birth weight percentile was unknown, but 3 of these had a preterm birth. The flowchart in figure 2 shows the distribution of the cohort graphically. The mean maternal age was 34 years (SD = 4), the mean gestational age at the time of the ultrasound scan was 87 days (SD = 4.2 days), the mean fetal CRL was 6.0 cm (SD = 0.7 cm), the mean fetal volume was 19.6 cm3 (SD = 5.8 cm3).
81
Ch
ap
ter
7
The predictive value of first trimester fetal volume
Proefschrift Nicol.indb 81 4-10-2012 14:34:13

Figure 2. The flowchart of the analysis of the cohort. The chart ends with the final validation sets and training sets (number of complete datasets/total dataset, (percentage complete datasets)).
The relations between the FV, CRL and GA are reported in figure 3. This figure confirms reports of others about the faster rise of the FV compared to the CRL [9-11,13,14].Figure 4 shows the scatterplot with the FV’s of neonates born after pre-term (black pastilles) and term (open squares) birth. The FV’s of the neonates born after preterm birth are distributed throughout the range of the neonates born after term birth.The scatterplot in figure 5 shows the FV’s of neonates with a normal birth weight (squares) and the FV’s with a birth weight below the tenth percentile (dots). It is clear to see that there is an overlap between the normal and the abnormal group. The scatterplot in figure 6 shows the CRL of neonates with a normal birth weight (squares) and the CRL of neonates with a birth weight below the tenth percentile (triangles). In this figure, there is also an overlap between both groups, although the points of the abnormal group seem to be in the lower segment.
Fetal volume as a predictor of preterm birth and/or low birth weightThe training set consisted of 116 randomly selected participants with a normal pregnancy outcome, of which 107 (92.2%) had complete datasets and were used in the multiple regression analysis. The validation set consisted of 200 randomly selected participants
82
Chapter 7
Proefschrift Nicol.indb 82 4-10-2012 14:34:15
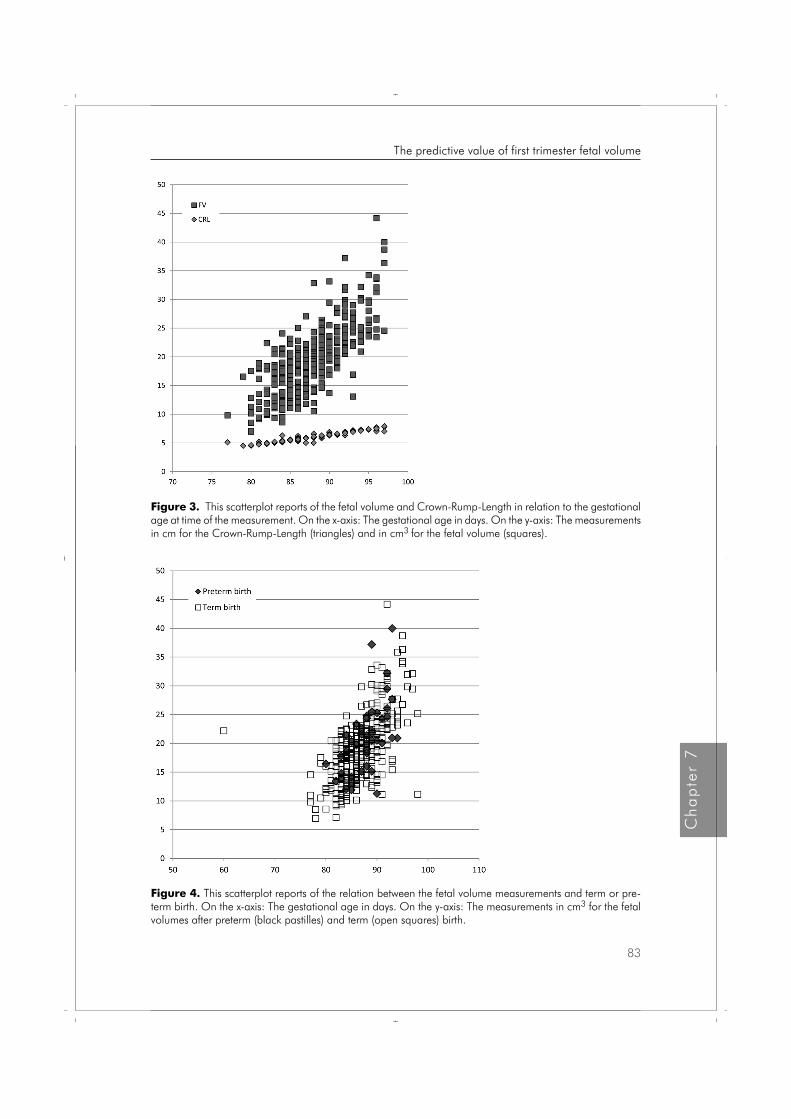
Figure 3. This scatterplot reports of the fetal volume and Crown-Rump-Length in relation to the gestational age at time of the measurement. On the x-axis: The gestational age in days. On the y-axis: The measurements in cm for the Crown-Rump-Length (triangles) and in cm3 for the fetal volume (squares).
Figure 4. This scatterplot reports of the relation between the fetal volume measurements and term or pre-term birth. On the x-axis: The gestational age in days. On the y-axis: The measurements in cm3 for the fetal volumes after preterm (black pastilles) and term (open squares) birth.
83
Ch
ap
ter
7
The predictive value of first trimester fetal volume
Proefschrift Nicol.indb 83 4-10-2012 14:34:22
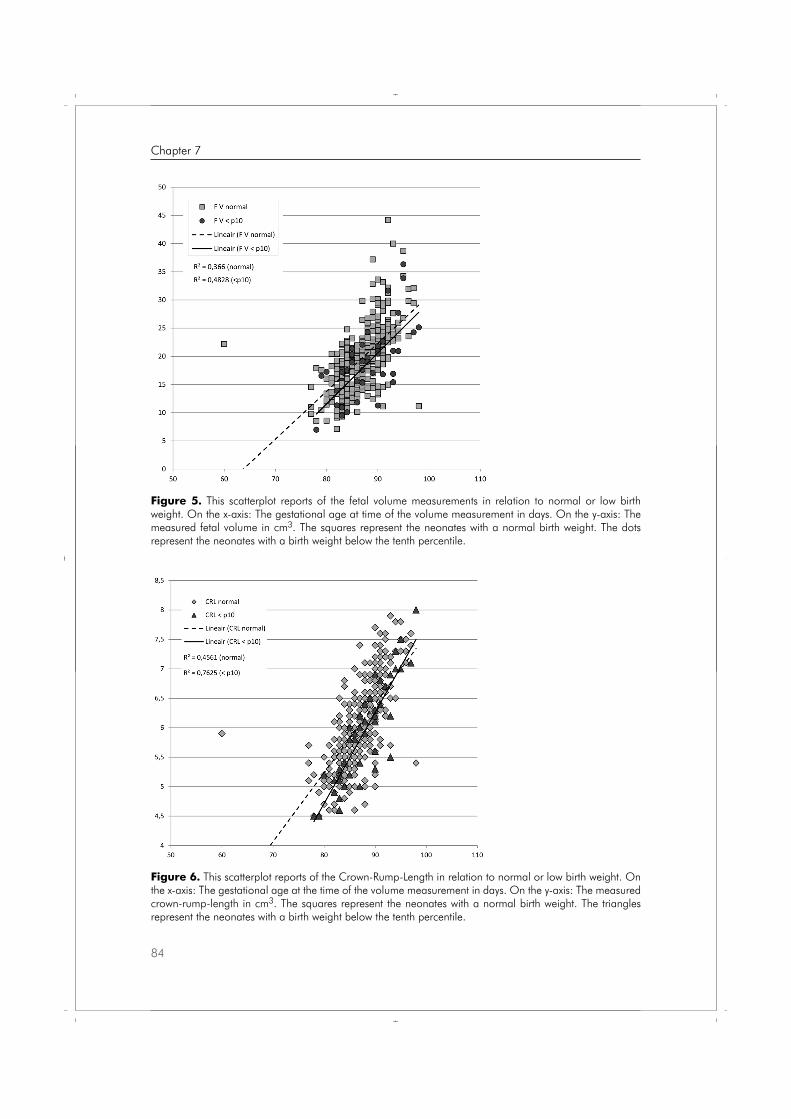
Figure 6. This scatterplot reports of the Crown-Rump-Length in relation to normal or low birth weight. On the x-axis: The gestational age at the time of the volume measurement in days. On the y-axis: The measured crown-rump-length in cm3. The squares represent the neonates with a normal birth weight. The triangles represent the neonates with a birth weight below the tenth percentile.
Figure 5. This scatterplot reports of the fetal volume measurements in relation to normal or low birth weight. On the x-axis: The gestational age at time of the volume measurement in days. On the y-axis: The measured fetal volume in cm3. The squares represent the neonates with a normal birth weight. The dots represent the neonates with a birth weight below the tenth percentile.
84
Chapter 7
Proefschrift Nicol.indb 84 4-10-2012 14:34:30
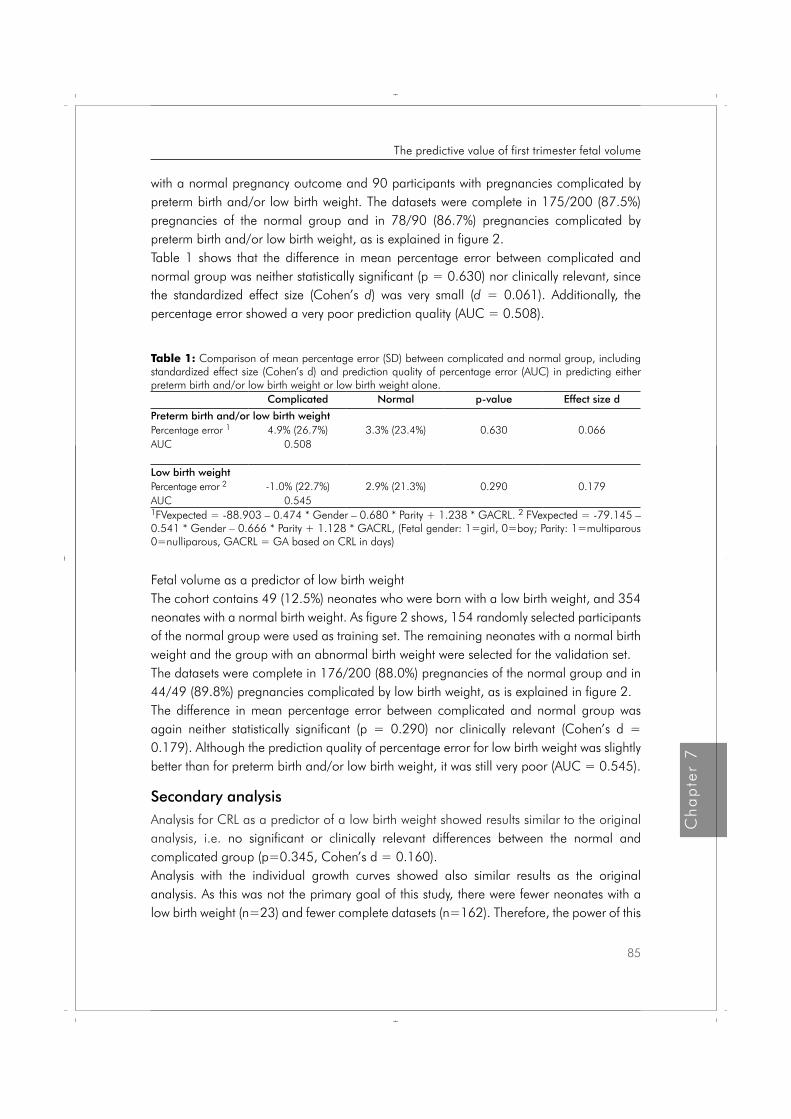
with a normal pregnancy outcome and 90 participants with pregnancies complicated by preterm birth and/or low birth weight. The datasets were complete in 175/200 (87.5%) pregnancies of the normal group and in 78/90 (86.7%) pregnancies complicated by preterm birth and/or low birth weight, as is explained in figure 2. Table 1 shows that the difference in mean percentage error between complicated and normal group was neither statistically significant (p = 0.630) nor clinically relevant, since the standardized effect size (Cohen’s d) was very small (d = 0.061). Additionally, the percentage error showed a very poor prediction quality (AUC = 0.508).
Table 1: Comparison of mean percentage error (SD) between complicated and normal group, including standardized effect size (Cohen’s d) and prediction quality of percentage error (AUC) in predicting either preterm birth and/or low birth weight or low birth weight alone.
Complicated Normal p-value Effect size d
Preterm birth and/or low birth weightPercentage error 1 4.9% (26.7%) 3.3% (23.4%) 0.630 0.066AUC 0.508
Low birth weightPercentage error 2 -1.0% (22.7%) 2.9% (21.3%) 0.290 0.179AUC 0.5451FVexpected = -88.903 – 0.474 * Gender – 0.680 * Parity + 1.238 * GACRL. 2 FVexpected = -79.145 – 0.541 * Gender – 0.666 * Parity + 1.128 * GACRL, (Fetal gender: 1=girl, 0=boy; Parity: 1=multiparous 0=nulliparous, GACRL = GA based on CRL in days)
Fetal volume as a predictor of low birth weightThe cohort contains 49 (12.5%) neonates who were born with a low birth weight, and 354 neonates with a normal birth weight. As figure 2 shows, 154 randomly selected participants of the normal group were used as training set. The remaining neonates with a normal birth weight and the group with an abnormal birth weight were selected for the validation set. The datasets were complete in 176/200 (88.0%) pregnancies of the normal group and in 44/49 (89.8%) pregnancies complicated by low birth weight, as is explained in figure 2. The difference in mean percentage error between complicated and normal group was again neither statistically significant (p = 0.290) nor clinically relevant (Cohen’s d = 0.179). Although the prediction quality of percentage error for low birth weight was slightly better than for preterm birth and/or low birth weight, it was still very poor (AUC = 0.545).
Secondary analysisAnalysis for CRL as a predictor of a low birth weight showed results similar to the original analysis, i.e. no significant or clinically relevant differences between the normal and complicated group (p=0.345, Cohen’s d = 0.160). Analysis with the individual growth curves showed also similar results as the original analysis. As this was not the primary goal of this study, there were fewer neonates with a low birth weight (n=23) and fewer complete datasets (n=162). Therefore, the power of this
85
Ch
ap
ter
7
The predictive value of first trimester fetal volume
Proefschrift Nicol.indb 85 4-10-2012 14:34:31
analysis is too low, especially for the very small effect that was found (Cohen’s d = 0.145). As for predicting quality, the AUC of 0.543 again indicates a poor prediction of percentage error for preterm birth and/or low birth weight, even if individual growth curves are taken into consideration.
Discussion
Although CRL and FV measurements in the first trimester of pregnancy were related to the birth weight, these parameters are not suited for detection of the fetus at risk for preterm birth and/or growth impairment.Despite promising results from earlier reports, this is to our knowledge, the first prospective follow up study that evaluates first trimester FV measurements as a tool for prediction of neonates born preterm and/or born with a low birth weight compared to normal pregnancies. Earlier reports of first trimester CRL measurements in relation to neonatal birth weight showed a relationship between fetal size and birth weight. However, it was concluded that two-dimensional fetal measurements were not a good predictive diagnostic tool because of the small differences between the normal and abnormal measurements, resulting in a low predictive value [3-8]. This was confirmed by our secondary analysis. Despite insufficient power, the AUC was 0.543 which means failure of the test. Adding the extra third dimension to the measurement seemed promising because of the exponential rise of the FV in the first trimester compared to the linear rise of the CRL. It was expected that slight abnormalities in the CRL would be more obvious in the FV measurements [9-11,13,14]. Earlier reports about up to 15% differences in fetal volume in the chromosomal abnormal fetus [10,14], prediction of inter-twin growth disturbances [15] and a pilot study reporting of a good correlation between FV and birth weight [16] were encouraging enough to expect that FV measurements would be a valuable tool for predicting high risk pregnancies. However, the results of this study show that FV is not suitable as a tool for predicting high risk pregnancies. As expected, the same accounts for CRL. Figure 5 and 6 both confirm these findings graphically: the difference between the regression lines with regard to FV of normal and abnormal pregnancies is rather small and the differences of FV within a group is large for the normal group as well as for the abnormal group. As a result, the points of the abnormal measurements in complicated pregnancies are positioned throughout the whole area of the normal measurements, indicating that it is hard to distinguish the complicated pregnancies from the normal ones by fetal volume alone. According to the results, the FV seems to be even larger when related to preterm birth (table 1), which is in contrary to earlier reports. In our sample artificial preterm birth was not a substantial factor, which is not clearly described in earlier reports. The scatter plot of FV’s of neonates born after term and pre-term birth (figure 4) showed that the FV’s of the preterm neonates are also distributed throughout the whole area of neonates born after term birth.
86
Chapter 7
Proefschrift Nicol.indb 86 4-10-2012 14:34:31
Looking for an explanation, we checked if the definition of the gestational age could cause a methodological error. The differences between gestational age according to the last menstrual period and according to the ultrasound measurements were compared. The mean difference was 1.1 days (SD =3.1, range -7 to 27 days). Only in four cases the difference was more than seven days. It is not expected that this influenced the results. Adequate diagnostics using fetal volume will probably be more difficult, because of the larger range of normal values compared to two-dimensional measurements, which is also visible in figure 1. We found a mean difference in percentage error of FV between the normal and low birth weight group of 3.9% with a sd of 21.6%, confirming what is visually expected by looking at figure 3. Namely that FV’s of complicated pregnancies are within the normal range of uncomplicated pregnancies. Therefore, we expect that new technical developments with increasing contrast between the fetus and its surroundings, or an improved ability to analyse the datasets, f.e. I-space [22] will not improve this. In contrary, adding biochemical markers might improve diagnostics [23-25]. This study shows that fetal volume measurements are not useful for detecting pregnancies at risk for preterm birth and/or a low birth weight, due to lack of discriminative power.
87
Ch
ap
ter
7
The predictive value of first trimester fetal volume
Proefschrift Nicol.indb 87 4-10-2012 14:34:31

References 1. Behrman RE, Stith Butler A, Committee on Understanding Premature Birth and Assuring Healthy
Outcomes. Preterm birth: Causes, consequences, and prevention. Washington, D.C. National Academies Press; 2007.
2. Barker DJB. Adult consequences of fetal growht restriction. Clin Obstet Gynecol 2006;49:270-83.
3. Smith GCS, Smith MFS, McNay MB, Fleming JEE. First-trimester growth and the risk of low birth weight. N Engl J Med 1998;339:1817-22.
4. Bukowski R, Smith GCS, Malone FD, Ball RH, Nyberg DA, Comstock CH, Hankins GDV, Berkowitz RL, Gross SJ, Dugoff L, Craigo SD, Timor-Tritsch IE, Carr SR, Wolfe HM, D’Alton ME. Fetal growth in early pregnancy and risk of delivering low birth weight infant: prospective cohort study. BMJ, doi:10.1136/bmj. 39129.637917. AE 2007.
5. Mook-Kanamori DO, Steegers EAP, Eilers PH, Raat H, Hofman A, Jaddoe VWV. Risk factors and outcomes associated with first-trimester fetal growth restriction. JAMA 2010;303:527-534.
6. Odeh M, Ophir E, Maximovsky O, Grinin V, Bornstein J. Placental volume and three-dimensional power Doppler analysis in prediction of pre-eclampsia and small for gestational age between Week 11 and 13 weeks and 6 days of gestation. Prenat Diagn. 2011 Apr;31(4):367-71. doi: 10.1002/pd.2697. Epub 2011 Jan 20.
7. Gardosi J, Francis A. Early pregnancy predictors of preterm birth: the role of a prolonged menstruation-conception interval. BJOG 2000;107:228-37
8. Mercer BM, Merlino AA, Milluzzi CJ, Moore JJ. Small fetal size before 20 weeks’ gestation: associations with maternal tobacco use, early preterm birth, and low birthweight. Am J Obstet Gynecol 2008;198:673.e1-673.e8.
9. Blaas HGK, Taipale P, Torp H, Eik-Nes SH. Three-dimensional ultrasound volume calculations of human embryos and young fetuses: a study on the volumetry of compound structures and its reproducibility. Ultrasound Obstet Gynecol 2006;27:640-6.
10. Falcon O, Peralta CFA, Cavoretto P, Auer M, Nicolaides KH. Fetal trunk and head volume in chromosomally abnormal fetuses at 11+0 to 13+6 weeks of gestation. Ultrasound Obstet Gynecol 2005;26:517-20.
11. Martins WP, Ferriani RA, Nastri CO, Filho FM. First trimester fetal volume and crown-rump length: Comparison betweens singletons and twins conceived by in vitro fertilization. Ultrasound Med Biol 2008;34:1360-4.
12. Martins WP, Nastri CO, Barra DA, Navarro PAAS, Filho FM, Ferriani RA. Fetal volume and crown-rump length from 7 to 10 weeks of gestational age in singletons and twins. Eur J Obstet Gynecol Reprod Biol 2009;145:32-5.
13. Aviram R, Kamar Shpan D, Markovitch O, Fisherman A, Tepper R. Three-dimensional first trimester fetal volumetry; comparison with crown rump length. Early Hum Dev 2004;80:1-5.
14. Falcon O, Peralta CF, Cavoretto P, Faiola S, Nicolaides KH. Fetal trunk and head volume measured by three-dimensional ultrasound at 11+0 to 13+6 weeks of gestation in chromosomally normal pregnancies. Ultrasound Obstet Gynecol 2005;26:263-6.
15. Fajardo-Expósito MA, Hervías B, González FB, Melero-Jiménez V, Quintero-Prado R, Facio-Fernández MC, Bartha JL. First trimester fetal head and trunk volume predict growth disturbance in twin pregnancy. Prenat Diagn. 2011 Jun;31(6):543-7. doi: 10.1002/pd.2739.
16. Antsaklis A, Anastasakis E, Komita O, Theodora M, Hiridis P, Daskalakis G. First trimester 3D volumetry. Association of the gestational volumes with the birth weight. J Matern Fetal Neonatal Med. 2011 Aug;24(8):1055-9. doi: 10.3109/ 14767058.2010.545915. Epub 2011 Jan 19.
17. Nicolaides KH. The 11-13+6 weeks scan. London, The Fetal Medicine Foundation;2004.
18. American College of Obstetricians and Gynecologists. ACOG Practice Bulletin No. 101: Ultrasonography in pregnancy. Obstet Gynecol 2009;113:451-61.
88
Chapter 7
Proefschrift Nicol.indb 88 4-10-2012 14:34:31
19. Raine-Fenning NJ, Clewes JS, Kendall NR, Bunkheila AK, Campbell BK, Johnson IR. The interobserver reliability and validity of volume calculation from three-dimensional ultrasounds datasets in the in vitro setting. Ultrasound Obstet Gynecol 2003;21:283-91.
20. Smeets NAC, Ven van de J, Oei SG. Inter- and intraobserver variation of fetal volume measurements with three-dimensional ultrasound in the first trimester of pregnancy. J Perinat Med 2011;39:539-43.
21. Gaillard R, de Ridder MA, Verburg BO, Witteman JC, Mackenbach JP, Moll HA, Hofman A, Steegers EA, Jaddoe VW. Individually customised fetal weight charts derived from ultrasound measurements: The Generation R Study. Eur J Epidemiol. 2011;26:919-26.
22. Rousian M, Koning AH, van Oppenraaij RH, Hop WC, Verwoerd-Dikkeboom CM, van der Spek PJ, Exalto N, Steegers EA. An innovative virtual reality technique for automated human embryonic volume measurements. Hum Reprod. 2010;25:2210-6. Epub 2010 Jul 19.
23. Karagiannis G, Akolekar R, Sarquis R, Wright D, Nicolaides KH. Prediction of small-for-gestation neonates from biophysical and biochemical markers at 11-13 weeks. Fetal Diagn Ther. 2011;29:148-54. Epub 2010 Nov 16.
24. Poon LC, Karagiannis G, Staboulidou I, Shafiei A, Nicolaides KH. Reference range of birth weight with gestation and first-trimester prediction of small-for-gestation neonates. Prenat Diagn. 2011;31:58-65. doi: 10.1002/pd.2520. Epub 2010 Aug 26.
25. Spencer K, Cowans NJ, Molina F, Kagan KO, Nicolaides KH. First-trimester ultrasound and biochemical markers of aneuploidy and the prediction of preterm or early preterm delivery. Ultrasound Obstet Gynecol. 2008;31:147-52.
89
Ch
ap
ter
7
The predictive value of first trimester fetal volume
Proefschrift Nicol.indb 89 4-10-2012 14:34:31

Proefschrift Nicol.indb 90 4-10-2012 14:34:31
Chapter
Conclusion and perspectives
8
Proefschrift Nicol.indb 91 4-10-2012 14:34:31

Proefschrift Nicol.indb 92 4-10-2012 14:34:31
Complications in pregnancy, such as preterm birth, low birth weight and birth weight that is small for gestational age, are expected to be the result of the intra-uterine conditions in the first trimester of pregnancy. The commonly used two-dimensional fetal ultrasound measurements have shown a low predictive quality with regard to prediction of these complications [1-6]. This thesis discusses whether adding the third dimension increases the predictive value of fetal measurements in the first trimester of pregnancy resulting in a predictive instrument for the selection of pregnancies with a high risk for preterm birth and or a low birth weight.First, the basics of the volume measurements with three-dimensional ultrasound were tested in vitro. Then, the value of first trimester fetal volume measurements is assessed in vivo by clinical studies.
In vitro studies
Since the introduction of three-dimensional ultrasound in clinical practice, it has become possible to measure volumes of a scanned object with computer calculations. It is the general opinion that volume calculations with three-dimensional ultrasound will be of diagnostic value in general gynecologic and obstetric practice [7]. The current available methods for volume calculation are, however, rather complex and time-consuming. For this reason introduction in daily practice is still difficult.The most frequently used method to obtain volume measurements from 3D volume datasets is the rotational multi-planar technique VOCAL™ (Volume Organ Computer Aided analysis) [8]. This method is currently installed on most of the three-dimensional ultrasound devices and used in the quest for new diagnostic tools in obstetrics and gynecology. The accuracy and reproducibility of the VOCAL technique are described in several settings [9-13]. They concluded that the VOCAL technique greatly reduced the time required to conduct volume measurements and the manual labour required for volume measurements with a high accuracy and reproducibility. The procedure of volume measurements with VOCAL is described in detail in the introduction of this thesis (Chapter 1). Volume calculations with the VOCAL technique are rather complex. Drawing all the circumferences exactly around the object of interest requires concentration and a steady hand. Slight mismatches may have quite an influence on the calculated volume. As part of the analysis of a new measurement technique it is important to assess the value and limitations of this technique. Therefore we performed in vitro studies in advance of in vivo studies.First, it was hypothesized that there would be a learning curve for the volume measurements. The learning curve study (Chapter 2) shows that there is no significant difference between the measurements of inexperienced sonographers and the measurements of an expert. In addition, there was no significant decline in the measurement error and the time needed for each measurement decreased first, but stabilized already after four measurements.
93
Ch
ap
ter
8
Conclusion and perspectives
Proefschrift Nicol.indb 93 4-10-2012 14:34:32

Therefore, it is concluded that there is no significant learning curve for the performance of 3DUS volume measurements with the VOCAL technique. As a result, it is not necessary to develop a training program in advance of further research or eventually before introducing volume measurements with three-dimensional ultrasound in daily practice.Secondly, knowledge about the measurement error of the volume measurements is necessary. Chapter 3 describes the relation between the volume of an object and the measurement error in vitro for a range of volumes that are comparable to actual fetal volumes in the first trimester of pregnancy. The results show that the VOCAL technique overestimates the actual volumes and that the absolute error increases significantly with an increasing volume of interest. The percentage error, i.e. absolute measurement error expressed as a percentage of the actual volume, was smaller for larger objects. One should be aware of the volume-dependent absolute and percentage measurement error when interpreting the measured values. Despite earlier promising results, fetal volume measurements with three-dimensional ultrasound are still not used in daily practice. This is understandable, as the current methods for three-dimensional ultrasound volume measurements are time consuming and rather difficult to perform. Recently, new methods for volume measurements with three-dimensional ultrasound, as XI-VOCAL, Sono-AVC and the measurements in I-space with V-scope, have become available. Our efforts to use XI-VOCAL and Sono-AVC for fetal volume calculations at 12 weeks of gestational age were unsuccessful. Furthermore, V-scope is not yet generally available. Previous reports confirm that all these newly developed techniques are not suited for fetal volume measurements [14-16]. Chapter 4 describes explorative research in order to develop and verify a more practical semi-automated method for volume calculations with 3DUS images. The results of this study show that mathematical volume calculations are possible with the semi-automated method. It is commonly known that the VOCAL technique has a structural overestimation of the volume, probably caused by blurring of the contours of the object. The developed semi-automated method has a structural underestimation of the volume, possibly because of the detection of the inner contour of the object. In the future, new software that recognizes the expected shape of the measured object and automatically fills in the logic blanks in the image could be added to improve the performance of this new method. Unfortunately, the main limitation of the mathematical method at this moment is that only the volumes of ellipsoid structures can be calculated. Further development of this method using spherical harmonics might succeed in calculating the volume of irregular objects. This method was successfully applied on a first trimester fetus, the points of interest at the contour of the fetal head and body were detected. The calculated fetal volume was 23.4 cm3, which is in the normal range for a fetus of 12 weeks of gestation. We also succeeded in detecting voxels in the whole contour of a first trimester fetus, including the limbs, with a gestational age of 12 weeks.
94
Chapter 8
Proefschrift Nicol.indb 94 4-10-2012 14:34:32
Clinical studies
Slow first trimester fetal growth, measured with the commonly used two-dimensional ultrasound parameters, is related to an increased risk of adverse birth outcomes such as preterm birth and low birth weight for gestational age [1-3]. The differences between normal and abnormal growth in early pregnancy are small if the fetal size is measured by the crown-rump-length (CRL). Abnormal growth is calculated as a difference in expected fetal size (according to the last menstrual period) minus the calculated fetal size by ultrasound (CRL/BPD) in days, where earlier cut-off values for abnormal growth range from −1 to -10 days [1,5,6]. The weakness of using CRL for defining abnormal growth is the low predictive quality and therefore is not a good screening test for detecting high risk pregnancies.Three-dimensional ultrasound volume measurements might give more information about fetal development than two-dimensional ultrasound measurements. Fetal volume measurements proved to be reliable and reproducible [17,18], even in twins [19,20]. A significant correlation between fetal volume and the CRL had already been confirmed, with an up to 35-fold increase of the fetal volume and a 4.5-fold increase of the CRL in the first trimester of pregnancy [17-19,21,22]. As the fetal volume rises 7 times faster than the CRL, it can be expected that slight abnormalities in the CRL will be more obvious in fetal volume measurements. The chromosomal abnormal fetus has a significantly smaller fetal volume than the chromosomal normal fetus, whereas the CRL in trisomy 21 and Turner syndrome were normal [18,22]. These findings suggest that it is possible to detect early growth impairment with fetal volume measurements, in cases with a normal CRL. Detection of the fetus with a small fetal volume might result in earlier detection of high risk pregnancies.Due to the complexity of the VOCAL method, the inter- and intra-observer variation of fetal volume measurements with three-dimensional ultrasound should be determined in advance of a prospective follow up study of the relation between fetal volume and complications in pregnancy. Chapter 5 discusses the inter-and intraobserver variation of abdominal fetal volume measurements with three-dimensional ultrasound measurements of the fetal head and rump in 65 consecutive pregnant women with a gestational age of 11+0 – 13+6 weeks. The VOCAL method with a rotational angle of 9° was used. The inter- and intraobserver reproducibility of fetal volume by 3DUS appears to be high, i.e. inter- and intra-class correlation of 0.934 and 0.994, respectively, despite of a consistent overestimation by one of the two observers. Because of all these promising results, a prospective cohort study was performed to determine whether it is possible to detect a fetus at risk for preterm birth and/or low birth weight for gestational age by measuring the fetal volume with three-dimensional ultrasound in the first trimester of pregnancy, of which the study protocol is discussed in chapter 6. During the routine first trimester ultrasound examination 538 participants were included. Volume
95
Ch
ap
ter
8
Conclusion and perspectives
Proefschrift Nicol.indb 95 4-10-2012 14:34:32
measurements were performed with VOCAL using a rotational step of 9°. First, the relation between fetal volume and gestational age for a set of participants with normal pregnancies (training set) was assessed using multiple linear regression analysis, which was then used to determine the expected normal values. Secondly, for a new set of participants with normal pregnancies and a set of participants with complicated pregnancies (preterm birth and/or low birth weight), i.e. the validation set, the observed fetal volumes were compared with their expected normal values and expressed as a percentage of the expected normal value (percentage error). The difference in mean percentage error was then assessed with the independent-samples t-test. Finally, logistic regression analysis was applied to the validation set in order to analyse the possibility of predicting the pregnancy outcome after fetal volume calculation in the first trimester using this percentage error. The prediction quality is presented by the area under the ROC curve (AUC). Complicated pregnancies were defined by preterm birth and/or low birth weight for gestational age or only by low birth weight for gestational age. The CRL already proved to have a low predictive quality in relation to preterm birth and/or low birth weight [1-6]. As the CRL was available in this study, we performed a secondary analysis to test this statement using the same analysis as for the analysis for fetal volume measurements. During this study, individual growth curves in order to exclude the individual influence of fetal growth were introduced [23]. This formula uses more parameters, including ethnicity. Because of their interesting results, we decided to apply their formula to the data from this study using the same analysis as mentioned before. Chapter 7 discusses the results of the prospective cohort study. The difference in mean percentage error between normal and complicated pregnancies (preterm birth and/or low birth weight for gestational age, or only low birth weight for gestational age) was neither significant (p = 0.630 and 0.290, respectively) nor clinically relevant (standardized effect sizes of 0.061 and 0.179, respectively). As a consequence, the predicting quality was also very low (AUC = 0.508 and 0.545, respectively). The fetal volumes of the neonates born after preterm birth and/or a low birth weight are distributed throughout the range of the neonates born after preterm birth and/or a normal birth weight. Analysis for CRL as a predictor of a low birth weight and the analysis with the individual growth curves showed results similar to the original analysis, i.e. neither significant nor clinically relevant differences between the normal and complicated group. First trimester CRL measurements showed a relationship between fetal size and birth weight. The conclusion that two-dimensional fetal measurements were not a good predictive diagnostic test because of the small differences between the normal and abnormal measurements, resulting in a low predictive quality [1-6] was confirmed by our secondary analysis. Adding the extra third dimension to the measurement seemed promising because of the exponential rise of the fetal volume in the first trimester compared to the linear rise of the CRL. It was expected that slight abnormalities in the CRL would be more obvious in the fetal volume measurements [18-22]. Earlier reports described about up to 15 % differences in
96
Chapter 8
Proefschrift Nicol.indb 96 4-10-2012 14:34:32
the fetal volume compared to the chromosomal abnormal fetus [18,22], prediction of inter-twin growth disturbances [19,20] and a pilot study reporting of a good correlation between fetal volume and birth weight [24] were encouraging enough to expect that fetal volume measurements would be valuable for predicting high risk pregnancies. However, the results of this study show that fetal volume is not suitable for predicting high risk pregnancies. The difference between the fetal volume of normal and abnormal pregnancies is rather small and the range of fetal volumes within a group is large for the normal group as well as for the abnormal group. As a result, the values of the abnormal measurements in complicated pregnancies are positioned throughout the whole area of the normal measurements, indicating that it is hard to distinguish the complicated pregnancies from the normal ones by fetal volume alone. Therefore, we expect that new technical developments with increasing contrast between the fetus and its surroundings, or an improved ability to analyse the datasets, e.g. I-space [14,15] will not improve the predictive quality enough for a diagnostic test for daily practice. In contrary, adding biochemical markers might improve diagnostics [25-27]. This study shows that, due to lack of discriminative power, fetal volume measurements are not useful as a prognostic instrument for predicting pregnancies of high risk for preterm birth or a low birth weight.
In conclusion, three-dimensional fetal volume measurements in the first trimester of pregnancy are not useful for detecting pregnancies at risk for preterm birth and/or a low birth weight. The combination with biochemical markers can be subject of future research. If fetal volume measurements appear to be useful after all, then we have shown that there is no learning curve for the volume measurements with three-dimensional ultrasound, and that the inter- and intraobserver variation of these measurements are good. Further research concerning automated volume measurements or automated detection of the expected fetal shape might be helpful in pregnancy dating and detection of congenital anomalies.
97
Ch
ap
ter
8
Conclusion and perspectives
Proefschrift Nicol.indb 97 4-10-2012 14:34:32
References 1. Smith GCS, Smith MFS, McNay MB, Fleming JEE. First-trimester growth and the risk of low birth
weight. N Engl J Med 1998;339:1817-22.
2. Bukowski R, Smith GCS, Malone FD, Ball RH, Nyberg DA, Comstock CH, Hankins GDV, Berkowitz RL, Gross SJ, Dugoff L, Craigo SD, Timor-Tritsch IE, Carr SR, Wolfe HM, D’Alton ME. Fetal growth in early pregnancy and risk of delivering low birth weight infant: prospective cohort study. BMJ, doi:10.1136/bmj.39129. 637917. AE 2007.
3. Mook-Kanamori DO, Steegers EAP, Eilers PH, Raat H, Hofman A, Jaddoe VWV. Risk factors and outcomes associated with first-trimester fetal growth restriction. JAMA 2010;303:527-534.
4. Odeh M, Ophir E, Maximovsky O, Grinin V, Bornstein J. Placental volume and three-dimensional power Doppler analysis in prediction of pre-eclampsia and small for gestational age between Week 11 and 13 weeks and 6 days of gestation. Prenat Diagn. 2011 Apr;31(4):367-71. doi: 10.1002/pd.2697. Epub 2011 Jan 20.
5. Gardosi J, Francis A. Early pregnancy predictors of preterm birth: the role of a prolonged menstruation-conception interval. BJOG 2000;107:228-37.
6. Mercer BM, Merlino AA, Milluzzi CJ, Moore JJ. Small fetal size before 20 weeks’ gestation: associations with maternal tobacco use, early preterm birth, and low birthweight. Am J Obstet Gynecol 2008;198:673.e1-673.e8.
7. Geomini PM, Coppus SF, Kluivers KB, Bremer GL, Kruitwagen RF, Mol BW. Is three-dimensional ultrasonography of additional value in the assessment of
adnexal masses? Gynecol Oncol 2007;106:153-9.
8. Kusanovic JP, Nien JK, Gonçalves LF, Espinoza J, Lee W, Balasubramaniam M, Soto E, Erez O, Romero R. The use of inversion mode and 3D manual segmentation in volume measurement of fetal fluid-filled structures: Comparison with Virtual Organ Computer-aided AnaLysis (VOCALTM). Ultrasound Obstet Gynecol. 2008;31:177–186.
9. Hui-Xiong X, Xiao-Yu Y, Ming-De L, Guang-Jian Liu, Zuo-Feng X. Estimation of liver tumor volume using a three-dimensional ultrasound volumetric system. Ultrasound in Med & Biol 2003;29:839-846.
10. Raine-Fenning NJ, Clewes JS, Kendall NR, Bunkheila AK, Campbell BK, Johnson IR. The interobserver reliability and validity of volume calculation from three-dimensional ultrasound datasets in the in vitro setting. Ultrasound Obstet Gynecol 2003;21:283-291.
11. Ruano R, Martinovic J, Dommergues M, Aubry M-C, Dumez Y, Benachi A. Accuracy of fetal lung volume assessed by three-dimensional sonography. Ultrasound Obstet Gynecol 2005;26:725-730.
12. Moeglin D, Talmant C, Duyme M, Lopez AC. Fetal lung volumetry using two- and three-dimensional ultrasound. Ultrasound Obstet Gynecol 2005;25:119-127.
13. Raine-Fenning NJ, Campbell B, Collier J, Brincat M, Johnson I. The reproducibility of endometrial volume acquisition and measurement with the VOCAL-imaging. program. Ultrasound Obstet Gynecol 2002;19:69-75.
14. Rousian M, Koning AH, van Oppenraaij RH, et al. An innovative virtual reality technique for automated human embryonic volume measurements. Hum Reprod 2010;25:2210-6.
15. Rousian M, Verwoerd-Dikkeboom CM, Koning AH, et al. Early pregnancy volume measurements: Validation of ultrasound techniques and new perspectives. BJOG 2009;116:278-85.
16. Sur S, Marsh A, Campbell B, Raine-Fenning N. Re: Gestational sac volume: comparison between SonoAVC and VOCAL measurements at 11 + 0 to 13 + 6 weeks of gestation.Ultrasound Obstet Gynecol. 2010 Nov;36:648-9; author reply 649-51.
98
Chapter 8
Proefschrift Nicol.indb 98 4-10-2012 14:34:32
17. Blaas HGK, Taipale P, Torp H, Eik-Nes SH. Three-dimensional ultrasound volume calculations of human embryos and young fetuses: a study on the volumetry of compound structures and its reproducibility. Ultrasound Obstet Gynecol 2006;27:640-6.
18. Falcon O, Peralta CFA, Cavoretto P, Auer M, Nicolaides KH. Fetal trunk and head volume in chromosomally abnormal fetuses at 11+0 to 13+6 weeks of gestation. Ultrasound Obstet Gynecol 2005;26:517-20.
19. Martins WP, Ferriani RA, Nastri CO, Filho FM. First trimester fetal volume and crown-rump length: Comparison betweens singletons and twins conceived by in vitro fertilization. Ultrasound Med Biol 2008;34:1360-4.
20. Martins WP, Nastri CO, Barra DA, Navarro PAAS, Filho FM, Ferriani RA. Fetal volume and crown-rump length from 7 to 10 weeks of gestational age in singletons and twins. Eur J Obstet Gynecol Reprod Biol 2009;145:32-5.
21 Aviram R, Kamar Shpan D, Markovitch O, Fisherman A, Tepper R. Three-dimensional first trimester fetal volumetry; comparison with crown rump length. Early Hum Dev 2004;80:1-5.
22. Falcon O, Peralta CF, Cavoretto P, Faiola S, Nicolaides KH. Fetal trunk and head volume measured by three-dimensional ultrasound at 11+0 to 13+6 weeks of gestation in chromosomally normal pregnancies. Ultrasound Obstet Gynecol 2005;26:263-6.
23. Gaillard R, de Ridder MA, Verburg BO, Witteman JC, Mackenbach JP, Moll HA, Hofman A, Steegers EA, Jaddoe VW. Individually customised fetal weight charts derived from ultrasound measurements: The Generation R Study. Eur J Epidemiol. 2011;26:919-26.
24. Antsaklis A, Anastasakis E, Komita O, Theodora M, Hiridis P, Daskalakis G. First trimester 3D volumetry. Association of the gestational volumes with the birth weight. J Matern Fetal Neonatal Med. 2011 Aug;24(8):1055-9. doi: 10.3109/ 14767058.2010.545915. Epub 2011 Jan 19.
25. Karagiannis G, Akolekar R, Sarquis R, Wright D, Nicolaides KH. Prediction of small-for-gestation neonates from biophysical and biochemical markers at 11-13 weeks. Fetal Diagn Ther. 2011;29:148-54. Epub 2010 Nov 16.
26. Spencer K, Cowans NJ, Molina F, Kagan KO, Nicolaides KH. First-trimester ultrasound and biochemical markers of aneuploidy and the prediction of preterm or early preterm delivery. Ultrasound Obstet Gynecol. 2008;31:147-52.
27. Poon LC, Karagiannis G, Staboulidou I, Shafiei A, Nicolaides KH. Reference range of birth weight with gestation and first-trimester prediction of small-for-gestation neonates. Prenat Diagn. 2011;31:58-65. doi: 10.1002/pd.2520. Epub 2010 Aug 26.
99
Ch
ap
ter
8
Conclusion and perspectives
Proefschrift Nicol.indb 99 4-10-2012 14:34:32

Proefschrift Nicol.indb 100 4-10-2012 14:34:32
Summary
Proefschrift Nicol.indb 101 4-10-2012 14:34:32

Proefschrift Nicol.indb 102 4-10-2012 14:34:32
Summary
Fetal volume measurements in the first trimester of pregnancy with three-dimensional ultrasoundPreterm birth and a low birth weight are major complications with significant consequences for families and society. It is expected that these complications are the result of the intra-uterine conditions in the first trimester of pregnancy. If it would be possible to detect the fetus at risk early in pregnancy, the obstetric care can be adjusted accordingly.Earlier reports suggested that fetal growth in the first trimester of pregnancy is of significant value in assessing these complications in pregnancy. If fetal growth was measured with routine two-dimensional ultrasound, the clinical value of the findings is unclear, due to the small differences between normal and abnormal growth (chapter 1). The extra third dimension with three-dimensional ultrasound is expected to give more information about fetal development. As the fetal volume rises seven times faster than the crown-rump-length (routine two-dimensional measurement), the hypothesis is that impaired fetal growth will be more obvious with three-dimensional ultrasound. This thesis describes in vitro and in vivo studies in order to analyze the still rather complex volume measurements with three-dimensional ultrasound. Furthermore the predictive value of fetal volume measurements in relation to pregnancy outcome is discussed.
In vitro studies
Three-dimensional volume measurements are expected to be of diagnostic value in general gynecologic and obstetric practice. Despite that the introduction of volume measurements with VOCAL was an advancement, the volume measurements are still rather time consuming and complex, as explained in chapter 1. The learning curve for volume measurements with three-dimensional ultrasound and VOCAL were analyzed in chapter 2. There is no significant learning curve for volume measurements with three-dimensional ultrasound. In addition, the measurements from inexperienced sonographers were similar to those of an expert. Chapter 3 describes the relation between the volume of an object and the measurement error in vitro for a range of volumes that are comparable to actual fetal volumes in the first trimester of pregnancy. The results show that the percentage error, i.e. absolute measurement error expressed as a percentage of the actual volume, was smaller for larger objects. One should be aware of the volumedependent absolute and percentage measurement error when interpreting the measured values. Explorative research in order to develop and verify a more practical semi-automated method for volume calculations with 3DUS images is evaluated in chapter 4. The results of this study show that mathematical volume calculations are possible with the newly developed
103
Summary
Proefschrift Nicol.indb 103 4-10-2012 14:34:33
semi-automated method. This method was successfully applied on a first trimester fetus, where the points of interest at the contour of the fetal head and body were detected. We also succeeded in detecting voxels in the whole contour, including the limbs, of a first trimester fetus with a gestational age of 12 weeks.
In vivo studies
The high inter- and intra-observer reliability of abdominal fetal volume measurements with three-dimensional ultrasound measurements of the fetal head and rump, i.e. an inter- and intra-class correlation of 0.934 and 0.994, respectively is discussed in Chapter 5. Because of all these promising results, a prospective cohort study was performed to determine whether it is possible to detect a fetus at risk for preterm birth and/or low birth weight by measuring the fetal volume with three-dimensional ultrasound in the first trimester of pregnancy, of which the study protocol is described in Chapter 6. The results of this prospective cohort study are reported in Chapter 7. The difference in mean percentage error between normal and complicated pregnancies (preterm birth and/or low birth weight) was neither significant nor clinically relevant. The fetal volumes of the neonates born after preterm birth and/or low birth weight are distributed throughout the range of the neonates born after an uncomplicated pregnancy, indicating that it is hard to distinguish the complicated pregnancies from the normal ones by the first trimester fetal volume alone. Analysis for CRL as a predictor of a low birth weight and the analysis with the individual growth curves showed results similar to the original analysis, i.e. no significant or clinically relevant differences between the normal and complicated group.
In conclusion, the measurement of the three-dimensional fetal volume in the first trimester of pregnancy is, by itself, not useful for detecting pregnancies at risk for preterm birth and/or low birth weight. The combination with biochemical markers can be subject of future research. If fetal volume measurements appear to be useful after all, then we know that there is no learning curve for the volume measurements with three-dimensional ultrasound and that the inter- and intraobserver reliability of these measurements are good. Further research concerning automated volume measurements or automated detection of the expected fetal shape might be helpful in pregnancy dating and detection of congenital anomalies.
104
Summary
Proefschrift Nicol.indb 104 4-10-2012 14:34:33
Samenvatting
Proefschrift Nicol.indb 105 4-10-2012 14:34:33

Proefschrift Nicol.indb 106 4-10-2012 14:34:33
Samenvatting
Foetale volume metingen in het eerste trimester van de zwangerschap met driedimensionale echoscopieVroeggeboorte en een laag geboortegewicht zijn belangrijke complicaties in de zwangerschap met significante gevolgen voor de betrokkenen en de maatschappij. Naar verwachting zijn deze complicaties het gevolg van intra-uteriene omstandigheden in het eerste trimester van de zwangerschap. Als de foetus met een verhoogd risico voor deze complicaties reeds in het eerste trimester geselecteerd zou kunnen worden, zou de obstetrische zorg hieraan kunnen worden aangepast.Eerdere publicaties suggereren dat een verminderde foetale groei in het eerste trimester van de zwangerschap een voorspeller voor vroeggeboorte en/of een laag geboortegewicht kan zijn. De klinische waarde van deze bevindingen is, bij tweedimensionale metingen, vanwege de kleine verschillen tussen de normale en abnormale foetale groei onduidelijk (hoofdstuk 1). De toevoeging van de derde dimensie, driedimensionale echoscopie, zal naar verwachting resulteren in extra kennis over de foetale ontwikkeling in het eerste trimester. Aangezien het foetale volume zeven maal sneller toeneemt dan de CRL (routine tweedimensionale meting van de foetale kruin-stuitlengte), is de hypothese dat vertraagde groei hiermee beter op te sporen is.Dit proefschrift beschrijft de analyse van de nog vrij complexe driedimensionale volume metingen in vitro en in vivo. Tevens wordt de voorspellende waarde van foetale volume metingen met betrekking tot de zwangerschapsuitkomst onderzocht.
In vitro studies
Van driedimensionale echoscopische volume metingen wordt een toegevoegde diagnostische waarde voor de algemene gynaecologie en verloskunde verwacht. Hoewel de volume metingen met de introductie van VOCAL sterk zijn vereenvoudigd, kosten de metingen nog vrij veel tijd en zijn ze nog tamelijk complex, zoals wordt uitgelegd in hoofdstuk 1.De leercurve voor volume metingen met driedimensionale echoscopie en VOCAL wordt geanalyseerd in hoofdstuk 2. Er is geen significante leercurve voor volume metingen met driedimensionale echoscopie. De metingen van onervaren echoscopisten waren niet verschillend ten opzichte van de resultaten van de expert.Hoofdstuk 3 beschrijft een in vitro studie naar de meetfout in relatie tot het volume. Hiervoor werd in de testopstelling gebruikt gemaakt van objecten vergelijkbaar met het foetale volume in het eerste trimester. De procentuele meetfout, de absolute meetfout uitgedrukt als percentage van het werkelijke volume, was kleiner bij een kleiner volume.
107
Samenvatting
Proefschrift Nicol.indb 107 4-10-2012 14:34:33
Bij interpretatie van de metingen is het belangrijk rekening te houden met de absolute en procentuele meetfout.Verkennend onderzoek met betrekking tot de ontwikkeling van een meer praktische semi-geautomatiseerde methode voor volume metingen met driedimensionale echoscopie wordt besproken in hoofdstuk 4. Deze studie laat zien dat mathematische in vitro volume metingen mogelijk zijn met deze semi-geautomatiseerde methode. Tevens werd deze methode toegepast op de dataset van een eerste trimester foetus, waarbij het volume van het foetale hoofd en de romp werd berekend. Ook werden de voxels van de hele foetale contour inclusief ledematen gedetecteerd.
In vivo studies
De hoge inter- en intraobserver betrouwbaarheid van transabdominale foetale volume metingen met driedimensionale echoscopie van het foetale hoofd en de romp, met een inter- en intraclass correlatie van respectievelijk 0.934 en 0.994, wordt beschreven in hoofdstuk 5.Vanwege al deze veelbelovende resultaten, werd een prospectief cohort onderzoek uitgevoerd naar de mogelijke selectie van de eerste trimester foetus met een verhoogd risico op vroeggeboorte en/of een laag geboortegewicht middels foetale volume metingen met driedimensionale echoscopie. Het protocol van deze studie wordt beschreven in hoofdstuk 6. De resultaten van de prospectieve cohortstudie worden gerapporteerd in hoofdstuk 7. Het verschil in gemiddelde procentuele afwijking ten opzichte van het verwachtte volume tussen normale en gecompliceerde zwangerschappen (vroeggeboorte en/of laag geboortegewicht) was noch significant noch klinische relevant verschillend. De foetale volumes van pasgeborenen na vroeggeboorte en/of met een laag geboortegewicht zijn verspreid over de hele range van pasgeborenen na een niet-gecompliceerde zwangerschap, wat duidelijk maakt dat gecompliceerde zwangerschappen moeilijk zijn te onderscheiden op basis van het foetale volume in het eerste trimester van de zwangerschap. Analyse van de CRL als een voorspeller voor een laag geboortegewicht en de analyse met individuele groeicurves lieten dezelfde resultaten zien, geen significante of klinisch relevante verschillen tussen de normale en gecompliceerde groep.
De conclusie van het onderzoek beschreven in dit proefschrift is dat driedimensionale foetale volume metingen in het eerste trimester van de zwangerschap, alleen, niet geschikt zijn voor het voorspellen van zwangerschappen met een verhoogd risico op vroeggeboorte en/of een laag geboortegewicht. De waarde van deze parameter in combinatie met biochemische markers kan onderwerp zijn van toekomstig onderzoek. Als foetale volume metingen uiteindelijk zinvol blijken te zijn, is bekend dat er geen leercurve is voor deze
108
Samenvatting
Proefschrift Nicol.indb 108 4-10-2012 14:34:33

metingen en dat de inter- en intra-observer betrouwbaarheid goed is. Verdere ontwikkeling van automatische volume metingen of het detecteren van de verwachtte foetale vorm kan toegevoegde waarde hebben met betrekking tot het vaststellen van de zwangerschapsduur en het opsporen van congenitale afwijkingen.
109
Samenvatting
Proefschrift Nicol.indb 109 4-10-2012 14:34:33

Proefschrift Nicol.indb 110 4-10-2012 14:34:33

List of abbreviations
Proefschrift Nicol.indb 111 4-10-2012 14:34:34

Proefschrift Nicol.indb 112 4-10-2012 14:34:34
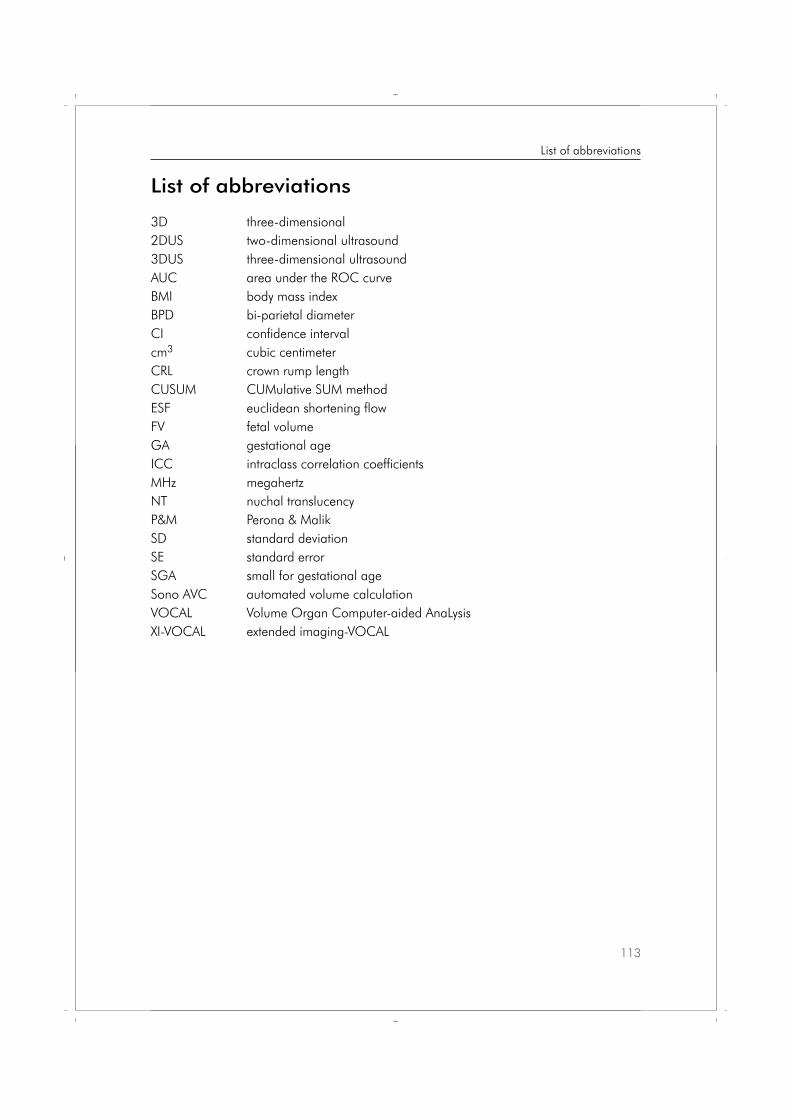
List of abbreviations
3D three-dimensional2DUS two-dimensional ultrasound3DUS three-dimensional ultrasoundAUC area under the ROC curveBMI body mass indexBPD bi-parietal diameterCI confidence intervalcm3 cubic centimeterCRL crown rump lengthCUSUM CUMulative SUM methodESF euclidean shortening flow FV fetal volumeGA gestational ageICC intraclass correlation coefficients MHz megahertzNT nuchal translucencyP&M Perona & MalikSD standard deviationSE standard errorSGA small for gestational ageSono AVC automated volume calculation VOCAL Volume Organ Computer-aided AnaLysisXI-VOCAL extended imaging-VOCAL
113
List of abbreviations
Proefschrift Nicol.indb 113 4-10-2012 14:34:34

Proefschrift Nicol.indb 114 4-10-2012 14:34:34

List of publications
Proefschrift Nicol.indb 115 4-10-2012 14:34:34

Proefschrift Nicol.indb 116 4-10-2012 14:34:34
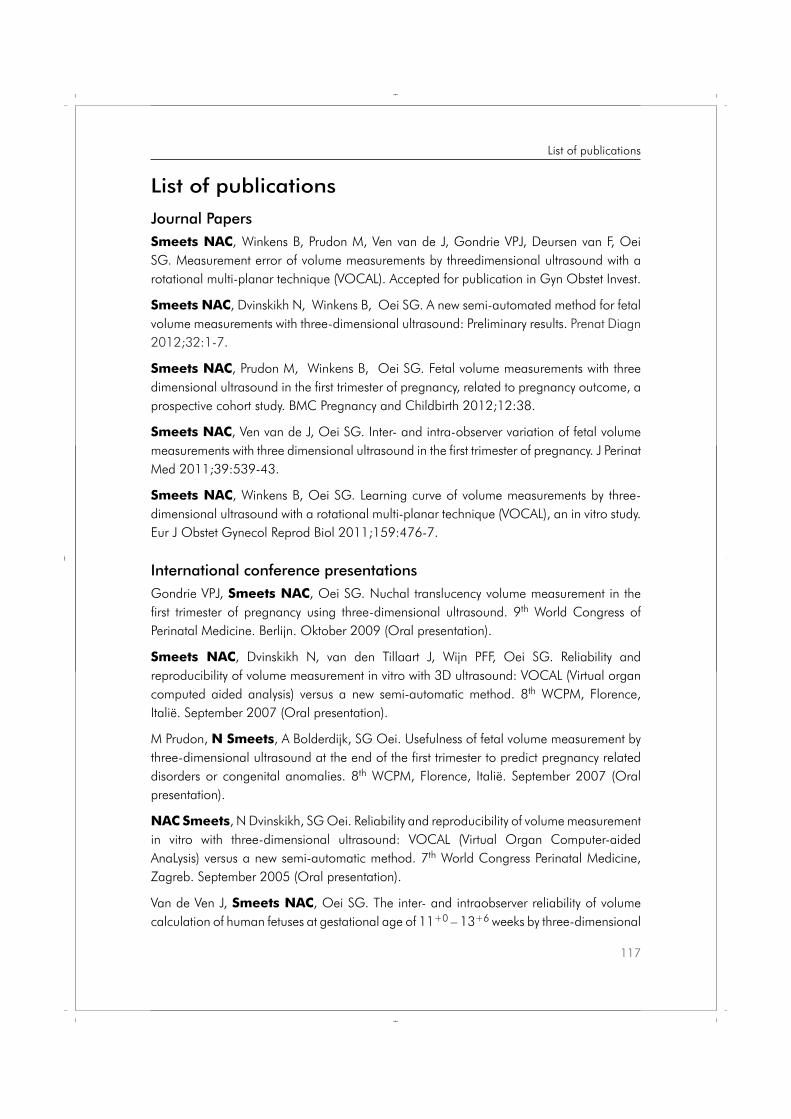
List of publications
Journal PapersSmeets NAC, Winkens B, Prudon M, Ven van de J, Gondrie VPJ, Deursen van F, Oei SG. Measurement error of volume measurements by threedimensional ultrasound with a rotational multi-planar technique (VOCAL). Accepted for publication in Gyn Obstet Invest.
Smeets NAC, Dvinskikh N, Winkens B, Oei SG. A new semi-automated method for fetal volume measurements with three-dimensional ultrasound: Preliminary results. Prenat Diagn 2012;32:1-7.
Smeets NAC, Prudon M, Winkens B, Oei SG. Fetal volume measurements with three dimensional ultrasound in the first trimester of pregnancy, related to pregnancy outcome, a prospective cohort study. BMC Pregnancy and Childbirth 2012;12:38.
Smeets NAC, Ven van de J, Oei SG. Inter- and intra-observer variation of fetal volume measurements with three dimensional ultrasound in the first trimester of pregnancy. J Perinat Med 2011;39:539-43.
Smeets NAC, Winkens B, Oei SG. Learning curve of volume measurements by three-dimensional ultrasound with a rotational multi-planar technique (VOCAL), an in vitro study. Eur J Obstet Gynecol Reprod Biol 2011;159:476-7.
International conference presentations Gondrie VPJ, Smeets NAC, Oei SG. Nuchal translucency volume measurement in the first trimester of pregnancy using three-dimensional ultrasound. 9th World Congress of Perinatal Medicine. Berlijn. Oktober 2009 (Oral presentation).
Smeets NAC, Dvinskikh N, van den Tillaart J, Wijn PFF, Oei SG. Reliability and reproducibility of volume measurement in vitro with 3D ultrasound: VOCAL (Virtual organ computed aided analysis) versus a new semi-automatic method. 8th WCPM, Florence, Italië. September 2007 (Oral presentation).
M Prudon, N Smeets, A Bolderdijk, SG Oei. Usefulness of fetal volume measurement by three-dimensional ultrasound at the end of the first trimester to predict pregnancy related disorders or congenital anomalies. 8th WCPM, Florence, Italië. September 2007 (Oral presentation).
NAC Smeets, N Dvinskikh, SG Oei. Reliability and reproducibility of volume measurement in vitro with three-dimensional ultrasound: VOCAL (Virtual Organ Computer-aided AnaLysis) versus a new semi-automatic method. 7th World Congress Perinatal Medicine, Zagreb. September 2005 (Oral presentation).
Van de Ven J, Smeets NAC, Oei SG. The inter- and intraobserver reliability of volume calculation of human fetuses at gestational age of 11+0 – 13+6 weeks by three-dimensional
117
List of publications
Proefschrift Nicol.indb 117 4-10-2012 14:34:34
ultrasound. 35th Annual Meeting of Fetal and Neonatal Physiological Society, 2008, Maastricht (Poster presentation).
Van de Ven J, Smeets NAC, Oei SG. The inter- and intraobserver reliability of total uterus volume calculation at gestational age of 11+0 – 13+6 weeks by three-dimensional ultrasound. XXIst ECPM, 2008, Istanbul (Poster presentation).
Prudon M, Smeets NAC, Oei SG. Normal values of fetal volume measurement by three-dimensional ulstrasound using the VOCAL technique. 8th WCPM 2007, Florence, Italië (Poster presentation).
Gutteling J, Prudon M, Pasmans P, Smeets NAC, Oei SG, Wijn P. Semi-automatic fetal volume calculations for 3d-US datasets. 8th WCPM 2007, Florence, Italië (Poster presentation).
Deursen van FJHM, Smeets NAC, Oei SG. Fetal volume measurement at a gestational age of 11+0 - 13+6 weeks by three-dimensional ultrasound. 20th World Congress on Ultrasound in Obstetrics and Gynecology, 2010, Praag, Tsjechië (Oral poster presentation).
Habraken MAM, Smeets NAC. 3D transvaginal ultrasound (TVU) measurement of cervical volume in pregnant women.. 20th World Congress on Ultrasound in Obstetrics and Gynecology, 2010, Praag, Tsjechië (Oral poster presentation).
118
List of publications
Proefschrift Nicol.indb 118 4-10-2012 14:34:34

Dankwoord
Proefschrift Nicol.indb 119 4-10-2012 14:34:35

Proefschrift Nicol.indb 120 4-10-2012 14:34:35
Dankwoord
En dan is het toch ineens zover, mijn proefschrift is klaar! Dit dankzij de bijdrage van velen, zonder iemand tekort te willen doen wil ik een aantal personen in het bijzonder noemen.Allereerst natuurlijk de patiënten die hebben deelgenomen aan de studie, zowel in de verkennende fase als in de uiteindelijke studie.
Prof.dr. S.G. Oei, beste Guid, ik zie nog voor me hoe jij en Leon onder de indruk waren van de eerste demonstratie van de driedimensionale echoscopie met de Voluson. Al snel werden er verschillende onderzoeken bedacht. Ik mocht tien jaar geleden met jou mee naar de 3D echocursus in Wenen, dat was een fantastische ervaring! Hierna volgden nog meerdere internationale congresbezoeken met voordrachten of poster presentaties, waarbij jij steeds een enthousiast mental coach en reisleider was, zelfs al joggend in de vroege ochtend. Het heeft even geduurd voordat het eerste artikel werd gepubliceerd, het leven is ook zo mooi… Het wekelijkse overleg was een gouden greep. Guid, enorm veel dank voor al je geduld, altijd positieve begeleiding, peptalks in moeilijkere tijden en voor alles dat je voor me hebt gedaan. Ook voor mij ben je een voorbeeld, zo positief en aanstekelijk enthousiast als jij altijd in het leven staat, ongelooflijk wat jij allemaal onderneemt en voor elkaar krijgt.
Dr. B. Winkens, beste Bjorn, dank voor je begeleiding onder andere bij het statistische deel van dit proefschrift. Jij zorgt er voor dat een wazige wolk met data opklaart en overzichtelijk wordt.
Prof.dr. P.F.F. Wijn, prof.dr. J.G. Nijhuis, prof.dr. P.P. van den Berg en dr.ir. M. Mischi bedankt voor het beoordelen van mijn manuscript.
Josje Langenveld en Joyce Spijkers, mijn paranimfen. Lieve Josje, ik zie ons nog in het Máxima als collega’s, inmiddels ben jij ook eindelijk gynaecoloog en zelfs mijn maat. Heerlijk om te zien dat je nog steeds zo gepassioneerd bent. Ik ben erg blij dat we weer samen werken. Veel dank voor je promotie tips and trics en niet te vergeten voor je steun en peptalks. Ik ben erg blij met onze plannen voor de minimaal invasieve chirurgie.Lieve, lieve Joyce, wat was ik destijds blij voor Roger dat jullie het geluk in de liefde hebben gevonden. Inmiddels heb ik er zelf een fantastische vriendin bij. We hebben allebei de laatste tijd wat werkgerelateerde perikelen achter de rug en elkaar er doorheen geholpen. We hebben serieuze gesprekken, waarbij jij zo heerlijk verhelderend kan zijn. Daarnaast geniet ik enorm van onze meligheid rondom o.a. het carnaval en niet te vergeten de kampspellen die we samen in elkaar ‘freubelen’. Gelukkig vinden onze kinderen elkaar ook zo leuk.
121
Dankwoord
Proefschrift Nicol.indb 121 4-10-2012 14:34:35
Evelien Moret, veel dank voor het rekruteren van alle patiënten en het zo zorgvuldig genereren van de benodigde datasets. Dankzij jouw fantastische inzet is het gelukt dit onderzoek ‘op afstand’ uit te voeren.
Beste semi-artsen: Marc Prudon, Joost van de Ven, Vera Gondrie, Frank van Deursen en Mathieu Habraken, veel dank voor jullie inzet en individuele bijdrage aan dit proefschrift, jullie zijn stuk voor stuk bijzondere persoonlijkheden. Ik wens jullie veel succes en geluk voor de toekomst.
Beste echoscopisten: Tatiane Freywald, Vera Gondrie, Mieke Grob, Virginia Hunen-Storms, Christel Janssen, Irene Leenders, Magriet Reumkens-Gerards, Cedric v Uytrecht, Diederik Veersema, Esther Winkel en Marie-José Wolfel-Kelleners, allemaal veel dank voor het uitvoeren van de in vitro metingen.
Natasha Dvinskikh, veel dank voor je aandeel aan dit proefschrift. Het is al weer even geleden dat we samen met de proefopstelling bezig waren. Je hebt veel werk gehad aan je thesis, ik ben erg blij dat het tot een artikel is gekomen.
Degenen die mij hebben gevormd tot de gynaecoloog die ik nu ben, de gynaecologen maatschap van het Elkerliek ziekenhuis waar ik met veel plezier anderhalf jaar heb gewerkt als ANIOS, nog steeds vind ik het indrukwekkend hoe goed jullie een en ander hebben geregeld. De maatschap gynaecologie van het Atrium Medisch Centrum, die drie maanden in 2000 waren een inspirerende kennismaking voor de huidige samenwerking. De maatschap gynaecologie van het Máxima Medisch Centrum, veel dank voor de mooie vijf jaren die ik bij jullie heb mogen doorbrengen, jullie ‘drive’ intrigeert me nog steeds. De vakgroep gynaecologie van het Academisch Medisch Centrum Maastricht. Alle collega A(N)IOS tijdens deze periode, dank voor de prettige samenwerking destijds, heerlijk om af en toe weer eens bij te praten. Hoewel volledigheid niet mogelijk is, wil ik toch een aantal personen extra bedanken. Peggy dank voor de gouden tip destijds, hierdoor werden we van studiegenoten, opleidingsmaatjes. Cathelijne, we zaten samen op het bankje voor onze sollicitatie en hebben samen onze opleiding doorlopen, ik heb genoten van jou als collega/opleidingsmaatje. Jammer dat we elkaar zo weinig spreken, ik zie uit naar ons volgende congres. Minouche, ik denk nog regelmatig aan onze wintersportvakantie, wat hadden we toen nog weinig zorgen en een hoop lol. Gelukkig mogen we genieten van onze gezinnetjes, dat is toch de basis.
Lieve, lieve Judith, wat hebben we vaak samen peentjes zitten zweten voorafgaand aan onze voordrachten, gezellig samen op een hotelkamer. Ik ben zo trots op je dat je twee weken eerder gaat promoveren op dat mega-ingewikkelde onderwerp van je, ook nog
122
Dankwoord
Proefschrift Nicol.indb 122 4-10-2012 14:34:35
voor het afronden van je opleiding! Geweldig dat onze kinderen elkaar zo leuk vinden, op naar de volgende date met zijn allen.
De Maatschap gynaecologie van het Atrium, beste maten, we hebben de afgelopen jaren in een storm gezeten. Nu het er op lijkt dat de wind gaat liggen, zijn wij aan zet. Veel dank dat jullie mij de wind uit de zeilen hebben gehouden. We gaan er met z’n allen tegenaan, ik verheug me er op dat ik meer kan gaan betekenen voor de maatschap. Frans, jij bent een enorme bron van ervaring en kennis, ik ben blij dat ik je nog een paar jaar altijd mag bellen voor advies of een handje hulp. Dank dat je wilt plaatsnemen in de corona. Het zal vast wennen zijn als straks bent afgetreden als opleider, gelukkig hebben we een zeer goede opvolgster. Patricia, ik wil van deze gelegenheid gebruik maken je veel succes als opleider te wensen. Je pakt deze uitdaging ontzettend goed aan, met jou ontwapenende manier van communiceren en je gedrevenheid heb je de goede papieren voor deze functie. Tom, dank voor je steun in mijn eerste jaren als gynaecoloog, ik mis je en ik hoop dat het zo goed mogelijk met je gaat.A(N)IOS van het Atrium, al dan niet nu even in het Maastrichtse, inspirerende jonge mensen dank voor jullie inzet en positieve bijdrage aan de sfeer en de patiënten zorg.
Wesley, het is tijd om afscheid te nemen, we hebben het erg gezellig gehad. Dankzij jouw humor en vrolijkheid ben ik de vele donkere nachten die nodig waren voor de afronding van dit proefschrift goed doorgekomen. Je taak is hier volbracht, ik geef je door aan Martine, daarna wacht Simone op je. Dames, veel succes met jullie promotieperikelen, mocht het nodig zijn, is er altijd nog Wesley, die houdt de lol er wel in. Voor de onwetenden, zie: http://www.youtube.com/watch?list= PLE2501CBE 20F4A1CE&v=Pety8_ LdCX4&feature=player_detailpage of http://www.youtube.com/ watch?v=9Q33PbPpkmE&feature=player_detailpage of http://www.youtube.com/ watch?v=rHswhUswi-M&feature=player_detailpage.
Beste Cheetahs, softbaldames, jullie ben ik erg dankbaar. Ondanks dat ik nauwelijks op de trainingen aanwezig kon zijn, heb ik me toch steeds deel van de groep gevoeld. Ook nu ik niet meer speel is er nog steeds het warme familie gevoel. Veel dank voor alle gezellige momenten op het veld en tijdens de vele feestjes.
Lieve ZVB-friends/vasteloavesvrunj…. Yes! Dit jaar mag ik me surprisetechnisch weer uitleven. Veel dank dat jullie in beeld bleven ondanks dat ik me niet zo vaak heb laten zien. We hebben een fantastische vriendengroep waar ik veel waarde aan hecht, met jullie is het altijd gezellig en lachen, met als het nodig is een serieuze noot. Ik verheug me op al het leuks dat we in het vooruitzicht hebben.
123
Dankwoord
Proefschrift Nicol.indb 123 4-10-2012 14:34:35
Chris Bor, hartelijk dank voor de grafische vormgeving van dit proefschrift. Dankzij de moderne tijd was het niet nodig elkaar te ontmoeten en is het proces toch vlot en naar tevredenheid verlopen.
Desirée en Aline, vriendinnetjes van de lagere school, fijn dat we weer lekker bij elkaar in de buurt zijn. Als we elkaar zien is het altijd weer als vanouds. Aline, dank voor de eerste opzet voor de kaft, dat vind ik heel speciaal. Desirée, lekker babbelen met jou werkt verhelderend en helpt me de kern van het verhaal weer te zien.
Lieve Manon, onze vriendschap stamt uit de kinderjaren, veel dank dat je zo’n lieve peettante voor Luuk bent en voor de oppasvrijdagen in zijn eerste jaar, ondanks je eigen drukke gezin. Sanne en Nina, jullie zijn altijd zo ontzettend lief voor Luuk, dankjewel.
Sandra, dank dat je zo enthousiast en lief voor onze Luuk zorgt. Dit helpt enorm tegen het schuldgevoel van een moeder die vindt dat ze weer zo nodig iets voor haar werk moet doen.
Lieve Marije en Wim, lieve schoonouders en Opa en Oma, jammer van de afstand. Als we elkaar zien is er veel warmte, dank hiervoor.
Lieve mam en pap, wat zijn jullie fantastische mensen, ouders en Oma en Opa. Jullie hebben mijn basis gevormd, dankzij jullie voorbeeld ben ik zoals ik ben, daar ben ik jullie erg dankbaar voor. Ik kan zo genieten als we samen zijn, de weekeindjes, maar ook gewoon thuis. Fantastisch zoals jullie van onze Luuk genieten.
Lieve, lieve Richard, wat ben ik blij dat we, uiteindelijk, op elkaars pad zijn gekomen en gebleven. De afgelopen jaren zijn druk geweest en is er heel wat flexibiliteit van jou gevraagd, zodat ik mijn werk en onderzoek kan doen. Ik vind het geweldig te zien hoe jij je ontpopt als een fantastische vader. Jij en Luuk zorgen er voor dat ik bij thuiskomst alle werkgerelateerde zorgen vergeet en acuut ontspan. Luuk, ik ben zo trots dat ik je moeder mag zijn, na een schaterlach van jou barst ik weer van de energie.
Allemaal enorm bedankt!
124
Dankwoord
Proefschrift Nicol.indb 124 4-10-2012 14:34:35
About the author
Nicol Smeets was born on the 19th of July 1973 at the School for Midwifery in Heerlen. She grew up as the only child of Hanny and Piet Smeets in Brunssum. She graduated from secondary school ‘Rombouts College’ in Brunssum in 1992. In the same year she started her medical study at Maastricht University. During the second year of her study she took a six-week course at the department of obstetrics and gynecology with theoretical classes from Dr. G. Dunselman and clinical introduction at the department of Obstetrics and Gynecology of the Sint Jans Gasthuis in Weert. During her fourth year she performed a scientific research project concerning the maternal heart rate pattern in the first ten weeks of pregnancy at the department of Obstetrics and Gynecology of the Academic Hospital of Maastricht under supervision of Dr. L.L.H. Peeters. At the end of 1997 she followed an internship of choice at the department of Obstetrics and Gynecology of the St. Anna Hospital in Geldrop. The final internship was the regular program Obstetrics and Gynecology at the Atrium Medical Centre in Heerlen in the summer of 1998, after which she graduated from medical school. This was followed by a residency at the Elkerliek Hospital in Helmond of 1.5 years were she learned the basics of Obstetrics and Gynecology. In 2000 she worked as a resident at the Atrium Medical Centre in Heerlen for 3 months. After this, she started as a resident at the Máxima Medical Centre in Veldhoven. Finally, she started her specialist training on the first of October 2001 at the department of Obstetrics and Gynecology in the Máxima Medical Centre in Veldhoven (Prof. dr. H.A.M. Brölmann and Prof. dr. S.G. Oei) and at the University Hospital of Maastricht (Prof. dr. G.G.M. Essed and Prof. dr. J.G. Nijhuis). During her specialist training she started with the PhD research described in this thesis under the supervision of Prof. dr. S.G. Oei. Since October 2007, she has been working as a gynecologist in the Atrium Medical Centre in Heerlen. The minimal invasive gynecology has her special interest. Nicol Smeets lives together with Richard Ricksen, they are the proud parents of their wonderful son Luuk.
Nicol Smeets is op 19 juli 1973 geboren in de Vroedvrouwenschool te Heerlen. Ze is in Brunssum opgegroeid als enig kind van Hanny en Piet Smeets. In 1992 behaalde ze het VWO diploma aan het Rombouts College in Brunssum. In hetzelfde jaar begon ze aan de studie Geneeskunde aan de Universiteit van Maastricht. In haar tweede jaar nam ze, gedurende zes weken deel aan een keuze-stage op de afdeling obstetrie en gynaecologie met theoretische lessen van Dr. G. Dunselman en een klinische stage in het Sint Jans Gasthuis te Weert. Hier ontstond het enthousiasme voor de obstetrie en gynaecologie. In haar vierde jaar onderzocht ze maternale hartfrequentie patronen in de eerste tien weken van de zwangerschap onder leiding van Dr. L.L.H. Peeters bij de afdeling obstetrie en gynaecologie van het Academisch Medisch Centrum te Maastricht. Eind 1997 volgde ze
125
About the author
Proefschrift Nicol.indb 125 4-10-2012 14:34:35

een keuze coschap bij de afdeling obstetrie en gynaecologie in het St. Anna Ziekenhuis te Geldrop. In de zomer van 1998 volgde ze haar laatste reguliere coschap, obstetrie en gynaecologie in het Atrium Medisch Centrum te Heerlen, waarna ze slaagde voor haar artsexamen. Hierna leerde ze gedurende anderhalf jaar de basis van de obstetrie en gynaecologie als ANIOS in het Elkerliek ziekenhuis te Helmond. In 2000 werkte ze drie maanden als ANIOS gynaecologie en obstetrie in het Atrium Medisch Centrum te Heerlen, waarna ze als ANIOS gynaecologie en obstetrie begon in het Máxima Medisch Centrum te Veldhoven. In oktober 2001 startte ze met de opleiding tot gynaecoloog in het Máxima Medisch Centrum te Veldhoven (Prof.dr. H.A.M. Brölmann en Prof.dr. S.G. Oei) en in het Academisch Medisch Centrum te Maastricht (Prof.dr. G.G.M. Essed en Prof.dr. J.G. Nijhuis). Tijdens haar opleiding startte ze, onder leiding van Prof.dr. S.G. Oei, met het onderzoek zoals beschreven in dit proefschrift. Sinds oktober 2007 werkt ze als gynaecoloog in het Atrium Medisch Centrum te Heerlen met de minimaal invasieve gynaecologie als aandachtsgebied. Nicol Smeets woont samen met Richard Ricksen, ze zijn de trotse ouders van hun fantastische zoon Luuk (2 jaar).
Proefschrift Nicol.indb 126 4-10-2012 14:34:35