Festugato, L. , Peccin da Silva, A., Diambra, A., Consoli ...
44
Festugato, L., Peccin da Silva, A., Diambra, A., Consoli, N. C., & Ibraim, E. (2018). Modelling tensile/compressive strength ratio of fibre reinforced cemented soils. Geotextiles and Geomembranes, 46(2), 155-165. https://doi.org/10.1016/j.geotexmem.2017.11.003 Peer reviewed version License (if available): CC BY-NC-ND Link to published version (if available): 10.1016/j.geotexmem.2017.11.003 Link to publication record in Explore Bristol Research PDF-document This is the author accepted manuscript (AAM). The final published version (version of record) is available online via Elsevier at http://www.sciencedirect.com/science/article/pii/S0266114417301498 . Please refer to any applicable terms of use of the publisher. University of Bristol - Explore Bristol Research General rights This document is made available in accordance with publisher policies. Please cite only the published version using the reference above. Full terms of use are available: http://www.bristol.ac.uk/red/research-policy/pure/user-guides/ebr-terms/
Transcript of Festugato, L. , Peccin da Silva, A., Diambra, A., Consoli ...

Festugato, L., Peccin da Silva, A., Diambra, A., Consoli, N. C., &Ibraim, E. (2018). Modelling tensile/compressive strength ratio of fibrereinforced cemented soils. Geotextiles and Geomembranes, 46(2),155-165. https://doi.org/10.1016/j.geotexmem.2017.11.003
Peer reviewed versionLicense (if available):CC BY-NC-NDLink to published version (if available):10.1016/j.geotexmem.2017.11.003
Link to publication record in Explore Bristol ResearchPDF-document
This is the author accepted manuscript (AAM). The final published version (version of record) is available onlinevia Elsevier at http://www.sciencedirect.com/science/article/pii/S0266114417301498 . Please refer to anyapplicable terms of use of the publisher.
University of Bristol - Explore Bristol ResearchGeneral rights
This document is made available in accordance with publisher policies. Please cite only thepublished version using the reference above. Full terms of use are available:http://www.bristol.ac.uk/red/research-policy/pure/user-guides/ebr-terms/
1
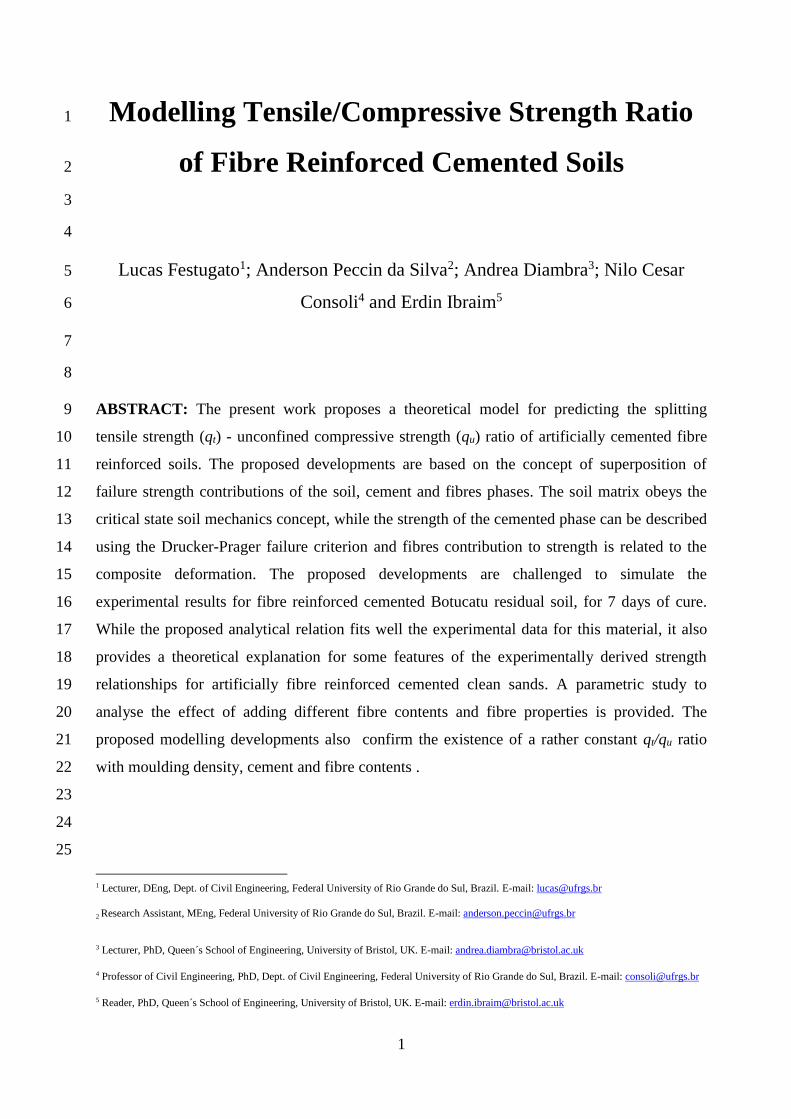
Modelling Tensile/Compressive Strength Ratio 1
of Fibre Reinforced Cemented Soils 2
3
4
Lucas Festugato1; Anderson Peccin da Silva2; Andrea Diambra3; Nilo Cesar 5
Consoli4 and Erdin Ibraim5 6
7
8
ABSTRACT: The present work proposes a theoretical model for predicting the splitting 9
tensile strength (qt) - unconfined compressive strength (qu) ratio of artificially cemented fibre 10
reinforced soils. The proposed developments are based on the concept of superposition of 11
failure strength contributions of the soil, cement and fibres phases. The soil matrix obeys the 12
critical state soil mechanics concept, while the strength of the cemented phase can be described 13
using the Drucker-Prager failure criterion and fibres contribution to strength is related to the 14
composite deformation. The proposed developments are challenged to simulate the 15
experimental results for fibre reinforced cemented Botucatu residual soil, for 7 days of cure. 16
While the proposed analytical relation fits well the experimental data for this material, it also 17
provides a theoretical explanation for some features of the experimentally derived strength 18
relationships for artificially fibre reinforced cemented clean sands. A parametric study to 19
analyse the effect of adding different fibre contents and fibre properties is provided. The 20
proposed modelling developments also confirm the existence of a rather constant qt/qu ratio 21
with moulding density, cement and fibre contents . 22
23
24
25
1 Lecturer, DEng, Dept. of Civil Engineering, Federal University of Rio Grande do Sul, Brazil. E-mail: [email protected]
2 Research Assistant, MEng, Federal University of Rio Grande do Sul, Brazil. E-mail: [email protected]
3 Lecturer, PhD, Queen´s School of Engineering, University of Bristol, UK. E-mail: [email protected]
4 Professor of Civil Engineering, PhD, Dept. of Civil Engineering, Federal University of Rio Grande do Sul, Brazil. E-mail: [email protected]
5 Reader, PhD, Queen´s School of Engineering, University of Bristol, UK. E-mail: [email protected]

2
Keywords: Geosynthetics, modelling, residual soil, Portland cement, fibres, tensile strength, 26
compressive strength, porosity/cement index. 27
1 INTRODUCTION 28
The addition of fibres for improving engineering properties of soils has been widely observed 29
in nature over the years, especially with the presence of plant roots. Early studies showed that 30
the inclusion of plant roots into the soil on slopes significantly increased shear strength 31
(Waldron, 1977; Wu et al., 1979). More recently, the addition of artificial fibres has been used 32
in several engineering applications, such as embankments and subgrade stabilisation beneath 33
footings and pavements. In the last decades, an important engineering material has emerged 34
with the advantages of quality control and easy installation: the geosynthetics (Koerner, 2012). 35
Moreover, the inclusion of randomly distributed short fibres has been reported as an effective 36
and cost attractive technique for increasing the strength of near surface soil layers in field 37
applications (e.g. Consoli et al., 2009a; Diambra, 2010; Festugato et al., 2015). 38
Additionally, Portland cement has been widely employed in the enhancement of clayey or 39
granular soils (e.g. Abdulla and Kiousis, 1997a; Ismail et al., 2002). The effect of cementation 40
includes an increase in stiffness and peak strength with increasing cement content and density 41
(e.g. Saxena and Lastrico, 1978; Huang and Airey, 1998), as well as a noticeable gain in tensile 42
strength, cohesion and friction angle (e.g. Lade and Overton, 1989). Concerning field 43
applications, Consoli et al. (2009a) revealed the importance of the tensile strength of cemented 44
sands, as the failure mechanism of cemented sand top layers vertically loaded begins with 45
tensile stresses. 46
The coupling of both techniques (cementation and fibre-reinforcement) gave rise to fibre-47
reinforced cemented soils and it has also been studied by several researchers. The addition of 48
fibres in cemented soils is of particular interest in those sands that show a brittle failure pattern 49

3
(Park, 2009). Maher and Ho (1993) showed that the inclusion of randomly oriented fibres into 50
artificially cemented sands caused a significant increase in both friction angle and cohesion, as 51
well as in compressive and tensile strengths for such specimens. The same behaviour has been 52
reported by other authors in clayey soils and fly ash-soil mixtures (Kaniraj and Havanagi, 53
2001; Tang et al., 2007). 54
55
Potential dosage methodologies for soil-cement blends must consider the influence of 56
distinctive variables, such as porosity and quantity of cement. Consoli et al. (2010) found out 57
experimentally that an index named porosity/cement ratio (η/Civ) controls the unconfined 58
compressive strength (qu) through a power relationship for a given soil treated with Portland 59
cement. This relationship was shown to be also adequate for fibre-reinforced cemented 60
specimens (Consoli et al., 2011a; Consoli et al., 2013a; Festugato et al., 2017) [see Eq. (1)]. 61
𝑞𝑢 = 𝑋 ⌊𝜂
𝐶𝑖𝑣𝑒𝑥𝑝⌋
𝑍
(1) 62
where porosity (η) is expressed as percentage of the volume of voids divided by total volume 63
of the specimen while volumetric cement content (Civ) is expressed as percentage of the 64
volume of cement divided by the total volume of the specimen, X, Z and exp are parameters 65
that possibly depend on the soil and binder used. Consoli et al. (2011a) showed that the 66
exponent X depends on the fibre content whereas Consoli et al. (2016) found that Z depends 67
exclusively on the type of soil. 68
Consoli et al. (2011b) demonstrated that such index is also useful in controlling splitting tensile 69
strength (qt). These studies employed the same soil, fibre and Portland cement used in previous 70
research, and a similar power relationship was obtained [see Eq. (2)]. 71
𝑞𝑡 = 𝑌 ⌊𝜂
𝐶𝑖𝑣𝑒𝑥𝑝⌋
𝑍
(2) 72

4
where Y, Z and exp are parameters that might depend on the soil and binder used. At that 73
moment, Consoli et al. (2011b) detected that the power Z and the exponent exp were the same 74
for both qu and qt, but X and Y were distinct. In order to check if a qt/qu relationship for the 75
studied fibre reinforced Botucatu residual soil – Portland cement blend was a function of 76
porosity, cement content or porosity/cement ratio, Consoli et al. (2013a) divided Eq. (2) by Eq. 77
(1), yielding a scalar [see Eq. (3)]. 78
𝑞𝑡
𝑞𝑢=
2.55𝑥106⌊𝜂
𝐶𝑖𝑣0.28⌋
−2.90
17.96𝑥106⌊𝜂
𝐶𝑖𝑣0.28⌋
−2.90 = 0.14 (3) 79
Accordingly, the authors found out that there was a straight proportionality between tensile and 80
compressive strengths, being independent of porosity, cement content and porosity/cement 81
ratio, which was valid for the whole studied porosity and cement ranges (see Fig. 1 for fibre 82
reinforced Botucatu residual soil – Portland cement blend). 83
The qt/qu ratio of fibre reinforced artificially cemented soils is an important parameter once its 84
existence allows determining qt knowing qu or vice versa, considering the whole porosity and 85
volumetric cement content studied. Besides, Consoli et al. (2013b) have shown a theoretical 86
framework proving that the friction angle of fibre reinforced cemented granular soil is unique 87
for a given soil and cement and its value is a function only of qt/qu. On the other side, the 88
cohesion of cemented granular soil can be determined on both qu and qt/qu. 89
Consoli et al. (2012) developed similar study with fibre reinforced silty soil treated with lime. 90
Result trends by Consoli et al. (2012) were similar to the ones obtained by Consoli et al. 91
(2013a), as the qt/qu relationship for the fibre reinforced silty soil treated with lime yielded a 92
scalar of 0.15. Up to this moment, several authors have developed constitutive modelling 93
approaches concerning fibre-reinforced sands (Villard and Jouve, 1989; Di Prisco and Nova, 94

5
1993; Sivakumar Babu et al., 2008; Diambra et al., 2007; 2010; 2011; 2013; Ibraim et al., 95
2010),cemented sands (Abdulla and Kiousis, 1997b; Vatsala et al., 2001) and concrete fibre 96
mixtures (e.g. Samaan et al., 1998; Teng and Lam, 2004). However, there are no theoretical 97
models able to explain the empirical expression for fibre-reinforced cemented sands exposed 98
above. 99
Diambra et al. (2017) presented a theoretical derivation for the strength of three unreinforced 100
artificially cemented granular soils. The authors showed that the concept of superposition of 101
failure strength contributions of the soil and cement phases is effective in predicting the 102
compressive strength of cemented granular soils. Based on this derivation, the present technical 103
paper proposes an extended theoretical modelling framework to predict the compressive and 104
tensile strengths of fibre reinforced artificially cemented soils by considering the individual 105
properties of its constituents: the soil matrix, the cementing phase and the fibres. It will be 106
shown that the proposed developments provide an accurate estimation of the experimental 107
results and that they corroborate the experimental observation of the existence of a unique 108
qt/qu ratio independent of moulding density and cement content. The proposed modelling 109
approach will also offer an insight into the physical meaning of the coefficients governing the 110
simple empirical relationships (1) and (2) for the compressive and tensile strengths of fibre 111
reinforced cemented soil and their ratio qt/qu in Eq (3), increasing the confidence for their 112
broader use in the engineering practice. This process will allow the establishment of 113
meaningful connections between the governing coefficients of the empirical relationships and 114
relevant material properties, which can provide significant guidance towards the design of 115
specific soil, cement and fibre mixtures to satisfy required strength criteria. 116

6
2 THEORETICAL MODEL 117
2.1 Testing boundary and stress conditions 118
Typical boundary stress and strain conditions for the unconfined compression and the splitting 119
tensile tests at failure are reported in Fig. 2. The unconfined compression test is in 120
axisymmetric testing conditions (Fig. 2a) and the failure strength (qu) is equal to the vertically 121
applied stress (σz). The stress and strain conditions of a splitting tensile test, in turn, are slightly 122
more complex. A cylinder is placed horizontally and loaded along its cross-section diameter: 123
plane strain loading conditions (εy=0) results on the section shown in Fig. 2b. Stress conditions 124
are invariably not uniform within the loaded specimen but we could concentrate on a small 125
finite element at the centre of the disk cross section. The vertical and horizontal principal 126
stresses on this element (σz and σx) are equals 3qt and qt, respectively, as theoretically 127
demonstrated by Jaeger et al. (2007) and as shown in Fig. 2b. 128
Differently from Diambra et al. (2017), the stress state for both tests is expressed here in terms 129
of maximum shear and mean stress t,s invariants [t=(σz- σx)/2 ; s=(σz+ σx)/2]. In such 130
coordinates system, the stress ratio at failure ki can be defined as: 131
𝑘𝑖 =𝑡𝑖
𝑠𝑖 with i=u,t (4) 132
where i distinguishes between unconfined compression (u) and tensile (t) testing conditions. By 133
substitution of the boundary stress conditions of Fig. 2 into the definition of t and s, the stress 134
ratios ku=1 and kt=2 for the unconfined compression and splitting tensile tests at failure can be 135
derived, respectively. 136

7
2.2 Modelling hypothesis 137
The fibre reinforced cemented soil is considered a composite material made of three separate 138
constituents: the soil matrix, the cementing phase and the fibres. Four main assumptions are 139
introduced for the following modelling developments: 140
1) The behaviour of the fibre reinforced cemented soil at the failure point is determined by 141
superposing the strength contributions of the three constituent phases; 142
2) Strain compatibility between the composite and its three constituent phases, soil, cement 143
and fibres, applies. 144
3) At the composite failure, the soil matrix is at peak conditions, while the cement phase is 145
at failure conditions and the fibres are stretched according the deformation state of the 146
composite material; 147
4) Fibres are mono-dimensional elastic elements resisting only to tension. Due to filaments 148
orientation caused by compaction, fibres are considered all horizontal. 149
By using a volumetric averaging approach (Diambra et al. 2011, Diambra et al. 2013; Diambra 150
and Ibraim 2015), the stress state of the composite material (t,s) can be derived from the failure 151
stress state of the soil matrix (tm,sm), the cementing phase (tc,sc) and the fibres (tf,sf) with the 152
following relationship: 153
[𝑡𝑠] = 𝜇𝑚 [
𝑡𝑚𝑠𝑚] + 𝜇𝑐 [
𝑡𝑐𝑠𝑐] + 𝜇𝑓 [
𝑡𝑓𝑠𝑓] (5) 154
where 𝜇𝑚, 𝜇𝑐 and 𝜇𝑓 are the volumetric concentrations of soil, cement and fibres in the 155
composite material, respectively. It should be noted that the volumetric cement concentration 156
𝜇𝑐 is equals Civ/100. 157

8
2.3 Failure models for constituent phases 158
2.3.1 Failure for the soil phase 159
In soil constitutive modelling, it is customary to link the strength of the material with a state 160
parameter (), which quantifies the difference between the current density state from the 161
corresponding one at critical state (Been and Jefferies 1985). It is possible to express the state 162
parameter in terms of the material porosity (η for current porosity and ηcs for the corresponding 163
porosity at the critical state) using the following definition: 164
𝜓 =𝜂𝑐𝑠
𝜂 (6) 165
where <1 represents a state on the loose side of the critical state line (CSL), while >1 166
represents a state on the dense side of the CSL. Thus, the soil stress ratio at failure can then be 167
expressed by the following expression: 168
𝑡𝑚
𝑠𝑚= 𝑀∗ = 𝑀(
𝜂𝑐𝑠
𝜂)𝑎
(7) 169
where M* represents the peak strength, M is the critical state strength and a is a model 170
parameter which links the peak strength to the state parameter, . 171
2.3.2 Failure and stress paths for the cementing phase 172
It is considered that the strength of the cement phase is simply described by the Drucker-Prager 173
failure criterion, which can be expressed in terms of the maximum shear and mean stresses as 174
follows: 175
𝑡𝑐 = 𝑏𝑐 +𝑀𝑐𝑠𝑐 (8) 176
where the terms 𝑏𝑐 and 𝑀𝑐 can be linked to both cohesion cc and friction angle 𝜙c of the 177
cemented phase as follows: 178

9
𝑏𝑐 = 𝑐𝑐𝑐𝑜𝑠𝜙𝑐 (9) 179
and 180
𝑀𝑐 = 𝑠𝑖𝑛𝜙𝑐 (10) 181
According to Diambra et al. (2017), the mathematical manipulations of the following section 182
2.4 and the Appendix require also the knowledge of the stress paths (Kcu and Kct for unconfined 183
compression and splitting tensile tests, respectively) followed by the cementing constituents 184
phase during loading. Experimentally observed stress-strain relationship for cemented soil 185
shows a quasi-elastic behaviour up to the peak strength conditions (Consoli et al., 2009a). In 186
fact, the strain levels at failure are generally quite low and elastic conditions have been 187
assumed to determine the stress conditions at failure (Jaeger et al. 2007). It is supposed herein 188
that fibre reinforced cemented composite soils, their cemented constituent phase and fibres 189
behave under elastic conditions. The elastic stress-strain relationship for fibre reinforced 190
cemented soils can then be written in the following way: 191
[
𝜀𝑥𝜀𝑦𝜀𝑧] =
1
𝐸[1 −𝜈 −𝜈−𝜈 1 −𝜈−𝜈 −𝜈 1
] [
𝜎𝑥𝜎𝑦𝜎𝑧] (11) 192
where E and 𝜈 are respectively the Young’s elastic modulus and Poisson’s ratio of the fibre 193
reinforced cemented soil. By applying the boundary conditions shown in Fig. 2 for either 194
unconfined compression (σz=qu, σy=0, σx=0) or splitting tensile (σz=3qt, εy=0, σx=- qt) tests, it 195
is possible to derive the following strain field for the composite material as function of the 196
material strength (qu or qt): 197
[
𝜀𝑥𝜀𝑦𝜀𝑧] =
𝑞𝑢
𝐸[−𝜈−𝜈1] for Unconfined Compression tests (12) 198
and 199

10
[
𝜀𝑥𝜀𝑦𝜀𝑧] =
−𝑞𝑡
𝐸[2ν2 + 3ν + 1
02ν2 − ν − 3
] for Splitting Tensile Tests (13). 200
Assuming strain compatibility between the composite material and its constituents, it is 201
possible to impose the strain fields in Eqs. (12) and (13) in the following elastic stress 202
relationship for the cemented soil material: 203
[
𝜎𝑐𝑥𝜎𝑐𝑦𝜎𝑐𝑧
] =𝐸𝑐
(1+𝜈𝑐)(1−2𝜈𝑐)[
1 − 𝜈𝑐 𝜈𝑐 𝜈𝑐𝜈𝑐 1 − 𝜈𝑐 𝜈𝑐𝜈𝑐 𝜈𝑐 1 − 𝜈𝑐
] [
𝜀𝑥𝜀𝑦𝜀𝑧] (14) 204
where Ec and νc are respectively the Young’s elastic modulus and Poisson’s ratio of the 205
cemented constituent phase. Thus, expressions for 𝜎𝑐𝑥 and 𝜎𝑐𝑧 in both unconfined compression 206
and splitting tensile testing conditions can be derived and substituted in the conventional 207
definition of the maximum shear and mean stress tc, sc invariants (tc=(𝜎𝑐𝑧- 𝜎𝑐𝑥)/2 ; sc=(𝜎𝑐𝑧+ 208
𝜎𝑐𝑥)/2), in order to obtain the following slopes of the stress paths (Kcu and Kct for unconfined 209
compression and splitting tensile tests respectively) for the cementing constituents phase during 210
loading: 211
𝐾𝑐𝑢 =𝑡𝑐
𝑠𝑐=
𝜎𝑐𝑧−𝜎𝑐𝑥
𝜎𝑐𝑧+𝜎𝑐𝑥=
2𝜈𝑐𝜈−1+2𝜈𝑐−𝜈
2𝜈𝑐𝜈−1+𝜈 (15) 212
and 213
𝐾𝑐𝑡 =𝑡𝑐
𝑠𝑐=
𝜎𝑐𝑧−𝜎𝑐𝑥
𝜎𝑐𝑧+𝜎𝑐𝑥= 2
2𝜈𝑐−1
2𝜈−1 (16). 214
These expressions are function of the Poisson’s ratios of the fibre reinforced cemented material 215
(ν) and cementing phase (νc). Intersection of these stress paths with the failure conditions for 216
the cementing phase in Eq. (8), allows the estimation of the mean stress contribution of the 217
cementing phase: 218

11
𝑠𝑐 =𝑏𝑐
𝐾𝑐𝑖−𝑀𝑐 with i=u,t (17) 219
where the index i discriminates between unconfined compression (u) and splitting tensile (t) 220
testing conditions. 221
2.3.3 Failure conditions and strength contributions of the fibres phase 222
Fibres contribution to strength is related to the composite deformation and the stress mobilised 223
in the fibres (σf) can be linked to the strain in the generic direction of fibre orientation (ɛ) by the 224
following relationship: 225
𝜎𝑓 = 𝐸𝑓 . 𝜀 (18) 226
where Ef is the elastic modulus of the fibre. Diambra et al. (2007) and Ibraim et al. (2012) 227
found that, for tamped and vibrated fibre reinforced granular soil samples, fibres assumed a 228
preferred horizontal bedding. Hence, it is assumed here for simplicity that fibres are all 229
horizontally and axi-symmetrically oriented, with respect to the configuration imposed during 230
sample preparation which coincides with that represented in Fig. 2a. It follows that, for 231
unconfined compression tests, all the fibres are oriented within a horizontal x-y plane. Thus, 232
taking advantage of stress-strain relationship for the composite material in Eq. (12), it is 233
possible to derive the following equations for the fibre stress components (𝜎𝑓𝑥 and 𝜎𝑓𝑧) at the 234
composite failure conditions: 235
𝜎𝑓𝑥 = 𝐸𝑓 . 𝜀𝑥 = −𝐸𝑓𝜈𝑞𝑢
𝐸= −2
𝐸𝑓𝜈𝑡𝑢
𝐸 (19) 236
and 237
𝜎𝑓𝑧 = 0 (20) 238
which leads to the following expressions of the stress invariants, tf and sf, for the fibre phase: 239

12
𝑡𝑓 =𝜎𝑓𝑧
−𝜎𝑓𝑥
2=
𝐸𝑓𝜈𝑡𝑢
𝐸 (21) 240
and 241
𝑠𝑓 =𝜎𝑓𝑧
+𝜎𝑓𝑥
2= −
𝐸𝑓𝜈𝑡𝑢
𝐸 (22) 242
The loading conditions of a splitting tensile tests are slightly more complex, because the 243
cylindrical sample is placed on its side after fabrication and the plane of fibre bedding is the 244
vertical x-z plane (Fig. 2b). On this plane, the strain state is not uniform but it can be described 245
by the Mohr’s circle in Fig.3. Therefore, the stress components of the fibre phase can be 246
computed by integrating the mobilised stress for all orientation within the x-z plane using the 247
following equations: 248
𝜎𝑓𝑥 =2
𝜋∫ 𝐸𝑓(𝜀𝑥𝑐𝑜𝑠
2𝜃 + 𝜀𝑧𝑠𝑖𝑛2𝜃)𝑐𝑜𝑠𝜃𝑑𝜃
𝜃𝑙0
(23) 249
and 250
𝜎𝑓𝑧 =2
𝜋∫ 𝐸𝑓(𝜀𝑥𝑐𝑜𝑠
2𝜃 + 𝜀𝑧𝑠𝑖𝑛2𝜃)𝑠𝑖𝑛𝜃𝑑𝜃
𝜃𝑙0
(24) 251
where θl is the angle of zero strain which, using the relationship in Eq.(13), can be determined 252
as: 253
𝜃𝑙 = 𝑎𝑡𝑎𝑛√−𝜀𝑥
𝜀𝑧= 𝑎𝑡𝑎𝑛√
2𝜈2+3𝜈+1
−2𝜈2+𝜈+3 (25) 254
Solutions of Eqs. (23) and (24) and the further use of relationship (13) lead to: 255
𝜎𝑓𝑥 =−𝐸𝑓
𝐸𝑡𝑡𝑠𝑖𝑛𝜃𝑙(4𝑐𝑜𝑠
2𝜃𝑙+6𝜈−1)(𝜈+1)
3𝜋 (26) 256
and 257

13
𝜎𝑓𝑧 =𝐸𝑓
𝐸𝑡𝑡(4𝑐𝑜𝑠3𝜃𝑙+6𝜈𝑐𝑜𝑠𝜃𝑙−9𝑐𝑜𝑠𝜃𝑙−6𝜈+5)
3𝜋 (27) 258
which allow to define the fibre stress invariants (tf and sf, respectively) for the splitting tensile 259
tests as follows: 260
𝑡𝑓 =𝜎𝑓𝑧
−𝜎𝑓𝑥
2=
𝐸𝑓
𝐸𝑡𝑡[𝑐𝑜𝑠𝜃𝑙(4𝑐𝑜𝑠
2𝜃𝑙+6𝜈−9)+𝑠𝑖𝑛𝜃𝑙(4𝑐𝑜𝑠2𝜃𝑙+6𝜈−1)−6𝜈+5](𝜈+1)
6𝜋=
𝐸𝑓
𝐸𝑡𝑡𝐾𝑓𝑡 (28) 261
and 262
𝑠𝑓 =𝜎𝑓𝑧
+𝜎𝑓𝑥
2=
−𝐸𝑓
𝐸𝑡𝑡[−𝑐𝑜𝑠𝜃𝑙(4𝑐𝑜𝑠
2𝜃𝑙+6𝜈−9)+𝑠𝑖𝑛𝜃𝑙(4𝑐𝑜𝑠2𝜃𝑙+6𝜈−1)+6𝜈−5](𝜈+1)
6𝜋=
−𝐸𝑓
𝐸𝑡𝑡𝐾𝑓𝑠 (29) 263
where the terms Kft and Kfs are self-defined. 264
2.4 Strength relationship for fibre reinforced artificially cemented soil 265
By substituting the assumed strength criteria for the constituents phases in Eq.(5) as detailed in 266
the Appendix, it is possible to obtain the following expressions for the maximum shear stress ti 267
for the two analysed tests: 268
𝑡𝑢 =𝜇𝑐𝑏𝑐 (𝐾𝑐𝑢−𝑀
∗)
(1−𝑀∗−𝜇𝑓𝐸𝑓
𝐸𝜈(1+𝑀∗))(𝐾𝑐𝑢−𝑀𝑐)
(30) 269
and 270
𝑡𝑡 =2𝜇𝑐𝑏𝑐 (𝐾𝑐𝑡−𝑀
∗)
(2−𝑀∗−2𝜇𝑓𝐸𝑓
𝐸(𝐾𝑓𝑡+𝑀
∗𝐾𝑓𝑠))(𝐾𝑐𝑡−𝑀𝑐) (31) 271
Using the stress state described in Fig.2, the following expressions for the unconfined 272
compressive (qu) and tensile (qt) strengths can then be obtained, respectively: 273
𝑞𝑢 = 2𝑡𝑢 =2𝜇𝑐𝑏𝑐 (𝐾𝑐𝑢−𝑀(
𝜂𝑐𝑠𝜂)𝑎)
(1−𝑀(𝜂𝑐𝑠𝜂)𝑎−𝜇𝑓
𝐸𝑓
𝐸𝜈(1+𝑀(
𝜂𝑐𝑠𝜂)𝑎))(𝐾𝑐𝑢−𝑀𝑐)
(32) 274

14
𝑞𝑡 =𝑡𝑡
2=
𝜇𝑐𝑏𝑐 (𝐾𝑐𝑡−𝑀(𝜂𝑐𝑠𝜂)𝑎)
(2−𝑀(𝜂𝑐𝑠𝜂)𝑎−2𝜇𝑓
𝐸𝑓
𝐸(𝐾𝑓𝑡+𝑀(
𝜂𝑐𝑠𝜂)𝑎𝐾𝑓𝑠))(𝐾𝑐𝑡−𝑀𝑐)
(33) 275
Relationships (32) and (33) provide a direct expression of the compressive and tensile strengths 276
of the fibre reinforced cemented soil in terms of the porosity (η), the cement content (μc), and 277
fibre content (μf) variables, with μc = Civ/100. The proposed relationships require nine model 278
parameters relative to the soil (𝜙, a, ηcs), to the cementing phase (bc, Mc, which are linked to 279
the cohesion and friction angle cc and 𝜙𝑐, and νc), to the fibres (Ef), and to the elastic properties 280
of the overall composite material (v and E) as summarised in Table 1. Since the proposed 281
developments refer to unconfined testing conditions only, it appears reasonable to consider the 282
soil porosity at critical state ηcs independent of the mean stress level and thus a material 283
constant. 284
3 MODEL PREDICTIONS 285
The predictions of the proposed relationships for unconfined compression and tensile strengths 286
have been assessed by direct comparison with experimental data on the following fibre 287
reinforced cemented soil reported in the literature: Botucatu Residual Soil + early strength 288
Portland cement + polypropylene fibres, cured at 7 days (Consoli et al. 2013a). 289
The physical properties and moulding parameters for the material are reported in Tables 2 and 290
3, respectively. 291
3.1.1 Selection of model parameters 292
As shown in Table 1, the model requires the calibration of nine parameters.:. Due to the 293
limitation of the available experimental data on the individual constituents, it was rather 294
impossible to run a thorough calibration procedure to select the values of certain parameters. 295

15
Thus, reasonable choices have been performed when necessary, trying to follow evidence from 296
the literature. 297
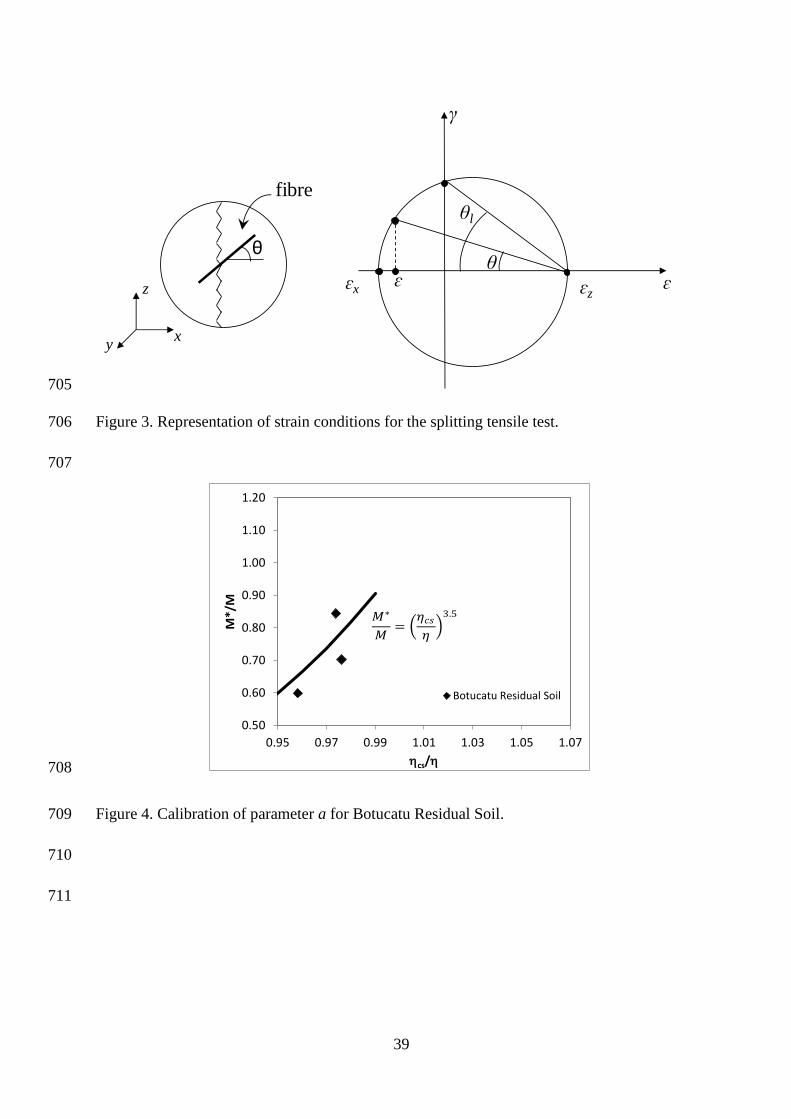
The values of the constants relative to the soil matrices (𝜙, ηcs and a) have been selected based 298
on triaxial experimental results and the assumed values are indicated in Table 1. The critical 299
state friction angle 𝜙 and porosity ηcs for Botucatu Residual Soil have been derived from 300
published triaxial tests in Heineck et al. (2005) and Heineck (2002). The tests were used to 301
establish a relationship between the peak to critical strength ratio (M*/M) and the state 302
parameter () in order to determine the model parameter a governing Eq.(7) as shown in Fig. 303
3. The model parameter a was found to be 3.5 for the studied soil. 304
Extensive experimental characterisation of the elastic properties of cemented soils by Felt and 305
Abram (1957) suggests values of the Poisson’s ratio for cemented sand and silts between 0.22 306
and 0.31 with a median value of about 0.26, while typical values of Poisson’s ratio for mortar 307
matrix are around 0.2, as suggested by Swamy (1971). These values have been assumed in this 308
research for the Poisson’s ratio of the composite material ν and the cementing phase νc, leading 309
to values of the cementing phase stress ratio in Eqs. (15) and (16) of Kcu=1.19 and Kct=2.5. In 310
absence of experimental data, a value of 32º for the friction angle of the cement phase has been 311
assumed following indication by Leonards (1965), who investigated the static and dynamic 312
frictional properties of plain smooth mortar. While the accuracy of this value cannot be 313
verified, its influence on the model prediction is rather limited and its variation would just 314
result in the need to assume a slightly different value of the binder strength component bc to 315
obtain a good fit of experimental data. In fact, this last parameter (bc) was calibrated by fitting 316
three unconfined compressive and tensile strength results randomly selected for each material. 317
A summary of the assumed value for each material is provided in Table 1. 318

16
The elastic modulus of the used polypropylene fibres Ef was 3000 MPa (Heineck et al. 2005, 319
Lirer et al. 2011, Consoli et al. 2013a). Consoli et al. (2009b) have shown that the elastic 320
modulus of cemented soils (E) is strongly dependent on porosity (η) and cement content (Civ), 321
particularly in the form of Eq. (34). 322
𝐸 = 𝐶 (𝐶𝑖𝑣
𝜂1/𝛼) (34) 323
The process of calibration of C can be carried out by fitting the value of strength for 3 to 4 324
random unconfined compressive tests on the studied fibre reinforced sand. For this material, C 325
was found to be equal to 9000 MPa. 326
327
3.1.2 Simulations 328
Comparison between model simulation and experimental data for the unconfined compression 329
strength (qu) and splitting tensile strength (qt) is proposed for fibre reinforced cemented 330
Botucatu residual soil in Fig. 5. The data are presented in the strength versus η/Civexp ratio 331
plot,where exp=1/a≈0.28 in this case as demonstrated in Diambra et al. (2017), while a direct 332
comparison between model prediction and experimental data is proposed in the qmodel-qexp 333
graphs. The model predicts reasonably well the magnitude of both unconfined compression 334
strength and splitting tensile tests, with these last ones largely lower. The hyperbolic 335
relationship between strength and η/Civexp ratio is also well captured by the model for both 336
testing modes. The direct comparison between experimental and predicted compressive and 337
tensile strengths (qmodel-qexp) shows a quite good correlation. 338

17
4 DISCUSSION 339
4.1.1 Parallelism with empirical formula 340
The proposed relationships (32) and (33) based on theoretical considerations have a different 341
form compared with the empirically based relationships (1) and (2) proposed by Consoli et al. 342
(2010) and Consoli et al. (2011a,b). However, for the limited range of variation of M* between 343
0.5 and 0.65,, it is possible to simplify Eqs. (32) by introducing the following approximation to 344
their bracketed terms 345
𝐾𝑐𝑢−𝑀∗
1−𝑀∗−𝜇𝑓𝐸𝑓
𝐸𝜈(𝑀∗+1)
≅ 𝑀∗ (2.07𝐾𝑐𝑢 + 9.3 𝐸𝑓
𝐸𝜇𝑓) (35) 346
Still, Eq. (33) can be simplified through the following approximation: 347
𝐾𝑐𝑡−𝑀∗
2−𝑀∗−2𝜇𝑓𝐸𝑓
𝐸(𝐾𝑓𝑡𝑀
∗+𝐾𝑓𝑠)≅ 𝑀∗ (0.93𝐾𝑐𝑡 + 0.02
𝐸𝑓
𝐸𝜇𝑓) (36) 348
where u and t distinguish between unconfined compression (u) and tensile (t) testing 349
conditions. The use of relationships (35) and (36) allows to consider a linear dependency 350
between the cemented soil strengths (qu or qt) and the peak strength of the soil M* 351
(M*=M(ηcs/η)a) in Eqs. (32) and (33). This mathematical approximation was obtained by 352
calculating the values of the left-hand terms in Eqs. (35) and (36) for an expected range of 353
model parameters and determining the coefficients on the right-hand side by averaging the best 354
fit data for each considered combination of parameters. The maximum error of this 355
approximation was found to be slightly less than 15%. A similar approximation was proposed 356
by Diambra et al. (2017) and employed in the context of unreinforced cemented granular soils. 357
Equations (32) and (33) can be can be further manipulated to give: 358
𝑞𝑢 =2 𝑀 𝑏𝑐 𝜂𝑐𝑠
𝑎 (2.07𝐾𝑐𝑢+9.3 𝐸𝑓
𝐸𝜇𝑓)
100 (𝐾𝑐𝑢−𝑀𝑐)(
𝜂
𝐶𝑖𝑣
1𝑎
)
−𝑎
(37) 359

18
𝑞𝑡 =𝑀 𝑏𝑐 𝜂𝑐𝑠
𝑎 (0.93𝐾𝑐𝑡+0.3𝐸𝑓
𝐸𝜇𝑓)
100 (𝐾𝑐𝑡−𝑀𝑐)(
𝜂
𝐶𝑖𝑣
1𝑎
)
−𝑎
(38) 360
As shown in Fig. 6, where the strengths are plotted again versus an adjusted porosity/cement 361
content ratio η/Civ1/a ≈ η/Civ
0.28 as proposed by Consoli et al. (2007), the transformation 362
introduced by Eq. (31) and (32) has a limited effect on the model predictions. The newly 363
derived Eqs. (37) and (38) are of very similar form to the experimentally derived strength 364
relationships in Eqs. (1) and (2) by Consoli et al. (2009b) and Consoli et al. (2010). The value 365
of the exponent 1/a corroborates also the experimental findings from experimental data by 366
Consoli et al. (2013a) for fibre reinforced Botucatu residual soil in Eq (3) and in Fig. 1. 367
The parameter a of the proposed model corresponds to the power -Z in Eqs. (1) and (2) and it 368
confirms that the same value of the exponent -Z controls the strength in unconfined 369
compression and tension testing conditions. Although this parameter is not exactly the same as 370
the one found from UCS and STS tests by Consoli et al. (2013a), the values are close enough 371
to reproduce the experimental data in an effective way. The model also suggests that this 372
parameter is entirely governed by the soil matrix. On the other hand, the parameters X and Y in 373
Eqs (1) and (2) differ between them in the two testing modes, as also confirmed by the 374
modelling developments, and they can be expressed as: 375
𝑋 =2 𝑀 𝑏𝑐 𝜂𝑐𝑠
𝑎 (2.07𝐾𝑐𝑢+9.3 𝐸𝑓
𝐸𝜇𝑓)
100 (𝐾𝑐𝑢−𝑀𝑐) (39) 376
and 377
𝑌 =𝑀 𝑏𝑐 𝜂𝑐𝑠
𝑎 (0.93𝐾𝑐𝑡+0.3𝐸𝑓
𝐸𝜇𝑓)
100 (𝐾𝑐𝑡−𝑀𝑐) (40) 378

19
for unconfined compression and tension testing conditions, respectively. The two terms are 379
governed by a combination of factors related to both the soil matrix, the fibre reinforcement 380
and the cementing phase. 381
4.1.2 Effect of fibre content and properties 382
The effect of fibre content and properties on the strength of fibre reinforced cemented soil can 383
be easily studied by analysing the terms X and Y in Eqs (39) and (40). For a given moulding 384
density and cement content, these terms govern the compressive tensile strength as shown in 385
Eq. (37) and (38). It is possible to investigate the strength increase provided by the fibres by 386
plotting the % increase of these two parameters in relation to the case of no fibres (μf=0%) 387
versus the fibre content as shown in Figure 7a. The values of model parameters given in Table 388
1 have been used in this exercise. Addition of fibres leads to a limited increase in strength, 389
which for unconfined compression can overcome 15% only if large amounts of fibres are used 390
(μf=5%). For tensile tests, the increase is much more limited reaching only 0.5% at μf=5%. This 391
is related to the much lower proportion of fibre engaged in tension for this loading condition. 392
Using stiffer fibres has also a positive influence on the increase of the compressive strength. as 393
shown in Fig 7b. Full matrix to fibre bonding and absence of shear strain gradients around the 394
fibres (Diambra and Ibraim, 2015) have been assumed in this work. However, fibre aspect 395
ratio, length and fibre to matrix stiffness ratio affect the fibre to matrix stress transfer 396
mechanism. Diambra and Ibraim (2015) have shown that increasing the aspect ratio or the 397
length of the fibres has a beneficial interaction effect and would produce a similar trend of 398
increasing strength as the one associated with an increase of fibre stiffness. However, its 399
accurate quantification would require additional and more complex theoretical developments. 400
4.1.3 Tensile to compressive strength ratio 401
Combination of relationship (39) and (40) allows to achieve an explicit relationship between 402
tensile and compressive strength of the cemented soil: 403

20
𝑞𝑡
𝑞𝑢=
1
2
(2.07𝐾𝑐𝑢+9.3 𝐸𝑓
𝐸𝜇𝑓) (𝐾𝑐𝑢−𝑀𝑐)
(0.93𝐾𝑐𝑡+0.3𝐸𝑓
𝐸𝜇𝑓) (𝐾𝑐𝑡−𝑀𝑐)
(41) 404
which is mainly dependent on the strength contribution of the cement phase through the stress 405
path slope Ki and the cement friction ratio Mc. Substitution of the parameters used in this 406
research led to qt/qu = 0.156 for the cemented fibre reinforced Botucatu Residual Soil. This 407
value is very similar with the qt/qu = 0.14 found by the unconfined compressive tests and 408
splitting tensile tests in Consoli et al. (2013a) for this mixture. The theoretical variation of this 409
ratio with the fibre content is provided in Fig. 8. Increasing the fibre content result in a slightly 410
lower value of this ratio which would theoretically decrease to 0.136 for a fibre content μf=5%. 411
This decrease is related to the less proportion of fibres engaged in tension for splitting tensile 412
tests. Nevertheless, the influence of fibre content on this ratio appears rather limited. The 413
values plotted in Fig.8 are also all rather close to the experimental ratio found by Consoli et al. 414
(2013a), 415
. 416
5 CONCLUSIONS 417
This publication proposes a new theoretical derivation for both unconfined compression and 418
splitting tensile strengths based on the concept of superposition of failure strength contribution 419
of the soil matrix, cementing bond and fibre reinforcement phases. The validity of the model 420
has been shown by the comparison of model simulations with fibre-reinforced cemented 421
Botucatu residual soil, which agreed well with the hyperbolic relationship plotted between 422
UCS and STS versus the adjusted porosity/cement index. The model has also confirmed some 423
important material insights: 424

21
- The hyperbolic relationships presented in Eqs (1) and (2) of unconfined compression 425
(qu) and splitting tensile (qt) strengths versus the porosity/cement index (η/Civ) are 426
characterised by the same exponent power Z which does not depend on the two test 427
loading conditions. This has been theoretically explained by the proposed model which 428
also suggests that this exponent is entirely governed by the soil matrix. Soil matrix 429
properties seem to control this power Z. 430
- The scalars X and Y in the typical hyperbolic relationships (Eqs (1) and (2)) vary 431
between unconfined compression and splitting tensile conditions. The model suggests 432
that this variation is related to the different stress path between these two types of tests. 433
They are also affected by strength of the sand matrix, cement phase, fibre content and 434
fibre stiffness. 435
- The model yields to a constant tensile to compression strength ratio (qt/qu) which is 436
rather close to what experimentally observed. This ratio is only slightly dependent on 437
the fibre content. 438
Acknowledgments 439
The authors gratefully acknowledge the support provided by the UK Royal Academy of 440
Engineering under the Newton Research Collaboration Programme, (Grant reference: 441
NRCP1415/2/2) and by the Brazilian Council for Scientific and Technological 442
Research/Brazilian Ministry of Science and Technology (CNPq/MCT) (Grant reference: 443
308050/2015-0). 444
APPENDIX. Derivation of Equations (30) and (31) 445
The volumetric averaging approach (Diambra et al. 2011, Diambra et al. 2013; Diambra and 446
Ibraim 2015) in Eq.(5) suggests the following relationship between the stress state of the 447
composite material and its constituents: 448

22
[𝑡𝑖𝑠𝑖] = 𝜇𝑚 [
𝑡𝑚𝑠𝑚] + 𝜇𝑐 [
𝑡𝑐𝑠𝑐] + 𝜇𝑓 [
𝑡𝑓𝑠𝑓] (A1) 449
where the subscript i discriminate between UCS and STS, i=u and i=t respectively. Re-450
arranging the second line of Eq.(A1), it is possible to write 451
𝑠𝑚 =𝑠𝑖−𝜇𝑐𝑠𝑐−𝜇𝑓𝑠𝑓
𝜇𝑚 (A2) 452
Considering the failure criterion for the soil matrix in Eq. (7) and substituting (A2) in the first 453
line of (A1) 454
𝑡𝑖 = 𝜇𝑚𝑀∗ (
𝑠𝑖−𝜇𝑐𝑠𝑐−𝜇𝑓𝑠𝑓
𝜇𝑚) + 𝜇𝑐𝑡𝑐 + 𝜇𝑓𝑡𝑓 (A3) 455
including the strength criterion for the cement phase (name equations) in (A3) and considering 456
the stress path of the composite in Eq(4) 457
𝑡𝑖 = 𝑀∗ 𝑡𝑖
𝑘𝑖− 𝜇𝑐𝑀
∗ 𝑏𝑐
𝐾𝑐𝑖−𝑀𝑐− 𝜇𝑓𝑀
∗𝑠𝑓 + 𝜇𝑐𝑏𝑐 (1 +𝑀𝑐
𝐾𝑐𝑖−𝑀𝑐) + 𝜇𝑓𝑡𝑓 (A4) 458
This equation can now be simplified to obtain: 459
𝑡𝑖 = 𝑀∗ 𝑡𝑖
𝑘𝑖+ 𝜇𝑐𝑏𝑐
𝐾𝑐𝑖−𝑀∗
𝐾𝑐𝑖−𝑀𝑐+ 𝜇𝑓(𝑡𝑓 −𝑀
∗𝑠𝑓) (A5) 460
Substituting the formulation for the stress invariants in the fibres (Eqs. (22) and (23) for 461
unconfined compression tests and Eqs (29) and (30) for splitting tensile tests) and the stress 462
paths of the composite materials in Eq(a), and re-arranging, it is possible to derive the 463
following expressions of the maximum shear stress for the two types of test: 464
𝑡𝑢 =𝜇𝑐𝑏𝑐 (𝐾𝑐𝑢−𝑀
∗)
(1−𝑀∗−𝜇𝑓𝐸𝑓
𝐸𝜈(1+𝑀∗))(𝐾𝑐𝑢−𝑀𝑐)
(A6) 465
and 466

23
𝑡𝑡 =2𝜇𝑐𝑏𝑐 (𝐾𝑐𝑡−𝑀
∗)
(2−𝑀∗−2𝜇𝑓𝐸𝑓
𝐸(𝐾𝑓𝑡+𝑀
∗𝐾𝑓𝑠))(𝐾𝑐𝑡−𝑀𝑐) (A7) 467
468
469
470
471

24
References 472
473
Abdulla, A. A. and Kiousis, P. D. (1997a). “Behavior of cemented sands – I. Testing.” 474
International Journal for Numerical and Analytical Methods in Geomechanics, 21(8), 533-475
547. 476
Abdulla, A. A. and Kiousis, P. D. (1997b). “Behavior of cemented sands – II. Modelling.” 477
International Journal for Numerical and Analytical Methods in Geomechanics, 21(8), 549-478
568. 479
Been, K. and Jefferies, M.G. (1985). "A state parameter for sands." Géotechnique, 35(2), 99-480
112. 481
Consoli, N.C. (2014). “A method proposed for the assessment of failure envelopes of cemented 482
sandy soils”. Engineering Geology, 169, 61-68. 483
Consoli, N.C.; Corte, M.B. and Festugato, L. (2012). “Key parameters for tensile and 484
compressive strength of fiber-reinforced soil-lime mixtures.” Geosynthetics International, 485
19, 409-414. 486
Consoli, N.C.; Foppa, D.; Festugato, L. and Heineck, K.S. (2007). “Key parameters for 487
strength control of artificially cemented soils”. Journal of Geotechnical and 488
Geoenvironmental Engineering, 133(2), 197-205. 489
Consoli, N.C.; Dalla Rosa, F. and Fonini, A. (2009a). “Plate load tests on cemented soil layers 490
overlying weaker soil”. Journal of Geotechnical and Geoenvironmental Engineering, 491
135(12), 1846-1856. 492
Consoli, N.C.; Viana da Fonseca, A.; Cruz, R.C. and Heineck, K.S. (2009b). “Fundamental 493
parameters for the stiffness and strength control of artificially cemented sand”. Journal of 494
Geotechnical and Geoenvironmental Engineering, 135, 1347-1353. 495
Consoli, N.C.; Cruz, R.C.; Floss, M.F. and Festugato, L. (2010). “Parameters controlling 496
tensile and compressive strength of artificially cemented sand”. Journal of Geotechnical and 497
Geoenvironmental Engineering, 136, 759-763. 498
Consoli, N. C.; Zortea, F.; Souza, M. and Festugato, L. (2011a). “Studies on the dosage of 499
fiber-reinforced cemented soils.” Journal of Materials in Civil Engineering, 23(12), 1624-500
1632. 501
Consoli, N.C.; Moraes R.R. and Festugato, L. (2011b). “Split tensile strength of monofilament 502
polypropylene fiber-reinforced cemented sandy soils.” Geosynthetics International, 18, 57-503
62. 504

25
Consoli, N.C.; Moraes R.R. and Festugato, L. (2013a). “Variables controlling strength of fibre-505
reinforced cemented soils.” Proceedings of the ICE - Ground Improvement, 166, 221-232. 506
Consoli, N.C.; Consoli, B.S. and Festugato, L. (2013b). “A practical methodology for the 507
determination of failure envelopes of fiber-reinforced cemented sands.” Geotextiles and 508
Geomembranes, 41, 50-54. 509
Consoli, N. C., Samaniego, R. A. Q., Marques, S. F. V., Venson, G. I., Pasche, E. and 510
Velásquez, L. E. G. (2016). “A single model establishing strength of dispersive clay treated 511
with distinct binders.” Canadian Geotechnical Journal, 53, 2072-2079. 512
Di Prisco, C. and Nova, R. (1993). “A constitutive model for soil reinforced by continuous 513
threads.” Geotextiles and Geomembranes, 12(2), 161-178. 514
Diambra, A. (2010). “Fibre reinforced sands: experiments and constitutive modelling.” PhD 515
Thesis (Doctor of Philosophy) – Faculty of Engineering, Department of Civil Engineering, 516
University of Bristol, UK, 266 p. 517
Diambra, A.; Ibraim, E.; Muir Wood, D. and Russel, A. R. (2010). “Fibre reinforced sands: 518
experiments and modelling.” Geotextiles and Geomembranes, 28, p. 238-250. 519
Diambra, A., Ibraim, E., Peccin, A., Consoli, N.C., Festugato, L. (2017). “Theoretical 520
Derivation of Artificially Cemented Granular Soil Strength.” Journal of Geotechnical and 521
Geoenvironmental Engineering, 143(5): 04017003. 522
Diambra, A., Ibraim, E. Russell, A.R. and Muir Wood, D. (2011). "Modelling the undrained 523
response of fibre reinforced sands." Soils and Foundations, 51(4), 625-636. 524
Diambra, A., Ibraim, E. Russell, A.R. and Muir Wood, D. (2013). "Fibre reinforced sands: 525
from experiments to modelling and beyond." International Journal for Numerical and 526
Analytical Methods in Geomechanics, 37(15), 2427-2455. 527
Diambra, A. and Ibraim, E. (2015). "Fibre-reinforced sand: interaction at the fibre and grain 528
scale." Géotechnique, 65(4), 296-308. 529
Diambra, A.; Russel, A. R.; Ibraim, E. and Muir Wood, D. (2007). “Determination of fibre 530
orientation distribution in reinforced sands.” Géotechnique, 57(7), 623-628. 531
Dos Santos, A.P.S., Consoli, N.C. and Baudet, B.A. (2010). "The mechanics of fibre-reinforced 532
sand." Géotechnique, 60(10), 791-799. 533
Faro, V.P., Consoli, N.C., Schnaid, F., Thomé, A. and Lopes Jr, L.S. (2015). "Field tests on 534
laterally loaded rigid piles in cemented treated soils." Journal of Geotechnical and 535
Geoenvironmental Engineering, 141(6), 06015003 (d.o.i.: 10.1061/(ASCE)GT.1943-536
5606.0001296). 537

26
Felt, E. J., & Abrams, M. S. (1957). “Strength and elastic properties of compacted soil-cement 538
mixtures.” American Society for Testing and Materials Special Technical Publication 539
Portland Cement Association Research and Development Laboratory Bulletin. 540
Festugato, L.; Consoli, N. C.; Fourie, A. (2015). “Cyclic shear behaviour of fibre-reinforced 541
mine tailings.” Geosynthetics International, 22, 196-206. 542
Festugato, L.; Menger, E.; Benezra, F.; Kipper, E. A. and Consoli, N.C. (2017). “Fibre-543
reinforced cemented soils compressive and tensile strength assessment as a function of 544
filament length.” Geotextiles and Geomembranes, 45, 77-82. 545
Floss, M.F. (2012). “Strength and stiffness parameters controlling artificially cemented 546
granular soils.” Ph.D. Thesis, Federal University of Rio Grande do Sul, Porto Alegre, Brazil 547
(in Portuguese). 548
Heineck, K.S. (2002). “Study of the hydraulic and mechanical behaviour of geomaterials for 549
impervious horizontal barriers.” PhD Thesis, Federal University of Rio Grande do Sul, 550
Porto Alegre, Brazil (in Portuguese). 551
Heineck, K.S.; Coop, M.R. and Consoli, N.C. (2005). “Effect of microreinforcement of soils 552
from very small to large shear strains.” Journal of Geotechnical and Geoenvironmental 553
Engineering, 131(8), 1024-1033. 554
Huang, J. T. and Airey, D. W. (1998). “Properties of artificially cemented carbonate sand.” 555
Journal of Geotechnical and Geoenvironmental Engineering, 124(6): 492-499. 556
Ibraim, E.; Diambra, A.; Muir Wood, D. and Russel, A. R. (2010). “Static liquefaction of fibre 557
reinforced sand under monotonic loading.” Geotextiles and Geomembranes, 28, p. 374-385. 558
Ismail, M. A., Joer, H. A., Sim, W. H., and Randolph, M. F. (2002b). “Effect of cement type on 559
shear behavior of cemented calcareous soil.” Journal of Geotechnical and 560
Geoenvironmental. Engineering, 128(6), 520-529. 561
Jaeger, J.C., Cook, N.G.W. and Zimmerman, R.W. (2007). "Fundamentals of Rock 562
Mechanics." 4th Edition, Oxford - UK, Blackwell Publishing. 563
Kaniraj, S. and Havanagi, V. (2001). "Behavior of Cement-Stabilized Fiber-Reinforced Fly 564
Ash-Soil Mixtures." Journal of Geotechnical and Geoenvironmental Engineering, 127(7), 565
574-584. 566
Koerner, R. M. (2012). “Designing with Geosynthetics.” 6th ed. Bloomington, USA: Xlibris 567
Corp., v. 1. 568
Lade, P. V. and Overton, D. D. (1990). “Cementation effects in frictional materials.” Journal of 569
Geotechical Engineering, 115(10), 1373-1387. 570

27
Leonards, G.A. (1965). Experimental study of static and dynamic friction between soil and 571
typical construction materials. Technical report AFWL-TR-65-161. Air Force Weapons 572
Laboratory. 573
Lirer, S.; Flora, A. and Consoli, N.C. (2011). “On the strength of fibre-reinforced soils.” Soils 574
and Foundations, 51(4), 601-609. 575
Maher, M.H. and Ho, Y.C. (1993). “Behavior of fiber-reinforced cemented sand under static 576
and cyclic loads.” Geotechnical Testing Journal, 16 (3), 330–338. 577
Park, S. S. (2009). “Effect of fiber reinforcement and distribution on unconfined compressive 578
strength of fiber-reinforced cemented sand.” Geotextiles and Geomembranes, 27, 162-166. 579
Samaan, M., Mirmiran, A., & Shahawy, M. (1998). “Model of concrete confined by fiber 580
composites” Journal of structural engineering, 124(9), 1025-1031. 581
Saxena, S. K. and Lastrico, R. M. (1978). “Static properties of lightly cemented sand.” Journal 582
of Geotechnical Engineering Division, 104(GT12), 1449-1464. 583
Sivakumar Babu, G. L.; Vasudevan, A. K. and Haldar, S. (2008). “Numerical simulation of 584
fiber-reinforced sand behavior.” Geotextiles and Geomembranes, 26, 181-188. 585
Swamy, R. N. (1971). “Dynamic Poisson's ratio of Portland cement paste, mortar and 586
concrete.” Cement and Concrete Research, 1(5), 559-583. 587
Tang, C.; Shi, B.; Gao, W.; Chen, F. and Cai, Y. (2007). “Strength and mechanical behavior of 588
short polypropylene fiber reinforced and cement stabilized clayey soil.” Geotextiles and 589
Geomembranes, 25, 194-202. 590
Teng, J. G., & Lam, L. (2004). “Behavior and modeling of fiber reinforced polymer-confined 591
concrete”. Journal of structural engineering, 130(11), 1713-1723. 592
Vatsala, A.; Nova, R. and Srinivasa Murthy, B. R. (2001). “Elastoplastic model for cemented 593
soils.” Journal of Geotechnical and Geoenvironmental Engineering, 127(8), 679-687. 594
Villard, P. and Jouve, P. (1989). “Behaviour of granular materials reinforced by continuous 595
threads.” Computers and Geotechnics, 7, 83-98. 596
Waldron, L. J. (1977). “The shear resistance of root-permeated homogeneous and stratified 597
soil.” Soil Science Society of America Journal, 41, 843-849. 598
Wu, T. H.; Mckinnel, W. P. Iii and Swanston, D. N. (1979). “Strength of tree roots and 599
landslides on Prince of Wales Island, Ala2ska.” Canadian Geotechnical Journal, 16(1), 19-600
33. 601
602

28
Notation list 603
a Parameter linking peak strength to state parameter 604
bc Binder strength component 605
C Constant for elastic stiffness of fibre reinforced cemented soil 606
cc Cohesion of the cement phase 607
Civ Volumetric cement content (expressed in percentage) 608
E Elastic modulus of the fibre-reinforced cemented sand 609
Ef Elastic modulus of the fibres 610
Kci Cement stress ratio (Kcu for UCS tests and Kct for STS tests) 611
Kfi Fibre stress ratio (Kfu for UCS tests and Kft for STS tests) 612
ki Stress ratio at failure (ku for UCS tests and kt for STS tests) 613
Ksf Coefficient for stress invariant sf of the fibre phaseKtf Coefficient for stress 614
invariant tf of the fibre phase 615
M Critical state strength ratio for the sand 616
Mc Slope of the failure line for the cement phase in the qc -pc plane 617
M* Peak strength ratio for the sand 618
qt Unconfined compressive strength for the cemented sand 619
qu Unconfined compressive strength for the cemented sand 620
s Mean stress of the cemented sand 621
sc Mean stress of the cement phase 622
sf Mean stress of the fibres 623
sm Mean stress of the sand matrix 624
STS Splitting tensile tests 625
t Maximum shear stress of the cement sand 626
ti Maximum shear stress for the tests (tu for UCS tests and tt for STS tests) 627

29
tc Maximum shear stress of the cement phase 628
tf Maximum shear stress of the fibres 629
tm Maximum shear stress of the sand matrix 630
UCS Unconfined compression tests 631
X Multiplying parameter in Empirical relationship (1) 632
Y Multiplying parameter in Empirical relationship (2) 633
Z Exponent of empirical relationships (1) and (2) 634
ε Strain for fibre reinforced cemented soil 635
Friction angle for the sand matrix 636
c Friction angle for the cement phase 637
ν Poisson’s ratio for cemented sand 638
νc Poisson’s ratio for cement phase 639
μc Volumetric cement concentration 640
μf Volumetric fibre concentration 641
μm Volumetric sand matrix concentration 642
σ Stress for fibre reinforced cemented soil 643
σc Stress for the cement phase 644
σf Fibres average stress 645
𝜓 State parameter 646
η Porosity 647
ηcs Porosity at critical state 648
θl Angle of zero strain for splitting tensile test 649
650

30
List of tables 651
Table 1. Parameters of the proposed model 652
Table 2. Physical properties of the sand samples 653
Table 3. Moulding parameters 654
655
656

31
List of figures 657
Figure 1. Variation of qt (a) and qu (b)with porosity/cement ratio for fibre reinforced Botucatu 658
residual soil – Portland cement (adapted from Consoli et al. 2013a). 659
Figure 2. Assumed boundary conditions for (a) the unconfined compression test and (b) the 660
tensile splitting test. 661
Figure 3. Representation of strain conditions for the splitting tensile test. 662
Figure 4. Calibration of parameter a for Botucatu Residual Soil. 663
Figure 5. Comparison between model prediction and experimental results for UCS and STS of 664
fibre reinforce cemented Botucatu residual soil. 665
Figure 6. Comparison between experimental data, theoretical prediction and approximated 666
formulas (37) and (38) for fibre reinforced cemented Botucatu residual soil. 667
Figure 7. Theoretical variation of increase in strength with (a) variation of fibre content and (b) 668
variation of fibre elastic modulus. 669
Figure 8. Theoretical variation of qt/qu with variation of fibre content for the values of model 670
parameters in Table 1. 671
672

32
673
674
675
676
TABLES 677
678

33
Table 1. Parameters of the proposed model and value assumed for fibre reinforced cemented 679
Botucatu residual soil 680
Symbol Variable Values
𝜙 Critical state friction angle 30.5°
ηcs Critical state soil porosity 30%
a
Parameter governing
dependence of soil strength
on its density
3.5
bc Binder strength component 19 MPa (7 days)
𝜙𝑐 Cement friction angle 32º
νc Cement Poisson’s ratio 0.2
ν Composite Poisson’s ratio 0.26
Ef Elastic modulus of the
fibres 3000 MPa
E Elastic modulus of the
composite material
𝐶 (𝐶𝑖𝑣𝜂1/𝛼
)
C=9000 MPa
681
682

34
Table 2. Physical properties of the sand samples 683
Soil Type Botucatu
Residual
Soil
Specific gravity 2.63 Medium sand (0.2
mm < diameter < 0.6 mm): %
16.2
Fine sand (0.06 mm
< diameter < 0.2 mm): %
45.4
Silt (0.002 mm <
diameter < 0.06
mm): %
33.4
Clay (Diameter <
0.002 mm) 5.0
Mean particle
diameter, D50: mm 0.16
Liquid limit: % 23 Plastic limit: % 13
Plasticity index: % 10 Uniformity
coefficient, Cu 50
Preponderant
minerals Quartz
Soil classification (ASTM 2006)
SC
684
685

35
Table 3. Moulding parameters 686
Soil Botucatu residual
soil
Void ratio (e) 0.64, 0.70, 0.78
Cement content (%) 1, 2, 3, 5, 7, 9, 12
Fibre content (%) 0.5
Cement type PC III
Moisture content (%) 10
η/Civ from 7 to 64
687

36
688
689
690
691
FIGURES 692
693

37
694
(a) (b) 695
Figure 1. Variation of qt (a) and qu (b)with porosity/cement ratio for fibre reinforced Botucatu 696
residual soil – Portland cement (adapted from Consoli et al. 2013a). 697
698

38
699 (a) (b) 700
701
Figure 2. Assumed boundary conditions for (a) the unconfined compression test and (b) the 702
tensile splitting test. 703
704
σx=-qt
σz=3qt
σz= qu
σx=0
σy=0εy=0
σy
Splitting
tensile test
Unconfined
compression test
yx
z
39
705
Figure 3. Representation of strain conditions for the splitting tensile test. 706
707
708
Figure 4. Calibration of parameter a for Botucatu Residual Soil. 709
710
711
ɛx
θ
θl
yx
z
fibre
ɛz
θɛ ɛ
γ
0.50
0.60
0.70
0.80
0.90
1.00
1.10
1.20
0.95 0.97 0.99 1.01 1.03 1.05 1.07
M*/M
hcs/h
Botucatu Residual Soil
𝑀∗
𝑀= (
𝜂𝑐𝑠𝜂)
3.5

40
(a) (b)
(c) (d)
Figure 5. Comparison between model prediction and experimental results for UCS and STS of 712
fibre reinforced cemented Botucatu residual soil. 713
714

41
(a)
(b)
Figure 6. Comparison between experimental data, theoretical prediction and approximated 715
formulas (37) and (38) for fibre reinforced cemented Botucatu residual soil. 716
717
718
719
𝑞𝑢 =2 𝑀 𝑏𝑐 𝜂𝑐𝑠
𝑎 (2.07𝐾𝑐𝑢 + 9.3 𝐸𝑓𝐸𝜇𝑓)
100 (𝐾𝑐𝑢 −𝑀𝑐) 𝜂
𝐶𝑖𝑣1𝑎
−𝑎
𝑞𝑡 =𝑀 𝑏𝑐 𝜂𝑐𝑠
𝑎 (0.93𝐾𝑐𝑡 + 0.3𝐸𝑓𝐸𝜇𝑓)
100 (𝐾𝑐𝑡 −𝑀𝑐) 𝜂
𝐶𝑖𝑣1𝑎
−𝑎

42
720
(a) 721
722
(b) 723
724
Figure 7. Theoretical variation of increase in strength with (a) variation of fibre content and (b) 725
variation of fibre elastic modulus 726
727
728

43
729
Figure 8. Theoretical variation of qt/qu with variation of fibre content for the values of model 730
parameters in Table 1 731
732
733