Feruar 2016 - IFCC
89
The Journal of the Internaonal Federaon of Clinical Chemistry and Laboratory Medicine Communicaons and Publicaons Division (CPD) of the IFCC Editor-in-chief : Prof. Gábor L. Kovács, MD, PhD, DSc Department of Laboratory Medicine, Faculty of Medicine, University of Pecs, Hungary e-mail: [email protected] ISSN 1650-3414 Volume 27 Number 1 February 2016
Transcript of Feruar 2016 - IFCC
The Journal of the International Federation of Clinical Chemistry and Laboratory Medicine
Communications and Publications Division (CPD) of the IFCCEditor-in-chief : Prof. Gábor L. Kovács, MD, PhD, DScDepartment of Laboratory Medicine, Faculty of Medicine, University of Pecs, Hungarye-mail: [email protected]
ISSN 1650-3414 Volume 27 Number 1February 2016
In this issue
Foreword of the editorGábor L. Kovács 3
Harmonization of clinical laboratory test resultsJillian R. Tate, Gary L. Myers 5
Harmonization of clinical laboratory information – current and future strategiesMario Plebani 15
Harmonization initiatives in EuropeFerruccio Ceriotti 23
The International Consortium for Harmonization of Clinical Laboratory Results (ICHCLR) – a pathway for harmonizationGary L. Myers, W. Greg Miller 30
Harmonization of clinical laboratory test results: the role of the IVD industryDave Armbruster, James Donnelly 37
Deriving harmonised reference intervals – global activitiesJillian R. Tate, Gus Koerbin, Khosrow Adeli 48
Critical risk results – an update on international initiativesLam Q., Ajzner E., Campbell C.A., Young A. 66
Analytical challenges in the genetic diagnosis of Lynch syndrome – difficult detection of germ-line mutations in sequences surrounding homopolymersCastillejo M.I., Castillejo A., Barbera V.M., Soto J.L. 77
The first green diagnostic centre and laboratory building in IndonesiaJoseph B. Lopez, Endang Hoyaranda, Ivan Priatman 84
eJIFCC2016Vol27No1pp003-004Page 3
In this issue: Harmonization of Clinical Laboratory Test Results
Foreword of the editorEditor in Chief: Gábor L. Kovács, MD, PhD, DSc
The current issue of the eJIFCC is devoted to lab-oratory harmonization. Harmonization is a fun-damental aspect of quality in laboratory medi-cine and its ultimate goal is to improve patient outcomes through the provision of accurate and actionable laboratory information. Two ex-cellent and renowned laboratory scientists (Ms. Jillian Tate from Australia and Dr. Gary L. Myers from the US) were asked to invite specialists on harmonization and guest-edit the issue.
Jill Tate is a Senior Scientist working in the Department of Chemical Pathology at the Pathology Queensland Central Laboratory in Brisbane, Australia and currently co-ordinates the laboratory’s Research and Development Unit which collaborates closely with local, na-tional and international clinical and laboratory groups. She has been involved with harmoni-zation activities since the 1990’s through work with lipoprotein(a) standardization and the IFCC Working Group on the Standardization of Lp(a) Assays, then with cardiac troponin and the IFCC Committee on the Standardization of Markers of Cardiac Damage. Between 2008 and 2014 Jill chaired the IFCC WG-TNI, which is de-veloping a secondary reference material for the standardization of troponin I assays. In October 2010 in Gaithersburg, USA, the AACC held their inaugural harmonization meeting. Following this meeting, which was attended by Jill on be-half of the Australasian Association of Clinical
Biochemists (AACB), the AACB Harmonization Committee was formed in 2011. As chair of the committee since its inception, Jill coordinates many of the AACB’s harmonization activities in-cluding workshops and the formation of work-ing parties involved with various aspects of har-monization, e.g. AACB Committee on Common Reference Intervals, AACB-RCPA Working Party on Management of Critical Laboratory Test Results. Over this time, she has guest-edited special issues on harmonization for The Clinical Biochemist Reviews and Clinica Chimica Acta.
Jill’s main passion in the routine laboratory for over 30 years has been to work in the pro-tein electrophoresis area and she has written widely on serum free light chain measure-ment. Standardization and harmonization of free light chain measurements remain contro-versial. Currently she is co-guest editing a spe-cial proteins issue on protein electrophoresis and serum free light chain measurement for Clinical Chemistry and Laboratory Medicine, due out in May this year. Above all Jill is en-thusiastic about the role of the profession in Laboratory Medicine and believes that harmo-nization is an important way that the profes-sion can add value to Laboratory Medicine.
Gary Myers, PhD, currently serves as Chair of the Joint Committee for Traceability in Laboratory Medicine. He also serves as Chair of the Council for the International Consortium for Harmonization
eJIFCC2016Vol27No1pp003-004Page 4
Gábor L. KovácsForeword of the editor
of Clinical Laboratory Results (ICHCLR). His most recent position was Vice President, Science and Practice Affairs for the American Association for Clinical Chemistry (AACC). Prior to joining AACC, Dr. Myers served as Chief, Clinical Chemistry Branch at the United States Centers for Disease Control and Prevention (CDC). During his 33+ year career at CDC he directed programs to improve and standardize the laboratory measurement of
biomarkers used to assess chronic disease sta-tus, particularly for cardiovascular disease and diabetes. Dr. Myers served as Secretary for the Scientific Division of the International Federation of Clinical Chemistry and Laboratory Medicine from 2009-2014. In 2015 Dr. Myers received AACC’s Outstanding Lifetime Achievement Award in Clinical Chemistry and Laboratory Medicine. He served as AACC President in 2007.
eJIFCC2016Vol27No1pp005-014Page 5
In this issue: Harmonization of Clinical Laboratory Test Results
Harmonization of clinical laboratory test resultsGuest editors: Jillian R. Tate1, Gary L. Myers2
1 Pathology Queensland, Royal Brisbane and Women’s Hospital, Brisbane, Qld, Australia2 Chair, Joint Committee for Traceability in Laboratory Medicine, Smyrna, Georgia, USA; International Consortium for Harmonization of Clinical Laboratory Results
A R T I C L E I N F O E D I T O R I A L
Clinical laboratory testing is now a global activity with laboratories no longer working in isolation but as re-gional and national networks, and often at interna-tional levels. We now have all of the electronic gadget-ry via internet technology at our fingertips to rapidly and accurately measure and report on laboratory test-ing but are our test results harmonized?
WHAT IS HARMONIZATION OF LABORATORY TESTING?
In the context of Laboratory Medicine, harmonization of laboratory testing refers to our ability to achieve the same result (within clinically acceptable limits) and the same interpretation irrespective of the mea-surement procedure used, the unit or reference in-terval applied, and when and/or where a measure-ment is made.
Laboratories may use different analytical methods that may not be harmonized, possibly with differ-ent units of reporting. We should not assume that the differing numbers can be directly compared es-pecially if the transfer of results from the laboratory to the report recipient does not highlight differences in units of reporting or in assay methods in use. To
Corresponding author:Jillian R. TateDepartment of Chemical Pathology Pathology Queensland Royal Brisbane and Women’s Hospital Herston, QLD 4029AustraliaPhone: 61-7-3646-0082E-mail: [email protected]
Key words: harmonization, standardization, laboratory medicine, total testing process
eJIFCC2016Vol27No1pp005-014Page 6
Jillian R. Tate, Gary L. MyersHarmonization of clinical laboratory test results
the contrary, the assumption made by patients, clinicians and other healthcare professionals is that clinical laboratory tests performed by dif-ferent laboratories at different times on the same sample and specimen are comparable in their quality and interpretation.
WHY IS HARMONIZATION NEEDED IN LABORATORY MEDICINE?
When laboratory test results differ the potential exists for misinterpretation of results, wrong treatments and adverse patient outcomes. It is our responsibility as laboratory professionals to identify where gaps exist in laboratory testing and endeavour to harmonize these where pos-sible, thereby minimising misinterpretation of test results.
WHO IS HARMONIZATION OF LABORATORY TESTING INTENDED FOR?
The key stakeholders who will benefit from har-monization are the patients, the clinical labora-tory community, diagnostic industry, clinicians, professional societies, information technology providers, consumer advocate groups, regu-latory and governmental bodies. The clinical laboratory community includes all disciplines of Laboratory Medicine. As potential consum-ers of laboratory testing ourselves, we expect to receive not only the Right result on the Right patient at the Right time in the Right form, but also the Right test choice with the Right inter-pretation with the Right advice as to what to do next with the result. This should be irrespective of the laboratory that produced the result and is achievable through harmonization (1).
AN OVERVIEW OF HARMONIZATION
In this harmonization issue Mario Plebani, who has been a proponent of harmonization in Laboratory Medicine for over 20 years provides an overview of the current and future strategies
needed to achieve harmonization of clinical lab-oratory information (1, 2). He emphasises the importance of considering the complete harmo-nization picture to ensure the comparability of laboratory information in all aspects of the total testing process (TTP) including the request, the sample, the analysis and the report.
As discussed by Plebani and others in this is-sue, a systematic approach to harmonization is needed that requires the following:
1. Awareness by the Laboratory Medicine com-munity that there is a need for harmonized processes not only for the analytical phase but across all steps of the TTP (3);
2. Awareness that harmonization processes are complex; hence a systematic and evidence-based approach that reflects best laboratory practice is needed;
3. An organizational plan or roadmap for the set-up and implementation of each harmo-nization activity is a pre-requisite and must identify and describe the problem in detail, identify relevant groups including external bodies when forming a working group, de-termine a funding source, gather technical information and data from various sources, consider the solutions, produce a discus-sion paper, seek feedback comments from the relevant stakeholders through discus-sion and revise recommendations, publish endorsed recommendations, promote and implement them, then monitor and survey their introduction (4-6);
4. Communication with main stakeholders, i.e. pathologists, scientists, clinical groups, regulatory bodies, IT developers, and con-sumer groups is central to the success of any harmonization project with a consen-sus outcome arrived at through cooperation and discussion (4,7,8).
eJIFCC2016Vol27No1pp005-014Page 7
Jillian R. Tate, Gary L. MyersHarmonization of clinical laboratory test results
What is the status of harmonization activities globally?
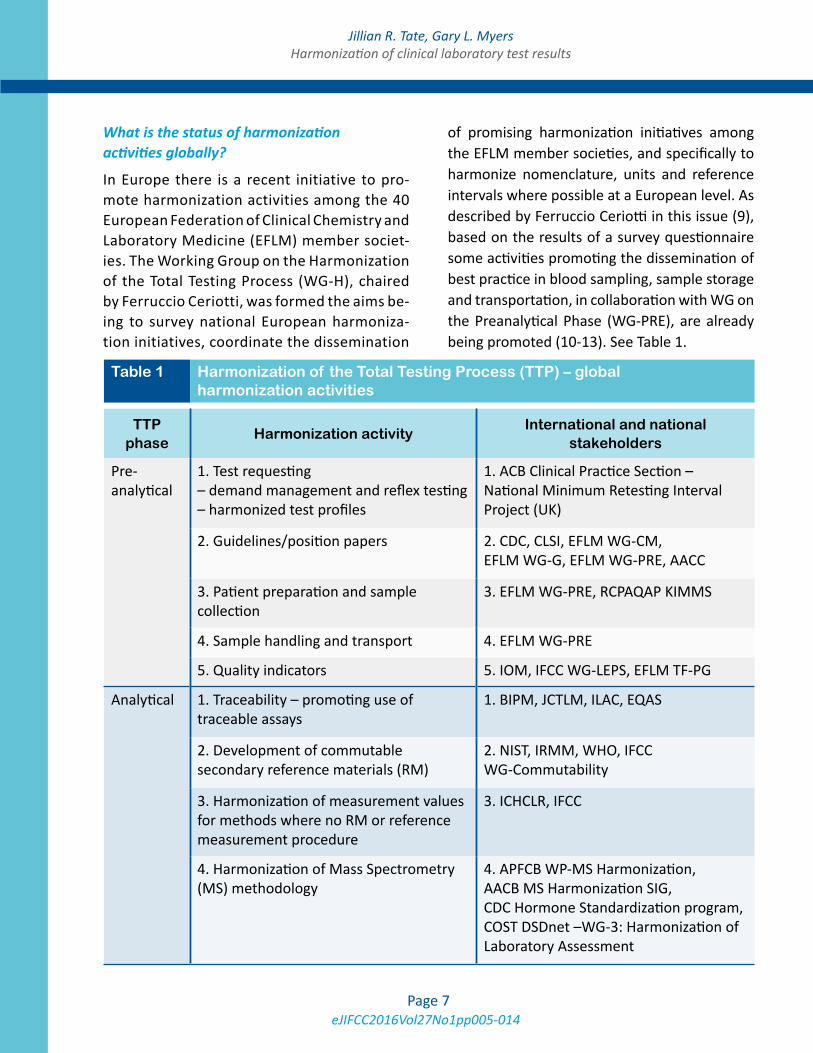
In Europe there is a recent initiative to pro-mote harmonization activities among the 40 European Federation of Clinical Chemistry and Laboratory Medicine (EFLM) member societ-ies. The Working Group on the Harmonization of the Total Testing Process (WG-H), chaired by Ferruccio Ceriotti, was formed the aims be-ing to survey national European harmoniza-tion initiatives, coordinate the dissemination
of promising harmonization initiatives among the EFLM member societies, and specifically to harmonize nomenclature, units and reference intervals where possible at a European level. As described by Ferruccio Ceriotti in this issue (9), based on the results of a survey questionnaire some activities promoting the dissemination of best practice in blood sampling, sample storage and transportation, in collaboration with WG on the Preanalytical Phase (WG-PRE), are already being promoted (10-13). See Table 1.
Table 1 Harmonization of the Total Testing Process (TTP) – global harmonization activities
TTP phase
Harmonization activityInternational and national
stakeholders
Pre-analytical
1. Test requesting – demand management and reflex testing – harmonized test profiles
1. ACB Clinical Practice Section – National Minimum Retesting Interval Project (UK)
2. Guidelines/position papers 2. CDC, CLSI, EFLM WG-CM, EFLM WG-G, EFLM WG-PRE, AACC
3. Patient preparation and sample collection
3. EFLM WG-PRE, RCPAQAP KIMMS
4. Sample handling and transport 4. EFLM WG-PRE
5. Quality indicators 5. IOM, IFCC WG-LEPS, EFLM TF-PG
Analytical 1. Traceability – promoting use of traceable assays
1. BIPM, JCTLM, ILAC, EQAS
2. Development of commutable secondary reference materials (RM)
2. NIST, IRMM, WHO, IFCC WG-Commutability
3. Harmonization of measurement values for methods where no RM or reference measurement procedure
3. ICHCLR, IFCC
4. Harmonization of Mass Spectrometry (MS) methodology
4. APFCB WP-MS Harmonization, AACB MS Harmonization SIG, CDC Hormone Standardization program, COST DSDnet –WG-3: Harmonization of Laboratory Assessment
eJIFCC2016Vol27No1pp005-014Page 8
Jillian R. Tate, Gary L. MyersHarmonization of clinical laboratory test results
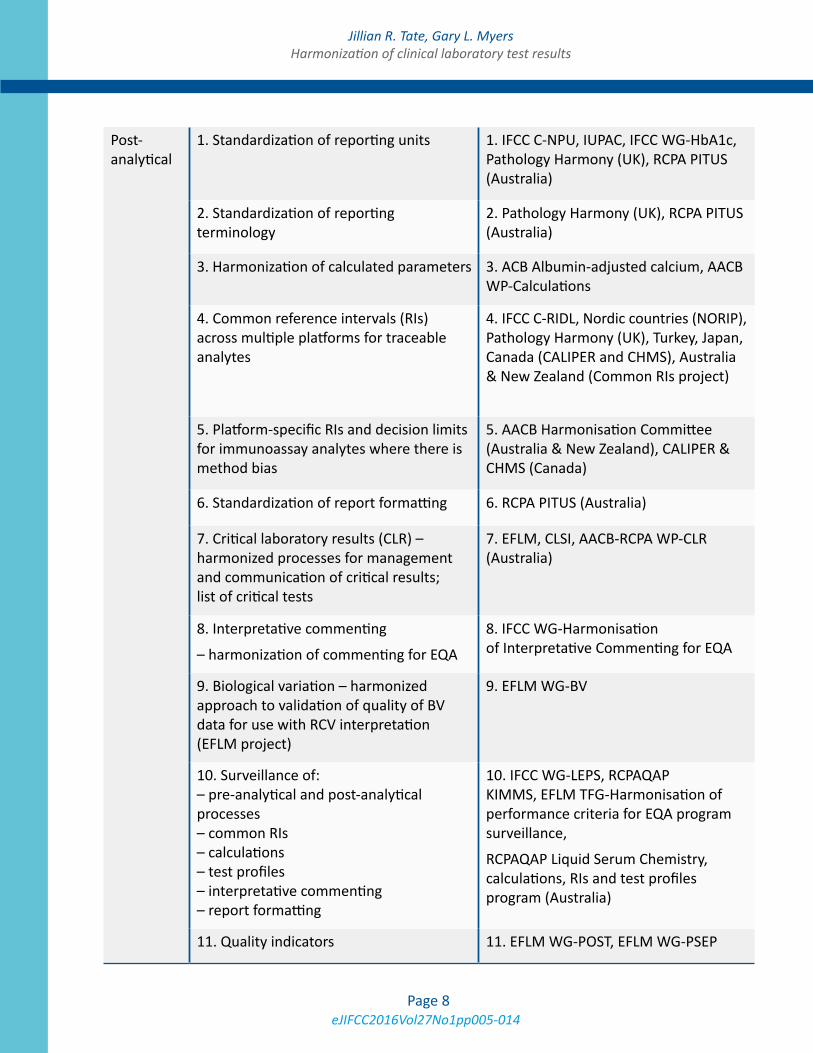
Post-analytical
1. Standardization of reporting units 1. IFCC C-NPU, IUPAC, IFCC WG-HbA1c, Pathology Harmony (UK), RCPA PITUS (Australia)
2. Standardization of reporting terminology
2. Pathology Harmony (UK), RCPA PITUS (Australia)
3. Harmonization of calculated parameters 3. ACB Albumin-adjusted calcium, AACB WP-Calculations
4. Common reference intervals (RIs) across multiple platforms for traceable analytes
4. IFCC C-RIDL, Nordic countries (NORIP), Pathology Harmony (UK), Turkey, Japan, Canada (CALIPER and CHMS), Australia & New Zealand (Common RIs project)
5. Platform-specific RIs and decision limits for immunoassay analytes where there is method bias
5. AACB Harmonisation Committee (Australia & New Zealand), CALIPER & CHMS (Canada)
6. Standardization of report formatting 6. RCPA PITUS (Australia)
7. Critical laboratory results (CLR) – harmonized processes for management and communication of critical results; list of critical tests
7. EFLM, CLSI, AACB-RCPA WP-CLR (Australia)
8. Interpretative commenting
– harmonization of commenting for EQA
8. IFCC WG-Harmonisation of Interpretative Commenting for EQA
9. Biological variation – harmonized approach to validation of quality of BV data for use with RCV interpretation (EFLM project)
9. EFLM WG-BV
10. Surveillance of: – pre-analytical and post-analytical processes – common RIs – calculations – test profiles – interpretative commenting – report formatting
10. IFCC WG-LEPS, RCPAQAP KIMMS, EFLM TFG-Harmonisation of performance criteria for EQA program surveillance,
RCPAQAP Liquid Serum Chemistry, calculations, RIs and test profiles program (Australia)
11. Quality indicators 11. EFLM WG-POST, EFLM WG-PSEP
eJIFCC2016Vol27No1pp005-014Page 9
Jillian R. Tate, Gary L. MyersHarmonization of clinical laboratory test results
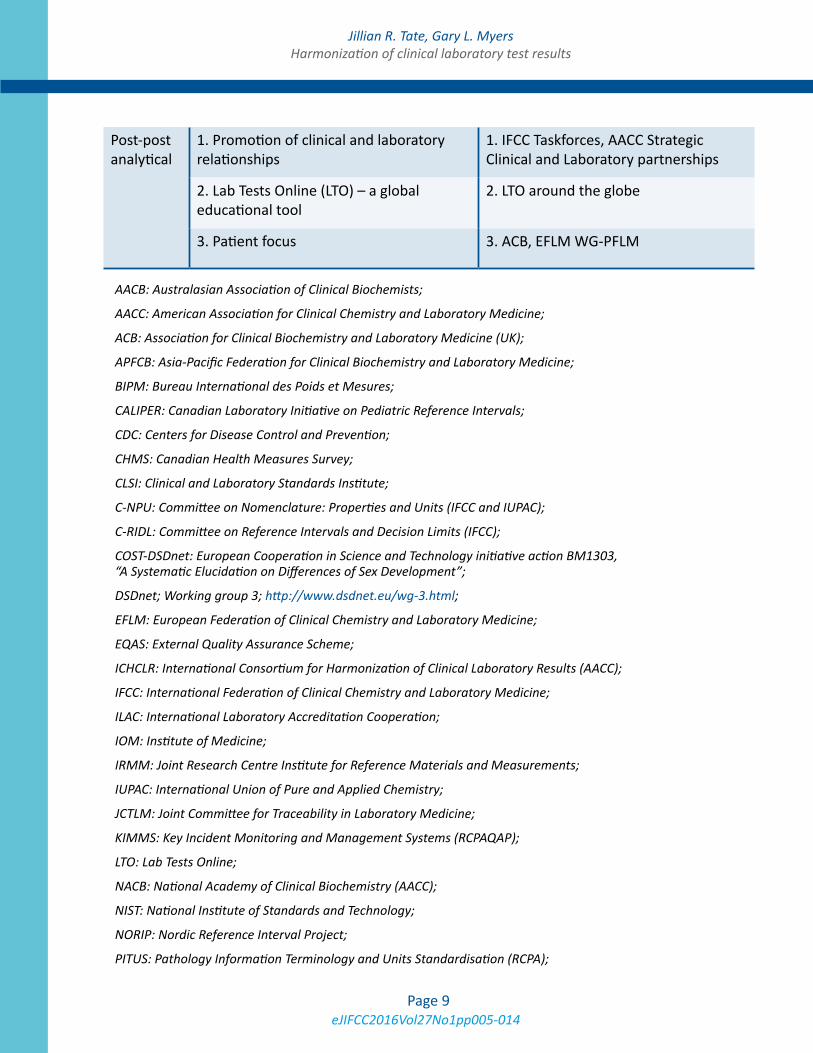
Post-post analytical
1. Promotion of clinical and laboratory relationships
1. IFCC Taskforces, AACC Strategic Clinical and Laboratory partnerships
2. Lab Tests Online (LTO) – a global educational tool
2. LTO around the globe
3. Patient focus 3. ACB, EFLM WG-PFLM
AACB: Australasian Association of Clinical Biochemists;
AACC: American Association for Clinical Chemistry and Laboratory Medicine;
ACB: Association for Clinical Biochemistry and Laboratory Medicine (UK);
APFCB: Asia-Pacific Federation for Clinical Biochemistry and Laboratory Medicine;
BIPM: Bureau International des Poids et Mesures;
CALIPER: Canadian Laboratory Initiative on Pediatric Reference Intervals;
CDC: Centers for Disease Control and Prevention;
CHMS: Canadian Health Measures Survey;
CLSI: Clinical and Laboratory Standards Institute;
C-NPU: Committee on Nomenclature: Properties and Units (IFCC and IUPAC);
C-RIDL: Committee on Reference Intervals and Decision Limits (IFCC);
COST-DSDnet: European Cooperation in Science and Technology initiative action BM1303, “A Systematic Elucidation on Differences of Sex Development”;
DSDnet; Working group 3; http://www.dsdnet.eu/wg-3.html;
EFLM: European Federation of Clinical Chemistry and Laboratory Medicine;
EQAS: External Quality Assurance Scheme;
ICHCLR: International Consortium for Harmonization of Clinical Laboratory Results (AACC);
IFCC: International Federation of Clinical Chemistry and Laboratory Medicine;
ILAC: International Laboratory Accreditation Cooperation;
IOM: Institute of Medicine;
IRMM: Joint Research Centre Institute for Reference Materials and Measurements;
IUPAC: International Union of Pure and Applied Chemistry;
JCTLM: Joint Committee for Traceability in Laboratory Medicine;
KIMMS: Key Incident Monitoring and Management Systems (RCPAQAP);
LTO: Lab Tests Online;
NACB: National Academy of Clinical Biochemistry (AACC);
NIST: National Institute of Standards and Technology;
NORIP: Nordic Reference Interval Project;
PITUS: Pathology Information Terminology and Units Standardisation (RCPA);
eJIFCC2016Vol27No1pp005-014Page 10
Jillian R. Tate, Gary L. MyersHarmonization of clinical laboratory test results
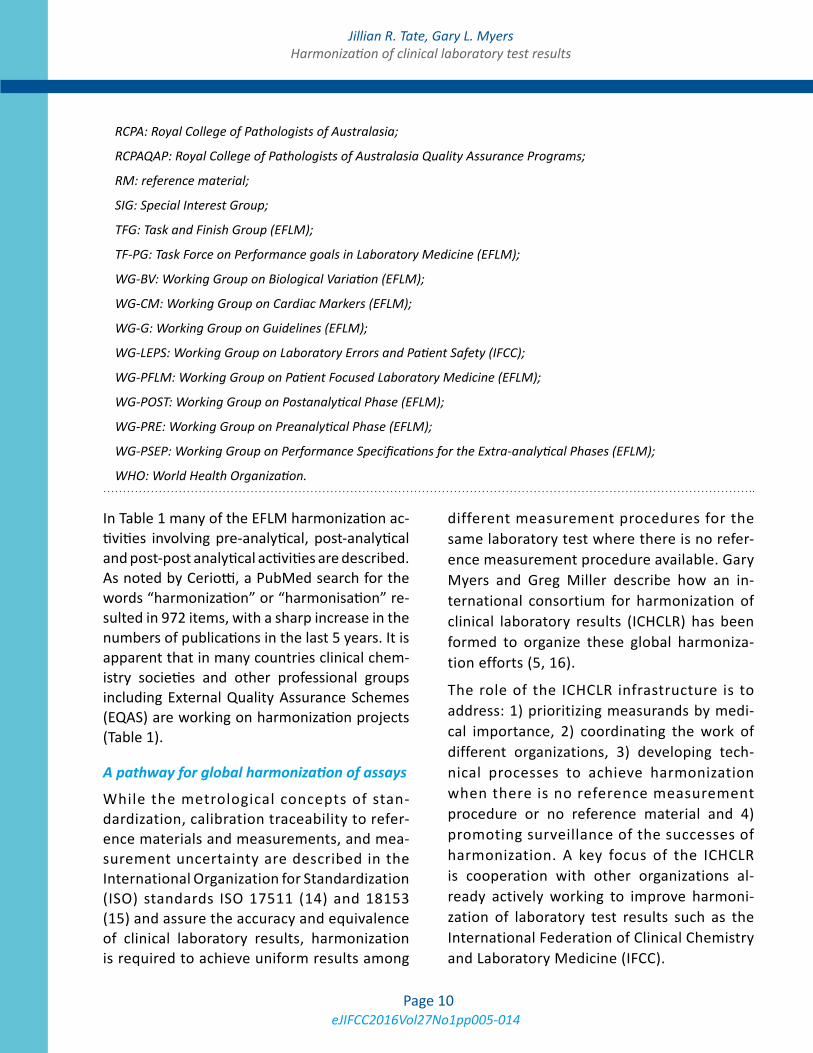
RCPA: Royal College of Pathologists of Australasia;
RCPAQAP: Royal College of Pathologists of Australasia Quality Assurance Programs;
RM: reference material;
SIG: Special Interest Group;
TFG: Task and Finish Group (EFLM);
TF-PG: Task Force on Performance goals in Laboratory Medicine (EFLM);
WG-BV: Working Group on Biological Variation (EFLM);
WG-CM: Working Group on Cardiac Markers (EFLM);
WG-G: Working Group on Guidelines (EFLM);
WG-LEPS: Working Group on Laboratory Errors and Patient Safety (IFCC);
WG-PFLM: Working Group on Patient Focused Laboratory Medicine (EFLM);
WG-POST: Working Group on Postanalytical Phase (EFLM);
WG-PRE: Working Group on Preanalytical Phase (EFLM);
WG-PSEP: Working Group on Performance Specifications for the Extra-analytical Phases (EFLM);
WHO: World Health Organization.
In Table 1 many of the EFLM harmonization ac-tivities involving pre-analytical, post-analytical and post-post analytical activities are described. As noted by Ceriotti, a PubMed search for the words “harmonization” or “harmonisation” re-sulted in 972 items, with a sharp increase in the numbers of publications in the last 5 years. It is apparent that in many countries clinical chem-istry societies and other professional groups including External Quality Assurance Schemes (EQAS) are working on harmonization projects (Table 1).
A pathway for global harmonization of assays
While the metrological concepts of stan-dardization, calibration traceability to refer-ence materials and measurements, and mea-surement uncertainty are described in the International Organization for Standardization (ISO) standards ISO 17511 (14) and 18153 (15) and assure the accuracy and equivalence of clinical laboratory results, harmonization is required to achieve uniform results among
different measurement procedures for the same laboratory test where there is no refer-ence measurement procedure available. Gary Myers and Greg Miller describe how an in-ternational consortium for harmonization of clinical laboratory results (ICHCLR) has been formed to organize these global harmoniza-tion efforts (5, 16).
The role of the ICHCLR infrastructure is to address: 1) prioritizing measurands by medi-cal importance, 2) coordinating the work of different organizations, 3) developing tech-nical processes to achieve harmonization when there is no reference measurement procedure or no reference material and 4) promoting surveillance of the successes of harmonization. A key focus of the ICHCLR is cooperation with other organizations al-ready actively working to improve harmoni-zation of laboratory test results such as the International Federation of Clinical Chemistry and Laboratory Medicine (IFCC).

eJIFCC2016Vol27No1pp005-014Page 11
Jillian R. Tate, Gary L. MyersHarmonization of clinical laboratory test results
The major advantages of harmonized test results include the use of common decision limits specified in clinical guidelines across all methods and uniform interpretation of re-sults. An example of a current IFCC standard-ization project involving harmonization is that for thyroid function tests with the Committee on the Standardization of Thyroid Function Tests led by Linda Thienpont using a step-up harmonization approach. Other up-to-date information about measurands in need of harmonization is available online at: http://www.harmonization.net, together with a toolkit with information about harmonization protocols.
What is the role of the IVD industry in harmonization?
The In Vitro Diagnostics (IVD) industry is ex-pected to provide traceability information in-dicating that their routine assays are traceable to reference materials and/or reference meth-ods. However, traceability does not necessar-ily ensure comparability of patient test results. Rather, both harmonization and metrological traceability of assays are required to provide test results that are clinically equivalent be-tween different manufacturers’ analytical sys-tems (5). In their paper on the role of the IVD industry in the harmonization of clinical labora-tory test results, Dave Armbruster and James Donnelly describe here the six “pillars” that are needed to achieve traceability and harmoniza-tion (17). These are: 1) reference measurement procedures; 2) reference materials; 3) refer-ence measurement laboratories; 4) universal reference intervals; 5) EQA programs using commutable samples with reference method target values to allow accuracy-based grading of manufacturers’ assays; and 6) harmonized basic terminology and units.
As both authors state, the new challenge for the IVD industry is to work with the many
professional organizations and each other to at-tain harmonization, and still retain viable busi-nesses. In their view industry support can be best achieved when harmonization initiatives are coordinated and prioritized. Major factors to be considered are:
1. Competing project priorities for companies;
2. Requirements by regulatory agencies for re-registration and associated additional costs and other manufacturing issues;
3. Need for cooperation between companies through contributing to the prioritization of projects, design of experiment, etc.;
4. Device manufacturer’s typically register products with the US FDA using a predicate device to demonstrate product acceptance. In such cases proof of substantial equiva-lence is essential to demonstrate the assay is safe and effective. Ideally companies want to compare their assay with a traceable ref-erence assay that is listed on the JCTLM website (Joint Committee for Traceability in Laboratory Medicine);
5. Does a harmonization effort add value to patient care? The cost of harmonization which includes physician education, patient safety and investment in product redevel-opment needs to be assessed against the clinical benefit of harmonization.
How do we derive harmonized Reference Intervals?
In the post-analytical phase laboratory test re-sults are compared to reference intervals (RIs) or decision limits depending on the analyte measured. However, where the same values are interpreted differently due to differences in RIs or decision limits this may lead to inap-propriate over- or under-investigation or treat-ment of the patient. The use of harmonized or common RI across different platforms and/
eJIFCC2016Vol27No1pp005-014Page 12
Jillian R. Tate, Gary L. MyersHarmonization of clinical laboratory test results
or assays aims to give the same interpretation irrespective of the pathology provider or the method, provided the same unit and termi-nology are used. Harmonization of RIs occurs optimally for those analytes where there is sound calibration and traceability in place and evidence from between-method comparisons shows that bias would not prevent the use of a common RI.
Jill Tate, Gus Koerbin and Khosrow Adeli pro-vide an opinion in this issue on how to derive harmonized reference intervals (18). A pre-determined checklist approach to acquiring the evidence for common RIs provides an ob-jective means of developing and assessing the strength of the evidence. The selection of the RI will depend on various sources of informa-tion including local formal RI studies, published studies from the literature, laboratory surveys, manufacturer’s product information, relevant guidelines, and mining of databases.
Several countries and regions including the Nordic countries, United Kingdom, Japan, Turkey, and Australasia are using common RIs that have been determined either by direct studies or by a consensus process. In Canada the Canadian Society of Clinical Chemists Taskforce is assessing the feasibility of estab-lishing common reference values using data from the formal reference interval studies of CALIPER (Canadian Laboratory Initiative on Pediatric Reference Intervals) and CHMS (The Canadian Health Measures Survey) as the ba-sis. Development of platform-specific common reference values for each of the major analyti-cal systems may be a more practical approach especially for the majority of analytes that are not standardized against a primary reference method and are not traceable to a primary or secondary reference material.
The authors encourage laboratories to consider adopting reference intervals consistent with those
used by other laboratories in your region where it is possible and appropriate for your local popu-lation. Validation of reference intervals by local laboratories is central to the adoption of com-mon RIs nationally as is validation of flagging rates to ensure the expected number of results outside the RI is acceptable.
How do we manage critical risk results?
Que Lam, Eva Ajzner, Craig Campbell and Andrew Young write in this issue about the current situation and existing practices for the management of critical risk results (19). They describe the need for more evidence from outcomes studies of critical risk results management to support laboratory practices and the need for harmonized terminology. New harmonized terminology has recently been proposed, e.g. “high-risk results”, re-sults requiring immediate medical attention and action, and “significant-risk results”, re-sults which signify a risk to patient well-being and require follow-up action within a clinically justified time limit (20). The authors discuss the recently released Clinical and Laboratory Standards Institute (CLSI) guideline CLSI GP47-Ed1 for the management of laboratory test re-sults that indicate risk for patient safety (21), as well as presenting the Australasian recom-mendations. In order to promote best labo-ratory practice, Lam et al. recommend that laboratories consider risk assessment when compiling alert tables and involve laboratory users when setting up protocols. They state: “Harmonization in this area cannot simply be a matter of shared definitions and procedures, but must involve the determination and im-plementation of best practice. The challenge is to define best practice and to obtain the evi-dence required to support this”.
eJIFCC2016Vol27No1pp005-014Page 13
Jillian R. Tate, Gary L. MyersHarmonization of clinical laboratory test results
CONCLUSIONS
It is obvious that harmonization does not happen overnight but is a long term consen-sus process that ideally is based on hard evi-dence that has been systematically compiled and has involved close interaction between the laboratory and the clinician to ensure suc-cessful implementation. It must be a shared responsibility of all stakeholders interested in patient care. Harmonization aims to add value to Laboratory Medicine measurements and their interpretation. Harmonized test results will ensure that clinical guidelines that call for the use of laboratory tests can be universally implemented. Harmonization still allows for innovation through discus-sion and the input of new ideas. It should extend beyond clinical chemistry across to all other pathology and Laboratory Medicine disciplines as the problems are not unique to chemistry.
REFERENCES
1. Tate JR, Johnson R, Barth J, Panteghini M. Harmoniza-tion of laboratory testing – Current achievements and future strategies. Clin Chim Acta 2014;432:4-7.
2. Plebani M. Harmonization of clinical laboratory information – current and future strategies. eJIFCC 2016;27:15-22.
3. Plebani M. Harmonization in laboratory medicine: the complete picture. Clin Chem Lab Med 2013;51:741-51.
4. Berg JD, Lane V. Pathology Harmony: a pragmatic ap-proach to unfounded variation in the clinical laboratory. Ann Clin Biochem 2011;48:195-7.
5. Miller WG, Myers GL, Gantzer ML, Kahn SE, Schön-brunner ER, Thienpont LM, Bunk DM, Christenson RH, Eckfeldt JH, Lo SF, Nübling CM, Sturgeon CM. Roadmap for harmonization of clinical laboratory measurement procedures. Clin Chem 2011;57:1108-17.
6. Aarsand AK, Sandberg S. How to achieve harmonisa-tion of laboratory testing – The complete picture. Clin Chim Acta 2014;432:8-14.
7. Plebani M, Panteghini. Promoting clinical and labo-ratory interaction by harmonization. Clin Chim Acta 2014;432:15-21.
8. Beastall GH. Adding value to laboratory medicine: a professional responsibility. Clin Chem Lab Med 2013; 51:221-7.
9. Ceriotti F. Harmonization initiatives in Europe. eJIFCC 2016;27:23-29.
10. Simundic AM, Cornes M, Grankvist K, Lippi G, Nybo M. Standardization of collection requirements for fast-ing samples: for the Working Group on Preanalytical Phase (WG-PA) of the European Federation of Clinical Chemistry and Laboratory Medicine (EFLM). Clin Chim Acta 2014;432:33-7
11. Simundic AM, Cornes M, Grankvist K, Lippi G, Nybo M, Kovalevskaya S, Sprongl L, Sumarac Z, Church S. Survey of national guidelines, education and training on phlebotomy in 28 European countries: an original report by the European Federation of Clinical Chemis-try and Laboratory Medicine (EFLM) working group for the preanalytical phase (WG-PA). Clin Chem Lab Med 2013;51:1585-93.
12. Lippi G, Banfi G, Church S, Cornes M, De Carli G, Grankvista K, Kristensena GB, Ibarza M, Panteghini M, Plebani M, Nyboa M, Smellie S, Zaninotto M, Simundic A-M, on behalf of the European Federation for Clinical Chemistry and Laboratory Medicine Working Group for Preanalytical Phase. Preanalytical quality improvement. In pursuit of harmony, on behalf of European Federation for Clinical Chemistry and Laboratory Medicine (EFLM) Working group for Preanalytical Phase (WG-PRE). Clin Chem Lab Med 2015;53:357-70.
13. Simundic AM, Cornes MP, Grankvist K, Lippi G, Nybo M, Ceriotti F, Theodorsson E, Panteghini M, on behalf of the European Federation for Clinical Chemistry and Laboratory Medicine (EFLM). Colour coding for blood collection tube closures - a call for harmonisation. Clin Chem Lab Med 2015;53:371-6.
14. ISO 17511:2003. In vitro diagnostic medical devices - Measurement of quantities in biological samples - Met-rological traceability of values assigned to calibrators and control materials. ISO, Geneva, Switzerland.
15. ISO 18153: 2003. In vitro diagnostic medical devices – Measurement of quantities in biological samples – metrological traceability of values for catalytic concen-tration of enzymes assigned to calibrators and control materials.
16. Myers GL, Miller WG. The International Consortium for Harmonization of Clinical Laboratory Results (ICHCLR) – A pathway for harmonization. eJIFCC 2016;27:30-36.
17. Armbruster D, Donnelly J. Harmonization of clini-cal laboratory test results: The role of the IVD Industry. eJIFCC 2016;27:37-47.

eJIFCC2016Vol27No1pp005-014Page 14
Jillian R. Tate, Gary L. MyersHarmonization of clinical laboratory test results
18. Tate JR, Koerbin G, Adeli K. Deriving harmonised reference intervals – global activities. eJIFCC 2016; 27:48-65.
19. Lam Q, Ajzner E, Campbell CA, Young A. Critical risk re-sults - an update on international initiatives. eJIFCC 2016; 27:66-76.
20. White GH, Campbell CA, Horvath AR. Is this a critical, panic, alarm, urgent, or markedly abnormal result? Clin Chem 2014;60:1569-81.
21. CLSI. GP47-Ed1: Management of critical- and signifi-cant-risk results, 1st Edition. Young A. Clinical and Labo-ratory Standards Institute; 2015.
eJIFCC2016Vol27No1pp015-022Page 15
In this issue: Harmonization of Clinical Laboratory Test Results
Harmonization of clinical laboratory information – current and future strategiesMario PlebaniDepartment of Laboratory Medicine, University Hospital of Padova, Padova, Italy
A R T I C L E I N F O A B S T R A C T
According to a patient-centered viewpoint, the me-aning of harmonization in the context of laboratory medicine is that the information should be compa-rable irrespective of the measurement procedu-re used and where and/or when a measurement is made. Harmonization represents a fundamental as-pect of quality in laboratory medicine as its ultimate goal is to improve patient outcomes through the provision of an accurate and actionable laboratory information. Although the initial focus has to a large extent been to harmonize and standardize analytical processes and methods, the scope of harmonization goes beyond to include all other aspects of the total testing process (TTP), such as terminology and units, report formats, reference intervals and decision lim-its, as well as tests and test profiles request and cri-teria for interpretation. Two major progresses have been made in the area of harmonization in laboratory medicine: first, the awareness that harmonization should take into consideration not only the analyti-cal phase but all steps of the TTP, thus dealing with the request, the sample, the measurement, and the report. Second, as the processes required to achieve harmonization are complicated, a systematic approa-ch is needed. The International Federation of Clinical
Corresponding author:Prof. Mario PlebaniDipartimento Strutturale Medicina di LaboratorioAzienda Ospedaliera Università di PadovaVia Giustiniani, 2 35128 Padova, ItalyPhone: 0498212792E-mail: [email protected]
Key words:harmonization, standardization, traceability, interchangeability, quality, patient safety, quality indicators, total testing process
eJIFCC2016Vol27No1pp015-022Page 16
Mario PlebaniHarmonization of clinical laboratory information – current and future strategies
Chemistry and Laboratory Medicine (IFCC) has played a fundamental and successful role in the development of standardized and harmonized assays, and now it should continue to work in the field through the collaboration and coope-ration with many other stakeholders.
INTRODUCTION
Patients, clinicians and other healthcare pro-fessionals assume that clinical laboratory tests performed by different laboratories at different times on the same sample and specimen can be compared and that results can be reliably and consistently interpreted (1). Unfortunately, these assumptions are not always justified be-cause many laboratory test results are still hi-ghly variable, poorly standardized and harmo-nized. Harmonization represents a fundamental aspect of quality in laboratory medicine as its ultimate goal is to improve patient outcomes through the provision of an accurate and ac-tionable laboratory information (2). Although the initial focus has to a large extent been to harmonize and standardize analytical processes and methods, the scope of harmonization goes beyond to include all other aspects of the total testing process (TTP), such as terminology and units, report formats, reference intervals and decision limits, as well as tests and test profiles request and criteria for interpretation (3, 4).
Major reasons to focus on a global picture of harmonization are represented by: a) the na-ture of errors in laboratory medicine and the ev-idence of the high rates of errors in the pre-and post-analytical phases (5, 6), b) the evidence of large variations in terminology, units and refer-ence ranges (7), c) the increasing demand for improving appropriateness in test request and result interpretation (8), and, finally, d) the risks for patient safety related to previous issues (9).
HARMONIZATION: CURRENT PROJECTS
As recently highlighted by Tate and Coll ”clinical laboratory testing is now a global activity, and laboratories no longer work in isolation” (10). Therefore, there is an increasing awareness of the importance and urgency to achieve harmo-nization in all steps of the total testing process (TTP) for ensuring comparability and inter-changeability of laboratory information.
Harmonizing the pre-analytical phase
Several initiatives and projects are in progress for harmonizing both the pre-pre-analytical as well as the pre-analytical processes. In the initial steps of the cycle, the issue of demand management which focuses on ensuring ap-propriate requesting is receiving an increasing importance. A step forward in this area has been achieved through the acceptance of the definition of “inappropriate test demand” that appears to be “a request that is made outside some form of agreed guidance” (11). The type of guidance may vary from national and inter-national guidelines to locally agreed behaviours but the basic concept is the application of sci-entific evidence rather than anecdote to clini-cal practice (8). Among the several progress, a special attention should be deserved to the National Minimum Retesting Interval Project promoted by the Clinical Practice Section of the Association for Clinical Biochemistry (ACB) in the UK uses a “state of the art” approach to set consensus/evidence based recommendations on when a test should be repeated. (12).
The importance to standardize patient prepara-tion and sample collection requirements to min-imize the uncertainty from the pre-analytical phase has already activated efforts to provide better evidence and recommendations. (13, 14). Further work to optimize sample transpor-tation procedures as well as the identification of indicators for their monitoring has been done,
eJIFCC2016Vol27No1pp015-022Page 17
Mario PlebaniHarmonization of clinical laboratory information – current and future strategies
and this is a premise for future harmonization initiatives in this field (15-17). In addition, the harmonization of procedures for evaluating the quality of biological samples, the criteria for their acceptance and rejection even through the use of automated workstations and serum indexes has been largely reported and promot-ed (18-21).
Harmonizing analytical results
Although the terms “standardization” and “har-monization” define two distinct, albeit closely linked, concepts in laboratory medicine, the final goal is the same: the equivalence of measure-ment results among different routine measure-ment procedures over time and space according to defined analytical and clinical quality specifi-cations (22).
While standardization, which allows the es-tablishment of metrological traceability to the System of Units (SI), represents the recom-mended approach, for a multitude of measur-ands the SI does not yet apply, in particular when the components in the measurand comprise a heterogeneous mixture. Over the past two decades, several clinical laboratory tests have been standardized through the development of reference measurement procedures, the IFCC playing a major role in this project. In particu-lar, the standardization of glycated haemoglo-bin contributed to significant improvements in diabetes (23). Other important projects are in progress in order to standardize measurands of high clinical value such as cardiac troponin (24) and carbohydrate-deficient transferrin (25). However, as a matter of fact, for a huge num-ber of measurands neither a reference method nor reference material are available (26). For all these measurands, harmonization of available methods and diagnostic systems should be pro-moted. In the last few years, significant progress has been done establishing an overarching con-trol system of the harmonization process in all
its aspects through improvements in: a) defining the quality and quantity of human samples to be used for standardization and harmonization studies (27, 28), b) identifying new and more robust mathematical models and statistical treatments of the data (29, 30). A major lesson we learnt, is that standardization and harmo-nization should not be applied only to clinical chemistry measurands, but to the whole field of laboratory medicine, including molecular diag-nostics (31). It should be highlighted that one of the most impressive and effective examples of harmonization in laboratory medicine is the ex-pression of prothrombin results as international normalized ratio (INR). PT results are corrected mathematically into INR by raising the PT-ratio to a power equal to the international sensitivity index (ISI) thus harmonizing results stemming from different thromboplastins from patients on treatment with vitamin K antagonists (32). Therefore, the debate on harmonization should not be limited to clinical chemistry scientists but should involve all fields of laboratory medicine to provide comparability and interchangeability of all tests usually performed in clinical labora-tories, including “omics”.
Under the patient-centered viewpoint, the sup-posed diatribe between standardization and harmonization should concentrate on more joint efforts to provide equivalence of measure-ment results among different routine measure-ment procedures and different clinical laborato-ries over time and space.
Harmonizing the post-analytical phase
Several issues in the post-analytical phase are in-creasingly acknowledged as fundamental steps for achieving higher harmonization and effec-tiveness of laboratory information.
Current evidence collected in the UK and in Australia demonstrates a significant variation in the units used for some tests and even more
eJIFCC2016Vol27No1pp015-022Page 18
Mario PlebaniHarmonization of clinical laboratory information – current and future strategies
widespread variation in the way they are repre-sented on screens and paper, as well as the way they appear in electronic messages (33). This, in turn, creates a potential for misinterpretation of laboratory results and risk for patient safety (7). As test results are increasingly transferred electronically, the argument for adopting a sin-gle standardized set of units needs immediate uptake (34).
Reference intervals are the most widely used decision-making tool in laboratory medicine and serve as the basis for many of the interpre-tations of laboratory results. Numerous stud-ies have shown large variation of reference in-tervals, even when laboratories use the same assay thus contributing to different clinical in-terpretation, risk for patients and unnecessary test repetition (35, 36). The importance of ob-taining reference intervals traceable to referent measurement systems has been reported (37) and evidence-based approaches to harmonize reference intervals have been promoted (38). The Nordic Reference Interval Project (NORIP) was one of the earliest reference interval
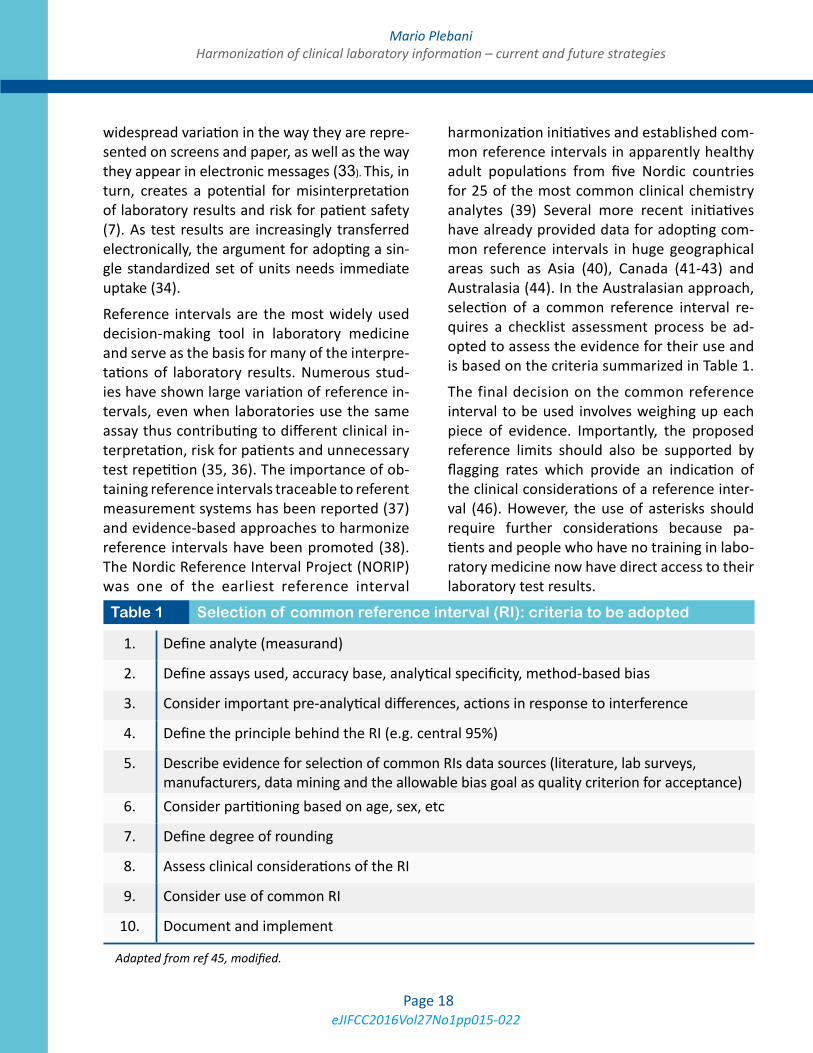
harmonization initiatives and established com-mon reference intervals in apparently healthy adult populations from five Nordic countries for 25 of the most common clinical chemistry analytes (39) Several more recent initiatives have already provided data for adopting com-mon reference intervals in huge geographical areas such as Asia (40), Canada (41-43) and Australasia (44). In the Australasian approach, selection of a common reference interval re-quires a checklist assessment process be ad-opted to assess the evidence for their use and is based on the criteria summarized in Table 1.
The final decision on the common reference interval to be used involves weighing up each piece of evidence. Importantly, the proposed reference limits should also be supported by flagging rates which provide an indication of the clinical considerations of a reference inter-val (46). However, the use of asterisks should require further considerations because pa-tients and people who have no training in labo-ratory medicine now have direct access to their laboratory test results.
1. Define analyte (measurand)
2. Define assays used, accuracy base, analytical specificity, method-based bias
3. Consider important pre-analytical differences, actions in response to interference
4. Define the principle behind the RI (e.g. central 95%)
5. Describe evidence for selection of common RIs data sources (literature, lab surveys, manufacturers, data mining and the allowable bias goal as quality criterion for acceptance)
6. Consider partitioning based on age, sex, etc
7. Define degree of rounding
8. Assess clinical considerations of the RI
9. Consider use of common RI
10. Document and implement
Adapted from ref 45, modified.
Table 1 Selection of common reference interval (RI): criteria to be adopted
eJIFCC2016Vol27No1pp015-022Page 19
Mario PlebaniHarmonization of clinical laboratory information – current and future strategies
Various practices, a number of different termi-nologies and extremely different values have been described in the literature affecting the quality of critical results management. Large variability in critical results practices have been reported not only when comparing different geographical areas but even in the same coun-try (47). Very recently, a study on the outcomes of critical values notification, demonstrated that in more than 40.0% of cases, they were un-expected findings, and that notification led to a change of treatment in 98.0% of patients admit-ted to surgical and in 90.6% of those admitted to medical wards, thus confirming their impor-tance for an effective clinical decision-making (48). Several initiatives and recommendations on the harmonization of critical result manage-ment have been released (49-52) and, finally, a better awareness of the importance of this is-sue for improving the quality of laboratory ser-vices and patient safety has been achieved.
Quality indicators
The definition, implementation and monitoring of valuable analytical quality specifications have played a fundamental role in improving the qual-ity of laboratory services and reducing the rates of analytical errors. However, a body of evidence has been accumulated on the relevance of the extra-analytical phases, namely the pre-analyt-ical steps, their vulnerability and impact on the overall quality of the laboratory information. The identification and establishment of valuable quality indicators (QIs) represents a promis-ing strategy for collecting data on quality in the total testing process (TTP) and, particularly, for detecting any mistakes made in the individual steps of the TTP, thus providing useful informa-tion for quality improvement projects (53). In addition, QIs represent a fundamental require-ment for the accreditation of clinical laborato-ries according to the International Standard ISO 15189 (54). While some interesting programs
on indicators in the TTP have been developed in some countries, there was no consensus for the production of joint recommendations focu-sing on the adoption of universal QIs and com-mon terminology in the total testing process. A preliminary agreement has been achieved in a Consensus Conference organized in Padua in 2013, after revising the model of quality indi-cators (MQI) developed by the Working Group on “Laboratory Errors and Patient Safety” of the International Federation of Clinical Chemistry and Laboratory Medicine (IFCC). The consen-sually accepted list of QIs, which takes into consideration both their importance and appli-cability, could be actually tested by all poten-tially interested clinical laboratories to identify further steps in the harmonization project (55). Preliminary performance criteria based on data collected have been proposed to allow a ben-chmark between different laboratories and to support improvement initiatives (56).
FUTURE STRATEGIES
Although standardization and harmonization in laboratory medicine have been recognized as essential requirements for improving quali-ty and value for patients for a long time, some major barriers have affected the success of such projects. In fact, the processes required to achieve harmonization are complicated, costly, and time consuming: a systematic approach, therefore, is needed. This should be based on an infrastructure with “well-defined procedu-res, transparent operations, effective commu-nication with all stakeholders, and a consensus approach to cooperation” (57). This systema-tic approach and roadmap represent essential steps for more successful harmonization initiati-ves. The increasing demand for standardization and harmonization in laboratory medicine re-quires incremental progress in addressing these issues through the cooperation between many stakeholders: laboratory professionals and their
eJIFCC2016Vol27No1pp015-022Page 20
Mario PlebaniHarmonization of clinical laboratory information – current and future strategies
scientific societies and federations, clinicians, in vitro manufacturing industry, accreditation and regulatory bodies, and patients’ representati-ves (2). Several organizations, such as the IFCC, the European Federation of Clinical Chemistry and Laboratory Medicine (EFLM), the American Association for Clinical Chemistry (AACC), the World Health Organization, the recently formed International Consortium for Harmonization of Clinical Laboratory Results (ICHCLR) that are working in the field should cooperate and in-tegrate their efforts to avoid duplication of ini-tiatives and to provide joint programs. Other scientific organizations such as the Clinical and Laboratory Standards Institute (CLSI) and the Joint Committee for Traceability in Laboratory Medicine (JCTLM), are recognized to play a major role in providing guidelines and lists of reference materials and reference procedures. But, first and foremost, laboratory professio-nals have to better understand the urgent need to improve harmonization in everyday clinical practice and to take a proactive role in efforts to assure comparability and interchangeability of laboratory information.
CONCLUSIONS
According to a patient-centered viewpoint, the meaning of harmonization in the context of lab-oratory medicine is that the information should be comparable irrespective of the measure-ment procedure used and where and/or when a measurement is made: this represents the major driver for implementing harmonization initiatives. In recent years, further demanding drivers have increased the need for, and rele-vance of, efforts for harmonizing laboratory in-formation, first and foremost the evidence that variations in laboratory information not only cause confusion but are potentially dangerous. There is convincing evidence that errors in lab-oratory medicine affect patient outcomes and affect patient safety (6). Two major progresses
have been made in the area of harmonization in laboratory medicine: first, the awareness that harmonization should take into consideration not only the analytical phase but all steps of the TTP, thus dealing with “the request, the sample, the measurement, and the report”. Second, as the processes required to achieve harmoniza-tion are complicated, a systematic approach is needed. A further achievement is the recogni-tion of the need to also apply the concepts of harmonization and standardization in clinical research and in projects of translational medi-cine (58). The cooperation between laboratory professionals, clinicians, IVD manufacturers, ac-creditation and regulatory bodies is essential.
REFERENCES
1. Panteghini M. Implementation of standardization in clinical practice: not always an easy task. Clin Chem Lab Med 2012;50:1237-41.
2. Aarsand AK, Sandberg S. How to achieve harmonisa-tion of laboratory testing-The complete picture. Clin Chim Acta 2014;432:8-14.
3. Plebani M. Harmonization in laboratory medicine: the complete picture. Clin Chem Lab Med 2013;51:741-51.
4. Tate JR, Johnson R, Sikaris K. Harmonisation of labora-tory testing. Clin Biochem Rev 2012;33:121-2.
5. Plebani M. The detection and prevention of errors in laboratory medicine. Ann Clin Biochem 2010;47:101-10.
6. Plebani M. The CCLM contribution to improve-ments in quality and patient safety. Clin Chem Lab Med 2013;51:39-46.
7. De la Salle B. Pathology harmony moves on: prog-ress on implementation in haematology. Br J Haematol 2012;158:804-5.
8. Plebani M, Panteghini M. Promoting clinical and lab-oratory interaction by harmonization. Clin Chim Acta 2014;432:15-21.
9. Plebani M. Diagnostic errors and laboratory medicine: causes and strategies. eJIFCC 2015; 26:7-14.
10. Tate JR, Johnson R, Barth JH, Panteghini M. “Harmoni-zation of laboratory testing - A global activity”. Clin Chim Acta 2014;432:1-3.
11. Fryer AA, Smellie WS. Managing demand for laborato-ry tests: a laboratory toolkit. J Clin Pathol 2013;66:62-72.
eJIFCC2016Vol27No1pp015-022Page 21
Mario PlebaniHarmonization of clinical laboratory information – current and future strategies
12. Lang T. Laboratory demand management of repetitive testing--time for harmonisation and an evidenced based approach. Clin Chem Lab Med 2013;51:1139-40.
13. Simundic AM, Cornes M, Grankvist K, Lippi G, Nybo M. Standardization of collection requirements for fasting samples: for the Working Group on Preanalytical Phase (WG-PA) of the European Federation of Clinical Chem-istry and Laboratory Medicine (EFLM). Clin Chim Acta 2014;432:33-7.
14. Simundic AM, Cornes M, Grankvist K, Lippi G, Nybo M, Kovalevskaya S. Survey of national guidelines, educa-tion and training on phlebotomy in 28 European coun-tries: an original report by the European Federation of Clinical Chemistry and Laboratory Medicine (EFLM) work-ing group for the preanalytical phase (WG-PA). Clin Chem Lab Med 2013;51:1585-93.
15. Zaninotto M, Tasinato A, Padoan A, Pinato A, Scia-covelli L, Plebani M. An integrated system for monitor-ing the quality of sample transportation. Clin Biochem 2012;45:688-90.
16. Zaninotto M, Tasinato A, Padoan A, Vecchiato G, Pi-nato A, Sciacovelli L, Plebani M. Effects of sample trans-portation on commonly requested laboratory tests. Clin Chem Lab Med 2012;50:1755-60.
17. Sciacovelli L, O’Kane M, Skaik YA, Caciagli P, Pellegrini C, Da Rin G, et al.; IFCC WG-LEPS. Quality Indicators in Laboratory Medicine: from theory to practice. Prelimi-nary data from the IFCC Working Group Project “Labo-ratory Errors and Patient Safety”. Clin Chem Lab Med 2011;49:835-44.
18. Simundic AM, Nikolac N, Vukasovic I, Vrkic N. The prevalence of preanalytical errors in a Croatian ISO 15189 accredited laboratory. Clin Chem Lab Med 2010;48:1009-14.
19. Lippi G, Plebani M, Di Somma S, Cervellin G. Hemo-lyzed specimens: a major challenge for emergency de-partments and clinical laboratories. Crit Rev Clin Lab Sci 2011;48:143-53.
20. Lippi G, Becan-McBride K, Behúlová D, Bowen RA, Church S, Delanghe J. Preanalytical quality improvement: in quality we trust. Clin Chem Lab Med 2013;51:229-41.
21. Boyd JM, Krause R, Waite G, Hui W, Yazdi E, Seiden-Long I. Developing optimized automated rule sets for re-porting hemolysis, icterus and lipemia based on a priori outcomes analysis. Clin Chim Acta 2015;450:31-38.
22. Miller WG, Eckfeldt JH, Passarelli J, Rosner W, Young IS. Harmonization of test results: what are the challenges; how can we make it better? Clin Chem 2014;60:923-7.
23. Braga F, Panteghini M. Standardization and analytical goals for glycated hemoglobin measurement. Clin Chem Lab Med. 2013 Sep;51(9):1719-26
24. Tate JR, Bunk DM, Christenson RH, Barth JH, Katrukha A, Noble JE, et al.; IFCC Working Group on Standardiza-tion of Cardiac Troponin I. Evaluation of standardization capability of current cardiac troponin I assays by a cor-relation study: results of an IFCC pilot project. Clin Chem Lab Med 2015;53:677-90.
25. Weykamp C, Wielders J, Helander A, Anton RF, Bianchi V, Jeppsson JO, et al.; IFCC Working Group on Standard-ization of Carbohydrate-Deficient Transferrin. Harmoni-zation of measurement results of the alcohol biomarker carbohydrate-deficient transferrin by use of the toolbox of technical procedures of the International Consortium for Harmonization of Clinical Laboratory Results. Clin Chem 2014;60:945-53.
26. Greenberg N. Update on current concepts and mean-ings in laboratory medicine --Standardization, traceability and harmonization. Clin Chim Acta 2014;432:49-54.
27. Van Houcke SK, Thienpont LM. “Good samples make good assays” – the problem of sourcing clinical sam-ples for a standardization project. Clin Chem Lab Med 2013;51:967-72.
28. Miller WG, Myers GL. Commutability still matters. Clin Chem 2013;59:1291–3.
29. Stöckl D, Van Uytfanghe K, Van Aelst S, Thienpont LM. A statistical basis for harmonization of thyroid stimulating hormone immunoassays using a robust factor analysis model. Clin Chem Lab Med 2014;52:965-72.
30. Clerico A, Ripoli A, Zucchelli GC, Plebani M. Harmo-nization protocols for thyroid stimulating hormone (TSH) immunoassays: different approaches based on the con-sensus mean value. Clin Chem Lab Med 2015;53:377-82.
31. Holden MJ, Madej RM, Minor P, Kalman LV. Molecular diagnostics: harmonization through reference materials, documentary standards and proficiency testing. Expert Rev Mol Diagn 2011;11:741-55.
32. Tripodi A, Lippi G, Plebani M. How to report results of prothrombin and activated partial thromboplastin times. Clin Chem Lab Med 2015 (in press).
33. Legg M, Swanepoel C. The Australian Pathology Units and Terminology standardization project - an overview. Clin Biochem Rev 2012;33:103-8.
34. Miller WG, Tate JR, Barth JH, Jones GR. Harmoniza-tion: the sample, the measurement, and the report. Ann Lab Med 2014;34:187-97.
35. Zardo L, Secchiero S, Sciacovelli L, Bonvicini P, Plebani M. Reference intervals: are interlaboratory differences appropriate? Clin Chem Lab Med 1999;37:1131-3.
36. Jones GR, Barker A, Tate J, Lim CF, Robertson K. The case for common reference intervals. Clin Biochem Rev 2004;25:99-104.
eJIFCC2016Vol27No1pp015-022Page 22
Mario PlebaniHarmonization of clinical laboratory information – current and future strategies
37. Panteghini M, Ceriotti F. Obtaining reference intervals traceable to reference measurement systems: is it pos-sible, who is responsible, what is the strategy? Clin Chem Lab Med 2011;50:813-7.
38. Koerbin G, Sikaris KA, Jones GR, Ryan J, Reed M, Tate J; AACB Committee for Common Reference Intervals. Evidence-based approach to harmonised reference inter-vals. Clin Chim Acta 2014;432:99-107.
39. Rustad P, Felding P, Franzson L, et al. The Nordic Ref-erence Interval Project 2000: recommended reference intervals for 25 common biochemical properties. Scand J Clin Lab Invest 2004;64:271-84.
40. Ichihara K, Ceriotti F, Tam TH, Sueyoshi S, Poon PM, Thong ML, et al. Committee on Reference Intervals and Decision Limits, International Federation for Clini-cal Chemistry and Laboratory Medicine, and the Sci-ence Committee for the Asia-Pacific Federation of Clini-cal Biochemistry. The Asian project for collaborative derivation of reference intervals: (1) strategy and major results of standardized analytes. Clin Chem Lab Med 2013;51:1429-42.
41. Adeli K, Higgins V, Nieuwesteeg M, Raizman JE, Chen Y, Wong SL, Blais D. Biochemical Marker Reference Values across Pediatric, Adult, and Geriatric Ages: Establishment of Robust Pediatric and Adult Reference Intervals on the Basis of the Canadian Health Measures Survey. Clin Chem 2015;61:1049-62.
42. Adeli K, Raizman JE, Chen Y, Higgins V, Nieuwesteeg M, Abdelhaleem M, et al. Complex Biological Profile of Hematologic Markers across Pediatric, Adult, and Geri-atric Ages: Establishment of Robust Pediatric and Adult Reference Intervals on the Basis of the Canadian Health Measures Survey. Clin Chem 2015;61:1075-86.
43. Adeli K, Higgins V, Nieuwesteeg M, Raizman JE, Chen Y, Wong SL. Complex Reference Values for Endocrine and Special Chemistry Biomarkers across Pediatric, Adult, and Geriatric Ages: Establishment of Robust Pediatric and Adult Reference Intervals on the Basis of the Canadian Health Measures Survey. Clin Chem 2015;61:1063-74.
44. Tate JR, Sikaris KA, Jones GR, Yen T, Koerbin G, Ryan J, et al. Harmonising adult and paediatric reference inter-vals in Australia and New Zealand: an evidence-based ap-proach for establishing a first panel of chemistry analytes. Clin Biochem Rev 2014;35:213-35.
45. Jones GD, Barker T. Reference intervals. Clin Biochem Rev 2008;29 Suppl:S93-7.
46. Horowitz GL. The power of asterisks. Clin Chem 2015;61:1009-11.
47. Piva E, Plebani M. From “panic” to “critical” values: which path toward harmonization? Clin Chem Lab Med 2013;51:2069-71.
48. Piva E, Pelloso M, Pennello L, Plebani M Labora-tory critical values: automated notification supports effective clinical decision making. Clin Biochem 2014 Sep;47:1163-8.
49. Piva E, Plebani M. From “panic” to “critical” values: which path toward harmonization? Clin Chem Lab Med 2013;51:2069-71.
50. Campbell CA, Horvath AR. Harmonization of critical result management in laboratory medicine. Clin Chim Acta 2014;432:135-47.
51. Campbell C, Horvath A. Towards harmonisation of critical laboratory result management - review of the literature and survey of Australasian practices. Clin Bio-chem Rev 2012;33:149-60.
52. White GH, Campbell CA, Horvath AR. Is this a critical, panic, alarm, urgent, or markedly abnormal result? Clin Chem 2014;60:1569-70.
53. Plebani M, Sciacovelli L, Aita A, Pelloso M, Chiozza ML. Performance criteria and quality indicators for the pre-analytical phase. Clin Chem Lab Med 2015;53:943-8.
54. ISO 15189:2012. Medical laboratories – requirements for quality and competence. Geneva, Switzerland: Inter-national Organization for Standardization, 2012.
55. Plebani M, Astion ML, Barth JH, Chen W, de Oliveira Galoro CA, Escuer MI, Harmonization of quality indicators in laboratory medicine. A preliminary consensus. Clin Chem Lab Med 2014;52:951-8.
56. Plebani M, Sciacovelli L, Aita A, Pelloso M, Chiozza ML. Performance criteria and quality indicators for the pre-analytical phase. Clin Chem Lab Med 2015;53:943-8.
57. Miller WG, Myers GL, Gantzer ML, Kahn SE, Schönb-runner ER, Thienpont LM, et al. Roadmap for harmoniza-tion of clinical laboratory measurement procedures. Clin Chem 2011;57:1108-17.
58. van der Burg SH, Kalos M, Gouttefangeas C, Janetzki S, Ottensmeier C, Welters MJ, et al. Harmonization of im-mune biomarker assays for clinical studies. Sci Transl Med 2011;3:108 ps44.
eJIFCC2016Vol27No1pp023-029Page 23
In this issue: Harmonization of Clinical Laboratory Test Results
Harmonization initiatives in EuropeFerruccio Ceriotti1, 2
1 Laboratory Medicine Service, San Raffaele Hospital, Milano, Italy2 Chair, EFLM WG-H (Working Group on Harmonisation of total testing process)
A R T I C L E I N F O A B S T R A C T
Introduction: Modern medicine is more and more based on protocols and guidelines; clinical laboratory data play very often a relevant role in these docu-ments and for this reason the need for their harmo-nization is increasing. To achieve harmonized results the harmonization process must not be limited to only the analytical part, but has to include the pre- and the post-analytical phases.
Results: To fulfill this need the European Federation of Clinical Chemistry and Laboratory Medicine (EFLM) has started several initiatives. A Working Group on harmonization of the total testing process (WG-H) has been created with the aims of: 1) surveying and sum-marizing national European and pan European har-monization initiatives; 2) promoting and coordinating the dissemination of especially promising harmoni-zation initiatives among the EFLM member societ-ies; and 3) taking initiatives to harmonize nomen-clature, units and reference intervals at a European level. The activity of the WG started this year with a questionnaire targeted at surveying the status of various harmonization activities, especially those in the pre- and post-analytical phase categories, among the European laboratory medicine societies.
Corresponding author:Ferruccio CeriottiLaboratory Medicine Service San Raffaele HospitalVia Olgettina 6020132 Milano, ItalyPhone: +39 02 26432282Fax: +39 02 26432640E-mail: [email protected]
Key words:harmonization, total testing process
eJIFCC2016Vol27No1pp023-029Page 24
Ferruccio CeriottiHarmonization initiatives in Europe
Conclusions: Based on the results of the ques-tionnaire, some activities promoting the dissemi-nation of best practice in blood sampling, sample storage and transportation, in collaboration with WG on the pre-analytical phase, will be promot-ed, and initiatives to spread to all the European countries the use of SI units in reporting, will be undertaken. Moreover, EFLM has created a Task and Finish Group on standardization of the color coding for blood collection tube closures that is actively working to accomplish this difficult task through collaboration with manufacturers.
INTRODUCTION
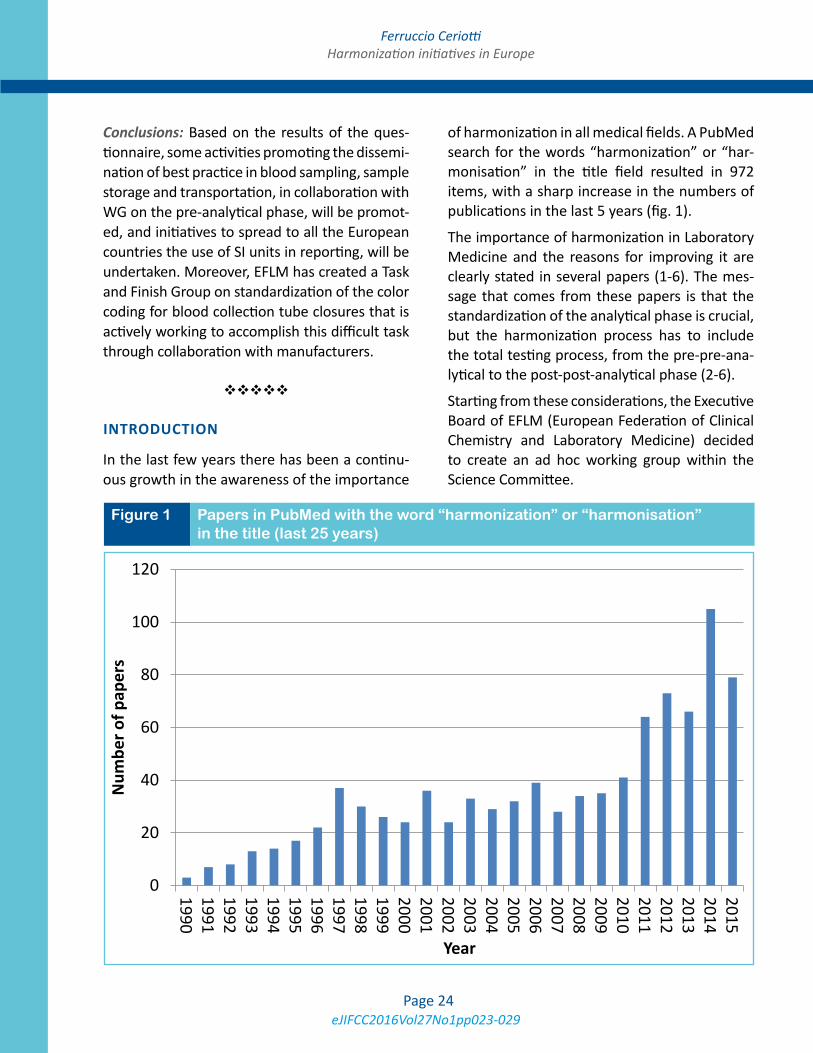
In the last few years there has been a continu-ous growth in the awareness of the importance
of harmonization in all medical fields. A PubMed search for the words “harmonization” or “har-monisation” in the title field resulted in 972 items, with a sharp increase in the numbers of publications in the last 5 years (fig. 1).
The importance of harmonization in Laboratory Medicine and the reasons for improving it are clearly stated in several papers (1-6). The mes-sage that comes from these papers is that the standardization of the analytical phase is crucial, but the harmonization process has to include the total testing process, from the pre-pre-ana-lytical to the post-post-analytical phase (2-6).
Starting from these considerations, the Executive Board of EFLM (European Federation of Clinical Chemistry and Laboratory Medicine) decided to create an ad hoc working group within the Science Committee.
Figure 1 Papers in PubMed with the word “harmonization” or “harmonisation” in the title (last 25 years)
0
20
40
60
80
100
120
1990 1991 1992 1993 1994 1995 1996 1997 1998 1999 2000 2001 2002 2003 2004 2005 2006 2007 2008 2009 2010 2011 2012 2013 2014 2015
Num
ber o
f pap
ers
Year

eJIFCC2016Vol27No1pp023-029Page 25
Ferruccio CeriottiHarmonization initiatives in Europe
The Working Group on the “Harmonisation of total testing process” (WG-H) has the following terms of reference:
• Survey and summarize national European and pan European harmonization initiatives.
• Promote and coordinate the dissemination of at least two especially promising harmo-nization initiatives among the EFLM Member Societies.
• Undertake initiatives to harmonize nomen-clature, units and reference intervals at a European level.
The plan of action for the first two years is the following:
1. WG-H will act as a collector of the harmoni-zation initiatives arising from other WGs or Task and Finish Groups of EFLM and from National Member Societies active in the field and will disseminate them to all the EFLM Member Societies to monitor their applica-tion and effects.
2. WG-H will survey and promote the use of harmonized nomenclature for measurands and promote the use of amount of substance units in the European countries.
3. WG-H will promote the implementation of common reference intervals for the measur-ands where this approach is feasible.
The European situation regarding harmoniza-tion is particularly critical essentially for two reasons: there are many different countries (the members of EFLM equal 40), each one with unique traditions, culture and legislation as well as many different languages. The first initiative taken by the WG-H was a survey aimed at iden-tifying those harmonization initiatives already in place in the different European countries and to obtain a picture of the units of measurement presently in use.
EFLM SURVEY ON HARMONIZATION OF TOTAL TESTING PROCESS
The survey aimed to collect information on the harmonization activities already carried out, or currently on-going, by the different nation-al societies of Europe. It was mainly based on the ideas presented in the references 4 and 5 and covered the 3 main phases of the clinical laboratory process: pre-analytical (8 questions), analytical (5 questions) and post-analytical (8 questions). It was distributed to the Presidents and National Representatives of the 40 EFLM Member Societies in 2 phases. In the first phase held at the end of March 2015 the complete survey consisting of 21 questions was sent out. After an evaluation of the replies received from 22 National Societies, it was decided to send a second reduced version (with only 9 of the original 21 questions) and to focus on the most relevant aspects of the pre- and post-analytical phases. This second questionnaire was sent in July 2015 only to the representatives of the 18 National Societies that did not reply in the first phase. This second phase was successful and we received 14 replies, with only 4 countries not responding, hence allowing us to draw an almost complete picture of the European situ-ation regarding the harmonization activities in the pre- and post-analytical phases.
I will present hereafter only the results relative to the 9 questions that received a reply from 36 out of 40 countries.
Questions on harmonization activities in the pre-analytical phase
1. Is it common practice in your country to use “profiles” (e.g. liver function, electrolytes, etc.) for test requesting?
2. If YES, did/does your society produce some document on harmonization of test request-ing profiles?
eJIFCC2016Vol27No1pp023-029Page 26
Ferruccio CeriottiHarmonization initiatives in Europe
The questions aimed at identifying how wide-spread the practice of requesting tests by pro-files instead of test by test was and if the so-cieties gave any indication of their intention to standardize the content of each profile (e.g. Electrolytes as only sodium, potassium and chloride or to include also bicarbonate and anion gap). Twenty countries replied that the use of profiles is common practice, but only 7 of them had undertaken test profile harmoni-zation initiatives and only 3 sent us their prac-tice documents indicating the suggested profile contents (Russia, Kazakhstan, The Netherlands); unfortunately all were in the national language and were not understandable (a translation is in progress).
3. Did/does your society, alone or in collabora-tion with clinical societies, elaborate guide-lines for diagnostic approaches to specific diseases? (e.g. myocardial infarction, coeliac disease, etc.)
Eighteen societies gave a positive reply and we re-ceived several documents. The topics addressed were the following: Autoimmune diseases, Coeliac disease, Chronic Kidney Disease (CKD), Diabetes and Gestational Diabetes, Dyslipidemia and Lipoprotein reporting, Myocardial infarction (MI), Proteinuria, Thyroid diseases and Thyroid disease in pregnancy, Tumor markers.
Several topics (diabetes, MI, CKD, tumor mark-ers) were covered by guidelines in various coun-tries; the material received was heterogeneous and, as expected, in many different languages. The WG-H has not yet been able to examine all of them in detail, but probably there is a need to promote European or international guide-lines from which each country can derive its own document. In this way all 40 countries will be able to propose a harmonized approach to the diagnosis of at least the most common diseases.
4. Did/does your society publish indications for optimal timing for test repetition or minimal retesting intervals?
Most of the replies (30) were negative with 6 positive. However, only the UK has officially published a document (7). The minimum retest-ing interval is an important element for govern-ing the appropriateness of test requesting and initiatives to expand similar documents at the European level are planned.
5. Did/Does your society produce a document on quality of the diagnostic samples or have some activity currently on this topic?
This is a very sensitive topic, especially in this pe-riod when centralization and laboratory consoli-dation is occurring throughout Europe. Twenty-two societies replied ‘No’, 14 ‘Yes’ and two of them (Spanish and German Societies) sent us very detailed documents. The EFLM working group on the pre-analytical phase (WG-PRE) is working on this matter and specific documents are in preparation.
Another important harmonization activity in the pre-analytical phase is the harmonization of blood sampling processes. Several European scientific societies have produced documents on this topic namely: Italy (8, 9), Croatia (10), Slovenia, Norway, Russia, and The Netherlands. Moreover the EFLM WG-PRE has already pre-pared a specific document (11) after conducting a survey of national guidelines, education and training in phlebotomy (12).
An important initiative for the safety of the op-erator during blood drawing is the European Directive 2010/32/EU implementing the Frame-work Agreement on prevention from sharps inju-ries in the hospital and healthcare sector concluded by HOSPEEM (European Hospital and Healthcare Employers’ Association) and EPSU (European Federation of Public Service Unions) (13). This directive has been converted in national law by each member state, but its application is not yet

eJIFCC2016Vol27No1pp023-029Page 27
Ferruccio CeriottiHarmonization initiatives in Europe
complete and the use of safety-engineered devices for blood sampling has to be fully implemented.
A comprehensive overview of harmonization activities in the pre-analytical phase was pub-lished by the EFLM WG-PRE (14).
A further harmonization initiative of EFLM is the creation of a Task and Finish Group on Standardization of the colour coding for blood collection tube closures. This group is trying to
define a road map to arrive at a uniform coloring of the tube caps produced by the different manu-facturers with the aim of reducing the possible errors when changing manufacturer or when re-ceiving tubes from different laboratories (15). All stakeholders, including all manufacturers working in the field, have been invited to join a dialogue to establish a universally acceptable colour cod-ing standard for blood collection tube closures.
NationUse of SI
unitsIntention to promote SI
NationUse of SI
unitsIntention to promote SI
1 Albania <10% NO 21 Latvia - -
2 Austria - - 22 Lithuania >80% Yes
3 Belgium 50 – 80% Yes 23 Luxembourg - -
4 Bosnia Herzegovina 100% Yes 24 Macedonia >80% Yes
5 Bulgaria 100% NO 25 Montenegro >80% Yes
6 Croatia >80% Yes 26 Norway >80% Yes
7 Cyprus <10% NO 27 Poland 50 - 80% Yes
8 Czech Republic >80% NO 28 Portugal 10 – 25% NO
9 Denmark >80% Yes 29 Romania 10 – 25% Yes
10 Estonia 50 – 80% Yes 30 Russia 100% Yes
11 Finland >80% Yes 31 Serbia 100% Yes
12 France 100% Yes 32 Slovak Republic >80% Yes
13 Germany 25 – 50% Yes 33 Slovenia 100% Yes
14 Greece <10% Yes 34 Spain <10% Yes
15 Hungary >80% NO 35 Sweden >80% Yes
16 Iceland >80% Yes 36 Switzerland >80% Yes
17 Ireland <10% Yes 37 The Netherlands >80% Yes
18 Israel <10% Yes 38 Turkey <10% Yes
19 Italy <10% Yes 39 Ukraine 100% Yes
20 Kosovo - - 40 UK >80% Yes
Table 1 Current use of SI units in Europe
eJIFCC2016Vol27No1pp023-029Page 28
Ferruccio CeriottiHarmonization initiatives in Europe
Questions on harmonization in the post-analytical phase
1. Did/does your society make documents or guidelines on use or definition of autovalida-tion rules?
Six societies replied ‘Yes’, but only Switzerland supplied a document that is now in evaluation for possible promotion at the European level.
2. Do you have any data on the diffusion of the use of SI unit (amount of substance units, e.g. mmol/L) in your country?
3. Did/does your society promote officially the use of SI units?
4. Would your society be in favour of initia-tives devoted to the introduction of SI units (mmol/L)?
The replies to these questions are summarized in Table 1 (above).
After the distribution of the survey we posed a further question on the use of katal for the ex-pression of enzyme catalytic activity. Five coun-tries replied that µkat/L is the unit used by all of the clinical laboratories in Slovenia, Slovakia, Sweden, Czech Republic and Ukraine, 22 use U/L and we received no replies from the 13 oth-er countries.
Another critical issue of the post-analytical phase that requires harmonization is the com-munication of critical values. EFLM has estab-lished a Task and Finish Group with the aim of surveying the critical result management proce-dures and policies laboratories currently have and how critical values are established and used in European laboratories.
CONCLUSIONS
There are several harmonization initiatives in place in different European countries, but these initiatives are not coordinated. The problem of the different languages precludes the possibility
of sharing easily the documents within Europe. EFLM WG-PRE has produced several docu-ments on which harmonization of several as-pects of the pre-analytical phase can be based. Implementing these on a European scale and verifying the effectiveness of their application will be the real challenge for the future. The har-monization and standardization of the analyti-cal phase is already covered at the international level by IFCC and by the American Association for Clinical Chemistry’s International Consortium on Harmonization of Clinical Laboratory Results (AACC ICHCLR) (1). EFLM is now working on the definition of quality performance specifications (16) that represent the basis for the harmoniza-tion of analytical quality.
The most problematic situation regards the post-analytical phase. The unit of measurement problem is really important. While most of the northern European countries (excluding Ireland) declare an almost total adoption of the amount of substance (mole) unit for expressing the lab-oratory results, the southern countries (Spain, Italy, Albania, Greece, Turkey, Cyprus) are still using traditional units and in some countries like Italy, clinical laboratories use up to 5 dif-ferent units for the same test (e.g. Free T3: pg/mL, ng/L, pmol/L, pg/dL and ng/dL). Moreover, many of the countries that adopted the SI units do not use katal for reporting enzymatic activity. It may be easier to ask countries that adopted katal to change back to international units rath-er than moving all the others to katal. Changing old habits is difficult, and requires coordination and collaboration; however, some countries like Albania, Cyprus and Portugal have declared that they are not in favor of any change. WG-H will promote initiatives in the southern European countries to gradually move toward a larger use of the SI units, starting with electrolytes. Finally the problem of reference intervals remains un-touched. Initiatives, similar to the Australasian one (17), are very difficult at the European level.
eJIFCC2016Vol27No1pp023-029Page 29
Ferruccio CeriottiHarmonization initiatives in Europe
There is an initiative in the UK (18) and the pre-vious studies of the Nordic Countries (19) but I do not foresee pan European initiatives in the short period except for a few specific analytes.
Most of the work has yet to be done – we are just at the beginning. Communication and col-laboration with the National Societies will be the key to achieving some progress in this field which is crucial not only for our profession but for medicine as a whole.
REFERENCES1. Miller WG, Myers GL, Gantzer ML, et al. Roadmap for harmonization of clinical laboratory measurement proce-dures. Clin Chem 2011;57:1108–17.
2. Plebani M. Harmonization in laboratory medicine: the complete picture. Clin Chem Lab Med 2013;51:741–51.
3. Tate JR, Johnson R, Barth J, Panteghini M. Harmoniza-tion of laboratory testing — A global activity. Clin Chim Acta 2014;432:1-3.
4. Tate JR, Johnson R, Barth J, Panteghini M. Harmoniza-tion of laboratory testing — current achievements and future strategies. Clin Chim Acta 2014;432:4–7.
5. Aarsand AK, Sandberg S. How to achieve harmonisa-tion of laboratory testing — the complete picture. Clin Chim Acta 2014;432:8–14.
6. Plebani M, Panteghini M. Promoting clinical and lab-oratory interaction by harmonization. Clin Chim Acta 2014;432:15–21.
7. http://www.acb.org.uk/docs/default-source/guide-lines/acb-mri-recommendations-a4-computer.pdf. Accessed October 31st 2015.
8. Lippi G, Caputo M, Banfi G, et al. Raccomandazioni per il prelievo di sangue venoso. Biochim Clin 2008;32:569-77.
9. Lippi G, Mattiuzzi C, Banfi G. Proposta di una “check-list” per il prelievo di sangue venoso. Biochim Clin 2013; 37:312-7.
10. Nikolac N, Šupak-Smolčić V, Šimundić AM, Ćelap I. Croatian Society of Medical Biochemistry and Laboratory Medicine: national recommendations for venous blood sampling. Biochemia Medica 2013;23:242-54.
11. Simundic AM, Cornes M, Grankvist K, et al. Standard-ization of collection requirements for fasting samples: for the Working Group on Preanalytical Phase (WG-PA) of the European Federation of Clinical Chemistry and Labo-ratory Medicine (EFLM). Clin Chim Acta 2014;432:33-7.
12. Simundic AM, Cornes M, Grankvist K, et al. Survey of national guidelines, education and training on phlebot-omy in 28 European countries: an original report by the European Federation of Clinical Chemistry and Labora-tory Medicine (EFLM) working group for the preanalytical phase (WG-PA). Clin Chem Lab Med 2013;51:1585-93.
13. http://eur- lex.europa.eu/legal-content/EN/TXT/?uri=CELEX:32010L0032. Accessed October 31st 2015.
14. Lippi G, Banfi G, Church S, et al. Preanalytical qual-ity improvement. In pursuit of harmony, on behalf of Eu-ropean Federation for Clinical Chemistry and Laboratory Medicine (EFLM) Working group for Preanalytical Phase (WG-PRE). Clin Chem Lab Med 2015;53:357–70.
15. Simundic AM, Cornes MP, Grankvist K, et al. Colour coding for blood collection tube closures - a call for har-monisation. Clin Chem Lab Med 2015;53:371-6.
16. Panteghini M, Sandberg S. Defining analytical perfor-mance specifications 15 years after the Stockholm con-ference. Clin Chem Lab Med. 2015;53:829-32.
17. Tate JR, Sikaris K, Jones GRD, et al. Harmonising Adult and Paediatric Reference Intervals in Australia and New Zealand: An Evidence-Based Approach for Establishing a First Panel of Chemistry Analytes. Clin Biochem Rev 2014;35:213-35.
18. http://www.pathologyharmony.co.uk/. Accessed Oc-tober 31st 2015.
19. Rustad P, Felding P, Lahti A, Hyltoft Petersen P. De-scriptive analytical data and consequences for calcula-tion of common reference intervals in the Nordic Refer-ence Interval Project 2000. Scand J Clin Lab Invest 2004; 64:343-70.
eJIFCC2016Vol27No1pp030-036Page 30
In this issue: Harmonization of Clinical Laboratory Test Results
The International Consortium for Harmonization of Clinical Laboratory Results (ICHCLR) – a pathway for harmonizationGary L. Myers1, W. Greg Miller2
1 Chair, Joint Committee for Traceability in Laboratory Medicine, Smyrna, Georgia, USA2 Professor of Pathology, Director of Clinical Chemistry, Virginia Commonwealth University Health System, Richmond, Virginia, USA
A R T I C L E I N F O A B S T R A C T
Results from clinical laboratory measurement proce-dures must be equivalent to enable effective use of clinical guidelines for disease diagnosis and patient management. Analytical results that are harmonized and independent of the measurement system, time, and location of testing is essential for providing ad-equate patient care. The key to generating harmo-nized results is establishing traceability to an accept-ed reference standard where available. Awareness of the benefits of having traceable measurement re-sults that are harmonized has increased along with efforts to develop approaches to enable and facilitate the implementation of harmonization. Although sev-eral organizations are addressing harmonization of test procedures, centralized and cooperative global oversight is needed to ensure that the most impor-tant tests are being addressed and resources are op-timally used. Working with its domestic and interna-tional partners, the American Association for Clinical Chemistry (AACC) has created an International Consortium for Harmonization of Clinical Laboratory Results. Advances in this area will improve the qual-ity of patient care.
Corresponding author:Gary Myers Chair, JCTLM Smyrna, Georgia, USAInternational Consortium for Harmonization of Clinical Laboratory Results (ICHCLR)c/o AACC, 900 Seventh Street, Suite 400 Washington, DC 20001, USA
Key words:harmonization, traceability, harmonization consortium, measurand, comparable test results
eJIFCC2016Vol27No1pp030-036Page 31
Gary L. Myers, W. Greg MillerThe ICHCLR – a pathway for harmonization
THE PROBLEM: INTRODUCTION
Many clinical decisions are based upon clinical guidelines that use a fixed laboratory test re-sult for treatment decisions. A basic problem in laboratory medicine is that different laboratory measurement procedures that intend to mea-sure the same measurand may give different results for the same specimen. If different labo-ratories get different results, clinical guidelines become compromised and a patient may get the wrong treatment. Many clinical studies may use a central laboratory with a single method; however, guidelines resulting from such a study cannot be effectively implemented until all oth-er methods are harmonized to the central labo-ratory procedure. Other types of clinical studies may use multiple laboratories that use differ-ent methods in which case data cannot be ag-gregated to develop guidelines until the results from the different methods are harmonized.
Over the past two decades, there have been a number of harmonization successes that have contributed to significant improvements in identifying and managing individuals with chronic diseases, such as diabetes and heart disease (1, 2). But despite these successes, the total number of laboratory tests for which a ref-erence system is available remains very small (approximately 80).
WHAT IS HARMONIZATION
Harmonization is achieving uniform results among different measurement procedures for the same laboratory test. Harmonization usually implies there is no reference measurement pro-cedure available. Harmonization includes con-sideration of nomenclature, patient preparation, specimen collection and handling, result value, reporting units and interpretative information. The topic for this report focuses on achieving harmonized test results.
ACHIEVING HARMONIZED LABORATORY TEST RESULTS
There are basically two important aspects or requirements to achieve harmonized or equiv-alent results. The first requirement is that all measurement procedures must measure the same quantity. Secondly all measurement pro-cedures should be traceable to a common ref-erence system. There is an ISO Standard 17511 that describes traceability and puts forth a pathway for establishing a traceable link to a reference system, where one exists (3). Figure 1 shows the traceability scheme based on the ISO Standard. Since it is not practical in the clini-cal laboratory to use a reference measurement procedure for routine testing, it is important that the patient’s result is traceable to the refer-ence measurement procedure. Establishing this “traceability chain” is accomplished through the materials and methods depicted in Figure 1. In many instances it may be necessary to substi-tute a panel of patient samples when reference materials are not available or deficiencies of the reference materials limit their use. For example, many existing reference materials are not com-mutable with patient samples and therefore not suitable to be used to calibrate routine clini-cal laboratory test procedures (4).
It is important to recognize that calibration traceability does not ensure accuracy for an individual patient’s sample. The imprecision of the measurement procedure may be too large, the measurement procedure may not be spe-cific for the measurand, interfering substances may influence the result or the measurand it-self may not be well defined and the molecular form of clinical interest may not be understood. Consequently different methods may be mea-suring something a little bit different making it impossible to achieve harmonization of results.
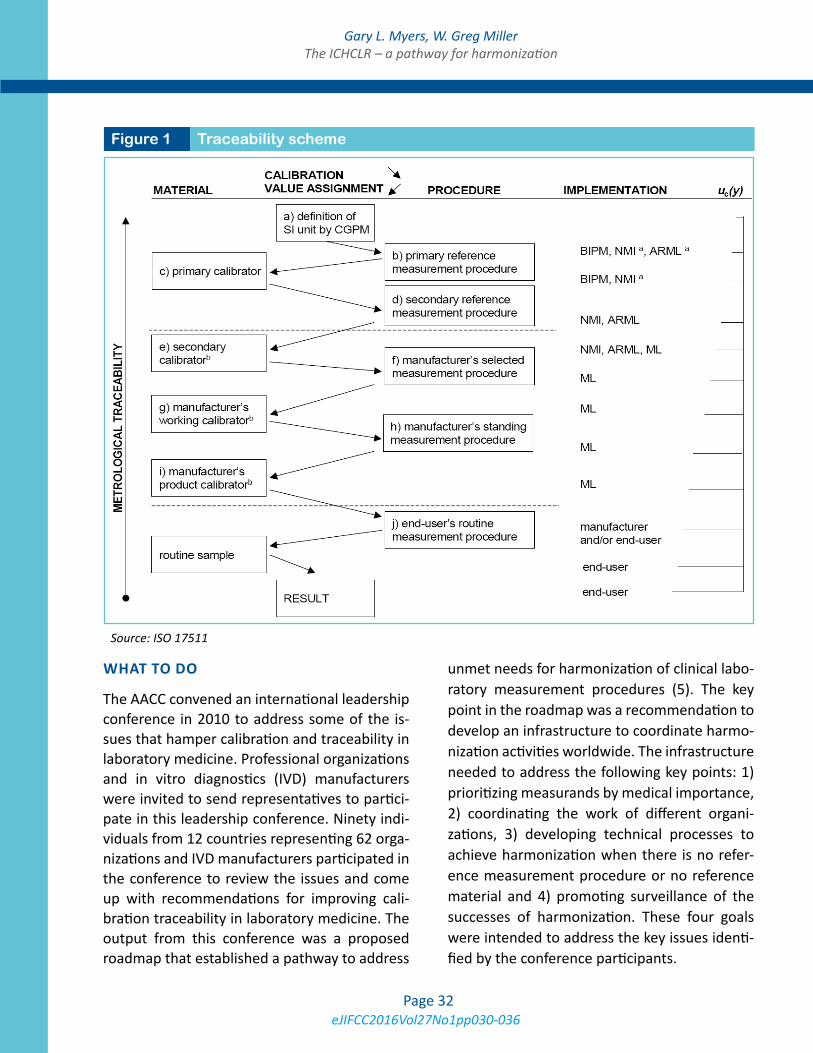
eJIFCC2016Vol27No1pp030-036Page 32
Gary L. Myers, W. Greg MillerThe ICHCLR – a pathway for harmonization
WHAT TO DO
The AACC convened an international leadership conference in 2010 to address some of the is-sues that hamper calibration and traceability in laboratory medicine. Professional organizations and in vitro diagnostics (IVD) manufacturers were invited to send representatives to partici-pate in this leadership conference. Ninety indi-viduals from 12 countries representing 62 orga-nizations and IVD manufacturers participated in the conference to review the issues and come up with recommendations for improving cali-bration traceability in laboratory medicine. The output from this conference was a proposed roadmap that established a pathway to address
unmet needs for harmonization of clinical labo-ratory measurement procedures (5). The key point in the roadmap was a recommendation to develop an infrastructure to coordinate harmo-nization activities worldwide. The infrastructure needed to address the following key points: 1) prioritizing measurands by medical importance, 2) coordinating the work of different organi-zations, 3) developing technical processes to achieve harmonization when there is no refer-ence measurement procedure or no reference material and 4) promoting surveillance of the successes of harmonization. These four goals were intended to address the key issues identi-fied by the conference participants.
Figure 1 Traceability scheme
Source: ISO 17511
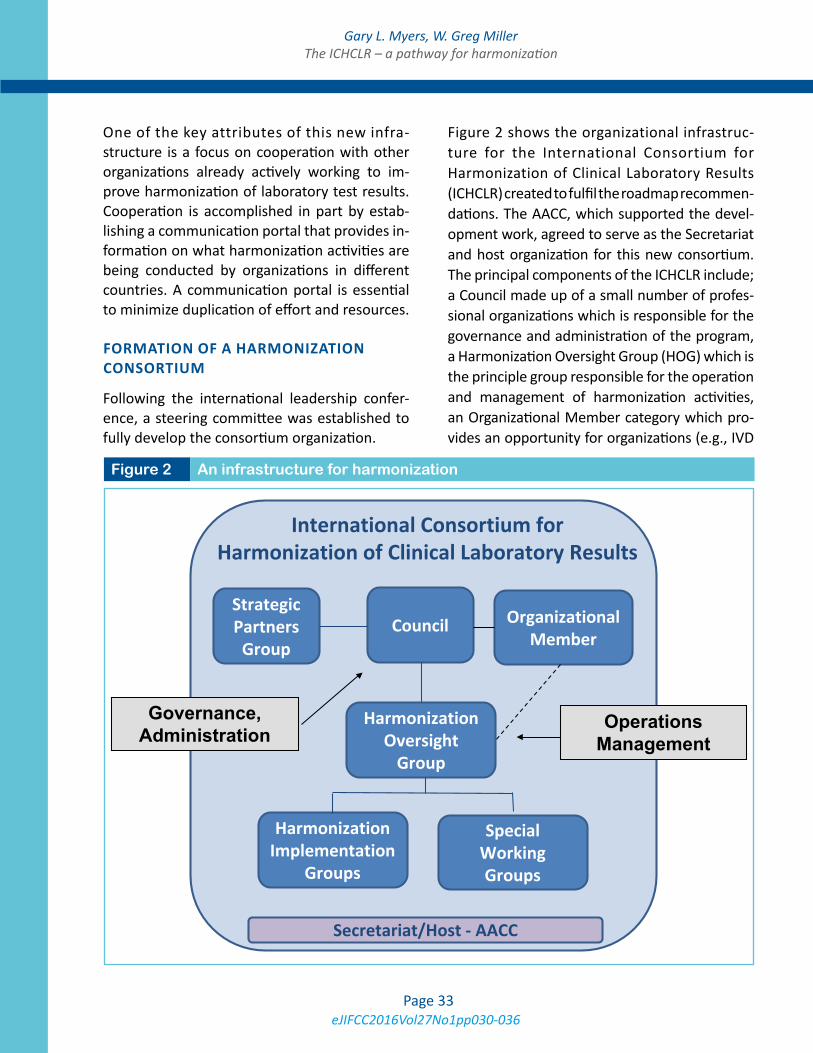
eJIFCC2016Vol27No1pp030-036Page 33
Gary L. Myers, W. Greg MillerThe ICHCLR – a pathway for harmonization
One of the key attributes of this new infra-structure is a focus on cooperation with other organizations already actively working to im-prove harmonization of laboratory test results. Cooperation is accomplished in part by estab-lishing a communication portal that provides in-formation on what harmonization activities are being conducted by organizations in different countries. A communication portal is essential to minimize duplication of effort and resources.
FORMATION OF A HARMONIZATION CONSORTIUM
Following the international leadership confer-ence, a steering committee was established to fully develop the consortium organization.
Figure 2 shows the organizational infrastruc-ture for the International Consortium for Harmonization of Clinical Laboratory Results (ICHCLR) created to fulfil the roadmap recommen-dations. The AACC, which supported the devel-opment work, agreed to serve as the Secretariat and host organization for this new consortium. The principal components of the ICHCLR include; a Council made up of a small number of profes-sional organizations which is responsible for the governance and administration of the program, a Harmonization Oversight Group (HOG) which is the principle group responsible for the operation and management of harmonization activities, an Organizational Member category which pro-vides an opportunity for organizations (e.g., IVD
Figure 2 An infrastructure for harmonizationig
Secretariat/Host - AACC
International Consortium for Harmonization of Clinical Laboratory Results
Council
Governance, Administration
Strategic Partners
Group
Harmonization Oversight
Group
Operations Management
Harmonization Implementation
Groups
Special Working Groups
Organizational Member
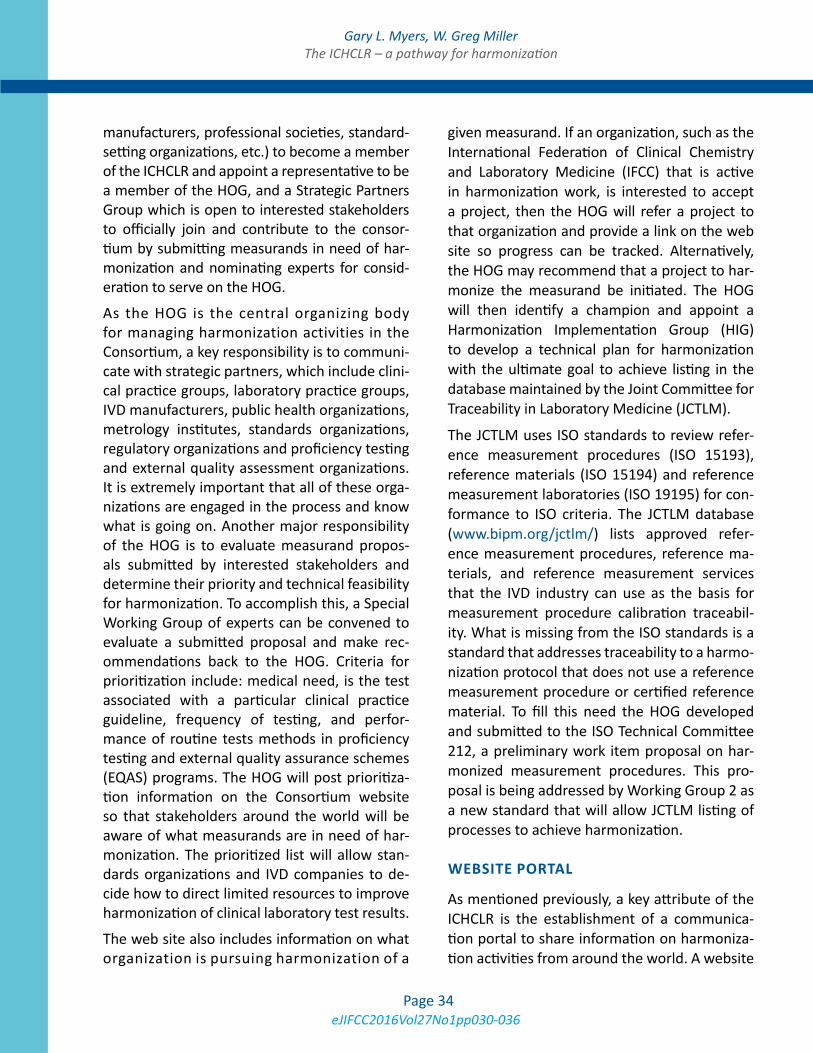
eJIFCC2016Vol27No1pp030-036Page 34
Gary L. Myers, W. Greg MillerThe ICHCLR – a pathway for harmonization
manufacturers, professional societies, standard-setting organizations, etc.) to become a member of the ICHCLR and appoint a representative to be a member of the HOG, and a Strategic Partners Group which is open to interested stakeholders to officially join and contribute to the consor-tium by submitting measurands in need of har-monization and nominating experts for consid-eration to serve on the HOG.
As the HOG is the central organizing body for managing harmonization activities in the Consortium, a key responsibility is to communi-cate with strategic partners, which include clini-cal practice groups, laboratory practice groups, IVD manufacturers, public health organizations, metrology institutes, standards organizations, regulatory organizations and proficiency testing and external quality assessment organizations. It is extremely important that all of these orga-nizations are engaged in the process and know what is going on. Another major responsibility of the HOG is to evaluate measurand propos-als submitted by interested stakeholders and determine their priority and technical feasibility for harmonization. To accomplish this, a Special Working Group of experts can be convened to evaluate a submitted proposal and make rec-ommendations back to the HOG. Criteria for prioritization include: medical need, is the test associated with a particular clinical practice guideline, frequency of testing, and perfor-mance of routine tests methods in proficiency testing and external quality assurance schemes (EQAS) programs. The HOG will post prioritiza-tion information on the Consortium website so that stakeholders around the world will be aware of what measurands are in need of har-monization. The prioritized list will allow stan-dards organizations and IVD companies to de-cide how to direct limited resources to improve harmonization of clinical laboratory test results.
The web site also includes information on what organization is pursuing harmonization of a
given measurand. If an organization, such as the International Federation of Clinical Chemistry and Laboratory Medicine (IFCC) that is active in harmonization work, is interested to accept a project, then the HOG will refer a project to that organization and provide a link on the web site so progress can be tracked. Alternatively, the HOG may recommend that a project to har-monize the measurand be initiated. The HOG will then identify a champion and appoint a Harmonization Implementation Group (HIG) to develop a technical plan for harmonization with the ultimate goal to achieve listing in the database maintained by the Joint Committee for Traceability in Laboratory Medicine (JCTLM).
The JCTLM uses ISO standards to review refer-ence measurement procedures (ISO 15193), reference materials (ISO 15194) and reference measurement laboratories (ISO 19195) for con-formance to ISO criteria. The JCTLM database (www.bipm.org/jctlm/) lists approved refer-ence measurement procedures, reference ma-terials, and reference measurement services that the IVD industry can use as the basis for measurement procedure calibration traceabil-ity. What is missing from the ISO standards is a standard that addresses traceability to a harmo-nization protocol that does not use a reference measurement procedure or certified reference material. To fill this need the HOG developed and submitted to the ISO Technical Committee 212, a preliminary work item proposal on har-monized measurement procedures. This pro-posal is being addressed by Working Group 2 as a new standard that will allow JCTLM listing of processes to achieve harmonization.
WEBSITE PORTAL
As mentioned previously, a key attribute of the ICHCLR is the establishment of a communica-tion portal to share information on harmoniza-tion activities from around the world. A website
eJIFCC2016Vol27No1pp030-036Page 35
Gary L. Myers, W. Greg MillerThe ICHCLR – a pathway for harmonization
portal for this purpose has been established at www.harmonization.net. Figure 3 is a screen shot of the harmonization website resources page. The site provides information on the Council, the HOG, and the Strategic Partners Group. The site contains resources to support global harmonization of clinical laboratory measurement procedures including: a link to the “Roadmap” paper, an AACC position state-ment on harmonization, minutes from meet-ings of the Council and HOG, Strategic Partners Update Reports, operating procedures for the ICHCLR and a copy of the toolbox of technical procedures to be considered when developing a process to achieve harmonization for a mea-surand. There is a separate section dedicated to measurands which provides information on the status of harmonization and standardization of measurands from organizations around the
world. Individuals or organizations can submit a measurand to the Consortium for inclusion on the priority list through the website. A fully elec-tronic process provides an efficient mechanism for submitting measurands for consideration.
TOOLBOX FOR HARMONIZATION
Special attention is drawn to the toolbox of tech-nical procedures to be considered when devel-oping a process to achieve harmonization for a measurand. The toolbox was created by a task force during the formation of the Consortium and contains useful information as a starting point for harmonization. There are two key pro-tocols detailed in the toolbox, 1) the integrated harmonization protocol and 2) a step-up design for harmonization. The integrated protocol is meant to be an assessment study which is a
Figure 3 Harmonization website resources page
eJIFCC2016Vol27No1pp030-036Page 36
Gary L. Myers, W. Greg MillerThe ICHCLR – a pathway for harmonization
very carefully designed experiment incorporat-ing clinical samples, pooled clinical samples, admixed clinical samples to assess linearity and any candidate reference materials that may be available. The protocol integrates into one care-fully designed experiment the ability to obtain information to enable decisions on feasibility to achieve harmonization given the tools avail-able, the preferred approach to harmonization that is likely to succeed and based on this infor-mation a commitment to proceed by interested stakeholders.
The Step-up design is intended for use when there is no reference measurement procedure and no reference material. This particular pro-tocol was developed under the leadership of Professor Linda Thienpont in the context of the IFCC Committee for Standardization of Thyroid Function Tests (6). The step-up design is a se-quence of patient sample comparisons between clinical laboratory procedures where success at one phase allows the harmonization process to “step up” to the next phase. The phases are de-signed to determine whether the methods cor-relate with each other, which is an essential pre-requisite to achieve harmonization, if there is an adequate response over the measuring interval, if there is adequate specificity for the measur-and and an adequate value assignment, such as an all methods mean or a trimmed all methods mean that may be agreeable on a consensus ba-sis. After several qualification phases, a panel of patient sera is fit for purpose to harmonize a set of clinical laboratory measurement procedures. Sustainability is assured by a second panel to harmonize new methods entering the market and to be used to transfer values to subsequent panels to maintain consistency of the scheme.
PATH FORWARD
Harmonizing a greater number of clinical labora-tory tests will contribute to improved healthcare
in many important ways. Harmonized test re-sults will ensure that clinical guidelines that call for the use of laboratory tests can be ap-propriately implemented. Reliable screening to detect diseases early, when they are easier to treat; appropriate diagnoses of diseases; cor-rect and consistent treatment decisions; and effective monitoring of responses to treatment will be important outcomes of more extensive harmonization of clinical laboratory test results. Furthermore, by reducing incorrect interpreta-tions of laboratory test results, harmonization can help prevent treatment errors and unnec-essary — and expensive — follow-up diagnostic procedures and treatments based on inaccu-rate laboratory test results. The ICHCLR encour-ages all interested stakeholders to recognize the critical role of clinical laboratory testing in im-proving health outcomes and to join the ICHCLR in promoting the need for achieving harmoniza-tion of laboratory tests results.
REFERENCES1. Little RR, Rohlfing CL, Wiedmeyer HM, Myers GL, Sacks DB and Goldstein DE for the NGSP Steering Committee. The National Glycohemoglobin Standardization Program: A five-year progress report. Clin Chem 2001;47:1985-92.
2. Warnick GR, Kimberly MM, Waymack PP, Leary ET, Myers, GL. Standardization of measurements for choles-terol, triglycerides and major lipoproteins. LABMEDICINE 2008;39:481-90.
3. ISO. In vitro diagnostic medical devices — measurement of quantities in biological samples — metrological trace-ability of values assigned to calibrators and control ma-terials. 1st ed. ISO17511:2003(E). Geneva: ISO; 2003.ISO 17511
4. Miller WG, Myers GL, Rej R. Why commutability mat-ters. Clin Chem 2006;52:553-4.
5. Miller WG, Myers GL, Gantzer ML, Kahn SE, Schönb-runner ER, Thienpont LM, Bunk DM, Christenson RH, Eck-feldt JH, Lo SF, Nübling CM and Sturgeon CM. Roadmap for harmonization of clinical laboratory measurement procedures. Clin Chem 2011;57:1108-17.
6. Van Uytfanghe K, De Grande LA, Thienpont LM. A “Step-Up” approach for harmonization. Clin Chim Acta 2014;432:62-7.
eJIFCC2016Vol27No1pp037-047Page 37
In this issue: Harmonization of Clinical Laboratory Test Results
Harmonization of clinical laboratory test results: the role of the IVD industryDave Armbruster1, James Donnelly2
1 Director, Clinical Chemistry Scientific Leadership, Abbott Diagnostics2 Chief Scientific Officer, Siemens Healthcare Diagnostics Inc.
A R T I C L E I N F O A B S T R A C T
At the start of the 21st century, a dramatic change oc-curred in the clinical laboratory community. Concepts from Metrology, the science of measurement, be-gan to be more carefully applied to the in vitro diagnostic (IVD) community, that is, manufactur-ers. A new appreciation of calibrator traceability evolved. Although metrological traceability always existed, it was less detailed and formal. The In Vitro Diagnostics Directive (IVDD) of 2003 required manufacturers to provide traceability information, proving assays were anchored to internationally ac-cepted reference materials and/or reference meth-ods. The intent is to ensure comparability of patient test results, regardless of the analytical system used to generate them. Results of equivalent qual-ity allows for the practical use of electronic health records (EHRs) capture a patient’s complete labo-ratory test history and allow healthcare providers to diagnose and treat patients, confident the test results are suitable for correct interpretation, i.e., are “fit for purpose” and reflect a real change in a patient’s condition and not just “analytical noise.” The healthcare benefits are obvious but harmoni-zation of test systems poses significant challenges to the IVD Industry. Manufacturers must learn the
Corresponding authors:Dave ArmbrusterDirector, Clinical Chemistry Scientific Leadership Abbott Diagnostics E-mail: [email protected]
James DonnellyChief Scientific Officer Siemens Healthcare Diagnostics Inc.E-mail: [email protected]
Key words:metrology, traceability, standardization, harmonization
Disclosure:Dave Armbruster is an employee of Abbott Diagnostics.
eJIFCC2016Vol27No1pp037-047Page 38
Dave Armbruster, James DonnellyHarmonization of clinical laboratory test results: the role of the IVD industry
theory of metrological traceability and apply it in a practical manner to assay calibration schemes. It’s difficult to effect such a practi-cal application because clinical laboratories do not test purified analytes using reference measurement procedures but instead deal with complex patient samples, e.g., whole blood, serum, plasma, urine, etc., using “field methods.” Harmonization in the clinical labo-ratory is worth the effort to achieve optimal patient care.
INTRODUCTION
The world is experiencing globalization and the clinical laboratory field is no exception. The goal is to provide optimal healthcare to the global population and clinical laboratory practice is inexorably moving towards harmonization. As stated by Greenberg, “An increasingly important objective in laboratory medicine is ensuring the equivalency of test results among different mea-surement procedures, different laboratories and health care systems, over time (1).” This requires harmonization and metrological traceability of assays to provide equivalence of results derived from different analytical systems (2). This has not been possible historically because assays provided by Industry have not been sufficiently comparable due to a lack of established refer-ence materials and methods to “anchor” tests. As noted by Miller and Myers, “True and precise routine measurements of quantities of clinical in-terest are essential if results are to be optimally interpreted for patient care. Additionally, results produced by different measurement procedures for the same measurand must be comparable if common diagnostic decision values and clinical research values are to be broadly applied (3).”
A patient’s test history would be consistent if a single clinical lab performed all testing (i.e., same
methodology, stable analytical performance, etc.) so a significant change in concentration (de-crease or increase) would signal a meaningful clinical change. In reality, patients are increas-ingly mobile and two or more laboratories may test their samples. If the tests performed by dif-ferent laboratories are sufficiently harmonized so as to produce essentially equivalent results (not necessarily quantitatively equal, but clini-cally equivalent), changes in concentration can be correctly interpreted by a healthcare provid-er. As explained by Gantzer and Miller “Clinical laboratory measurement results must be com-parable among different measurement proce-dures, different locations and different times in order to be used appropriately for identifying and managing disease conditions (4).”
Harmonization is needed to use of electronic medical records/electronic health records (EMRs/EHRs) to capture all of a patient’s lab re-sults in an electronic file available to patients and healthcare providers. Clinical laboratory results typically account for much of the information in EMRS but the benefit is negated if the cumula-tive values in EMR for the same analyte are not comparable. Perhaps not a problem for trace-able analytes, e.g., electrolytes and glucose, but very much an issue for immunoassays such as thyroid and fertility hormones and cancer mark-ers. Interpretation of sequential values using common reference intervals and medical deci-sion levels (MDLs) is difficult, if not impossible. It’s been suggested laboratory data accounts for about 70% of clinical decisions. Hallworth has challenged that blanket statement but allows “The value of laboratory medicine in patient care is unquestioned (5). That value is greatly di-minished without comparability of test results.
Cholesterol is a prime example of successful harmonization. Creating a reference measure-ment system (RMS) for this key lipid over about 30 years (1970 – 2000) coincided with a major reduction in mortality rates for coronary heart
eJIFCC2016Vol27No1pp037-047Page 39
Dave Armbruster, James DonnellyHarmonization of clinical laboratory test results: the role of the IVD industry
disease (CHD) in the US and also achieved a huge savings in healthcare dollars (1). The con-sequences of the lack of harmonization was demonstrated by an NIST report on calcium (Ca) that estimated the cost of a 0.1 mg/dL Ca bias can cost $8 - $31 for additional, but unneces-sary, patient follow up testing (6). A bias of 0.5 mg/dL could results in an additional $34 - $89/patient. On an annual basis, a 0.1 mg/dL bias could translate into $60 - $199 million/year for about 3.55 million patients screened for Ca.
HARMONIZATION VS. STANDARDIZATION
In this paper “harmonization” is used interchange-ably with “standardization,” though there is a dis-tinction between the two (4). Standardization means results are traceable to higher metro-logical order reference materials and/or meth-ods and ideally can be reported using SI units. Harmonization means results are traceable to some declared reference but accepted higher order reference materials and/or methods are not available and SI units are not applicable. Harmonization ensures comparability of re-sults, enables application of clinical best prac-tice guidelines and reference intervals, increas-es patient safety, and decreases medical care costs. Harmonization requires the cooperation of laboratories, academia, professional societ-ies, metrological institutes, government agen-cies, EQA/PT providers, and industry. Two re-cent harmonization (actually, standardization) success stories mediated by Industry are cre-atinine and glycated hemoglobin (Hb A1c). Field assays for both of these analytes feature com-plete traceability chains and are firmly anchored by reference measurement systems. That said, ironically results for both assays are still typi-cally reported in different units, creatinine in mg/dL (“conventional units”) and mmol/L (SI units), and Hb A1c in % Hb A1c (NGSP units) and mmol/mol (SI units).
METROLOGICAL TRACEABILITY
The In Vitro Diagnostics Directive (IVDD) of 2003 applies to Europe for the purposes of the CE mark, but has global implications. It requires manufacturers to establish the metrological traceability and uncertainty of kit calibrators. “Metrological traceability is defined in the VIM, clause 2.41 as the ‘property of a measurement result whereby the result can be related to a reference (a standard) through a documented unbroken chain of calibrations, each contribut-ing to the measurement uncertainty. (1)” The IVDD doesn’t provide specifics but ISO 17511 (Metrological traceability of values assigned to calibrators and control materials) applies (7; see Fig 1.). It establishes a metrology infrastructure for assays. The IVDD requirements are incorpo-rated in ISO 15189 (Medical laboratories- par-ticular requirements for quality and compe-tence) (8).
As White explains “Metrology, the science of measurement, provides laboratory medicine with a structured approach to the development and terminology of reference measurement sys-tems which, when implemented, improve the accuracy and comparability of patients’ results (9).” Metrological principles are a relatively new in the clinical laboratory. For example, the Tietz Textbook of Clinical Chemistry (third edition, 1999) made no mention of “uncertainty” or “commutability” (10). The fourth edition (2006) mentioned uncertainty and commutability but only a definition of commutability was given (11). The fifth edition (2011) includes a discus-sion of uncertainty along with commutability (12). As noted by De Bievre, “Discussions with analytical chemists have revealed that basic concepts in metrology, including ‘traceability,’ are generally not an integral part of university or college curricula and are not treated in most text books of analytical chemistry” (13).
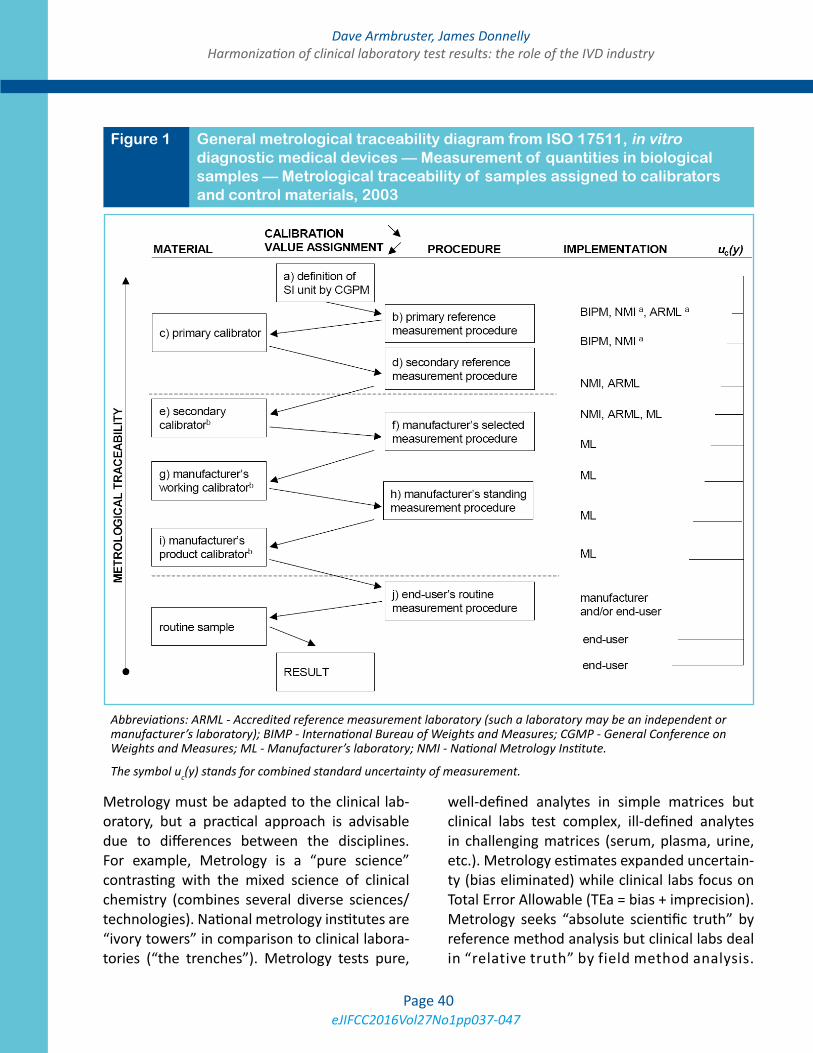
eJIFCC2016Vol27No1pp037-047Page 40
Dave Armbruster, James DonnellyHarmonization of clinical laboratory test results: the role of the IVD industry
Metrology must be adapted to the clinical lab-oratory, but a practical approach is advisable due to differences between the disciplines. For example, Metrology is a “pure science” contrasting with the mixed science of clinical chemistry (combines several diverse sciences/technologies). National metrology institutes are “ivory towers” in comparison to clinical labora-tories (“the trenches”). Metrology tests pure,
well-defined analytes in simple matrices but clinical labs test complex, ill-defined analytes in challenging matrices (serum, plasma, urine, etc.). Metrology estimates expanded uncertain-ty (bias eliminated) while clinical labs focus on Total Error Allowable (TEa = bias + imprecision). Metrology seeks “absolute scientific truth” by reference method analysis but clinical labs deal in “relative truth” by field method analysis.
Figure 1 General metrological traceability diagram from ISO 17511, in vitro diagnostic medical devices — Measurement of quantities in biological samples — Metrological traceability of samples assigned to calibrators and control materials, 2003
Abbreviations: ARML - Accredited reference measurement laboratory (such a laboratory may be an independent or manufacturer’s laboratory); BIMP - International Bureau of Weights and Measures; CGMP - General Conference on Weights and Measures; ML - Manufacturer’s laboratory; NMI - National Metrology Institute.
The symbol uc(y) stands for combined standard uncertainty of measurement.
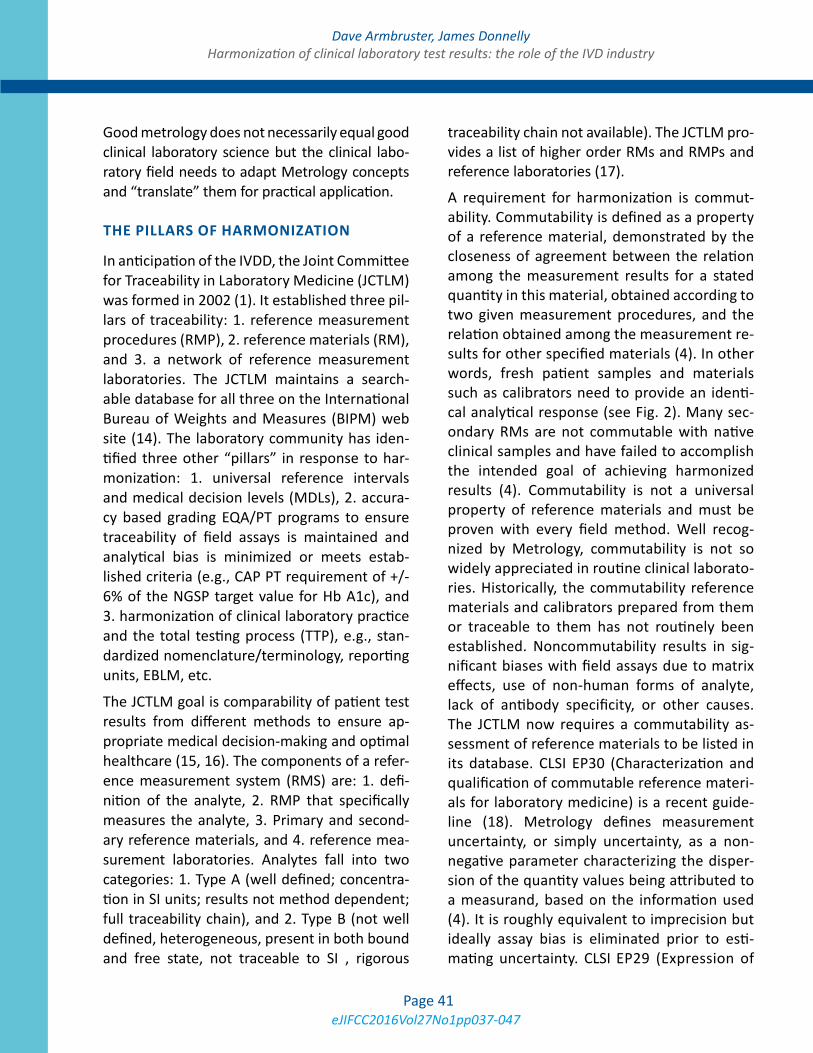
eJIFCC2016Vol27No1pp037-047Page 41
Dave Armbruster, James DonnellyHarmonization of clinical laboratory test results: the role of the IVD industry
Good metrology does not necessarily equal good clinical laboratory science but the clinical labo-ratory field needs to adapt Metrology concepts and “translate” them for practical application.
THE PILLARS OF HARMONIZATION
In anticipation of the IVDD, the Joint Committee for Traceability in Laboratory Medicine (JCTLM) was formed in 2002 (1). It established three pil-lars of traceability: 1. reference measurement procedures (RMP), 2. reference materials (RM), and 3. a network of reference measurement laboratories. The JCTLM maintains a search-able database for all three on the International Bureau of Weights and Measures (BIPM) web site (14). The laboratory community has iden-tified three other “pillars” in response to har-monization: 1. universal reference intervals and medical decision levels (MDLs), 2. accura-cy based grading EQA/PT programs to ensure traceability of field assays is maintained and analytical bias is minimized or meets estab-lished criteria (e.g., CAP PT requirement of +/- 6% of the NGSP target value for Hb A1c), and 3. harmonization of clinical laboratory practice and the total testing process (TTP), e.g., stan-dardized nomenclature/terminology, reporting units, EBLM, etc.
The JCTLM goal is comparability of patient test results from different methods to ensure ap-propriate medical decision-making and optimal healthcare (15, 16). The components of a refer-ence measurement system (RMS) are: 1. defi-nition of the analyte, 2. RMP that specifically measures the analyte, 3. Primary and second-ary reference materials, and 4. reference mea-surement laboratories. Analytes fall into two categories: 1. Type A (well defined; concentra-tion in SI units; results not method dependent; full traceability chain), and 2. Type B (not well defined, heterogeneous, present in both bound and free state, not traceable to SI , rigorous
traceability chain not available). The JCTLM pro-vides a list of higher order RMs and RMPs and reference laboratories (17).
A requirement for harmonization is commut-ability. Commutability is defined as a property of a reference material, demonstrated by the closeness of agreement between the relation among the measurement results for a stated quantity in this material, obtained according to two given measurement procedures, and the relation obtained among the measurement re-sults for other specified materials (4). In other words, fresh patient samples and materials such as calibrators need to provide an identi-cal analytical response (see Fig. 2). Many sec-ondary RMs are not commutable with native clinical samples and have failed to accomplish the intended goal of achieving harmonized results (4). Commutability is not a universal property of reference materials and must be proven with every field method. Well recog-nized by Metrology, commutability is not so widely appreciated in routine clinical laborato-ries. Historically, the commutability reference materials and calibrators prepared from them or traceable to them has not routinely been established. Noncommutability results in sig-nificant biases with field assays due to matrix effects, use of non-human forms of analyte, lack of antibody specificity, or other causes. The JCTLM now requires a commutability as-sessment of reference materials to be listed in its database. CLSI EP30 (Characterization and qualification of commutable reference materi-als for laboratory medicine) is a recent guide-line (18). Metrology defines measurement uncertainty, or simply uncertainty, as a non-negative parameter characterizing the disper-sion of the quantity values being attributed to a measurand, based on the information used (4). It is roughly equivalent to imprecision but ideally assay bias is eliminated prior to esti-mating uncertainty. CLSI EP29 (Expression of
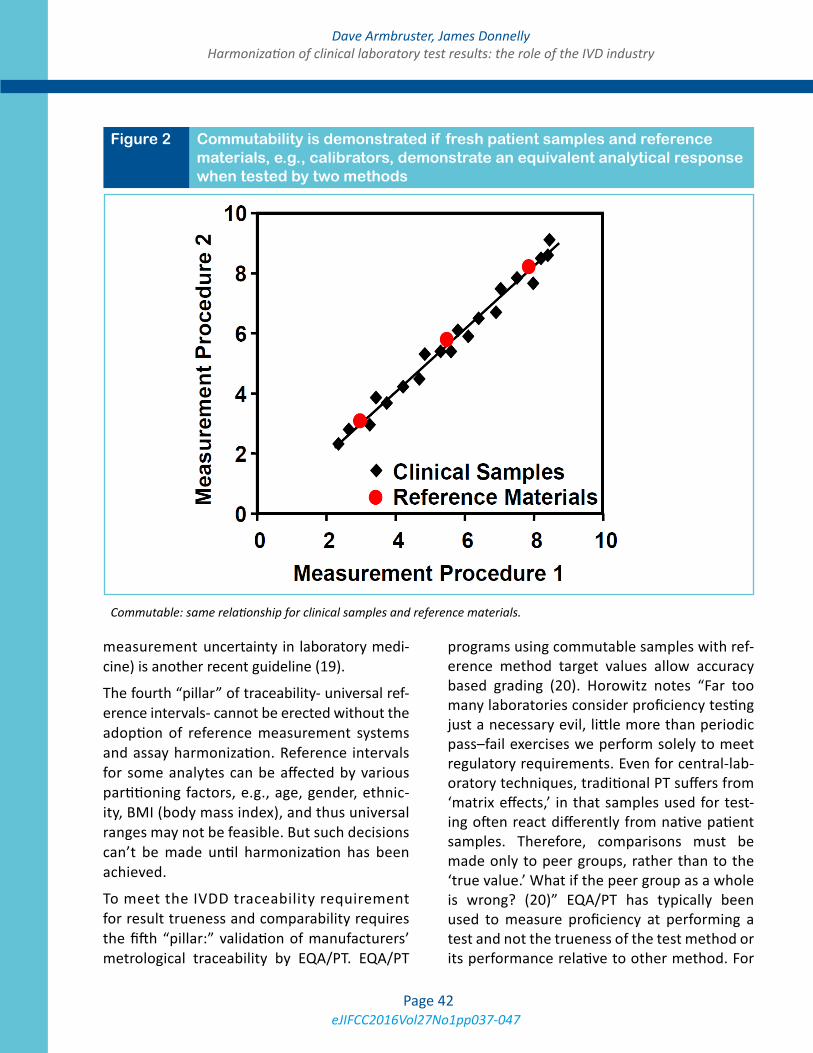
eJIFCC2016Vol27No1pp037-047Page 42
Dave Armbruster, James DonnellyHarmonization of clinical laboratory test results: the role of the IVD industry
measurement uncertainty in laboratory medi-cine) is another recent guideline (19).
The fourth “pillar” of traceability- universal ref-erence intervals- cannot be erected without the adoption of reference measurement systems and assay harmonization. Reference intervals for some analytes can be affected by various partitioning factors, e.g., age, gender, ethnic-ity, BMI (body mass index), and thus universal ranges may not be feasible. But such decisions can’t be made until harmonization has been achieved.
To meet the IVDD traceability requirement for result trueness and comparability requires the fifth “pillar:” validation of manufacturers’ metrological traceability by EQA/PT. EQA/PT
programs using commutable samples with ref-erence method target values allow accuracy based grading (20). Horowitz notes “Far too many laboratories consider proficiency testing just a necessary evil, little more than periodic pass–fail exercises we perform solely to meet regulatory requirements. Even for central-lab-oratory techniques, traditional PT suffers from ‘matrix effects,’ in that samples used for test-ing often react differently from native patient samples. Therefore, comparisons must be made only to peer groups, rather than to the ‘true value.’ What if the peer group as a whole is wrong? (20)” EQA/PT has typically been used to measure proficiency at performing a test and not the trueness of the test method or its performance relative to other method. For
Figure 2 Commutability is demonstrated if fresh patient samples and reference materials, e.g., calibrators, demonstrate an equivalent analytical response when tested by two methods
Commutable: same relationship for clinical samples and reference materials.
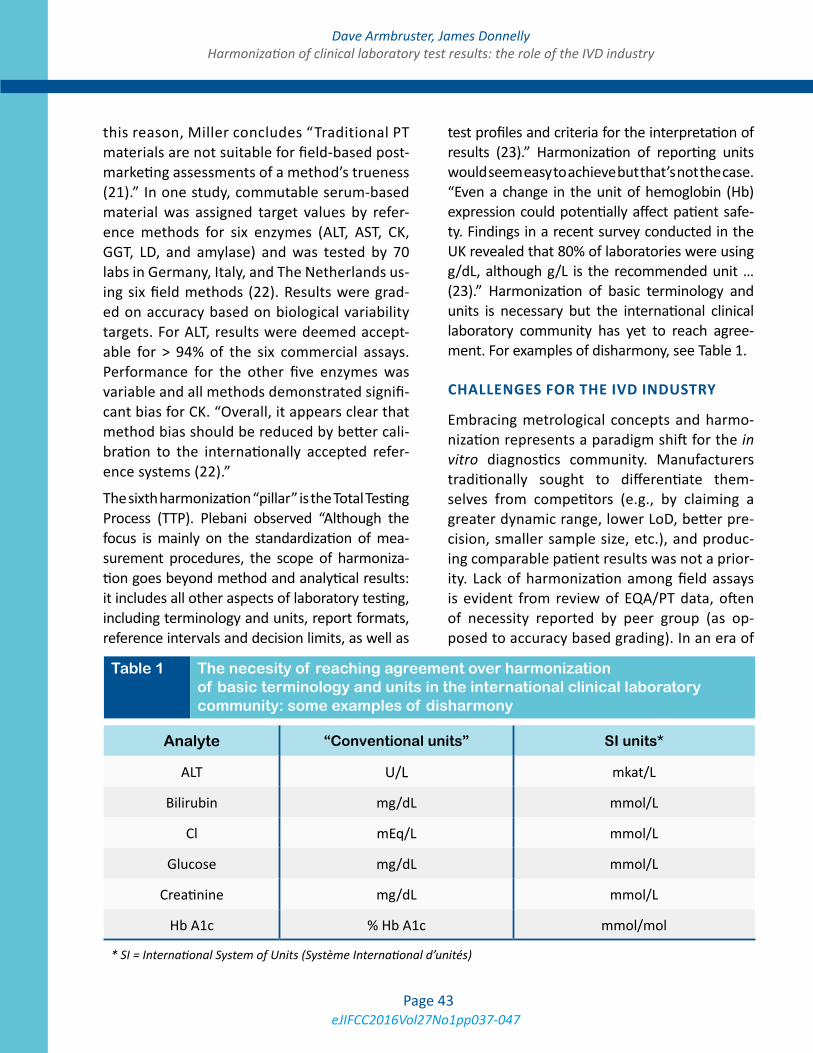
eJIFCC2016Vol27No1pp037-047Page 43
Dave Armbruster, James DonnellyHarmonization of clinical laboratory test results: the role of the IVD industry
this reason, Miller concludes “Traditional PT materials are not suitable for field-based post-marketing assessments of a method’s trueness (21).” In one study, commutable serum-based material was assigned target values by refer-ence methods for six enzymes (ALT, AST, CK, GGT, LD, and amylase) and was tested by 70 labs in Germany, Italy, and The Netherlands us-ing six field methods (22). Results were grad-ed on accuracy based on biological variability targets. For ALT, results were deemed accept-able for > 94% of the six commercial assays. Performance for the other five enzymes was variable and all methods demonstrated signifi-cant bias for CK. “Overall, it appears clear that method bias should be reduced by better cali-bration to the internationally accepted refer-ence systems (22).”
The sixth harmonization “pillar” is the Total Testing Process (TTP). Plebani observed “Although the focus is mainly on the standardization of mea-surement procedures, the scope of harmoniza-tion goes beyond method and analytical results: it includes all other aspects of laboratory testing, including terminology and units, report formats, reference intervals and decision limits, as well as
test profiles and criteria for the interpretation of results (23).” Harmonization of reporting units would seem easy to achieve but that’s not the case. “Even a change in the unit of hemoglobin (Hb) expression could potentially affect patient safe-ty. Findings in a recent survey conducted in the UK revealed that 80% of laboratories were using g/dL, although g/L is the recommended unit … (23).” Harmonization of basic terminology and units is necessary but the international clinical laboratory community has yet to reach agree-ment. For examples of disharmony, see Table 1.
CHALLENGES FOR THE IVD INDUSTRY
Embracing metrological concepts and harmo-nization represents a paradigm shift for the in vitro diagnostics community. Manufacturers traditionally sought to differentiate them-selves from competitors (e.g., by claiming a greater dynamic range, lower LoD, better pre-cision, smaller sample size, etc.), and produc-ing comparable patient results was not a prior-ity. Lack of harmonization among field assays is evident from review of EQA/PT data, often of necessity reported by peer group (as op-posed to accuracy based grading). In an era of
Analyte “Conventional units” SI units*
ALT U/L mkat/L
Bilirubin mg/dL mmol/L
Cl mEq/L mmol/L
Glucose mg/dL mmol/L
Creatinine mg/dL mmol/L
Hb A1c % Hb A1c mmol/mol
* SI = International System of Units (Système International d’unités)
Table 1 The necesity of reaching agreement over harmonization of basic terminology and units in the international clinical laboratory community: some examples of disharmony
eJIFCC2016Vol27No1pp037-047Page 44
Dave Armbruster, James DonnellyHarmonization of clinical laboratory test results: the role of the IVD industry
harmonization, results from different systems should be comparable. Manufacturers are re-sponding by: providing calibrator traceabil-ity/uncertainty information, restandardizing assays, testing commutability, etc., and they work with many professional organizations and each other to attain harmonization, but this is a new approach and challenge for the industry. Manufacturers have an integral role in educating customers about harmonization of assays, harmonization and clinical labora-tory practice in general. Of course the age old question remains: “Where do manufacturers’ obligations end and the obligations of lab di-rectors begin?” Manufacturers must provide “fit for purpose” tests, but labs must use the assays properly and effectively. When an as-say “failure” occurs (and “failure” can apply to myriad issues and causes) does the fault lie with the manufacturer or with the lab and its use of the test?
A major challenge for manufacturers is to choose a total allowable error (TEa) goal from the many available options: CLIA requirements (U.S. specific); CAP; RCPA, RiliBÄK, or other EQA/PT provider specifications. A popular approach is to define TEa based on biological variability targets, but there are three targets from which to choose:
Minimum:
TEa< 1.65(0.75 CV
i)+0.375(CV
i
2 + CV
g
2)
½
Desirable:
TEa<1.65(0.5 CV
i)+0.25(CV
i
2+ CV
g
2)
½
Optimum:
TEa< 1.65(0.25 CV
i)+0.125(CV
i
2 +CV
g
2)
½
CVi = individual biological variability;
CVg = group biological variability
An IFCC initiative is the Working Group on Allowable Error for Traceable Results (WG-AETR). This group concluded “Although manu-facturers are compelled by the European IVD Directive, 98/79/EC, to have traceability of the values assigned to their calibrators if suitable higher order reference materials and/or proce-dures are available, there is still no equivalence of results for many measurands determined in clinical laboratories” (24). For some common analytes, such as sodium, current assays are too imprecise to meet TEa targets based on biologi-cal variation. The aim of harmonization is equiv-alent results but unfortunately, due to cost and limited resources, IVD manufacturers don’t al-ways follow full traceability steps to value assign every new calibrator lot but rely on value trans-fer from an internally stored (“master”) calibra-tor material. In most cases, this procedure is probably valid, but a common complaint is cali-brator lot to lot variability. The WG-AETR noted that when there are two traceability paths for a measurand, calibrators from different manufac-turers may both be derived from valid traceabil-ity chains but produce non-equivalent results, as illustrated by Fig. 3. Equivalent results from two systems may be possible by using a correc-tion factor determined by a correlation study.
The international clinical laboratory community has embraced harmonization. A prime example is the AACC’s ICHCLR (International Consortium for Harmonization of Clinical Laboratory Results)(2). The ICHCLR prioritizes analytes globally for harmonization and development of RMs and RMPs for listing in the JCTLM database, which will allow for comparable results irrespective of the laboratory, method, or the time when test-ing is performed. ICHCLR stakeholders include: clinical lab and medical professional societies, IVD manufacturers, metrology institutes, pub-lic health organizations, regulatory agencies, and standard-setting organizations. A similar initiative is Pathology Harmony in the UK (25).
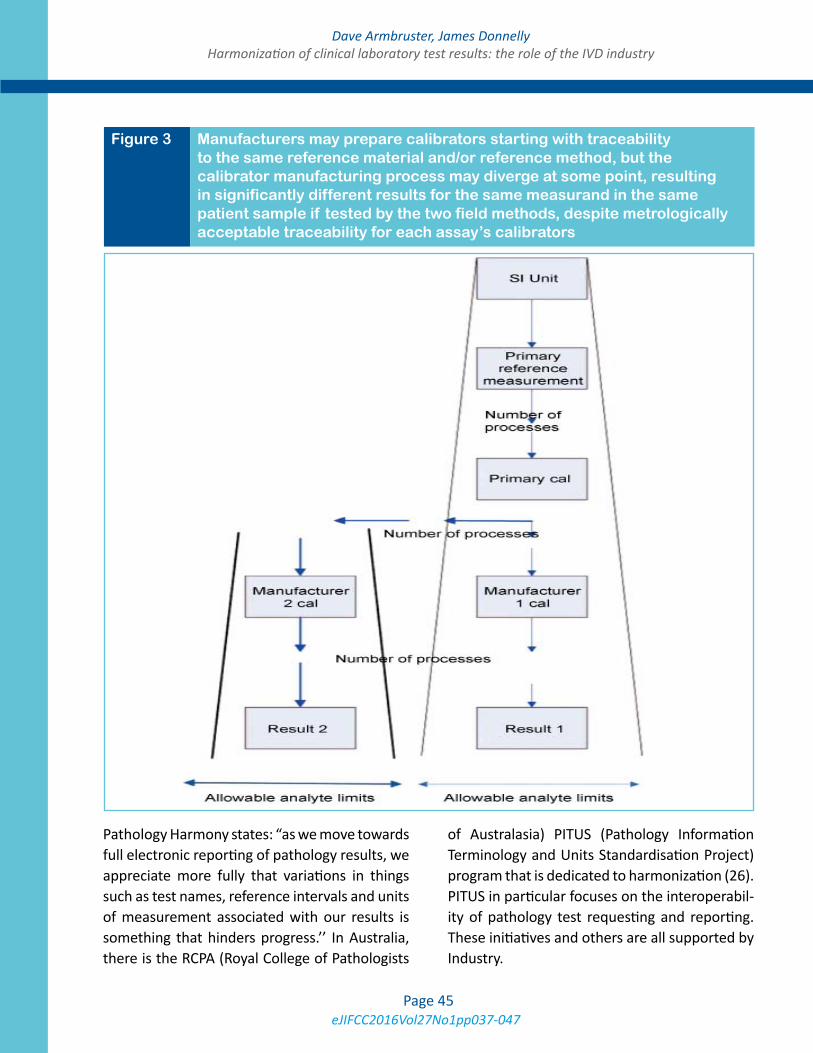
eJIFCC2016Vol27No1pp037-047Page 45
Dave Armbruster, James DonnellyHarmonization of clinical laboratory test results: the role of the IVD industry
Pathology Harmony states: “as we move towards full electronic reporting of pathology results, we appreciate more fully that variations in things such as test names, reference intervals and units of measurement associated with our results is something that hinders progress.’’ In Australia, there is the RCPA (Royal College of Pathologists
of Australasia) PITUS (Pathology Information Terminology and Units Standardisation Project) program that is dedicated to harmonization (26). PITUS in particular focuses on the interoperabil-ity of pathology test requesting and reporting. These initiatives and others are all supported by Industry.
Figure 3 Manufacturers may prepare calibrators starting with traceability to the same reference material and/or reference method, but the calibrator manufacturing process may diverge at some point, resulting in significantly different results for the same measurand in the same patient sample if tested by the two field methods, despite metrologically acceptable traceability for each assay’s calibrators
eJIFCC2016Vol27No1pp037-047Page 46
Dave Armbruster, James DonnellyHarmonization of clinical laboratory test results: the role of the IVD industry
MANUFACTURERS’ ROLE IN THE 21ST CENTURY
Industry support can be optimized when the harmonization initiatives are coordinated and prioritized. From the industry perspective there are limitations, costs and tradeoffs which need to be considered. Device manufacturers all have substantial product development priority lists and development schedules and personnel and financial resources are committed over long term periods to achieve strategic goals. The de-velopment process for a new product can be measured over years in our highly regulated en-vironment. Further, the cost for each project can run into the millions of dollars. Reprioritization is possible and welcomed by industry when the results will provide benefit to the clinician, pa-tient and healthcare system. Stellar examples such as creatinine, hemoglobin A1c and choles-terol have been pointed out in this manuscript.
The global drive for harmonization creates competing project priorities for companies. As manufacturers sign on to support harmoniza-tion projects, timelines that reflect develop-ment cycles (years) allow companies to reprior-itize resources while maintaining projects that drive innovation, product health and portfolio development.
Harmonization may also require worldwide re-registration of products. Meeting the criteria of country specific regulatory agencies comes with additional considerations and complexities be-yond the harmonization initiative. Registration timing is not equivalent in all countries and mul-tiple products for a given measurand may need to be supported for an extended period of time. This impacts manufacturing resources and pro-duction costs.
It is imperative there be close coordination of industry, professional bodies and the global leaders of harmonization initiatives to ensure harmonization is successful. If companies could
contribute to the prioritization of projects, de-sign of experiment and contribute to the inputs we would be assured changes requiring prod-uct re-registration would be successful. This would also avoid unintentional competitive imbalances.
A significant consideration is the traceability of the reference assay. Device manufacturer’s typi-cally register products using a predicate device to demonstrate product acceptance. In such cas-es proof of substantial equivalence is essential to demonstrate the assay is safe and effective. If a reference assay is a laboratory developed test the path to regulatory registration and the abil-ity to commercialize the assay brings with it ad-ditional complications.
Lastly, a major consideration is whether the harmonization initiative provides benefit to the public. While accuracy is important, there are situations where existing assays may be rela-tively harmonized yet the reference method is very different from the commercialized assays. Under these special circumstances the cost of harmonization which includes physician educa-tion, patient safety and investment in product redevelopment must be carefully weighed to understand the benefit of harmonization.
REFERENCES
1. Greenberg N. Update on current concepts and mean-ings in laboratory medicine Standardization, traceability and harmonization. Clin Chim Acta 2014;432:49-54.
2. Miller WG, Myers GL, Gantzer ML, Kahn SE, Schon-brunner ER, Thienpont LM, et al. Roadmap for harmoni-zation of clinical laboratory measurements procedures. Clin Chem 2011;57:1108-17.
3. Miller WG, Myers GL. Commutability still matters. Clin Chem 2013;59:1291-93.
4. Gantzer ML, Miller WG. Harmonisation of Measure-ment Procedures: how do we get it done? Clin Biochem Rev 2012,33:95-100.
5. Hallworth MJ. The ‘70% claim’: what is the evidence base? Ann Clin Biochem 2011;48:487-8.
eJIFCC2016Vol27No1pp037-047Page 47
Dave Armbruster, James DonnellyHarmonization of clinical laboratory test results: the role of the IVD industry
6. NIST. Planning report 04-1, The impact of calibration error in medical decision making. NIST, May, 2004.
7. ISO 17511. In vitro diagnostic medical devices - Mea-surement of quantities in biological samples - Metro-logical traceabiIity of values assigned to calibrators and control materials. International Organization for Stan-dardization, 2003.
8. ISO 15189. Medical laboratories — Requirements for quality and competence. International Organization for Standardization, 2012.
9. White GH. Metrological traceability in clinical biochem-istry. Ann Clin Biochem 2011;48:393-409.
10. Tietz Textbook of Clinical Chemistry,3rd ed. Eds. Bur-tis CA and Ashwood ER. W.B. Saunders Co., Philadelphia, 1999.
11. Tietz Textbook of Clinical Chemistry and Molecular Diagnostics,4th ed. Eds. Burtis CA, Ashwood ER, Bruns DE. W.B. Saunders Co., Philadelphia, 2006.
12. Tietz Textbook of Clinical Chemistry and Molecular Diagnostics,5th ed. Eds. Burtis CA, Ashwood ER, Bruns DE. W.B. Saunders Co., Philadelphia, Saunders, 2011.
13. De Bievre P. Metrological traceability of measurement results in chemistry: Concepts and implementation. IUPAC Technical Report. Pure Appl Chem 2011;83:1873-1935.
14. www.bipm.org/jctlm.
15. Panteghini M. Traceability, reference systems and re-sult comparability. Clin Biochem Rev 2007;28:97-104.
16. Braga F, Panteghini M. Verification of in vitro medical diagnostics (IVD) metrological traceability: Responsibili-ties and strategies. Clin Chim Acta 2014;432:55-61.
17. Panteghini M. Traceability as a unique tool to improve standardization in laboratory medicine. Clin Biochem 2009;42:236-40.
18. CLSI EP30. Characterization and qualification of commutable reference materials for laboratory medi-cine. Clinical Laboratory Standards Institute, Wayne, PA, 2010.
19. CLSI EP21. Expression of measurement uncertainty in laboratory medicine. Clinical Laboratory Standards Insti-tute, Wayne, PA, 2012.
20. Horowitz GL. Proficiency testing matters. Clin Chem 2013;59:335-7.
21. Miller WG, Myers GL, Ashwood ER, et al. State of the art in trueness and interlaboratory
harmonization for 10 analytes in general clinical chemis-try. Archiv Pathol Lab Med, 2008;132:838-46.
22. Jansen R, Schumann G, Baadenhuijsen H, et al. True-ness verification and traceability assessment of results from commercial systems for measurement of six en-zyme activities in serum: An international study in the EC4 framework of the Calibration 2000 project. Clin Chim Acta 2006;368:160-7.
23. Plebani M. Harmonization in laboratory medicine: the complete picture. Clin Chem Lab Med 2013;51:741-51.
24. Bais R, Armbruster D, Jansen RTP, Klee G, Panteghi-ni, Passarelli J, Sikaris KA. Defining acceptable limits for the metrological traceability of specific measurands. Clin Chem Lab Med 2013;51:973-6.
25. Berg J, Lane V. Pathology Harmony; a pragmatic and scientific approach to unfounded variation in the clinical laboratory. Ann Clin Biochem 2011;48:195-7.
26. Legg M. Standardisation of test requesting and re-porting for the electronic health record. Clin Chim Acta 2014;432:148.
eJIFCC2016Vol27No1pp048-065Page 48
In this issue: Harmonization of Clinical Laboratory Test Results
Opinion paper: deriving harmonised reference intervals – global activitiesJillian R. Tate1, Gus Koerbin2, Khosrow Adeli3
1 Pathology Queensland, Royal Brisbane and Women’s Hospital, Brisbane, QLD, Australia2 NSW Health Pathology, Chatswood, NSW, Australia3 Clinical Biochemistry, The Hospital for Sick Children, University of Toronto, ON, Canada
A R T I C L E I N F O A B S T R A C T
Harmonisation of reference intervals (RIs) refers to use of the same or common RI across different plat-forms and /or assays for a specified analyte. It occurs optimally for those analytes where there is sound cal-ibration and traceability in place and evidence from a between-method comparison shows that bias would not prevent the use of a common RI. The selection of the RI will depend on various sources of informa-tion including local formal RI studies, published stud-ies from the literature, laboratory surveys, manufac-turer’s product information, relevant guidelines, and mining of databases. Pre-analytical and partitioning issues, significant figures and flagging rates, are as-sessed for each analyte.
Several countries and regions including the Nordic countries, United Kingdom, Japan, Turkey, and Australasia are using common RIs that have been de-termined either by direct studies or by a consensus process. In Canada, the Canadian Society of Clinical Chemists Taskforce is assessing the feasibility of estab-lishing common reference values using the CALIPER (Canadian Laboratory Initiative on Pediatric Reference Intervals) and CHMS (The Canadian Health Measures Survey) databases as the basis. Development of platform-specific common reference values for each
Corresponding author:Jillian R. TateDepartment of Chemical Pathology Pathology Queensland Royal Brisbane and Women’s Hospital Herston, QLD 4029 AustraliaPhone: 61-7-3646-0082E-mail: [email protected]
Key words:harmonisation, standardisation, reference intervals, transference, adult, paediatric
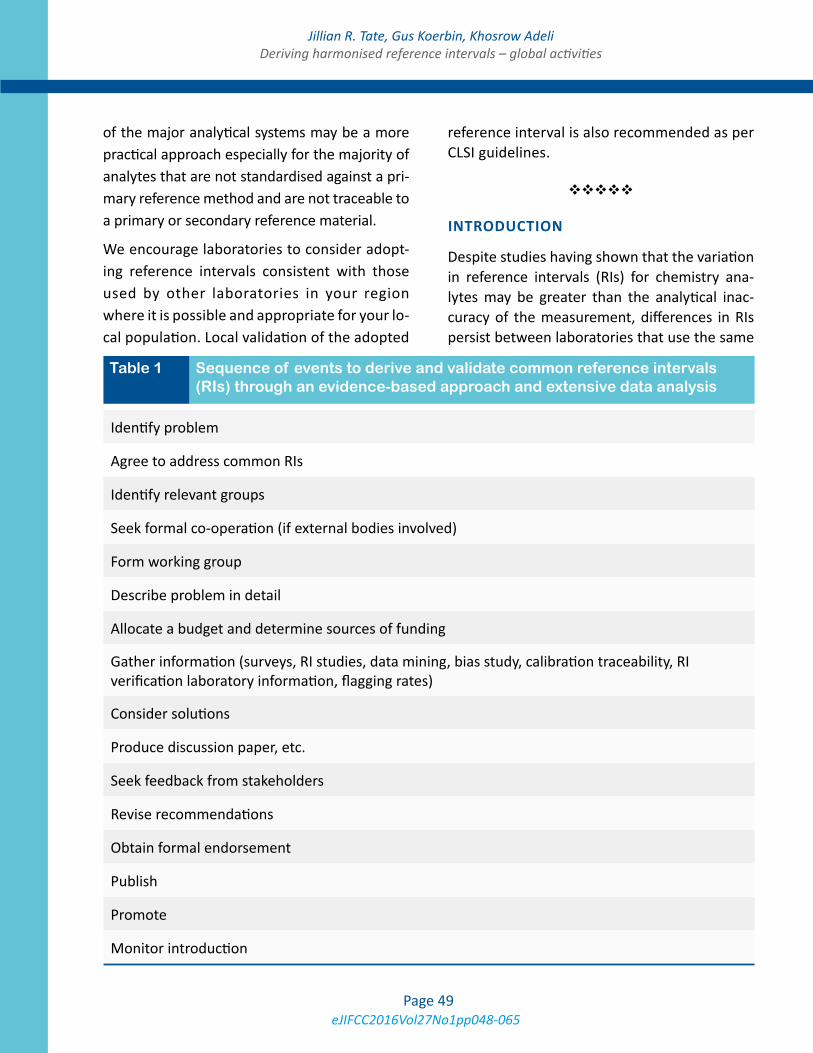
eJIFCC2016Vol27No1pp048-065Page 49
Jillian R. Tate, Gus Koerbin, Khosrow AdeliDeriving harmonised reference intervals – global activities
of the major analytical systems may be a more practical approach especially for the majority of analytes that are not standardised against a pri-mary reference method and are not traceable to a primary or secondary reference material.
We encourage laboratories to consider adopt-ing reference intervals consistent with those used by other laboratories in your region where it is possible and appropriate for your lo-cal population. Local validation of the adopted
reference interval is also recommended as per CLSI guidelines.
INTRODUCTION
Despite studies having shown that the variation in reference intervals (RIs) for chemistry ana-lytes may be greater than the analytical inac-curacy of the measurement, differences in RIs persist between laboratories that use the same
Identify problem
Agree to address common RIs
Identify relevant groups
Seek formal co-operation (if external bodies involved)
Form working group
Describe problem in detail
Allocate a budget and determine sources of funding
Gather information (surveys, RI studies, data mining, bias study, calibration traceability, RI verification laboratory information, flagging rates)
Consider solutions
Produce discussion paper, etc.
Seek feedback from stakeholders
Revise recommendations
Obtain formal endorsement
Publish
Promote
Monitor introduction
Table 1 Sequence of events to derive and validate common reference intervals (RIs) through an evidence-based approach and extensive data analysis
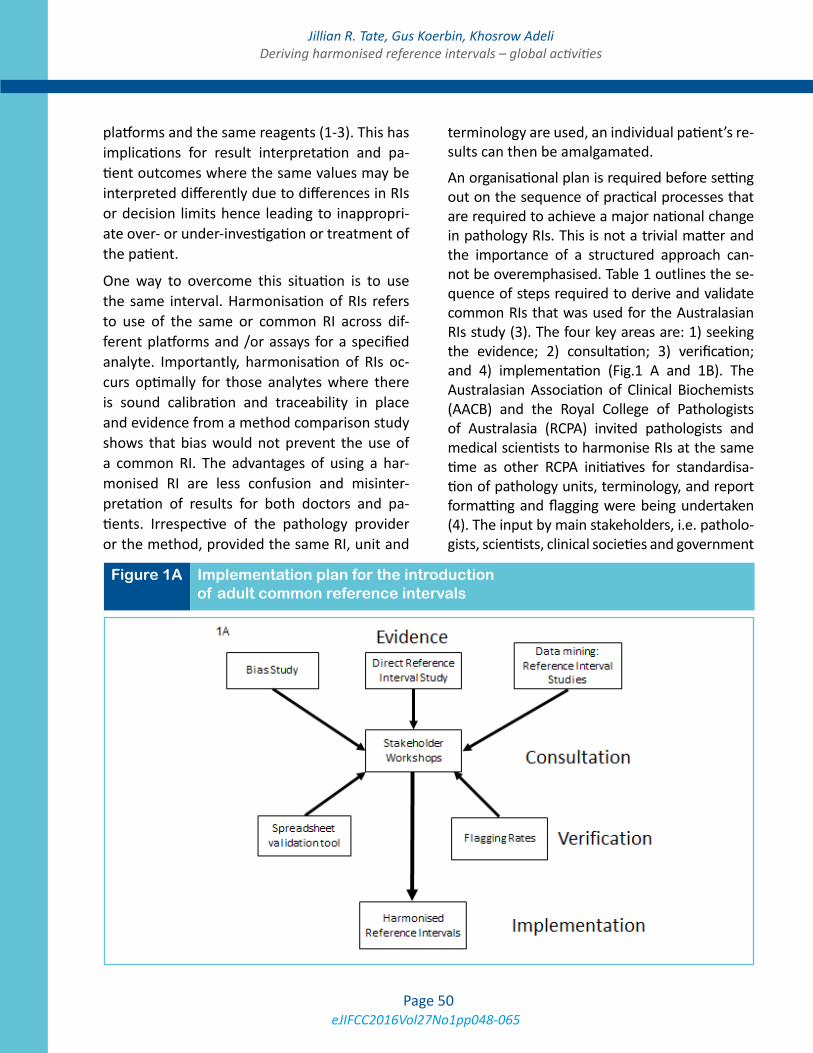
eJIFCC2016Vol27No1pp048-065Page 50
Jillian R. Tate, Gus Koerbin, Khosrow AdeliDeriving harmonised reference intervals – global activities
platforms and the same reagents (1-3). This has implications for result interpretation and pa-tient outcomes where the same values may be interpreted differently due to differences in RIs or decision limits hence leading to inappropri-ate over- or under-investigation or treatment of the patient.
One way to overcome this situation is to use the same interval. Harmonisation of RIs refers to use of the same or common RI across dif-ferent platforms and /or assays for a specified analyte. Importantly, harmonisation of RIs oc-curs optimally for those analytes where there is sound calibration and traceability in place and evidence from a method comparison study shows that bias would not prevent the use of a common RI. The advantages of using a har-monised RI are less confusion and misinter-pretation of results for both doctors and pa-tients. Irrespective of the pathology provider or the method, provided the same RI, unit and
terminology are used, an individual patient’s re-sults can then be amalgamated.
An organisational plan is required before setting out on the sequence of practical processes that are required to achieve a major national change in pathology RIs. This is not a trivial matter and the importance of a structured approach can-not be overemphasised. Table 1 outlines the se-quence of steps required to derive and validate common RIs that was used for the Australasian RIs study (3). The four key areas are: 1) seeking the evidence; 2) consultation; 3) verification; and 4) implementation (Fig.1 A and 1B). The Australasian Association of Clinical Biochemists (AACB) and the Royal College of Pathologists of Australasia (RCPA) invited pathologists and medical scientists to harmonise RIs at the same time as other RCPA initiatives for standardisa-tion of pathology units, terminology, and report formatting and flagging were being undertaken (4). The input by main stakeholders, i.e. patholo-gists, scientists, clinical societies and government
Figure 1A Implementation plan for the introduction of adult common reference intervals
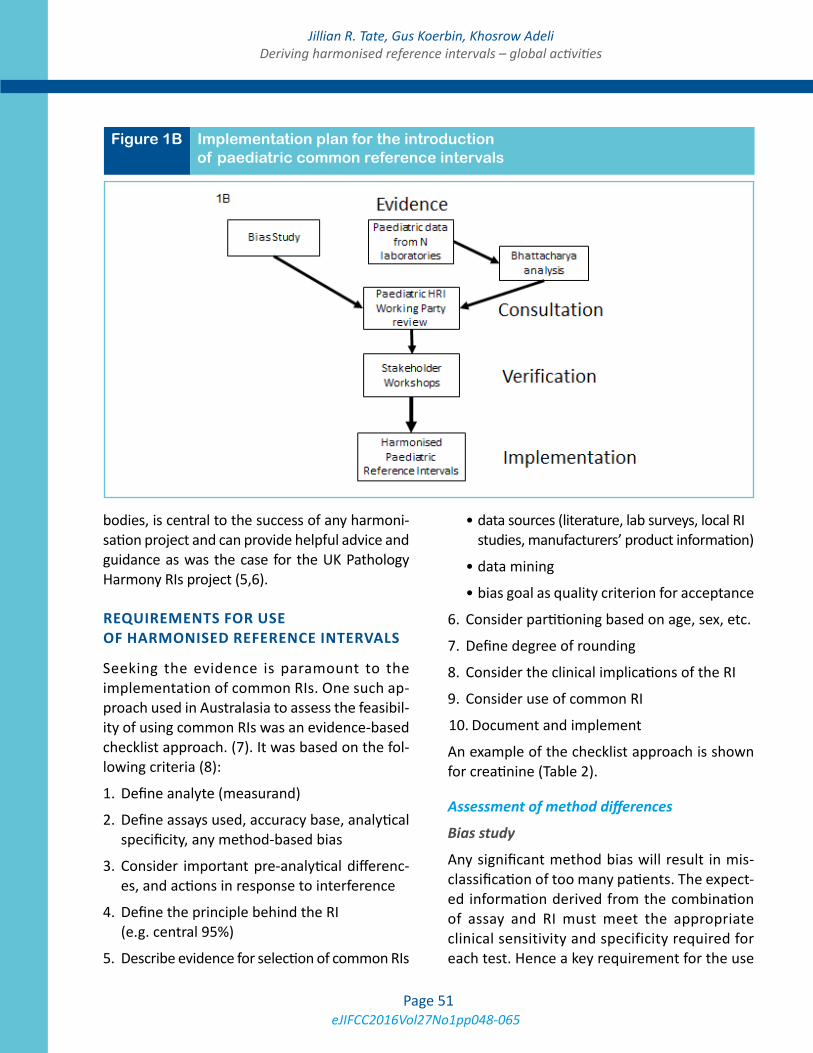
eJIFCC2016Vol27No1pp048-065Page 51
Jillian R. Tate, Gus Koerbin, Khosrow AdeliDeriving harmonised reference intervals – global activities
bodies, is central to the success of any harmoni-sation project and can provide helpful advice and guidance as was the case for the UK Pathology Harmony RIs project (5,6).
REQUIREMENTS FOR USE OF HARMONISED REFERENCE INTERVALS
Seeking the evidence is paramount to the implementation of common RIs. One such ap-proach used in Australasia to assess the feasibil-ity of using common RIs was an evidence-based checklist approach. (7). It was based on the fol-lowing criteria (8):
1. Define analyte (measurand)
2. Define assays used, accuracy base, analytical specificity, any method-based bias
3. Consider important pre-analytical differenc-es, and actions in response to interference
4. Define the principle behind the RI (e.g. central 95%)
5. Describe evidence for selection of common RIs
• data sources (literature, lab surveys, local RI studies, manufacturers’ product information)
• data mining
• bias goal as quality criterion for acceptance
6. Consider partitioning based on age, sex, etc.
7. Define degree of rounding
8. Consider the clinical implications of the RI
9. Consider use of common RI
10. Document and implement
An example of the checklist approach is shown for creatinine (Table 2).
Assessment of method differences
Bias study
Any significant method bias will result in mis-classification of too many patients. The expect-ed information derived from the combination of assay and RI must meet the appropriate clinical sensitivity and specificity required for each test. Hence a key requirement for the use
Figure 1B Implementation plan for the introduction of paediatric common reference intervals
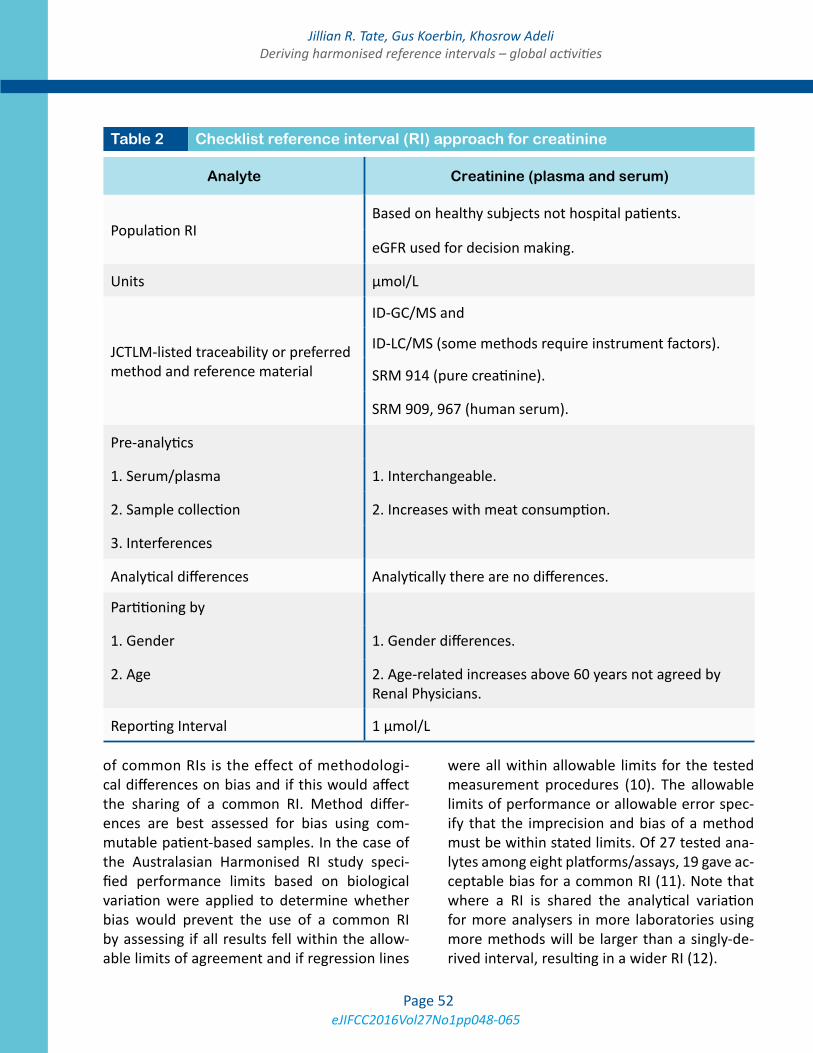
eJIFCC2016Vol27No1pp048-065Page 52
Jillian R. Tate, Gus Koerbin, Khosrow AdeliDeriving harmonised reference intervals – global activities
of common RIs is the effect of methodologi-cal differences on bias and if this would affect the sharing of a common RI. Method differ-ences are best assessed for bias using com-mutable patient-based samples. In the case of the Australasian Harmonised RI study speci-fied performance limits based on biological variation were applied to determine whether bias would prevent the use of a common RI by assessing if all results fell within the allow-able limits of agreement and if regression lines
were all within allowable limits for the tested measurement procedures (10). The allowable limits of performance or allowable error spec-ify that the imprecision and bias of a method must be within stated limits. Of 27 tested ana-lytes among eight platforms/assays, 19 gave ac-ceptable bias for a common RI (11). Note that where a RI is shared the analytical variation for more analysers in more laboratories using more methods will be larger than a singly-de-rived interval, resulting in a wider RI (12).
Analyte Creatinine (plasma and serum)
Population RIBased on healthy subjects not hospital patients.
eGFR used for decision making.
Units µmol/L
JCTLM-listed traceability or preferred method and reference material
ID-GC/MS and
ID-LC/MS (some methods require instrument factors).
SRM 914 (pure creatinine).
SRM 909, 967 (human serum).
Pre-analytics
1. Serum/plasma 1. Interchangeable.
2. Sample collection 2. Increases with meat consumption.
3. Interferences
Analytical differences Analytically there are no differences.
Partitioning by
1. Gender 1. Gender differences.
2. Age 2. Age-related increases above 60 years not agreed by Renal Physicians.
Reporting Interval 1 µmol/L
Table 2 Checklist reference interval (RI) approach for creatinine
eJIFCC2016Vol27No1pp048-065Page 53
Jillian R. Tate, Gus Koerbin, Khosrow AdeliDeriving harmonised reference intervals – global activities
Calibration traceability
An initial assessment of methodology and cali-bration traceability of laboratory assays to be used to establish the common RI is required. Laboratories need to assess the traceability claims made by manufacturers including the reference material and reference measurement procedures used to assign values to master calibrators from which product calibrators are traceable in routine assays. Preliminary infor-mation can be gathered from the manufactur-er, external quality assurance (EQA) programs and other published data. If a laboratory uses a method known to be biased compared with the method used to set the RI, a common RI cannot be used. Rather, for analytes with estab-lished traceability, traceable assays should be used to both set and to use the interval (13). Ideally, analytes should have a complete refer-ence measurement system or a reference mate-rial and/or a reference measurement procedure listed on the Joint Committee for Traceability in Laboratory Medicine (JCTLM) website (14).
Selection of reference intervals
Various sources of information on RIs should be searched including local formal RI studies, pub-lished studies from the literature, laboratory surveys, manufacturer’s product information, relevant guidelines, and mining of databases. Pre-analytical and partitioning issues, signifi-cant figures and flagging rates, which provide an indication of the clinical considerations of the RI, should also be assessed for each analyte.
Common laboratory usage
A survey of local laboratories ideally through the national EQA provider provides the op-portunity for laboratories to compare their RIs with those from other laboratories using the same and different methods. By linking RIs to results from measurements on commutable samples, it is also possible to see the effect of
the intervals on between-laboratory differenc-es. For the majority of common chemistry ana-lytes the between-laboratory variation in RIs is usually greater than the variation in results (15). These types of data can be used to support the use of common RIs for many analytes.
Published studies
The Nordic Reference Interval Project (NORIP) established common RIs in apparently healthy adult populations from five Nordic countries for 25 of the most common clinical chemistry analytes (16). Results were traceable to higher-order reference measurement systems. More recently Nordic paediatric RIs have been deter-mined for 21 common biochemistry analytes and intervals were suggested for combined age groups (17). In the United Kingdom, reference limits have been established by a survey of RIs in use followed by an assessment of analytical variability, any age and sex related variation, or other variances in populations where these were seen as relevant to the analyte (5,6). The aim was to remove unnecessary variation that was demonstrated to lack scientific validity pri-or to taking on new work to formally validate the consensus RIs (6).
Global formal reference interval studies
The CALIPER Initiative
The Canadian Laboratory Initiative on Pediatric Reference Intervals (CALIPER) (18) was estab-lished by a Canadian team of investigators to develop a new database of biomarker refer-ence values (stratified by age, sex and ethnic-ity) determined from a large, healthy popula-tion of community children and adolescents. The CALIPER project was initiated as a result of several detailed gap analyses evaluating the availability of pediatric RIs in four clinical sub-specialties: bone markers (19), risk markers for cardiovascular disease and metabolic syndrome (19,20), hormones of the thyroid and growth
eJIFCC2016Vol27No1pp048-065Page 54
Jillian R. Tate, Gus Koerbin, Khosrow AdeliDeriving harmonised reference intervals – global activities
hormone axes (21), and markers of inborn er-rors of metabolism (22). These analyses re-vealed major gaps in data available to clinical laboratories and paediatricians and highlighted the critical need for new initiatives. Since its inception in 2009, the CALIPER program has made considerable strides in establishing and publishing a new RI database for biochemical markers (23-33), however, the reference values were initially established on a single analytical system, the Abbott Architect assay system. To address this limitation, a series of transference studies (34-37) have recently been completed by the CALIPER program, allowing transference of paediatric reference values from the Abbott database to four other major analytical systems including Beckman, Ortho, Roche, and Siemens. Additional transference studies are in progress to complete transference of the entire CALIPER RI database to all major chemistry assay systems allowing widespread application of CALIPER ref-erence standards in clinical laboratories world-wide using any one of the five major biochemi-cal assay systems.
Canadian Health Measures Survey (CHMS)
The Canadian Health Measures Survey (CHMS) is the most comprehensive, direct health mea-sures survey ever conducted in Canada. The study was launched in 2007 by Statistics Canada, in partnership with Health Canada and the Public Health Agency of Canada, to collect pop-ulation-representative health information from Canadians aged 3-79 years. An initial household interview collected information about general health including nutrition, smoking habits, al-cohol use, medical history, physical activity, and socioeconomic variables. Respondents then vis-ited a mobile examination centre, where direct physical measures of health were taken, such as height, weight and blood pressure, and blood specimens were collected and analysed for bio-markers of health and disease (25). Individuals
were selected in a systematic manner to be rep-resentative of 96.3% of the Canadian population. Data from CHMS samples were then weighted to ensure that the study population was truly representative of age, geographical distribu-tion and ethnic origin of the Canadian popula-tion. In a recent collaboration between CALIPER and CHMS, laboratory data from approximate-ly 12000 Canadian children and adults were used to establish a comprehensive database of paediatric and adult reference intervals for 24 chemistry (38), 13 endocrine/special chemistry (39), and 16 haematology markers (40). These reference intervals provide a valuable descrip-tion of the changes in key biochemical param-eters within the Canadian population. The use of common patient selection, pre-analytical, analytical and post-analytical methods allowed for assessment of fluctuations in ‘normal’ levels over time and prevalence of disease risk factors. Together, these studies provide a comprehen-sive description of the changes in important biomarkers within the Canadian population throughout the course of a lifetime, from child-hood to adulthood to geriatrics.
The CALIPER and CHMS initiatives also provide a unique opportunity to strive towards establish-ment of common RIs across Canada. A taskforce has recently been developed by the Canadian Society of Clinical Chemists and discussions have begun among a number of opinion leaders across the country to assess the feasibility of es-tablishing common reference values using the CALIPER and CHMS databases as the basis. The Canadian common reference interval initiative is also examining the potential development of platform-specific common reference values for each of the major analytical systems. This may be a more practical approach especially for the majority of analytes that are not standardised based on primary reference method and not traceable to a primary or secondary reference material.
eJIFCC2016Vol27No1pp048-065Page 55
Jillian R. Tate, Gus Koerbin, Khosrow AdeliDeriving harmonised reference intervals – global activities
Asian Studies
Although not attempting to define population reference intervals, Ichihara et al. (41) found unexpectedly large variations between the re-sults obtained from samples sourced from 6 Asian cities (Hong Kong, Shanghai, Seoul, Kuala Lumpur, Taipei and Tokyo) for the 13 analytes tested suggesting that harmonised RIs would be difficult between these countries that these cit-ies represent .
In contrast to the study by Ichihara, a Japanese multicentre study by Yamamoto et al. (42) in-volving 105 laboratories across Japan and using 4 different chemistry platforms demonstrated no regional differences and concluded that the RIs established in this study were also suitable for adoption nationwide (Table 3).
Turkish Study: Similar to the Japanese study, a multi-centre study by Ozarda et al. (43) de-termining RIs for 25 commonly tested analyt-es showed similar results between the seven Turkish geographical regions in 28 laboratories where the samples were sourced. They con-cluded that the intervals determined by this study using the same Architect 8000 analysers were suitable for use in all Turkish clinical chem-istry laboratories that used the same platforms (Table 3).
Australian Study
The Aussie Normals study was a formal refer-ence interval study of 1876 male and female healthy adult Australians in the age group 18 to 95 years (44). Up to 91 biochemistry analytes were measured by Abbott Architect analysers. Partitioning was done according to the effects of gender, age and body mass index (BMI) on these RIs. For the most part these differences were statistically small such as for lactate dehy-drogenase and phosphate where they were less than day to day biological variation. As shown in Table 3, reference intervals for the Aussie
Normals formal RI study were in general simi-lar to those for the Australasian common RIs study although somewhat tighter as they were determined using one platform only. However, γ-glutamyltransferase (GGT) upper reference limits were notably higher in the Aussie Normals study which demonstrated BMI differences with increasing age in men and women (44). For the 18-<45y age group and BMI <25 kg/m2, GGT was 12-37 U/L for men and 9-38 U/L for women. However, it is difficult to adopt RIs in association with BMI at this stage as this param-eter is not routinely provided to the laboratory.
Data mining
Expert groups can provide RI information through their data mining of millions of data points from primary care patients. This method has advantages over the direct RI validation pro-cess by providing large amounts of data on the local population being tested and reflects the actual analytical and pre-analytical conditions for the tested population. This approach is valid only if there is a majority of results from the primary care population such that the healthy distribution of values can be clearly identified in the midst of a smaller number of non-healthy values. Bhattacharya analysis to determine un-derlying distributions in the presence of outli-er results can be used to assess proposed RIs. For example, in Australasia data mining of over 200,000 paediatric data points provided by 15 laboratories for the main general chemistry an-alytes from birth to 18 years of age was used for establishing partitioned paediatric RIs (3).
Final selection of the common reference interval
One approach to the setting of a common RI that was used in Australasia is described as fol-lows. The starting point to develop a common RI was to do a national survey of laboratory RIs and determine the predominant RI in use. Then
eJIFCC2016Vol27No1pp048-065Page 56
Jillian R. Tate, Gus Koerbin, Khosrow AdeliDeriving harmonised reference intervals – global activities
a method comparison study across the major chemistry platforms using commutable samples from healthy subjects was used to assess if bias would prevent use of a common RI with accept-ability based on the specified allowable limits of performance such as those based on biological variation for example (11). For analytes where bias may prevent use of a common RI for one or two main platforms, it may be possible for other platforms to share a common RI, e.g. lactate de-hydrogenase methods that use pyruvate to lac-tate [P to L] rather than the IFCC-recommended [L to P] method cannot be combined.
The next step involves gathering supportive date for the proposed common RI using data from formal local RI studies, if available, and from data mining. In Australia values from the Aussie Normals adult RI study were used to con-firm the common RIs recommended for use in Australia and New Zealand (44). Note that ref-erence intervals are wider for the common RIs that have been established for eight platforms compared with those obtained using the one platform; inclusion of between-method varia-tion results in wider intervals than for a singly-derived RI (Table 3). Further mining of hun-dreds of thousands of data points from primary care patients who are relatively healthy was then employed to show the biochemical physi-ology from childhood to adulthood through to geriatric age, according to age and gender (45). In order to compare partitioning according to the continuous variables of age and pregnancy, and whether merged or separate partitions will affect clinical outcomes, there must be an un-derstanding of the physiological processes af-fecting an analyte. Without the knowledge of clinical outcomes and their association with partitioned RIs, the lesser approaches of clini-cal opinion, statistics or laboratory consensus are used to determine the suitability of parti-tioning (45).
Once RIs are agreed upon, the proposed ref-erence limits should be supported by flagging rates which provide an indication of the clini-cal considerations of the RI. Excess flagging of results can lead to inappropriate testing due to decreased specificity of the RI. Horowitz sug-gests that laboratories should be mindful of ex-cess partitioning which is due to minor changes in physiology not to pathology (46). Hence lo-cal laboratories should assess flagging rates to determine if a change to historical RIs will create higher flag rates. For example, the pre-analytical effect of delayed sample transport would impact on potassium levels and hence for pragmatic reasons laboratories may choose to have a higher upper reference limit (URL) of 5.5 mmol/L rather than 5.2 mmol/L (Fig. 2A) (3).
Final agreement by a majority of stakeholders is required to support the selected common RI and a laboratory’s intention to implement it, as described in the next section. The consensus process for deriving common RIs is not perfect and there are limitations. As noted above, inter-vals are usually wider than for singly-derived RIs obtained on the same platform, pre-analytical issues can cause elevated flagging rates, and elevated BMI in the population is not factored into clinical interpretation by the routine labo-ratory of GGT for example. Traceable analytes with JCTLM-listed reference materials and ref-erence measurement procedures are more likely to share common RIs. However, countries may not be using IFCC recommended methods for enzymes as is the case in Australia where non-pyridoxal-5’-phosphate (P5P) AST and ALT methods are predominantly in use (Table 3). A harmonised RI with non-P5P methods is better than no harmonised RI and a future goal is for Australian laboratories to use P5P methods for AST and ALT.
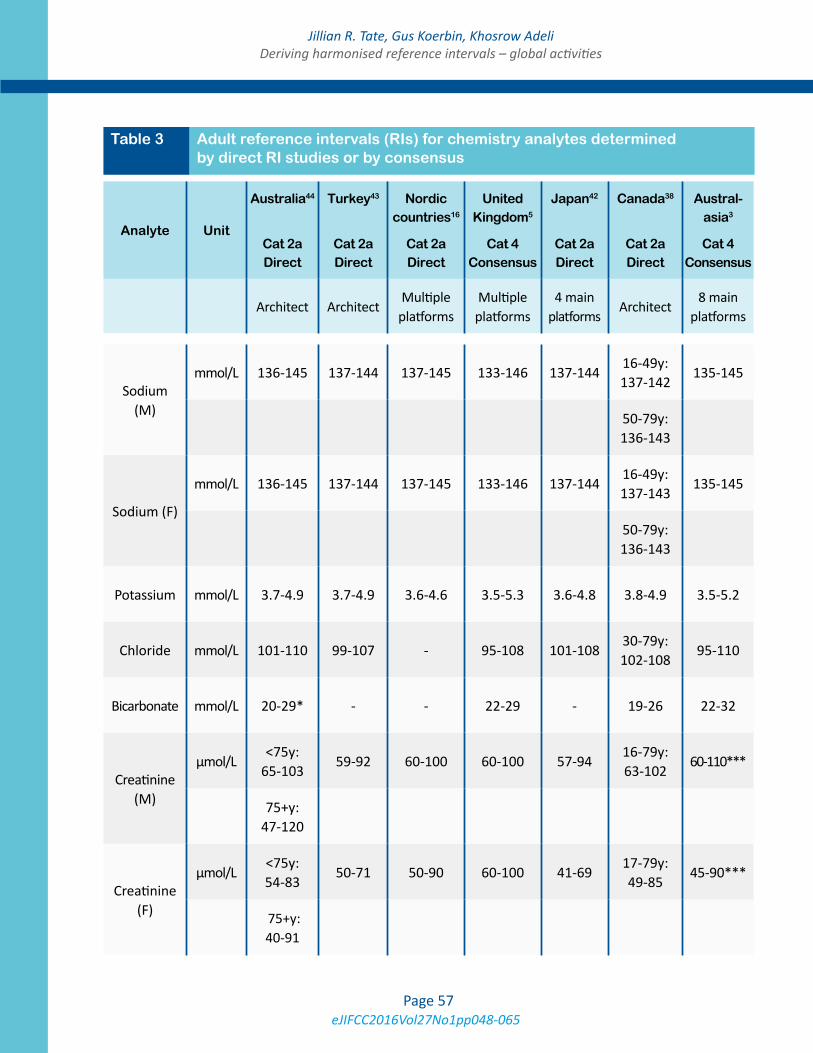
eJIFCC2016Vol27No1pp048-065Page 57
Jillian R. Tate, Gus Koerbin, Khosrow AdeliDeriving harmonised reference intervals – global activities
Analyte Unit
Australia44
Cat 2a Direct
Turkey43
Cat 2a Direct
Nordic countries16
Cat 2a Direct
United Kingdom5
Cat 4 Consensus
Japan42
Cat 2a Direct
Canada38
Cat 2a Direct
Austral-asia3
Cat 4 Consensus
Architect ArchitectMultiple
platformsMultiple
platforms4 main
platformsArchitect
8 main platforms
Sodium (M)
mmol/L 136-145 137-144 137-145 133-146 137-14416-49y: 137-142
135-145
50-79y: 136-143
Sodium (F)
mmol/L 136-145 137-144 137-145 133-146 137-14416-49y: 137-143
135-145
50-79y: 136-143
Potassium mmol/L 3.7-4.9 3.7-4.9 3.6-4.6 3.5-5.3 3.6-4.8 3.8-4.9 3.5-5.2
Chloride mmol/L 101-110 99-107 - 95-108 101-10830-79y: 102-108
95-110
Bicarbonate mmol/L 20-29* - - 22-29 - 19-26 22-32
Creatinine (M)
µmol/L<75y:
65-10359-92 60-100 60-100 57-94
16-79y: 63-102
60-110***
75+y: 47-120
Creatinine (F)
µmol/L<75y: 54-83
50-71 50-90 60-100 41-6917-79y: 49-85
45-90***
75+y: 40-91
Table 3 Adult reference intervals (RIs) for chemistry analytes determined by direct RI studies or by consensus
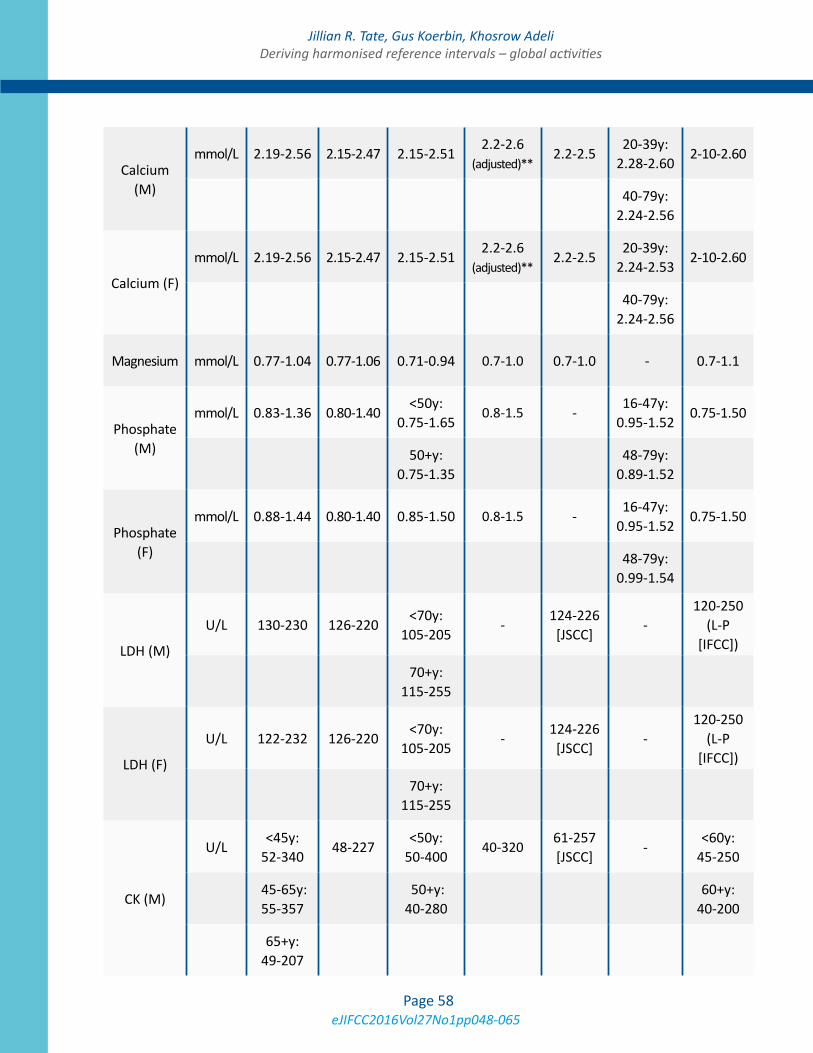
eJIFCC2016Vol27No1pp048-065Page 58
Jillian R. Tate, Gus Koerbin, Khosrow AdeliDeriving harmonised reference intervals – global activities
Calcium (M)
mmol/L 2.19-2.56 2.15-2.47 2.15-2.512.2-2.6
(adjusted)**2.2-2.5
20-39y: 2.28-2.60
2-10-2.60
40-79y:
2.24-2.56
Calcium (F)
mmol/L 2.19-2.56 2.15-2.47 2.15-2.512.2-2.6
(adjusted)**2.2-2.5
20-39y: 2.24-2.53
2-10-2.60
40-79y:
2.24-2.56
Magnesium mmol/L 0.77-1.04 0.77-1.06 0.71-0.94 0.7-1.0 0.7-1.0 - 0.7-1.1
Phosphate (M)
mmol/L 0.83-1.36 0.80-1.40<50y:
0.75-1.650.8-1.5 -
16-47y: 0.95-1.52
0.75-1.50
50+y:
0.75-1.35
48-79y: 0.89-1.52
Phosphate (F)
mmol/L 0.88-1.44 0.80-1.40 0.85-1.50 0.8-1.5 -16-47y:
0.95-1.520.75-1.50
48-79y:
0.99-1.54
LDH (M)
U/L 130-230 126-220<70y:
105-205-
124-226 [JSCC]
-120-250
(L-P [IFCC])
70+y:
115-255
LDH (F)
U/L 122-232 126-220<70y:
105-205-
124-226 [JSCC]
-120-250
(L-P [IFCC])
70+y:
115-255
CK (M)
U/L<45y:
52-34048-227
<50y: 50-400
40-320 61-257 [JSCC]
-<60y:
45-250
45-65y: 55-357
50+y: 40-280
60+y:
40-200
65+y: 49-207
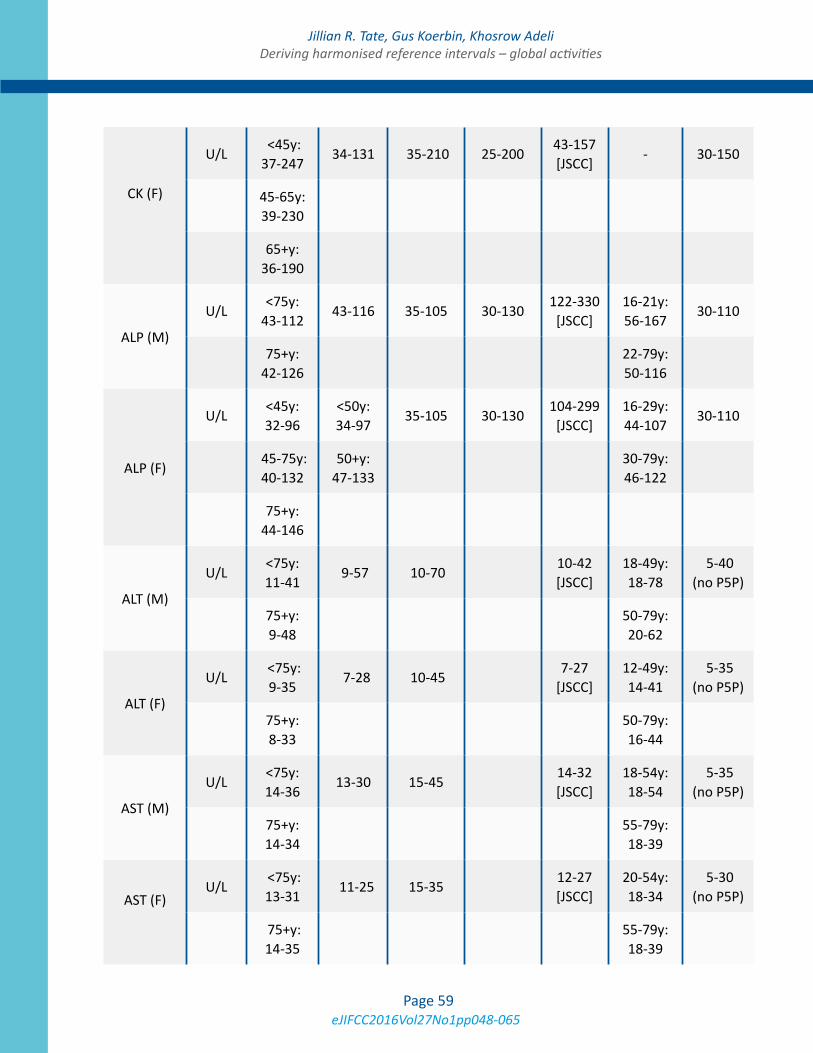
eJIFCC2016Vol27No1pp048-065Page 59
Jillian R. Tate, Gus Koerbin, Khosrow AdeliDeriving harmonised reference intervals – global activities
CK (F)
U/L <45y: 37-247
34-131 35-210 25-20043-157 [JSCC]
- 30-150
45-65y: 39-230
65+y: 36-190
ALP (M)
U/L<75y:
43-11243-116 35-105 30-130
122-330 [JSCC]
16-21y: 56-167
30-110
75+y: 42-126
22-79y: 50-116
ALP (F)
U/L<45y: 32-96
<50y: 34-97
35-105 30-130 104-299 [JSCC]
16-29y: 44-107
30-110
45-75y: 40-132
50+y: 47-133
30-79y: 46-122
75+y: 44-146
ALT (M)
U/L<75y: 11-41
9-57 10-70 10-42 [JSCC]
18-49y: 18-78
5-40 (no P5P)
75+y: 9-48
50-79y: 20-62
ALT (F)
U/L <75y: 9-35
7-28 10-45 7-27
[JSCC]12-49y: 14-41
5-35 (no P5P)
75+y: 8-33
50-79y: 16-44
AST (M)
U/L<75y: 14-36
13-30 15-45 14-32 [JSCC]
18-54y: 18-54
5-35 (no P5P)
75+y: 14-34
55-79y: 18-39
AST (F)
U/L <75y: 13-31
11-25 15-35 12-27 [JSCC]
20-54y: 18-34
5-30 (no P5P)
75+y: 14-35
55-79y: 18-39
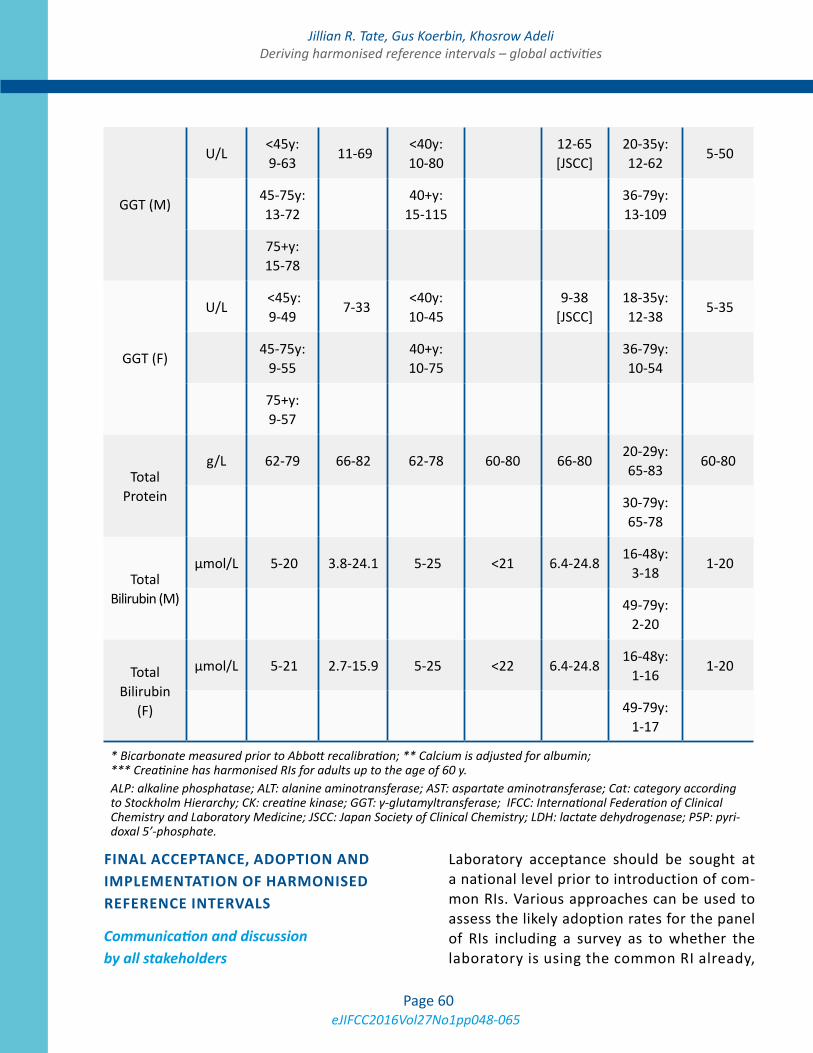
eJIFCC2016Vol27No1pp048-065Page 60
Jillian R. Tate, Gus Koerbin, Khosrow AdeliDeriving harmonised reference intervals – global activities
GGT (M)
U/L<45y: 9-63
11-69 <40y: 10-80
12-65 [JSCC]
20-35y: 12-62
5-50
45-75y: 13-72
40+y:
15-115
36-79y: 13-109
75+y: 15-78
GGT (F)
U/L <45y: 9-49
7-33 <40y: 10-45
9-38
[JSCC]18-35y: 12-38
5-35
45-75y: 9-55
40+y: 10-75
36-79y: 10-54
75+y: 9-57
Total Protein
g/L 62-79 66-82 62-78 60-80 66-8020-29y: 65-83
60-80
30-79y: 65-78
Total Bilirubin (M)
µmol/L 5-20 3.8-24.1 5-25 <21 6.4-24.816-48y:
3-18 1-20
49-79y:
2-20
Total Bilirubin
(F)
µmol/L 5-21 2.7-15.9 5-25 <22 6.4-24.816-48y:
1-16 1-20
49-79y: 1-17
* Bicarbonate measured prior to Abbott recalibration; ** Calcium is adjusted for albumin; *** Creatinine has harmonised RIs for adults up to the age of 60 y.ALP: alkaline phosphatase; ALT: alanine aminotransferase; AST: aspartate aminotransferase; Cat: category according to Stockholm Hierarchy; CK: creatine kinase; GGT: γ-glutamyltransferase; IFCC: International Federation of Clinical Chemistry and Laboratory Medicine; JSCC: Japan Society of Clinical Chemistry; LDH: lactate dehydrogenase; P5P: pyri-doxal 5’-phosphate.
FINAL ACCEPTANCE, ADOPTION AND IMPLEMENTATION OF HARMONISED REFERENCE INTERVALS
Communication and discussion by all stakeholders
Laboratory acceptance should be sought at a national level prior to introduction of com-mon RIs. Various approaches can be used to assess the likely adoption rates for the panel of RIs including a survey as to whether the laboratory is using the common RI already,
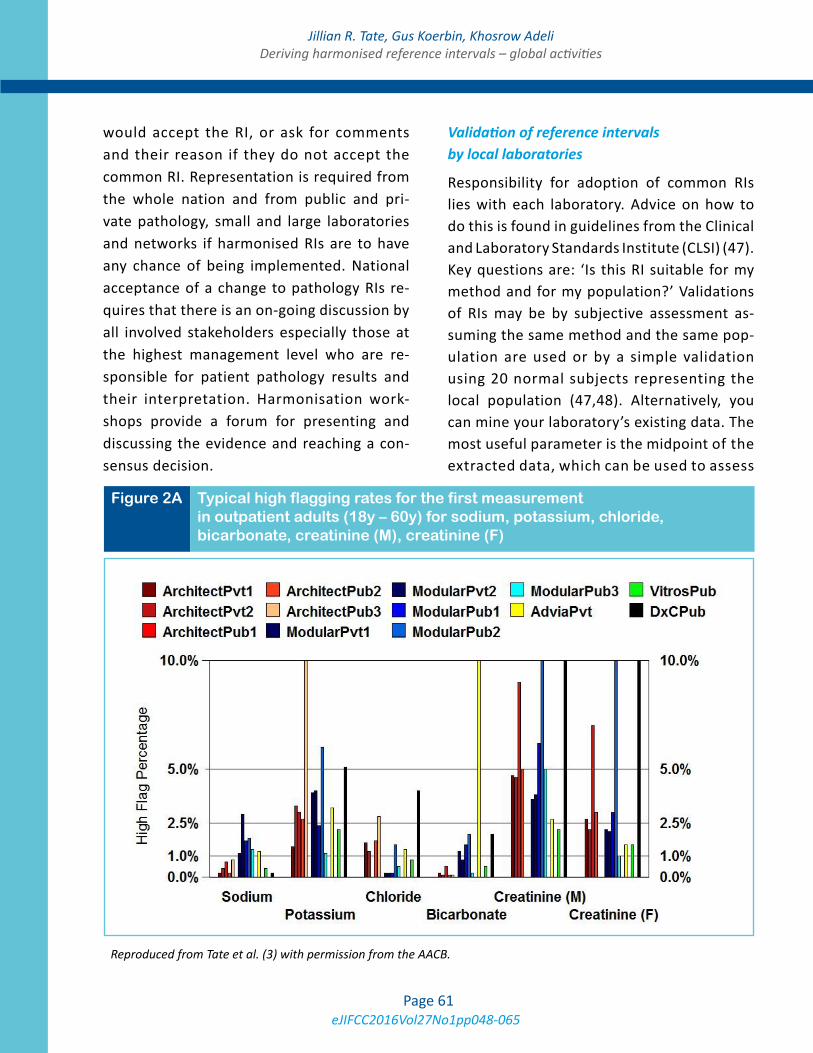
eJIFCC2016Vol27No1pp048-065Page 61
Jillian R. Tate, Gus Koerbin, Khosrow AdeliDeriving harmonised reference intervals – global activities
would accept the RI, or ask for comments and their reason if they do not accept the common RI. Representation is required from the whole nation and from public and pri-vate pathology, small and large laboratories and networks if harmonised RIs are to have any chance of being implemented. National acceptance of a change to pathology RIs re-quires that there is an on-going discussion by all involved stakeholders especially those at the highest management level who are re-sponsible for patient pathology results and their interpretation. Harmonisation work-shops provide a forum for presenting and discussing the evidence and reaching a con-sensus decision.
Validation of reference intervals by local laboratories
Responsibility for adoption of common RIs lies with each laboratory. Advice on how to do this is found in guidelines from the Clinical and Laboratory Standards Institute (CLSI) (47). Key questions are: ‘Is this RI suitable for my method and for my population?’ Validations of RIs may be by subjective assessment as-suming the same method and the same pop-ulation are used or by a simple validation using 20 normal subjects representing the local population (47,48). Alternatively, you can mine your laboratory’s existing data. The most useful parameter is the midpoint of the extracted data, which can be used to assess
Figure 2A Typical high flagging rates for the first measurement in outpatient adults (18y – 60y) for sodium, potassium, chloride, bicarbonate, creatinine (M), creatinine (F)
Reproduced from Tate et al. (3) with permission from the AACB.
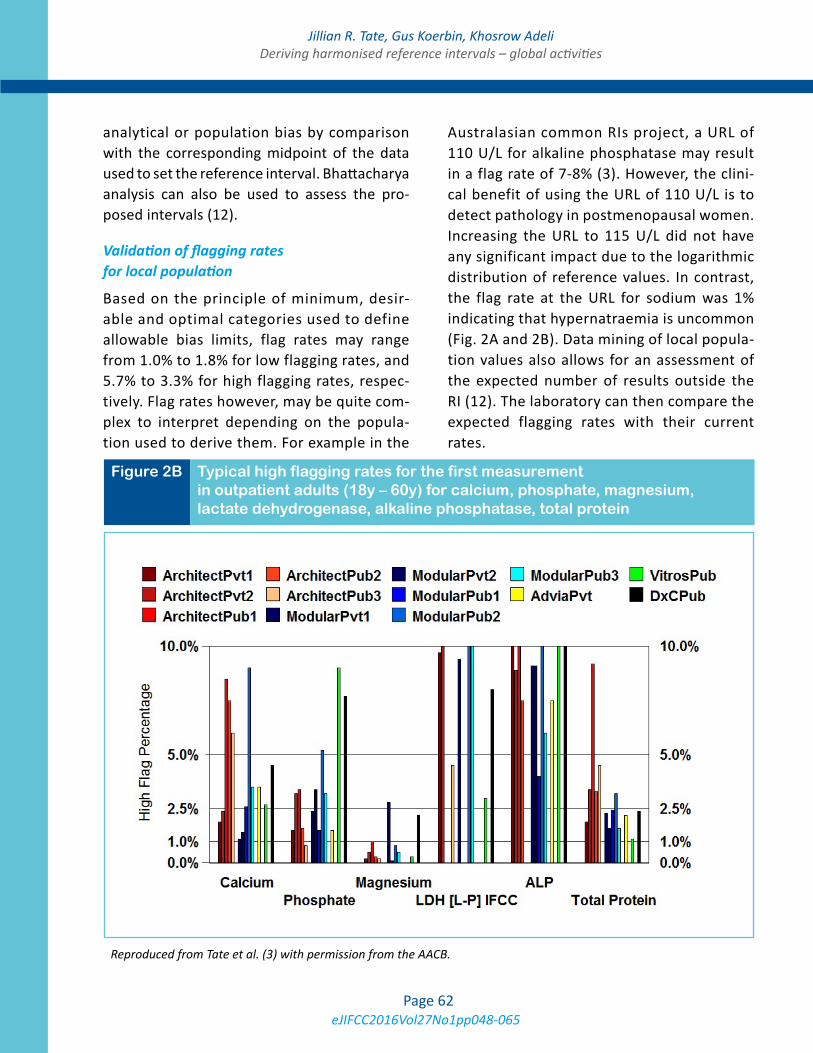
eJIFCC2016Vol27No1pp048-065Page 62
Jillian R. Tate, Gus Koerbin, Khosrow AdeliDeriving harmonised reference intervals – global activities
analytical or population bias by comparison with the corresponding midpoint of the data used to set the reference interval. Bhattacharya analysis can also be used to assess the pro-posed intervals (12).
Validation of flagging rates for local population
Based on the principle of minimum, desir-able and optimal categories used to define allowable bias limits, flag rates may range from 1.0% to 1.8% for low flagging rates, and 5.7% to 3.3% for high flagging rates, respec-tively. Flag rates however, may be quite com-plex to interpret depending on the popula-tion used to derive them. For example in the
Australasian common RIs project, a URL of 110 U/L for alkaline phosphatase may result in a flag rate of 7-8% (3). However, the clini-cal benefit of using the URL of 110 U/L is to detect pathology in postmenopausal women. Increasing the URL to 115 U/L did not have any significant impact due to the logarithmic distribution of reference values. In contrast, the flag rate at the URL for sodium was 1% indicating that hypernatraemia is uncommon (Fig. 2A and 2B). Data mining of local popula-tion values also allows for an assessment of the expected number of results outside the RI (12). The laboratory can then compare the expected flagging rates with their current rates.
Figure 2B Typical high flagging rates for the first measurement in outpatient adults (18y – 60y) for calcium, phosphate, magnesium, lactate dehydrogenase, alkaline phosphatase, total protein
Reproduced from Tate et al. (3) with permission from the AACB.
eJIFCC2016Vol27No1pp048-065Page 63
Jillian R. Tate, Gus Koerbin, Khosrow AdeliDeriving harmonised reference intervals – global activities
CLOSING THE HARMONISED REFERENCE INTERVAL LOOP
Following the endorsement of common RIs by pathologists and scientists, formal endorse-ment by the profession is sought from the National Pathology College and National Clinical Chemistry, Biochemistry or Laboratory Medicine Society. Support by the National Testing Authorities for Laboratory Medicine, who should be included in meetings on harmonisation, is via formal recommendations to laboratories that they use these intervals, or if not, to provide supporting evidence for other references.
Continuing work is required to produce and validate common RIs, to manage ongoing is-sues, e.g. problems with implementation of RIs by the local laboratory Information Technology unit into the Laboratory Information System. These issues may be changes to reporting units, significant figures, rounding, report formatting, etc. Consultation with clinical societies and ed-ucation of local clinicians are imperative if the new RIs are to be used. Other flow-on effects can be those regarding the reimbursement of pharmaceutical benefits according to national government benefit schemes that use specific RIs or decision limit values when assessing the provision of a treatment drug.
The level of uptake of common RIs can be read-ily surveyed through EQA programs. One such scheme that also surveys the bias of methods within the reference interval measuring range by using commutable samples from healthy subjects is the RCPA Quality Assurance Program Liquid Serum Chemistry program (15). The scheme al-lows assessment of the between-laboratory vari-ation in results, RIs and the information transmit-ted by the combination of these factors. For most common chemistry analytes, use of common RIs has improved the variation seen in the informa-tion produced by different laboratories.
CONCLUSION
Consideration should be given by laboratories to adopting RIs consistent with those used by other laboratories in the region where it is pos-sible and appropriate for the local population. These may be common RIs for use across sev-eral major platforms in the region, e.g. United Kingdom, Nordic countries, Japan, Australasia, or for use with one specific platform, e.g. Canada, Asia, Turkey. Scientific evidence sup-ports the use of common RIs for many gen-eral chemistry analytes especially those with sound calibration and traceability in place. For other non-harmonised immunoassay analytes where either there is currently no secondary reference material or reference measurement procedure for value assignment, it seems logi-cal to use platform-specific RIs and decision limits across regions, provided that labora-tories have acceptable assay precision, until such time when methods become harmonised internationally.
REFERENCES
1. Zardo L, Secchiero S, Sciacovelli L, Bonvinci P, Plebani M. Reference intervals: are interlaboratory differences appropriate? Clin Chem Lab Med 1999;37:1131-3.
2. Jones GR, Barker A, Tate J, Lim C-F, Robertson K. The case for common reference intervals. Clin Biochem Rev 2004;25:99-104.
3. Tate JR, Sikaris KA, Jones GRD, Yen T, Koerbin G, Ryan J, et al. on behalf of the AACB Committee for Common Ref-erence Intervals. Harmonising adult and paediatric refer-ence intervals in Australia and New Zealand: an evidence-based approach for establishing a first panel of chemistry analytes. Clin Biochem Rev 2014;35:213-35.
4. Australian Pathology Units AND Terminology (APUTS) Standards and Guidelines (v2.2). http://www.rcpa.edu.au/Library/Practising-Pathology/PTIS/APUTS-Downloads (Accessed 5 November, 2015).
5. Berg J, Lane V. Pathology Harmony; a pragmatic and scientific approach to unfounded variation in the clinical laboratory. Ann Clin Biochem 2011;48:195-7.
6. Berg J. The UK Pathology Harmony initiative; the foun-dation of a global model. Clin Chim Acta 2014;432:22-6.
eJIFCC2016Vol27No1pp048-065Page 64
Jillian R. Tate, Gus Koerbin, Khosrow AdeliDeriving harmonised reference intervals – global activities
7. Koerbin G, Sikaris KA, Jones GRD, Ryan J, Reed M, Tate J, On behalf of the AACB Committee for Common Refer-ence Intervals. Evidence-based approach to harmonised reference intervals. Clin Chim Acta 2014,432:99-107.
8. Jones GD, Barker T. Reference intervals. Clin Biochem Rev 2008;29 Suppl:S93-7.
9. KDIGO 2012 Clinical Practice Guideline for the Evalu-ation and Management of Chronic Kidney Disease. Chapter 1. Kidney Int Suppl 2013;3:19-62. Available at: http://www.kdigo.org/clinical_practice_guidelines/pdf/CKD/KDIGO_2012_CKD_GL.pdf (Accessed on 5 Novem-ber, 2015).
10. Jones GR, Sikaris K, Gill J. Allowable Limits of Per-formance for External Quality Assurance Programs - an approach to application of the Stockholm criteria by the RCPA Quality Assurance Programs. Clin Biochem Rev 2012;33:133-9.
11. Koerbin G, Tate JR, Ryan J, Jones GRD, Sikaris KA, Kanowski D, et al. Bias assessment of general chemistry analytes using commutable samples. Clin Biochem Rev 2014;35:203-11.
12. Jones GRD. Validating common reference intervals in routine laboratories. Clin Chim Acta 2014;432:119-21.
13. Panteghini M, Ceriotti F. Obtaining reference intervals traceable to reference measurement systems: is it pos-sible, who is responsible, what is the strategy? Clin Chem Lab Med 2012;50:813-7.
14. JCTLM: Joint Committee for Traceability in Laboratory Medicine. Available at: http://www.bipm.org/jctlm (Ac-cessed on 5 November, 2015).
15. Jones GRD, Koetsier SDA. RCPAQAP first combined measurement and reference interval survey. Clin Bio-chem Rev 2014;35:243-50.
16. Rustad P, Felding P, Franzson L, Kairisto V, Lahti A, Mårtensson A, et al. The Nordic Reference Interval Proj-ect 2000: recommended reference intervals for 25 com-mon biochemical properties. Scand J Clin Lab Invest 2004;64:271-84.
17. Hilsted L, Rustad P, Aksglaede L, Sorensen K, Juul A. Recommended Nordic paediatric reference intervals for 21 common biochemical properties. Scand J Clin Lab In-vest 2013;73:1-9.
18. Adeli K. Closing the gaps in pediatric reference inter-vals: The CALIPER initiative. Clin Biochem 2011;44:480-2.
19. Mansoub S, Chan MK, Adeli K. Gap analysis of pedi-atric reference intervals for risk biomarkers of cardiovas-cular disease and the metabolic syndrome. Clin Biochem 2006;39:569-87.
20. Davis GK, Bamforth F, Sarpal A, Dicke F, Rabi Y, Lyon ME. B-type natriuretic peptide in pediatrics. Clin Biochem 2006;39:600-5.
21. Delvin EE, Laxmi G, V, Vergee Z. Gap analysis of pedi-atric reference intervals related to thyroid hormones and the growth hormone-insulin growth factor axis. Clin Bio-chem 2006;39:588-94.
22. Lepage N, Li D, Kavsak PA, Bamforth F, Callahan J, Dooley K, Potter M. Incomplete pediatric reference inter-vals for the management of patients with inborn errors of metabolism. Clin Biochem 2006;39:595-9.
23. Colantonio DA, Kyriakopoulou L, Chan MK, Daly CH, Brinc D, Venner AA, et al. Closing the gaps in pediatric laboratory reference intervals: a CALIPER database of 40 biochemical markers in a healthy and multiethnic popula-tion of children. Clin Chem 2012;58:854-68.
24. Bailey D, Colantonio D, Kyriakopoulou L, Cohen AH, Chan MK, Armbruster D, Adeli K. Marked biological vari-ance in endocrine and biochemical markers in childhood: Establishment of pediatric reference intervals using healthy community children from the CALIPER cohort. Clin Chem 2013;59:1393-405.
25. Konforte D, Shea JL, Kyriakopoulou L, Colantonio D, Cohen AH, Shaw J, et al. Complex biological pattern of fertility hormones in children and adolescents: A study of healthy children from the CALIPER cohort and es-tablishment of pediatric reference intervals. Clin Chem 2013;59:1215-27.
26. Bevilacqua V, Chan MK, Chen Y, Armbruster D, Scho-din B, Adeli K. Pediatric population reference value dis-tributions for cancer biomarkers and covariate-stratified reference intervals in the CALIPER cohort Clin Chem 2014;60:1532-42.
27. Raizman JE, Cohen AH, Teodoro-Morrison T, Wan B, Khun-Chen M, Wilkenson C, et al. Pediatric reference value distributions for vitamins A and E in the CALIPER cohort and establishment of age-stratified reference in-tervals. Clin Biochem 2014;47:812-15.
28. Bailey D, Bevilacqua V, Colantonio DA, Pasic MD, Pe-rumal N, Chan MK, Adeli K. Pediatric within-day biologi-cal variation and quality specifications for 38 biochemical markers in the CALIPER cohort. Clin Chem 2013;60:518-29.
29. Shaw JL, Cohen A, Konforte D, Binesh-Marvasti T, Colantonio DA, Adeli K. Validity of establishing pediat-ric reference intervals based on hospital patient data: A comparison of the modified Hoffmann approach to CALI-PER reference intervals obtained in healthy children. Clin Biochem 2014;47:166-72.
30. Kyriakopoulou L, Yazdanpanah M, Colantonio DA, Chan MK, Daly CH, Adeli K. A sensitive and rapid mass spec-trometric method for the simultaneous measurement of
eJIFCC2016Vol27No1pp048-065Page 65
Jillian R. Tate, Gus Koerbin, Khosrow AdeliDeriving harmonised reference intervals – global activities
eight steroid hormones and CALIPER pediatric reference intervals. Clin Biochem 2013;46:642-51.
31. Teodoro-Morrison T, Kyriakopoulou L, Chen YK, Raiz-man JE, Bevilacqua V, Chan MK, Wan B, Yazdanpanah M, Schulze A, Adeli K. Dynamic biological changes in meta-bolic disease biomarkers in childhood and adolescence: A CALIPER study of healthy community children. Clin Bio-chem 2015;48:828-36.
32. Raizman JE, Quinn F, Armbruster DA, Adeli K. Pediat-ric reference intervals for calculated free testosterone, bioavailable testosterone and free androgen index in the CALIPER cohort. Clin Chem Lab Med. 2015;53:e239-43.
33. Devgun MS, Chan MK, El-Nujumi AM , Abara R, Arm-bruster D, Adeli K. Clinical decision limits for interpretation of direct bilirubin - A CALIPER study of healthy multiethnic children and case report reviews. Clin Biochem;48:93-6.
34. Estey MP, Cohen AH, Colantonio DA, Chan MK, Mar-vasti TB, Randell E, et al. CLSI-based transference of the CALIPER database of pediatric reference intervals from Abbott to Beckman, Ortho, Roche and Siemens Clinical Chemistry Assays: direct validation using refer-ence samples from the CALIPER cohort. Clin Biochem 2013;46:1197-219.
35. Araújo PA, Thomas D, Sadeghieh T, Bevilacqua V, Chan MK, Chen Y, et al. CLSI based transference of the CALIPER database of pediatric reference intervals to Beckman Coulter DxC biochemical assays. Clin Biochem 2015;48:870-80.
36. Abou El Hassan M, Stoianov A, Araújo PA, Sadeghieh T, Chan MK, Chen Y, et al. CLSI-based transference of CALIPER pediatric reference intervals to Beckman Coulter AU biochemical assays. Clin Biochem 2015 May 13. pii: S0009-9120(15)00170-8.
37. Higgins V, Chan MK, Nieuwesteeg M, Hoffman BR, Bromberg IL, Gornall D, et al. Transference of CALIPER pediatric reference intervals to biochemical assays on the Roche cobas 6000 and the Roche Modular P. Clin Bio-chem 2015 Aug 19. pii: S0009-9120(15)00398-7.
38. Adeli K, Higgins V, Nieuwesteeg M, Raizman JE, Chen Y, Wong SL, Blais D. Biochemical marker reference values across pediatric, adult, and geriatric ages: Establishment of robust pediatric and adult reference intervals on the basis of the Canadian Health Measures Survey. Clin Chem 2015;61:1049-62.
39. Adeli K, Higgins V, Nieuwesteeg M, Raizman JE, Chen Y, Wong SL, Blais D. Complex reference values for en-docrine and special chemistry biomarkers across pedi-atric, adult, and geriatric ages: Establishment of robust pediatric and adult reference intervals on the basis of the Canadian Health Measures Survey. Clin Chem 2015; 61:1063-74.
40. Adeli K, Raizman JE, Chen Y, Higgins V, Nieuwesteeg M, Abdelhaleem M, et al. Complex Biological profile of hematologic markers across pediatric, adult, and geriatric Ages: Establishment of robust pediatric and adult refer-ence intervals on the asis of the Canadian Health Mea-sures Survey. Clin Chem 2015;61:1075-86.
41. Ichihara K, Itoh Y, Lam CWK, Poon PMK, Kim J-H, Kyo-no H, et al: Science Committee for the Asian-Pacific Fed-eration of Clinical Biochemistry. Sources of variation of commonly measured serum analytes in 6 Asian cities and consideration of common reference intervals. Clin Chem 2008;54:356-65.
42. Yamamoto Y, Hosogaya S, Osawa S, Ichihara K, Onu-ma T, Saito A, et al. Nationwide multicenter study aimed at the establishment of common reference intervals for standardized clinical laboratory tests in Japan. Clin Chem LabMed 2015;51:1663-72.
43. Ozarda Y, Ichihara K, Aslan D, Aybek H, Ari Z, Taneli F, et al. A multicenter nationwide reference intervals study for common biochemical analytes in Turkey using Abbott analyzers. Clin Chem Lab Med 2014;52:1823-33.
44. Koerbin G, Cavanaugh JA, Potter JM, Abhayaratna WP, West NP, Glasgow N, et al. ‘Aussie normals’: an a priori study to develop clinical chemistry reference in-tervals in a healthy Australian population. Pathology 2015;47:138-44.
45. Sikaris KA. Physiology and its importance for refer-ence intervals. Clin Biochem Rev 2014;35:3-14.
46. Horowitz GL. The power of asterisks [Editorial]. Clin Chem 2015;61:1009-11.
47. CLSI. Defining, establishing, and verifying reference intervals in the clinical laboratory; approved guideline-third edition. Wayne (PA): CLSI; 2008. CLSI document C28-A3.
48. Tate Jr, Yen T, Jones GRD. Transference and validation of reference intervals [Editorial]. Clin Chem 2015;61:1012-5.
eJIFCC2016Vol27No1pp066-076Page 66
In this issue: Harmonization of Clinical Laboratory Test Results
Critical risk results – an update on international initiativesLam Q.1, Ajzner E.2, Campbell C.A.3, 4, Young A.5
1 Austin Pathology, Vic., Australia2 Central Laboratory, Jósa Teaching Hospital of University of Debrecen Medical and Health Science Center, Nyíregyháza, Hungary3 Department of Clinical Chemistry and Endocrinology, South Eastern Area Laboratory Services, NSW Health Pathology, Australia4 Australian Institute of Health Innovation, Macquarie University, NSW, Australia5 Quest Diagnostics, PA, U.S.A
Direct communication of significant (often life-threat-ening) results is a universally acknowledged role of the pathology laboratory, and an important contributor to patient safety. Amongst the findings of a recent survey of 871 laboratories from 30 countries by the European Federation of Clinical Chemistry and Laboratory Medicine (EFLM), only 3 tests were noted to be com-mon to 90% of alert lists, and only 48% of laborato-ries consulted clinicians in developing these alert lists despite ISO15189 recommendations to do so. These findings are similar to previous national surveys dem-onstrating significant variation worldwide in how criti-cal risk results are managed and also in how these pro-tocols are developed. In order to promote “best practice” and harmonization of critical risk re-sults management, guidelines and recommendations have been published, most recently by Clinical and Laboratory Standards Institute (CLSI) and Australasian Association of Clinical Biochemists (AACB). These statements in particular have placed strong emphasis on patient risk and risk assessment in the manage-ment of critical risk results. This focus has resulted in recommendations to adopt new terminology, the
Corresponding author:Dr. Que LamAustin Pathology, Austin Health Studley Rd., Heidelberg, Vic 3084AustraliaE-mail: [email protected]
Key words:harmonization, critical risk results, critical laboratory results, alert table, alert threshold, critical laboratory notification
A R T I C L E I N F O A B S T R A C T
eJIFCC2016Vol27No1pp066-076Page 67
Lam Q., Ajzner E., Campbell C.A., Young A.Critical risk results – an update on international initiatives
consideration of risk assessment when com-piling alert tables, consultative involvement of laboratory users in setting up protocols, and the need for outcome-based evidence to support our practices. With time it is expected that emerging evidence and technological improvements will facilitate the advancement of laboratories down this path to harmonization, best practice, and improve patient safety.
INTRODUCTION
Direct communication of significant (often life-threatening) results which require timely clini-cal attention is a universally acknowledged role of the pathology laboratory. Accreditation stan-dards formalise the requirement for laborato-ries to manage these “high risk results” but only offer very general guidance on how this should be achieved. Not surprisingly, there is evidence of wide differences in practice between labora-tories both internationally and within the same country. These differences are seen in all as-pects of high risk results management including the nomenclature and definitions used; which critical tests and thresholds are included in alert tables; specification of who can receive results and by what mode of communication; what in-formation should be conveyed with the result; how receipt of the result is acknowledged; es-calation protocols for failed attempts at com-munication; and how communication events are recorded. Lack of agreement is evident not only in what is contained in laboratory protocols but also in how these protocols are developed.
It is now increasingly recognised that successful management of high risk results is an important contributor to patient safety1. As such, harmo-nization in this area cannot simply be a matter of shared definitions and procedures, but must involve the determination and implementation
of best practice. The challenge is to define best practice and to obtain the evidence required to support this. This review discusses the work currently being undertaken by a number of pro-fessional organisations worldwide to harmonize and bring best practice to the management of high risk results.
WHAT IS THE CURRENT SITUATION?
Existing practices
Information on how laboratories manage high risk results is largely provided by national sur-veys 2-13, most of which have been questionnaire-based with voluntary participation. Although their findings are limited by the response rate and potential selection bias inherent to this method of data collection, these surveys re-main the best source of information we have on existing practices. In 2011, the Australasian Association of Clinical Biochemists (AACB) un-dertook a survey of laboratories representing a mixture of large private and public pathol-ogy networks from key providers in the region, servicing community and hospital patients2. Between September 2012 and March 2013, the European Federation of Clinical Chemistry and Laboratory Medicine (ELFM) invited its members, affiliates and provisional member countries to complete a modified version of the Australasian survey, adapted for the European professional environment. Eight hundred and seventy one laboratories from 30 countries re-sponded and these results3,4, in combination with the Australasian findings, have provided a comprehensive insight into international state-of-the-art practice in this area.
One finding common to all surveys has been the lack of uniformity in alert lists, both in their contents and how they are compiled. Only 41% of Australasian and 48% of European laborato-ries consulted clinicians in this process despite the recommendation within ISO 15189 that
eJIFCC2016Vol27No1pp066-076Page 68
Lam Q., Ajzner E., Campbell C.A., Young A.Critical risk results – an update on international initiatives
clinical agreement be sought. However, this rate varied between nations with Norway and the Netherlands reporting high consultation rates (72% and 88% respectively) comparable to the 73% of U.S. laboratories previously described10. It is known from other national surveys that clinical consultation rates can be significantly lower12,13. Alert lists solely derived from the laboratory run the risk of being detached from clinical practice. A Canadian laboratory found that when their laboratory-derived alert lists were presented to their hospital physicians, only 36% of adult and 61.5% of paediatric alert thresholds were con-sidered acceptable and did not require modifi-cation14,15. “Published literature” is another com-monly cited source of critical thresholds (listed by 59% of Australasian and 66% of European laboratories) but what laboratories interpret this term to mean is often not explored. A previous survey of UK laboratories found that only 2 out of 94 laboratories actually quoted literature to support the thresholds in their alert table6.
Surveys have consistently highlighted variation in the content of alert lists. In Europe, only 3 tests (potassium, glucose and sodium) were common to the alert lists of more than 90% of survey respondents. In comparison, a U.S. report found 8 common tests (potassium, so-dium, calcium, platelets, hemoglobin, activated partial thromboplastin time, white blood count and prothrombin time), again shared by more than 90% of the surveyed laboratories7. How many tests should we expect to be common on alert lists is not clear. The answer is likely to be complicated when considering the patient pop-ulation serviced by individual laboratories, the tests performed and whether there is evidence of clinical risk from outcome studies.
When the numerical alert thresholds used are compared between laboratories, the findings are varied. Some analyte thresholds do show harmonization probably as a consequence of the wide adoption of thresholds from a single
source (e.g. guidelines), rather than consensus regarding clinical risk. This can be seen amongst laboratories measuring the drug carbamaze-pine. In the Australasian survey, 22 out of 26 laboratories reported a high critical threshold for this drug, the median of which was 15 mg/L (range 9-20). This same median high thresh-old (15 mg/L) was found in a US survey of 36 internet-published alert lists for therapeutic drugs (range 11-20)16. Fifteen mg/L was also the mean high threshold (range 10-20) found in a survey of UK laboratories6. In contrast, there is little agreement with C-reactive protein thresh-olds in adults. Its inclusion in alert lists can be seen in 28% of Australasian alert lists with a me-dian value of 100 mg/L (range 80-300) and in 30% and 43% of European adult and pediatric alert lists, respectively. Forty-three percent of Norwegian laboratories use CRP on their alert lists17 with a median applied alert threshold of 200 (10 and 90 percentiles; 50-200) mg/L. Of interest, only 35% of responding general practi-tioners actually wanted to be alerted of CRP val-ues above 120 mg/L (10 and 90 percentiles of responses were 50 and 200mg/L, respectively). Further variation in alert list content has been described as a result of some laboratories using customized thresholds and modified policies based on the patient age, location, individual provider or practice group requesting the test, or the disease type where known7. Sixty-one percent of European laboratories use children-specific alert thresholds, and 19% apply unique thresholds for specialist wards.
Many surveys also described diversity in the communication policies around high risk re-sults. Around 65% of European and 80% of Australasian laboratories would not actively communicate a critical risk result if it was not significantly different from a previously deliv-ered result for that patient. In U.S., only 36% lab-oratories had a policy allowing for these repeat critical results not to be called18. Furthermore, a
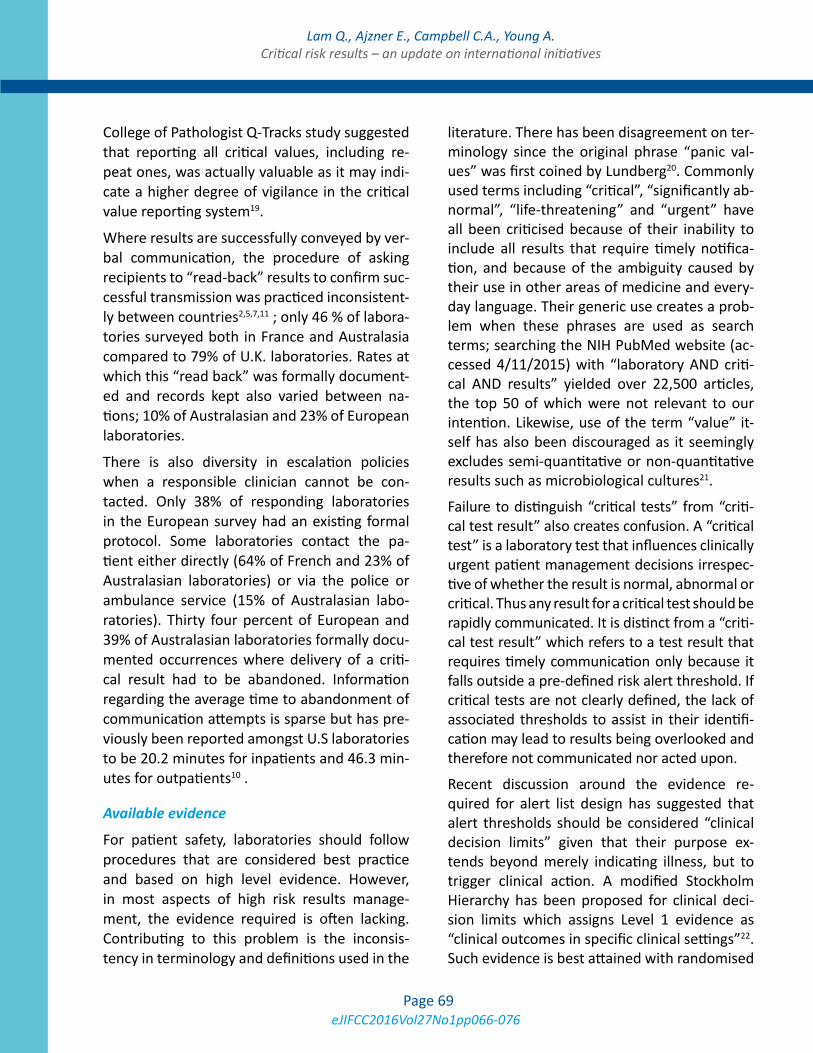
eJIFCC2016Vol27No1pp066-076Page 69
Lam Q., Ajzner E., Campbell C.A., Young A.Critical risk results – an update on international initiatives
College of Pathologist Q-Tracks study suggested that reporting all critical values, including re-peat ones, was actually valuable as it may indi-cate a higher degree of vigilance in the critical value reporting system19.
Where results are successfully conveyed by ver-bal communication, the procedure of asking recipients to “read-back” results to confirm suc-cessful transmission was practiced inconsistent-ly between countries2,5,7,11 ; only 46 % of labora-tories surveyed both in France and Australasia compared to 79% of U.K. laboratories. Rates at which this “read back” was formally document-ed and records kept also varied between na-tions; 10% of Australasian and 23% of European laboratories.
There is also diversity in escalation policies when a responsible clinician cannot be con-tacted. Only 38% of responding laboratories in the European survey had an existing formal protocol. Some laboratories contact the pa-tient either directly (64% of French and 23% of Australasian laboratories) or via the police or ambulance service (15% of Australasian labo-ratories). Thirty four percent of European and 39% of Australasian laboratories formally docu-mented occurrences where delivery of a criti-cal result had to be abandoned. Information regarding the average time to abandonment of communication attempts is sparse but has pre-viously been reported amongst U.S laboratories to be 20.2 minutes for inpatients and 46.3 min-utes for outpatients10 .
Available evidence
For patient safety, laboratories should follow procedures that are considered best practice and based on high level evidence. However, in most aspects of high risk results manage-ment, the evidence required is often lacking. Contributing to this problem is the inconsis-tency in terminology and definitions used in the
literature. There has been disagreement on ter-minology since the original phrase “panic val-ues” was first coined by Lundberg20. Commonly used terms including “critical”, “significantly ab-normal”, “life-threatening” and “urgent” have all been criticised because of their inability to include all results that require timely notifica-tion, and because of the ambiguity caused by their use in other areas of medicine and every-day language. Their generic use creates a prob-lem when these phrases are used as search terms; searching the NIH PubMed website (ac-cessed 4/11/2015) with “laboratory AND criti-cal AND results” yielded over 22,500 articles, the top 50 of which were not relevant to our intention. Likewise, use of the term “value” it-self has also been discouraged as it seemingly excludes semi-quantitative or non-quantitative results such as microbiological cultures21.
Failure to distinguish “critical tests” from “criti-cal test result” also creates confusion. A “critical test” is a laboratory test that influences clinically urgent patient management decisions irrespec-tive of whether the result is normal, abnormal or critical. Thus any result for a critical test should be rapidly communicated. It is distinct from a “criti-cal test result” which refers to a test result that requires timely communication only because it falls outside a pre-defined risk alert threshold. If critical tests are not clearly defined, the lack of associated thresholds to assist in their identifi-cation may lead to results being overlooked and therefore not communicated nor acted upon.
Recent discussion around the evidence re-quired for alert list design has suggested that alert thresholds should be considered “clinical decision limits” given that their purpose ex-tends beyond merely indicating illness, but to trigger clinical action. A modified Stockholm Hierarchy has been proposed for clinical deci-sion limits which assigns Level 1 evidence as “clinical outcomes in specific clinical settings”22. Such evidence is best attained with randomised
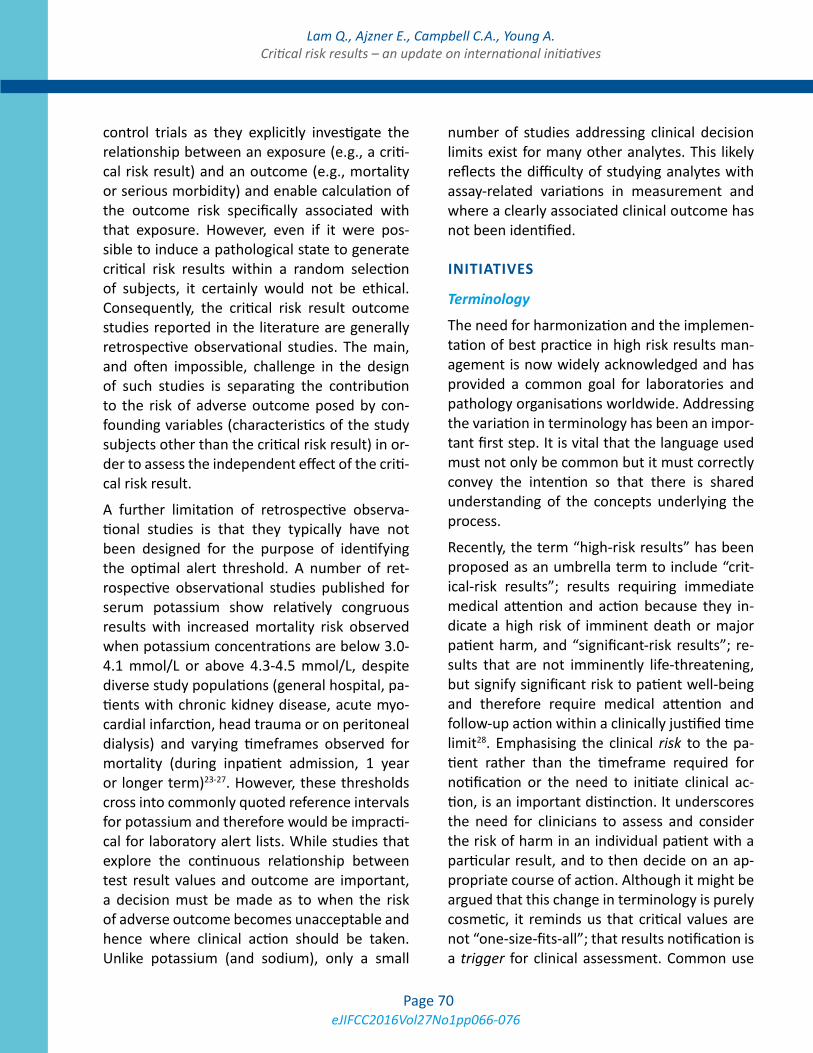
eJIFCC2016Vol27No1pp066-076Page 70
Lam Q., Ajzner E., Campbell C.A., Young A.Critical risk results – an update on international initiatives
control trials as they explicitly investigate the relationship between an exposure (e.g., a criti-cal risk result) and an outcome (e.g., mortality or serious morbidity) and enable calculation of the outcome risk specifically associated with that exposure. However, even if it were pos-sible to induce a pathological state to generate critical risk results within a random selection of subjects, it certainly would not be ethical. Consequently, the critical risk result outcome studies reported in the literature are generally retrospective observational studies. The main, and often impossible, challenge in the design of such studies is separating the contribution to the risk of adverse outcome posed by con-founding variables (characteristics of the study subjects other than the critical risk result) in or-der to assess the independent effect of the criti-cal risk result.
A further limitation of retrospective observa-tional studies is that they typically have not been designed for the purpose of identifying the optimal alert threshold. A number of ret-rospective observational studies published for serum potassium show relatively congruous results with increased mortality risk observed when potassium concentrations are below 3.0-4.1 mmol/L or above 4.3-4.5 mmol/L, despite diverse study populations (general hospital, pa-tients with chronic kidney disease, acute myo-cardial infarction, head trauma or on peritoneal dialysis) and varying timeframes observed for mortality (during inpatient admission, 1 year or longer term)23-27. However, these thresholds cross into commonly quoted reference intervals for potassium and therefore would be impracti-cal for laboratory alert lists. While studies that explore the continuous relationship between test result values and outcome are important, a decision must be made as to when the risk of adverse outcome becomes unacceptable and hence where clinical action should be taken. Unlike potassium (and sodium), only a small
number of studies addressing clinical decision limits exist for many other analytes. This likely reflects the difficulty of studying analytes with assay-related variations in measurement and where a clearly associated clinical outcome has not been identified.
INITIATIVES
Terminology
The need for harmonization and the implemen-tation of best practice in high risk results man-agement is now widely acknowledged and has provided a common goal for laboratories and pathology organisations worldwide. Addressing the variation in terminology has been an impor-tant first step. It is vital that the language used must not only be common but it must correctly convey the intention so that there is shared understanding of the concepts underlying the process.
Recently, the term “high-risk results” has been proposed as an umbrella term to include “crit-ical-risk results”; results requiring immediate medical attention and action because they in-dicate a high risk of imminent death or major patient harm, and “significant-risk results”; re-sults that are not imminently life-threatening, but signify significant risk to patient well-being and therefore require medical attention and follow-up action within a clinically justified time limit28. Emphasising the clinical risk to the pa-tient rather than the timeframe required for notification or the need to initiate clinical ac-tion, is an important distinction. It underscores the need for clinicians to assess and consider the risk of harm in an individual patient with a particular result, and to then decide on an ap-propriate course of action. Although it might be argued that this change in terminology is purely cosmetic, it reminds us that critical values are not “one-size-fits-all”; that results notification is a trigger for clinical assessment. Common use
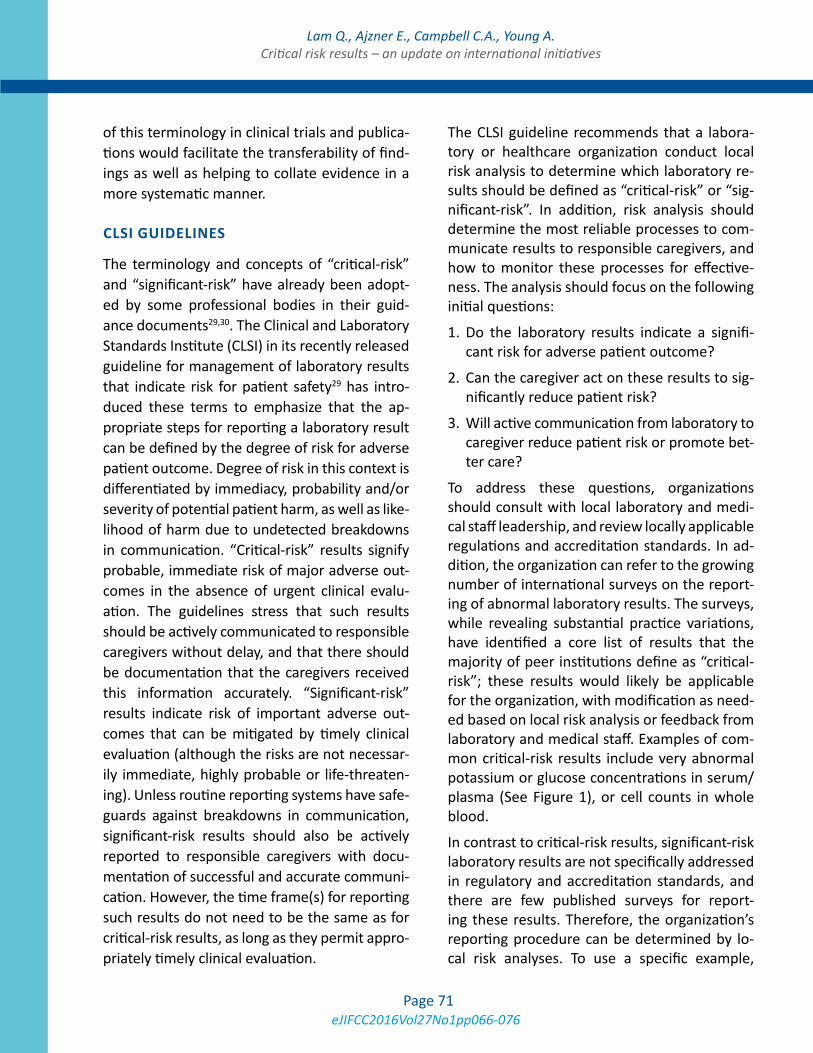
eJIFCC2016Vol27No1pp066-076Page 71
Lam Q., Ajzner E., Campbell C.A., Young A.Critical risk results – an update on international initiatives
of this terminology in clinical trials and publica-tions would facilitate the transferability of find-ings as well as helping to collate evidence in a more systematic manner.
CLSI GUIDELINES
The terminology and concepts of “critical-risk” and “significant-risk” have already been adopt-ed by some professional bodies in their guid-ance documents29,30. The Clinical and Laboratory Standards Institute (CLSI) in its recently released guideline for management of laboratory results that indicate risk for patient safety29 has intro-duced these terms to emphasize that the ap-propriate steps for reporting a laboratory result can be defined by the degree of risk for adverse patient outcome. Degree of risk in this context is differentiated by immediacy, probability and/or severity of potential patient harm, as well as like-lihood of harm due to undetected breakdowns in communication. “Critical-risk” results signify probable, immediate risk of major adverse out-comes in the absence of urgent clinical evalu-ation. The guidelines stress that such results should be actively communicated to responsible caregivers without delay, and that there should be documentation that the caregivers received this information accurately. “Significant-risk” results indicate risk of important adverse out-comes that can be mitigated by timely clinical evaluation (although the risks are not necessar-ily immediate, highly probable or life-threaten-ing). Unless routine reporting systems have safe-guards against breakdowns in communication, significant-risk results should also be actively reported to responsible caregivers with docu-mentation of successful and accurate communi-cation. However, the time frame(s) for reporting such results do not need to be the same as for critical-risk results, as long as they permit appro-priately timely clinical evaluation.
The CLSI guideline recommends that a labora-tory or healthcare organization conduct local risk analysis to determine which laboratory re-sults should be defined as “critical-risk” or “sig-nificant-risk”. In addition, risk analysis should determine the most reliable processes to com-municate results to responsible caregivers, and how to monitor these processes for effective-ness. The analysis should focus on the following initial questions:
1. Do the laboratory results indicate a signifi-cant risk for adverse patient outcome?
2. Can the caregiver act on these results to sig-nificantly reduce patient risk?
3. Will active communication from laboratory to caregiver reduce patient risk or promote bet-ter care?
To address these questions, organizations should consult with local laboratory and medi-cal staff leadership, and review locally applicable regulations and accreditation standards. In ad-dition, the organization can refer to the growing number of international surveys on the report-ing of abnormal laboratory results. The surveys, while revealing substantial practice variations, have identified a core list of results that the majority of peer institutions define as “critical-risk”; these results would likely be applicable for the organization, with modification as need-ed based on local risk analysis or feedback from laboratory and medical staff. Examples of com-mon critical-risk results include very abnormal potassium or glucose concentrations in serum/plasma (See Figure 1), or cell counts in whole blood.
In contrast to critical-risk results, significant-risk laboratory results are not specifically addressed in regulatory and accreditation standards, and there are few published surveys for report-ing these results. Therefore, the organization’s reporting procedure can be determined by lo-cal risk analyses. To use a specific example,
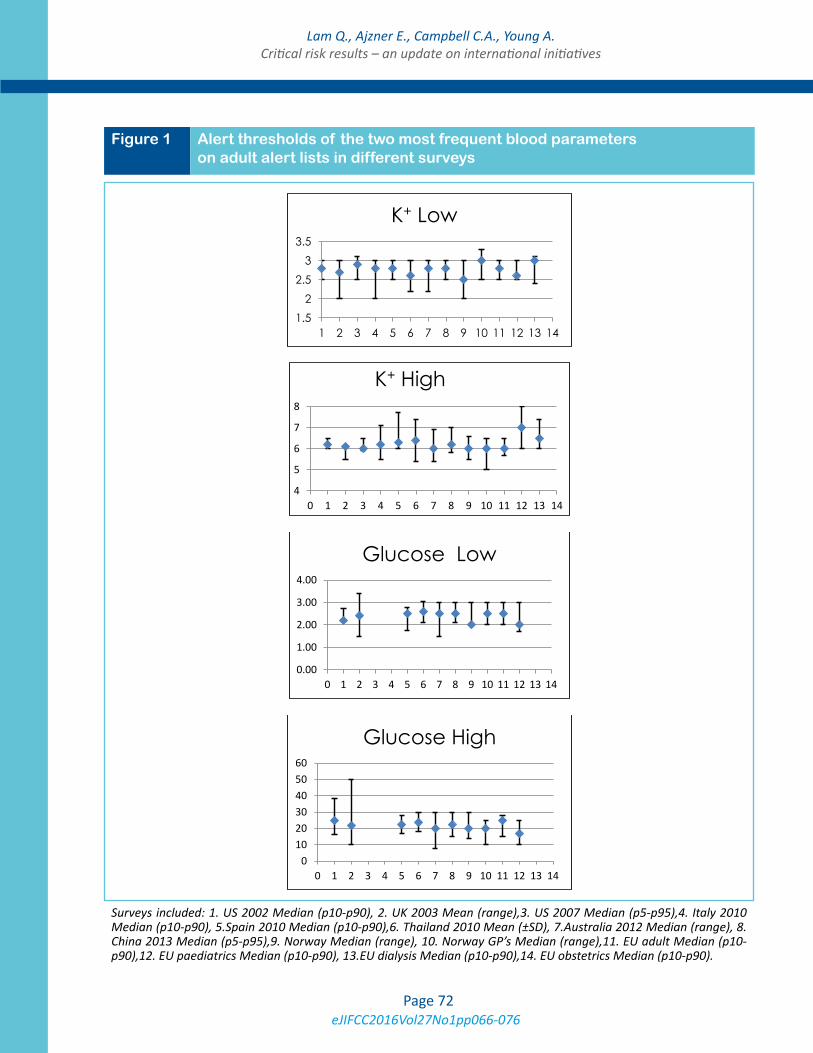
eJIFCC2016Vol27No1pp066-076Page 72
Lam Q., Ajzner E., Campbell C.A., Young A.Critical risk results – an update on international initiatives
1.52
2.53
3.5
1 2 3 4 5 6 7 8 9 10 11 12 13 14
K+ Low
4
5
6
7
8
0 1 2 3 4 5 6 7 8 9 10 11 12 13 14
K+ High
0.00
1.00
2.00
3.00
4.00
0 1 2 3 4 5 6 7 8 9 10 11 12 13 14
Glucose Low
0 10 20 30 40 50 60
0 1 2 3 4 5 6 7 8 9 10 11 12 13 14
Glucose High
Figure 1 Alert thresholds of the two most frequent blood parameters on adult alert lists in different surveys
Surveys included: 1. US 2002 Median (p10-p90), 2. UK 2003 Mean (range),3. US 2007 Median (p5-p95),4. Italy 2010 Median (p10-p90), 5.Spain 2010 Median (p10-p90),6. Thailand 2010 Mean (±SD), 7.Australia 2012 Median (range), 8. China 2013 Median (p5-p95),9. Norway Median (range), 10. Norway GP’s Median (range),11. EU adult Median (p10-p90),12. EU paediatrics Median (p10-p90), 13.EU dialysis Median (p10-p90),14. EU obstetrics Median (p10-p90).
eJIFCC2016Vol27No1pp066-076Page 73
Lam Q., Ajzner E., Campbell C.A., Young A.Critical risk results – an update on international initiatives
the organization might consider how to report unexpected, early-stage adenocarcinoma in a routine appendectomy specimen. This result is significant for prognosis and therapy, but does not indicate immediate risk of severe adverse events, and does not require immediate clini-cal intervention for appropriate care. However, a delay in recognition and treatment could re-sult in a significantly worse outcome for the pa-tient. Therefore, this result might meet criteria for “significant-risk” depending on an organiza-tional risk analysis. If routine pathology reports cannot be verified for receipt and acknowledg-ment, the organization should classify the unex-pected finding of malignancy as a significant-risk result, and require the pathology laboratory to actively notify caregivers in a clinically appropri-ate time frame (for example, within 24 hours). On the other hand, if routine pathology reports are monitored to verify acknowledgment by re-sponsible caregivers within an appropriate time frame, the organization might choose to rely on standard reporting in this situation.
Policies and procedures for reporting critical-risk and significant-risk laboratory results should include the following:
1. The definition of critical-risk and significant-risk results, and timeframes for reporting. These should be established through con-sensus between laboratory, medical and ad-ministrative personnel.
2. The laboratory should identify personnel re-sponsible for reporting critical-risk and signif-icant-risk results.
3. The organization should identify caregivers au-thorized to receive reports of critical-risk and significant-risk results. Final recipients should be responsible clinicians who can direct pa-tient care based on the laboratory results. It may be reasonable for the laboratory to report results to intermediaries, who relay the re-port to the responsible clinician. However, the
accuracy and timeliness of the communication must remain appropriate for patient care.
4. Reports of critical-risk and significant-risk re-sults should be documented to identify the patient or patient’s sample, the laboratory result, the reporter and recipient, the time of report, and verification of accurate com-munication. If intermediary personnel are involved in the report, each leg of communi-cation should be documented.
5. The reporting of critical-risk and significant-risk results should be continually monitored for ef-fectiveness. Root cause analyses should be conducted if performance targets are not met, in order to identify potential sources of risk.
AUSTRALASIAN RECOMMENDATIONS
A guidance document on the communication and management of high risk results has also been recently published by the AACB in con-junction with the Royal College of Pathologists of Australasia (RCPA)30. It contains recommen-dations which reflect “best practice” based, where possible, on available literature but ul-timately reflects the consensus view of a spe-cifically formed working party comprising of pathologists and laboratory scientists with in-terest and expertise in this area. The statement has been written in a general manner so as to be able to be applied to all disciplines within pa-thology. Before publication, an open invitation to comment on the draft was sent to the wider laboratory community, clinicians and patient interest groups. This wide consultative process acknowledged the importance of agreement amongst these three groups in order for the successful management of high risk results.
The document features 8 key recommendations for laboratories, namely to:
1. compile an alert list(s) in consultation with its users;
eJIFCC2016Vol27No1pp066-076Page 74
Lam Q., Ajzner E., Campbell C.A., Young A.Critical risk results – an update on international initiatives
2. have procedures to ensure that high risk re-sults are reliably identified;
3. specify, in agreement with its users, the modes of transmission for the communication of high risk results;
4. specify, in agreement with its users, who is au-thorised to receive high risk results;
5. define what data needs to be communicated to the recipients of high risk results;
6. develop a system for the acknowledgement of the receipt of high risk results to confirm that results were accurately and effectively communicated;
7. ensure that every high risk result notification is appropriately documented;
8. have procedures that involve its users in maintaining and monitoring the outcomes of its high risk result management practices.
Further details of how each recommendation should be achieved, including some examples, are explored within the body of the paper.
The consensus statement aims to incorporate a number of important concepts for harmoniza-tion and best practice. Laboratories are encour-aged to adopt the newly proposed international terminology and are also encouraged not to develop their procedures in isolation but in-stead to collaborate with their laboratory users (that is, medical practitioners, nurses and other health care professionals directly involved in patient care). Although the guidance document represents what is considered best practice, it recognises that individual laboratories, due to unique circumstances, may struggle with some recommendations. To address this, the terms “needs to”, “should” and “may” are purposely used to give an indication of the strength of each recommendation, providing laboratories with an understanding of which recommenda-tions must be adhered to, and which can be viewed as suggestions. It is also important that
laboratories see the management of high risk results as a dynamic process requiring monitor-ing and updating in light of changing circum-stances and technology.
These recommendations are an initial step to-wards harmonization. The working party hopes to compile a “starter” alert list with thresholds based on outcome studies and expert opinion, framed by the risk assessment model proposed by the CSLI. Laboratories could expect to use this list as a foundation for discussion with their clinical users.
FUTURE DIRECTIONS
Future directions in the area of high risk results management will be influenced by emerging evidence and advances in technology. There is a clear need for more outcome studies. These studies should use consensus terminology and be designed to not only demonstrate where the risk of harm to patients starts but also deter-mine the threshold level(s) where clinical action can eliminate or diminish this risk. With stron-ger evidence will come harmonization of alert thresholds and protocols for laboratories and their users. Studies should also look at specific populations or scenarios to allow for alert lists to better cater for individuals thus generating less false positive clinical notifications. While having more exceptions or rules seems unmanageable today, it is reasonable to expect improvements in technology that will assist the way we iden-tify and communicate high risk results.
Laboratories will also need to adapt their pro-cedures and protocols as new opportunities are presented by improving technology. Already, the use of electronic text messaging as an al-ternative form of communication to the tra-ditional phone call has been described with success31,32. Further advances in the way labora-tories identify high risk results and notify clini-cians are certain. However, it is important that
eJIFCC2016Vol27No1pp066-076Page 75
Lam Q., Ajzner E., Campbell C.A., Young A.Critical risk results – an update on international initiatives
the underlying principles of best practice re-main, so that in the example of text messaging, receipt of the result must be acknowledged and documented and where this does not occur, an escalation procedure implemented.
CONCLUSION
High risk results management is recognised as an important contributor to patient safety. Wide variation in laboratory practices worldwide has been identified, and the need for harmoniza-tion is universally acknowledged. Recent initia-tives towards harmonization have focussed on patient risk and risk assessment. This approach has framed proposed new terminology, dis-cussions around the design of alert tables, the need for outcome-based evidence and best practice recommendations for laboratory pro-cedures. With time it is expected that emerging evidence and technological improvements will further advance laboratories down this path to harmonization and best practice, and improve patient safety.
DEFINITIONS
Critical test: A test that requires immediate com-munication of the result irrespective of whether it is normal, significantly abnormal or critical.
Critical risk result: Results requiring immediate medical attention and action because they in-dicate a high risk of imminent death or major patient harm.
Significant risk result: Results that are not im-minently life-threatening, but signify significant risk to patient well-being and therefore require medical attention and follow-up action within a clinically justified time limit.
High risk results: A collective term used to de-note results that require communication in a timely manner; i.e. critical risk results, signifi-cant risk results and results of critical tests.
Alert threshold: The upper and/or lower thresh-old of a test result or the magnitude of change (delta) in a test result within a clinically signifi-cant time period, beyond which the finding is considered to be a medical priority warranting timely action.
Alert list: A list of critical tests and tests with alert thresholds for high risk results ideally reflecting an agreed policy between the laboratory and its users for rapid communication within a pre-spec-ified time frame and according to a procedure.
Escalation procedure: An ordered list of alter-native steps to be followed when the appropri-ate recipient(s) of a high risk result cannot be reached in a clinically appropriate time frame.
REFERENCES
1. Plebani M. Harmonization in laboratory medicine: the complete picture Clin Chem Lab Med 2013; 51(4): 741–751.
2. Campbell CA and Horvath AR. Towards Harmonisation of Critical Laboratory Result Management - Review of the Literature and Survey of Australasian Practices. Clin Bio-chem Rev 2012;33:149-60.
3. Ajzner E , Miklos T, Campbell C, Aakre KM, Horvath AR. Critical result management in Europe and lessons from international surveys – Can we do better? Oral pres, AACC Annual Meeting 28th July 2014, Chicago, USA, Ses-sion 32216: Critical Result Management Practices: Global Perspectives and Recommendations for Best Practices.
4. Ajzner E, Aakre KM, Campbell CA, Horvath AR. Man-agement of laboratory results that indicate critical pa-tient risk in European laboratories. Oral Pres, EuroLab-Focus 2014 conference, 9th October 2014, Liverpool, UK, Session “Communication with Clinicians”.
5. Kopcinovic LM, Trifunovic J, Pavosevic T, Nikolac N. Croatian survey on critical results reporting. Biochemia Medica 2015;25(2):193–202.
6. Tillman J, Barth JH; ACB National Audit Group. A survey of laboratory “critical (alert) limits” in the UK. Ann Clin Biochem. 2003;40(pt 2):181-184.
7. Wagar EA, Friedberg RC, Souers R, and Stankovic AK. Critical Values Comparison: A College of American Pathol-ogists Q-Probes Survey of 163 Clinical Laboratories. Arch Pathol Lab Med 2007;131:1769-75.
8. Lippi G, Giavarina D, Montagnana M, Salvagno GL, Cap-peletti P, Plebani M, Guidi GC. National survey on critical
eJIFCC2016Vol27No1pp066-076Page 76
Lam Q., Ajzner E., Campbell C.A., Young A.Critical risk results – an update on international initiatives
values reporting in a cohort of Italian laboratories. Clin Chem Lab Med 2007;45:1411-13.
9. Gong Y, Adeli K, on behalf of CSCC Pediatric Focus Group. A national survey on pediatric critical values used in clinical laboratories across Canada. Clin Biochem. 2009; 42:1610–1615.
10. Howanitz PJ. Laboratory Critical Values Policies and Procedures. A College of American Pathologists Q-Probes Study in 623 Institution. Arch Pathol Lab Med. 2002; 126:663–669.
11. Sirisali K, Manochiopinij S,Leelahakul P, Ruengrai V, Sattayakom A, Sirisali S. Critical Value of the Clinical Labo-ratory Test in Thailand. J Med Assoc Thai 2010; 93 (Suppl. 6): S22-S27.
12. Llopis Diaz MA, Gomez Rioja R, Alvarez Funes V, Mar-tinez Bru C, Cortes Rius M, Barba Meseguer N, Alemany MV, Alsina Kirchner MJ. Critical values reporting: Results of a Spanish laboratories survey. [Spanish] Revista del Laboratorio Clinico 2010;3:177–82.
13. Zeng R, Wang W, Wang Z. National survey on critical values notification of 599 institutions in China. Clin Chem Lab Med 2013:1–9.
14. Don-Wauchope AC, and Chetty VT. Laboratory de-fined critical value limits: How do hospital physicians perceive laboratory based critical values? Clin Biochem 2009;42:766-70.
15. Don-Wauchope AC, Wanga L, Greya V. Pediatric criti-cal values: Laboratory–pediatrician discourse. Clin Bio-chem 2009;42:1658-61.
16. McClain CM, Owings R, Bornhorst JA. Heterogeneity of publicly accessible online critical values for therapeutic drugs. J Pathol Inform 2011;2:53.
17. Aakre KM, Hov GG, Skadberg O, Piehler A, Distante S, Hager HB. Notification of highly abnormal laboratory re-sults to doctors outside hospitals. Tidsskr Nor Laegeforen 2013 Nov 12;133(21):E1-6.
18. Valenstein PN; Wagar EA; Stankovic AK; Walsh MK; Schneider F. Notification of Critical Results, A College of American Pathologists Q-Probes Study of 121 Institutions Arch Pathol Lab Med. 2008;132:1862–1867.
19. Wagar EA; Stankovic AK; Wilkinson DS; Walsh M; Souers RJ. MS Assessment Monitoring of Laboratory Critical Val-ues, A College of American Pathologists Q-Tracks Study of 180 Institutions. Arch Pathol Lab Med. 2007;131:44–49.
20. Lundberg GD. When to panic over abnormal values. MLO Med Lab Obs. 1972;4:47-54.
21. Campbell CA and Horvath AR. Harmonization of criti-cal result management in laboratory medicine. CClin Chim Acta 2014;432:135-47.
22. Sikaris KA. Application of the Stockholm Hierarchy to Defining the Quality of Reference Intervals and Clinical Decision Limits.Clin Biochem Rev 2012;33:141-8.
23. Solinger AB and Rothman SI. Risks of mortality associ-ated with common laboratory tests: a novel, simple and meaningful way to set decision limits from data available in the Electronic Medical Record. Clin Chem Lab Med 2013; 1-11.
24. Korgaonkar S, Tilea A, Gillespie BW, Kiser M, Eisele G, Finkelstein F, Kotanko P, Pitt B and Saran R. Serum Potas-sium and Outcomes in CKD: Insights from the RRI-CKD Cohort Study. Clin J Am Soc Nephrol 5: 762-769, 2010.
25. Conway R, Creagh D, Byrne DG, O’Riordan D and Silke B. Serum potassium levels as an outcome deter-minant in acute medical admissions. Clin Med (Lond) 2015;15:239-43.
26. Goyal A, Spertus JA, Gosch, K, Venkitachalam L, Jones PG, Van den Berghe G, Kosiborod M. Serum Potas-sium Levels and Mortality in Acute Myocardial Infarction. JAMA. 2012;307(2):157-164.
27. Ookuma T, Miyasho K, Kashitani N, Beika N, Ishibashi N, Yamashita T and Ujike Y. The clinical relevance of plasma potassium abnormalities on admission in trauma patients: a retrospective observational study. J Intensive Care 2015;3:37.
28. White GH, Campbell CA, Horvath AR. Is This a Critical, Panic, Alarm, Urgent, or Markedly Abnormal Result? Clin Chem 2014;60:1569-81.
29. CLSI. GP47-Ed1: Management of Critical- and Signifi-cant-Risk Results, 1st Edition. Young A. Clinical and Labo-ratory Standards Institute; 2015.
30. Campbell CA, Caldwell G, Coates P, Flatman R, Geor-giou A, Horvath AR, Lam QT, Schneider HG. Consen-sus Statement for the Management and Communica-tion of High Risk Laboratory Results. Clin Biochem Rev 2015;36:97-105.
31. Piva E, Sciacovelli L, Zaninotto M, Laposata M and Plebani M. Evaluation of Effectiveness of a Computerized Notification System for Reporting Critical Values. Am J Clin Pathol 2009;131:432-41.
32. Saw S, Loh TP, Ang SBL, Yip JWL, and Sethi SK. Meeting Regulatory Requirements by the Use of Cell Phone Text Message Notification With Autoescalation and Loop Clo-sure for Reporting of Critical Laboratory Results. Am J Clin Pathol 2011;136:30-4.
eJIFCC2016Vol27No1pp077-083Page 77
A R T I C L E I N F O A B S T R A C T
A genetic diagnosis is essential in families with a suspi-cion of Lynch syndrome, as it allows the use of proper and specific surveillance programs for high-risk indi-viduals who carry a pathogenic mutation. The predic-tion and prevention schemes reduce the impact of cancer in high-risk families in a cost-effective manner. Genetic tests for LS are well standardized and broadly used, although there remain some specific difficulties that need to be addressed to reach an optimal diag-nosis. In this report, we addressed the problem raised by the detection of mutations at intronic-splicing con-sensus sites located near mononucleotide repeats. A standard procedure was applied for LS diagnosis in all cases. PCR and Sanger sequencing results of the whole coding sequences and intron–exon boundar-ies of the MSH2 gene were analyzed. Moreover, we designed quality-control procedures to verify the at-tainment of the intended quality of results regarding sequences located in complex contexts. We found eight families with point mutations at intron 5 of the MSH2 gene located near the BAT26 mononucleotide marker, which could be missed in a regular diagnostic process. Four families had the c.942+2T>A mutation, and the remaining four families had the c.942+3A>T mutation. In conclusion, the detection of pathogenic
Corresponding author:José Luis SotoMolecular Genetics Laboratory Elche University HospitalCamino Almazara nº 1103203 Elche. SpainPhone: (+34) 966 616185E-mail: [email protected]
Key words:diagnosis, Lynch syndrome, analytical challenges
Competing interests:The authors declare no competing interests.
Ackowledgements:We thank the Hereditary Cancer Program of the Valencian Region.
Analytical challenges in the genetic diagnosis of Lynch syndrome – difficult detection of germ-line mutations in sequences surrounding homopolymersCastillejo M.I., Castillejo A., Barbera V.M., Soto J.L.Molecular Genetics Laboratory, Elche University Hospital, Elche, Spain
eJIFCC2016Vol27No1pp077-083Page 78
Castillejo M.I., Castillejo A., Barbera V.M., Soto J.L.Lynch syndrome diagnosis: detection of germ-line mutations in sequences surrounding homopolymers
mutations located near microsatellite sequenc-es is especially difficult and requires the imple-mentation of specific quality controls to opti-mize diagnostic methods.
INTRODUCTION
Lynch syndrome (LS) (MIN No: 120435) is an autosomal dominant hereditary condition that predisposes to colorectal, endometrial, and oth-er tumors. The syndrome is caused by germ-line mutations in one of the mismatch repair (MMR) genes: MLH1, MLH2, MSH6, or PMS21. A genetic diagnosis is essential in families with a suspicion of having LS, as it allows the use of proper and specific surveillance programs for high-risk indi-viduals who carry a pathogenic mutation. Thus, high risk individuals are advised to stay with-in the normal weight range and refrain from smoking since a high BMI and smoking increase the risk of developing adenomas and colorectal cancer in Lynch syndrome. Regular colonoscopy leads to a reduction of colorectal cancer-related mortality. Hysterectomy and bilateral oopho-rectomy largely prevents the development of endometrial and ovarian cancer and is an op-tion to be discussed with mutation carriers who have completed their families especially after the age of 40 years2.
The prediction and prevention schemes reduce the impact of cancer in high-risk families in a cost-effective manner.
In general, genetic tests for LS are well stan-dardized and broadly used, although there remain some specific difficulties that need to be addressed to reach an optimal diagnosis. In addition to the postanalytical limitations in the interpretation of the clinical significance of some genetic variants, there are other analyti-cal challenges, such as the difficult study of the PMS2 gene because of the high number and
homology with several pseudogenes, or the de-tection of variants located in the proximity of a homopolymer sequence in the MMR genes.
In this report, we addressed the problem raised by the detection of mutations located at intron-ic-splicing consensus sites, near mononucleo-tide repeats. In this particular sequence context, the detection of mutations is a real analytical challenge.
METHODS
Our laboratory performs genetic testing for the diagnosis of LS covering a population of over five million people in the southeast of Spain. These genetic tests are requested from the five genetic counseling units of the Public Health Hereditary Cancer Program of the Comunidad Valenciana3.
The present study was conducted in compliance with the ethical principles for medical research involving human subjects of the Declaration of Helsinki. Informed consent was obtained from all subjects, and the study received the approval of the Ethics Committee of the Elche University Hospital.
A standard procedure was applied for the di-agnosis of LS in all cases. Fulfillment of the re-vised Bethesda Guidelines or loss of expression of MMR genes during universal screening for colorectal and endometrial tumors is required for referral to the Genetic Counseling in Cancer Units4,5. Before gene mutation analysis, the tu-mors of the probands were studied for micro-satellite instability and MMR protein expression (MLH1, MSH2, MSH6, and PMS2), to confirm MMR implication and select the target gene/s for mutation analysis.
Mutation testing using the probands’ blood DNA was then performed to assess the causative germ-line mutation in their families. PCR and Sanger sequencing results of the whole coding
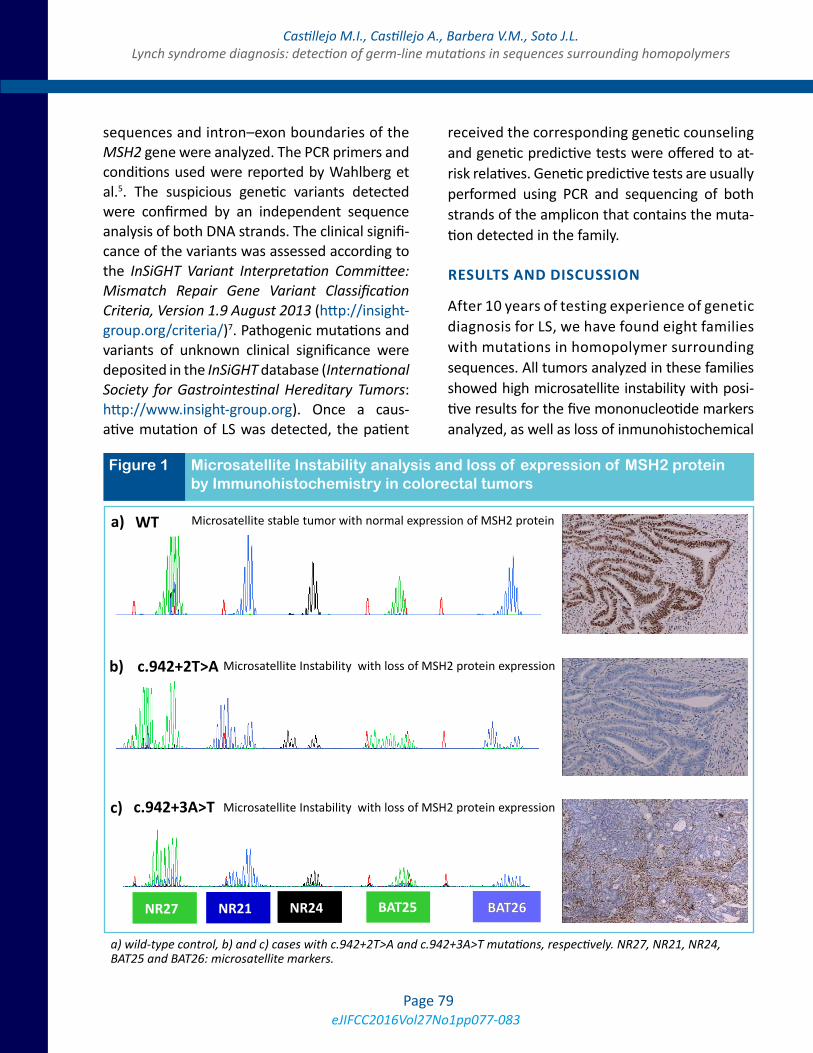
eJIFCC2016Vol27No1pp077-083Page 79
Castillejo M.I., Castillejo A., Barbera V.M., Soto J.L.Lynch syndrome diagnosis: detection of germ-line mutations in sequences surrounding homopolymers
sequences and intron–exon boundaries of the MSH2 gene were analyzed. The PCR primers and conditions used were reported by Wahlberg et al.5. The suspicious genetic variants detected were confirmed by an independent sequence analysis of both DNA strands. The clinical signifi-cance of the variants was assessed according to the InSiGHT Variant Interpretation Committee: Mismatch Repair Gene Variant Classification Criteria, Version 1.9 August 2013 (http://insight-group.org/criteria/)7. Pathogenic mutations and variants of unknown clinical significance were deposited in the InSiGHT database (International Society for Gastrointestinal Hereditary Tumors: http://www.insight-group.org). Once a caus-ative mutation of LS was detected, the patient
received the corresponding genetic counseling and genetic predictive tests were offered to at-risk relatives. Genetic predictive tests are usually performed using PCR and sequencing of both strands of the amplicon that contains the muta-tion detected in the family.
RESULTS AND DISCUSSION
After 10 years of testing experience of genetic diagnosis for LS, we have found eight families with mutations in homopolymer surrounding sequences. All tumors analyzed in these families showed high microsatellite instability with posi-tive results for the five mononucleotide markers analyzed, as well as loss of inmunohistochemical
b) c.942+2T>A
NR2 NR27 BAT25 NR2 NR21 BAT26 BAT26 NR2 NR24
c) c.942+3A>T
a) WT Microsatellite stable tumor with normal expression of MSH2 protein
Microsatellite Instability with loss of MSH2 protein expression
Microsatellite Instability with loss of MSH2 protein expression
Figure 1 Microsatellite Instability analysis and loss of expression of MSH2 protein by Immunohistochemistry in colorectal tumors
a) wild-type control, b) and c) cases with c.942+2T>A and c.942+3A>T mutations, respectively. NR27, NR21, NR24, BAT25 and BAT26: microsatellite markers.
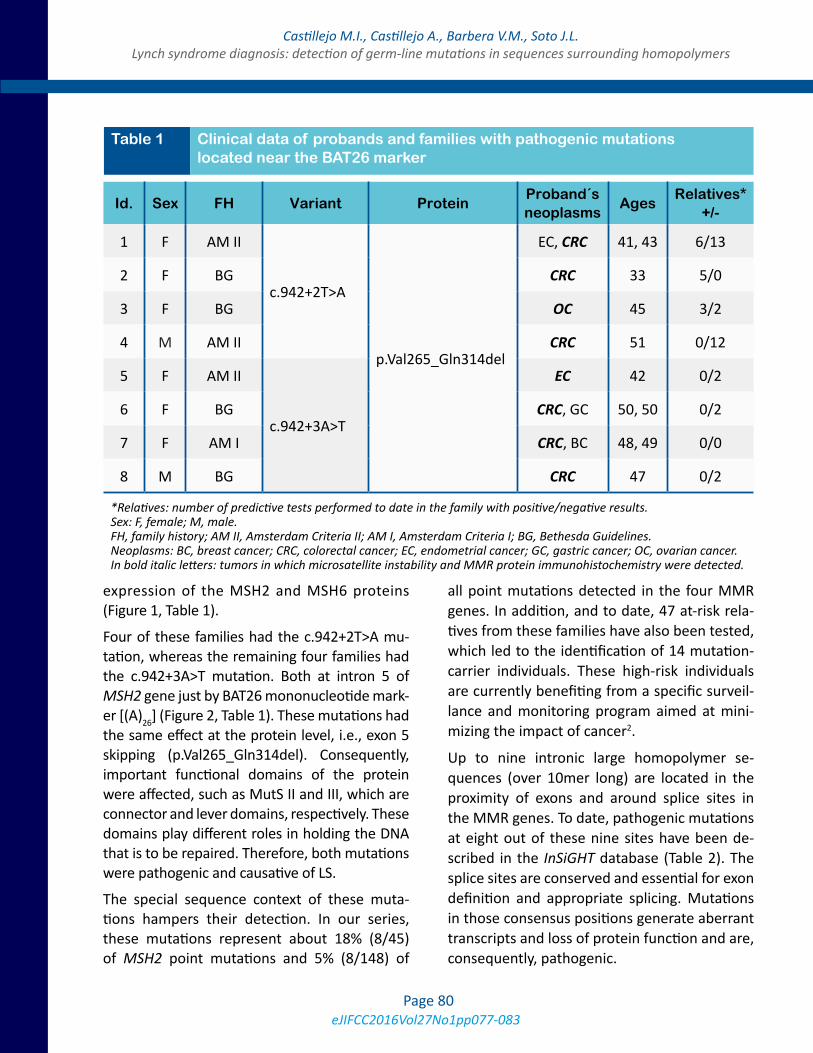
eJIFCC2016Vol27No1pp077-083Page 80
Castillejo M.I., Castillejo A., Barbera V.M., Soto J.L.Lynch syndrome diagnosis: detection of germ-line mutations in sequences surrounding homopolymers
expression of the MSH2 and MSH6 proteins (Figure 1, Table 1).
Four of these families had the c.942+2T>A mu-tation, whereas the remaining four families had the c.942+3A>T mutation. Both at intron 5 of MSH2 gene just by BAT26 mononucleotide mark-er [(A)26] (Figure 2, Table 1). These mutations had the same effect at the protein level, i.e., exon 5 skipping (p.Val265_Gln314del). Consequently, important functional domains of the protein were affected, such as MutS II and III, which are connector and lever domains, respectively. These domains play different roles in holding the DNA that is to be repaired. Therefore, both mutations were pathogenic and causative of LS.
The special sequence context of these muta-tions hampers their detection. In our series, these mutations represent about 18% (8/45) of MSH2 point mutations and 5% (8/148) of
all point mutations detected in the four MMR genes. In addition, and to date, 47 at-risk rela-tives from these families have also been tested, which led to the identification of 14 mutation-carrier individuals. These high-risk individuals are currently benefiting from a specific surveil-lance and monitoring program aimed at mini-mizing the impact of cancer2.
Up to nine intronic large homopolymer se-quences (over 10mer long) are located in the proximity of exons and around splice sites in the MMR genes. To date, pathogenic mutations at eight out of these nine sites have been de-scribed in the InSiGHT database (Table 2). The splice sites are conserved and essential for exon definition and appropriate splicing. Mutations in those consensus positions generate aberrant transcripts and loss of protein function and are, consequently, pathogenic.
Id. Sex FH Variant ProteinProband´s neoplasms
AgesRelatives*
+/-
1 F AM II
c.942+2T>A
p.Val265_Gln314del
EC, CRC 41, 43 6/13
2 F BG CRC 33 5/0
3 F BG OC 45 3/2
4 M AM II CRC 51 0/12
5 F AM II
c.942+3A>T
EC 42 0/2
6 F BG CRC, GC 50, 50 0/2
7 F AM I CRC, BC 48, 49 0/0
8 M BG CRC 47 0/2
Table 1 Clinical data of probands and families with pathogenic mutations located near the BAT26 marker
*Relatives: number of predictive tests performed to date in the family with positive/negative results. Sex: F, female; M, male. FH, family history; AM II, Amsterdam Criteria II; AM I, Amsterdam Criteria I; BG, Bethesda Guidelines. Neoplasms: BC, breast cancer; CRC, colorectal cancer; EC, endometrial cancer; GC, gastric cancer; OC, ovarian cancer. In bold italic letters: tumors in which microsatellite instability and MMR protein immunohistochemistry were detected.
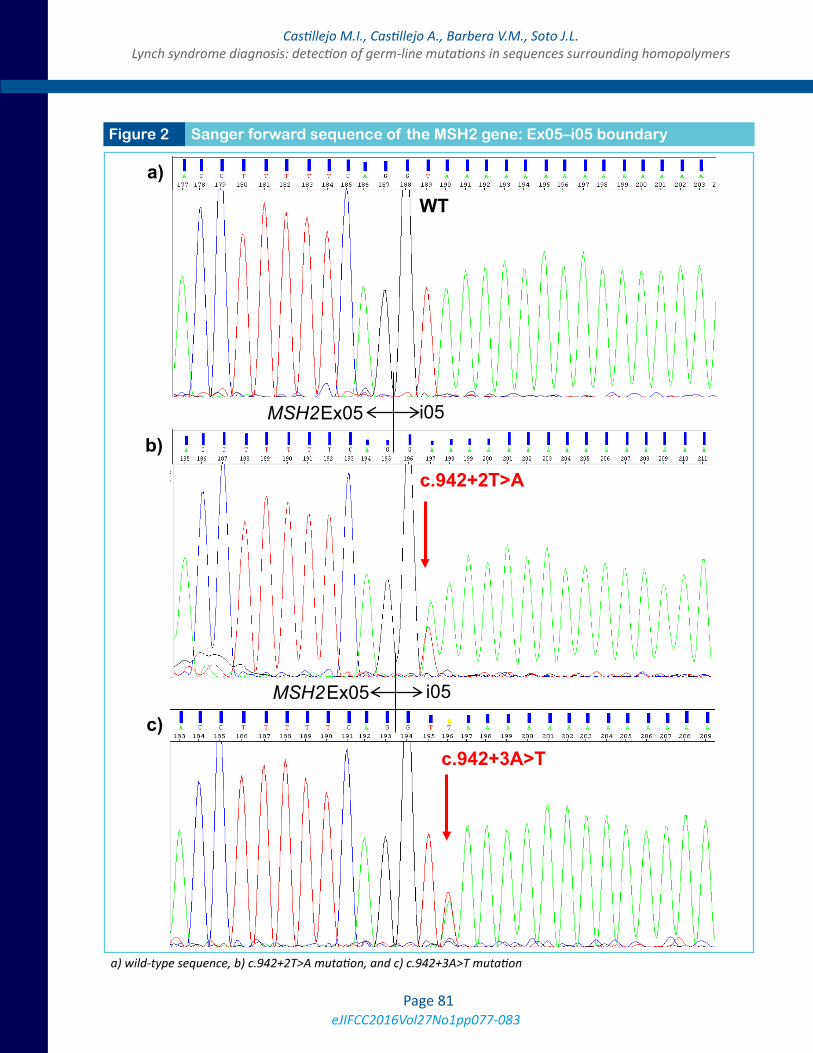
eJIFCC2016Vol27No1pp077-083Page 81
Castillejo M.I., Castillejo A., Barbera V.M., Soto J.L.Lynch syndrome diagnosis: detection of germ-line mutations in sequences surrounding homopolymers
Figure 2 Sanger forward sequence of the MSH2 gene: Ex05–i05 boundary
a) wild-type sequence, b) c.942+2T>A mutation, and c) c.942+3A>T mutation
WT
c.942+2T>A
i05Ex05MSH2
i05Ex05MSH2
c.942+3A>T
igure
a)
b)
c)
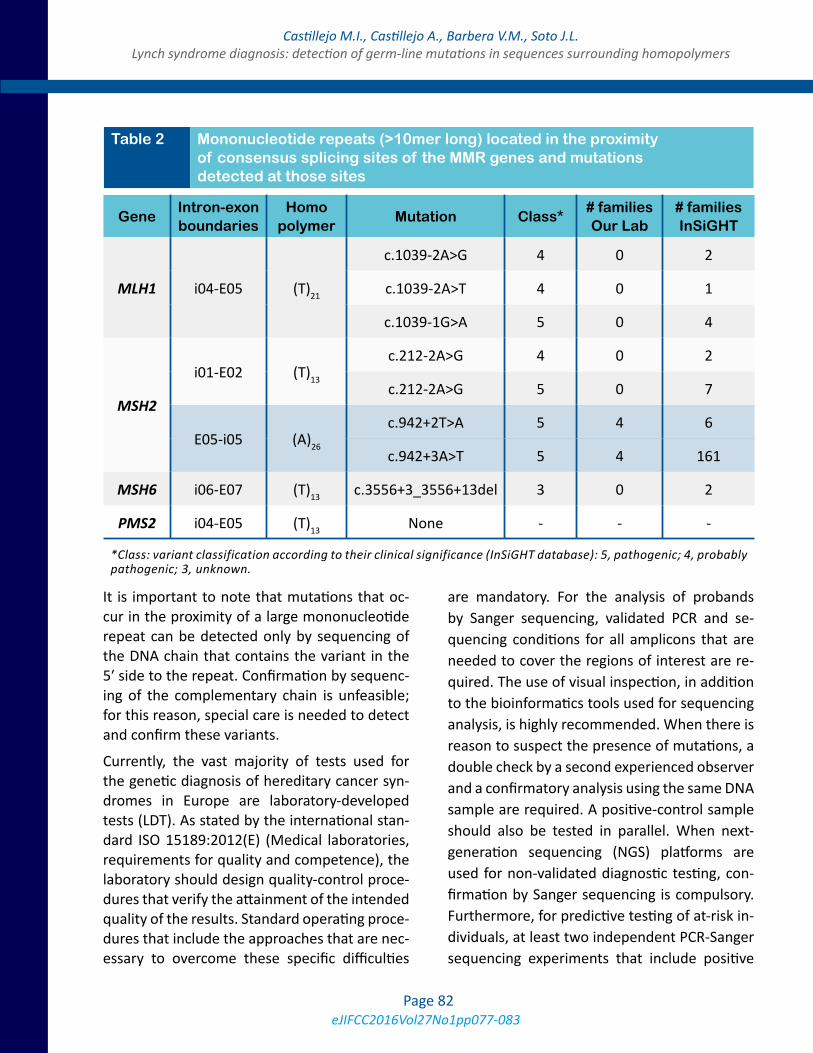
eJIFCC2016Vol27No1pp077-083Page 82
Castillejo M.I., Castillejo A., Barbera V.M., Soto J.L.Lynch syndrome diagnosis: detection of germ-line mutations in sequences surrounding homopolymers
It is important to note that mutations that oc-cur in the proximity of a large mononucleotide repeat can be detected only by sequencing of the DNA chain that contains the variant in the 5′ side to the repeat. Confirmation by sequenc-ing of the complementary chain is unfeasible; for this reason, special care is needed to detect and confirm these variants.
Currently, the vast majority of tests used for the genetic diagnosis of hereditary cancer syn-dromes in Europe are laboratory-developed tests (LDT). As stated by the international stan-dard ISO 15189:2012(E) (Medical laboratories, requirements for quality and competence), the laboratory should design quality-control proce-dures that verify the attainment of the intended quality of the results. Standard operating proce-dures that include the approaches that are nec-essary to overcome these specific difficulties
are mandatory. For the analysis of probands by Sanger sequencing, validated PCR and se-quencing conditions for all amplicons that are needed to cover the regions of interest are re-quired. The use of visual inspection, in addition to the bioinformatics tools used for sequencing analysis, is highly recommended. When there is reason to suspect the presence of mutations, a double check by a second experienced observer and a confirmatory analysis using the same DNA sample are required. A positive-control sample should also be tested in parallel. When next-generation sequencing (NGS) platforms are used for non-validated diagnostic testing, con-firmation by Sanger sequencing is compulsory. Furthermore, for predictive testing of at-risk in-dividuals, at least two independent PCR-Sanger sequencing experiments that include positive
GeneIntron-exon boundaries
Homo polymer
Mutation Class*# familiesOur Lab
# familiesInSiGHT
MLH1 i04-E05 (T)21
c.1039-2A>G 4 0 2
c.1039-2A>T 4 0 1
c.1039-1G>A 5 0 4
MSH2
i01-E02 (T)13
c.212-2A>G 4 0 2
c.212-2A>G 5 0 7
E05-i05 (A)26
c.942+2T>A 5 4 6
c.942+3A>T 5 4 161
MSH6 i06-E07 (T)13 c.3556+3_3556+13del 3 0 2
PMS2 i04-E05 (T)13 None - - -
Table 2 Mononucleotide repeats (>10mer long) located in the proximity of consensus splicing sites of the MMR genes and mutations detected at those sites
*Class: variant classification according to their clinical significance (InSiGHT database): 5, pathogenic; 4, probably pathogenic; 3, unknown.
eJIFCC2016Vol27No1pp077-083Page 83
Castillejo M.I., Castillejo A., Barbera V.M., Soto J.L.Lynch syndrome diagnosis: detection of germ-line mutations in sequences surrounding homopolymers
and negative controls of the genetic variants in question are recommended.
In conclusion, the detection of pathogenic mu-tations located near microsatellite sequences is especially difficult and requires the implemen-tation of specific quality controls to optimize di-agnostic methods.
REFERENCES1. Rustgi AK. The genetics of hereditary colon cancer. Genes Dev. 2007, 15;21(20): p. 2525-38.
2. Vasen HF, et al. Revised guidelines for the clinical man-agement of Lynch syndrome (HNPCC): recommenda-tions by a group of European experts.Gut. 2013,62(6): p. 812-23.
3. Cuevas-Cuerda D, Salas-Trejo D. Evaluation after five years of the cancer genetic counselling programme of
Valencian Community (Eastern Spain). Fam Cancer. 2014, 13(2): p. 301-9.
4. Umar A, et al. Revised Bethesda Guidelines for heredi-tary nonpolyposis colorectal cancer (Lynch syndrome) and microsatellite instability. J Natl Cancer Inst. 2004, 18;96(4): p. 261-8.
5. Pérez-Carbonell L, et al. Comparison between univer-sal molecular screening for Lynch syndrome and revised Bethesda guidelines in a large population-based cohort of patients with colorectal cancer. Gut. 2012, 61(6): p. 865-72.
6. Wahlberg SS, et al. Evaluation of microsatellite insta-bility and Immunohistochemistry for the prediction of germ-line MSH2 and MLH1 mutations in hereditary non-polyposis colon cancer families. Cancer Research 2002, 62: p. 3485-92.
7. Thompson BA, et al. Application of a 5-tiered scheme for standardized classification of 2,360 unique mismatch repair gene variants in the InSiGHT locus-specific data-base. Nat Genet. 2014, 46(2): p. 107-15.
eJIFCC2016Vol27No1pp084-087Page 84
A R T I C L E I N F O A B S T R A C T
Like every human activity, clinical laboratories pro-duce a carbon foot-print which they have a societal obligation to reduce. The renovation or construc-tion of a new laboratory provides an opportunity to achieve this. A new, environmentally-friendly diag-nostic centre in the city of Surabaya, Indonesia, was recently constructed under the supervision of a LEED (Leadership in Energy and Environmental Design) - certified architect incorporating the three basic te-nets of good environmental practices, i.e. to reduce, reuse and recycle. Sustainable practices that were ad-opted in the construction of the building involved its architectural features, the location and the construc-tion materials used. The building has been designed for energy and water conservation in the long-term. The cost for these green features was an additional 30% compared to that of a conventional building. It is expected that this extra cost will be recouped in the long run through cost-savings.
Corresponding author:Joseph B. Lopez 17 Jalan SS 21/46, Damansara Utama 47400 Petaling Jaya MalaysiaE-mail: [email protected]
The first green diagnostic centre and laboratory building in IndonesiaJoseph B. Lopez1, Endang Hoyaranda2, Ivan Priatman3
1 Immediate Past President, APFCB, Kuala Lumpur, Malaysia2 Secretary, APFCB; Prodia, Jakarta, Indonesia3 ARCHIMETRIC, Surabaya, Indonesia
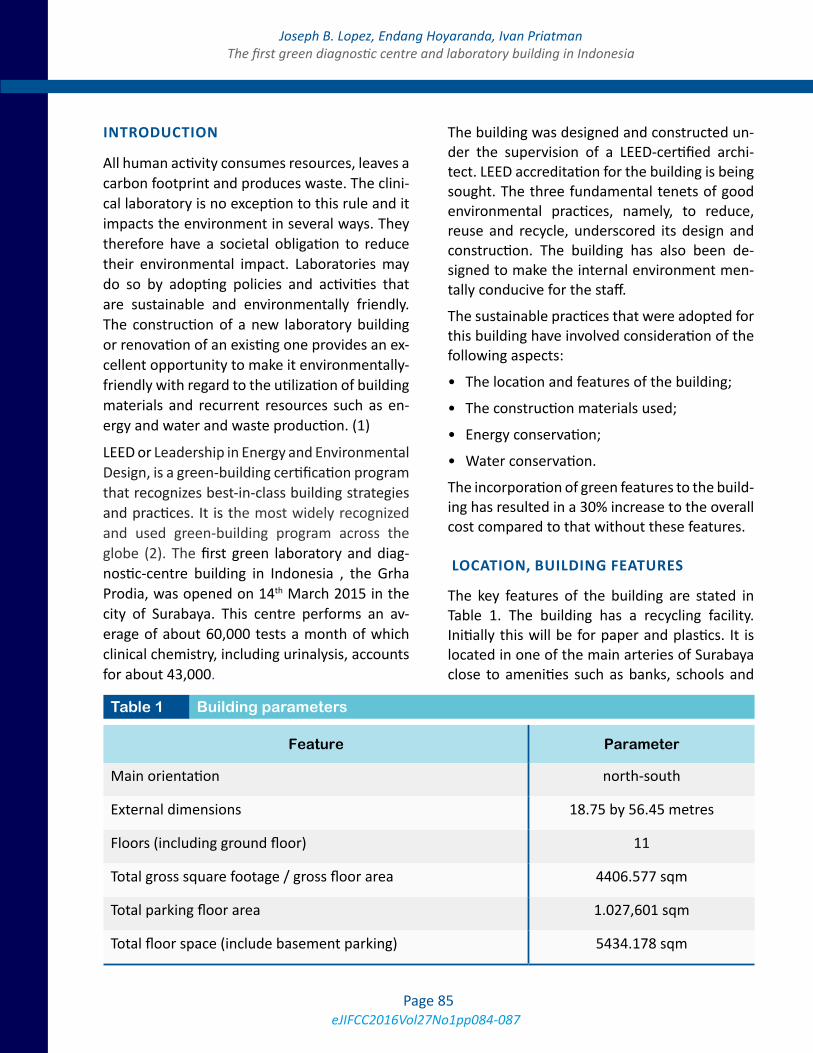
eJIFCC2016Vol27No1pp084-087Page 85
Joseph B. Lopez, Endang Hoyaranda, Ivan PriatmanThe first green diagnostic centre and laboratory building in Indonesia
INTRODUCTION
All human activity consumes resources, leaves a carbon footprint and produces waste. The clini-cal laboratory is no exception to this rule and it impacts the environment in several ways. They therefore have a societal obligation to reduce their environmental impact. Laboratories may do so by adopting policies and activities that are sustainable and environmentally friendly. The construction of a new laboratory building or renovation of an existing one provides an ex-cellent opportunity to make it environmentally-friendly with regard to the utilization of building materials and recurrent resources such as en-ergy and water and waste production. (1)
LEED or Leadership in Energy and Environmental Design, is a green-building certification program that recognizes best-in-class building strategies and practices. It is the most widely recognized and used green-building program across the globe (2). The first green laboratory and diag-nostic-centre building in Indonesia , the Grha Prodia, was opened on 14th March 2015 in the city of Surabaya. This centre performs an av-erage of about 60,000 tests a month of which clinical chemistry, including urinalysis, accounts for about 43,000.
The building was designed and constructed un-der the supervision of a LEED-certified archi-tect. LEED accreditation for the building is being sought. The three fundamental tenets of good environmental practices, namely, to reduce, reuse and recycle, underscored its design and construction. The building has also been de-signed to make the internal environment men-tally conducive for the staff.
The sustainable practices that were adopted for this building have involved consideration of the following aspects:
• The location and features of the building;
• The construction materials used;
• Energy conservation;
• Water conservation.
The incorporation of green features to the build-ing has resulted in a 30% increase to the overall cost compared to that without these features.
LOCATION, BUILDING FEATURES
The key features of the building are stated in Table 1. The building has a recycling facility. Initially this will be for paper and plastics. It is located in one of the main arteries of Surabaya close to amenities such as banks, schools and
Feature Parameter
Main orientation north-south
External dimensions 18.75 by 56.45 metres
Floors (including ground floor) 11
Total gross square footage / gross floor area 4406.577 sqm
Total parking floor area 1.027,601 sqm
Total floor space (include basement parking) 5434.178 sqm
Table 1 Building parameters
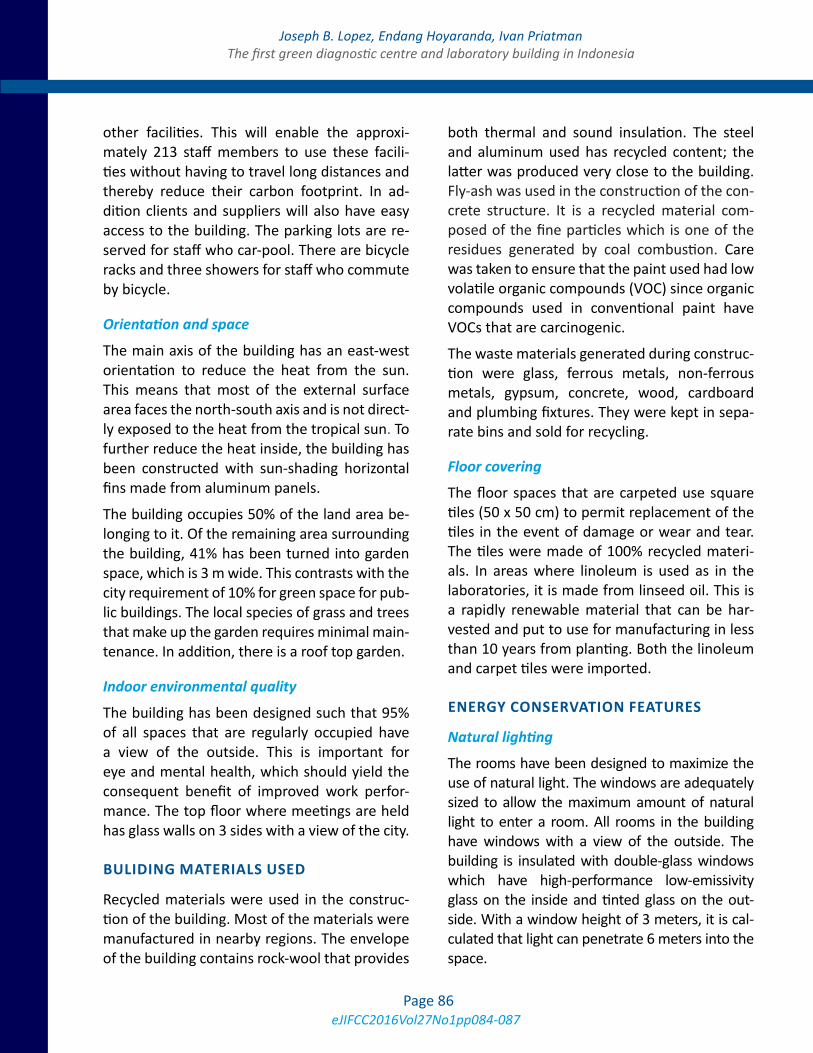
eJIFCC2016Vol27No1pp084-087Page 86
Joseph B. Lopez, Endang Hoyaranda, Ivan PriatmanThe first green diagnostic centre and laboratory building in Indonesia
other facilities. This will enable the approxi-mately 213 staff members to use these facili-ties without having to travel long distances and thereby reduce their carbon footprint. In ad-dition clients and suppliers will also have easy access to the building. The parking lots are re-served for staff who car-pool. There are bicycle racks and three showers for staff who commute by bicycle.
Orientation and space
The main axis of the building has an east-west orientation to reduce the heat from the sun. This means that most of the external surface area faces the north-south axis and is not direct-ly exposed to the heat from the tropical sun. To further reduce the heat inside, the building has been constructed with sun-shading horizontal fins made from aluminum panels.
The building occupies 50% of the land area be-longing to it. Of the remaining area surrounding the building, 41% has been turned into garden space, which is 3 m wide. This contrasts with the city requirement of 10% for green space for pub-lic buildings. The local species of grass and trees that make up the garden requires minimal main-tenance. In addition, there is a roof top garden.
Indoor environmental quality
The building has been designed such that 95% of all spaces that are regularly occupied have a view of the outside. This is important for eye and mental health, which should yield the consequent benefit of improved work perfor-mance. The top floor where meetings are held has glass walls on 3 sides with a view of the city.
BULIDING MATERIALS USED
Recycled materials were used in the construc-tion of the building. Most of the materials were manufactured in nearby regions. The envelope of the building contains rock-wool that provides
both thermal and sound insulation. The steel and aluminum used has recycled content; the latter was produced very close to the building. Fly-ash was used in the construction of the con-crete structure. It is a recycled material com-posed of the fine particles which is one of the residues generated by coal combustion. Care was taken to ensure that the paint used had low volatile organic compounds (VOC) since organic compounds used in conventional paint have VOCs that are carcinogenic.
The waste materials generated during construc-tion were glass, ferrous metals, non-ferrous metals, gypsum, concrete, wood, cardboard and plumbing fixtures. They were kept in sepa-rate bins and sold for recycling.
Floor covering
The floor spaces that are carpeted use square tiles (50 x 50 cm) to permit replacement of the tiles in the event of damage or wear and tear. The tiles were made of 100% recycled materi-als. In areas where linoleum is used as in the laboratories, it is made from linseed oil. This is a rapidly renewable material that can be har-vested and put to use for manufacturing in less than 10 years from planting. Both the linoleum and carpet tiles were imported.
ENERGY CONSERVATION FEATURES
Natural lighting
The rooms have been designed to maximize the use of natural light. The windows are adequately sized to allow the maximum amount of natural light to enter a room. All rooms in the building have windows with a view of the outside. The building is insulated with double-glass windows which have high-performance low-emissivity glass on the inside and tinted glass on the out-side. With a window height of 3 meters, it is cal-culated that light can penetrate 6 meters into the space.
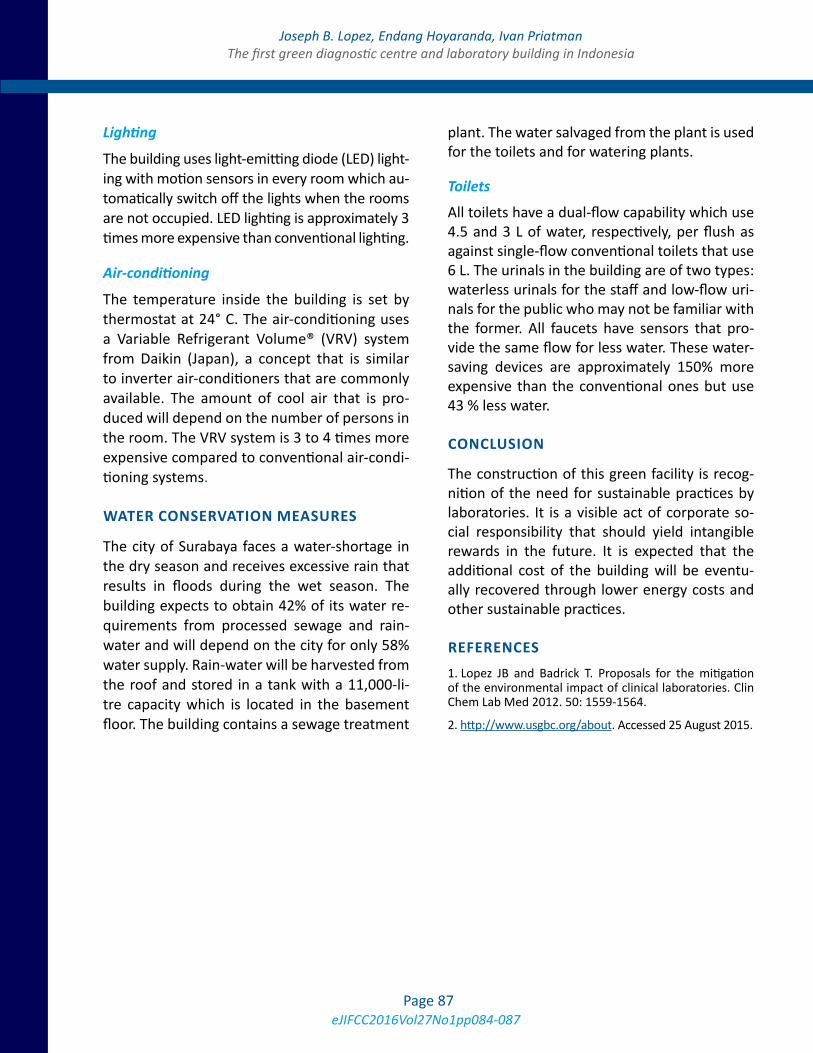
eJIFCC2016Vol27No1pp084-087Page 87
Joseph B. Lopez, Endang Hoyaranda, Ivan PriatmanThe first green diagnostic centre and laboratory building in Indonesia
Lighting
The building uses light-emitting diode (LED) light-ing with motion sensors in every room which au-tomatically switch off the lights when the rooms are not occupied. LED lighting is approximately 3 times more expensive than conventional lighting.
Air-conditioning
The temperature inside the building is set by thermostat at 24° C. The air-conditioning uses a Variable Refrigerant Volume® (VRV) system from Daikin (Japan), a concept that is similar to inverter air-conditioners that are commonly available. The amount of cool air that is pro-duced will depend on the number of persons in the room. The VRV system is 3 to 4 times more expensive compared to conventional air-condi-tioning systems.
WATER CONSERVATION MEASURES
The city of Surabaya faces a water-shortage in the dry season and receives excessive rain that results in floods during the wet season. The building expects to obtain 42% of its water re-quirements from processed sewage and rain-water and will depend on the city for only 58% water supply. Rain-water will be harvested from the roof and stored in a tank with a 11,000-li-tre capacity which is located in the basement floor. The building contains a sewage treatment
plant. The water salvaged from the plant is used for the toilets and for watering plants.
Toilets
All toilets have a dual-flow capability which use 4.5 and 3 L of water, respectively, per flush as against single-flow conventional toilets that use 6 L. The urinals in the building are of two types: waterless urinals for the staff and low-flow uri-nals for the public who may not be familiar with the former. All faucets have sensors that pro-vide the same flow for less water. These water-saving devices are approximately 150% more expensive than the conventional ones but use 43 % less water.
CONCLUSION
The construction of this green facility is recog-nition of the need for sustainable practices by laboratories. It is a visible act of corporate so-cial responsibility that should yield intangible rewards in the future. It is expected that the additional cost of the building will be eventu-ally recovered through lower energy costs and other sustainable practices.
REFERENCES1. Lopez JB and Badrick T. Proposals for the mitigation of the environmental impact of clinical laboratories. Clin Chem Lab Med 2012. 50: 1559-1564.
2. http://www.usgbc.org/about. Accessed 25 August 2015.
Editor-in-chiefGábor L. KovácsInstitute of Laboratory Medicine, Faculty of Medicine, University of Pécs, Hungary
Assistant EditorHarjit Pal BhattoaDepartment of Laboratory Medicine, University of Debrecen, Hungary
Editorial Board
Khosrow Adeli, The Hospital for Sick Children, University of Toronto, Canada
Borut Božič, University Medical Center, Lubljana, Slovenia
Rajiv Erasmus, Dept. of Chemical Pathology, Tygerberg, South Africa
Nilda E. Fink, Universidad Nacional de La Plata, La Plata, Argentina
Mike Hallworth, Shrewsbury, United Kingdom
Ellis Jacobs, Alere Inc., New York, USA
Bruce Jordan, Roche Diagnostics, Rotkreuz, Switzerland
Evelyn Koay, National University, Singapore
Maria D. Pasic, Laboratory Medicine and Pathobiology, University of Toronto, Canada
Oliver Racz, University of Kosice, Slovakia
Rosa Sierra Amor, Laboratorio Laquims, Veracruz, Mexico
Sanja Stankovic, Institute of Medical Biochemistry, Clinical Center of Serbia, Belgrade, Serbia
Danyal Syed, Ryancenter, New York, USA
Grazyna Sypniewska, Collegium Medicum, NC University, Bydgoszcz, Poland
Peter Vervaart, LabMed Consulting, Australia
Stacy E. Walz, Arkansas State University, USA
Publisher: IFCC Communications and Publications Division (IFCC-CPD)
Copyright © 2016 IFCC. All rights reserved.
The eJIFCC is a member of the Committee on Publication Ethics (COPE).
The eJIFCC (Journal of the International Federation of Clinical Chemistry) is an electronic journal with frequent updates on its home page. Our articles, debates, reviews and editorials are addressed to clinical laboratorians. Besides offering original scientific thought in our featured columns, we provide pointers to quality resources on the World Wide Web.
Contents may not be reproduced without the prior permission of the Communications and Publications Division (CPD) of the IFCC.
Produced by: www.insoftdigital.com
Published by: www.ifcc.org