Fertilizing for Irrigated Cornipni.net/ipniweb/portal.nsf/0/1510bfb2a4649f7c8525756f005899e9... ·...
52
Fertilizing for Irrigated Corn Guide to Best Management Practices Edited by W.M. Stewart and W.B. Gordon
Transcript of Fertilizing for Irrigated Cornipni.net/ipniweb/portal.nsf/0/1510bfb2a4649f7c8525756f005899e9... ·...

Fertilizing for
Irrigated CornGuide to
Best Management Practices
Edited by W.M. Stewart and W.B. Gordon
Irrigated corn production is an important component of agricultural systems in some parts of the central and southern Great Plains of the United States. Abundant sunlight and deep, well-drained soils enable farmers to produce top yields where irrigation is available. Adequate and balanced nutrient inputs are critical to produc-ing optimum yields that result in maximum profit. This manual was designed and authored by industry, university, and government soil fertility experts from across the central and southern Plains to address fundamental irrigated corn fertility questions and issues particular to this region.

Chapter l. Soil Sampling, Soil Testing, and Fertility Program Development ....1-1Dr. Dale Leikam
Chapter 2. Fertilizer Sources .................................................................2-1Dr. W.M. (Mike) Stewart
Chapter 3. Nitrogen Management ............................................................3-1Dr. Larry Maddux and Dr. Ardell Halvorson
Chapter 4. Phosphorus Management ........................................................4-1Dr. Keith Janssen
Chapter 5. Potassium Management ..........................................................5-1Dr. W.B. (Barney) Gordon
Chapter 6. Managing Secondary Nutrients and Micronutrients ......................6-1Dr. Alan Blaylock
Chapter 7. Starter Fertilizer ...................................................................7-1Dr. W.B. (Barney) Gordon
Chapter 8. Enhancing Nitrogen Use Efficiency in Irrigated Corn Using Sensor Technology ................................................................8-1
Dr. David B. Mengel
Fertilizing for Irrigated Corn—
Guide to Best Management PracticesEdited by Dr. W.M. (Mike) Stewart, International Plant Nutrition Institute, and Dr. W.B. Gordon, Kansas State University. Published by the International Plant Nutrition Institute, 2008.
Cover photo courtesy of Harlen PersingerInside front cover photo courtesy of Dietrich Kastens
This publication is one of a series prepared by cooperators with the staff of the International Plant Nutrition Institute (IPNI). It is part of a project in cooperation with the Foundation for Agronomic Research (FAR) toward fulfilling the goals of a 3-year Con-servation Innovation Grant (CIG 68-3A75-5-166) from the USDA-Natural Resources Conservation Service to identify fertilizer best management practices (BMPs). The intent of this publication is to help develop the BMP definition process in such a way that environmental objectives are met without sacrificing current or future production or profit potential and in full consideration of the newer technologies relevant to fertilizer use. The concept of applying the right fertilizer at the “right rate, right time, and right place” is a guiding theme in this series. For additional information, visit the websites: www.farmresearch.com/CIG and www.ipni.net. Item # 30-3240
Contents


Fertilizing for Irrigated Corn–Guide to Best Management Practices / Leikam 1-1
Fertilizing for Irrigated Corn — Chapter 1
Soil Sampling, Soil Testing, and Fertility Program DevelopmentBy Dale Leikam
There are very few fields that do not require the addition of crop nutrients to provide for efficient and profitable
corn production in the central Great Plains region. The most common limiting nutrients are N, P, K, S, Cl-, Zn, and Fe. The estimated uptake of these nutrients by a 150 bu/A corn crop is presented in Table1. Keep in mind that the values presented are not the amount of nutrients that need to be applied, but rather the total uptake by the corn crop from soil, fertilizer, and other sources.
Soil testing is an important tool for estimating crop nutrient needs and is the cornerstone of any well-designed fertil-ity program. A sound soil testing program is essential for making wise fertility program decisions. Without historical soil test information for each field, or portions of a field, the development of an efficient fertility program is severely hampered. A key to developing the greatest value of soil testing is to recognize that a single soil sample/test from a field has only limited value since soil test values may vary year-to-year. The real value is the development of a soil test history so that trends can be evaluated and acted upon. Providing a fertility history is really what soil testing does best.
A common complaint about soil testing is that different recommendations often result if the same sample is sent to different laboratories…and these differences are appar-ent when comparisons are made among both university and commercial laboratories. There are several things to keep in mind relative to these questions and comments. First, the final product of soil testing is not a specific prescription for the precise amount of fertilizer to apply to a specific field. The product of soil testing is simply an additional piece of important information to use when developing
an overall farmer/field specific fertility program. Second, fertilizer recommendations must include more than just a suggested application rate – application method and tim-ing are equally important. Third, differences in rate rec-ommendations are generally the result of differences in the interpretation of analytical results and not a difference in laboratory analytical values. And finally, soil testing is not the same thing as fertilizer recommendations – these terms are not synonymous and should not be used inter-changeably. There are several steps involved in developing a fertility program for a specific farmer/field utilizing soil testing:
1) Collecting a good representative sample (represen-tative of field or portion of field);
2) Proper care of the sample after collection (contami-nation, microbial processes, etc.);
3) Chemical analysis at the laboratory (appropriate tests that have regional meaning);
4) Interpretation of analytical results relative to his-torical research base;
5) Integrating interpretations to fit farmer/field spe-cific goals/conditions.
SoilSampling,LaboratoryAnalysis,andInterpretation
The importance of collecting a good sample cannot be over-emphasized. No matter how accurate the analytical results or how knowledgeable the person who interprets the results, the developed fertility programs cannot be bet-ter than the initial sample collected. If the sample is not representative of the field or area of the field in question, then the analytical results will be of little value.
While there can be large variations in soil test values with-in a field, equally large variations exist for samples col-lected only inches apart. As a result of this variability, it is necessary to collect and consolidate 15 to 20 individual subsamples from each field or portion of a field regardless of the acreage represented by the sample. At a minimum, it is best to collect a separate composite sample for each 40 acres in a field. Regardless if the field is to be managed uniformly across the whole field or if inputs will be variably managed within a field, it is best to delineate and indi-
Abbreviations and notes for this article: N = nitrogen; P = phosphorus; K = potassium; S = sulfur; Cl- = chloride; Zn = zinc; Fe = iron; ppm = parts per million; NO
3- = nitrate; SO
4 = sulfate.
Table 1. Estimated total nutrient uptake by 150 bu/A corn crop.
Estimated nutrient removalNutrient Grain Stover Total uptake
- - - - - - - - - - - - lb nutrient/A - - - - - - - - - - - -N 135 95 230P
2O
555 30 85
K2O 40 140 180
S 12 12 25Zn 0.15 0.30 0.45Adapted by author from several university sources in the central Plains.

1-2 Fertilizing for Irrigated Corn–Guide to Best Management Practices / Leikam
vidually sample portions of the fields that are similar (e.g. top, side-slope, bottom of hills; high, medium, low yielding portions of a field; etc.). The greater the number of samples collected from a field, the better the information base will be on which to develop an overall fertility program.
Soil sampling depth is extremely important and should be consistent from person-to-person and year-to-year. Proper sampling depth for soil pH, organic matter (OM), P, K, and Zn is the surface 6 to 8 in. since this is the depth used for calibrating the soil tests in university research. Sam-pling deeper or shallower than this will provide misleading results. An exception is for no-till and very reduced-till systems where soil pH should be monitored and managed to a depth of 2 to 3 in., as that is the limit of the depth to which soil acidity accumulates in these systems. For avail-able NO
3-N, Cl-, and SO
4-S, samples should be collected
to a minimum depth of 24 in. (or depth of soil if less than 24 in.) since these nutrients are mobile in soils. Deeper sampling may provide more reliability in estimating re-sidual soil N availability. The importance of consistency of sampling depth cannot be overemphasized. Remember, the consistency of sampling depth from person-to-person and year-to-year is extremely important for developing the long-term value of a soil test history.
After collecting the sample, proper care is essential to obtaining reliable results. Very small amounts of contami-nants can have large effects on analytical results obtained at the laboratory. It is recommended that plastic pails be used for compositing the subsamples in the field. Metal pails often contaminate the sample, rendering it useless for Zn and/or Fe analysis. Plastic pails with rounded surfaces are also easier to keep clean.
If available NO3-N and/or SO
4-S are requested for analysis,
the samples should be delivered to the laboratory immedi-ately after collection in order to minimize microbial min-eralization of organic nutrients. If the samples cannot be delivered to the laboratory in a timely manner, the samples should be air-dried or frozen. Normally, spreading samples on a clean surface and air drying the samples overnight will be adequate, although very wet samples may take longer. All samples should be submitted to the laboratory as soon as possible to minimize the potential for contamination.
Soil testing laboratories are in business to provide accurate analytical results in a timely manner, utilizing tests that are appropriate for specific conditions in a geographic region. While soil testing laboratories can perform analytical tests for any and all essential crop nutrients, it is not always appropriate to run tests for nutrients that research has not shown a need for. If a crop response has not been observed in research trials for a given crop and/or geographic area, then proper correlation, calibration, and interpretation of
the laboratory analytical results are not possible. There are many good commercial and university laboratories in the Great Plains region and most have stringent quality control procedures that make the chance for error quite low. In fact, the actual chemical analysis by the laboratory is gen-erally the step that results in the least amount of variability or error in the overall soil testing process.
Following the actual soil test analysis by the laboratory, the results must be interpreted to be of any value. In general, recommendation guidelines for the amount of a nutrient to apply are most often based on a specific year/field soil test value and on an interpretation of research data collected for that specific soil test over a period of years. For nutri-ents such as P, K, and/or Zn, soil testing generally provides an index of the relative ability of a soil to supply a nutrient to the crop – not the amount of available nutrient present in the soil. For these nutrients, what soil testing does best is provide an estimation of the probability of obtaining an economical response if that specific nutrient is applied to the crop. Secondly, it offers a long-term approximation of the percent of maximum yield that will be realized if the nutrient in question is not applied. And while it is widely believed that soil testing accurately predicts the specific rate of a nutrient (e.g. P, K, Zn) to be applied for optimum crop production in all situations – it really doesn’t.
For N, S, and Cl- in the Great Plains, the soil test does es-timate the actual amount of plant-available nutrient in the sample depth submitted to the laboratory. These nutrients (NO
3-N, Cl-, and SO
4-S) are present as anions in the soil
solution and are mobile with soil water. As a result, it is important to sample deeper in the soil profile than for other nutrients that are generally immobile in the soil (e.g. P, K, and Zn).
Sound corn production fertility programs depend on a comprehensive soil testing program, accurate and appro-priate procedures, reliable guidelines based on long-term research and knowledge of how to refine guidelines into efficient and profitable fertility programs.
SettingaYieldGoalYield goal (expected yield) is an important input required for planning efficient fertility programs. Oftentimes, how-ever, too little thought is given to setting appropriate yield goals on a field-by-field basis or for various management zones within a field. There are many opinions on how re-alistic yield goals should be determined. Some suggest av-eraging the past five years, excluding atypical low yields caused by factors such as drought or hail, and adding 5 to 10% to account for continuous yield improvement. This is likely best suited for systems with relatively small year-to-year yield variability, such as irrigated production systems.
Fertilizing for Irrigated Corn–Guide to Best Management Practices / Leikam 1-3
program. Much of the corn production in this area is on irrigated sands where N leaching is the main factor reduc-ing N use efficiency. Minimizing the potential for N leach-ing loss is the most important factor for improved crop pro-duction profitability and environmental protection under these conditions. This is especially important in areas with coarse textured soils and a relatively shallow aquifer.
At the same time, there is significant irrigated acreage of corn production on medium-fine textured soils. Denitrifica-tion is the main cause for concern in these areas since there is minimal potential for significant N leaching. The same is true for dryland corn production on the claypan soils of southeast Kansas and other scattered poorly drained soils in the other parts of the central Plains. And for dryland production in the western part of the Plains states, timing applications so that N is moved into the soil profile with limited precipitation is important for making most efficient use of applied N.
Optimum N application rates in the central Plains are best determined by carefully accounting for residual profile N (profile NO
3-N soil test) and expected contributions from
soil OM, previous legume crops, manure applications, and available N from irrigation water. Estimated N uptake for corn is about 1.5 to 1.6 lb of N/bu (Table1; grain and stover). This is in part the basis for Kansas State University corn N recommendations. Nebraska N recommendations are somewhat similar, but generally suggest lower N ap-plications at yield levels above ~150 bu/A. KSU Nrec = (Yield Goal x 1.6) – (Profile N) – (20 x %OM) – Other N Credits (Source: Kansas State University, 2003)
Nebraska Nrec = 35 + (Yield Goal x 1.2) – (Profile N) – (0.14 x Yield Goal x %OM) – Other N Credits (Souce: Shapiro et al., 2003)
Summarized information from the central Plains on le-gume crop N credits is presented in Table2. Note that the amount of N that should be credited varies with the overall stand of legume remaining prior to planting corn. While a previous excellent stand of alfalfa may provide most of the N required for corn production, a poor stand may contrib-ute little N to a following corn crop. Also note that these
Others suggest setting the yield goal near the maximum attained on a given field in order to take advantage of good years and not be overly influenced by very low yields. This approach is likely best suited to dryland production in the central Great Plains.
Regardless of how yield goals are established, it is impor-tant to give adequate thought to setting realistic, but ag-gressive, yield goals on a field-by-field basis. Establishing field by field yield goals is an important part of the plan-ning process.
SpecificNutrientConsiderations
NitrogenManagement decisions for N in corn are dependent on several factors, including: water management if irrigated, soil texture, options available for N fertilizer application, manure application history, soil OM content, residual soil profile NO
3-N content, residue management system, and
previous crop and tillage system adjustments. While N ap-plication rate is the first thing that often comes to mind when discussing corn N recommendations, the time and method of N application are as important as N applica-tion rate. How the N is applied, how much N is applied and how/when N is applied all have dramatic effects on N use efficiency by the corn crop. However, for irrigated crop production, N management must begin with water manage-ment.
For corn grown in the central Plains, widely varying soils, climate, and cultural conditions have large effects on expected N use efficiency for a specific N management
Table 2. Summary of estimated legume crop N credits from central Plains.
Previous crop/stand N creditAlfalfa Excellent stand (>5 plants/ft2) 120 lb N/A Good stand (2-5 plants/ft2) 80 lb N/A Fair stand (1-2 plants/ft2) 40 lb N/A Poor stand (<1 plant/ft2) 0 lb N/ASoybeans 40 to 50 lb N/AClovers 60 to 80% of Alfalfa creditsOther legume crops 0 lb N/AAdapted by author from several university sources in the central Plains.
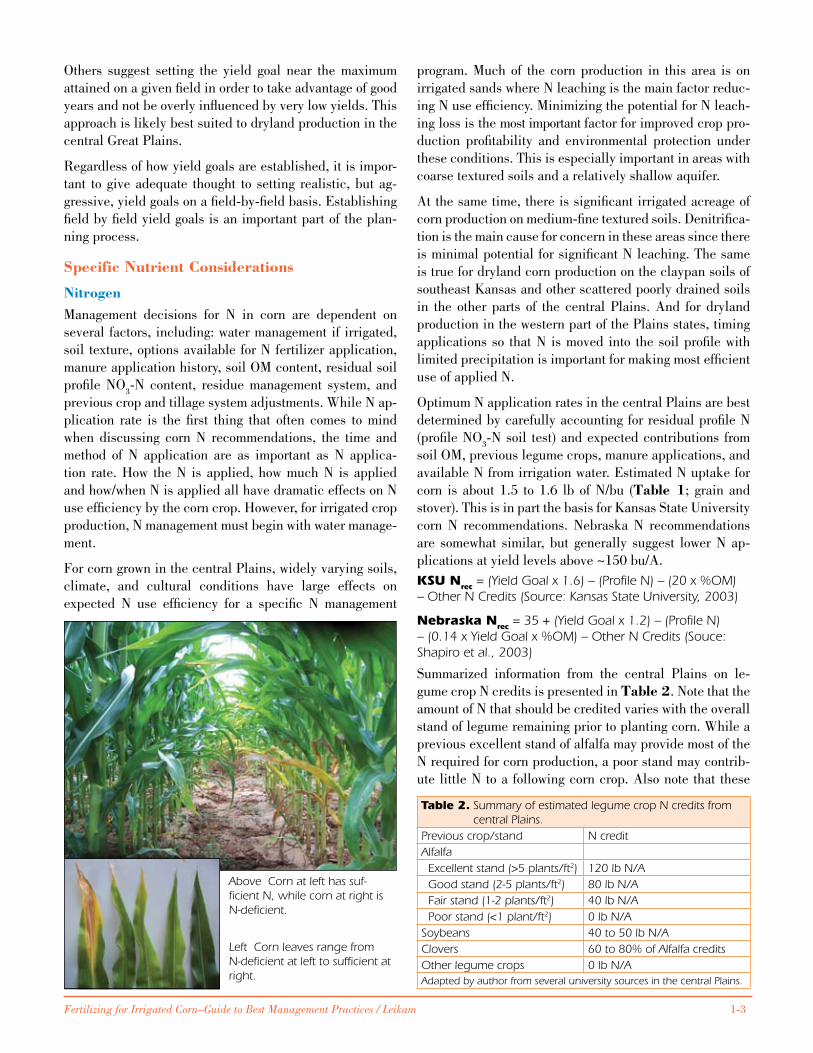
Above Corn at left has suf-ficient N, while corn at right is N-deficient.
Left Corn leaves range from N-deficient at left to sufficient at right.

1-4 Fertilizing for Irrigated Corn–Guide to Best Management Practices / Leikam
legume crop N credits assume destruction of the previous legume crop stand with tillage – no-till systems may con-tribute less to the corn crop immediately following.
PhosphorusMany metabolic processes within the plant require P. Pho-tosynthesis, respiration, carbohydrate synthesis and utili-zation, cell division, reproduction, and energy transfer all require P. If P becomes deficient, then crop growth, grain production, and profitability all will suffer. While less P is found in plants than either N or K, sizeable amounts are removed in the harvested portions of crops. For corn, regional estimates of the amount of P removed are in the range of 0.30 to 0.38 lb of P
2O
5 equivalent removal with
each bushel of corn grain (Table1). Lower grain P values may result on low P testing soils, while higher grain P con-tents are likely with high or very high P soil test values.
While soil testing is critical for developing P fertility pro-grams, it is important to recognize that soil testing doesn’t tell us how much P is “available” in the soil. Due to com-plex reactions involving P in soils, soil testing only pro-vides an index value that can be used to estimate the soils relative ability to supply P to growing crops. The meaning of these index values varies depending on the specific soil test procedure used, the depth of sampling, and other field specific factors that affect P uptake by corn.
There are two main approaches to producers for managing P. ‘Sufficiency’ P fertility programs are intended to estimate the long-term average amount of fertilizer P required to, on the average, provide optimum economic return in the year of nutrient application while achieving about 90 to 95% of maximum yield. In some years, greater amounts of nutrient are required for optimum yield and economic return, while in other years less than recommended amounts of nutrient would suffice. There is little consideration of future soil test
values, and soil test values will likely stabilize in the ‘low’ crop responsive range using the sufficiency approach.
‘Build-maintenance’ recommendations are intended to ap-ply enough P to build soil test values to a target soil test value over a planned timeframe (typically 4 to 8 years) and then maintain soil test values in the target range in future years. If soil test values exceed the target range, no P is recommended, with the exception of starter applied rates if desired. Build-maintenance fertility programs are not in-tended to provide optimum economic returns in a given year, but rather attempt to minimize the probability of P limiting corn yields while providing for near maximum yield potential.
While there are those who insist that the ‘sufficiency’ ap-proach is the only approach to P fertility management that is appropriate, there are others that insist that a ‘build-maintenance’ approach is the only long-term approach that best serves producers. Which of these approaches are right for a particular situation is a decision best left to individual producers, depending on circumstances for specific fields and situations.
Both sufficiency and build-maintenance programs have advantages and disadvantages – depending on the needs and expectations of specific producers, fields and situa-tions. Both approaches are based on identifying the criti-cal P soil test value. The critical soil test value is the P soil test value above which the soil is normally capable of supplying P to crops in amounts sufficient to achieve about 90 to 95% of maximum yield – or single year optimum eco-nomic growth. Across the central Plains most agree that the critical P soil test value is in the range of 15 to 20 ppm Bray P-1 or Mehlich III P, or 12 to15 ppm P using the Olsen procedure.
Sufficiency programs minimize P inputs in the early years of adoption, but recommended application rates eventually stabilize at P rates that maintain soil test values in the crop responsive range. Generally, fertilizer P application rates equal to crop removal are needed to maintain soil test P levels. Since P soil test values are eventually maintained in the crop responsive range, fertilizer P applications are required each year in order to meet crop needs. If fertil-izer P application is skipped in a particular year, overall crop production profitability would be expected to suffer. For sufficiency programs, fertilizer P is usually not recom-mended at soil test values much above the critical P soil test value.
Build-maintenance programs require somewhat higher P rates in the early build phase of the program (for soils ini-tially testing in the crop responsive range), but applica-tion rates eventually stabilize at P rates that maintain soil
Left Early season P deficiency in corn.
Below Corn deficient in P at left, sufficient at right.
Fertilizing for Irrigated Corn–Guide to Best Management Practices / Leikam 1-5
test values at a desired targeted level. The targeted soil test value will be just above the critical P soil test values. By building or maintaining soil P test values in the tar-geted range, the soil will be capable of supplying crop P nutritional needs for 1 or 2 years without the application of fertilizer P.
Sufficiency programs fit best for short land tenure situa-tions (generally 2 to 3 years or less) and in situations of cash flow shortages. Adoption of a sufficiency P fertility program requires the application of fertilizer P (and K) each and every year if soil test levels are not above the critical soil test value. This lack of flexibility is due to the fact that soil test values are maintained in the crop responsive range over the long term. Build-maintenance programs generally fit best for longer land tenure situations (3 to 4 years and longer), when flexibility in application rate in a given year is desired (after soil tests built to targeted non-responsive range), when the producer desires to maintain soil tests at a given value over the long-term, or other farmer specific reasons.
As a result, both ‘sufficiency’ and ‘build-maintenance’ pro-grams are appropriate P nutrient management strategies depending on the individual producer situations, goals and objectives for specific fields. Producers may adopt differ-ent P management approaches for individual fields within their operation.
PotassiumCorn requires K in larger amounts than any other nutrient except N. Unlike other crop nutrients, K is not a part of any plant part or compound – it is present as a soluble ion in plant sap. While it is not a structural component of plants, it is required to activate many plant enzymes and plays a key role in plant water balances. As with other essential plant nutrients, if K becomes deficient then crop growth, grain production, and profitability will all suffer. Potas-sium deficiencies are exhibited first on the lower, older plant parts since K is mobile within plants. Potassium de-ficiencies are normally most severe in very wet (especially if compacted) or very dry years.
For corn, estimates of the amount of K removed are in the range of 0.24 to 0.30 lb of K
2O equivalent removal with
each bushel of corn grain (Table1). The higher removal value is a standard established by past research at several Corn Belt universities, while central Plains information suggests about 0.26 lb of K
2O removed with each bushel
of corn grain production. If the corn is harvested as silage, much more K is removed than if only the grain is harvested.
In the central Great Plains, the frequency of soils defi-cient in K is much less than for P. Most soils can provide adequate K nutrition to growing crops, although the inci-
dence of soils testing in the low-medium soil test ranges seems to be increasing. Sandy soils across the region are most likely to test marginal in soil test K, while medium-fine textured soils in the eastern third of the central Plains seem to be more frequently low in exchangeable soil test K. Historically, K deficiencies were most likely to appear in the eastern portions of the central Plains states in years of low rainfall. In recent years, however, K deficiencies of corn have become much more common…especially for re-duced/no-tillage systems in the eastern central Plains.
Like P, soil test values for K are index values only – they provide an estimate of the relative ability of the soil to sup-ply K to growing crops. Since K responses have not been noted as frequently as for P, the K soil test has not been well correlated/calibrated in the central Plains. Consequently, the sufficiency approach is probably more applicable in this region than would be a build-maintenance approach.
Sufficiency P and K recommendations for corn are pre-sented in Table3. The recommendations presented are from Kansas State University, but recommendations from Nebraska and other central Plains states would not be too much different. The main difference is that Nebraska guidelines generally recommend no P above a Bray P1 soil test of 15 ppm or an Olsen P value of 10 ppm. These recommendations are intended to, on the average, provide for optimum economic return in the year of application. If more P is removed in the corn grain than is supplied from various nutrient sources, soil tests values would be expected to decline over time.
Build-maintenance P recommendations for corn are presented in Table4. In the central Plains, only Kansas State University provides ‘build-maintenance’ guidelines. As a general rule-of-thumb, about 18 lb P
2O
5 in excess of
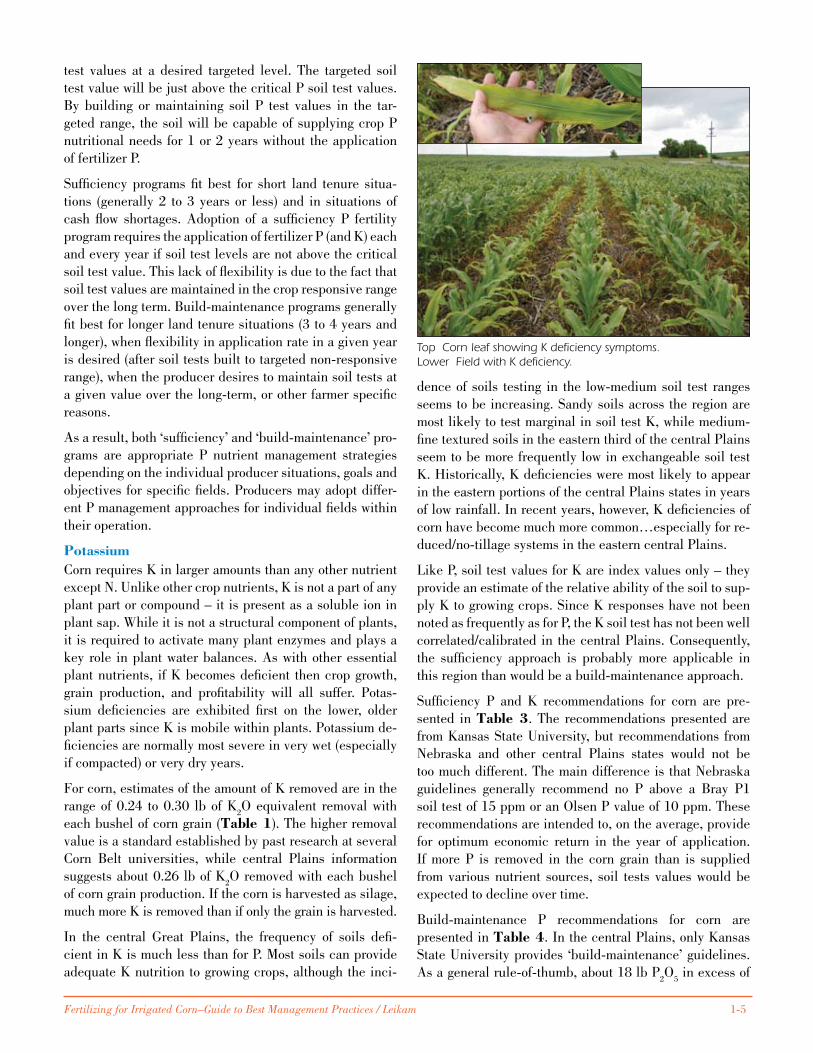
Top Corn leaf showing K deficiency symptoms.Lower Field with K deficiency.

1-6 Fertilizing for Irrigated Corn–Guide to Best Management Practices / Leikam
crop removal is suggested to increase the Bray P-1 soil test by 1 ppm for the surface 6 in. of soil. Sandy soils and shal-lower tillage will typically require less and fine-textured soils containing larger amounts of clay and deeper tillage operations may require more. In addition to the amount of P required to build up soil test P, enough P
2O
5 needs to be
applied to replace the amount removed in the crop in order to maintain P soil tests.
SulfurWhile S is classified as a secondary nutrient, nutritional shortages of S are more common than K in most of the cen-tral Plains. While S deficiencies are not as prevalent as N and P deficiencies, on sandy, well drained and/or low OM soils, S often limits corn production efficiency and profitability.
Sulfur is an essential con-stituent of several amino acids as well as other plant constituents and processes. Often, S deficiency on small plants is mistakenly identi-fied as N deficiency. Sulfur deficient wheat will exhibit a general yellowing and stunt-ing which is also typical for a N shortage. On older plants, the lower leaves of N defi-cient plants will die as N is redistributed to the younger plant parts, while the lower leaves on S deficient plants will remain a pale green.
Sulfate-S is mobile in soils and can move through the soil profile with water. Additionally, most soil S is present in soil OM and becomes available to plants through mineral-ization. As a result, response to S applications is most like-ly on sandy, low OM soils. A routine S soil test is available, but it is not as reliable as soil tests for N, P, or Zn. When the S soil test is utilized, values of less than 6 to 8 ppm SO
4-S generally suggest that additional S may be needed.
Typical broadcast recommended rates in the central Plains range from 10 to 20 lb S/A.
ChlorideAs an essential plant nutrient, Cl- has a major role in plant water relationships. In the past, however, Cl- was rarely considered when developing a fertility program. In fact, the only mention of Cl- was in regard to excessive amounts
Table 3. Sufficiency recommendations for P and K in corn production.
P sufficiency recommendations for corn1 K sufficiency recommendations for corn1
Bray P-1 soil test
Yield goal, bu/A Yield goal, bu/A
60 100 140 180 220 Exch. K 60 100 140 180 220ppm - - - - - - - - - - - - - lb P
2O
5/A - - - - - - - - - - - - - ppm - - - - - - - - - - - - - - - lb K
2O/A - - - - - - - - - - - - - - -
0-5 55 60 70 75 80 0-40 70 80 85 95 1005-10 40 45 50 55 60 40-80 45 50 55 60 6510-15 25 25 30 30 35 80-120 20 20 25 25 3015-20 15 15 15 15 15 120-130 15 15 15 15 15
20+ 02 02 02 02 02 130+ 0 0 0 0 0Crop removal3 20 33 46 59 73 Crop removal3 16 26 36 47 571Corn Sufficiency P Rec = [50 + (Exp Yield x 0.2) + (Bray P • -2.5) + (Exp Yield • Bray P • -0.01)]. If Bray P is greater than 20 ppm, then only a NP or NPKS starter fertilizer suggested. If Bray P is less than 20 ppm, then the minimum P Recommendation = 15 lb P
2O
5/A.
Corn Sufficiency K Rec = [73 + (Exp Yield • 0.21) + (Exch K • -0.565) + (Exp Yield • Exch K • -0.0016)]. If Exch K is greater than 130 ppm then only a NPK or NPKS starter fertilizer is suggested. If Exch K is less than 130 ppm then the minimum K Recommendation = 15 lb K
20/A.
2Application of a NP, NPK, or NPKS starter fertilizer may be beneficial regardless of P or K soil test level, especially for cold/wet soil conditions and/or high surface crop residues. Do not exceed N + K
2O guidelines for fertilizer placed in direct seed contact.
3Crop removal numbers for comparative purposes only. About 0.33 lb P2O
5 and 0.26 lb K
2O per bushel of harvested corn. If crop removal exceeds
nutrient applications, soil test values are expected to decline over time.Source: Kansas State University, 2003.
Table 4. Phosphorus build-maintenance guidelines for corn1.
4-Yr Build Timeframe 6-Yr Build Timeframe 8-Yr Build Timeframe
Bray P-1 soil test
Yield, bu/A Yield, bu/A Yield, bu/A60 140 220 60 140 220 60 140 220
ppm - - - - - - lb P2O
5/A - - - - - - - - - - - - lb P
2O
5/A - - - - - - - - - - - - lb P
2O
5/A - - - - - -
0-5 99 125 151 72 99 125 59 86 1125-10 76 102 129 57 84 110 48 74 101
10-15 54 80 106 42 69 95 37 63 8915-20 31 57 84 27 54 80 25 52 7820-302 20 46 73 20 46 73 20 46 73
30+ 03 03 03 03 03 03 03 03 03
1The 4, 6, and 8-year timeframes presented are examples only. Build programs can be over a long time-frame. However, build-maintenance recommendations should not be less than crop sufficiency-based fertility programs.2Recommended amounts of P
2O
5 and K
2O are based on crop nutrient removal at the indicated yields (0.33
lb P2O
5 and 0.26 lb K
2O/bu).
3Application of a NP, NPK, or NPKS starter fertilizer may be beneficial regardless of P or K soil test level, espe-cially for cold/wet soil conditions and/or high surface crop residues. Do not exceed N+K
2O guidelines for
fertilizer placed in direct seed contact.Source: Kansas State University, 2003.

Fertilizing for Irrigated Corn–Guide to Best Management Practices / Leikam 1-7
that could result in reduced crop quality for certain crops, such as tobacco. Over the past 20 years, however, research in some areas of the central Plains has demonstrated corn yield and profit increases from Cl- applications.
Kansas offers a Cl- soil test based on the Cl- content of the surface 2 ft. of soil. Research generally indicates that a soil test value of about 45 lb (6 ppm ) Cl-/A is required to optimize production. At lower soil test values, about 20 lb of Cl-/A are suggested.
ZincCorn has long been recognized as being susceptible to Zn deficiency if soil availability is low, especially on cal-careous soils. Fortunately, the DTPA-Zn soil test is very reliable in the central Great Plains and the need for Zn can be fairly well predicted. As with P and K, the DTPA-Zn does not measure the amount of Zn available to the grow-ing crop, but only provides an estimate of the soils rela-tive ability to supply Zn to growing crops. Soil test values of less than 0.5 ppm should receive an application of Zn, while soil test values of 0.6 to1.0 ppm are marginal for corn production. Zinc is most likely deficient on fields where the topsoil has been removed and higher yields are likely. Zinc may be foliar applied for in-season rescue treatment, but is best managed using soil applications of a high water soluble Zn fertilizer at or before planting.
A summary of suggested Zn application rates are present-ed in Table5. Broadcast Zn applications are intended to build DTPA-Zn soil test values to a range that will not limit corn growth and development. The suggested starter appli-cation are intended to correct Zn deficiency for the current year, with additional Zn applications for crops susceptible to Zn deficiency required in future years. The advantage of a broadcast program is that a controllable production fac-tor (Zn availability) has been corrected for several years. The disadvantage of broadcast applications is the poten-tial for non-uniform application across the field since so little material is required, and there may be potential for the Zn product to segregate within a fertilizer blend. The advantage of starter band applications is that needed Zn is uniformly applied in an area close to developing seedling roots. The disadvantage is that multiple applications are required in future years.
IronSoil Fe availability limits corn production in certain areas on calcareous soils. Corn is generally less susceptible to Fe chlorosis than sorghum or soybeans, but more sensitive than wheat. Eliminating Fe chlorosis via soil fertilization is not very effective, although the University of Nebraska has had some success with applications of 50 to 150 lb of ferrous sulfate heptahydrate applied in direct seed contact. Logistics (high rates at planting), dry in-row equipment re-quirement, source of Fe product and questionable econom-ics have resulted in this treatment not being very widely adopted. Iron EDDHA products have also been used in the past with limited success (foliar and seed-placed), but profitability of the treatment is a major stumbling block. Perhaps the best treatment is to apply manure to Fe- chlo-rotic spots in the field, if manure is available.
Table 5. Central Plains Zn suggestions for corn.
Application method
DTPA-ZN Broadcast Starter
(ppm) - - - - - - - - - - - lb Zn/A - - - - - - - - - - -
0-0.5 10 0.5-2.0
0.5-1.0 5 0.5-1.0
>1.0 0 0
Adapted by author from several university sources in the central Plains.
OtherNutrientsDocumented corn growth and/or yield responses to calci-um, magnesium, manganese, copper, boron, molybdenum, and nickel have not been observed in the central Plains. As a result, these nutrients would not be expected to im-prove corn production in the central Plains region.
Author information: Dr. Leikam is with the Fluid Fertilizer Foundation (FFF) and is Adjunct Professor with Kansas State University; e-mail: [email protected].
ReferencesKansas State University. 2003. Soil test interpretations and fertilizer recom-
mendations. Dept. of Agronomy. MF 2586. [Online]. Available at http://www.agronomy.ksu.edu/SoilTesting/DesktopDefault.aspx?tabid=17 (verified 19 May 2008).
Shapiro, C.A., R.B. Ferguson, G.W. Hergert, A.R. Dobermann, and C.S. Wortman. Fertilizer suggestions for corn. University of Nebraska-Lincoln. G174. [Online]. Available at http://www.ianrpubs.unl.edu/epublic/live/g174/build/g174.pdf (verified 19 May 2008).
Iron deficiency symptoms.

1-8 Fertilizing for Irrigated Corn–Guide to Best Management Practices / Leikam

Fertilizing for Irrigated Corn–Guide to Best Management Practices / Stewart 2-1
Abbreviations and notes for this article: N = nitrogen; P = phosphorus; K = potassium; S = sulfur; Cl- = chloride; Mg = magnesium; Ca = calcium; B = boron; Cl- = chloride; Cu = copper; Fe = iron; Mn = manganese; Mo = molybdenum; Ni = nickel; Zn = zinc.
Fertilizing for Irrigated Corn — Chapter 2
Fertilizer Sources for Irrigated CornBy Mike Stewart
Most modern N fertilizers are produced from the Haber-Bosch process. First adopted on a commercial scale
in 1913, this process enables the capture and conversion (industrial fixation) of atmospheric N
2 gas to ammonia
(NH3). It requires hydrocarbons for energy, plus hydrogen.
Natural gas is the principal hydrocarbon feedstock for NH3
production, hence the close connection between natural gas and N fertilizer prices.
CommonCommercialNFertilizersThere are several commercial N fertilizer materials and combinations available in today’s marketplace; however, most are derived from a few basic materials. Following is a list of basic N fertilizer sources and some key consider-ations for each.
Ammonia Nitrogen sources that contain free NH3, such as
anhydrous NH3 (82% N) and low-pressure NH
3 solutions
(20 to 25% N) must be injected into the soil to avoid losses of NH
3 gas. In typical corn management programs, anhy-
drous NH3 moves about 4 to 6 in. from the point of injec-
tion. Placement should be no deeper than necessary to en-sure soil closure and entrapment of NH
3. Therefore, it must
be injected 6 to 8 in. deep to ensure it does not escape. Deeper injection may be required in sandier soils. Losses of NH
3 are minimized when the soil is at or near field ca-
pacity in water content. In extremely dry soils, much of the N applied as anhydrous NH
3 may be lost.
Upon application, NH3 reacts with water in the soil to form
ammonium (NH4+). It is temporarily attached to clay or
organic colloids and is subject to nitrification…conver-sion to nitrate (NO
3-). The soil’s capacity to retain NH
3 is
largely dependent on cation exchange capacity (CEC) and soil moisture content at application. However, soil pH, ap-plicator knife spacing, and depth of application are also determining factors (Hoeft et al., 2000).
The main advantages of anhydrous NH3 have traditionally
been low cost and high efficiency as a source of N for corn. Its main disadvantages involve safety issues, high pressure handling, and deep injection requirements. Anhydrous NH
3 can result in freeze injury if it comes in contact with
the skin. As it is hygroscopic, it can also cause severe eye injury. So it is imperative that the proper safety procedures and equipment (long rubber gloves, long sleeves, eye gog-gles, eye wash bottle, and water container) be utilized by applicators.
Low-pressure solutions of NH3 are used only on a limited
basis, as the low N content means high transportation and delivery costs.
UreaThe principal form of dry granular fertilizer in North America is urea [CO(NH
2)
2]. It contains 46% N. Figure
1 compares N fertilizer consumption trends in the USA. Urea is highly soluble in soil water and converts quickly to NH
4+. It is an excellent source of N, but must be ap-
plied carefully to avoid gaseous NH3 losses from surface
applications. Inhibitors can be added to urea-containing fertilizers to reduce the potential for NH
3 loss (see section
on enhanced efficiency N fertilizers). Because it tends to produce NH
3, which is toxic to seedlings, urea in starter
fertilizers must be kept to smaller amounts than other N sources, particularly on soils with neutral to alkaline pH. Also, urea should not be placed with corn seed (Mengel, 2008).
Conditions that favor gaseous loss of NH3 from surface ap-
plication of urea include high residue, warm temperature (>55 ºF), drying soil surface (water vapor loss from surface), neutral to alkaline soil pH, and low CEC, as found in sandy soil conditions (Hoeft et al., 2000). Under these conditions, where the environment favors gaseous loss of N from urea,
Urea (at right) is an important source of N. Chemical or phys-ical treatments can be used to produce enhanced efficiency forms (left).
Ammonia is still synthesized through the Haber-Bosch process. Dr. Fritz Haber (left) and Dr. Carl Bosch (right) each earned a Nobel Prize for their work.
Imag
e cr
edit:
IFD
C –
An
Inte
rnat
ion
al C
ente
r fo
r So
il Fe
rtili
ty a
nd
Ag
ricu
ltura
l Dev
elo
pm
ent.

2-2 Fertilizing for Irrigated Corn–Guide to Best Management Practices / Stewart
it is advisable to place the material below the soil surface, water it in shortly after application, or use a urease inhibi-tor (see section on enhanced efficiency fertilizer).
Ammonium nitrate Ammonium nitrate (NH4NO
3) is
another dry granular source of N containing 34% N. Half of the N is in the NH
4+ form and half in the NO
3- form.
Ammonium nitrate may produce better results than urea when surface broadcast for no-till corn production (Gor-don, 2005). While it is less susceptible to volatile losses of NH
3, the NO
3- portion is more susceptible to leaching
or denitrification. Under the right conditions, ammonium nitrate can become highly explosive; therefore, due to se-curity concerns, availability of ammonium nitrate in the USA has declined in recent years (Figure1).
UAN Urea-ammonium nitrate (UAN) consists of non-pressure solutions of urea and ammonium nitrate ranging from 28 to 32% N. Solutions containing both urea and am-monium nitrate have higher maximum N concentrations than solutions of either material alone. At low tempera-tures, however, the materials will precipitate out of solution or “salt out”. Some losses of NH
3 may occur when UAN is
surface-applied, but generally less than from urea alone. Advantages of UAN include:
• Solutions may be easier to handle and apply
• Application is often more uniform and accurate than solids
• Many pesticides are compatible and can be applied in a single pass
• They can be applied through irrigation systems
• Transport and handling is safer than for anhydrous NH
3
• Storage facilities cost less than those for other N sources
AmmoniumsulfateAmmonium sulfate [(NH4)2SO
4] sup-
plies all of its N in the NH4+ form. It contains 21% N and
24% S. This may be of particular advantage to hybrids re-quiring enhanced NH
4+ nutrition, but the effect is short-
lived as NH4+ is rapidly nitrified (converted to NO
3-) in the
soil over the course of several weeks. In contrast to urea, there is little risk of NH
3 volatilization when surface ap-
plied. Ammonium sulfate also supplies S. It is available in both dry granular (21-0-0-24) and liquid (8-0-0-9) forms.
EnhancedEfficiencyNFertilizersNitrogen fertilizers that provide mechanisms for controlled or slow release, or otherwise enhance efficiency, have been available for many years (Robbins, 2005). Their use in production agriculture has traditionally been limited due to cost considerations; however, over the past few years there has been increased interest in these technologies because of increased N prices, heightened environmental awareness, and improved manufacturing technology (Blay-lock and Tindall, 2006). Enhanced efficiency N fertilizer sources can be broken down into three basic categories, described in the following paragraphs.
Stabilizedmaterials The concept behind these materials is to add a nitrification and/or urease inhibitor to urea or UAN fertilizer to delay conversion to N forms that are more susceptible to gaseous or leaching losses.
When urea is applied to the soil it is converted or hydro-lyzed to NH
4+ by the urease enzyme. The rate of conver-
sion or hydrolysis of urea to ammoniacal N is governed by several factors including temperature and humidity. If urea fertilizer is surface applied in the spring, summer, or when temperatures are otherwise warm there is a risk of loss of some fertilizer N as NH
3 gas. The addition of a urease in-
hibitor such as Agrotain to urea or urea containing fertil-izers can diminish the potential for loss from surface ap-plications in conditions favoring rapid hydrolysis (Figure2) (Watson, 2005).
Figure 1. Nitrogen fertilizer consumption trends in the USA, 1960-2006. Source: USDA-ERS, 2008.
0
2
4
6
8
10
12
1960
1962
1964
196619
6819
7019
7219
7419
7619
7819
8019
8219
8419
8619
8819
9019
9219
9419
9619
9820
0020
0220
0420
06
Mill
ion
to
ns
of p
rod
uct
anhydrous ammonia ammonium nitrate
ammonium sulfate N solutionsurea
Figure 2. Urea hydrolysis and how urease inhibitors work.
Urea hydrolysisUrea hydrolysis
• Urease inhibitors interfere with the process of urea hydrolysis
• The slowing of conversion of urea to ammoniacal N can significantly reduce the potential for NH3 volatilization
CO(NH2)2 + H+ + H2O 2NH4+ + HCO3
-
NH4+ NH3 + H+
urease

Fertilizing for Irrigated Corn–Guide to Best Management Practices / Stewart 2-3
Nitrification inhibitors are added to ammoniacal N fertil-izer, or sources that produce ammoniacal N (e.g., urea) to slow the conversion of NH
4+ to NO
3-. Ammoniacal N
is naturally converted to NO3-N in soils by the process of
nitrification. Nitrate-N is susceptible to leaching and/or denitrification losses in some environments. The addition of a nitrification inhibitor such as nitrapyrin (N-Serve) or DCD to N sources such as anhydrous NH
3, UAN, urea, am-
monium nitrate, or ammonium sulfate can, under the right conditions, reduce losses of NO
3-N in soils, as shown in
Figure3 (Frye, 2005).
Physical coating or barrier around a soluble NfertilizerThese are conventional soluble fertilizer mate-rials with rapidly available nutrients which...after granu-lation, prilling, or crystallization...are given a protective (water-insoluble) coating to control the water penetration and thus the rate of dissolution and the nutrient release (Trenkel, 1997). The three major groups of coated or en-capsulated fertilizers are S coated (e.g., S coated urea), polymer coated (e.g., polymer coated urea), and S plus
polymer coated materials. The polymer coated technology has gained in interest in corn production in some areas over the past few years. Improvements in manufacturing and cost reduction have contributed to the increased inter-est in these materials. One of the objectives of polymer coating technology is to attempt to match N release with crop uptake, as was aptly depicted by Schwab and Mur-dock (2004) (Figure4).
Condensationproductsofureaandurea-aldehydes These are basically slowly soluble synthetic organic com-pounds such as urea-formaldehyde (UF), isobutylidene diurea (IBDU), and urea-crotonaldehyde (CDU). These materials, particularly UF containing products, have also become more available in production agriculture over the past few years.
AcidifyingNatureofNFertilizersAll NH
4-N sources and urea tend to acidify soil to some de-
gree. For most sources (urea, NH3, NH
4NO
3, UAN), about
180 lb of calcium carbonate equivalent (CCE) neutralizes the acidity generated by 100 lb of N. Other sources such as (NH
4)2SO
4, and ammoniated phosphates generate more
acidity, requiring from 360 to 540 lb CCE per 100 lb of N supplied (Potash & Phosphate Institute, 2003). The acid-ity generated poses no problem for the soil’s productivity provided that there is sufficient buffering, as is the case in most of the Central Great Plains, or that lime is applied as required. Nitrate sources of N, such as calcium nitrate or potassium nitrate, do not acidify the soil. However, the NO
3- sources are rarely used for corn owing to their cost
and the risk of NO3- losses.
PhosphorusFertilizersPractically all commercial inorganic P fertilizers come from phosphate rock (PR), a naturally occurring sedimen-tary rock composed largely of calcium phosphate minerals (apatite). The first commercial mining of PR in the USA began in 1867 in South Carolina. Deposits in Florida were discovered in the 1880s as production in South Carolina was declining. Soon after the deposits in Florida were identified, PR was discovered in Tennessee. The western phosphate deposits (Idaho, Montana, Utah, and Wyoming) were discovered in the late 1890s (Nelson, 1990). The USA is one of the world’s largest producers of PR. Most of the PR production in the country is in Florida, North Carolina, Idaho, and Utah. The majority of this comes from Florida and North Carolina, with these two states currently accounting for about 85% of PR output in the USA (U.S. Geologic Survey, 2008a). Based on 2006-2007 averages, China is the world’s biggest producer of PR with the USA a very close second. Morocco (and Western Sahara), Russia, and Tunisia round-out the top five of world PR producers (U.S. Geologic Survey, 2008a).
Figure 3. Nitrification and how nitrification inhibitors work.
NitrificationNitrification……a natural process in soilsa natural process in soils
• Nitrification inhibitors interfere with activity of Nitrosomonas bacteria, slowing the nitrification process
• This leaves more N in ammoniacal form, thus reducing the chance of leaching and denitrification
NH4+ NH3 NO2
- NO3-Nitrosomonas Nitrobacter-H+
+H+
0 10 20 30 40 50 60 70 80 90 100Days after emergence
Theoretical release curve
100
90
80
7060
50
40
30
20
10
% n
itrog
en u
ptak
e
Figure 4. N uptake curve (corn) and theoretical polymer coated urea release curve. Source: Schwab and Murdock, 2004.
2-4 Fertilizing for Irrigated Corn–Guide to Best Management Practices / Stewart
Most conventional commercial P fertilizers are made by reacting PR with sulfuric acid to produce phosphoric acid (green or wet process acid). The phosphoric acid is further reacted with NH
4 (ammoniation) to produce am-
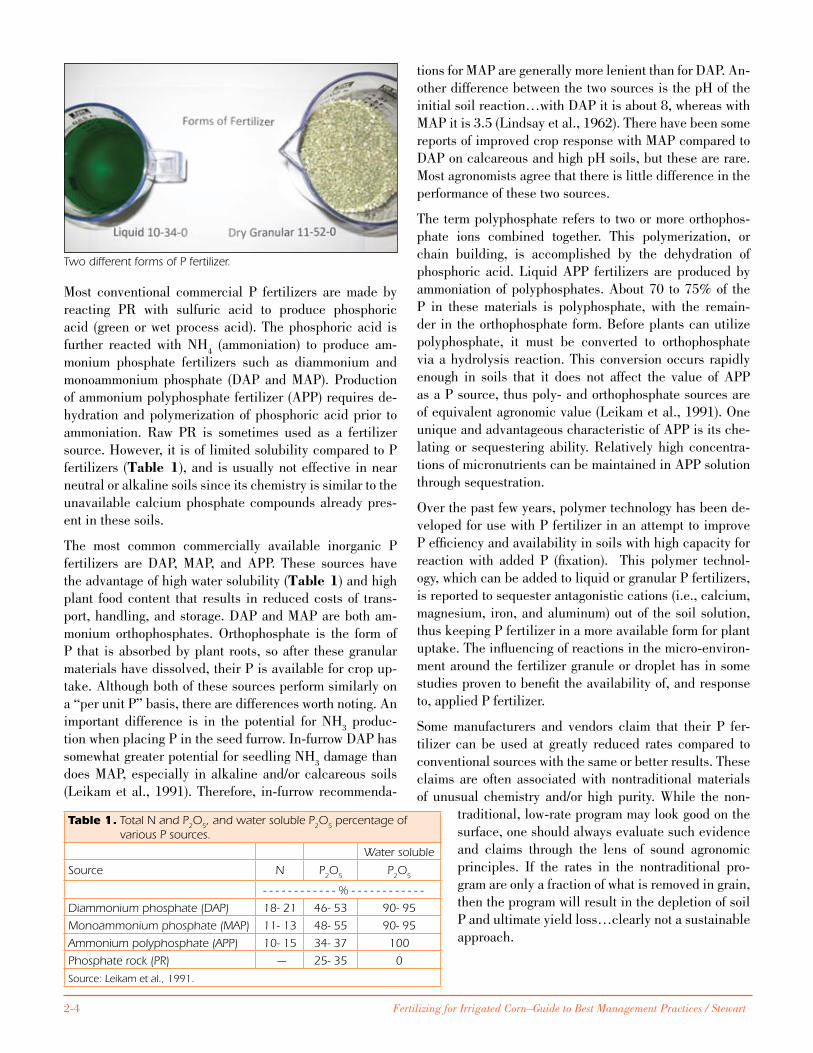
monium phosphate fertilizers such as diammonium and monoammonium phosphate (DAP and MAP). Production of ammonium polyphosphate fertilizer (APP) requires de-hydration and polymerization of phosphoric acid prior to ammoniation. Raw PR is sometimes used as a fertilizer source. However, it is of limited solubility compared to P fertilizers (Table1), and is usually not effective in near neutral or alkaline soils since its chemistry is similar to the unavailable calcium phosphate compounds already pres-ent in these soils.
The most common commercially available inorganic P fertilizers are DAP, MAP, and APP. These sources have the advantage of high water solubility (Table1) and high plant food content that results in reduced costs of trans-port, handling, and storage. DAP and MAP are both am-monium orthophosphates. Orthophosphate is the form of P that is absorbed by plant roots, so after these granular materials have dissolved, their P is available for crop up-take. Although both of these sources perform similarly on a “per unit P” basis, there are differences worth noting. An important difference is in the potential for NH
3 produc-
tion when placing P in the seed furrow. In-furrow DAP has somewhat greater potential for seedling NH
3 damage than
does MAP, especially in alkaline and/or calcareous soils (Leikam et al., 1991). Therefore, in-furrow recommenda-
tions for MAP are generally more lenient than for DAP. An-other difference between the two sources is the pH of the initial soil reaction…with DAP it is about 8, whereas with MAP it is 3.5 (Lindsay et al., 1962). There have been some reports of improved crop response with MAP compared to DAP on calcareous and high pH soils, but these are rare. Most agronomists agree that there is little difference in the performance of these two sources.
The term polyphosphate refers to two or more orthophos-phate ions combined together. This polymerization, or chain building, is accomplished by the dehydration of phosphoric acid. Liquid APP fertilizers are produced by ammoniation of polyphosphates. About 70 to 75% of the P in these materials is polyphosphate, with the remain-der in the orthophosphate form. Before plants can utilize polyphosphate, it must be converted to orthophosphate via a hydrolysis reaction. This conversion occurs rapidly enough in soils that it does not affect the value of APP as a P source, thus poly- and orthophosphate sources are of equivalent agronomic value (Leikam et al., 1991). One unique and advantageous characteristic of APP is its che-lating or sequestering ability. Relatively high concentra-tions of micronutrients can be maintained in APP solution through sequestration.
Over the past few years, polymer technology has been de-veloped for use with P fertilizer in an attempt to improve P efficiency and availability in soils with high capacity for reaction with added P (fixation). This polymer technol-ogy, which can be added to liquid or granular P fertilizers, is reported to sequester antagonistic cations (i.e., calcium, magnesium, iron, and aluminum) out of the soil solution, thus keeping P fertilizer in a more available form for plant uptake. The influencing of reactions in the micro-environ-ment around the fertilizer granule or droplet has in some studies proven to benefit the availability of, and response to, applied P fertilizer.
Some manufacturers and vendors claim that their P fer-tilizer can be used at greatly reduced rates compared to conventional sources with the same or better results. These claims are often associated with nontraditional materials of unusual chemistry and/or high purity. While the non-
traditional, low-rate program may look good on the surface, one should always evaluate such evidence and claims through the lens of sound agronomic principles. If the rates in the nontraditional pro-gram are only a fraction of what is removed in grain, then the program will result in the depletion of soil P and ultimate yield loss…clearly not a sustainable approach.
Two different forms of P fertilizer.
Table 1. Total N and P2O
5, and water soluble P
2O
5 percentage of
various P sources.
Water soluble
Source N P2O
5P
2O
5
- - - - - - - - - - - - % - - - - - - - - - - - -
Diammonium phosphate (DAP) 18- 21 46- 53 90- 95
Monoammonium phosphate (MAP) 11- 13 48- 55 90- 95
Ammonium polyphosphate (APP) 10- 15 34- 37 100
Phosphate rock (PR) --- 25- 35 0
Source: Leikam et al., 1991.
Fertilizing for Irrigated Corn–Guide to Best Management Practices / Stewart 2-5
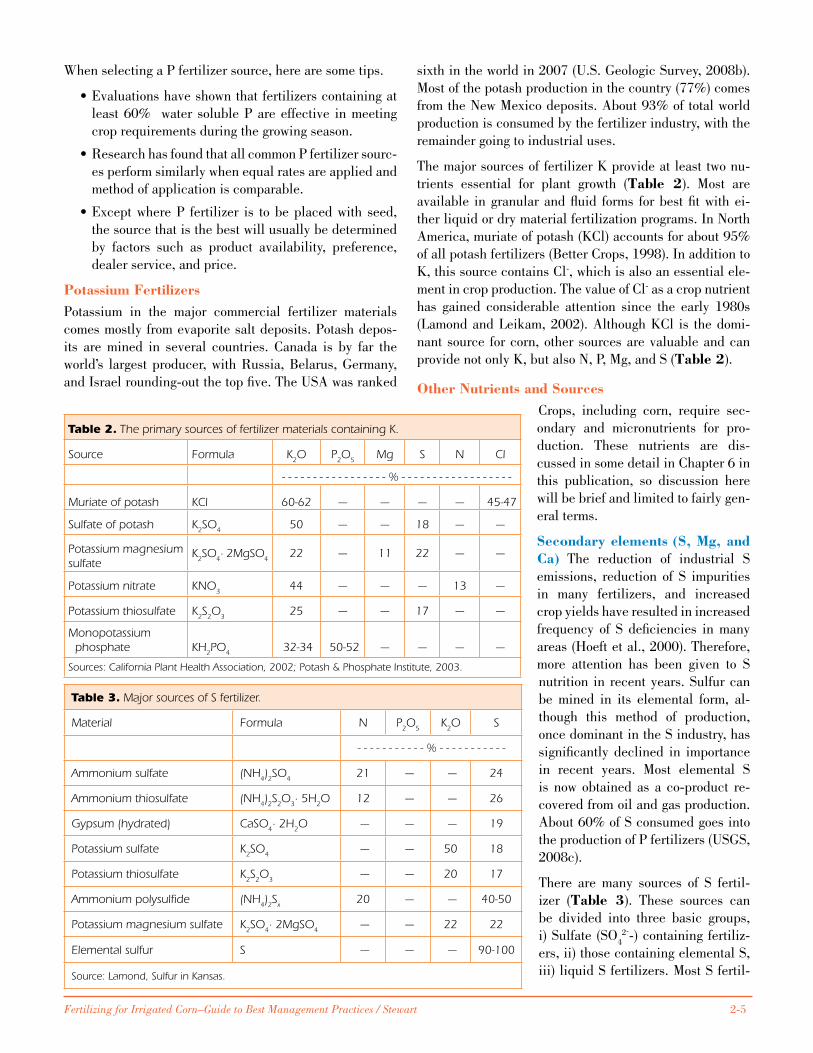
sixth in the world in 2007 (U.S. Geologic Survey, 2008b). Most of the potash production in the country (77%) comes from the New Mexico deposits. About 93% of total world production is consumed by the fertilizer industry, with the remainder going to industrial uses.
The major sources of fertilizer K provide at least two nu-trients essential for plant growth (Table 2). Most are available in granular and fluid forms for best fit with ei-ther liquid or dry material fertilization programs. In North America, muriate of potash (KCl) accounts for about 95% of all potash fertilizers (Better Crops, 1998). In addition to K, this source contains Cl-, which is also an essential ele-ment in crop production. The value of Cl- as a crop nutrient has gained considerable attention since the early 1980s (Lamond and Leikam, 2002). Although KCl is the domi-nant source for corn, other sources are valuable and can provide not only K, but also N, P, Mg, and S (Table2).
OtherNutrientsandSourcesCrops, including corn, require sec-ondary and micronutrients for pro-duction. These nutrients are dis-cussed in some detail in Chapter 6 in this publication, so discussion here will be brief and limited to fairly gen-eral terms.
Secondaryelements(S,Mg,andCa) The reduction of industrial S emissions, reduction of S impurities in many fertilizers, and increased crop yields have resulted in increased frequency of S deficiencies in many areas (Hoeft et al., 2000). Therefore, more attention has been given to S nutrition in recent years. Sulfur can be mined in its elemental form, al-though this method of production, once dominant in the S industry, has significantly declined in importance in recent years. Most elemental S is now obtained as a co-product re-covered from oil and gas production. About 60% of S consumed goes into the production of P fertilizers (USGS, 2008c).
There are many sources of S fertil-izer (Table 3). These sources can be divided into three basic groups, i) Sulfate (SO
42--) containing fertiliz-
ers, ii) those containing elemental S, iii) liquid S fertilizers. Most S fertil-
Table 2. The primary sources of fertilizer materials containing K.
Source Formula K2O P
2O
5Mg S N Cl
- - - - - - - - - - - - - - - - - % - - - - - - - - - - - - - - - - - -
Muriate of potash KCl 60-62 --- --- --- --- 45-47
Sulfate of potash K2SO
450 --- --- 18 --- ---
Potassium magnesium sulfate
K2SO
4· 2MgSO
422 --- 11 22 --- ---
Potassium nitrate KNO3
44 --- --- --- 13 ---
Potassium thiosulfate K2S
2O
325 --- --- 17 --- ---
Monopotassium phosphate KH
2PO
4 32-34 50-52 --- --- --- ---
Sources: California Plant Health Association, 2002; Potash & Phosphate Institute, 2003.
Table 3. Major sources of S fertilizer.
Material Formula N P2O
5K
2O S
- - - - - - - - - - - % - - - - - - - - - - -
Ammonium sulfate (NH4)2SO
421 --- --- 24
Ammonium thiosulfate (NH4)2S
2O
3· 5H
2O 12 --- --- 26
Gypsum (hydrated) CaSO4· 2H
2O --- --- --- 19
Potassium sulfate K2SO
4 --- --- 50 18
Potassium thiosulfate K2S
2O
3 --- --- 20 17
Ammonium polysulfide (NH4)2S
x20 --- --- 40-50
Potassium magnesium sulfate K2SO
4· 2MgSO
4 --- --- 22 22
Elemental sulfur S --- --- --- 90-100
Source: Lamond, Sulfur in Kansas.
When selecting a P fertilizer source, here are some tips.
• Evaluations have shown that fertilizers containing at least 60% water soluble P are effective in meeting crop requirements during the growing season.
• Research has found that all common P fertilizer sourc-es perform similarly when equal rates are applied and method of application is comparable.
• Except where P fertilizer is to be placed with seed, the source that is the best will usually be determined by factors such as product availability, preference, dealer service, and price.
PotassiumFertilizersPotassium in the major commercial fertilizer materials comes mostly from evaporite salt deposits. Potash depos-its are mined in several countries. Canada is by far the world’s largest producer, with Russia, Belarus, Germany, and Israel rounding-out the top five. The USA was ranked

2-6 Fertilizing for Irrigated Corn–Guide to Best Management Practices / Stewart
izer materials are in the SO42- form and are immediately
available for crop uptake upon dissolving. However, other sources such as elemental S must undergo transformation (oxidation) to SO
42- to become available. Materials contain-
ing elemental S produce acidity in the process of oxida-tion. This is of little concern over most of the Great Plains since rates of application are normally low enough to have negligible effect on soil pH. However, acidity production from elemental S can be used to good effect in alkaline soil conditions as is evidenced by the recent development of products that combine elemental S with P and micronutri-ents such as Zn in an effort to improve availability of these nutrients in the granule micro-environment.
The most common source of Mg fertilizer is dolomitic lime-stone, but the use of this source is usually confined to acid soil conditions where it is applied for the lime value. Other important sources include potassium magnesium sulfate, Mg sulfate, Mg chloride, and Mg oxide. The SO
42- and Cl-
sources of Mg tend to be of high solubility and therefore result in relatively quick crop response.
Most Ca deficient soils are acid, so the application of lime for acidity correction serves to also correct Ca deficiency. This is not a problem common to the Plains since most soils are not acid and are high in Ca. The primary non-lime source of Ca is gypsum (CaSO
4 •
2H
2O).
Micronutrients(B,Cl-,Cu,Fe,Mn,Mo,Ni,andZn) Micronutrients are necessary for crop production, but in much smaller quantities than major or secondary elements. The most commonly needed micronutrient in corn produc-tion in the Great Plains is Zn. However, other micronutri-ents may also be required in specific circumstances. The need for micronutrients and agronomics of specific micro-nutrients is discussed in more detail in Chapter 6 in this publication.
Metal micronutrients such as Cu, Fe, Mn, and Zn for the most part come in fertilizer forms of oxides, sulfates, or chelates. Oxides tend to be the least soluble, so these ma-terials may not provide immediate response. Sulfate forms are generally soluble and provide quick response. Che-lated materials tend to be highly soluble and are usually the most readily available. Other forms of these materials may also be available, such as carbonates, chlorides, and organics.
Most B fertilizer materials are in the borate (BO33-) form
and are highly soluble. Chloride-containing fertilizers tend to be salts of Cl-, such as K+, NH
4+, or Mg2+, and are
of equivalent value as fertilizer since they are all readily soluble. Most Mo fertilizers are in the molybdate form (MoO
42-) and are highly soluble; thus, as with B and Cl-
sources, response is fairly rapid.
Author information: Dr. Stewart is IPNI Southern and Central Great Plains Regional Director, located at San Antonio, Texas; e-mail: [email protected].
ReferencesBetter Crops. 1998. Production and use of potassium. In Potassium for
agriculture. Vol. 82. No. 3, p. 6-8. [Online]. Available at http://www.ipni.net/ppiweb/bcrops.nsf/$webindex/EA503A5EC59681B3852568C700157B00!opendocument (verified 22 April 2008).
Blaylock, A. and T. Tindall. 2006. Advances in slow-release nitrogen fertil-izers. In Proceedings of the Great Plains Soil Fertility Conference. Denver, Colorado. March 7-8, 2006. p. 37-43.
California Plant Health Association. 2002. Western Fertilizer Handbook. Interstate Publishers, Inc. Danville IL.
Frye, W. 2005. Nitrification inhibition for nitrogen efficiency and environ-ment protection. IFA International Workshop on Enhanced-Efficiency Fertilizers. Frankfurt, Germany. 28-30, June 2005. [Online]. Available at: http://www.fertilizer.org/ifa/news/2005_17.asp#PRESENTATIONS (verified 22 April 2008).
Gordon, W.B. 2005. Controlled-release urea for irrigated corn production. Kansas Fertilizer Report. p. 32-33. Kansas State Univ. Ag. Exp. Station and Coop. Ext. Service. Report of Progress 957. [Online]. Available at http://www.oznet.ksu.edu/library/crpsl2/srp957.pdf (verified 1 May 2008).
Hoeft, R.G., E.D. Nafzinger, R.R. Johnson and S.R. Aldrich. 2000. Modern corn and soybean production. MCSP Publications, Champaign, IL.
Lamond, R.E. Sulfur in Kansas. Kansas State Univ. Dept. of Agronomy. MF-2264. [Online]. Available at http://www.oznet.ksu.edu/library/crpsl2/mf2264.pdf (verified 24 April 2008).
Lamond, R.E. and D.F. Leikam. 2002. Chloride in Kansas: Plant, soil, and fertilizer considerations. Kansas State Univ. Dept. of Agronomy. MF-2570. [Online]. Available at http://www.oznet.ksu.edu/library/crpsl2/mf2570.pdf (verified 23 April 2008).
Leikam, D. F., W. N. Sutherland, and E.J. Penas. 1991. Phosphorus Sources for Corn Fertilization. National Corn Handbook. Iowa State Univ. Ex-tension. NCH13. [Online]. Available at http://www.extension.iastate.edu/Publications/NCH13.pdf (verified 22 April 2008).
Lindsay, W.L., A.W. Frazier, and H.F. Stephenson. 1962. Iditificaiton of reaction products from phosphate fertilizers in soils. Soil Sci. Soc. Proc. 26: 446-452.
Mengel, D. 2008. Placing fertilizer with the seed. K-State Extension Agron-omy e-updates. April 17, 2008. [Online]. Available at: http://www.agronomy.ksu.edu/DesktopDefault.aspx?tabindex=356&tabid=586 (verified 24 May 2008).
Nelson, L.B. 1990. History of the U.S. fertilizer industry. TVA. Muscle Shoals, AL.
Potash & Phosphate Institute. 2003. Soil Fertility Manual. International Plant Nutrition Institute, Norcross, GA.
Robbins, J. 2005. Slow-release fertilizers as tools. IFA International Workshop on Enhanced-Efficiency Fertilizers. Frankfurt, Germany, 28-30 June 2005. [Online]. Available at http://www.fertilizer.org/ifa/news/2005_17.asp#PRESENTATIONS (verified 1 May 2008).
Schwab, G.J. and L.W. Murdock. 2004. Nitrogen transformation inhibi-tors and controlled release urea. University of Kentucky Cooperative Extension Service. AGR-185. [Online]. Available at http://www.ca.uky.edu/agc/pubs/agr/agr185/agr185.pdf (verified 1 May 2008).
Trenkel, M.E. 1997. Improved Fertilizer Use Efficiency. Controlled-release and stabilized fertilizers in agriculture. International Fertilizer Industry Association. Paris, France. [Online]. Available at http://www.fertilizer.org/ifa/publicat/pdf/trenkel.pdf (verified 22 April 2008).
U.S. Geological Survey. 2008a. Mineral commodity summaries. [Online]. Available at http://minerals.usgs.gov/minerals/pubs/commodity/phos-phate_rock/mcs-2008-phosp.pdf (verified 17 April 2008).
U.S. Geological Survey. 2008b. Mineral commodity summaries. [Online]. Available at http://minerals.usgs.gov/minerals/pubs/commodity/pot-ash/mcs-2008-potas.pdf (verified 23 April 2008).
U.S. Geological Survey. 2008c. Mineral commodity summaries. [Online]. Available at http://minerals.usgs.gov/minerals/pubs/commodity/sul-fur/mcs-2008-sulfu.pdf (verified 23 April 2008).
USDA-ERS. 2008. U.S. consumption of selected nitrogen materials for 1960-2006. [Online]. Available at http://www.ers.usda.gov/Data/Fer-tilizerUse/ (verified 22 April 2008).
Watson, C. 2005. Urease inhibitors. IFA International Workshop on Enhanced-Efficiency Fertilizers. Frankfurt, Germany. 28-30, June 2005. [Online]. Available at http://www.fertilizer.org/ifa/news/2005_17.asp#PRESENTATIONS (verified 22 April 2008).
Fertilizing for Irrigated Corn / Maddux - Halvorson 3-�
Abbreviations and notes for this article: N = nitrogen; P = phosphorus; NO3
- = nitrate; NH3 = ammonia; NH
4+ = ammonium.
Fertilizing for Irrigated Corn — Chapter 3
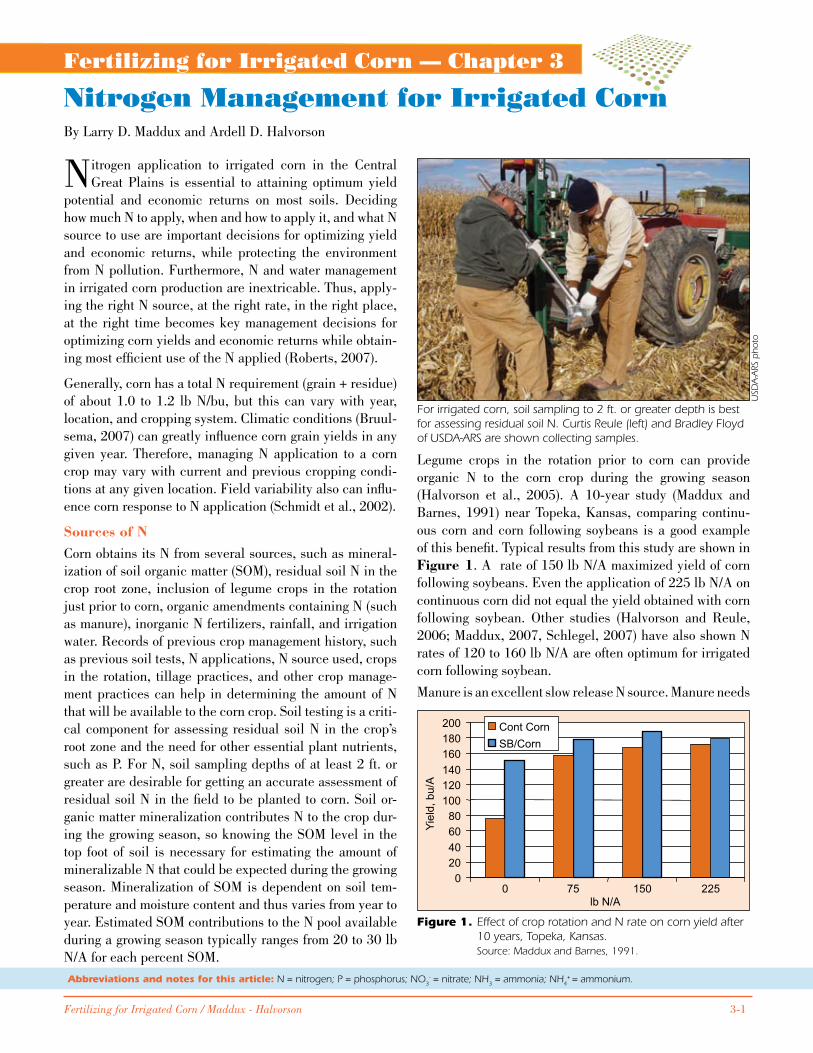
Nitrogen Management for Irrigated CornBy Larry D. Maddux and Ardell D. Halvorson
Nitrogen application to irrigated corn in the Central Great Plains is essential to attaining optimum yield
potential and economic returns on most soils. Deciding how much N to apply, when and how to apply it, and what N source to use are important decisions for optimizing yield and economic returns, while protecting the environment from N pollution. Furthermore, N and water management in irrigated corn production are inextricable. Thus, apply-ing the right N source, at the right rate, in the right place, at the right time becomes key management decisions for optimizing corn yields and economic returns while obtain-ing most efficient use of the N applied (Roberts, 2007).
Generally, corn has a total N requirement (grain + residue) of about �.0 to �.2 lb N/bu, but this can vary with year, location, and cropping system. Climatic conditions (Bruul-sema, 2007) can greatly influence corn grain yields in any given year. Therefore, managing N application to a corn crop may vary with current and previous cropping condi-tions at any given location. Field variability also can influ-ence corn response to N application (Schmidt et al., 2002).
SourcesofNCorn obtains its N from several sources, such as mineral-ization of soil organic matter (SOM), residual soil N in the crop root zone, inclusion of legume crops in the rotation just prior to corn, organic amendments containing N (such as manure), inorganic N fertilizers, rainfall, and irrigation water. Records of previous crop management history, such as previous soil tests, N applications, N source used, crops in the rotation, tillage practices, and other crop manage-ment practices can help in determining the amount of N that will be available to the corn crop. Soil testing is a criti-cal component for assessing residual soil N in the crop’s root zone and the need for other essential plant nutrients, such as P. For N, soil sampling depths of at least 2 ft. or greater are desirable for getting an accurate assessment of residual soil N in the field to be planted to corn. Soil or-ganic matter mineralization contributes N to the crop dur-ing the growing season, so knowing the SOM level in the top foot of soil is necessary for estimating the amount of mineralizable N that could be expected during the growing season. Mineralization of SOM is dependent on soil tem-perature and moisture content and thus varies from year to year. Estimated SOM contributions to the N pool available during a growing season typically ranges from 20 to 30 lb N/A for each percent SOM.
Legume crops in the rotation prior to corn can provide organic N to the corn crop during the growing season (Halvorson et al., 2005). A �0-year study (Maddux and Barnes, �99�) near Topeka, Kansas, comparing continu-ous corn and corn following soybeans is a good example of this benefit. Typical results from this study are shown in Figure1. A rate of �50 lb N/A maximized yield of corn following soybeans. Even the application of 225 lb N/A on continuous corn did not equal the yield obtained with corn following soybean. Other studies (Halvorson and Reule, 2006; Maddux, 2007, Schlegel, 2007) have also shown N rates of �20 to �60 lb N/A are often optimum for irrigated corn following soybean.
Manure is an excellent slow release N source. Manure needs
Figure 1. Effect of crop rotation and N rate on corn yield after 10 years, Topeka, Kansas. Source: Maddux and Barnes, 1991.
020406080
100120140160180200
0 75 150 225lb N/A
Yiel
d, b
u/A
Cont CornSB/Corn
For irrigated corn, soil sampling to 2 ft. or greater depth is best for assessing residual soil N. Curtis Reule (left) and Bradley Floyd of USDA-ARS are shown collecting samples.
USD
A-A
RS p
ho
to

3-2 Fertilizing for Irrigated Corn / Maddux - Halvorson
to be monitored for N and P content before application to reduce the risk of over application of P. In eastern Kansas, approximately 50% of the N in manure is considered avail-able for use by the first summer crop. In drier climates, less N would likely be available. An 8-year study (Schlegel, et al, 2007) conducted near Tribune in western Kansas as-sumed 33% of the N would be available for use the first year. This study evaluated cattle manure and swine effluent and concluded that they were both effective sources of N. The data shown in Figure2 included applications based on P (�50% of estimated removal) and compared them to N fertilizer applications. A study in eastern Kansas (Maddux and Barnes, �993) near Topeka evaluated lime-amended sewage sludge as an N source for corn. The sludge applica-tion rate was determined by the N content of the sludge and assuming that 50% would be available to the corn crop the year of application. Because of residual N in the soil pro-file, no significant N response was obtained the first year of the study. However, a good yield response was obtained the next 2 years with the third year data (�993) shown in Fig-ure3. Corn yields obtained with the sludge applications were similar to that obtained with broadcast, incorporated urea ammonium nitrate (UAN) solution. After 3 years of sludge application based on N content, a very high level of P was noted in the soil with the �80 lb N/A rate, as well as an elevated pH level, indicating the importance of taking into consideration the total nutrient content of the material. Also, NO
3--N in the fall profile was higher with �80 lb N/A
as sludge than with UAN. This indicates the importance of accounting for residual N in the soil profile as discussed in more detail later in this chapter. Applying manure based on P content and supplementing with a fertilizer N source when necessary is a good approach to take with these or-ganic materials.
Nitrogen in the irrigation water is also an important source of N to the crop during the growing season and needs to be
considered when estimating N fertilizer requirements of an irrigated corn crop. Determining or estimating N fertilizer needs for the corn season should consider all of the above factors when deciding how much N to apply to produce an optimum corn yield at a given location. Most soil testing laboratories take these factors into account when making N fertilizer recommendations based on a reasonable yield goal for the field.
NEfficiency,Application,andLossConsiderationsNitrogen use efficiency (NUE) of applied N is usually lower than 50% at optimum yield potential (Snyder and Bruulse-ma, 2007). Potential losses of N include crop removal, run-off, leaching, denitrification, volatilization, and immobili-zation. Runoff loss of surface applied N will vary according to rainfall intensity, residue cover, soil moisture content, and soil texture and physical properties. Subsurface place-ment of N will reduce, if not eliminate, losses from runoff. Soil type (coarse textured soils vs. fine textured soils) needs to be taken into consideration when determining when and how to apply the N fertilizer. Coarse textured soils have a high NO
3- leaching potential since they retain less wa-
ter than a fine textured soil. Nitrate-N is highly mobile in
Cattle manure
Swine effluent
N fertilizerlb N/A
Treatment
0
50
100
150
200G
rain
yie
ld, b
u/A
P N 2X N 0 60 120 180
Figure 2. Effect of cattle manure, swine effluent, and N fertil-izer on corn yield at Tribune, Kansas, 2000-2007. Source: Schlegel, et al, 2007.
020406080
100120140160180200
0 60 180N rate, lb N/A
Yiel
d, b
u/A
CheckUANSludge
Figure 3. Effect of UAN and lime stabilized sludge on corn yield, Topeka, Kansas. Source: Maddux and Barnes, 1993.
Dr. Michael Bartolo and Dr. Halvorson of USDA-ARS compare irrigated corn with low (20 lb/A) N rate in foreground and high (120 lb/A) N rate in background.
USD
A-A
RS p
ho
to

Fertilizing for Irrigated Corn / Maddux - Halvorson 3-3
soil and will move through the soil profile with the water. Therefore, choosing the right time to apply N fertilizer to the corn crop is important to reduce the potential for loss of N. When possible, N application to a corn crop should coincide with its rapid growth period (growth stages V6 to milk stage) (Ritchie et al., �997), which also corresponds to the greatest N uptake period by corn (Bauder and Was-kom, 2003). Starter fertilizer application at planting along with split N applications during the growing season may be needed to supply the corn crop with adequate N while reducing the environmental impact of N loss on groundwa-ter quality on coarse textured soils. On fine textured soils, starter fertilizer applications along with in-season N ap-plications should result in more efficient use of N by the crop. New remote sensing technologies and variable rate fertilizer applicators make it possible to determine N de-ficiencies while moving through a field with the capabili-ties of applying variable rates of N throughout the field as needed (Shanahan et al., 2008). These technologies should help improve NUE.
Where N leaching potential is low, pre-plant applications of N may be more cost effective. The use of anhydrous NH
3
is common in many areas of the central Great Plains. Its advantage is having the lowest cost per pound of N of the common N sources. Another advantage is the N is all in the ammoniacal form, so it is not subject to leaching or denitrification until it undergoes nitrification in the soil. Fall applications made after soil temperatures drop below 50° F will mostly remain in the NH
4+ form until soil tem-
perature rises above that level, usually sometime in early spring. Anhydrous NH
3 must be injected into the soil, usu-
ally to a depth of 6 to 8 in. and the application slot must be properly sealed, to avoid vaporization losses. Application to soils too wet or too dry can result in the gaseous loss of NH
3. A disadvantage of anhydrous NH
3 is that it is a pres-
surized gas and requires appropriate equipment, and leaks can pose severe health hazards. Corn yields are sometimes higher with anhydrous NH
3 when compared with surface
broadcast urea or UAN, but when these materials are in-corporated, or sub-surface applied, yields are usually equivalent. Data from north central Kansas, near Scandia (Gordon, �992), shows a good example of anhydrous NH
3
compared to surface-applied, knifed, and dribbled UAN in irrigated corn (Figure 4). In 4 of the 5 years of this study, broadcast and dribbled UAN produced lower yields, presumably from volatilization losses of urea. Knifed UAN performed similar to the knifed anhydrous NH
3. Use of sta-
bilized N sources have potential for reducing NH3 volatil-
ization losses.
Choosing controlled release N fertilizer sources, such as polymer-coated urea, would make it feasible to apply all fertilizer N preplant on most soils. A no-till study (Gordon,
2008) conducted in 2006 and 2007 near Scandia, Kansas, compared urea, urea plus Nutrisphere-N (NSN), urea + Agrotain, controlled release N (ESN), and ammonium ni-trate. All materials were surface-applied at planting (Fig-ure5). Urea alone resulted in lower corn yield than am-monium nitrate or the treated urea treatments. UAN, UAN + Agrotain, UAN + Agrotain Plus, and UAN + NSN were also included in this study and results were similar (data not shown). In irrigated systems, application of urea, UAN, or other NH
4+ based N fertilizers treated with nitrification
and urease inhibitors would allow surface broadcast ap-plications to be used when followed within days (<4) by at least a 0.5 in. of water to move the fertilizer into the soil and root zone to reduce NH
3 volatilization losses. Use of
water to move the N fertilizer into the soil on a timely basis allows the application of both dry soluble and liquid sourc-es of N fertilizer, reducing volatilization losses of NH
3-N
from the applied fertilizer. On heavy soils, especially those with a claypan or clay lenses, loss of N from denitrification of NO
3--N can occur during periods of high soil moisture
(from precipitation and/or excess irrigation).
020406080
100120140160
AA UAN-K UAN-B UAN-D
Yiel
d, b
u/A
Figure 4. Comparison of anhydrous ammonia (AA), knifed UAN (UAN-K), broadcast UAN (UAN-B), and dribbled UAN (UAN-D) on corn yields at Scandia, Kansas, 1987-91. Source: Gordon, 1992.
140
150
160
170
180
190
200
Urea NSNUrea
+
Agrotai
nAmNit
ESN
N rate, lb/A
Yiel
d, b
u/A
80160240
Figure 5. Comparison of urea, urea+NSN (Nutrisphere-N), urea+Agrotain, ammonium nitrate, and ESN (poly-mer coated urea) on corn yield, Scandia, KS, 2006-2007. Source: Gordon, 2008.

3-4 Fertilizing for Irrigated Corn / Maddux - Halvorson
Fertigation (chemigation) is another option for applying N to the corn crop under irrigated conditions, especially with overhead sprinkler systems and drip irrigations systems. Fertigation with furrow irrigation is more difficult and can result in loss of N fertilizer in the drainage water. With furrow irrigation systems, applying N preplant is often a common practice or using subsurface banding equipment to apply N following crop emergence. Surface broadcast N applications should be incorporated in furrow-irrigated systems to reduce loss of N from the field.
Balancing the N and P needs for corn is important. Work near Tribune in western Kansas (Schlegel, 2007) showed that applying N or P alone resulted in lower yields than when applying both nutrients to the corn crop (Figure6). Similar results have also been obtained in long-term stud-ies near Scandia and Topeka, Kansas (Gordon, 2007; Mad-dux, 2007). Phosphorus deficiency will result in inefficient use of applied N and lower yields.
Fertilizing corn in areas with high levels of residual N, such as in vegetable production, will require soil testing to assess residual soil NO
3-N levels before planting to better
plan N fertilization strategies and avoid over fertilization. Corn responds well to residual soil N located in the up-per 3 feet of soil (Halvorson et al., 2005). For example, in the Arkansas River Valley in Colorado shallow rooted vegetable crops are grown with high rates of N fertilizer applied to enhance crop quality and marketability (Halvor-son et al., 2008a). Residual soil NO
3-N tends to be high in
these soils, especially following an onion crop. Residual soil NO
3-N following an onion crop treated with 200 lb N/
A increased from ��2 lb N/A at onion planting to 360 lb N/A in the 0 to 6 ft. soil profile at corn planting the next spring. The response of furrow-irrigated corn to increas-ing levels of available N [soil N (0 to 2 ft. depth) + ir-rigation water N + fertilizer N] following onion crops in 2006 and 2007 is shown in Figure7. Statistical analyses [linear (LP) and quadratic (QP) plateau regression models] showed the optimum yield ranged from 260 to 267 bu/A at available N levels of �9� and 294 lb N/A, respectively. The linear plateau model shows a more conservative level of N management and a lower optimum yield potential than the quadratic plateau model. Managing the available N level somewhere between these two model estimates for opti-mum yield should result in efficient use of N and optimum economic returns. Including soil N from deeper soil depths improved yield predictability in this study.
This example from Colorado shows the importance of eval-uating residual soil N levels and accounting for N in the ir-rigation water when applying N to the corn crop. Conserva-tive use of N on corn produced in areas with high residual soil N will improve fertilizer NUE. Over-application of N, regardless of source, will result in an increase in residual soil N and a larger amount of nitrous oxide gas (a green-house gas that contributes to global warming) emissions to the environment than is necessary. Greenhouse gas work in irrigated corn fields in Colorado (Mosier et al., 2006; Halvorson et al., 2008b) show that nitrous oxide emissions increase linearly with increasing N rates. Thus, it is impor-
0
50
100
150
200
250
0 40 80 120 160 200
Yiel
d, b
u/A
N Rate, lb/A
0 P40 P2O580 P2O5
1998-2007
Conventional till corn (2006 and 2007), Rocky Ford, CO.
100
120
140
160
180
200
220
240
260
280
0 100 200 300 400 500Available N [IW+Soil N (0-2 ft.) + fert. N], lb N/A
Cor
n gr
ain
yiel
d, b
u/A
LP model: Plateau = 260 bu/A Optimum AN level of 191 lb N/A
QP model: Plateau = 267 bu/A Optimum AN level of 294 lb N/A
Figure 6. Interaction of N and P fertilizer application on long-term corn yields at Tribune, Kansas, 1998-2007. Source: Schlegel, 2007.
Figure 7. Corn grain yields following onion, with high residual soil N levels as a function of available N [irrigation water N + soil N (0 to 2 ft.) + fertilizer N applied] in 2006 and 2007 near Rocky Ford, Colorado. Source: Halvorson et al., 2008a.
Adequate N is essential to proper grain fill in irrigated corn.
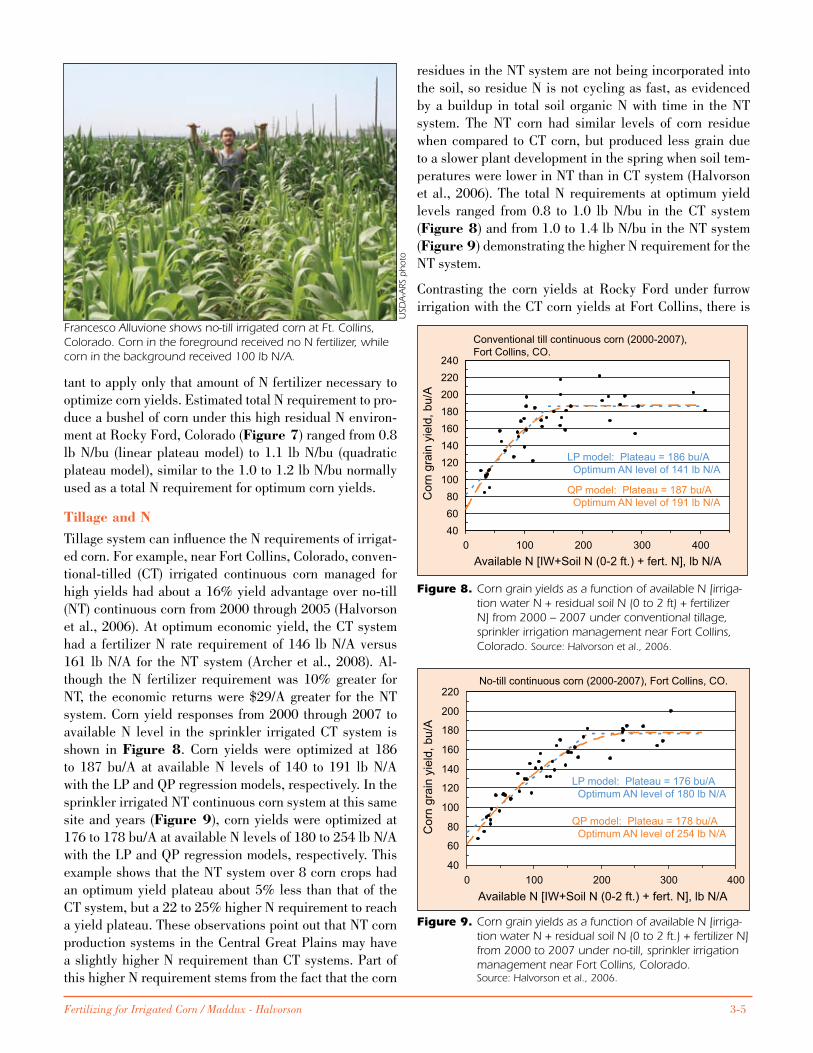
Fertilizing for Irrigated Corn / Maddux - Halvorson 3-5
residues in the NT system are not being incorporated into the soil, so residue N is not cycling as fast, as evidenced by a buildup in total soil organic N with time in the NT system. The NT corn had similar levels of corn residue when compared to CT corn, but produced less grain due to a slower plant development in the spring when soil tem-peratures were lower in NT than in CT system (Halvorson et al., 2006). The total N requirements at optimum yield levels ranged from 0.8 to �.0 lb N/bu in the CT system (Figure8) and from �.0 to �.4 lb N/bu in the NT system (Figure9) demonstrating the higher N requirement for the NT system.
Contrasting the corn yields at Rocky Ford under furrow irrigation with the CT corn yields at Fort Collins, there is
Conventional till continuous corn (2000-2007), Fort Collins, CO.
406080
100120140160180200220240
0 100 200 300 400Available N [IW+Soil N (0-2 ft.) + fert. N], lb N/A
Cor
n gr
ain
yiel
d, b
u/A
LP model: Plateau = 186 bu/A Optimum AN level of 141 lb N/A
QP model: Plateau = 187 bu/A Optimum AN level of 191 lb N/A
Figure 8. Corn grain yields as a function of available N [irriga-tion water N + residual soil N (0 to 2 ft) + fertilizer N] from 2000 – 2007 under conventional tillage, sprinkler irrigation management near Fort Collins, Colorado. Source: Halvorson et al., 2006.
Figure 9. Corn grain yields as a function of available N [irriga-tion water N + residual soil N (0 to 2 ft.) + fertilizer N] from 2000 to 2007 under no-till, sprinkler irrigation management near Fort Collins, Colorado. Source: Halvorson et al., 2006.
No-till continuous corn (2000-2007), Fort Collins, CO.
40
60
80
100
120
140
160
180
200
220
0 100 200 300 400Available N [IW+Soil N (0-2 ft.) + fert. N], lb N/A
Cor
n gr
ain
yiel
d, b
u/A
LP model: Plateau = 176 bu/A Optimum AN level of 180 lb N/A
QP model: Plateau = 178 bu/A Optimum AN level of 254 lb N/A
Francesco Alluvione shows no-till irrigated corn at Ft. Collins, Colorado. Corn in the foreground received no N fertilizer, while corn in the background received 100 lb N/A.
tant to apply only that amount of N fertilizer necessary to optimize corn yields. Estimated total N requirement to pro-duce a bushel of corn under this high residual N environ-ment at Rocky Ford, Colorado (Figure7) ranged from 0.8 lb N/bu (linear plateau model) to �.� lb N/bu (quadratic plateau model), similar to the �.0 to �.2 lb N/bu normally used as a total N requirement for optimum corn yields.
TillageandNTillage system can influence the N requirements of irrigat-ed corn. For example, near Fort Collins, Colorado, conven-tional-tilled (CT) irrigated continuous corn managed for high yields had about a �6% yield advantage over no-till (NT) continuous corn from 2000 through 2005 (Halvorson et al., 2006). At optimum economic yield, the CT system had a fertilizer N rate requirement of �46 lb N/A versus �6� lb N/A for the NT system (Archer et al., 2008). Al-though the N fertilizer requirement was �0% greater for NT, the economic returns were $29/A greater for the NT system. Corn yield responses from 2000 through 2007 to available N level in the sprinkler irrigated CT system is shown in Figure 8. Corn yields were optimized at �86 to �87 bu/A at available N levels of �40 to �9� lb N/A with the LP and QP regression models, respectively. In the sprinkler irrigated NT continuous corn system at this same site and years (Figure9), corn yields were optimized at �76 to �78 bu/A at available N levels of �80 to 254 lb N/A with the LP and QP regression models, respectively. This example shows that the NT system over 8 corn crops had an optimum yield plateau about 5% less than that of the CT system, but a 22 to 25% higher N requirement to reach a yield plateau. These observations point out that NT corn production systems in the Central Great Plains may have a slightly higher N requirement than CT systems. Part of this higher N requirement stems from the fact that the corn
USD
A-A
RS p
ho
to

3-6 Fertilizing for Irrigated Corn / Maddux - Halvorson
ReferencesArcher, D.W., A.D. Halvorson, and C.A. Reule. 2008. Economics of Irrigated
Continuous Corn under Conventional-Till and No-Till in Northern Colo-rado. Agron. J. 100: 1166-1172.
Bauder, T. and R. Waskom. 2003. Best management practices for Colorado corn. Colorado State Univ. Coop. Ext. Bul. XCM574A. Fort Collins, CO. 87p.
Bruulsema, T. 2007. A research agenda for managing crop nitrogen for weather. Better Crops 91(4):3-5.
Gordon, Barney. 2008. Nitrogen management for no-tillage corn and grain sorghum production. In 2008 Great Plains Soil Fert. Conf., Proc., Vol. 12:67-70. Denver, CO. March 4-5, 2008.
Gordon, W.B., D.A. Whitney, and R.J. Raney. 1992. Nitrogen management for ridge-tilled corn production. In Kansas Fert. Res., Report of Progress 670:69-72. Kansas State University, Agri. Exp. Sta. & Coop. Ext. Service, Manhattan, KS.
Halvorson, Ardell D., Michael E. Bartolo, Curtis A. Reule, and Abdel Berrada. 2008a. Nitrogen effects on onion yield under drip and furrow irrigation. Agron. J. 100: 1062-1069.
Halvorson, A.D., S.J. Del Grosso, and C.A. Reule. 2008b. Nitrogen, tillage, and crop rotation effects on nitrous oxide emissions from irrigated crop-ping systems. J. Environ. Qual. 37: 1337-1344.
Halvorson, A.D., A.R. Mosier, C.A. Reule, and Walter C. Bausch. 2006. Nitrogen and tillage effects on irrigated continuous corn yields. Agron. J. 98:63-71.
Halvorson, A.D. and C.A. Reule. 2006. Irrigated corn and soybean response to nitrogen under no-till in northern Colorado. Agron. J. 98:1367-1374.
Halvorson, A.D., Schweissing, F., Bartolo, M., Reule, C.A. 2005. Corn Re-sponse to Nitrogen Fertilization in A Soil With High Residual Nitrogen. Agron. J. 97:1222-1229.
Maddux, L.D. 2007. Macronutrient fertility on irrigated corn and soybeans in a corn/soybean rotation. In Agronomy Field Research. Report of Progress 975:KRV7-10. Kansas State University, Agri. Exp. Sta. & Coop. Ext. Service, Manhattan, KS.
Maddux, L.D., and P.L. Barnes. 1991. Evaluation of nitrogen fertilization on corn-soybean cropping sequences. In Kansas Fert. Res., Report of Progress 647:50-51. Kansas State University, Agri. Exp. Sta. & Coop. Ext. Service, Manhattan, KS.
Maddux, L.D. and P.L. Barnes. 1993. Evaluation of lime-amended sludge on irrigated corn. In Kansas Fert. Res., Report of Progress 697:45-50. Kansas State University, Agri. Exp. Sta. & Coop. Ext. Service, Manhattan, KS.
Mosier, A.R., A.D. Halvorson, C.A. Reule, and X.J. Liu. 2006. Net global warming potential and greenhouse gas intensity in irrigated cropping systems in northeastern Colorado. J. Environ. Qual. 35:1584-1598.
Ritchie, S.W., J.J. Hanway, and G.O. Benson. 1997. How a corn plant develops. Special Report No. 48, Iowa State Univ., Coop. Exten. Serv., Ames, IA. 21p.
Roberts, T.L. 2007. Right product, right place, right time, and right place…the foundation of BMPs for fertilizer. Better Crops 91(4):14-15.
Schlegel, A.J. 2007. Nitrogen and phosphorus fertilization of irrigated corn. In Kansas Fert. Res., Report of Progress 976. Kansas State University, Agri. Exp. Sta. & Coop. Ext. Service, Manhattan, KS, pp 4-5. In Kansas Fert. Res., Report of Progress 976:4-5. Kansas State University, Agri. Exp. Sta. & Coop. Ext. Service, Manhattan, KS.
Schlegel, A.J., L. Stone, H.D. Bond, and M. Alam. 2007. Animal waste applications for irrigated corn. In Kansas Fert. Res., Report of Progress 976:6-8. Kansas State University, Agri. Exp. Sta. & Coop. Ext. Service, Manhattan, KS.
Schmidt, J.P., A.J. DeJoia, R.B. Ferguson, R.K. Taylor, R.K. Young, and J.L. Havlin. 2002. Corn yield response to nitrogen at multiple in-field loca-tions. Agron. J. 94:798-806.
Shanahan, J.F., J.S. Schepers, R.B. Ferguson, and D. Roberts. 2008. Update on using active sensors to manage N application on corn. In Proc. of 2008 Great Plains Soil Fertility Conference, A. Schlegel (ed). Kansas State University. 12:71-76.
Snyder, C.S. and T.W. Bruulsema. 2007. Nutrient use efficiency and effective-ness in North America: Indices of agronomic and environmental benefit. International Plant Nutrition Institute, Norcross, GA. Ref. # 07076.
a higher level of available N required with the higher corn yields at Rocky Ford than the CT corn yields at Fort Col-lins. So yield potential influences the amount of N needed by the corn crop. Longer season corn was grown at Rocky Ford than at Fort Collins, with longer season corn having a higher yield potential.
SummaryOptimizing corn yields, economic returns, and NUE re-quires that the right N source be applied at the right rate, at the right time, and in the right place. Soil testing is a criti-cal component for determining the right rate to be used. Previous cropping history and crop management practices also play a key role in efficient use of N.
Author information: Dr. Maddux (e-mail: [email protected]) is Professor of Soil Fertility with Kansas State University and Agronomist-in-Charge at the Kansas River Valley Experiment Field, Topeka, Kansas. Dr. Halvorson (e-mail: [email protected]) is Research Soil Sci-entist with USDA-ARS, Fort Collins, Colorado.
Longer season corn tends to offer higher yield potential, but may require more N. Dr. Halvorson (left) and Dr. Bartolo examine longer season corn.

Fertilizing for Irrigated Corn / Janssen 4-�
Abbreviations and notes for this article: P = phosphorus.
Fertilizing for Irrigated Corn — Chapter 4
Phosphorus Management By Keith Janssen
Phosphorus is one of the three major plant nutrients commonly applied as fertilizer for crop production. It
is necessary for many of the chemical and physical pro-cesses in plants. It has a major role in energy transfer, pho-tosynthesis, and respiration, and is a structural component of many plant parts. Corn seeds contain, on average, an approximately 7-day supply of P. After that the corn plant must acquire P through root uptake from the soil (Aldrich et al., �986).
PhosphorusSoilChemistryandPlantUptakePhosphorus occurs naturally in soils in relatively large quantities. The majority exists as mineral and organic P forms and is not directly useable by plants. Plants can take up P only from the solution phase of the soil as the soluble orthophosphate anion. The predominant orthophosphate anion form in acid soils is H
2PO
4- and in alkaline soils
HPO4-2.
The amount of orthophosphate P available in the soil so-lution phase for plant uptake is small in relation to the total P content in the soil and is minuscule in quantity at any given time. It is in constant equilibrium with the solid phase P. Chemical reactions, both positive and negative, influence the concentration of orthophosphate-P present in the soil solution phase. Depending on the concentration of orthophosphate-P present in the soil solution phase, min-eral and organic P compounds in the soil may release or remove orthophosphate-P from the soil solution by various mechanisms, including dissolution, de-sorption, mineral-ization, adsorption, or precipitation. The concentration of orthophosphate-P in the soil solution phase in contact with the crop roots must be replenished many times during the growing season for the crop to obtain sufficient uptake of P.
For corn, P uptake generally parallels that of dry weight accumulation (Figure1). On average, about 55% of the P taken up by the corn plant is partitioned to the grain and 45% to the stover.
EffectsofSoilpHontheAvailabilityofPinSoilsSoil pH has a major influence on the solubility and the ad-sorption characteristics of P minerals in soils (Figure2). Highest availability of P occurs between soil pH of about 5.5 to 7.0.
PDeficiencyStunting and dark-green or reddish purple leaf coloration is characteristic of symptoms of P deficiency in corn. These symptoms occur most often during the early part of the corn growing-season. This is because early in the corn growing season the corn plant has a limited root system and ability to take up P. Also, soil temperatures during the early part of the season are often colder, and that results in reduced mineralization of organic P and solubility of inorganic P.
Corn seeds contain only a few days’ supply of P. After that, plants must acquire P through root uptake.
Figure 1. Phosphorus in the life of the corn plant Source: adapted from Hanway, 1963.

4-2 Fertilizing for Irrigated Corn / Janssen
Mild cases of P deficiencies rarely show visual symptoms.
PFertilizerandManureApplicationsPhosphorus fertilizer and manure recommendations are usually based on soil test P levels, and either sufficiency or build-maintenance strategies (Figure 3). Sufficiency recommendations (see Table3 in Chapter �) are intended to provide optimum economic return in the year of nutri-ent application while achieving 90 to 95% of maximum yield. Build-maintenance recommendations (see Table4 in Chapter �) are intended to build soil P test values over a planned timeframe and then maintain those soil P test levels in the 20 to 30 ppm range. Soil P test levels below 20 ppm are considered to be deficient and in need of P fertilizer or manure application. When soil P test levels exceed 50 ppm, manure P applications are limited to crop P replacement levels only and if above the manure-man-agement range no applications of P fertilizers or manure is recommended. This subject is covered in greater detail in the chapter on soil testing.
TimingandPlacementofPFertilizerandManureApplicationsTiming of P fertilizer and manure applications generally are less critical than that for N, but placement is more im-portant. Since P does not move in the soil, leaching is usu-ally not a problem, but placement of the P to ensure root contact is crucial. Incorporation by mixing or other sub-surface application of P fertilizers and manure into the soil is recommended. Phosphorus fertilizers and manure need to be placed in the soil where it will be in contact with ac-tively growing roots. Also, P fertilizer and manure applied on the soil surface can lead to increased P losses in surface water runoff which is further justification for incorporation or sub-surface application.
Placement of P fertilizer in bands is generally more effi-cient than broadcast and incorporation, especially when soil P test levels are low and when applied to soils that strongly adsorb P. Placement of P in the soil in concen-trated bands reduces contact between the soil and the fer-tilizer and saturates P adsorption sites in the P fertilized zone. As a result, not as much P is exposed to adsorbtion by the soil. That enables some of the fertilizer P to remain in solution longer, making it easier for the plant to acquire P. The most efficient P placement methods are pop-up (in the seed furrow), 2x2 (2 in. to the side and below the seed), pre-plant deep banding, and dual N-P placement (banding P with anhydrous ammonia). The suggested rates for band-ed P fertilizer applications are generally one-half to one-third less than for broadcast applications. In that case, care should be taken to avoid depletion of soil test P over time. To be most effective, P fertilizer bands should be placed not more than 6 to 8 in. deep in the soil, otherwise early season availability will be significantly limited.
When corn plants are small and have limited roots for P uptake, zones of concentrated fertilizer placed in bands near the row may stimulate additional P uptake and growth.
Figure 2. The availability of P as affected by soil pH. Source: International Plant Nutrition Institute, 2006.
Figure 3. Phosphorus management model for Kansas crop production and manure management. Source: Leikam et al., 2003.
Stunting and dark-green or reddish purple leaf coloration are characteristic symptoms of P deficiency in corn.
Rel
ativ
e yi
eld,
%
VL L M H VH
100 %95 %
50 %
50 ppm
Crop responsive soil test range Maintenancerange
Manuremanagement range
Environmental risk range
EX
Fertilizer and manure nutrient recommendation zone
No nutrient applications
recommended
Manure allocation
10 ppm 20 ppm 30 ppm
20 ppmcritical value
30 ppmupper build
Buildrecommendation
Sufficiencyrecommendation
Maintenancerecommendation
Starter only recommendation
Bray P-1 soil test, ppm
Upper manure limit
Starter only recommendation

Fertilizing for Irrigated Corn / Janssen 4-3
This is why starter or pop-up P fertilizers are applied even when soil P test levels are high.
When P fertilizers are applied with the seed, caution must be taken, especially if the P materials contain more than �0 lb/A N and K
2O combined. Fertilizers are salts and when
applied in excess of tolerable levels can negatively affect stand and early-season vegetative growth, especially on sandy soils and when soil conditions at planting are dry.
EnvironmentalStewardshipMinimizing P runoff losses from fields fertilized with P fer-tilizers and manure requires careful management. Exces-sive P loss can lead to increased plant and algal production (eutrophication) in surface waters.
For row crop producers, controlling soil erosion is key to preventing P runoff losses to surface waters. Enriched sed-iments from P fertilizer and manure-fertilized fields can deliver elevated levels of P to streams and surface water bodies. Minimizing losses of dissolved P in runoff is also important.
Research has shown that the first couple of runoff events following a surface application of P fertilizer or manure will often result in the largest concentrations of soluble P in runoff (Figure4). Incorporation or sub-surface applica-tion of these P fertilizer materials is necessary to minimize losses. Phosphorus fertilizers contain greater than 85% water soluble P and manures contain on average approxi-mately 5% water soluble P.
Over-fertilization with P fertilizer or manure, or repeated applications on or near the soil surface without incorpo-ration, can lead to P runoff problems in some areas. Any practice that concentrates P in the top inch or two of soil can lead to increased P runoff. Soils with very high levels of soil test P at the soil surface and a transport pathway will deliver P-enriched sediments and high levels of soluble P to streams and surface water bodies. Sharpley et al. (�986) showed that there is a strong linear relationship between soil P test levels in the top inch of soil and the loss of sol-uble P in runoff.
Figure 4. Soluble P concentrations in successive runoff events following the surface application of 50 lb P
2O
5/A,
2001. Source: Unpublished data, K.A. Janssen, Kansas State Univ.
The following are best management practices (BMPs) rec-ommended for minimizing P losses from cropland;
• Control soil erosion;
• Apply P fertilizer and manure according to soil P test recommendations;
• Incorporate or subsurface inject P fertilizers and live-stock manure.
Author information: Dr. Janssen is Agronomist with Kansas State University, located at Ottawa, Kansas; e-mail: [email protected].
ReferencesAldrich, S.R., W.O. Scott, and R.G. Hoeft.1986. Modern Corn Production.
3rd edition. A & L Publication, Inc.. Champaign, IL.Hanway, J.J. 1963. Growth stages of corn (Zea mays, L.). Agron. J.55:487-
492International Plant Nutrition Institute. 2006. Soil Fertility Manual. p. 4-10.
Norcross, GA.Leikam, D.F., R.E. Lamond, and D.B. Mengel. 2003. Soil test interpretations
and fertilizer recommendations. Kansas State University Agricultural Experiment Station and Cooperative Extension Service. MF – 2586, September 2003
Sharpley, A.N., S.J. Smith, and R.G. Menzel. 1986. Phosphorus criteria and water quality management for agricultural watersheds. Lake Reserv. Mgmt. 2:177-182.
0
1
2
3
4
5
6
7
1st 2nd 3rd 4th 5th 6th 7thNumber of runoff events after surface P application
Orth
o-P
, mg/
L

4-4 Fertilizing for Irrigated Corn / Janssen

Fertilizing for Irrigated Corn / Gordon 5-�
Abbreviations and notes for this article: N = nitrogen; P = phosphorus; K = potassium; ppm = parts per million;
Fertilizing for Irrigated Corn — Chapter 5
Potassium Fertilization of Irrigated CornBy W.B. (Barney) Gordon
The use of conservation-tillage has increased in recent years because of its effectiveness in conserving soil
and water. Potassium deficiency can be a problem on soils that have been managed with reduced tillage practices. The large amount of residue left on the soil surface can depress soil temperature early in the growing season. Low soil temperature can interfere with plant root growth, nutri-ent availability in soil, and crop nutrient uptake.
Soil temperature influences both K uptake by roots and K diffusion through the soil. Ching and Barber (�979) investi-gated the effects of temperature on K uptake by corn using a simulation model. At the low soil K level, increasing soil temperature increased uptake, while at the high K level there was no effect of temperature on uptake (Table1).
Low soil water content or zones of soil compaction also can reduce K availability. Potassium uptake in corn is great-est early in the growing season and accumulates in plant parts at a relatively faster rate than either dry matter, N, or P. Cool spring temperatures can limit early-season root growth and K uptake by corn.
In plant physiology, K is the most important cation not only in regard to concentration in tissues but also with respect to physiological functions. Potassium is considered to be a relatively immobile element in soil, but a mobile nutri-ent in plants. In general, K in plants moves from older to younger leaves. Classical K deficiency in corn may not be visible initially, but can be expressed as an overall reduc-tion in plant growth rate. Visual K deficiency appears first as yellowing in the tips of lower leaves. The deficiency symptoms appear as yellow, tan, and then brown discolor-ation and progress from the tip along the outside margins of the leaf blades. The inner part of the leaf near the midrib may stay green for a time while the margins of the leaves fire and turn brown.
A deficiency in K affects such important physiological pro-cesses as respiration, photosynthesis, chlorophyll develop-ment, and regulation of stomatal activity. Plants suffering from a K deficiency show a decrease in turgor, making re-sistance to drought poor. The main function of K in bio-chemistry is its function in activating many different en-zyme systems involved in plant growth and development. Potassium also influences crop maturity and plays a role in reducing disease and stalk lodging in corn. Deficiency of K may result in incidence of stalk diseases that can weaken stalks and result in lodging problems.
The appearance of K deficiency in fields managed with conservation tillage systems has been reported with great-er frequency in recent years and has become a concern for producers. In the central Great Plains, starter fertilizer applications have proven effective in some cases in enhancing nutrient uptake and yield of corn even on soils that are high in available K.
Potassium is considered to be relatively immobile in soil, but mobile in plants.
Table 1. Predicted K uptake by corn as affected by soil K level, air temperature, and soil temperature.
Air temperature, ºF Low soil K High soil K
- - - - - - - - Soil Temperature, ºF - - - - - - - -
59 84 59 84
- - - - - - - - K uptake, mmol/pot - - - - - - - -
59 0.44 1 3.1 3.1
84 0.77 1.8 8.9 8.9
Source: Ching and Barber, 1979.
Potassium deficiency symptoms in corn may appear as yellow, tan, and then brown discoloration progressing from the tip along the outside margin of the leaf blade.

5-� Fertilizing for Irrigated Corn / Gordon
PotassiumResearchStarterK—NorthCentralKansas—Two separate studies were conducted at the North Central Kansas Ex-periment Field (Gordon, �004). Both experiments were on a Crete silt loam soil in areas that had been ridge-tilled since �984. Both sites also were furrow irrigated. Potassi-um deficiencies had been observed in these two areas prior to the initiation of the studies. Ear-leaf K concentrations had proven to be below published sufficiency ranges.
In the first study, a field experiment was conducted for three crop years, �000 to �00�. Soil test results showed that initial pH was 6.�, organic matter was �.4%, Bray-� P and exchangeable K in the top 6 in. of soil were 40 and 4�0 ppm, respectively. Treatments consisted of the liquid starter fertilizer N-P
�O
5-K
�O combinations 30-�5-
5, �5-30-5, 30-30-0, and 30-30-5. A no-starter check was also included. Starters were made using �8% UAN, ammo-nium polyphosphate (�0-34-0), and potassium thiosulfate (KTS; 0-0-�5-�7). Nitrogen was balanced so that all plots received ��0 lb N/A regardless of starter treatment. On plots receiving no KTS, ammonium sulfate was included in order to eliminate S as a variable. Starter fertilizer was applied � in. to the side and � in. below the seed (�x�) at planting.
The 30-30-5 starter treatment increased corn 6-leaf stage dry matter and tissue K content, decreased the number of days from emergence to mid-silk and increased grain yield as compared to the 30-30-0 treatment (Table2). A small amount of K applied as a starter on this high soil test K soil resulted in better growth, more nutrient uptake, and �� bu/A greater yield than starter that did not include K. In all cases, the 30-30-5 starter also was superior to the �5-30-5 treatment, indicating that N is an important ele-ment of starter fertilizer composition. All starter treatments improved growth and yield over the no-starter check.
Another study was conducted during the �00�-�003 grow-ing seasons on a site that was lower in soil test K than the previous experiment. Analysis showed that initial soil pH was 6.9; organic matter was �.5%; Bray-� P was 35 ppm, and exchangeable K was �50 ppm. Treatments consisted of liquid starter fertilizer rates of 0, 5, �5, or �5 lb K
�O/A
applied in combination with 30 lb N, �5 lb P�O
5, and 5 lb
S/A. A 30-�5-�5-0 treatment was included to separate the effects of K and S. The K source used in this treatment was KCl. The source of K used in all other treatments was KTS. Starter fertilizer was again applied �x� at planting. Nitro-gen was balance on all plots to give a total of ��0 lb/A.
Grain yield was maximized with application of �5 lb of K�O
in the starter (Table3). Addition of �5 lb K�O/A to the
starter increased grain yield by �3 bu/A over the starter containing only N and P. No response to S was seen at this site. All combinations improved yields over the no-starter check.
Even though soil test K was in the high range, addition of K in the starter fertilizer increased early season growth and yield of corn. At this site, �5 lb K
�O/A was required
to reach maximum yield. In the previous experiment on a soil much higher in available K, only 5 lb K
�O/A was need
to maximize yields. In these experiments, addition of K to starters containing N and P has been shown to improve early season growth, nutrient uptake, earliness, and yield of corn grown in a long-term ridge-tillage production sys-tem.
In reduced or no-tillage systems, immobile elements such as K can become stratified in the soil profile. After �4 con-secutive years in a ridge-tillage production system on a Crete silt loam soil at the North Central Kansas Experi-ments Field, soil test K levels were still in the “high” cat-egory in the inter-row area, but in the “low” category in areas directly under the row (Figure1).
Table 2. Starter fertilizer combinations effects on V6 dry weight, K uptake, days from emergence to mid-silk, and yield of corn, Experiment 1, 2000-2002.
TreatmentsN-P
2O
5-K
2O,
V6 Dry weight
V6 K uptake
Days to mid-silk
Grain yield
lb/A - - - - - - - - - lb/A - - - - - - - - - bu/A0-0-0 Check 210 6.2 79 16230-15-0 382 10.9 71 17515-30-5 355 15.2 71 17330-30-0 395 11.2 71 18430-30-5 460 15.2 68 195LSD(0.05) 28 1.5 2 10Source: Gordon, 2004.
Table 3. Starter fertilizer combinations effects on V6 dry weight, K uptake, days from emergence to mid-silk, and yield of corn, Experiment 2, 2002-2003.
Treatments N-P
2O
5-K
2O
V6 Dry weight
V6 K uptake
Days to mid-silk
Grain yield
lb/A lb lb/A bu/A0-0-0-0 Check 208 6.9 82 16130-15- 5-5 312 12.8 76 18930-15-15-5 395 16.2 72 19830-15-25-5 398 16.9 72 19730-15-0 290 8.8 76 18530-15-15-0 398 16.1 72 198LSD(0.05) 31 1.9 2 11Source: Gordon, 2004.
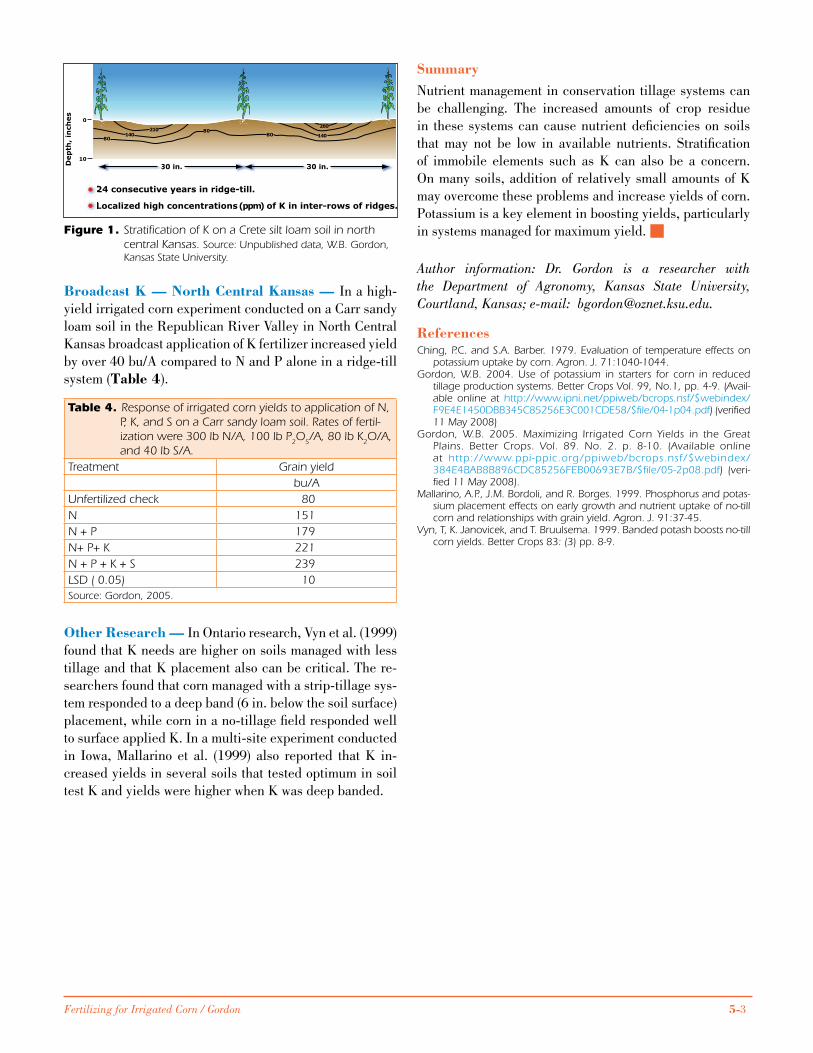
Fertilizing for Irrigated Corn / Gordon 5-3
BroadcastK—NorthCentralKansas—In a high-yield irrigated corn experiment conducted on a Carr sandy loam soil in the Republican River Valley in North Central Kansas broadcast application of K fertilizer increased yield by over 40 bu/A compared to N and P alone in a ridge-till system (Table4).
OtherResearch—In Ontario research, Vyn et al. (�999) found that K needs are higher on soils managed with less tillage and that K placement also can be critical. The re-searchers found that corn managed with a strip-tillage sys-tem responded to a deep band (6 in. below the soil surface) placement, while corn in a no-tillage field responded well to surface applied K. In a multi-site experiment conducted in Iowa, Mallarino et al. (�999) also reported that K in-creased yields in several soils that tested optimum in soil test K and yields were higher when K was deep banded.
SummaryNutrient management in conservation tillage systems can be challenging. The increased amounts of crop residue in these systems can cause nutrient deficiencies on soils that may not be low in available nutrients. Stratification of immobile elements such as K can also be a concern. On many soils, addition of relatively small amounts of K may overcome these problems and increase yields of corn. Potassium is a key element in boosting yields, particularly in systems managed for maximum yield.
Author information: Dr. Gordon is a researcher with the Department of Agronomy, Kansas State University, Courtland, Kansas; e-mail: [email protected].
ReferencesChing, P.C. and S.A. Barber. 1979. Evaluation of temperature effects on
potassium uptake by corn. Agron. J. 71:1040-1044.Gordon, W.B. 2004. Use of potassium in starters for corn in reduced
tillage production systems. Better Crops Vol. 99, No.1, pp. 4-9. (Avail-able online at http://www.ipni.net/ppiweb/bcrops.nsf/$webindex/F9E4E1450DBB345C85256E3C001CDE58/$file/04-1p04.pdf) (verified 11 May 2008)
Gordon, W.B. 2005. Maximizing Irrigated Corn Yields in the Great Plains. Better Crops. Vol. 89. No. 2. p. 8-10. (Available online at http://www.ppi-ppic.org/ppiweb/bcrops.nsf/$webindex/384E4BAB8B896CDC85256FEB00693E7B/$file/05-2p08.pdf) (veri-fied 11 May 2008).
Mallarino, A.P., J.M. Bordoli, and R. Borges. 1999. Phosphorus and potas-sium placement effects on early growth and nutrient uptake of no-till corn and relationships with grain yield. Agron. J. 91:37-45.
Vyn, T, K. Janovicek, and T. Bruulsema. 1999. Banded potash boosts no-till corn yields. Better Crops 83: (3) pp. 8-9.
Figure 1. Stratification of K on a Crete silt loam soil in north central Kansas. Source: Unpublished data, W.B. Gordon, Kansas State University.
Table 4. Response of irrigated corn yields to application of N, P, K, and S on a Carr sandy loam soil. Rates of fertil-ization were 300 lb N/A, 100 lb P
2O
5/A, 80 lb K
2O/A,
and 40 lb S/A. Treatment Grain yield
bu/AUnfertilized check 80N 151N + P 179N+ P+ K 221N + P + K + S 239LSD ( 0.05) 10Source: Gordon, 2005.

5-4 Fertilizing for Irrigated Corn / Gordon

Fertilizing for Irrigated Corn / Blaylock 6-�
Abbreviations and notes for this article: N = nitrogen; P = phosphorus; K = potassium; S = sulfur; Mg = magnesium; Ca = calcium; iron = Fe; Cu = copper; Mn = manganese; Cl- = chloride; B = boron; Mo = molybdenum.
Fertilizing for Irrigated Corn — Chapter 6
Managing Secondary Nutrients and MicronutrientsBy Alan Blaylock
The secondary nutrients and micronutrients are as important to plant nutrition as are the primary nutri-
ents—N, P, and K. Although secondary and micronutrients are generally required in lesser quantities than primary nutrients, they can play a critical role in optimizing crop yield. Any sound fertility program will need to take into account the potential need for each nutrient and balance among all nutrients.
SecondaryNutrients
Sulfur—Often overlooked, S can be the “weak link” in many soil fertility and plant nutrition programs. Increased crop yields, government restrictions on atmospheric S emissions, increased use of higher analysis fertilizers, and a greater awareness of crop S needs are contributing to an increased need for S fertilization. It is absorbed by corn roots in the sulfate form (SO
42-) and is required for the syn-
thesis of certain amino acids (cysteine and methionine), protein formation, and photosynthesis. A �80 bu/A corn crop takes up 30 lb of S/A with about �0 lb/A removed in the grain at harvest. Tables 1 and 2 show examples of corn response to S fertilizer.
In the field, S deficiency and N deficiency are often con-fused. Sulfur is immobile within the plant and does not readily move from old to new growth. With S deficiency, yellowing symptoms first appear in younger leaves, where-as with N deficiency, the yellowing appears on the older leaves first. In less severe situations, visual symptoms may not be noticeable. Symptoms of both N and S deficiencies may appear as stunted plants, with a general yellowing of leaves. The best way to diagnose a S deficiency is with plant tissue analysis. Desirable total N to total S ratios range from 7:� to �5:�. Wider ratios may point to possible S deficiency, but should be considered along with actual
N and S concentrations (Table 3) in making diagnostic interpretations.
Most S in the soil is bound in the organic matter and cannot be used by plants until it is converted to the SO
42- form by
soil bacteria. This process is referred to as mineralization. On deep, low organic matter, sandy soils with little or no clay in the subsoil, plants will likely respond to applica-tions of �0 to 20 lb/A SO
4-S with preplant fertilizers, or
with the first N sidedressing.
Keep in mind that SO42- is mobile in the soil, similar to
nitrate (NO3)-N, and can be leached. Practices recom-
mended for managing NO3-N to reduce leaching loss would
also be appropriate for SO4-S and improve SO
42- fertilizer
efficiency. For example, if leaching conditions are antici-pated, avoid applying SO
42- sources far in advance of plant
need. Also, over-irrigation can leach SO4-S from the root
zone and reduce fertilizer efficiency.
Table 2. Corn yields increase with S in starter fertilizer.N P
2O
5S Pioneer 3346 DeKalb 591
- - - - - - lb/A - - - - - - - - - - - - bu/A - - - - - -30 30 0 190 20030 30 10 204 212
Adapted from Gordon and Pierzynski. 1997. Kansas Fertilizer Research. (DeKalb 40Y, DeKalb 48, and Pioneer 8699 did not significantly respond to S.)
Table 1. Corn response is best when both N and S are in adequate supply—Minnesota.
S rate N rate, lb/Alb/A 0 75 150 Average
Yield, bu/A0 63 128 145 112
10 79 143 153 12520 92 146 155 131
Source: Soil Fertility Manual, IPNI, 2003.
Sulfur deficiency in corn may be confused with N deficiency. Over-irrigation can leach SO
4-S from the root zone and reduce
efficiency.

6-2 Fertilizing for Irrigated Corn / Blaylock
Common S sources are listed in the fertilizer sources chap-ter of this publication (page 2-5). With the exception of el-emental S and S coated urea, S fertilizer sources are water soluble. If elemental S is used, fall applications in excess of 50 lb/A may be needed to permit conversion and a sup-ply of at least �0 to 20 lb/A of SO
4-S by early spring and as
growth accelerates. Fall application of elemental S is gen-erally preferred to spring. Spring applications of elemental S may not provide sufficient available SO
4-S for early-sea-
son crop needs. It is also often recommended to broadcast elemental S on the surface and allow time and moisture for dispersion from the fertilizer granules then follow with in-corporation. Some irrigation waters may contain significant quantities of S. When the irrigation water exceeds about 5 ppm SO
4-S, deficiency of S is unlikely. An irrigation-water
analysis should include SO4-S to help determine fertilizer
needs.
Calcium—Calcium is taken up by plants as the divalent cation, Ca2+. It is needed for cell wall formation and normal cell division, improves the root absorption and transloca-tion of other nutrients, activates growth-regulating enzyme systems, and contributes to improved disease resistance. Along with Mg and K, Ca also helps to balance organic acids, which form during cell metabolism. Symptoms of Ca deficiency, found in the new growth because it is not readily translocated, include slowed root development and slowed new leaf growth, with leaf tips sticking together. Calcium deficiency is not likely in corn when the soil is properly limed. As soils become more acidic, crop growth is often restricted by toxic soil concentrations of Al and/or Mn, not a Ca shortage. When deficiencies occur, they are most commonly observed in acid, sandy soils where Ca has been leached by rain or irrigation water or in strongly acid peat and muck soils where the total soil Ca content is low. Application of Ca fertilizers would rarely be necessary in the central Great Plains.
Magnesium — Magnesium, as the central atom in the chlorophyll molecule, aids the plant in photosynthesis. It is also required for cell division, protein formation, P me-tabolism, plant respiration, and the activation of several enzyme systems. Magnesium is taken up by the plant as the divalent cation, Mg2+. A 200 bu/A corn crop takes up about 65 lb/A, with about �8 lb/A removed in the grain at harvest. It is mobile and easily translocated from older to younger tissues. When deficiencies occur, the older leaves are affected first with a loss of color between the leaf veins, beginning at the leaf margins or tips and progressing in-ward. Leaves appear striped, with yellowing and browning of leaf tips and edges as symptoms progress (which may be confused with K deficiency), resulting in lowered photo-synthesis and overall crop stunting.
If soil test Mg levels are below 25 to 50 ppm (50 to �00 lb/A), extractable Mg is usually considered low and ap-plication is warranted at about �0 to 40 lb of Mg/A. If Mg deficiency is detected by plant tissue analyses (Table3) before the 6 to 8-leaf stage, a soluble Mg source may be applied and watered into the soil by irrigation or rainfall. All of the common Mg fertilizer sources are water soluble except dolomitic lime. If the need for Mg is for the im-mediate crop, dolomitic lime may not provide acceptable immediate Mg supply and soluble sources are preferred. Dolomitic lime is a good Mg source for Mg deficient soils needing liming. It is not recommended for high pH soils where liming is not required. Solubility of dolomitic lime, and release of the Mg it contains, is very limited in high pH soils. Small amounts of Mg can be applied to growing crops through foliar fertilization to correct or prevent developing deficiencies, but the preferred approach is to soil-apply the required amounts before planting.
Some soil testing laboratories use cation-saturation ratios to derive Mg, Ca, and/or K recommendations. Caution should be exercised if using this method of interpretation. A wide range of cation ratios will provide adequate levels of these nutrients. Using the cation-saturation ratios often results in excessive application of some nutrients without a corresponding increase in crop yield.
MicronutrientsFive nutrients essential for growth are absorbed by corn in the micro quantity of less than a half pound each (Table4). The sixth, Fe, makes up only about 3 lb out of the 8 tons of dry matter produced by each acre of corn. The seventh, Cl-, is classified as a micronutrient, but is more abundant in corn plant tissue than either Ca, Mg, or S. Regardless of their concentration in corn tissue, each micronutrient is responsible for specific plant functions and thus each is equally important to any other essential element for high yield corn production.
Micronutrients are essential plant nutrients that are needed in small quantities. While not applied as fertilizers as often or at high rates as other nutrients, they are just as essential to the plant as N, P, and K. In many cases, soils contain
Table 3. Sufficient levels of Ca, Mg, and S in corn at different growth stages.
Plant part Ca Mg S- - - - - - - - - - % - - - - - - - - - -
Whole plants less than about 12 in. tall 0.30 to 0.70 0.15 to 0.45 0.15 to .50Leaf below the whorl prior to tasseling 0.25 to 0.50 0.13 to 0.30 0.15 to .50Ear leaf at initial silking 0.21 to 1.0 0.20 to 1.0 0.21 to .50
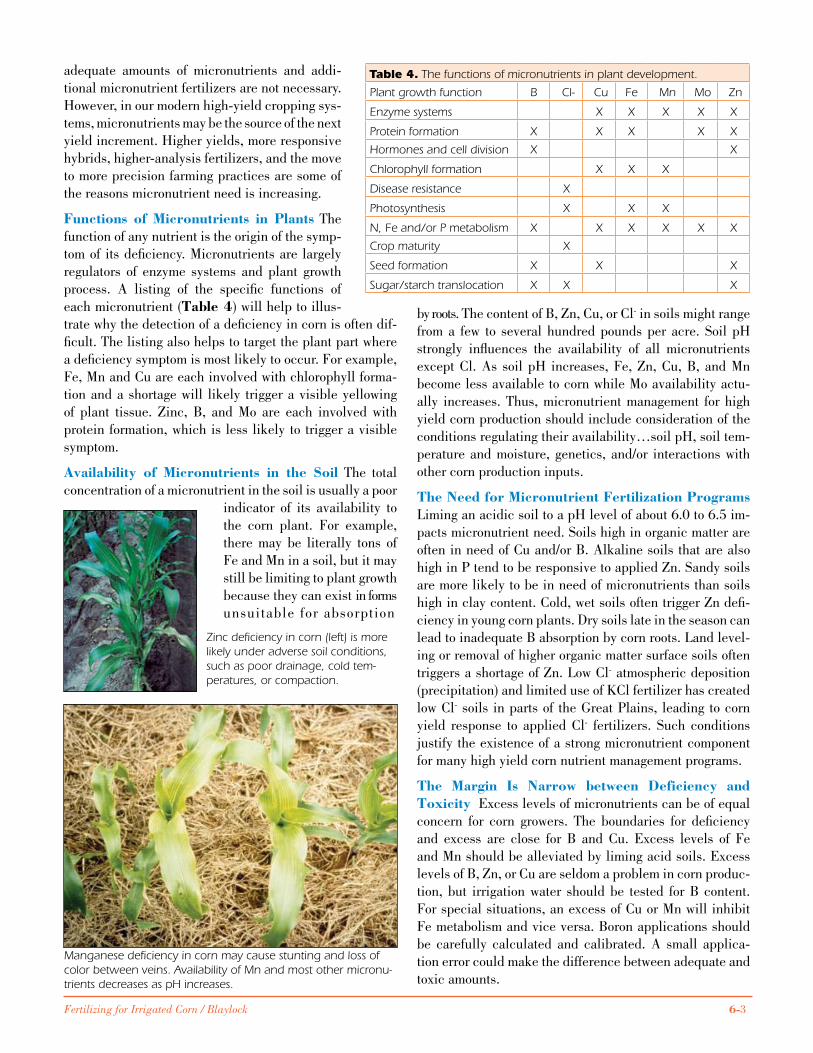
Fertilizing for Irrigated Corn / Blaylock 6-3
adequate amounts of micronutrients and addi-tional micronutrient fertilizers are not necessary. However, in our modern high-yield cropping sys-tems, micronutrients may be the source of the next yield increment. Higher yields, more responsive hybrids, higher-analysis fertilizers, and the move to more precision farming practices are some of the reasons micronutrient need is increasing.
FunctionsofMicronutrients inPlants The function of any nutrient is the origin of the symp-tom of its deficiency. Micronutrients are largely regulators of enzyme systems and plant growth process. A listing of the specific functions of each micronutrient (Table4) will help to illus-trate why the detection of a deficiency in corn is often dif-ficult. The listing also helps to target the plant part where a deficiency symptom is most likely to occur. For example, Fe, Mn and Cu are each involved with chlorophyll forma-tion and a shortage will likely trigger a visible yellowing of plant tissue. Zinc, B, and Mo are each involved with protein formation, which is less likely to trigger a visible symptom.
Availability of Micronutrients in the Soil The total concentration of a micronutrient in the soil is usually a poor
indicator of its availability to the corn plant. For example, there may be literally tons of Fe and Mn in a soil, but it may still be limiting to plant growth because they can exist in forms unsuitable for absorption
by roots. The content of B, Zn, Cu, or Cl- in soils might range from a few to several hundred pounds per acre. Soil pH strongly influences the availability of all micronutrients except Cl. As soil pH increases, Fe, Zn, Cu, B, and Mn become less available to corn while Mo availability actu-ally increases. Thus, micronutrient management for high yield corn production should include consideration of the conditions regulating their availability…soil pH, soil tem-perature and moisture, genetics, and/or interactions with other corn production inputs.
TheNeedforMicronutrientFertilizationPrograms Liming an acidic soil to a pH level of about 6.0 to 6.5 im-pacts micronutrient need. Soils high in organic matter are often in need of Cu and/or B. Alkaline soils that are also high in P tend to be responsive to applied Zn. Sandy soils are more likely to be in need of micronutrients than soils high in clay content. Cold, wet soils often trigger Zn defi-ciency in young corn plants. Dry soils late in the season can lead to inadequate B absorption by corn roots. Land level-ing or removal of higher organic matter surface soils often triggers a shortage of Zn. Low Cl- atmospheric deposition (precipitation) and limited use of KCl fertilizer has created low Cl- soils in parts of the Great Plains, leading to corn yield response to applied Cl- fertilizers. Such conditions justify the existence of a strong micronutrient component for many high yield corn nutrient management programs.
The Margin Is Narrow between Deficiency andToxicity Excess levels of micronutrients can be of equal concern for corn growers. The boundaries for deficiency and excess are close for B and Cu. Excess levels of Fe and Mn should be alleviated by liming acid soils. Excess levels of B, Zn, or Cu are seldom a problem in corn produc-tion, but irrigation water should be tested for B content. For special situations, an excess of Cu or Mn will inhibit Fe metabolism and vice versa. Boron applications should be carefully calculated and calibrated. A small applica-tion error could make the difference between adequate and toxic amounts.
Table 4. The functions of micronutrients in plant development.
Plant growth function B Cl- Cu Fe Mn Mo Zn
Enzyme systems X X X X X
Protein formation X X X X X
Hormones and cell division X X
Chlorophyll formation X X X
Disease resistance X
Photosynthesis X X X
N, Fe and/or P metabolism X X X X X X
Crop maturity X
Seed formation X X X
Sugar/starch translocation X X X
Manganese deficiency in corn may cause stunting and loss of color between veins. Availability of Mn and most other micronu-trients decreases as pH increases.
Zinc deficiency in corn (left) is more likely under adverse soil conditions, such as poor drainage, cold tem-peratures, or compaction.

6-4 Fertilizing for Irrigated Corn / Blaylock
Determining Micronutrient Needs The following conditions deserve consideration when determining the need for micronutrients. Knowledge about corn needs for specific micronutrients is a starting point. Soil testing has its limitations, but can be helpful as it provides the best measure of soil nutrient reserves and allows corrective ac-tion for an anticipated shortage before the crop is planted. Crop history and field scouting records help to pinpoint previous problem areas and gain some insight as to how the corn crop responded to treatments. Plant analysis provides a good evaluation of the micronutrient status of a plant when soil tests and field scouting are not conclusive. For best results, soil and plant analysis should be used together to detect shortages and to develop effective micronutrient management programs.
TimingandMethodsofApplication Decisions relat-ing to the application of a micronutrient are often depen-dent upon site-specific conditions and the stage of plant development at the time of problem detection. Soil and crop conditions as well as equipment availability should also be considered.
Broadcast applications are often most convenient, require higher rates for response and sometimes, such as with Fe on alkaline soils, are rendered practically ineffective by the soil conditions which originally created the need for treatment. Soils that are low in a particular nutrient may benefit from broadcast applications at higher rates to build available nutrient levels. Broadcast applications of B are usually more effective than for other nutrients because it is mobile in the soils and moves more easily to plant roots.
Band placement concentrates the source, which minimiz-es soil tie-up and improves root absorption. Band place-ment is usually superior on alkaline soils because of the propensity for most micronutrients to be tied up. The mi-cronutrient metals, Cu, Fe, Mn, and Zn, are immobile in alkaline soils and are supplied to plant roots primarily by diffusion. Band placement near the plant can significantly improve nutrient availability. Band applications frequently produce the desired response at one-fourth to one-half the rate needed with a broadcast application. In a band appli-cation, soil pH can sometimes be manipulated within the band to improve micronutrient availability. Several studies have documented better performance of micronutrients ap-plied in a band with other acid or acid-forming fertilizers (Miner et al, �986; Petrie and Jackson, �984a; Petrie and Jackson, �984b). Band applications of B should be consid-ered carefully because of the possibilities for toxicity when relatively small amounts are concentrated in a band.
Foliar sprays have a limited application rate, and some risk of foliar injury, but do allow for the use of a minimum of product and rapid absorption and correction of deficien-
cies. Foliar applications should be made as soon as the deficiency is observed. By the time visual symptoms are observed, some yield potential may have been lost. Rescue foliar applications are less effective because they are often made after deficiencies are observed and yield potential has been lost. For some situations, foliar applications may be the best method of correcting micronutrient deficiency. For example, Fe and Mn deficiencies on alkaline soils are difficult to correct with soil applications, but can be readily corrected with timely foliar treatments. Only small amounts of product are needed, but repeated applications may be necessary to maintain proper nutrient supply. Foliar ap-plications should be made in consideration of plant nu-trient demand and soil supplying capacity. Foliar feeding strategies should be accompanied by regular field scouting and knowledge of the soil, environment, and production system. Plant tissue analysis can be useful in diagnosing nutrient status before symptoms appear.
Seed coating fits best with Mo applied with the inocula-tion for legume crops. Seed coatings have been used with some success with some other micronutrients, but it may be difficult to supply sufficient amounts of some nutrients to provide the entire crop need.
Understanding Crop Response to Micronutrients There are many factors that affect crop response to micro-nutrients. Responses to micronutrients may be dramatic if the nutrient is deficient, but more often, responses are in-cremental yield increases or even only maturity or quality improvements. Micronutrient chemistry in the soil can be complex with numerous interactions with other nutrients and environmental conditions. One important key to mi-cronutrient response is the management level of the pro-ducer. Producers who do not manage yields at a high level are usually limited by other factors that must be corrected before micronutrient response will be observed. Micronu-trient need is more accurately predicted if considered in the context of a variety of other factors.
Soil-TestLevels Micronutrient need is evaluated first by soil testing. Appropriate soil testing provides an indicator of the probability of crop response to a given nutrient. A high soil test means the probability of crop response is low; a low soil test indicates high probability of crop response. Because of the complexity of micronutrient interactions with other production factors, the predictability of micro-nutrient response is often somewhat less than for other nu-trients. Responses to micronutrients can be observed when soil test levels are adequate. Conversely, a low soil test does not guarantee crop response when other factors are limiting. Nevertheless, soil test information should not be ignored; it should always be part of the information consid-ered in developing nutrient management plans.
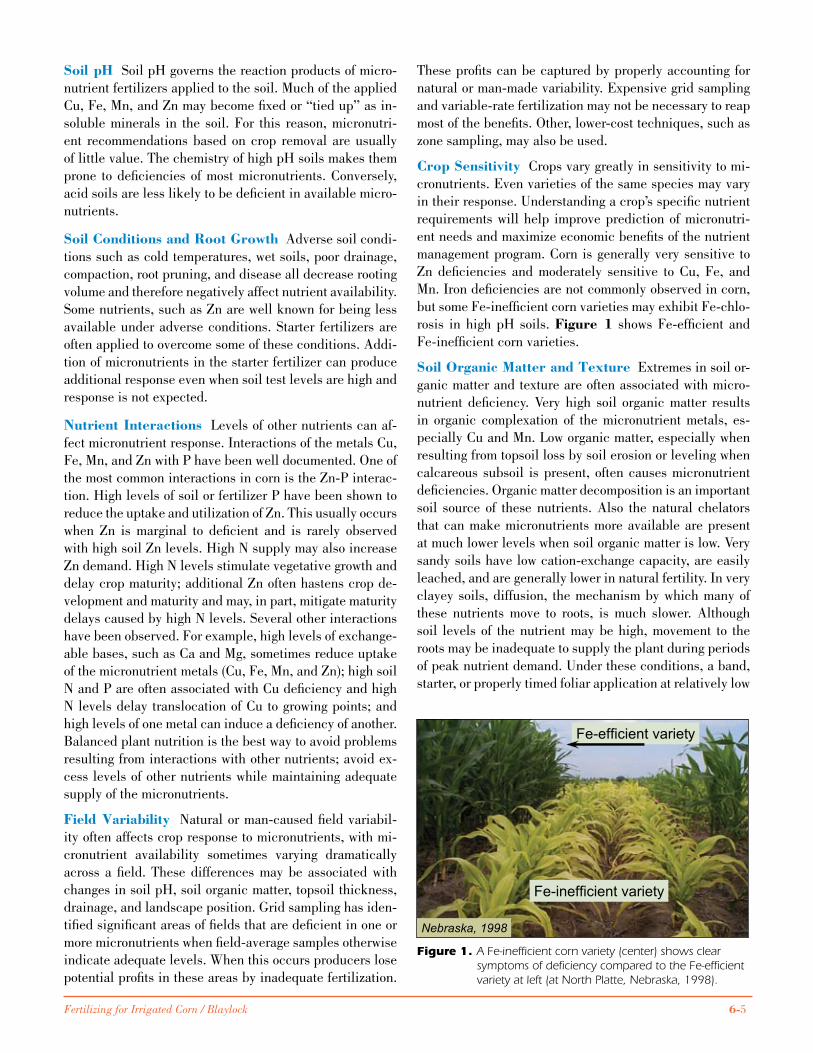
Fertilizing for Irrigated Corn / Blaylock 6-5
SoilpH Soil pH governs the reaction products of micro-nutrient fertilizers applied to the soil. Much of the applied Cu, Fe, Mn, and Zn may become fixed or “tied up” as in-soluble minerals in the soil. For this reason, micronutri-ent recommendations based on crop removal are usually of little value. The chemistry of high pH soils makes them prone to deficiencies of most micronutrients. Conversely, acid soils are less likely to be deficient in available micro-nutrients.
SoilConditionsandRootGrowth Adverse soil condi-tions such as cold temperatures, wet soils, poor drainage, compaction, root pruning, and disease all decrease rooting volume and therefore negatively affect nutrient availability. Some nutrients, such as Zn are well known for being less available under adverse conditions. Starter fertilizers are often applied to overcome some of these conditions. Addi-tion of micronutrients in the starter fertilizer can produce additional response even when soil test levels are high and response is not expected.
NutrientInteractions Levels of other nutrients can af-fect micronutrient response. Interactions of the metals Cu, Fe, Mn, and Zn with P have been well documented. One of the most common interactions in corn is the Zn-P interac-tion. High levels of soil or fertilizer P have been shown to reduce the uptake and utilization of Zn. This usually occurs when Zn is marginal to deficient and is rarely observed with high soil Zn levels. High N supply may also increase Zn demand. High N levels stimulate vegetative growth and delay crop maturity; additional Zn often hastens crop de-velopment and maturity and may, in part, mitigate maturity delays caused by high N levels. Several other interactions have been observed. For example, high levels of exchange-able bases, such as Ca and Mg, sometimes reduce uptake of the micronutrient metals (Cu, Fe, Mn, and Zn); high soil N and P are often associated with Cu deficiency and high N levels delay translocation of Cu to growing points; and high levels of one metal can induce a deficiency of another. Balanced plant nutrition is the best way to avoid problems resulting from interactions with other nutrients; avoid ex-cess levels of other nutrients while maintaining adequate supply of the micronutrients.
FieldVariability Natural or man-caused field variabil-ity often affects crop response to micronutrients, with mi-cronutrient availability sometimes varying dramatically across a field. These differences may be associated with changes in soil pH, soil organic matter, topsoil thickness, drainage, and landscape position. Grid sampling has iden-tified significant areas of fields that are deficient in one or more micronutrients when field-average samples otherwise indicate adequate levels. When this occurs producers lose potential profits in these areas by inadequate fertilization.
These profits can be captured by properly accounting for natural or man-made variability. Expensive grid sampling and variable-rate fertilization may not be necessary to reap most of the benefits. Other, lower-cost techniques, such as zone sampling, may also be used.
CropSensitivity Crops vary greatly in sensitivity to mi-cronutrients. Even varieties of the same species may vary in their response. Understanding a crop’s specific nutrient requirements will help improve prediction of micronutri-ent needs and maximize economic benefits of the nutrient management program. Corn is generally very sensitive to Zn deficiencies and moderately sensitive to Cu, Fe, and Mn. Iron deficiencies are not commonly observed in corn, but some Fe-inefficient corn varieties may exhibit Fe-chlo-rosis in high pH soils. Figure1 shows Fe-efficient and Fe-inefficient corn varieties.
SoilOrganicMatterandTexture Extremes in soil or-ganic matter and texture are often associated with micro-nutrient deficiency. Very high soil organic matter results in organic complexation of the micronutrient metals, es-pecially Cu and Mn. Low organic matter, especially when resulting from topsoil loss by soil erosion or leveling when calcareous subsoil is present, often causes micronutrient deficiencies. Organic matter decomposition is an important soil source of these nutrients. Also the natural chelators that can make micronutrients more available are present at much lower levels when soil organic matter is low. Very sandy soils have low cation-exchange capacity, are easily leached, and are generally lower in natural fertility. In very clayey soils, diffusion, the mechanism by which many of these nutrients move to roots, is much slower. Although soil levels of the nutrient may be high, movement to the roots may be inadequate to supply the plant during periods of peak nutrient demand. Under these conditions, a band, starter, or properly timed foliar application at relatively low
Figure 1. A Fe-inefficient corn variety (center) shows clear symptoms of deficiency compared to the Fe-efficient variety at left (at North Platte, Nebraska, 1998).
Fe-efficient variety
Fe-inefficient variety
Nebraska, 1998

6-6 Fertilizing for Irrigated Corn / Blaylock
rates would often be beneficial to provide sufficient nutri-ent to get the crop through a period of peak demand.
Optimizing Results of Micronutrient Fertilization Confident diagnosis of micronutrient needs requires more than a scan of laboratory results from a 0 to 6 in. soil sample. Success increases dramatically when considering overall fertility management, management level of the pro-ducer, soil type and conditions, crop sensitivity, and past observations of crop response, quality, or deficiency symp-toms. Quality of recommendations and the probability of economic return are improved if this additional informa-tion is used in considering the need for micronutrients.
Author information: Dr. Blaylock is Senior Agronomist with Agrium Inc., located in Denver, Colorado; e-mail: ablayloc@ agrium .com .
ReferencesAmrani, M., D.G. Westfall, and G.A. Peterson. 1997. Zinc plant availability
as influenced by zinc fertilizer sources and zinc water solubility. Agric. Exp. Sta. Tech. Bull. TB97-4, Colorado State Univ. Dept. of Soil and Crop Sci. Ft. Collins, CO.
Mascagni, H.J.,Jr. and F.R.Cox. 1985. Evaluation of inorganic and organic manganese fertilizers sources. Soil Sci. Soc. Am. J. 49:458-461.
Miner, G.S., S. Traore, and M.R. Tucker. 1986. Corn response to starter fertilizer acidity and manganese materials varying in water solubility. Agron. J. 78:291-295.
Mortvedt, J.J. 1992. Crop response to level of water-soluble zinc of granular zinc fertilizers. Fertilizer Research 33:249-255.
Petrie, S.E. and T.L. Jackson. 1984a. Effects of nitrogen fertilization on manganese concentration and yield of barley and oats. Soil Sci. Soc. Am. J. 48:319-322.
Petrie, S.E. and T.L. Jackson. 1984b. Effects of fertilization on soil solution pH and manganese concentration. Soil Sci. Soc. Am. J. 48:315-318.
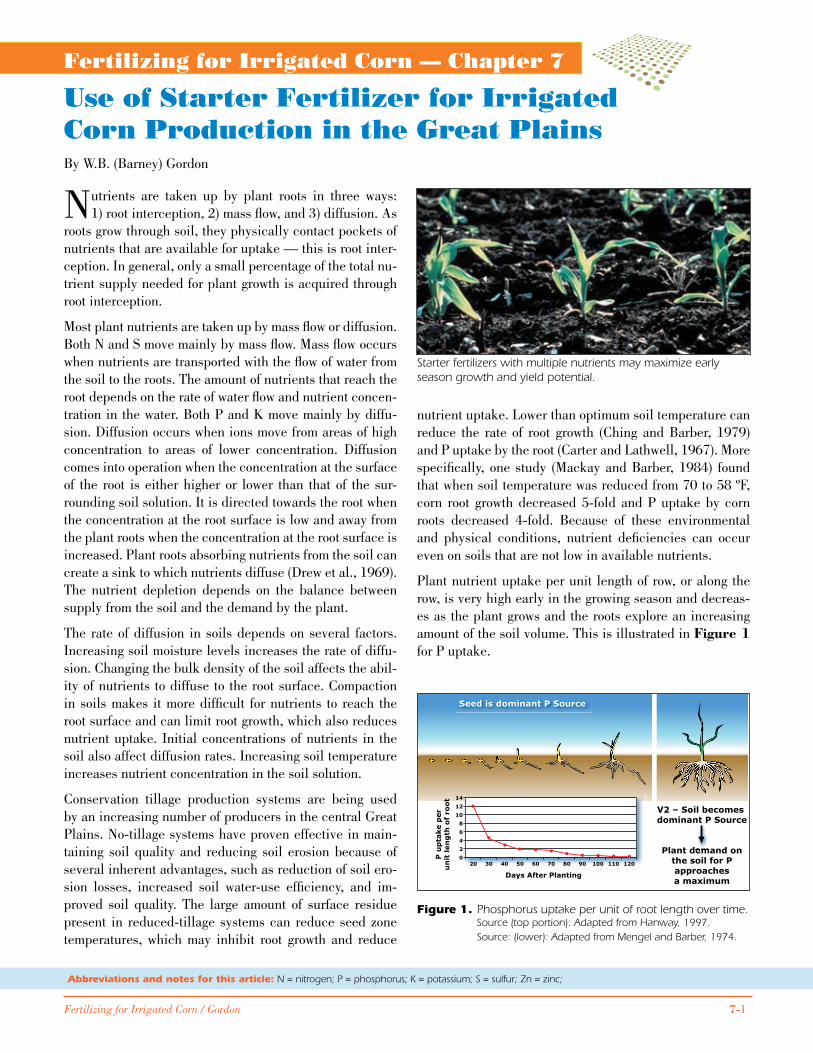
Fertilizing for Irrigated Corn / Gordon 7-�
Abbreviations and notes for this article: N = nitrogen; P = phosphorus; K = potassium; S = sulfur; Zn = zinc;
Fertilizing for Irrigated Corn — Chapter 7
Use of Starter Fertilizer for Irrigated Corn Production in the Great PlainsBy W.B. (Barney) Gordon
Nutrients are taken up by plant roots in three ways: �) root interception, 2) mass flow, and 3) diffusion. As
roots grow through soil, they physically contact pockets of nutrients that are available for uptake — this is root inter-ception. In general, only a small percentage of the total nu-trient supply needed for plant growth is acquired through root interception.
Most plant nutrients are taken up by mass flow or diffusion. Both N and S move mainly by mass flow. Mass flow occurs when nutrients are transported with the flow of water from the soil to the roots. The amount of nutrients that reach the root depends on the rate of water flow and nutrient concen-tration in the water. Both P and K move mainly by diffu-sion. Diffusion occurs when ions move from areas of high concentration to areas of lower concentration. Diffusion comes into operation when the concentration at the surface of the root is either higher or lower than that of the sur-rounding soil solution. It is directed towards the root when the concentration at the root surface is low and away from the plant roots when the concentration at the root surface is increased. Plant roots absorbing nutrients from the soil can create a sink to which nutrients diffuse (Drew et al., �969). The nutrient depletion depends on the balance between supply from the soil and the demand by the plant.
The rate of diffusion in soils depends on several factors. Increasing soil moisture levels increases the rate of diffu-sion. Changing the bulk density of the soil affects the abil-ity of nutrients to diffuse to the root surface. Compaction in soils makes it more difficult for nutrients to reach the root surface and can limit root growth, which also reduces nutrient uptake. Initial concentrations of nutrients in the soil also affect diffusion rates. Increasing soil temperature increases nutrient concentration in the soil solution.
Conservation tillage production systems are being used by an increasing number of producers in the central Great Plains. No-tillage systems have proven effective in main-taining soil quality and reducing soil erosion because of several inherent advantages, such as reduction of soil ero-sion losses, increased soil water-use efficiency, and im-proved soil quality. The large amount of surface residue present in reduced-tillage systems can reduce seed zone temperatures, which may inhibit root growth and reduce
nutrient uptake. Lower than optimum soil temperature can reduce the rate of root growth (Ching and Barber, �979) and P uptake by the root (Carter and Lathwell, �967). More specifically, one study (Mackay and Barber, �984) found that when soil temperature was reduced from 70 to 58 ºF, corn root growth decreased 5-fold and P uptake by corn roots decreased 4-fold. Because of these environmental and physical conditions, nutrient deficiencies can occur even on soils that are not low in available nutrients.
Plant nutrient uptake per unit length of row, or along the row, is very high early in the growing season and decreas-es as the plant grows and the roots explore an increasing amount of the soil volume. This is illustrated in Figure1 for P uptake.
Figure 1. Phosphorus uptake per unit of root length over time. Source (top portion): Adapted from Hanway, 1997. Source: (lower): Adapted from Mengel and Barber, 1974.
Starter fertilizers with multiple nutrients may maximize early season growth and yield potential.

7-2 Fertilizing for Irrigated Corn / Gordon
The seed itself is the source of P during germination. At the 2-leaf stage, the soil becomes the dominant P source. Root systems are very small at this time and growth may be inhibited by unfavorable environmental conditions. The practice of placing small amounts of nutrients close to or with the seed at planting has proven effective in enhancing early season plant nutrient uptake and yield of corn.
StarterPlacementandBandingMethodsVarious placement methods have been adapted to provide options for starter fertilizer application. Some of the com-mon starter placements include: in-furrow in contact with the seed; banded near the seed either on the surface or more traditionally 2 in. to the side and 2 in. below the seed (2x2); or applied in a band over the seed row.
In-furrow placement of fertilizer, commonly referred to as pop-up fertilizer, is intended to promote vigorous seed-ling growth due to a supply of available nutrients to young plant root systems. Placement of fertilizer in contact with seed increases the salt concentration surrounding the seed. With an increase in salt concentration, the plant’s capac-ity to absorb water is greatly reduced and this may cause germination and growth problems. In-furrow placement of urea-containing starters can result in ammonia toxicity. The rapid hydrolysis of urea can result in the production of very high concentrations of ammonia that can result in plant stand loss. Many producers favor in-furrow application be-cause of the low initial cost of planter-mounted equipment and problems associated with knife and coulter systems in high-residue environments. However, care should be tak-en with in-furrow fertilization. Table1 shows guidelines
(Mengel, 2008) from Kansas State University for placing fertilizer with corn seed.
Subsurface 2x2 band applications have generally been proven to be a safe, effective way of applying nutrients as a starter. The fertilizer is separated from the seed so larger amounts of nutrients can be applied without risking seed-ling injury. Surface dribble or band application of starter fertilizer has not been extensively investigated and com-pared to sub-surface applications.
There is debate on which elements should be included in starter fertilizers and in what ratios. Some studies that have evaluated crop response to N and P starter fertilizers have demonstrated improved early growth and yield increase and attributed those responses to the P component of the combination (Farber and Fixen, �986). Other studies have indicated that N is the most critical nutrient (Touchton, �988.). Other elements such as S (Niehues et. al, 2004) and Zn (Gordon and Pierzynski, 2006) can be important contributors to response of corn to starter fertilizers.
StarterResearchPlacementandComposition—NorthCentralKansas Irrigated, reduced-tillage experiments were conducted at the North Central Kansas Experiment Field to compare methods of application and composition of starter fertilizer. Soil test P values were in the upper-part of the medium range and soil test K was in the high range. Soil organic matter was 2.5% and pH was 7.0.
The study consisted of four methods of starter fertilizer ap-plication: in-furrow with the seed; 2x2 at planting; drib-bled in a narrow band on the soil surface 2 in. to the side of the row at planting; and placed on the soil surface in an 8 in. band centered on the row. Starter fertilizer consisted of combinations that included either 5, �5, 30, 45, or 60 lb N/A with �5 lb P
2O
5/A and 5 lb K
2O/A. Nitrogen as 28%
UAN was balanced so that all plots received 220 lb N/A regardless of starter treatment. Starter fertilizer combina-tions were made using liquid �0-34-0, 28% UAN, and mu-riate of potash (KCl).
When starter fertilizer containing 5 lb N and 5 lb K2O/A
was applied in-furrow with the seed, plant population was reduced by over 6,000 plants/A (Figure2). As N rate in-creased, plant population continued to decrease. When av-eraged over starter fertilizer rate, corn yield was 36 bu/A lower when starter fertilizer was applied in-furrow with the seed than when applied 2x2 (Table2). This illustrates the importance of caution with in-furrow applications.
Dribble application of starter fertilizer in a narrow surface band to the side of the row was statistically equal to starter that was placed below the soil surface in the traditional
Table 1. Suggested maximum amounts of fertilizer to place in direct seed contact with corn and wheat.
Row spacing, Medium-fine textured soils Sandy or dry soils
in. - - - - - - Pounds of N + K2O/A1 - - - - - -
40 6 4
30 8 6
20 12 8
15 16 11
12 20 14
10 24 17
6-8 30 211No urea-containing fertilizer (e.g. urea, UAN solution) should be placed in direct seed contact. The hydrolysis of urea to ammonia can result in ammonia toxicity to seedlings.
1Reduce rates 25 to 30% for grain sorghum.1We suggest no seed placed fertilizer for soybeans, sunflowers, field beans, or sugarbeets.
Source: Mengel, 2008.

Fertilizing for Irrigated Corn / Gordon 7-3
managed with reduced tillage practices, even though soil test levels were not low. Results of a 2-year experiment at Scandia, Kansas, on a soil that tested high in available K, indicate that the addition of a small amount of K to the starter fertilizer mix can greatly improve K uptake, early season growth, and yield of irrigated corn (Table4).
This experiment also points out another great advantage of the use of starter fertilizer. The number of days from emergence to mid-silk was reduced from 79 with the no starter check to 68 with the N-P-K starter. Heat stress can be a problem with corn production in the Great Plains, even when grown under irrigation. Shortening the period of time from emergence to the critical reproductive stage of growth can ensure that pollination occurs earlier in the growing season when temperatures are likely to be cooler, thus avoiding the hot temperatures of mid-summer.
EffectofZinc—NorthCentralKansas Deficiencies of Zn can occur in areas where topsoil was removed by
Figure 2. Effect of starter placement and composition on plant population, 3-year average. Source: Gordon, unpublished data, 2008.
20,000
22,000
24,000
26,000
28,000
30,000
32,000
34,000
In-Furrow 2X2 Dribble Row Band
5-15-515-15-530-15-545-15-560-15-5
Plan
ts/A
Table 2. Starter effects on corn yield (bu/A), 3-year average.
Starter In-furrow 2x2 Dribble Row Band
5-15-5 172 194 190 179
15-15-5 177 197 198 180
30-15-5 174 216 212 192
45-15-5 171 215 213 195
60-15-5 163 214 213 201
Average 171 207 205 189Source: Gordon, unpublished data, 2008.
Figure 3. Starter N-rate effects on V-6 stage whole plant P uptake, 3-year average. All starter fertilizer treatments also received 15 lb P
2O
5 and 5 lb K
2O/A.
Source: Gordon, unpublished data, 2008.
Table 3. Starter fertilizer effect on dryland corn early season growth and yield, 3-year average.
Treatment, N-P-K-S, V-6 stage whole plant dry weight, Grain yield,
lb/A lb/A bu/A0-0-0-0 199 7930-30-10-0 315 9730-30-10-10 428 111Source: Niehues, et. al., 2004.
Table 4. Starter fertilizer effects on irrigated corn, 2-year aver-age.
Treatment N-P
2O
5-K
2O,
V6 dry wt V6 K
uptakeDays to mid- silk
Grain yield
lb/A - - - - - lb/A - - - - - bu/A0-0-0-0 210 6.2 79 16230-30-0 395 11.2 71 18430-30-5 460 15.2 68 195
Source: Gordon, unpublished data, 2008.
2x2 band. A surface band is much easier and much less costly for producers to apply than the 2x2 band and, based on this evidence, may be a reasonable alternative to 2x2 placement.
The 8 in. band over-the-row treatment resulted in yields that were greater than the in-furrow treatment, but less than the 2x2 or surface dribble treatments. The fertilizer band was just too diffuse to receive the full benefit of a starter fertilizer application.
Regardless of whether the starter fertilizer was placed 2x2 or dribbled on the soil surface, yields increased with increasing starter N rate up to the 30 lb/A rate. Plant P content also increased with increasing N up to the 30 lb N/A rate (Figure3). These observations provide further evidence of NxP interactions in the band, and that there is some benefit to including N in a starter.
EffectofS—Manhattan,Kansas Research at Man-hattan, Kansas, found that the addition of S to the starter fertilizer mix increased early season growth and yield of dryland corn (Table3). The starter fertilizer was applied 2x2 and N was balanced on all plots to bring the total amount applied to �60 lb/A.
EffectofK—NorthCentralKansas There have been increasing numbers of reports of K deficiency on soils
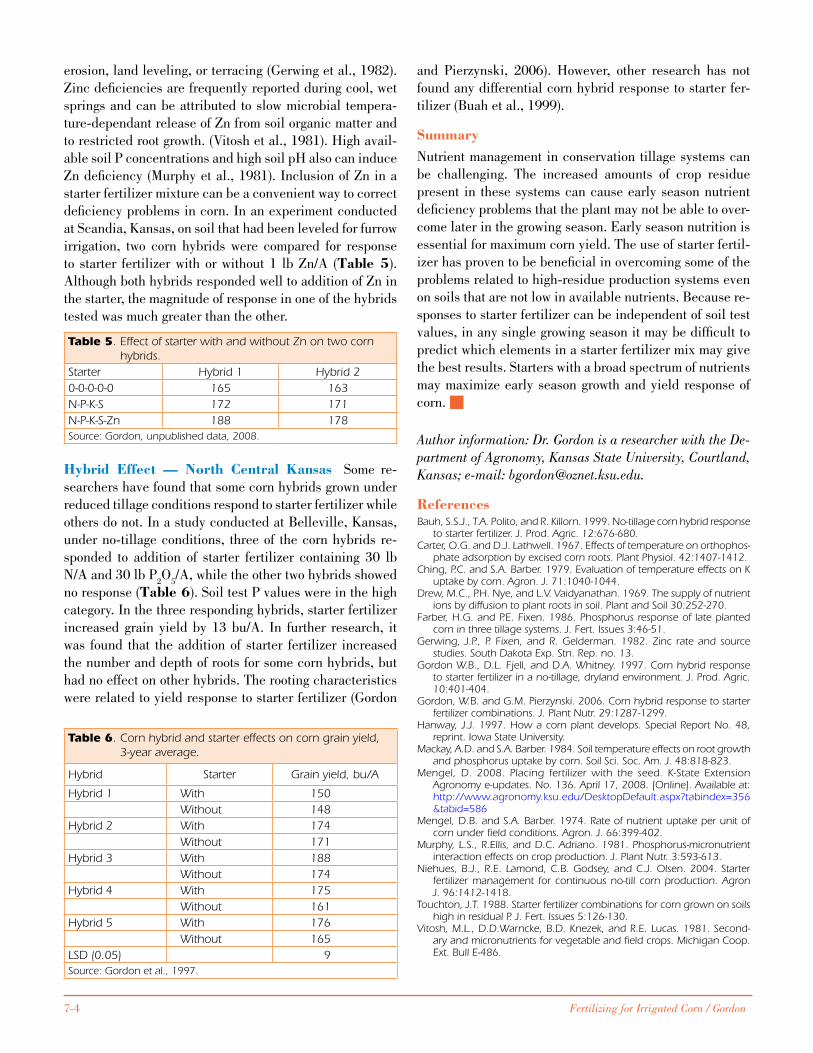
7-4 Fertilizing for Irrigated Corn / Gordon
erosion, land leveling, or terracing (Gerwing et al., �982). Zinc deficiencies are frequently reported during cool, wet springs and can be attributed to slow microbial tempera-ture-dependant release of Zn from soil organic matter and to restricted root growth. (Vitosh et al., �98�). High avail-able soil P concentrations and high soil pH also can induce Zn deficiency (Murphy et al., �98�). Inclusion of Zn in a starter fertilizer mixture can be a convenient way to correct deficiency problems in corn. In an experiment conducted at Scandia, Kansas, on soil that had been leveled for furrow irrigation, two corn hybrids were compared for response to starter fertilizer with or without � lb Zn/A (Table5). Although both hybrids responded well to addition of Zn in the starter, the magnitude of response in one of the hybrids tested was much greater than the other.
and Pierzynski, 2006). However, other research has not found any differential corn hybrid response to starter fer-tilizer (Buah et al., �999).
SummaryNutrient management in conservation tillage systems can be challenging. The increased amounts of crop residue present in these systems can cause early season nutrient deficiency problems that the plant may not be able to over-come later in the growing season. Early season nutrition is essential for maximum corn yield. The use of starter fertil-izer has proven to be beneficial in overcoming some of the problems related to high-residue production systems even on soils that are not low in available nutrients. Because re-sponses to starter fertilizer can be independent of soil test values, in any single growing season it may be difficult to predict which elements in a starter fertilizer mix may give the best results. Starters with a broad spectrum of nutrients may maximize early season growth and yield response of corn.
Author information: Dr. Gordon is a researcher with the De-partment of Agronomy, Kansas State University, Courtland, Kansas; e-mail: [email protected].
ReferencesBauh, S.S.J., T.A. Polito, and R. Killorn. 1999. No-tillage corn hybrid response
to starter fertilizer. J. Prod. Agric. 12:676-680.Carter, O.G. and D.J. Lathwell. 1967. Effects of temperature on orthophos-
phate adsorption by excised corn roots. Plant Physiol. 42:1407-1412.Ching, P.C. and S.A. Barber. 1979. Evaluation of temperature effects on K
uptake by corn. Agron. J. 71:1040-1044.Drew, M.C., P.H. Nye, and L.V. Vaidyanathan. 1969. The supply of nutrient
ions by diffusion to plant roots in soil. Plant and Soil 30:252-270.Farber, H.G. and P.E. Fixen. 1986. Phosphorus response of late planted
corn in three tillage systems. J. Fert. Issues 3:46-51.Gerwing, J.P., P. Fixen, and R. Gelderman. 1982. Zinc rate and source
studies. South Dakota Exp. Stn. Rep. no. 13.Gordon W.B., D.L. Fjell, and D.A. Whitney. 1997. Corn hybrid response
to starter fertilizer in a no-tillage, dryland environment. J. Prod. Agric. 10:401-404.
Gordon, W.B. and G.M. Pierzynski. 2006. Corn hybrid response to starter fertilizer combinations. J. Plant Nutr. 29:1287-1299.
Hanway, J.J. 1997. How a corn plant develops. Special Report No. 48, reprint. Iowa State University.
Mackay, A.D. and S.A. Barber. 1984. Soil temperature effects on root growth and phosphorus uptake by corn. Soil Sci. Soc. Am. J. 48:818-823.
Mengel, D. 2008. Placing fertilizer with the seed. K-State Extension Agronomy e-updates. No. 136. April 17, 2008. [Online]. Available at: http://www.agronomy.ksu.edu/DesktopDefault.aspx?tabindex=356&tabid=586
Mengel, D.B. and S.A. Barber. 1974. Rate of nutrient uptake per unit of corn under field conditions. Agron. J. 66:399-402.
Murphy, L.S., R.Ellis, and D.C. Adriano. 1981. Phosphorus-micronutrient interaction effects on crop production. J. Plant Nutr. 3:593-613.
Niehues, B.J., R.E. Lamond, C.B. Godsey, and C.J. Olsen. 2004. Starter fertilizer management for continuous no-till corn production. Agron J. 96:1412-1418.
Touchton, J.T. 1988. Starter fertilizer combinations for corn grown on soils high in residual P. J. Fert. Issues 5:126-130.
Vitosh, M.L., D.D.Warncke, B.D. Knezek, and R.E. Lucas. 1981. Second-ary and micronutrients for vegetable and field crops. Michigan Coop. Ext. Bull E-486.
Table 5. Effect of starter with and without Zn on two corn hybrids.
Starter Hybrid 1 Hybrid 20-0-0-0-0 165 163N-P-K-S 172 171N-P-K-S-Zn 188 178Source: Gordon, unpublished data, 2008.
Table 6. Corn hybrid and starter effects on corn grain yield, 3-year average.
Hybrid Starter Grain yield, bu/A
Hybrid 1 With 150Without 148
Hybrid 2 With 174Without 171
Hybrid 3 With 188Without 174
Hybrid 4 With 175Without 161
Hybrid 5 With 176Without 165
LSD (0.05) 9Source: Gordon et al., 1997.
Hybrid Effect — North Central Kansas Some re-searchers have found that some corn hybrids grown under reduced tillage conditions respond to starter fertilizer while others do not. In a study conducted at Belleville, Kansas, under no-tillage conditions, three of the corn hybrids re-sponded to addition of starter fertilizer containing 30 lb N/A and 30 lb P
2O
5/A, while the other two hybrids showed
no response (Table6). Soil test P values were in the high category. In the three responding hybrids, starter fertilizer increased grain yield by �3 bu/A. In further research, it was found that the addition of starter fertilizer increased the number and depth of roots for some corn hybrids, but had no effect on other hybrids. The rooting characteristics were related to yield response to starter fertilizer (Gordon
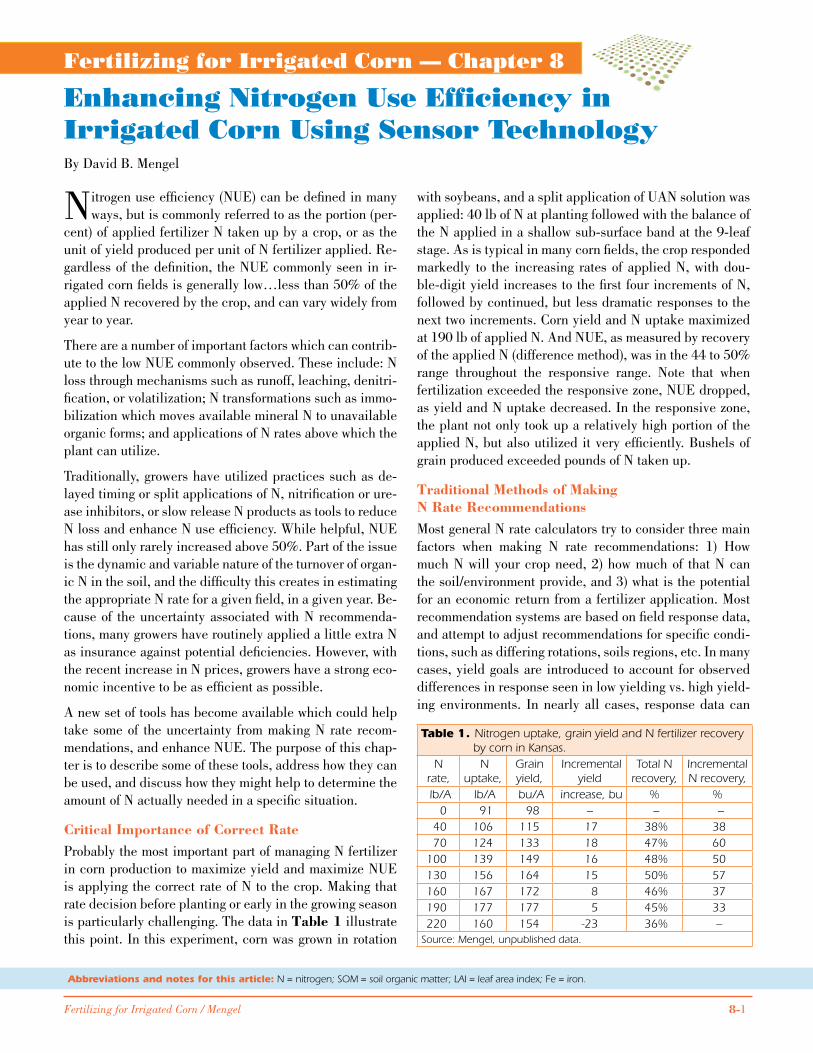
Fertilizing for Irrigated Corn / Mengel 8-�
Abbreviations and notes for this article: N = nitrogen; SOM = soil organic matter; LAI = leaf area index; Fe = iron.
Fertilizing for Irrigated Corn — Chapter 8
Enhancing Nitrogen Use Efficiency in Irrigated Corn Using Sensor TechnologyBy David B. Mengel
Nitrogen use efficiency (NUE) can be defined in many ways, but is commonly referred to as the portion (per-
cent) of applied fertilizer N taken up by a crop, or as the unit of yield produced per unit of N fertilizer applied. Re-gardless of the definition, the NUE commonly seen in ir-rigated corn fields is generally low…less than 50% of the applied N recovered by the crop, and can vary widely from year to year.
There are a number of important factors which can contrib-ute to the low NUE commonly observed. These include: N loss through mechanisms such as runoff, leaching, denitri-fication, or volatilization; N transformations such as immo-bilization which moves available mineral N to unavailable organic forms; and applications of N rates above which the plant can utilize.
Traditionally, growers have utilized practices such as de-layed timing or split applications of N, nitrification or ure-ase inhibitors, or slow release N products as tools to reduce N loss and enhance N use efficiency. While helpful, NUE has still only rarely increased above 50%. Part of the issue is the dynamic and variable nature of the turnover of organ-ic N in the soil, and the difficulty this creates in estimating the appropriate N rate for a given field, in a given year. Be-cause of the uncertainty associated with N recommenda-tions, many growers have routinely applied a little extra N as insurance against potential deficiencies. However, with the recent increase in N prices, growers have a strong eco-nomic incentive to be as efficient as possible.
A new set of tools has become available which could help take some of the uncertainty from making N rate recom-mendations, and enhance NUE. The purpose of this chap-ter is to describe some of these tools, address how they can be used, and discuss how they might help to determine the amount of N actually needed in a specific situation.
CriticalImportanceofCorrectRateProbably the most important part of managing N fertilizer in corn production to maximize yield and maximize NUE is applying the correct rate of N to the crop. Making that rate decision before planting or early in the growing season is particularly challenging. The data in Table1 illustrate this point. In this experiment, corn was grown in rotation
with soybeans, and a split application of UAN solution was applied: 40 lb of N at planting followed with the balance of the N applied in a shallow sub-surface band at the 9-leaf stage. As is typical in many corn fields, the crop responded markedly to the increasing rates of applied N, with dou-ble-digit yield increases to the first four increments of N, followed by continued, but less dramatic responses to the next two increments. Corn yield and N uptake maximized at �90 lb of applied N. And NUE, as measured by recovery of the applied N (difference method), was in the 44 to 50% range throughout the responsive range. Note that when fertilization exceeded the responsive zone, NUE dropped, as yield and N uptake decreased. In the responsive zone, the plant not only took up a relatively high portion of the applied N, but also utilized it very efficiently. Bushels of grain produced exceeded pounds of N taken up.
TraditionalMethodsofMakingNRateRecommendationsMost general N rate calculators try to consider three main factors when making N rate recommendations: �) How much N will your crop need, 2) how much of that N can the soil/environment provide, and 3) what is the potential for an economic return from a fertilizer application. Most recommendation systems are based on field response data, and attempt to adjust recommendations for specific condi-tions, such as differing rotations, soils regions, etc. In many cases, yield goals are introduced to account for observed differences in response seen in low yielding vs. high yield-ing environments. In nearly all cases, response data can
Table 1. Nitrogen uptake, grain yield and N fertilizer recovery by corn in Kansas.
N rate,
N uptake,
Grain yield,
Incremental yield
Total N recovery,
Incremental N recovery,
lb/A lb/A bu/A increase, bu % % 0 91 98 – – –
40 106 115 17 38% 38 70 124 133 18 47% 60
100 139 149 16 48% 50130 156 164 15 50% 57160 167 172 8 46% 37190 177 177 5 45% 33220 160 154 -23 36% –
Source: Mengel, unpublished data.
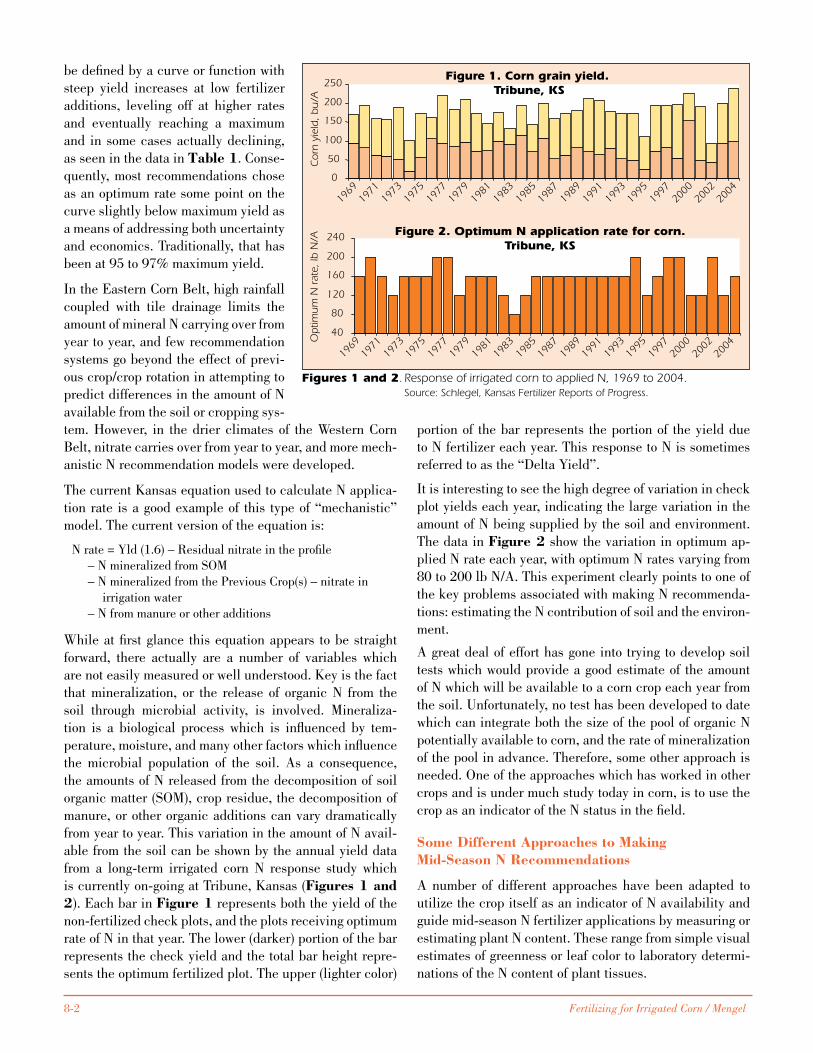
8-2 Fertilizing for Irrigated Corn / Mengel
be defined by a curve or function with steep yield increases at low fertilizer additions, leveling off at higher rates and eventually reaching a maximum and in some cases actually declining, as seen in the data in Table1. Conse-quently, most recommendations chose as an optimum rate some point on the curve slightly below maximum yield as a means of addressing both uncertainty and economics. Traditionally, that has been at 95 to 97% maximum yield.
In the Eastern Corn Belt, high rainfall coupled with tile drainage limits the amount of mineral N carrying over from year to year, and few recommendation systems go beyond the effect of previ-ous crop/crop rotation in attempting to predict differences in the amount of N available from the soil or cropping sys-tem. However, in the drier climates of the Western Corn Belt, nitrate carries over from year to year, and more mech-anistic N recommendation models were developed.
The current Kansas equation used to calculate N applica-tion rate is a good example of this type of “mechanistic” model. The current version of the equation is:
N rate = Yld (�.6) – Residual nitrate in the profile – N mineralized from SOM – N mineralized from the Previous Crop(s) – nitrate in irrigation water – N from manure or other additions
While at first glance this equation appears to be straight forward, there actually are a number of variables which are not easily measured or well understood. Key is the fact that mineralization, or the release of organic N from the soil through microbial activity, is involved. Mineraliza-tion is a biological process which is influenced by tem-perature, moisture, and many other factors which influence the microbial population of the soil. As a consequence, the amounts of N released from the decomposition of soil organic matter (SOM), crop residue, the decomposition of manure, or other organic additions can vary dramatically from year to year. This variation in the amount of N avail-able from the soil can be shown by the annual yield data from a long-term irrigated corn N response study which is currently on-going at Tribune, Kansas (Figures1and2). Each bar in Figure1 represents both the yield of the non-fertilized check plots, and the plots receiving optimum rate of N in that year. The lower (darker) portion of the bar represents the check yield and the total bar height repre-sents the optimum fertilized plot. The upper (lighter color)
portion of the bar represents the portion of the yield due to N fertilizer each year. This response to N is sometimes referred to as the “Delta Yield”.
It is interesting to see the high degree of variation in check plot yields each year, indicating the large variation in the amount of N being supplied by the soil and environment. The data in Figure2 show the variation in optimum ap-plied N rate each year, with optimum N rates varying from 80 to 200 lb N/A. This experiment clearly points to one of the key problems associated with making N recommenda-tions: estimating the N contribution of soil and the environ-ment.
A great deal of effort has gone into trying to develop soil tests which would provide a good estimate of the amount of N which will be available to a corn crop each year from the soil. Unfortunately, no test has been developed to date which can integrate both the size of the pool of organic N potentially available to corn, and the rate of mineralization of the pool in advance. Therefore, some other approach is needed. One of the approaches which has worked in other crops and is under much study today in corn, is to use the crop as an indicator of the N status in the field.
SomeDifferentApproachestoMakingMid-SeasonNRecommendations
A number of different approaches have been adapted to utilize the crop itself as an indicator of N availability and guide mid-season N fertilizer applications by measuring or estimating plant N content. These range from simple visual estimates of greenness or leaf color to laboratory determi-nations of the N content of plant tissues.
Figure 1. Corn grain yield. Tribune, KS
0
50
100
150
200
250
1969
1971
1973
1975
1977
1979
1981
1983
1985
1987
1989
1991
1993
1995
1997
2000
2002
2004
Co
rn y
ield
, bu
/A
Figure 2. Optimum N application rate for corn.Tribune, KS
40
80
120
160
200
240
1969
1971
1973
1975
1977
1979
1981
1983
1985
1987
1989
1991
1993
1995
1997
2000
2002
2004
Op
timu
m N
rat
e, lb
N/A
Figures 1 and 2. Response of irrigated corn to applied N, 1969 to 2004. Source: Schlegel, Kansas Fertilizer Reports of Progress.
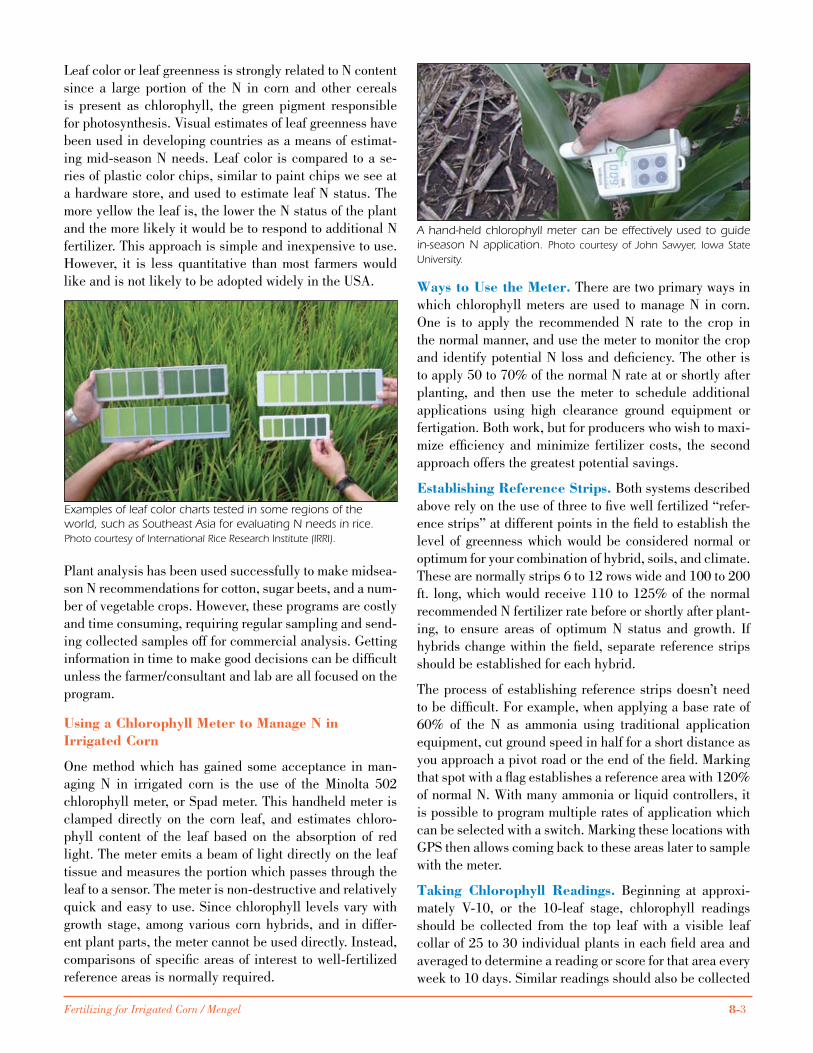
Fertilizing for Irrigated Corn / Mengel 8-3
Leaf color or leaf greenness is strongly related to N content since a large portion of the N in corn and other cereals is present as chlorophyll, the green pigment responsible for photosynthesis. Visual estimates of leaf greenness have been used in developing countries as a means of estimat-ing mid-season N needs. Leaf color is compared to a se-ries of plastic color chips, similar to paint chips we see at a hardware store, and used to estimate leaf N status. The more yellow the leaf is, the lower the N status of the plant and the more likely it would be to respond to additional N fertilizer. This approach is simple and inexpensive to use. However, it is less quantitative than most farmers would like and is not likely to be adopted widely in the USA. WaystoUsetheMeter. There are two primary ways in
which chlorophyll meters are used to manage N in corn. One is to apply the recommended N rate to the crop in the normal manner, and use the meter to monitor the crop and identify potential N loss and deficiency. The other is to apply 50 to 70% of the normal N rate at or shortly after planting, and then use the meter to schedule additional applications using high clearance ground equipment or fertigation. Both work, but for producers who wish to maxi-mize efficiency and minimize fertilizer costs, the second approach offers the greatest potential savings.
EstablishingReferenceStrips. Both systems described above rely on the use of three to five well fertilized “refer-ence strips” at different points in the field to establish the level of greenness which would be considered normal or optimum for your combination of hybrid, soils, and climate. These are normally strips 6 to �2 rows wide and �00 to 200 ft. long, which would receive ��0 to �25% of the normal recommended N fertilizer rate before or shortly after plant-ing, to ensure areas of optimum N status and growth. If hybrids change within the field, separate reference strips should be established for each hybrid.
The process of establishing reference strips doesn’t need to be difficult. For example, when applying a base rate of 60% of the N as ammonia using traditional application equipment, cut ground speed in half for a short distance as you approach a pivot road or the end of the field. Marking that spot with a flag establishes a reference area with �20% of normal N. With many ammonia or liquid controllers, it is possible to program multiple rates of application which can be selected with a switch. Marking these locations with GPS then allows coming back to these areas later to sample with the meter.
Taking Chlorophyll Readings. Beginning at approxi-mately V-�0, or the �0-leaf stage, chlorophyll readings should be collected from the top leaf with a visible leaf collar of 25 to 30 individual plants in each field area and averaged to determine a reading or score for that area every week to �0 days. Similar readings should also be collected
A hand-held chlorophyll meter can be effectively used to guide in-season N application. Photo courtesy of John Sawyer, Iowa State University.
Plant analysis has been used successfully to make midsea-son N recommendations for cotton, sugar beets, and a num-ber of vegetable crops. However, these programs are costly and time consuming, requiring regular sampling and send-ing collected samples off for commercial analysis. Getting information in time to make good decisions can be difficult unless the farmer/consultant and lab are all focused on the program.
UsingaChlorophyllMetertoManageNinIrrigatedCorn
One method which has gained some acceptance in man-aging N in irrigated corn is the use of the Minolta 502 chlorophyll meter, or Spad meter. This handheld meter is clamped directly on the corn leaf, and estimates chloro-phyll content of the leaf based on the absorption of red light. The meter emits a beam of light directly on the leaf tissue and measures the portion which passes through the leaf to a sensor. The meter is non-destructive and relatively quick and easy to use. Since chlorophyll levels vary with growth stage, among various corn hybrids, and in differ-ent plant parts, the meter cannot be used directly. Instead, comparisons of specific areas of interest to well-fertilized reference areas is normally required.
Examples of leaf color charts tested in some regions of the world, such as Southeast Asia for evaluating N needs in rice. Photo courtesy of International Rice Research Institute (IRRI).

8-4 Fertilizing for Irrigated Corn / Mengel
from adjacent references strips. Care should be taken to ensure the plants sampled represent the area. Plants near skips or doubles, or unusually large, small, or damaged plants should be avoided. The same relative leaf should be sampled on each plant if possible. The meter should always be positioned halfway between the leaf margin and the midrib and midway between leaf tip and leaf collar. Once tasseling occurs, sample the earleaf, or the leaves directly above or below the earleaf. Ideally, all N should be applied by or shortly after silking.
InterpretingChlorophyllMeterReadings. To use the chlorophyll meter readings to make N recommendations, a Sufficiency Index (SI) is calculated for N. The SI is calcu-lated as follows:
SI = average reading from the bulk area/average reading from the reference strip x �00
When the SI falls below 95%, or regular sampling indicates it is approaching 95%, an application of 20 to 40 lb of N should be made through fertigation, or by ground equip-ment followed by an irrigation of at least 0.5 in. of water, to ensure the N is moved into the soil and is available to the plant roots. Multiple applications may be required, de-pending on the amount of N applied early, N loss, and crop demand.
Producers should ideally have all N applied shortly after pollination. No N should be applied later than 20 days af-ter pollination.
UsingActiveSensorstoManageNRecently, active crop sensors such as the GreenSeeker and Crop Circle have become available as tools to manage N. Active sensors measure the amount of light projected on a target and reflected back to a sensor. Generally, active sen-sors use two or more bands of light in both the visible (VIS) and near infrared (NIR) regions of the spectrum. Each pulse of light emitted by the sensor results in a reading that is summed and output at a prescribed interval (�0 times per
second is common). The sensor circuitry is able to differ-entiate between the modulated portion of the reflectance from the sensor and natural light of the same wavelength that originated with sunlight. This unique feature of ac-tive sensors is why they can operate equally well under all lighting conditions.
The primary output from most active sensors is a form of Normalized Difference Vegetation Index (NDVI). NDVI is an index calculated using the reflectance of a visible (red or amber) line and the reflectance of a NIR line. The for-mula for calculating NDVI is as follows:
NDVI = (NIR-VIS)/(NIR+VIS)
where NIR and VIS refer to the reflectance value from the near infrared bands and visible bands.
NDVI is unitless and values range from -�.0 to +�.0. In typical sensing operations, output ranges from 0.� to 0.9. Soil generally has a NDVI of 0.� to 0.2, unless residue covered, in which case background NDVI can go as high as 0.4 (especially when using in a field that has a freshly killed cover crop). The NIR band is strongly reflected by living biomass. This characteristic makes it useful for esti-mating crop biomass, which at a given growth stage can be related to yield potential.
Data from the visible wavebands (e.g., red or amber) can be used to assess greenness and chlorophyll status. Specific visible wavelengths are absorbed by chlorophyll molecules in the leaf, and can be correlated to greenness and N sta-tus. Thus, active sensors can provide both an estimate of yield potential at the time of sensing and an estimate of greenness or N status, as compared to the chlorophyll me-ter which just provides an estimate of greenness.
WaystoUseActiveSensors Active sensors are avail-able in either handheld or applicator mounted versions. Thus, there are a number of ways active crop sensors can be used to monitor N status and make N recommendations for irrigated corn. Like the chlorophyll meter, active sen-sors can be used in a “quality control” mode to monitor N status of fully fertilized crop and guide any additional N applications which may be needed due to N loss or unex-pected high crop demand. But to take full advantage of the sensors capabilities, applying 50 to 70% of the anticipated N needs early and using the sensor to guide mid- to late-season applications should lead to the highest NUE and potential profits.
EstablishingReferenceStrips As with the chlorophyll meter, active sensors rely on the use of three to five well-fertilized “reference strips” at different points in the field to establish the level of greenness and biomass which would be considered normal or optimum for your combination of hybrid, soils, and climate.
Applying 50 to 70% of the anticipated N need early and using a sensor to guide late-season applications can lead to the highest NUE and potential profits.

Fertilizing for Irrigated Corn / Mengel 8-5
Unlike the chlorophyll meter, some active sensor rate cal-culations also utilize unfertilized check strips in addition.
Taking Sensor Readings A number of factors can in-fluence sensor readings. Water stress, dew, leaf structure, distance, and aspect of the target and canopy architecture all can impact reflectance. Reflectance patterns sometimes vary between cultivars, even under adequately fertilized conditions. For these reasons, great care should be tak-en when comparing sensor data between fields that have different cropping histories, growth stages, and cultivars. Normalizing data to a well-fertilized area within a field us-ing reference strips makes it possible to make comparisons between different soils within fields, different hybrids, etc. Maintaining a constant sensor height, normally 24 to 30 in. above the canopy, is also important.
Most currently available sensors will lose sensitivity or max out their readings in corn once a full, multiple layer leaf canopy develops. In high population irrigated corn, this begins to occur around the �2-leaf stage when the sen-sors are centered directly over the corn row. By moving the sensing unit over the row middles, the amount of biomass being seen by the sensor is reduced, and the period that the sensor can be used can be extended, in many cases un-til tasseling. Calculating other vegetative indices or simple ratios from the output can also help.
One potential problem observed is that the sensor does not differentiate well between Fe chlorosis or S deficiency and N deficiency. All result in a yellowing of tissue and stunt-ing. So care must be taken in interpreting sensor data to ensure that the differences in growth are due to N, and appropriate adjustments may be required in N recommen-dations.
InterpretingSensorReadings To make N recommenda-tions from an active sensor, an N Response Index (RI) is calculated. The RI is calculated as follows:
RI = average reading from reference strip/average reading from the bulk area in the field
When the RI is �.0 or below, no difference exists in bio-mass, growth, or greenness between the reference strip and the bulk field. No additional N would be called for. A RI > � would indicate less biomass and/or greenness in the bulk areas than the reference strips, and N maybe called for. Some of the factors that normally would be considered include growth stage of the crop at the reading date, yield potential, and the RI.
MakingNRecommendationsfromSensors Making N recommendations using active sensors can be fairly simple, or more complex, depending on how the farmer chooses to apply N and the management goals of the farm.
In irrigated corn where the farmer has the option to add N in multiple doses through fertigation, one can make appli-cations based on sensor readings just like with the chloro-phyll meter. For example, whenever the RI exceeds �.05, an additional 20 to 40 lb of N is added through the irriga-tion system, followed by subsequent monitoring in a week to �0 days to ensure utilization of the N by the crop and determining if additional N is required.
When single late side-dress applications are desired at ear-lier growth stages, the rate calculation is more complicated. It should consider growth stage of the crop, yield potential, growing conditions, and the current RI. Rate calculators are currently available on-line at the KSU Agronomy Soil Test-ing Lab website >www.agronomy.ksu.edu/soiltesting< and at the NUE website maintained by researchers at Oklahoma State University >www.nue.okstate.edu<.
ConclusionsSensor technology, using tools such as a chlorophyll me-ter or an active sensor, has the potential to improve yield, NUE, and profit in irrigated corn production. Most tradi-tional N rate calculators are designed to provide an N rate recommendation prior to or shortly after planting, and are static estimates that are not designed to react to in-sea-son variations in weather which can alter N mineralization from organic matter and crop residue, and change the level of N loss from the system. Sensor technology, on the other hand, has the capacity to respond to in-season changes in plant greenness and biomass and use that information to adjust N rates as conditions change, in some cases on-the-go based on variations across the field.
The use of these enhanced technologies should lead to im-proved NUE by capturing variations in native soil N supply across the field, coupled with losses of applied N due to mechanisms such as leaching or denitrification.
Author information: Dr. Mengel is Agronomist with the De-partment of Agronomy, Kansas State University, Manhat-tan, Kansas; e-mail: [email protected].
ReferenceSchlegel, A.J. (multiple years). Nitrogen and phosphorus fertilization of
irrigated corn. Kansas Fertilizer Research. Reports of Progress. Kansas State Univ. Ag. Exp. Station and Coop. Ext. Service. [online] Available at http://www.oznet.ksu.edu/library/crpsl2/

8-6 Fertilizing for Irrigated Corn / Mengel

Notes

Notes


Item # 30-3240 Ref # 08053
International Plant Nutrition Institute (IPNI) 3500 Parkway Lane, Suite 550 • Norcross, GA 30092-2806 U.S.A.
Phone: 770-447-0335 •Fax: 770-448-0439 • E-mail: [email protected] • Website: www.ipni.net