
FERNANDERS, MARIUM S., M.S. Crossed Molecular Beam Study...
66
FERNANDERS, MARIUM S., M.S. Crossed Molecular Beam Study of X + O 3 (X= Br and I) and O( 1 D) + X (X= Br 2 , I 2 , CHCl 3 , and N 2 O) Reactions via Millimeter and Sub- Millimeter Wavelength Spectroscopy. (2014) Directed by Dr. Liam Duffy. 58 pp. The use of scattering experiments in atmospheric studies has proved useful in understanding the dynamics of the catalytic ozone destruction cycle. By using millimeter and sub-millimeter wavelengths, we can probe bimolecular reaction systems for translational, rotational, vibrational, and electronic energy distributions through pure rotational spectroscopy. The focus of this research is on the reaction between iodine, bromine, and ozone due to their roles in the catalytic ozone destruction cycle. For this research we studied the X + O 3 (X= I and Br) and O( 1 D) + X (X= I 2 , Br 2 , N 2 O, and CHCl 3 ) reactions using single and crossed molecular beam techniques. The apparatus contains two independently rotatable arms, capable of changing collisional energies in relation to arm angle. Though no product signals have been detected at this time, critical experimental methods have been developed that can be optimized in the future.
Transcript of FERNANDERS, MARIUM S., M.S. Crossed Molecular Beam Study...

FERNANDERS, MARIUM S., M.S. Crossed Molecular Beam Study of X + O3 (X= Br and I) and O(1D) + X (X= Br2, I2, CHCl3, and N2O) Reactions via Millimeter and Sub-Millimeter Wavelength Spectroscopy. (2014) Directed by Dr. Liam Duffy. 58 pp.
The use of scattering experiments in atmospheric studies has proved useful in
understanding the dynamics of the catalytic ozone destruction cycle. By using millimeter
and sub-millimeter wavelengths, we can probe bimolecular reaction systems for
translational, rotational, vibrational, and electronic energy distributions through pure
rotational spectroscopy. The focus of this research is on the reaction between iodine,
bromine, and ozone due to their roles in the catalytic ozone destruction cycle.
For this research we studied the X + O3 (X= I and Br) and O(1D) + X (X= I2, Br2,
N2O, and CHCl3) reactions using single and crossed molecular beam techniques. The
apparatus contains two independently rotatable arms, capable of changing collisional
energies in relation to arm angle. Though no product signals have been detected at this
time, critical experimental methods have been developed that can be optimized in the
future.

CROSSED MOLECULAR BEAM STUDY OF THE X+ O3 (X= Br and I) AND O(1D) +
X (X= Br2, I2, CHCl3, and N2O) REACTIONS VIA MILLIMETER AND SUB-
MILLIMETER WAVELENGTH SPECTROSCOPY
by
Marium S. Fernanders
A Thesis Submitted to the Faculty of the Graduate School at
The University of North Carolina at Greensboro in Partial Fulfillment
of the Requirements for the Degree Master of Science
Greensboro 2014
Approved by
_________________________________ Committee Chair

ii
APPROVAL PAGE
This thesis has written by Marium S Fernanders been approved by the following
committee of the Faculty of The Graduate School at The University of North Carolina at
Greensboro.
Committee Chair ______________________________ Committee Members ______________________________
___________________________ Date of Acceptance by Committee
_________________________ Date of Final Oral Examination

iii
ACKNOWLEDGEMENTS
I would like to thank Dr. Liam Duffy for serving as my research advisor. Thank
you for your patience, understanding, and guidance.
I would like to thank Dr. Alice Haddy and Dr. Solomon Bililign for agreeing to
serve on my thesis committee.
iv
TABLE OF CONTENTS
Page
LIST OF FIGURES ........................................................................................................... vi CHAPTER I. INTRODUCTION .................................................................................................1 I.A. Background ...........................................................................................1 I.B. Catalytic Ozone Destruction Cycle via the ClO Dimer Mechanism ............................................................................3 I.C. Catalytic Ozone Destruction Cycle via BrO/CIO Dimer Mechanism ............................................................................7 I.D. Tucceri Iodine Experiment .................................................................. 9 I.E. Photodissociation of Ozone to O(1D) ..................................................10 I.F. Kaucozok O(1D) + D2 Experiment ......................................................10 II. X + O3 REACTION .............................................................................................12 II.A. X + O3 (X= I and Br) Experimental Setup ........................................12 II.A.1. X + O3 (X= I and Br) Experimental Modifications ............16 II.B. Experimental Data for the X + O3 (X= I and Br) Reactions .............19 II.B.1. Nitrous Oxide as Diagnostic Gas for the X + O3 Reaction Data ..................................................................19 II.B.2. Experimental Data for the I + O3 Reaction ........................24 II.B.3. Experimental Data for the Br + O3 Reaction ......................25 II.C. Problems with X + O3 Experimental Modifications ..........................27 II.D. Conclusions for the X + O3 Reactions ..............................................31 III. O(1D) + X REACTION .......................................................................................33 III.A. O(1D) + X Experimental Setup ........................................................33 III.A.1. Laser Optimization for the Production of O(1D) ..............39 III.B. Experimental Data for the O(1D) + X (X= Br2, I2, N2O, and CHCl3) Reactions .....................................42 III.B.1. Experimental Data for the O(1D) + Br2 Reaction .............42 III.B.2. Experimental Data for the O(1D) + I2 Reaction ...............46 III.B.3. Experimental Data for the O(1D) + N2O Reaction ............47 III.B.4. Experimental Data for the O(1D) + CHCl3 Reaction ........50 III.C. Discussion on the O(1D) + X Reactions ...........................................52 III.D. Conclusions ......................................................................................52

v
REFERENCES ..................................................................................................................54

vi
LIST OF FIGURES
Page Figure 1. Energy level diagram for the Cl + O3 reaction Ea= 2.08 kJ/mol ..........................5 Figure 2. Energy level diagram for the Br + O3 reaction .....................................................8 Figure 3. Top down view of the X+ O3 chamber setup showing the rotatable arms and a projection of the molecular beams. ..............................................13 Figure 4. Collisional energy as a function of arm angle (blue line). .................................14 Figure 5. Chopper blade attached to the slit nozzle, the chopper blade controls the firing sequence of the nozzles. ................................................................17 Figure 6. Relocation of the new diffusion pump, by placing the pump closer to the chamber we decreased void volume and increase vacuum efficiency. ........................................................................................17 Figure 7. The initial modifications to the pinhole nozzle: iodine reservoir, light detector, fiber optic holder, skimmer, temperature probe, and heater .......................................................................................................18 Figure 8. Shows the placement of the light detector on the pinhole nozzle, bottom right shows detector positioned right above fiber optic opening. .................................................................................................19 Figure 9. Slit nozzle mm-wave transient absorption signal of N2O (N= 4 ← 3) without the chopper blade or skimmer, signal is relatively long in time (~700 μsec) ................................................................................ 20 Figure 10. Shows the raw sequence of gas pulses pulses, in this case, pinhole and slit nozzles fired together followed by the pinhole only and then slit only ..................................................................................21 Figure 11. Shows a surface plot of the same signals in Figure 10 but with the negative going timing pulses removed .........................................................22 Figure 12. Shows an example of the potential avenue of data analysis .............................23 Figure 13. Scans to find the IO product signal using CMB methods ................................25
vii
Figure 14. Schematic of the gas inlet manifold, the green lines represent the pathway of the argon and bromine as it goes into the pinhole nozzle for CMB experiments .......................................................................26 Figure 15. 90° Push in connector and banjo fitting, the replacement of the iodine reservoir, lead to better signal from the pinhole nozzle ....................27 Figure 16. Signal from the pinhole using N2O after replacing the iodine reservoir with 90° push in connector, secondary peak a result of N2O leaking into the slit arm and out of the nozzle, due to Doppler Shift
corresponding to slit nozzle location ............................................................28 Figure 17. Voigt profile charaterized by Ttrans= 47 K spread, 15 kHz Lorentzian broadening (gas: ozone) ..............................................................................31 Figure 18. Ozone mm-wave transient absorption signal (v=0 transition) ........................ 33 Figure 19. Schematic of the laser pathway before entering the chamber ..........................34 Figure 20. Top down view of the O(1D) + X experimental setup .....................................35 Figure 21. Examples of daily diagnostic scans ..................................................................36 Figure 22. Diagnostic scan that indicates a problem with the experiment ........................37 Figure 23. New set up to introduce non-gaseous reagent into the experimental chamber (located in laboratory chemical hood) ....................38 Figure 24. Photodissociation OPO laser scan (over part of Hartley band) of ozone at a fixed mm-wave frequency centered on an intense ozone rotational transition (249788.5520 MHz) ....................................................40 Figure 25. Pseudo-optimization of the pinhole, slit, and laser for CMB experiments ........................................................................................42 Figure 26. Sweeps for the 79BrO signal at the v=0 and v=1 states ....................................44 Figure 27. Broadband frequency sweep of BrO for the v=2 state using CMB method ................................................................................................45 Figure 28. Broadband frequency sweep of BrO for the v=2 state using SMB method ................................................................................................46
viii
Figure 29. Different scans to find IO signal using both CMB and SMB experimental methods ..................................................................................47 Figure 30. Different scans to find NO product using SMB and CMB experimental methods (all scans are v=0 state) ............................................49 Figure 31. Different scans to find ClO product using SMB and CMB experimental methods ..................................................................................51

1
CHAPTER I
INTRODUCTION
I.A. Background
Ever since the 1970’s when ozone depletion was first detected, scientists have
been monitoring the effects of man-made pollution and naturally occurring compounds
that could affect ozone degradation. In 1995, Paul Crutzen, Mario Molina, and Frank
Sherwood Rowland shared the Nobel Prize in chemistry for their work on the ozone
destruction cycle. [1] Due to their efforts, it is now widely known that
chlorofluorocarbons (CFCs) and brominated organic compounds have a detrimental
effect on the ozone layer. The work of these laureates along with Michael McElroy’s
work on the BrO/ClO dimer mechanism has helped support laws and policies regarding
pollution affecting the ozone layer. The most notable of these policies was the Montreal
Protocol which required a gradual phase out of CFCs (and their derivatives). [2,3]
The laureates’ work with CFCs showed that the photolysis of atomic chlorine,
from CFCs, is responsible for 75% of the catalytic destruction of ozone. [4] When Molina
and McElroy’s work on the ClO and ClO/BrO dimer mechanisms in the catalytic
destruction of ozone was first published, the reaction dynamics were not well understood.
J.S Zhang and Y.T. Lee’s crossed molecular beam (CMB) work with X+ O3 (X= Cl and
Br) reactions lead to the first breakthrough on the dynamics of ozone degradation. In our
experiments, we initially attempted to study the X + O3 (X= Br and I) reactions due to

2
their similarity to the Cl + O3 reaction; however, we turned to the reactions of O(1D) + X
(X= Br2, I2, N2O, and CHCl3) after failing to detect products. The O(1D) + X reactions
are more kinetically favored, while their reaction dynamics are still similar to the X + O3
reactions. The goal of this research was to obtain the rovibronic (rotational, vibrational,
and electronic) product state distributions of XO (X= Cl, Br, N, I). It is useful to study
iodine containing compounds because of their relative abundance from natural and man-
made sources. Natural sources of iodine tend to be concentrated in coastal regions due to
oceanic algae. [5] Ever since the ban on bromomethane by the Montreal Protocol man-
made iodinated compounds, specifically iodomethane, can now be found readily in
pesticides. [3] Bromine containing compounds are also useful to study, ever since atomic
bromine was identified as the second most abundant ozone destroying atom. Nitrous
oxide (N2O) is quickly becoming the largest stratospheric ozone depleting compound,
since the Montreal Protocols ban on CFCs. [6,7] CMB experiments are useful in
atmospheric studies because they can help identify or confirm the presence of transient
reaction intermediates that may not be observable in normal kinetic studies. Armed with a
better understanding of the reaction mechanisms, scientists and policymakers can, if
necessary, develop or revise policies and laws governing the production and mitigation of
ozone harming chemicals.
Crossed molecular beam experiments are essential to a detailed understanding of
the dynamics of elementary chemical reactions, yielding the rotational, vibrational,
translational, and electronic energy distribution of the resulting products. These
distributions in turn give insight into the nature of the chemical transition state. As

3
mentioned earlier, the primary focus of this research has been to obtain the rovibronic
energy distributions of IO, BrO, ClO, and NO. By obtaining these distributions we can
determine if the reaction has an early or late transition state geometry, and whether the
reaction follows an abstraction or insertion mechanism. Prior research with the Br + O3
reaction shows that the heavier atom reacts similar to the Cl + O3 reaction; therefore, we
expected the I + O3 reaction (k= 1.3E-12 cm3/molecule s @ 298 K) to behave similar to
the widely studied Cl + O3 reaction. [8,9,10]
While the initial goal of the thesis was to study the X + O3 (X= Br and I) reaction,
numerous experimental difficulties required us to change our experimental direction to
the O(1D) + X (X=Br2, I2, N2O, CHCl3) reaction. Despite overcoming these challenges,
we failed to observe product formation in any of these reactions. We outline the possible
reasons for this below.
I.B. Catalytic Ozone Destruction Cycle via the ClO Dimer Mechanism
Molina identified the ClO dimer mechanism as the catalytic pathway responsible
for 75% of ozone destruction.
ClO dimer mechanism: [11,4]
2 (Cl +O3 ClO +O2)
2 ClO + M (ClO)2
(ClO)2 + hν Cl + ClOO
ClOO + M Cl + O2 + M
Net: 2O3 3O2

4
Zhang and Lee carried out a dynamics experiment on the Cl + O3 reaction to determine
the angular and translational energy distributions for the ClO product in relation to the
center of mass (CoM). [4] They were also able to identify the most likely geometry of the
ClO3 reaction intermediate. Zhang and Lee ran the CMB experiment at four different
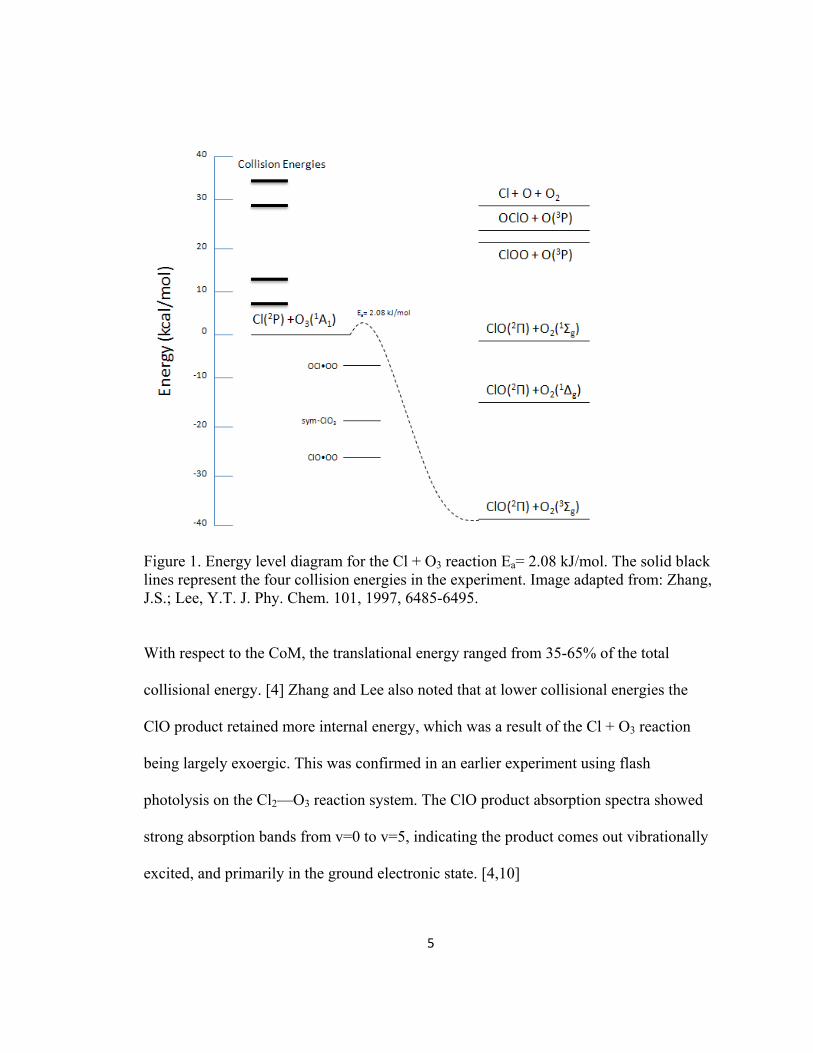
collisional energies (6-32 kcal/mol). Figure 1 shows the energy level diagram for the Cl +
O3 reaction. They found the translational energy was released in the forward direction
with respect to the Cl atom, and the angular distribution was predominately scattered
forward and sideways. [4]
5
Figure 1. Energy level diagram for the Cl + O3 reaction Ea= 2.08 kJ/mol. The solid black lines represent the four collision energies in the experiment. Image adapted from: Zhang, J.S.; Lee, Y.T. J. Phy. Chem. 101, 1997, 6485-6495. With respect to the CoM, the translational energy ranged from 35-65% of the total
collisional energy. [4] Zhang and Lee also noted that at lower collisional energies the
ClO product retained more internal energy, which was a result of the Cl + O3 reaction
being largely exoergic. This was confirmed in an earlier experiment using flash
photolysis on the Cl2—O3 reaction system. The ClO product absorption spectra showed
strong absorption bands from v=0 to v=5, indicating the product comes out vibrationally
excited, and primarily in the ground electronic state. [4,10]

6
At higher collisional energies, the ClO2 product channel becomes accessible
(Figure 1). Zhang and Lee attempted to detect the ClO2 product’s two possible isomers
ClOO and OClO. The OClO isomer is relatively stable and capable of detection through
mass spectrometry (67 m/z). [4] Zhang and Lee were unable to detect signal at higher
collisional energies and speculated that the OClO product required the chlorine to
undergo insertion with the ozone and, therefore, has a higher reaction barrier. The high
reaction barrier makes the OClO isomer unlikely to form in later stages of the ozone
catalytic cycle.
While detection of the ClO2 reaction channel is important, Zhang and Lee focused
on the dynamics of the initial step in the ozone catalytic destruction cycle Cl + O3 ClO
+ O2. Based on the CoM angular distribution’s lack of forward-back symmetry, they
concluded the sym-ClO3 and the moderately stable ClO•OO were unlikely reaction
intermediates for the Cl + O3 reaction. [4] This theory was confirmed by the lack of
angular and translational energy back-scattering in the experimental data; therefore, the
Cl + O3 reaction is consistent with a direct reaction with no long-lived intermediates. [9]

7
I.C. Catalytic Ozone Destruction Cycle via the BrO/ClO Dimer Mechanism
The ClO/BrO mechanism identified by McElroy is the second most significant
cause of catalytic ozone destruction. The Br + O3 reaction is a key initial step in the
ClO/BrO mechanism.
ClO/BrO mechanism: [4,12]
Cl + O3 ClO + O2
Br + O3 BrO + O2
ClO + BrO Cl + Br + O2
net: 2O3 3O2
Zhang and co-workers studied the Br + O3 reaction in order to compare it to previously
published dynamics data on the Cl + O3 reaction. Based on prior kinetic studies on X +
O3 reactions (X= O(3P), F, Cl, and Br) the pre-exponential factors were all similar (~2.2
X 10-11 cm3 molecule-1s-1). [4] As a result, the Br + O3 reaction is expected to behave
similar to the Cl + O3 reaction.
Zhang et al. ran their experiment at five different collisional energies (5-26
kcal/mol) to obtain the translational energy and angular distributions for comparison to
the Cl + O3 reaction. Figure 2 shows the energy level diagram for the Br + O3 reaction.
[13]

8
Figure 2. Energy level diagram for the Br + O3 reaction. The solid black lines represent the five collision energies (5-26 kcal/mol) in the experiment. Image adapated from: Zhang, J.S.; Lee, Y.T. J. Phy. Chem. 101, 1997, 6922-6930. There are three possible products of the Br + O3 reaction: ground state O2 and two excited
state O2 molecules. At higher collisional energies, the semi-stable BrO2 intermediate
pathway opens up. Zhang and coworkers attempted to detect the BrO2 intermediate, but
were unable to. They speculated that this was due to the relatively weak Br—O2 bond (~1
kcal/mol) that could be broken during the ionization process. Or more likely, the Br + O3
reaction does not contain an intermediate reaction channel. [13] This was confirmed by
the lack of forward-back scattering in the experiment. They found the translational
energy was forward scattered with respect to the CoM, and the angular distribution was
forward and side scattered.
9
I.D. Tucceri Iodine Experiment
Iodomethane (CH3I) has recently become of interest in atmospheric chemistry as
a potential reagent in the ozone catalytic destruction cycle, but there has been very little
experimental data on the reaction dynamics or kinetics of the I + O3 reaction. [14]
Tucceri and coworkers used laser flash photolysis coupled with resonance-fluorescence
to measure the rate coefficients for the I + O3 reaction. [15] They found that atomic
iodine’s decay is defined by: [15]
(1.1)
Where (1.2)
Here, d represents the loss of reagent through diffusion or side reactions. For their
experiment, N2O acts as a scavenger reagent to minimize and/or prevent any side
reactions, since the IO product tends to undergo self-reactions, which can artificially
inflate the unreacted atomic iodine in the experiment. [15] Tucceri et al. increased the
concentration of atomic iodine at a constant ozone concentration and recorded no
significant change in the production of product (IO). By taking the slope of k1’ vs [O3],
they were able to obtain k1 of the reaction (1.28 ± 0.06) x 10-12 cm3 molecule-1 s-1. Their
data corresponds with previous research by Holscher and coworkers (1.2 ± 0.1) x 10-12
cm3 molecule-1 s-1. [16,15]

10
I.E. Photodissociation of Ozone to O(1D)
The photodissociation of ozone is a naturally occurring reaction in the
stratosphere. It is due to ozone’s ability to photodissociate at ultraviolet (UV)
wavelengths that protects the earth’s surface from harmful UV radiation. Peak ozone
absorption occurs in two areas of the UV spectrum the Hartley band (220-310 nm) and
Huggins band (310-360 nm). [17,18] When undergoing photodissociation, ozone can
follow two separate reaction channels: [17]
O3 + hv O2(
1Δg) + O(1D) (1)
O3 + hv O2(3Σg
-) + O(3P) (2)
With the dominant reaction channel dependent on what wavelength of light ozone
absorbs. The Hartley band is one of the primary sources of O(1D) production, with peak
O(1D) synthesis occurring at wavelengths less than 300 nm. [19,20]
I.F. Kauczok O(1D) + D2 Experiment
Kauczok et. al. ran a PHOTOLOC single molecular beam experiment for the
O(1D) + D2 reaction. The scientist produced O(1D) atoms through hole burning, by photo-
dissociating N2O molecules with a laser set to 193 nm. They then used a rotatable Time-
of-Flight Mass Spectrometer (TOF-MS) to measure the D atoms that resulted from the
O(1D) + D2 reaction. [21]
From this the scientist found that the O(1D) + D2 reaction was predominantly
back-scattered with respect to the D2 molecule. The back-scattering of the D atom is

11
consistent with an insertion mechanism. They also found that the product came out
primarily in the v=4 and 5 state. [21,9,4]

12
CHAPTER II
X + O3 REACTION
II.A. X + O3 (X= I and Br) Experimental Setup
The crossed molecular beam experiment is relatively new to the Duffy research
group. In previous years, Duffy’s lab worked on single molecular beam experiments
using lasers. The previous graduate students: Jouse Monge, Daniel Mauney, and Nicholas
Mark modified the group’s prior setup to run CMB experiments. [22,24,26] The focus of
their research was on different forms of CMB scattering and the theoretical approach of
CMB data analysis through Fourier Transform Doppler Spectroscopy (FTDS). [22,23]
Mark’s efforts with atomic chlorine and ozone served as the catalyst for our experiment
with X + O3 (X= Br and I) and O(1D) + X (X= I2, Br2, N2O, and CHCl3). Nicholas Mark
conducted experiments in which he attempted to generate atomic chlorine by the use of
electrical discharge. Unfortunately, his method generated significant RF noise, interfering
with the data acquisition electronics, as well as the operation of the gas pulse nozzles.
The need for high voltage and high current fast switches was also problematic. [24,25]
Figure 3 shows a top-down view of the experimental setup. The lower figure
shows a projection of the molecular and microwave beams. Once a given collisional
energy is chosen by adjusting the relative angle between the arms, the arms may then be
moved in tandem to allow the products to be probed by means of Doppler spectroscopy.

13
By moving the arms, over a range of angles, the full 3D velocity distribution of
the products may be determined by FTDS. In the chamber the nozzle arms can be set at a
range of angles from 45˚ to 180˚ apart, allowing the initial relative kinetic energy of the
reactants to vary (Figure 4). In this case, FTDS will be used to determine the angular
distributions of the overall reaction X + O3 (X= Br and I). We hoped to use these
distributions to gain insight into the transition state geometries, reaction intermediates,
and basic mechanisms.
Figure 3. Top down view of the X+ O3 chamber setup, showing the rotatable arms and a projection of the molecular beams.

14
Figure 4. Collisional energy as a function of arm angle (blue line). Reported activation energy, of 6.9 kJ/ mol @ 300 K (red line), for the I + O3 reaction.
Because molecular bromine does not have a millimeter wave spectrum, we tested
our system timing using acetonitrile before each experimental run. A vial of acetonitrile
was attached to the gas inlet system (the bromine was set up in the same way) and argon
gas was passed through the liquid. The microwave frequency was set to a rotational state
of acetonitrile, and a test scan was taken. When we were satisfied with the timing, the
iodine/bromine ozone experiment was initiated.
Ozone was fired through the slit nozzle with argon acting as the carrier gas.
Atomic iodine was generated at the pinhole nozzle exit from the dissociation of
molecular iodine by using a continuous wave (CW) line tunable Ar/Kr laser set at 488
nm. Again, argon was used as the carrier gas. The pressure of each nozzle was monitored
individually using the gas inlet system. An optical sensor spanning across the chopper
blade, and mounted on the arm of the slit nozzle, was used as a trigger for the nozzle
0.0
5.0
10.0
15.0
20.0
25.0
30.0
0 20 40 60 80 100 120 140 160 180
Collision Energy (kJ/mol)
Arm Angle

15
firing. A custom-made timing circuit was used to synchronize the chopper and slit gas
pulse firing, as described in the thesis of Daniel Mauney. [26] The microwave frequency
was set to a rotational state of the product molecules (IO and BrO).
Ozone was created, in the laboratory fume hood, with a commercially available
generator (Pacific Ozone G 11) in accordance with the owner’s manual. Neat O2 was
passed through the generator at a 10% flow rate of total possible gas flow. The ozone
output was set at 70% and the generator was run for a minimum of thirty minutes. The
ozone was then captured on silica beads cooled in a dry ice/ acetone bath (-78 ˚C)
allowing the unreacted waste stream of O2 to pass through the beads. As a precaution,
any trace ozone that may have passed through the silica was diminished in a heated 4”
diameter pipe containing copper wool at 100˚C and then exhausted into the chemical
hood. [27] We knew we had obtained ozone when the silica beads had taken on a dark
blue/ purple hue. To facilitate the flow of ozone to the cross molecular beam apparatus,
argon was passed over the trapped ozone. It is also important to note, that mixtures of
ozone and molecular oxygen are potentially explosive, as is neat ozone liquid undergoing
evaporation. Researchers intending to work with or trap ozone should read the references
cited here. [28,29] We have not had any problems working with pure neat ozone
evaporating from silica gel held at -78 ˚C and carried to the experiment via ¼” Teflon
tubing. It is critical that liquid nitrogen not be used to trap ozone as this would lead to the
capture of molecular oxygen on the beads and possible explosion. [28,29]
Iodine crystals were placed in a reservoir attached to the pinhole nozzle (Figure
8). The crystals were heated to increase their vapor pressure and argon was used as a

16
carrier gas. We estimated the molecular iodine concentration within the molecular beam
using baratron pressure sensors attached to the gas inlet system. Due to the relatively
weak nature of the I2 (151 kJ/mol) bond, we chose to make atomic iodine by photolysis
using a laser (Melles Griot 43 ion series) tuned to approximately 488 nm.
Molecular bromine was introduced to the chamber via a vial attached to the gas
inlet system. Argon gas was passed through the liquid bromine to facilitate evaporation.
The bromine vapor came out the pinhole nozzle where we photodissociated the molecular
bromine using a laser (Melles Griot 43 ion series) tuned to approximately 510 nm. [30]
We confirmed the presence of atomic bromine with the Spectra International Residual
Gas Analyzer Mass Spectrometer (RGA) by pulsing bromine vapor into the chamber with
the laser on.
II.A.1. X + O3 (X= I and Br) Experimental Modifications
To optimize the cross molecular beam apparatus for the X + O3 (X= I and Br)
experiments, we made several modifications to the chamber. One such modification was
the addition of skimmers to the pinhole and slit nozzles. The skimmers decreased the
molecular spread of the pulsed gas, which in turn narrowed the Doppler line width.
As mentioned earlier, in some experiments a chopper blade was added
downstream from the slit nozzle in order to shortening the gas pulse, and in conjunction
with an optical sensor, act as a timing mechanism (Figure 5). During the initial testing of
the chopper blade, we experienced problems with the motor. After consultation with the
company engineers, we suspected the chopper motor was overheating. To prevent this,

17
we replaced the original dc motor (Maxon Amax 16 motor) with a larger one (Maxon
Amax 26 motor) and added a temperature probe to decrease the risk of overheating while
under vacuum (Figure 5).
Figure 5. Chopper blade attached to the slit nozzle, the chopper blade controls the firing sequence of the nozzles. Side view of the chopper shows the installation of the larger motor and temperature probe.
Figure 6. Relocation of the new diffusion pump, by placing the pump closer to the chamber we decreased void volume and increase vacuum efficiency.
Since the nozzles were firing within quick succession of each other, there was a
possibility of overwhelming the vacuum system. To combat the problem, we relocated
and replaced the mini diffusion pump (air-cooled Edwards E050/60 pump, Figure 6). By

18
moving the diffusion pump closer to the chamber we had decreased void volume,
increased pumping efficiency, and decreased pump down time.
In order to use a laser to generate atomic iodine, we made extensive modifications
to the pinhole nozzle holder (Figure 7). These include a fiber optic cable holder, a light
detector (Figure 8), an iodine reservoir/heater holder, and a temperature probe. Because
the entire nozzle was enclosed, we added a photoresistor light detector to indicate if the
laser was on. Signal intensity could be monitored with a voltmeter, where a 9 V reading
indicated the laser was off and a 0 V reading indicated full power.
Figure 7. The initial modifications to the pinhole nozzle: iodine reservoir, light detector, fiber optic holder, skimmer, temperature probe, and heater
19
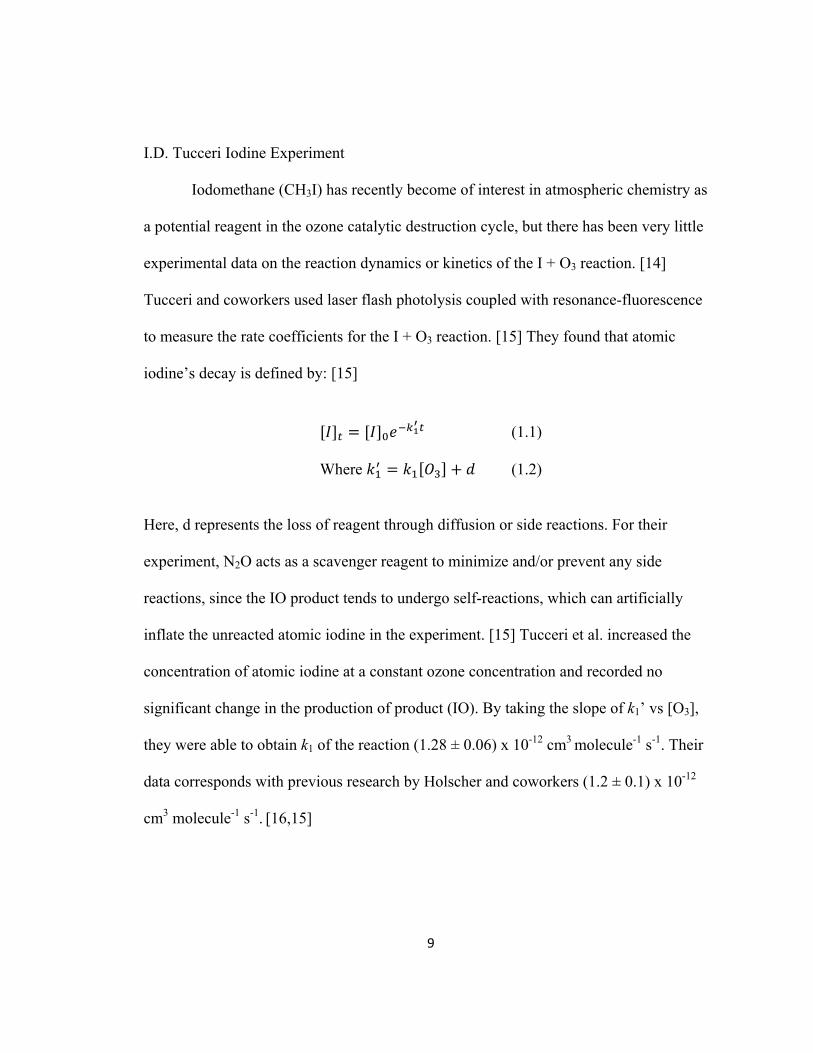
Figure 8. Shows the placement of the light detector on the pinhole nozzle, bottom right shows detector positioned right above fiber optic opening. II.B. Experimental Data for the X + O3 (X= I and Br) Reactions
II.B.1. Nitrous Oxide as Diagnostic Gas for the X + O3 Reaction Data
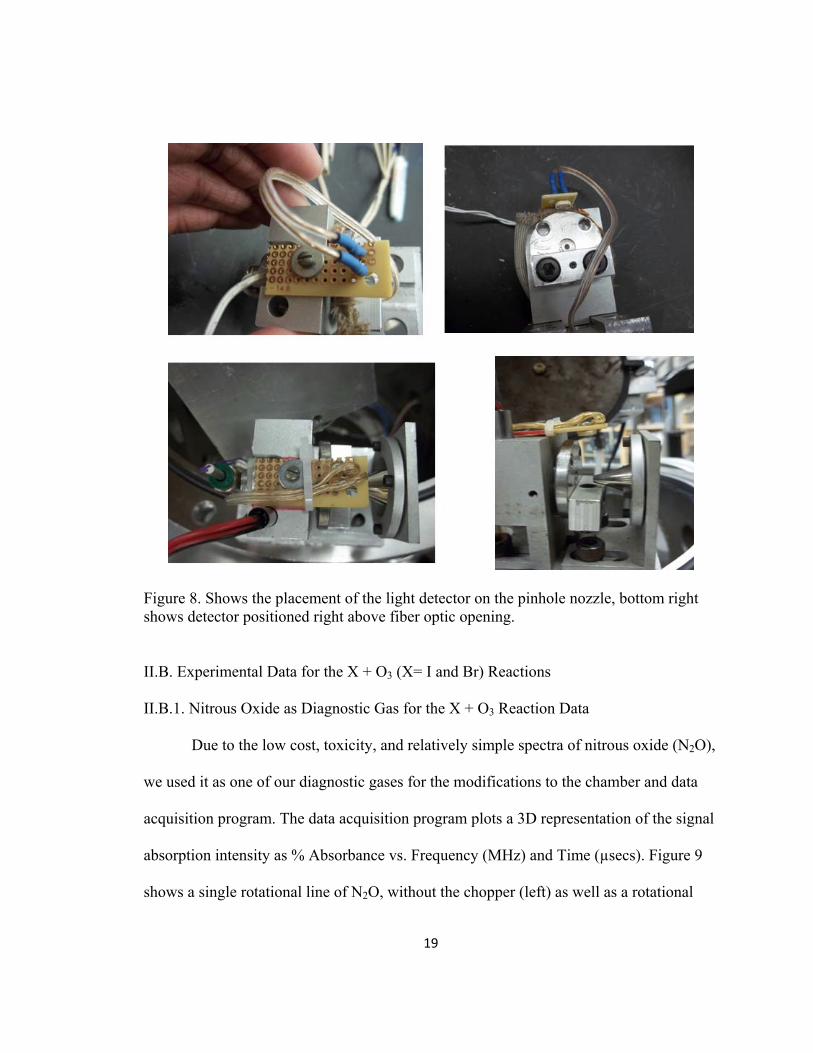
Due to the low cost, toxicity, and relatively simple spectra of nitrous oxide (N2O),
we used it as one of our diagnostic gases for the modifications to the chamber and data
acquisition program. The data acquisition program plots a 3D representation of the signal
absorption intensity as % Absorbance vs. Frequency (MHz) and Time (µsecs). Figure 9
shows a single rotational line of N2O, without the chopper (left) as well as a rotational
20
line of N2O with the addition of the skimmer and chopper (right). By adding the skimmer
and chopper, we narrowed the signal in time.
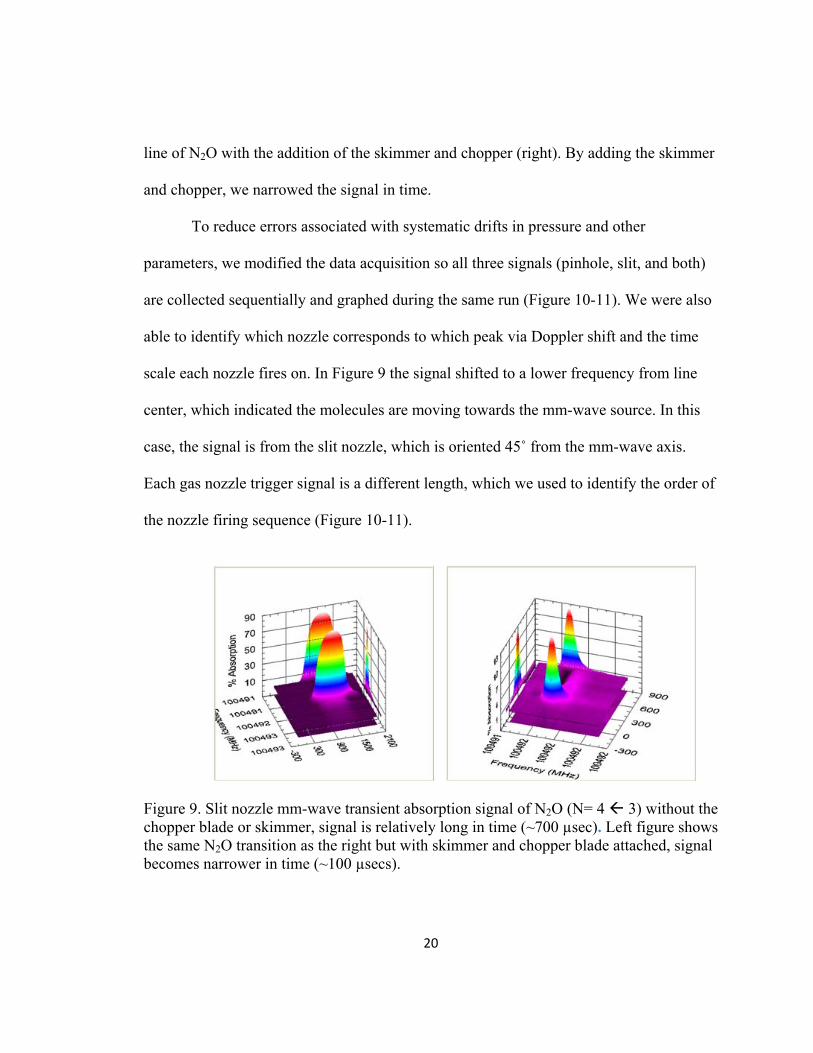
To reduce errors associated with systematic drifts in pressure and other
parameters, we modified the data acquisition so all three signals (pinhole, slit, and both)
are collected sequentially and graphed during the same run (Figure 10-11). We were also
able to identify which nozzle corresponds to which peak via Doppler shift and the time
scale each nozzle fires on. In Figure 9 the signal shifted to a lower frequency from line
center, which indicated the molecules are moving towards the mm-wave source. In this
case, the signal is from the slit nozzle, which is oriented 45˚ from the mm-wave axis.
Each gas nozzle trigger signal is a different length, which we used to identify the order of
the nozzle firing sequence (Figure 10-11).
Figure 9. Slit nozzle mm-wave transient absorption signal of N2O (N= 4 3) without the chopper blade or skimmer, signal is relatively long in time (~700 µsec). Left figure shows the same N2O transition as the right but with skimmer and chopper blade attached, signal becomes narrower in time (~100 µsecs).

21
Figure 10. Shows the raw sequence of gas pulses, in this case, pinhole and slit nozzles fired together followed by the pinhole only and then slit only. Each color is taken at different fixed mm-wave frequency around the N= 4 3 rotational transition of N2O. The negative going signals are trigger pulses intentionally subtracted from the positive going absorption signals. The length of each trigger pulse allows us to determine which nozzle has fired.
22
Figure 11. Shows a surface plot of the same signals in Figure 10 but with the negative going timing pulses removed. Signals are from a single rotational line (N= 4 3) of N2O. The data has been sequentially collected by alternately firing both nozzles together, then firing the pinhole nozzle, followed by the slit nozzle. The signals have been averaged and background subtracted. Doppler shifts in frequency are due to the opposite angular orientation of the two molecular beams relative to the mm-waves. During data analysis, we cleaned up the noise by subtracting the background (Figure 11).
By subtracting the background, we obtained a more accurate representation of the signal
and remove trigger induced dips from the data. In addition to removing background, we
were able to focus on a single or multiple peaks (Figures 11). Product and parent peaks
can be masked or distorted by other signals and/or noise. By removing background and

23
signals, we hoped to isolate and focus on our target signal that may have been distorted or
masked. Figure 12 show the various signal isolations possible during data analysis.
Figure 12. Shows an example of the potential avenue of data analysis. Plots. (a) through (c) show the isolation of specific signals, so we can either look at the collision free signals, or the scattered signal. Plot (d) shows the both signal minus the pinhole and slit signal, by subtracting those peaks we can isolate any scattered product signal that may be masked, which if present, would appear as positive signal in plot (d).

24
II.B.2 Experimental Data for the I + O3 Reaction
Due to issues with the pinhole nozzle, we were unable to take very many scans of
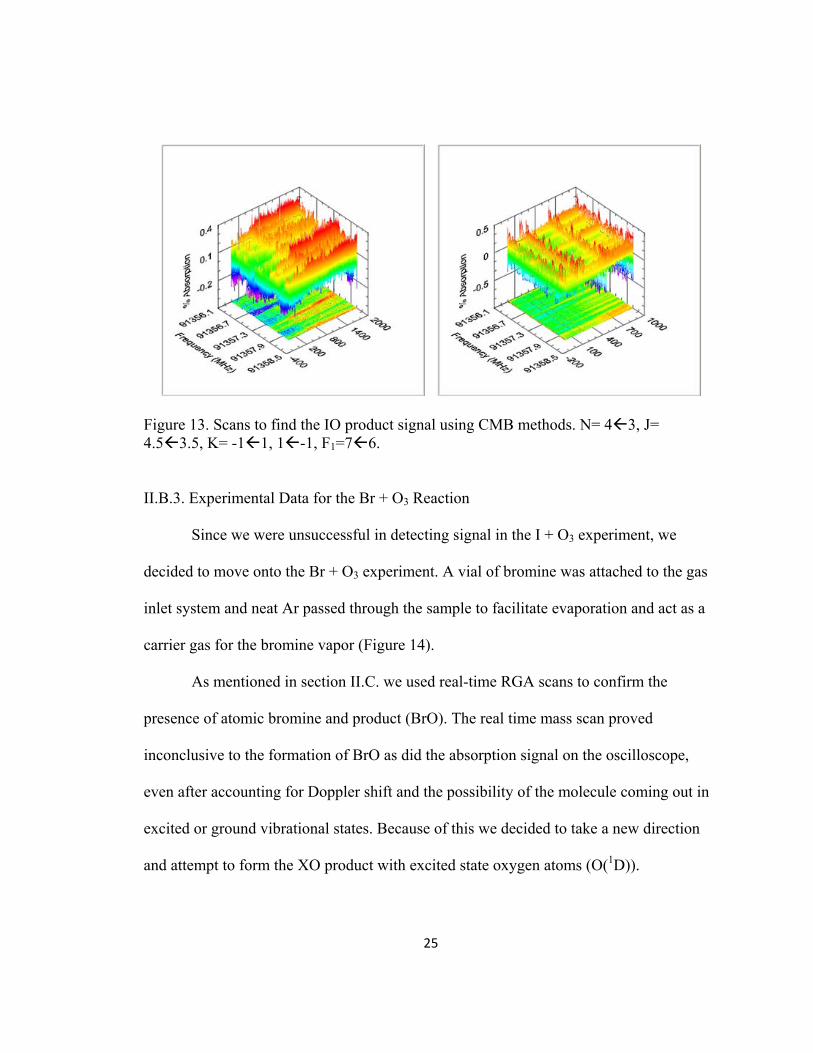
the I + O3 reaction. Figure 13 shows scans for the IO product. Initially we thought that
the product signal may have been obscured by noise. So during data analysis we zoomed
in, in time, to where the product should have emerged. Unfortunately, the features in
figure 13 were not reproducible; if signal is present, it is smaller than the fluctuations in
the baseline due to nozzle vibration (left figure) and/or noise spikes due to RF pickup
(right figure). It is also possible, as will be mentioned in section III.B.3 with NO, the
product IO may have come out too hot vibrationally and/or rotationally. In the former
case, for v>1, rotational transition frequencies are not available in the literature, while in
the latter case, we do not have mm-wave sources extending to frequencies above 330
GHz or N’N” > 1514. It is also possible the products came out in an excited spin-
orbit state of IO which we did not attempt to probe.
25
Figure 13. Scans to find the IO product signal using CMB methods. N= 43, J= 4.53.5, K= -11, 1-1, F1=76. II.B.3. Experimental Data for the Br + O3 Reaction
Since we were unsuccessful in detecting signal in the I + O3 experiment, we
decided to move onto the Br + O3 experiment. A vial of bromine was attached to the gas
inlet system and neat Ar passed through the sample to facilitate evaporation and act as a
carrier gas for the bromine vapor (Figure 14).
As mentioned in section II.C. we used real-time RGA scans to confirm the
presence of atomic bromine and product (BrO). The real time mass scan proved
inconclusive to the formation of BrO as did the absorption signal on the oscilloscope,
even after accounting for Doppler shift and the possibility of the molecule coming out in
excited or ground vibrational states. Because of this we decided to take a new direction
and attempt to form the XO product with excited state oxygen atoms (O(1D)).

26
Figure 14. Schematic of the gas inlet manifold, the green lines represent the pathway of the argon and bromine as it goes into the pinhole nozzle for CMB experiments.

27
II.C. Problems with X + O3 Experimental Modifications
The previous modification to the pinhole nozzle was ineffective. The iodine
reservoir, over time failed to maintain a vacuum tight seal, and when fired it would
overwhelm the pinhole molecular beam and the vacuum system. In addition to troubles
maintaining vacuum, the heater melted the plastic connector of the iodine reservoir,
further ruining the vacuum seal (shown in Figure 8). We also experienced the nozzle
clogging, as a result of iodine vapor plating out. To maintain chamber pressure, we
replaced the iodine reservoir with a 90˚ quarter inch push-in banjo-type connector (Figure
15). From this change, we had managed to get a better pinhole molecular beam signal
(Figure 16).
Figure 15. 90° Push in connector and banjo fitting, the replacement of the iodine reservoir, lead to better signal from the pinhole nozzle

28
Figure 16. Signal from the pinhole using N2O after replacing the iodine reservoir with 90° push in connector, secondary peak a result of N2O leaking into the slit arm and out of the nozzle, due to Doppler Shift corresponding to slit nozzle location. N=76
The previous experimental setup required the atomic halogens (I and Br) to be
produced outside the nozzle exit within the chamber. We used the Spectra International
Residual Gas Analyzer Mass Spectrometer (RGA) to confirm the presence of bromine
atoms (m/z: 79/ 81 amu). After several real-time scans, we could see a noticeable uptick
in intensity of the mass units associated with the isotopes of atomic bromine when the
29
laser was on, and a rapid decrease in the mass units when the laser was off.
Unfortunately, the RGA was not in sync with the pinhole nozzle firing, so the atomic
bromine signals were not stable. Because of this we were unable to know if we were in
fact producing atomic bromine exclusively. Nevertheless, we concluded that, at the very
least, we were indeed making some atomic bromine. After confirming an ozone signal,
we ran both nozzles, and attempted to detect the BrO signal by means of both the RGA
and millimeter-wave absorption.
After several unsuccessful attempts to detect signal, we speculated that the laser
(Melles Griot 43 ion series) was not intense enough to produce the density of halogen
atoms necessary to effectively make enough XO (X= I and Br) products for detection. In
an effort to find a more robust reaction the X + O3, we performed a literature review, and
found that the kinetics for the O(1D) + X2 (X= I2 and Br2) reactions are significantly more
effective than X + O3 (X= I and Br) reactions, largely because O(1D) is almost barrier-
less when reacting and, therefore, much more likely to form the desired XO product:
[31,32]
Br + O3 BrO k= 1.20E-12 cm3/molecule s @ 298 K
I + O3 IO k= 1.30E-12 cm3/molecule s @ 298 K
O(1D) + Br2 BrO k= 1.40E-11 cm3/molecule s @ 298 K
O(1D) + I2 IO k= 1.25E-10 cm3/molecule s @ 298 K

30
The rate constants for O(1D) + X (X= Br and I) showed that these reactions were
expected to proceed at the gas-kinetic collision rate coefficient, which for hard-spheres of
diameter 0.4 nm , is 2.5E-10 cm3/molecule s . [33]
Another problem with the previous setup was the use of the chopper blade. The
chopper blade was designed to cut off part of the molecular beam for the experiment,
with the rest of the gas being pumped away; however, it appeared that the backscattered
gas would move around the chopper disk obscuring the silt molecular beam and
overwhelming the vacuum system. Initially, to fix the problem, we shortened the gas
pulse, but that lead to a loss of signal intensity and the signal was affected by more
artifact noise. Subsequently, after deciding to use O(1D) instead of ozone, the chopper
blade was removed.
The primary purpose of the chopper blade was to improve the signal relative to
the noise. This was in response to slow baseline noise variation on the time scale of a full
gas pulse. Because the Ar/Kr ion laser was continuous wave (CW), we produce bromine
or iodine atoms and hence products throughout the full gas pulse, making it challenging
to see small differences in the product signal relative to the slowly varying baseline noise.
By contrast, during the O(1D) experiments, the laser was on only for short periods of time
(~3-5 nsecs) making the potential product signal stand out against a slowly varying
background. These factors made the chopper obsolete in the O(1D) experiments.
The final problem we had with the initial experimental setup was the slit skimmer.
The previous slit skimmer did not have the desired effect of cleaning up the slit signal. To
prevent undesirable artifacts from interfering with the slit signal, we made a custom slit

31
skimmer with aluminum. The new slit skimmer decreased the frequency broadening of
the slit signal (Figure 17).
Figure 17. Voigt profile charaterized by Ttrans= 47 K spread, 15 kHz Lorentzian broadening (gas: ozone). Dotted line is experimental signal. Blue line is the residual offset. Red curve is the Voigt fit of slit nozzle signal to the JPL frequency line (N=76, K-1=10, K+1=76).
II.D. Conclusions for the X + O3 Reactions
While the X + O3 reaction was unsuccessful for our particular experimental setup,
we learned valuable information for future reference. In our attempt to photodissociate
halogen molecules (I2 and Br2), we learned that the CW laser we were using may not
have been intense enough to produce the density of halogens atoms necessary to form
enough XO products for detection.
We also found that the X + O3 reaction is not the best type of experiment to try
using our CMB detection method (absorption spectroscopy). When comparing the rate
constants of the X + O3 reaction to the gas kinetic rate (where every collision is a
reaction) we found that with both iodine and bromine only one in every one hundred
collisions will result in product formation. This combined with the uncertainty in the

32
density of halogens atoms produced by the CW laser, may have contributed to little or no
product formation to be detected.
Finally as mentioned in section III.B.3., running reaction as a crossed molecular
beam (CMB) results in products coming out in higher spin-orbit vibrational, and/or
rotational states. At this time there were no literature values on the rotational lines of BrO
and IO higher than the v=1 state, we were unable to check higher states. In lieu of
obtaining a higher power CW laser and/or extending our millimeter-wave frequency
coverage, a solution to this issue may be to run the X + O3 reaction under single
molecular beam (SMB) conditions, as the collision within the beam would slow down the
radical halogen increasing its collisional cross section and hopefully result in more
product formation.

33
CHAPTER III
O(1D) + X REACTION
III.A. O(1D) + X Experimental Setup
To optimize the system for the formation of O(1D), and ultimately the XO
products, we oriented the slit nozzle 90˚ with respect to the microwaves. This had the
benefit of aligning the slit opening with the laser, as well as not having to account for
Doppler Shifting in the product or parent molecule (Figure 18).
Figure 18. Ozone mm-wave transient absorption signal (v=0 transition). The gap or “hole” at 100 µsec corresponds to the depletion of ozone following the laser firing. It is during this window of time we expect production of O(1D) radical and subsequent product formation. N=76, K-1=10, K+1=76
34
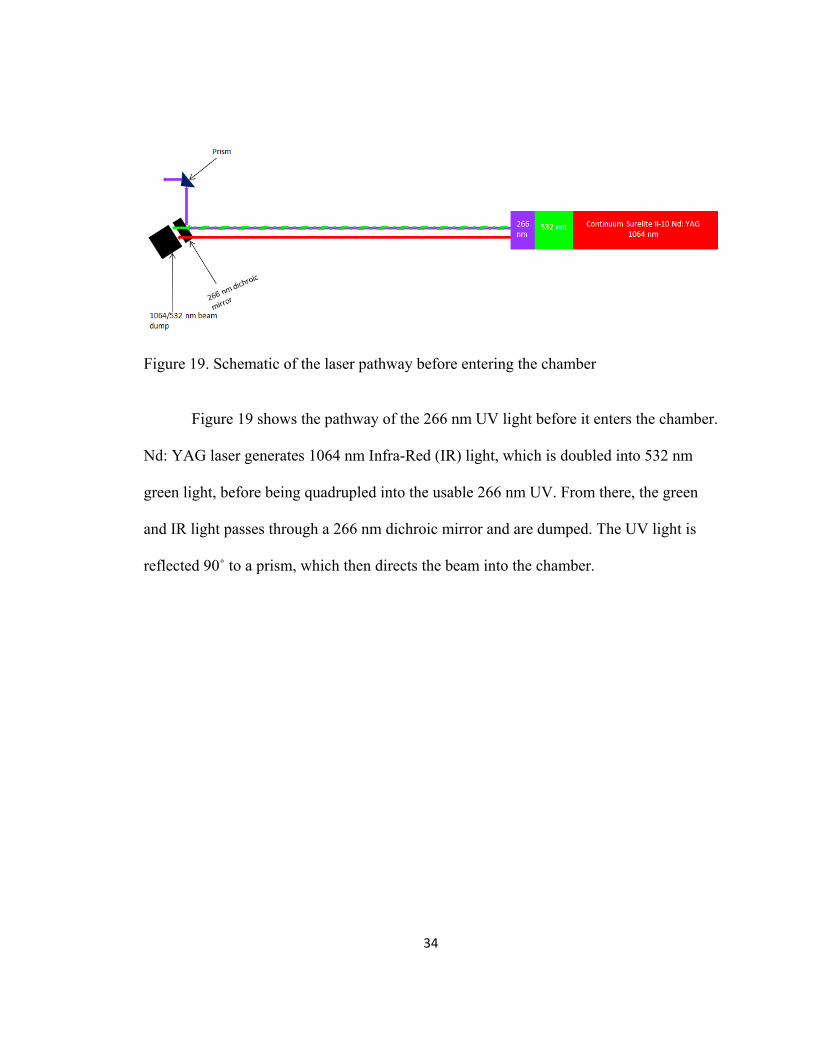
Figure 19. Schematic of the laser pathway before entering the chamber Figure 19 shows the pathway of the 266 nm UV light before it enters the chamber.
Nd: YAG laser generates 1064 nm Infra-Red (IR) light, which is doubled into 532 nm
green light, before being quadrupled into the usable 266 nm UV. From there, the green
and IR light passes through a 266 nm dichroic mirror and are dumped. The UV light is
reflected 90˚ to a prism, which then directs the beam into the chamber.
35
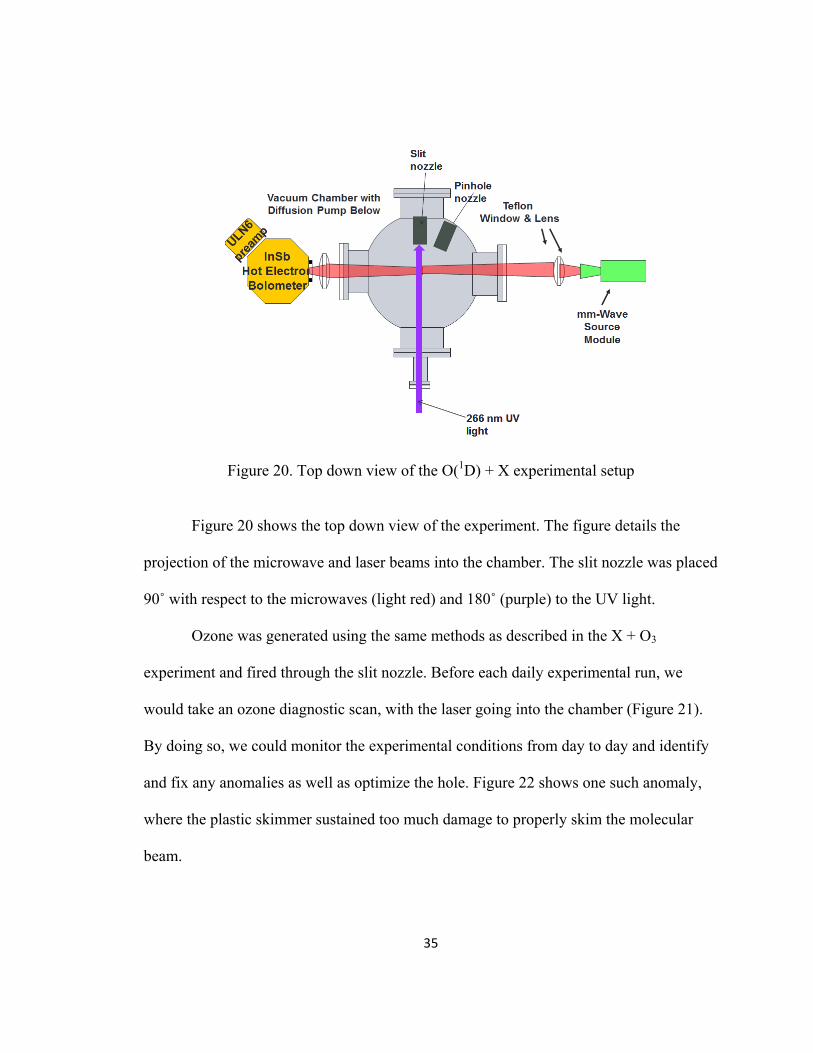
Figure 20. Top down view of the O(1D) + X experimental setup
Figure 20 shows the top down view of the experiment. The figure details the
projection of the microwave and laser beams into the chamber. The slit nozzle was placed
90˚ with respect to the microwaves (light red) and 180˚ (purple) to the UV light.
Ozone was generated using the same methods as described in the X + O3
experiment and fired through the slit nozzle. Before each daily experimental run, we
would take an ozone diagnostic scan, with the laser going into the chamber (Figure 21).
By doing so, we could monitor the experimental conditions from day to day and identify
and fix any anomalies as well as optimize the hole. Figure 22 shows one such anomaly,
where the plastic skimmer sustained too much damage to properly skim the molecular
beam.

36
Figure 21. Examples of daily diagnostic scans. Ozone signal intensities can vary significantly with time as the gas inlet Teflon tubing first passivates with ozone and later as the ozone runs out. The depth of the hole also lets us know how well the laser is tuned and aligned. Top Left: N=76, K-1=10, K+1=76 Top Right and Bottom: N=32, K-
1=10, K+1=32

37
Figure 22. Diagnostic scan that indicates a problem with the experiment. N=76, K-
1=10, K+1=76
For the single molecular beam experiments, the gases were mixed and introduced
to the slit nozzle via the gas inlet system, with the exception of iodine. Bromine and
Chloroform were introduced to the slit nozzle from the gas inlet system. A vial of reagent
was attached to a specially rigged system, where argon was passed through the liquid to
facilitate evaporation and act as a carrier to the gas inlet system (Figure 23). From there
the slit nozzle was opened to the gas inlet system, and the reagent was introduced to the
chamber. Ozone bypassed the gas inlet system by connecting directly to the slit nozzle.
38
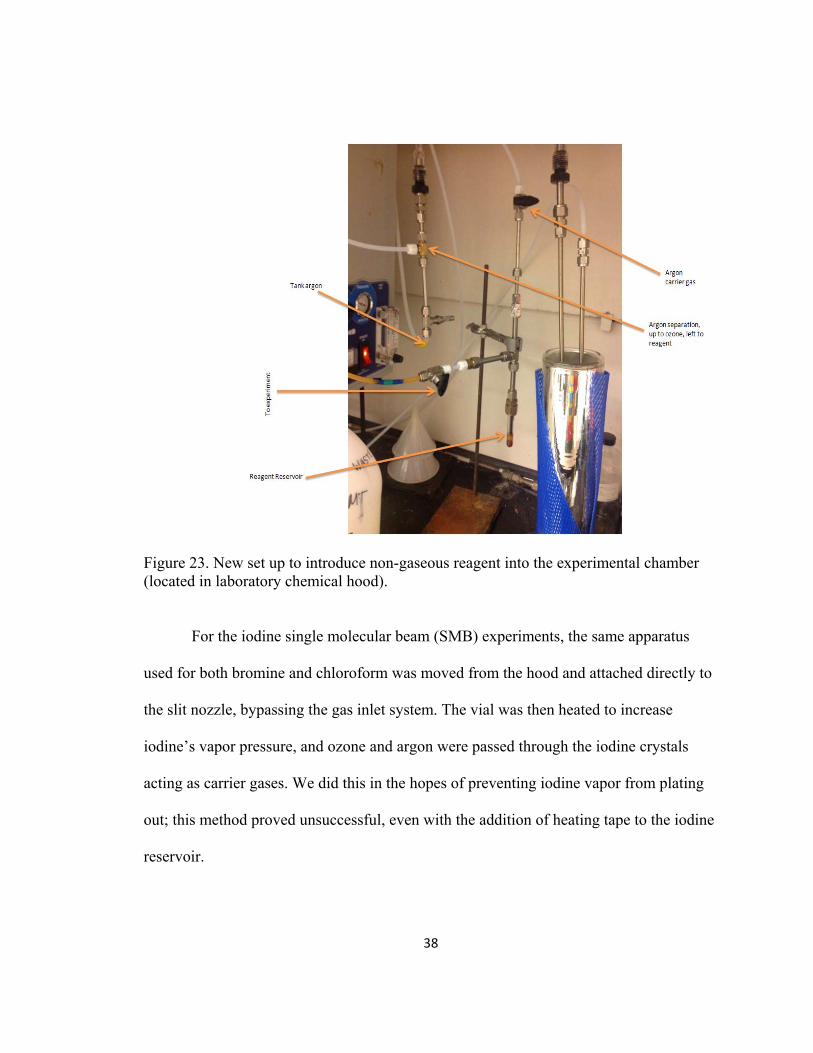
Figure 23. New set up to introduce non-gaseous reagent into the experimental chamber (located in laboratory chemical hood).
For the iodine single molecular beam (SMB) experiments, the same apparatus
used for both bromine and chloroform was moved from the hood and attached directly to
the slit nozzle, bypassing the gas inlet system. The vial was then heated to increase
iodine’s vapor pressure, and ozone and argon were passed through the iodine crystals
acting as carrier gases. We did this in the hopes of preventing iodine vapor from plating
out; this method proved unsuccessful, even with the addition of heating tape to the iodine
reservoir.

39
III.A.1. Laser Optimization for the Production of O(1D)
After deciding to run O(1D) + X (X= I2 and Br2) reactions, we needed to modify
the experiment to optimize the production of O(1D). Initially, we planned on using the
Continuum Panther EX OPO (optical parametric oscillator) laser to produce tunable UV
light delivered through an optical fiber to the exit of the nozzle. This method could take
advantage of ozone’s photodissociation over the entire Hartley Band. We set the
millimeter-waves to a strong rotational line of ozone, and the OPO was set to scan 1 nm
increments of the Hartley Band. The UV was scanned and timed to fire at the peak of the
slit nozzle gas pulse. Still, we found that the delivered intensity was not strong enough to
produce a visible depletion of the ozone signal, and hence not of adequate strength to
produce sufficient quantities of O(1D) atoms such that the produced XO molecules could
be detected (Figure 24).

40
Figure 24. Photodissociation OPO laser scan (over part of Hartley band) of ozone at a fixed mm-wave frequency centered on an intense ozone rotational transition (249788.5520 MHz). The left figure shows the mm-wave transient absorption at each UV wavelength. The laser was set to fire at the peak of the gas pulse and after some baseline subtraction, the figure on the right depicts the ozone peak intensity as a function of UV wavelength. While depletion should occur at all UV wavelengths covered, the hole only occurs at 260 nm, which simply corresponds to the power optimization of the harmonic crystals in the OPO laser and not the actual UV spectrum of ozone. As can be seen from Figure 24, we scanned areas where peak ozone absorption occurs in
the Hartley band, and the only hole produced was at 260 nm. This corresponds to the
power optimization of the two harmonic crystals, so that the maximum UV power output
of the frequency doubled OPO laser (2.4 mJ/pulse) was hitting the molecular beam,
producing the largest hole. To dramatically increase the laser power and hence hole
depth, we decided to forego the tunable OPO laser and take advantage of the far greater
power (~80 mJ/pulse) available at 266 nm from the tripled frequency output of the
Continuum Surelite II-10 Nd:YAG laser. Figure 18 shows the hole we were able to

41
produce. The hole bisects the ozone peak, demonstrating full depletion of the ozone
signal following firing of the laser. Because the laser was collinear with the molecular
beam, ozone over the full length of the molecular beam was depleted. This resulted in an
effect on the mm-wave signal that lasts for over 100 µsecs despite the fact the laser
output is only on 3-5 nsecs. Satisfied that we were dissociating O3 we began running the
O(1D) + X experiments.
We ran the bromine, iodine, chloroform, and nitrous oxide experiments using the
single molecular beam and crossed molecular beam methods. By using an SMB
experiment, we hoped that we would increase the probability of collisional interactions,
and therefore, product formation. With respect to the nitrous oxide, Tokel and researchers
found that when running CMB experiments, the product NO, was more likely to come
out vibrationally hot as compared to an SMB experiment. [34] We also suspected that
this might be the case for the IO, BrO, and ClO products. Unfortunately as discussed
earlier, there is no rotational data higher than v=1 for either IO or BrO in the Jet-
Propulsion Laboratory spectral database (JPL), so we have been unable to check
rotational lines at higher vibrational states.

42
III.B Experimental Data for the O(1D) + X (X= Br2, I2, N2O, and CHCl3) Reactions
III.B.1. Experimental Data for the O(1D) + Br2 Reaction
As mentioned earlier in section II.C., the rate constant for the O(1D) + Br2 is an
order of magnitude better than the Br + O3 reaction. So we felt that we would be able to
detect signal if the product molecule (BrO) was present. Before doing so, we optimized
the CMB experiment, for the hole and the pinhole molecular beam (Figure 25). The wide
sloping dip shown in Figure 25 is what we thought was the pinhole signal overlapping the
hole and the ozone molecular beam (slit nozzle). We suspect however, that some of the
dip was a result of exhaust gas from the pinhole nozzle moving through the arm to the slit
and suppressing the ozone molecular beam.
Figure 25. Pseudo-optimization of the pinhole, slit, and laser for CMB experiments. Right figure shows optimization at a tripled ozone frequency. While the left figure shows optimization at a doubled ozone frequency. The difference in % Absorption is a result of a decrease in ozone from the laboratory hood. Left: N=76, K-1=10, K+1=76, Right: N=32, K-1=10, K+1=32

43
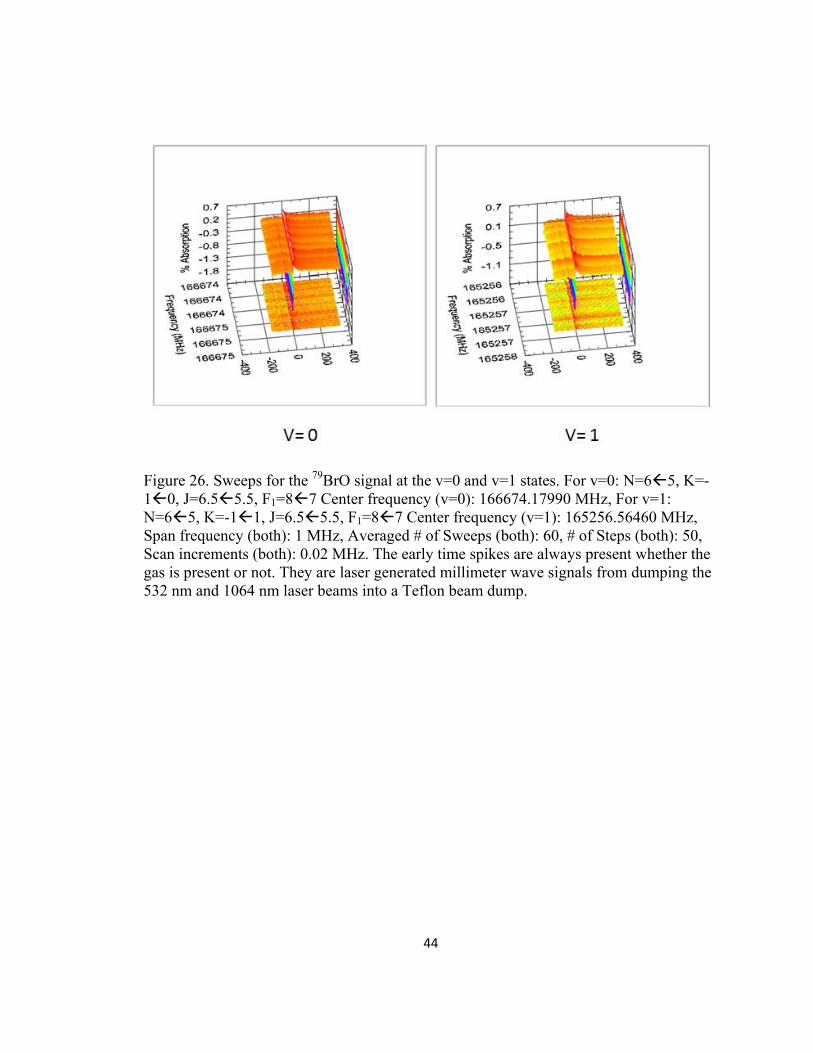
We ran several experiments looking for the v=0 to the v=1 rotational states of
BrO with no success (Figure 26). Since higher vibrational states are expected to be
populated the JPL database does not have any rotational lines of BrO higher than v=1, we
decided to try and find v=2 ourselves. The frequency shift from v=0 to v=1 for the N= 6
5 transition was -1.408 GHz. We assumed a similar -1.408 GHz shift for the v=1 to
v=2 transition and then scanned within 10 MHz from this assumed shift see Figure 27.
Finally, in the hopes of increasing rotational relaxation and/or slowing the O(1D) atom by
collisions (slower O(1D) atoms are expected to have a larger collision/reaction cross
section) between the gases, we switched to an SMB experiment via the slit nozzle (Figure
28). We still did not find anything, so we moved on to the O(1D) + I2 experiment, as it
had a gas kinetic rate constant (k= 1.25E-10 cm3/ molecule s).
44
Figure 26. Sweeps for the 79BrO signal at the v=0 and v=1 states. For v=0: N=65, K=-10, J=6.55.5, F1=87 Center frequency (v=0): 166674.17990 MHz, For v=1: N=65, K=-11, J=6.55.5, F1=87 Center frequency (v=1): 165256.56460 MHz, Span frequency (both): 1 MHz, Averaged # of Sweeps (both): 60, # of Steps (both): 50, Scan increments (both): 0.02 MHz. The early time spikes are always present whether the gas is present or not. They are laser generated millimeter wave signals from dumping the 532 nm and 1064 nm laser beams into a Teflon beam dump.

45
Figure 27. Broadband frequency sweep of BrO for the v=2 state using CMB method. Center frequency: 163838.94930 MHz @ v=1, Span frequency: 10 MHz, Averaged # of Sweeps: 60, # of Steps: 50, Scan Increments: 0.20 MHz. N=65, K=-11, J=6.55.5, F1=87

46
Figure 28. Broadband frequency sweep of BrO for the v=2 state using SMB method. Center frequency: 163838.94930 MHz @ v=1, Span Frequency: 10 MHz, Averaged # of Sweeps: 60, # of Steps: 200, Scan increments: 0.050 MHz. N=65, K=-11, J=6.55.5, F1=87 III.B.2. Experimental Data for the O(1D) + I2 Reaction
As mentioned earlier, we switched to iodine because it has a gas kinetic rate
constant, essentially every collision should result in a reaction. Because of iodine’s
tendency to plate out at room temperature, we decided to move the reagent holder closer
to the chamber. In addition to moving iodine closer to the chamber, we decided to use an
O3/Ar mix as our carrier gas, in the hopes that increasing collisional interactions sooner
would result in quicker product formation, than with other SMB experiments. We also
ran the experiment using the CMB method, with Ar as our carrier gas. Despite our best

47
efforts to prevent the plating of iodine, it still occurred most likely as the primary cause
of why we did not obtain signal (Figure 29).
Figure 29. Different scans to find IO signal using both CMB and SMB experimental methods. For SMB: Center frequency: 152316.64130 MHz Span frequency: 10 MHz Averaged # of Sweeps: 60 # of Steps: 100 Scan increments: 0.10 MHz. For CMB (center): Center frequency: 152316.72540 MHz Span frequency: 4 MHz Averaged # of Sweeps: 60 # of Steps: 100 Scan increments: 0.04 MHz. For SMB/CMB (center): N=76, K=-11, J=7.56.5, F1=109 For CMB (left): N=1211, K=1-1, J=12.511.5, F1=1514 Center frequency: 253839.53620 MHz Span frequency: 2 MHz, Averaged # of Sweeps: 60 # of Steps: 50 Scan increments: 0.04 MHz. III.B.3. Experimental Data for the O(1D) + N2O Reaction
Thinking that the vaporization of solids (iodine) and liquids was affecting our
ability to see signal, we decided to try a gas reagent for our SMB and CMB experiment.
For this purpose we used nitrous oxide, as it was readily available and is quickly
becoming the dominant cause of ozone destruction, since the gradual phase out of CFCs.6
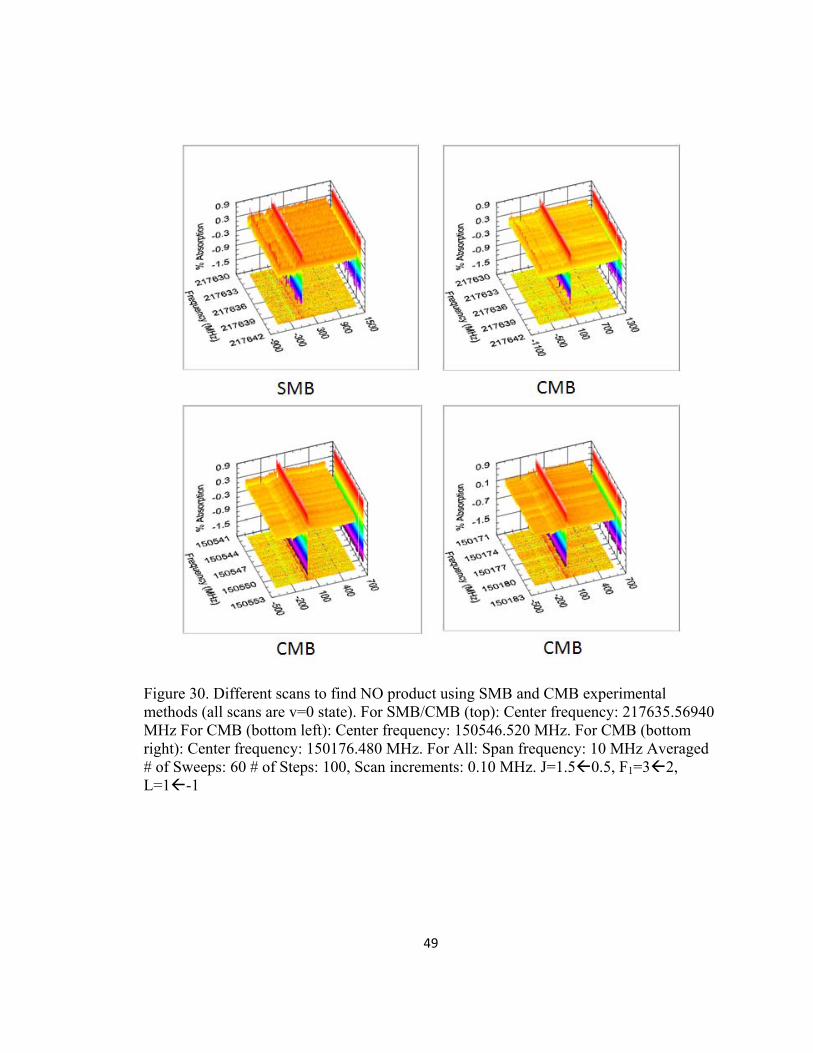
We used both SMB and CMB methods with no success (Figure 30). A literature
search showed that not only was the product molecules’ (NO) most intense lines outside
our frequency range, it also showed that the type of experiment effects the product energy

48
distribution. [34,35] In single molecular beam experiments the product (NO) was more
likely to come out in the ground state (v=0), and in crossed molecular beam experiments
the product was more likely to come out in an excited state (v=7). [34] From this we
speculated that BrO and IO may have a similar effect. To test this theory, we decided to
run an O(1D) + CHCl3 experiment in the hopes that the ClO product forms.
49
Figure 30. Different scans to find NO product using SMB and CMB experimental methods (all scans are v=0 state). For SMB/CMB (top): Center frequency: 217635.56940 MHz For CMB (bottom left): Center frequency: 150546.520 MHz. For CMB (bottom right): Center frequency: 150176.480 MHz. For All: Span frequency: 10 MHz Averaged # of Sweeps: 60 # of Steps: 100, Scan increments: 0.10 MHz. J=1.50.5, F1=32, L=1-1

50
III.B.4. Experimental Data for the O(1D) + CHCl3 Reaction
In the past the Duffy Lab has conducted experiments, which provided rotational
data up to the v=7 excited state of ClO. From this data, we felt confident that we could
detect vibrationally excited ClO if it were present. Rather than work with molecular
chlorine in the reaction O(1D) + Cl2, for corrosion and safety reasons we chose instead to
look for other chlorine source that could react with O(1D). We chose chloroform
(CHCl3), as we already had a set up capable of vaporizing liquid.
We ran both the SMB and CMB experiments using the same methods described
for the O(1D) + Br2 reaction. So far we have managed to scan up to the v=4 state using
both the CMB and SMB methods (Figure 31), before issues with the ozone generator
caused us to shut down. We even tested the excited Ω= ½ electronic state, which the
product may have come out in (Figure 31).

51
Figure 31. Different scans to find ClO product using SMB and CMB experimental methods. For SMB v=2 (top left): N=54, K=1-1, J=5.54.5, F1=76 Center frequency: 200432.33270 MHz. For SMB v=3 (top right): N=43, K=-11, J=4.53.5, F1=65 Center frequency: 162387.45240 MHz. For SMB v=4* (bottom left): N=65, K=1-1, J=5.54.5, F1=76 Center frequency: 197268.8470 MHz. For CMB v=4 (bottom right): N=87, K=1-1, J=8.57.5, F1=98 Center frequency: 303629.23460 MHz For All: Span frequency: 1 MHz Averaged # of Sweeps: 120 # of Steps: 50 Scan increments: 0.02 MHz.

52
III.C. Discussion on the O(1D) + X Reactions
While we have not seen product signal for the O(1D) + X reaction, we feel
confident that our setup and detection method is conducive for product formation and
detection. With that said, for future experiments with the O(1D) + X reaction, we may
choose to stick with SMB conditions until product signal is found, in the hopes that the
collisions within the molecular beam will slow down the O(1D) atom, and thereby
increasing its collisional cross section and the likelihood of product formation.
Even though we switch to the O(1D) + CHCl3 experiment because we had
rotational data on the ClO product up to the v=7 state we have yet to find signal. It is
possible that the O(1D) + CHCl3 reaction is preferentially producing HCl and so in future
experiments we plan on switching to carbon tetrachloride (CCl4) or Chlorine gas (Cl2) as
our chlorine source. These gases also have a more favorable rate constant with O(1D).
III.D. Conclusions
This thesis describes a set of experiments with the goal of measuring product
rovibronic state distributions of bimolecular reactions by direct mm-wave absorption
under both crossed molecular beam and single molecular beam conditions. The work
attempted to detect the formation of XO (X= Br, I, Cl) products from the reactions X +
O3 (X= I and Br) and O(1D) + X (X=Br2, I2, N2O, and CHCl3). If successful, it would
have added high resolution detail to prior crossed molecular beam studies of these
systems. While no product signals have been observed to date, the thesis outlines some of
the experimental pitfalls along the way. We have systematically chosen systems with

53
increasingly large reaction cross sections in the hopes of obtaining signal. On the
experimental side, it is possible that by decreasing sources of noise, optimizing laser and
millimeter wave overlap and/or by using multipass configurations and longer averaging
products may eventually be detected and optimized. It is also possible that the product
state distributions are simply too broad-peaked at an inaccessibly high rotational states, or
they are in vibrational or electronic states for which we have no transition frequencies.
On the experimental side, the delivery of non-gaseous reagents to the chamber has
proved successful for liquids (bromine and chloroform). However, for solid reagents, like
iodine, external delivery systems proved ineffective. A solution to this would be to heat
the entire external system.
Back-flow of exhaust gases between nozzles has proved problematic in obtaining
clean CMB signals. A solution to this problem would be to design nozzle arms that
prevent the flow of gases between each other. The Duffy lab has recently gained access to
a 3D printer, so the arms could be designed and made out of plastic on site, allowing us to
tweak the arm design as needed.
Successful diagnostic scans have been developed and tested, which allows us to
optimize and identify experimental issues before running experiments. Future work in
testing the product distribution of ClO from CMB and SMB experiments may prove more
successful with the use of chlorine gas, or carbon tetrachloride. Once a successful ClO
signal has been obtained, we can use those experimental conditions to try and detect BrO
or IO.
54
REFERENCES
[1] The Noble Prize in Chemistry 1995. Nobleprize.org. Noble Media AB 2013. Web.
http://www.nobleprize.org/noble_prize/chemistry/laureates/1995/ Accessed: September
22, 2013.
[2] Speth, J.G. 2004. Red Sky at Morning: America and the Crisis of the Global
Environment New Haven: Yale University Press, pp. 95.
[3] Class I Ozone Depleting Substances. Epa.gov. Web.
http://www.epa.gov/ozone/science/ods/classone.html Accessed: September 4, 2013.
[4] Zhang, J.S.; Lee, Y.T. J. Phys. Chem. 1997, 101, 6485-6495.
[5] Bell, N.; Hsu, L.; Jacob, D.J.; Schultz, M.G.; Blake, D.R.; Butler, J.H.; King, D.B.;
Lobert, J.M.; Maier-Reimer, E. J. Geophys. Res.: Atmos., 2002, 107, 4340.
[6] NOAA Study Shows Nitrous Oxide Now Top Ozone-Depleting Emission. Noaa.gov.
Linda Joy. Web. http://www.noaanews.noaa.gov/stories2009/20090827_ozone.html
Accessed: June 30, 2014.
[7] NOAA Study Shows Nitrous Oxide Now Top Ozone-Depleting Emission. Noaa.gov.
Linda Joy. Web. http://www.noaanews.noaa.gov/stories2009/20090827_ozone.html
Accessed: June 30, 2014.
[8] NIST Chemical Kinetics Database Cl + O3. Nist.gov. Web.
http://www.kinetics.nist.gov/kinetics/Search.jsp Accessed: September 4, 2013.
[9] Miller, W.B.; Safron, S.A.; Herschbach, D.R. Discuss. Faraday Soc. 1979, 67, 27.

55
[10] McGrath, W.P.; Norrish, R.G.W.Z. Phys. Chem. (Munich) 1958, 15, 245.
[11] Molina, L.T.; Molina, M.J.; J. Phys. Chem. 1987, 91, 433.
[12] McElroy, M.B.; Salawitch, R.J.; Wofsy, S.C.; Logan, J.A. Nature 1986, 321, 759.
[13] Zhang, J.S.; Miau, T.T.; Lee, Y.T. J. Phys. Chem. A. 1997, 101, 6922-6930.
[14] Solomon, S.; Garcia, R.R.; Ravishankara, A.R.; J. Geophys. Res. 1994, 99, 20491.
[15] Tucceri, M.E.; Dillon, T.J.; Crowley, J.N.; Phys. Chem. Chem. Phys. 2005, 7, 1657-
1663.
[16] D. Holscher, C. Fockenberg and R. Zellner, Ber. Bunsen-Ges. Phys. Chem.,
1998,102, 716–722.
[17] Hay, P.J.; Pack, R.T.; Walker, R.B.; Heller, E.J. J. Phys. Chem. 86, 1982, 862-865.
[18] Finlayson-Pitts, B.J.; Pitts, J.N. Atmospheric Chemistry Wiley, New York 1986.
[19] Munson, M.S.B. J. Am. Chem. Soc., 1965, 87, 5313.
[20] MacNeil, K.G.; Futrell, J.H. J. Phys. Chem. 1972, 76, 409.
[21] Kauczok, S; Maul, C.; Chichinin, A.I.; Gericke, K.H. J. Chem. Phys. 2010, 132,
244308.
[22] Monge, Josue R. Constructing Velocity Distributions in Crossed-Molecular Beam
Studies Using Fourier Transform Doppler Spectroscopy. Greensboro, N.C: University of
North Carolina at Greensboro, 2012. Internet resource.
[23] Kinsey, J.L. J. Chem. Phys., 1977, 66, 2560-2565.
[24] Mark, Nicholas R. A New Crossed Molecular Beam Apparatus for the Study of the
Cl + O3 Reaction Probed Via Direct Absorption of Millimeter/submillimeter-Waves.
Greensboro, N.C: University of North Carolina at Greensboro, 2012. Internet resource.

56
[25] Ren,Z.; Qiu, M.; Che, L.; Dai, D.; Wang, X.; Yang, X. Rev. Sci. Inst. 77, 2006,
016102.
[26] Mauney, Daniel T. New Instrument for Probing the Pure Rotational Spectroscopy of
Cold Molecules Produced Via "billiard-Like" Scattering. Greensboro, N.C: University of
North Carolina at Greensboro, 2012. Internet resource.
[27] Ozone Decomposition.
http://www.lenntech.com/library/ozone/decomposition/ozone-decomposition.htm
Accessed: September 3, 2013.
[28] Mordecai, R.B. Bull. Hist. Chem., 2008, 33, 68-75.
[29] MSDS Ozone (Ambient Air Gas). mcpur.com, Mar Cor Purification,
http://www.mcpur.com/main/library/msds/MSDS_Ozone_ME80675e.pdf Accessed: July
25, 2014. Internet resource.
[30] Smedly, J.E.; Haugen, H.K.; Leone, S.R. J. Chem. Phys. 87, 1987, 5, 2700-2708.
[31] Atkinson, R.;Baulch, D.L.;Cox, R.A.;Crowley, J.N.;Hampson, R.F.;Hynes,
R.G.;Jenkin, M.E.;Rossi, M.J.;Troe, J. Atmos. Chem. Phys. 7, 2007, 981-1191.
[32] Atkinson, R.; Baulch, D.L.; Cox, R.A.; Hampson Jr., R.F.; Kerr, J.A.; Troe, J. Phys.
Chem. Ref. Data 18, 1989, 881-1097.
[33] Steinfeld, J.; Francisco, J.; Hase, W. Chemical Kinetics and Dynamics. Prentice
Hall, 1989, 247.
[34] Tokel, O.; Chen, J.; Ulrich, C. K.; Houston, P. L. J. Phys. Chem. A 2010, 114,
11292-11297.

57
[35] Mandin, J.Y.; Dana, V.; Regalia, L.; Barbe, A.; Thomas, X. J. Mol. Spec. 1997, 185,
347-355.


![MOLECULAR BEAM STUDIES OF ELEMENTARY CHEMICAL …web.mit.edu/10.652/www/YTLeeNobelLecture.pdf · radical products, the crossed molecular beams technique is most suitable [6, 7]. Information](https://static.fdocuments.us/doc/165x107/5fdb840d20dd0e0982168ee6/molecular-beam-studies-of-elementary-chemical-webmitedu10652www-radical.jpg)


