![[email protected] : an Application of the MYRRHA Accelerator for Nuclear](https://static.fdocuments.us/doc/165x107/61fb2f0d2e268c58cd5b2553/emailprotected-an-application-of-the-myrrha-accelerator-for-nuclear.jpg)
[email protected] : an Application of the MYRRHA Accelerator for Nuclear

Fermi National Accelerator Laboratory
J?ER&ILUWubWO12-E
Nuclear Dependence of Neutral D-Meson Production by 800 GeV/c Protons
M.J. Leitch et al. The E789 Collaboration
Fermi National Accelerator Laboratory P.O. Box 500, Batauiu, Illinois 60510
January 1994
Submitted to Physical Review Letters
## Operated by Universities Research Association Inc. under Contract No. DE-ACO2-76CH03000 with the United States Department of Energy

Disclaimer
This report was prepared as an account of work sponsored by an agency of the United States Government. Neither the United States Government nor any agency thereof, nor any of their employees, makes any warranty, express or implied, or assumes any legal liability or responsibility for the accuracy, completeness, or usefulness of any information, apparatus, product, or process disclosed, or represents that its use would not infringe privately owned rights. Reference herein to any specific commercial product, process, or service by trade name, trademark, manufacturer, or otherwise, does not necessarily constitute or imply its endorsement, recommendation, or favoring by the United States Government or any agency thereof. The views and opinions of authors expressed herein do not necessarily state or reflect those of the United States Government or any agency thereof.
Nuclear Dependence of Neutral D-Meson Production
by 800 GeV/c Protons
M. J. Leitch,l J. Boissevain,l T. A. Carey,l D. M. Jansen,r
R. G. Jeppesen,‘t* J. S. Kapustinsky,l D. W. Lane,lTt
J. W. Lillberg, ’ P. L. McGaughey,l J. M. Moss1 J. C. Peng,l
L. D. Isenhower,2 M. E. Sadler,2 R. Schnathorst, 21t G. Gidal,3
P. M. Ho,~ M. S. Kowitt,3$§ K. B. Luk,3 D. Pripstein,3
L. M. Lederman,4t11 M. H. Schub,4 C. N. Brown,5 W. E. Cooper,5
H. D. Glass5 K. N. Gounder,‘? C. S. Mishra,’ D. M. Kaplan,’
W. R. Luebke,’ V. M. Martin,‘>** R. S. Preston,6 J. Sa,6
V. Tanikella,” R. Childers7 C. W. Darden,r J. R. Wilson,’
Y. C. Chen,‘ttt G. C. Kiangg and P. K. Teng,g
’ Los Alamos National Laboratory, Los Alamos, New Mesico 87545
2 Abilene Christian University, Abilene, Tezas 79699
3 Lawrence Berkeley Laboratory and Unive,rsity of California, Berkeley, California 94720
4 University of Chicago, Chicago, Illinois 60637
5 Fermi National Accelerator Laboratory, Batavia, Illinois 60510
6 Northern Illinois University, Deh’alb, Illinois 60115
7 University of South Carolina, Columbia, South Carolina 29208
8 Institute of Physics, National Cheng h’ung University, Tainan, Taiwan
’ Institute of Physics, Academia Sinica, Taipei, Taiwan
(Received February 8, 1994)
The nuclear dependence for 800 GeV/c proton production of neutral D mesons
has been measured near XF = 0 in Experiment 789 at Fermilab. D mesons from
1

beryItium and gold targets were detected with a pair spectrometer and a silicon
vertex detector via their decay D - K7r. No nuclear dependence is found, with a
measured cr = 1.02 f 0.03 f 0.02, in contrast to the large suppression seen previously
for production of J/G and +‘. The measured differential cross section, da/&~, for
neutral D-meson production at < XF >= 0.031 is 58 It 3 f 7 pb/nucleon. The
integrated cross section obtained by extrapolation of the measured cross section to
all xF is 17.7 f 0.9 f 3.4 pb/ nucleon and is consistent with previous measurements.
PACS number: 25.4O.Ve, 13.85.Ni, 24.85.+p
Typeset Using REWEX
2

A strong suppression of J/g and T production has been observed in p-A collisions on heavy
relative to light nuclear targets[l-4]. S’ rmr ar effects have been seen in heavy-ion collisions[5]. The ‘I
causes of this suppression are still unclear; for example, one of the models discussed involves the
conversion of J/$‘s into open-charm pairs (DD) through interaction with co-movers or with the
nucleus[6]. For D meson production this mechanism would be absent. Other mechanisms, such
as effects in the initial state or effects on the gluon structure function, might impact charmonium
production and open-charm production in similar ways. These issues have been the subject of a
vast amount of theoretical activity [6-111. Data on the nuclear dependence of D-meson produc-
tion can help to identify the dynamics involved in these suppressions. Previous measurements for
proton production of D mesons are few and did not explicitly reconstruct the 0[12, 131.
We report results for D-meson production from Fermilab Experiment 789, in which over 4000
Do + Ir’7r decays have been reconstructed from 800 GeV/c protons incident on beryllium and
gold targets. Throughout the paper, except where explicit charged decay products are listed, we
use Do to refer to both the Do and its anti-particle, the Do.
Experiment 789 used an upgraded version of the pair spectrometer in the Fermilab Meson
East beamline, previously used for experiments 605[14] and 772[1]. Th in strip targets of beryllium
and gold (either 160 pm high by 1.8 mm long or 110 pm high by 0.8 mm long) localized the
primary interaction point to a small region and downstream decays of neutral D mesons were
identified using a silicon vertex detector. The silicon vertex detector consisted of sixteen 50 /lrn
pitch silicon strip detectors each 5 x 5 cm2 in area and 300 pm thick, covering an angular range
of 20 to 60 mr above and below the beam axis. The detectors were positioned between 37
and 94 cm downstream of the target and were oriented to measure either the y(vertical) or u/v
coordinates (&,5” stereo angles). A total of 8,544 strips were individually read out via Fermilab
amplifier cards[l5] and LBL discriminators[16]. A vertex processor[l7] provided on-line rejection
of prompt target dihadron events by selecting only track pairs consistent with decay vertices at
least 1.02 mm downstream of the target and impact parameters of at least 51 /lm relative to the
target center. Rejection factors between 5 and 20 were achieved, depending on the luminosity.
3

For these data two magnetic-field settings of the first spectrometer magnet (SM12) were
used, 1000 amperes (1000A) and 900 amperes (900A). Th e nuclear-dependence measurement
is based only on the 900A runs, in which both beryllium and gold targets were used, while at
1OOOA substantial data were obtained only for the gold target. With beam rates between 0.5 and
1.9 x 10' protons/set, and a typical targeting fraction of - 0.4, total per nucleon luminosities
of 17 pb-l (900A beryllium), 13 pb-l (900A gold), and 35 pb-l (1000A gold) were obtained.
This resulted in average multiplicities on each silicon plane between 5 and 13 hits per event.
Approximately 380 million events were recorded on tape.
Beam flux normalization was obtained from a four-element scintillator telescope viewing the
target at 90”, which was calibrated for each target by scanning the target vertically across the full
vertical extent of the beam. This determined the relationship between counts in the 90” monitor
and in the secondary-emission monitor (SEM) which intercepted the entire proton beam. The
90” monitor was then used to measure the actual proton flux incident on the target at its normal
vertical position. For the beryllium target a substantial target-out background was determined
and corrected for. This contributed about 4% to the relative uncertainty between the beryllium
and gold data. The SEM calibration, determined using activation techniques, was l.Oj10.1 x 10”
protons per SEM count.
Mass spectra for the three target and magnetic-field combinations are shown in Fig. 1.
Background dihadron events from the target are rejected by requiring that events have a proper-
lifetime significance, r/o, greater than 7.2, where 7 is the proper lifetime of the downstream decay
and 0 is the corresponding uncertainty (typically N 0.08~~). Each plot contains two entries per
event, one assuming Do + r+lil- and the other Do -+ 7r-Kf. Since the correct decay-product
assignment gives a sharp peak in mass with 0 N 5 MeV/c2 while the incorrect assignment gives
a N 50 MeV/c”, only the correct assumption contributes to the clear peak at the Do mass of
l.S6 GeV/c2. The continuum background underneath the peak is mostly from target hadron
pairs misidentified as downstream events by the vertex detector. Since the rates in the silicon
vertex detector are higher at 900A for gold than for beryllium, this continuum background is
4
higher by approximately a factor of 1.6 for gold due to the increased tracking confusion in the
silicon detector. To obtain the sum of the Do and fro yields, the spectra were fit with a narrow
gaussian and a wide gaussian, representing the correct particle and decay assumption and the
incorrect assumption, respectively, with a polynomial background underneath these peaks. The
wide peak was constrained to have the same number of counts as the narrow peak, since in this
summed spectrum each Do or DO event will give one entry in each peak. In order to determine
the asymmetry between Do and go production another fit was done which allowed the Do and
Do to vary independently. A simultaneous fit to separate mass spectra for the two assumptions
was done, similar to that described above, except that the narrow peak in each spectrum is
constrained to the same area as the wide peak in the other spectrum.
The top panel in Fig. 1 shows the 900A beryllium mass spectrum for the loosest vertex
cut. Several different lifetime-significance cuts have been studied to verify that no unexpected
systematic effects from this cut occur. Detailed monte-carlo simulations of the system are used to
determine the acceptance, including the effects of low-momentum pion tracks from the target in
the silicon vertex detector, random hits in all the detectors, multiple scattering and decay of the
produced particles, and efficiencies of all the detectors. The acceptances, including efficiencies,
are about 1.4 x 10m3 (900A) and 6.4 x 10m4 (1000A). Additional vertex efficiences resulting from
the lifetime significance cut of 7.2 used in Fig. 1 are about 0.19 (900A) and 0.24 (1000A). We
use a Do lifetime of 0.420 f 0.008 ps [18] and for the Do XF and PT distributions we use the
average of the results obtained using the forms of Ref. [19] and Ref. [20]. The difference in
acceptance obtained using these two parameterizations is about 10%. The efficiency of the level-
one trigger was evaluated using prescaled minimum-bias triggers and was found to be 0.42 III
0.04 (900A) and 0.46 f 0.04 (1000A). The additional efficiency factor from the vertex processor
was evaluated by studying level-one triggers which were forced to pass the processor and was
found to vary between 0.70 and 0.74.
We have checked our data against the published Do lifetime by determining the normalized
Do yields corrected for acceptance effects in five bins of proper lifetime. All three samples give
5

lifetimes consistent with the value used above. A fit to our combined data sample, shown in Fig.
2, yields a lifetime of 0.413 f. 0.018 ps.
The nuclear-dependence ratio from the 900A data is
R = +wl97 4w/9
= 1.06 & O.ll(stat.) f: O.O7(syst.),
corresponding to CI = 1.02 rt 0.03 & 0.02, where cy is the parameter obtained by representing
the dependence of the cross section on atomic mass (A) as CT(A) = crOACI. The uncertainty
in the ratio is dominated by fitting and statistics (+lO%), processor efficiency (f4%), and
the relative luminosity (f470). No asymmetry between Do and 0’ production is seen, with
c(DO)/~(DO) = 0.97 & 0.12. Our data cover the ranges 0.0 < x1: < 0.08 with < XF >= 0.031
and 0.0 < PT < 1.1 GeV/ c with < PT >= 0.50 GeV/c. Using a Do t I(71 branching ratio of
0.0365 f 0.0021[18] an d assuming no nuclear dependence, we obtain a differential cross section
for neutral D-meson production of ~o/~xF(D~)+~cT/~xF(D~) = 58f3f7 pb/nucleon per unit
xF. The main uncertainties in this result include the proton beam flux (&lo%), the Do -+ Kr
branching ratio (f5.8%), fitting and statistics (f4.9%), the trigger efficiency (1k3.2%), the Do
lifetime (f3%)), and the processor efficiency (&2%). Using the average acceptance obtained
from the PT and XF parameterizations of Refs. [19] and [20] to integrate over all XF and PT, we
can also obtain the total cross section: a(D”) + a(oO) = 17.7 f 0.9 f 3.4 pbb/nucleon. This
result includes an additional uncertainty of &15%, corresponding to the difference between the
two parameterizations and their uncertainties. We have also studied the variation in Q’ over our
range in XF and PT. The results, shown in Table 1, exhibit no dependence on PT and a slight but
statistically insignificant decrease between the smaller and larger bin in XF. Finally, our measured
da/dpT for our best statistics data set, the one at lOOOA, is shown in Fig. 3. A fit to the
standard form da/dpT cc pTemnpT2 gives n = 0.91 !C 0.12 (GeV/c)-2.
Previous measurements of cy for D-meson production have yielded values between 0.75 and
1.04. Recent results from E769 for 250 GeV/c pions yielded CY = 1.00 & 0.05 f 0.02 [21],
in agreement with our result. Other measurements for 340 GeV/c pions from WA82[22] at
< XF > = 0.24 gave 0.92 f 0.06 for all D’s and 1.03 IfI 0.11 for Do ---+ Kx, also roughly in
6

agreement. Both of these measurements cover a much wider range in xF than do ours. Older
results from beam-dump measurements using prompt single muons[l2] or prompt neutrinos[l3]
yielded values of Q substantially below one. These measurements all have acceptance primarily
in the large XF region above xF = 0.5. They are also more indirect measurements, since the D
mesons are not explicitly reconstructed, and rely upon several large corrections. Finally, we recall
the nuclear dependences of J/I) and $I’ production from Refs. [l, 231, which show an increasing
suppression for larger xF. Several of the mechanisms which can produce large suppressions
have strong dependences on XF. At large enough xF of a single detected D meson, the 22
(momentum fraction of the target parton) corresponding to the Do pair can be very small and
may be influenced by shadowing of the gluon structure function. Following Ref. [24], the strength
of gluon shadowing must be less than that for sea quarks and could cause, at most, a reduction
in LY for the total D cross section to 0.96. However, the effect in a particular region in x2 could
be more dramatic. We have used the correlation measurements of E653[25] to estimate that
the range of x2 in our data lies above 0.05, well above the shadowing region. However, for the
beam-dump measurements discussed above with IC F > 0.5, the Do x2 would be substantially
smaller, and shadowing may be causing all or part of the large suppression seen in these results.
Another model which predicts a strong suppression at large xF, and could also explain the
difference between the low- and high-xF measurements of the nuclear dependence, is intrinsic
charm[6]. This model gives an effect which depends strongly on xF. Used within a two-component
model which also includes the standard gluon-fusion picture modified by shadowing and various
final-state effects, it appears to be able to explain the bulk of charm-production data. However,
recent measurements by our group of J/$ production at very large x~[23] disagree with the
shape of the xF distribution predicted by this model.
Two previous measurements of the 800 GeV/c proton production cross section for neutral D
mesons have been reported: E653 reported 38f3f13 pub [19], while E743 reported 22’;*5.5 pb
[20]. Our result is consistent with both but agrees best with that of E743.
In conclusion, the lack of nuclear dependence in the production of neutral D mesons suggests
7
that the strong dependence seen in the production of J/G 7 and $I’ is not the result of initial state
effects or of nuclear modification of the gluon structure functions outside of the shadowing region.
Other data on D-meson production that lie primarily in the large-XF region, along with our results
and those from several pion-beam experiments which lie primarily in the IOW-XF region, suggest
that shadowing or possibly intrinsic charm may play important roles in determining the nuclear
dependences of open- and closed-charm production.
We wish to thank J. Appel, S. Brodsky, M. Strikman, and R. Vogt for useful discussions
and also the Fermilab Research and Accelerator Divisions. This work was supported by the U. S.
Department of Energy and the National Science Foundation.
8
REFERENCES
l Present Address: Science Applications International Corp., 2950 Patrick Henry drive, Santa
Clara. CA 95054.
’ Present Address: Department of Physics, Iowa State University, Ames, Iowa 50011.
$ Present Address: Department of Physics, Purdue University, Lafayette, Indiana 47907.
§ Present Address: NASA/Goddard Space Flight Center, Greenbelt, Maryland 20771.
” Present Address: Department of Physics, Illinois Institute of Technology, Chicago, Illinois
60616.
Present Address: Department of Physics, University of Mississippi, University, Mississippi
38677.
** Present Address: Department of Electrical Engineering and Computer Science, University of
Illinois at Chicago, Chicago, Illinois 60680.
tt Also at Institute of Physics, Academia Sinica, Taipei, Taiwan.
[l] D. M. Alde et al., Phys. Rev. Lett. 66, 133 (1991); and Phys. Rev. Lett. 66, 2285 (1991).
[2] S. Kartik et al., Phys. Rev. D 41, 1 (1990).
[3] S. Katsanevas et al., Phys. Rev. Lett. 60, 2121 (1988)
[4] J. Badier et al., Z. Phys. C 20, 101 (1983).
[5] C. Baglin et al., Phys. Lett. 220, 471 (1989); Phys. Lett B 255, 459 (1991); and Phys.
Lett B 270, 105 (1991).
[6] R. Vogt, S. J. Brodsky, and P. Hoyer, Nucl. Phys. B360 67, (1991); B383, 643 (1992).
[7] Stanley J. Brodsky and Paul Hoyer, Phys. Rev. Lett. 63 1566, (1989).
9
[8] S. Gavin and R. Vogt, Nucl. Phys. B345 104, (1990).
[9] S. Gavin and J. Milana, Brookhaven preprint BNL-46793.
[lo] J.-P. Blaizot and J.-Y. Ollitrault, Phys. Lett. B 217, 386 (1989).
[ll] C. Gerschel and J. Hufner, Phys. Lett. B 207, 253 (1988).
[12] H. Cobbaert ef al., Phys. Lett. 191, 456 (1987) and 206, 546 (1988).
[13] M. E. Duffy et al., Phys. Rev. Lett. 55, 1816 (1985).
[14] J. A. Crittenden et al., Phys. Rev. D 34, 2584 (1986); G. Moreno et al., Phys. Rev. D 43,
2815 (1991).
[15] D. Christian et al., IEEE Trans. Nucl. Sci. 36, 507 (1989).
[16] B. T. Turko et al., IEEE Trans. Nucl. Sci. 39, 758 (1992).
[17] C. Lee et al., IEEE Trans. Nucl. Sci. 38, 461 (1989).
[18] Particle Data Group: K. Hikasa et al., Phys. Rev. D 45, Sl (1992)
[19] K. Kodama et al., Phys. Lett. B263, 573 (1991).
[20] R. Ammar et al., Phys. Rev. Lett. 61, 2185 (1988).
[21] G. A. Alves et al., Phys. Rev. Lett. 70, 722 (1993).
[22] M. Adamovich et al., Phys. Lett. B 284, 453 (1992).
[23] M. S. Kowitt, Ph. D. Thesis, U. of Calif. Berkeley, LBL-33331/UC-414 (1992); and M. S.
Kowitt et al., to be published.
[24] Jianwei Qiu, Phys. Lett. B 191, 182 (1987).
[25] K. Kodama et al., Phys. Lett. B 263, 579 (1991).
10

FIGURES
FIG. 1. Invariant mass spectra for the three target and magnet-current configurations: 900
ampere SMl2 magnet current (900A) for the beryllium (Be) and gold (Au) targets and 1000 ampere
current (1000A) for the gold target. The peak at 1.86 GeV/c’ corresponds to Do --+ lCFi- n+ and
Do - Ii+ 7r- events. The bottom three panels are for the nominal lifetime significance cut.
(~/C-J > 7.2). The top panel illustrates the degradation in peak to background ratio for the 900A
Be data with a looser lifetime significance cut (r/g > 3.5).
FIG. 2. Differential cross section per nucleon, da/dr(D’) + da/dr(dO), versus proper lifetime
(r). Uncertainties shown are statistical only and do not include an additional systema,tic uncertaiut,y
of 12.8%‘. The solid line represents the fit used to obtain a Do + Do lifetime of 0.413 f 0.018 ps.
FIG. 3. Differential cross section per nucleon, da/dp~(D’) + &r/dp~(fiO), versus PT for our
1OOOA data. Uncertainties shown are statistical only and do not include an additional systematic
uncertainty of 12.870. The solid line represents the fit described in the text.
11
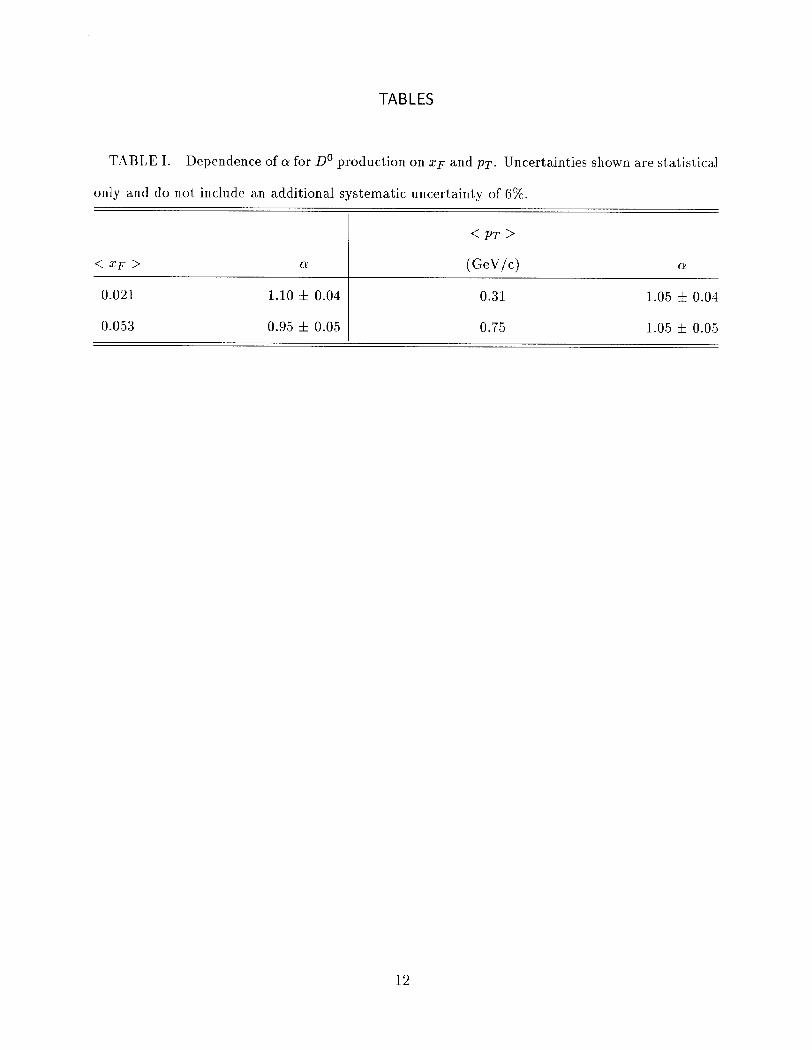
TABLES
TABLE I. Dependence of cr for Do production on XF and PT. Uncertainties shown are statistical
only and do not include an additional systematic uncertainty of 6%.
< XF > (Y (GeW a
0.021 1.10 f 0.04 0.31 1.05 i 0.04
0.053 0.95 f 0.05 0.75 1.05 !c 0.05
12

3 > a> > m . nl
cn E 3 0
0
600
300
0 300
200
100
0 300
200
100
0 300
200
100
O- 15 .
900A Be T/O > 7.2
20 . 25 . Mass (GeV/c*)
Figure 1

10 1
z c1 3 =t -loo P
u -6 u
06 .
I
I I I
11 . 16
z (Ps)
21 .
Figure 2

25
s ,=t IO & u 5 -5
00 . 05 IO & (GeVk)
15 ’
--
Figure 3